improved optical and chemical characterization methods … · alcohol/phenol o-h broad peak 3200...
TRANSCRIPT

Richard J. Tropp
Judith C. Chow
John G. Watson
Desert Research Institute, Reno, NV
Presented at:
EPA’s National Ambient Air Monitoring Conference
Atlanta, GA
August 11-14, 2014
Improved Optical and Chemical
Characterization Methods for PM2.5
Source Apportionment

Objectives
• Review common chemical analyses for
PM2.5/PM10 networks
• Give overview of characterization methods for
more specific source markers
• Give examples of source markers to better
validate source apportionment results
• Goal is to provide additional information at
minimal additional cost

Major PM components are commonly characterized, but
more specific markers are needed
• Organic Carbon
• Elemental Carbon
• Nitrate
• Sulfate
• Ammonium
• Geological Material
• Sea Salt
• Liquid Water
• Other
U.S. EPA Staff Paper (2005)
PM0.1 (ultrafine PM) PM2.5 (fine PM) PM10-2.5 (coarse PM)
Los Angeles Supersite
Chemical composition differs by PM size fraction

U.S. long-term chemical speciation networks obtain filter
samples for PM2.5 mass, elements, ions, and carbon
IMPROVE (2014). Interagency Monitoring of Protected Visual Environments. prepared by National Park Service, Ft. Collins, CO,
http://vista.cira.colostate.edu/IMPROVE.
U.S.EPA (2014). Chemical speciation. prepared by U.S. Environmental Protection Agency, Research Triangle Park, NC,
http://www.epa.gov/ttn/amtic/speciepg.html.
Interagency Monitoring of PROtected Visual
Environments (IMPROVE) NetworkChemical Speciation Network (CSN)
URG
MASSAndersen
RAAS
MetOne
SASS
URG
3000N
R&P
Partisol
IMPROVE
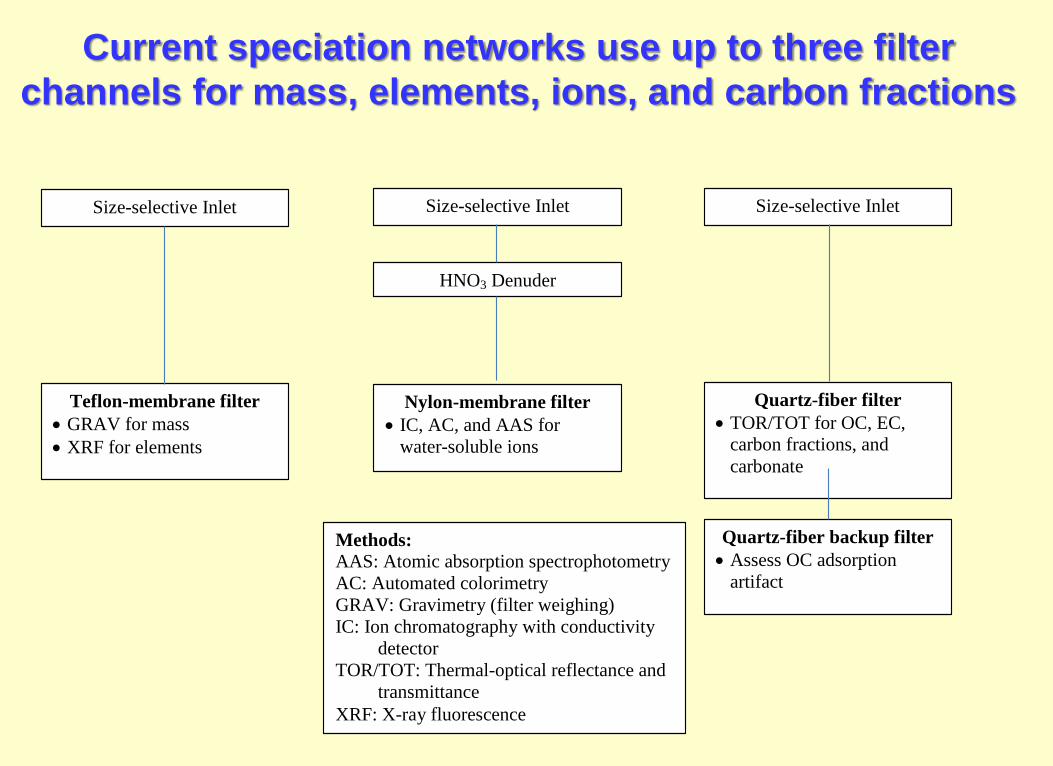
Current speciation networks use up to three filter
channels for mass, elements, ions, and carbon fractions
Size-selective Inlet Size-selective Inlet Size-selective Inlet
HNO3 Denuder
Teflon-membrane filter
GRAV for mass
XRF for elements
Nylon-membrane filter
IC, AC, and AAS for
water-soluble ions
Quartz-fiber filter
TOR/TOT for OC, EC,
carbon fractions, and
carbonate
Quartz-fiber backup filter
Assess OC adsorption
artifact
Methods: AAS: Atomic absorption spectrophotometry
AC: Automated colorimetry
GRAV: Gravimetry (filter weighing)
IC: Ion chromatography with conductivity
detector
TOR/TOT: Thermal-optical reflectance and
transmittance
XRF: X-ray fluorescence

Most source profiles report similar measurements of elements,
ions, and carbon, but these are insufficient for separating many
sources from each other
Watson and Chow (2007) 279–316

Organic components
help with modern
source apportionment,
but source and receptor
measurements are
limited
Watson et al., 2008, JAWMA
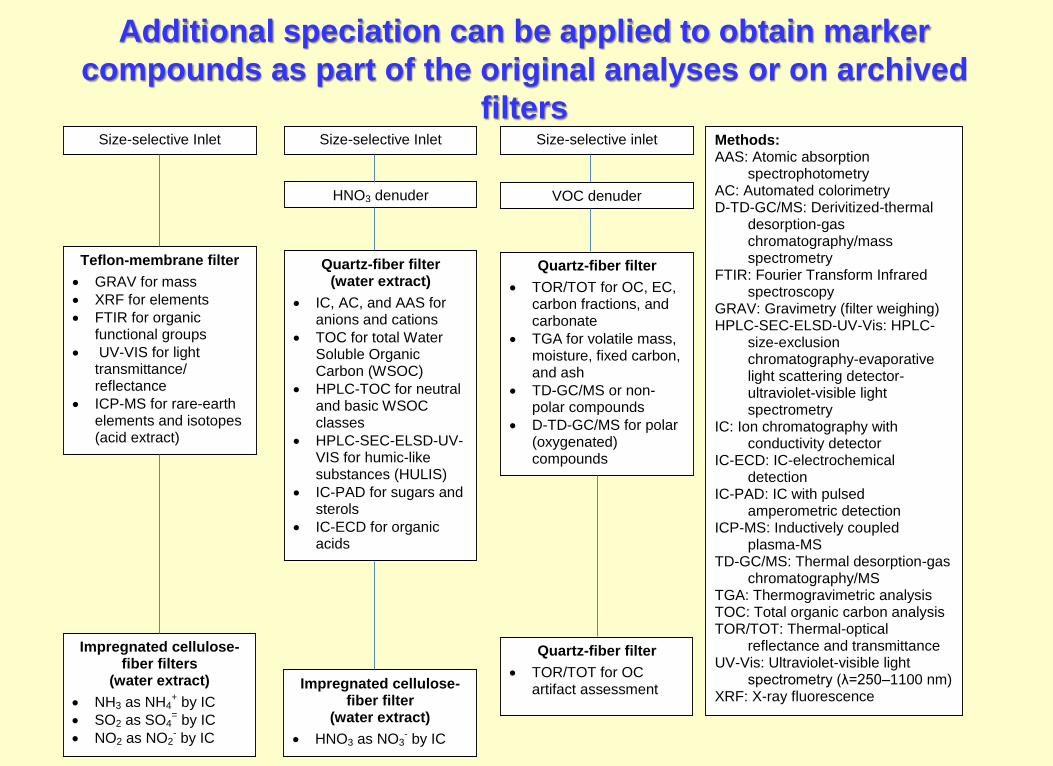
Additional speciation can be applied to obtain marker
compounds as part of the original analyses or on archived
filters
Size-selective Inlet Size-selective Inlet Size-selective inlet
HNO3 denuder VOC denuder
Teflon-membrane filter
GRAV for mass
XRF for elements
FTIR for organic functional groups
UV-VIS for light transmittance/ reflectance
ICP-MS for rare-earth elements and isotopes (acid extract)
Quartz-fiber filter
TOR/TOT for OC, EC, carbon fractions, and carbonate
TGA for volatile mass, moisture, fixed carbon, and ash
TD-GC/MS or non-polar compounds
D-TD-GC/MS for polar (oxygenated) compounds
Quartz-fiber filter (water extract)
IC, AC, and AAS for anions and cations
TOC for total Water Soluble Organic Carbon (WSOC)
HPLC-TOC for neutral and basic WSOC classes
HPLC-SEC-ELSD-UV-VIS for humic-like substances (HULIS)
IC-PAD for sugars and sterols
IC-ECD for organic acids
Impregnated cellulose-fiber filters
(water extract)
NH3 as NH4+ by IC
SO2 as SO4= by IC
NO2 as NO2- by IC
Impregnated cellulose-fiber filter
(water extract)
HNO3 as NO3- by IC
Quartz-fiber filter
TOR/TOT for OC artifact assessment
Methods: AAS: Atomic absorption
spectrophotometry AC: Automated colorimetry D-TD-GC/MS: Derivitized-thermal
desorption-gas chromatography/mass spectrometry
FTIR: Fourier Transform Infrared spectroscopy
GRAV: Gravimetry (filter weighing) HPLC-SEC-ELSD-UV-Vis: HPLC-
size-exclusion chromatography-evaporative light scattering detector-ultraviolet-visible light spectrometry
IC: Ion chromatography with conductivity detector
IC-ECD: IC-electrochemical detection
IC-PAD: IC with pulsed amperometric detection
ICP-MS: Inductively coupled plasma-MS
TD-GC/MS: Thermal desorption-gas chromatography/MS
TGA: Thermogravimetric analysis TOC: Total organic carbon analysis TOR/TOT: Thermal-optical
reflectance and transmittance UV-Vis: Ultraviolet-visible light
spectrometry (λ=250–1100 nm) XRF: X-ray fluorescence

Biomass
burningDust
Acetylene
soot
Diesel
soot
PALAS arc
generator soot
More information can be obtained from Teflon-
membrane filters than mass concentration

Filter transmittance (or reflectance as in British Smoke) has been
added to mass as a soot indicator correlated with elemental carbon
Densitometer (TBX; Tobias Instruments,
Ivyland, PA)

Dual wavelength light transmission through
filters allows the separation of biomass
smoldering (370 nm) from flaming/engine exhaust (880 nm)
Optical Transmissometer, (Magee Scientific, Berkeley, CA, USA)

Integrated sphere method quantifies light
absorption/transmission at 250–1000 nm
UV/VIS spectrometer, (Lambda 35 , PerkinElmer,
Waltham, MA, USA) 0
20
40
60
80
100
120
140
100 200 300 400 500 600 700 800 900 1000
Lig
ht
Ab
so
rpti
on
Eff
icie
nc
y (
m2
g-1
)
Wavelength (nm)
Smoldering Biomass
Diesel Exhaust
Flaming Biomass
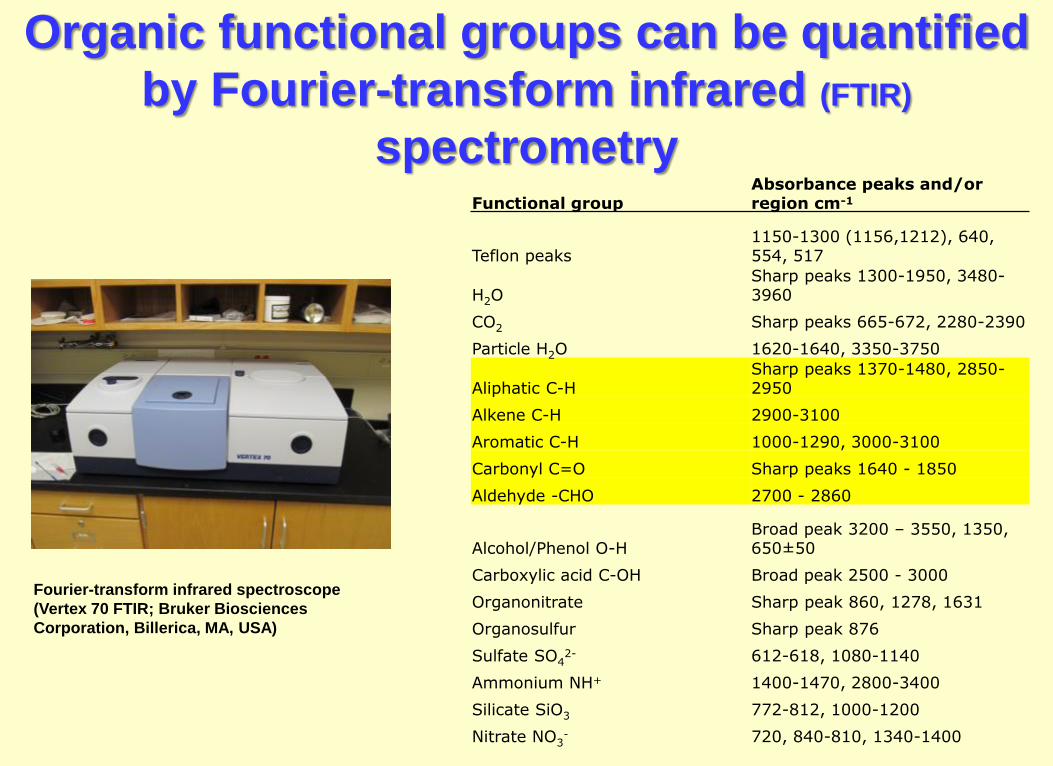
Organic functional groups can be quantified
by Fourier-transform infrared (FTIR)
spectrometryFunctional group
Absorbance peaks and/or region cm-1
Teflon peaks1150-1300 (1156,1212), 640, 554, 517
H2OSharp peaks 1300-1950, 3480-3960
CO2 Sharp peaks 665-672, 2280-2390
Particle H2O 1620-1640, 3350-3750
Aliphatic C-HSharp peaks 1370-1480, 2850-2950
Alkene C-H 2900-3100
Aromatic C-H 1000-1290, 3000-3100
Carbonyl C=O Sharp peaks 1640 - 1850
Aldehyde -CHO 2700 - 2860
Alcohol/Phenol O-HBroad peak 3200 – 3550, 1350, 650±50
Carboxylic acid C-OH Broad peak 2500 - 3000
Organonitrate Sharp peak 860, 1278, 1631
Organosulfur Sharp peak 876
Sulfate SO42- 612-618, 1080-1140
Ammonium NH+ 1400-1470, 2800-3400
Silicate SiO3 772-812, 1000-1200
Nitrate NO3- 720, 840-810, 1340-1400
Fourier-transform infrared spectroscope
(Vertex 70 FTIR; Bruker Biosciences
Corporation, Billerica, MA, USA)

Absorbance for some blank filters can be as high as the actual signal from
sample filters. Subtracting an average can create a problem.
Functional group vary by pollution source and there is
useful source apportionment information in unidentified
parts of the spectrum
Biomass Burning
Paved Road Dust
Acetylene Flame
Pellet Dust
De-Icing Material
Electric Arc

Paved
roadParking
lot
De-icing
material
Taconite
dust
IR and UV-VIS spectra for
fugitive dustIR and UV-VIS spectra for
biomass burning
Litter Duff Squaw Bitterbrush

X-ray Fluorescence (XRF) is non-
destructive and acquires 51 elements (from Na to U)
X-ray Fluorescence analyzer (PANalytical Model
Epsilon 5, Boulder, CO, USA)
silic
on
sulfur
chlo
rine
pota
ssiu
m
calc
ium
excitation p
eak
calc
ium
Kß
excitation p
eak
Elemental detection sensitivity is optimized by excitation condition and analysis
time. Longer analysis times reduce detection limits by (tusual/tenhanced)0.5
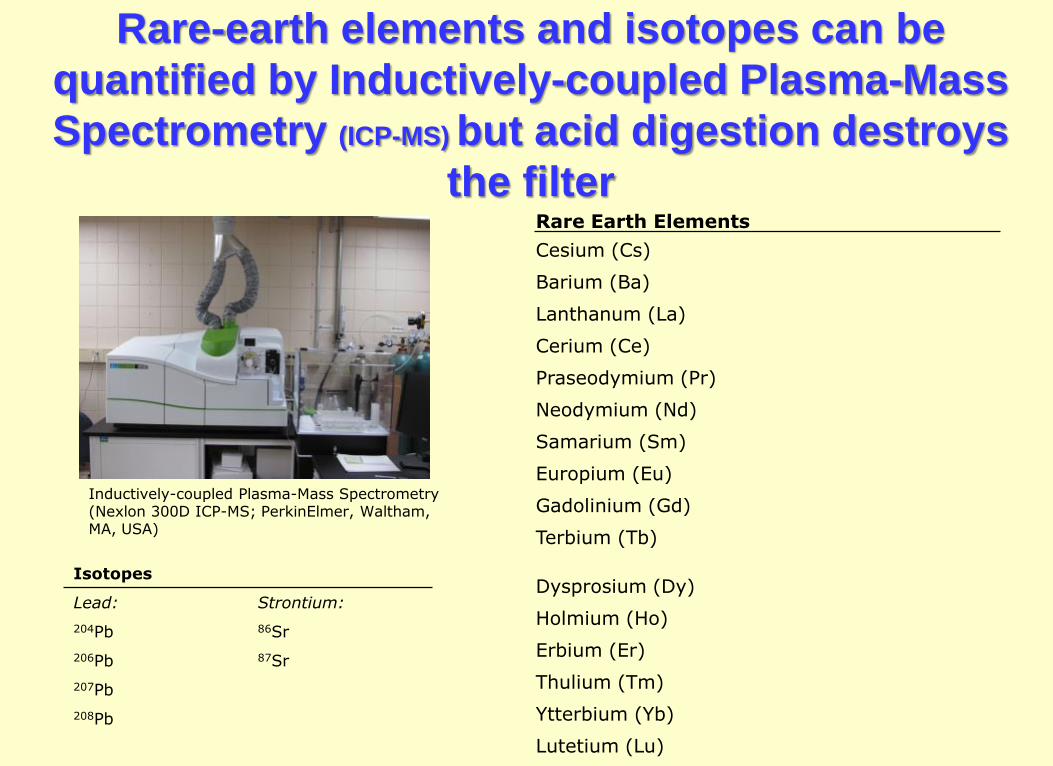
Rare-earth elements and isotopes can be
quantified by Inductively-coupled Plasma-Mass
Spectrometry (ICP-MS) but acid digestion destroys
the filter Rare Earth Elements
Cesium (Cs)
Barium (Ba)
Lanthanum (La)
Cerium (Ce)
Praseodymium (Pr)
Neodymium (Nd)
Samarium (Sm)
Europium (Eu)
Gadolinium (Gd)
Terbium (Tb)
Dysprosium (Dy)
Holmium (Ho)
Erbium (Er)
Thulium (Tm)
Ytterbium (Yb)
Lutetium (Lu)
Inductively-coupled Plasma-Mass Spectrometry (Nexlon 300D ICP-MS; PerkinElmer, Waltham, MA, USA)
Isotopes
Lead: Strontium:
204Pb 86Sr
206Pb 87Sr
207Pb
208Pb

Detection limits for ICP-MS are lower than
those of XRF for several elements
ICP-MS has difficulty detecting Si due to high background levels caused by the acid matrix
Instrument Detection Limit
0.01
0.1
1
10
100
Al Si K Ca V Mn Fe Ni Cu Br Pb
Elements
Min
imu
m D
ete
cti
on
Lim
it (
ng
cm
-2)
XRF
ICP/MS

Thermal/optical reflectance/transmittance carbon
analysis provides several carbon fractions
Thermal/Optical Analyzer (DRI Model
2001, Atmoslytics, Calabasas, CA)
Chow et al. (2007) JAWMA
°C Analysis Atmosphere
OC1 140 100% He (99.99% Purity)
OC2 280 100% He (99.99% Purity)
OC3 480 100% He (99.99% Purity)
OC4 580 100% He (99.99% Purity)
OP Return to original reflectance/transmittance value
EC1 580 98% He/2% O2
EC2 740 98% He/2% O2
EC3 840 98% He/2% O2
TC OC (OC1+OC2+OC3+OC4+OP) + EC (EC1+EC2+EC3-OP)
0
100
200
300
400
500
600
700
800
900
1000
0 200 400 600 800 1000 1200 1400 1600 1800 2000
FID
, L
as
er
Re
fle
ct
& L
as
er
Tra
ns
(re
lati
ve
un
its
)
Te
mp
era
ture
(°C
)
Time (sec)
IMPROVE_A Thermal/Optical Carbon Analysis Protocola
100% He 98% He/2% O2
EC by reflectance
OC1 OC2 OC3 OC4 EC1 EC2 EC3CH4
CAL
EC by transmission
reflectance
transmission
IMPROVE_A Thermal/Optical Protocol
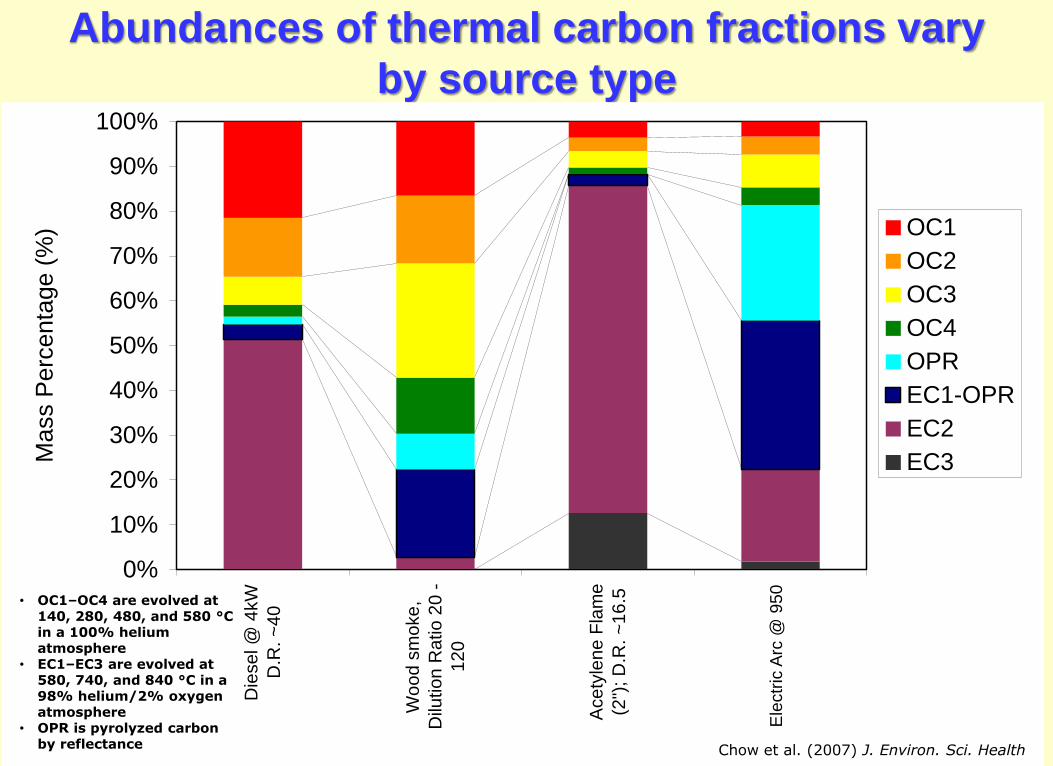
Abundances of thermal carbon fractions vary
by source type
0%
10%
20%
30%
40%
50%
60%
70%
80%
90%
100%
Die
se
l @
4kW
D.R
. ~
40
Wo
od
sm
oke
,
Dilu
tion
Ra
tio
20
-
12
0
Ace
tyle
ne
Fla
me
(2")
; D
.R.
~1
6.5
PA
LA
S @
95
0
str
om
cu
rre
nt
Ma
ss P
erc
en
tag
e (
%) OC1
OC2
OC3
OC4
OPR
EC1-OPR
EC2
EC3
Ele
ctr
ic A
rc @
950
Chow et al. (2007) J. Environ. Sci. Health
• OC1–OC4 are evolved at 140, 280, 480, and 580 °C in a 100% helium atmosphere
• EC1–EC3 are evolved at 580, 740, and 840 °C in a 98% helium/2% oxygen atmosphere
• OPR is pyrolyzed carbon by reflectance

Thermal/optical analyzers can be adapted to obtain multiple
wavelength information related to black and brown carbon
Quartz Light
Pipes
Filter Sample
Heated up to
900 °C
Lasers
405 –1000 nm8-Leg
Optical Fibers
Reflectance
Photodiode
Tranmittance
Photodiode
Time (sec)
0 500 1000 1500 2000 2500
Ion
Sig
nal
(a.u
.)
0
200
400
600
800
1000
1200
1400
1600
1800
Oven
Tem
pera
ture
(°C
)
0
2
4
6
8
10
12
14
R 405nm
R 455nm
R 532nm
R 635nm
R 780nm
R 808nm
R 980nm
T 405nm
T 455nm
T 532nm
T 635nm
T 780nm
T 808nm
T 980nm
CalibrationCH
4 Injection
Temperature
100% He 98% He / 2% O2
140°C
480°C
580°C
740°C
840°C
280°CFID
Transmittance
Reflectance
Smoldering Flaming Diesel
• Using laser diodes, λ are 405,
445, 532, 635, 780, 808, and 980 nm
• Transmittance (T) and reflectance (R) analysis are normalized to the blank filter at end of analysis
•Black and brown carbon will be quantified for different temperature fractions
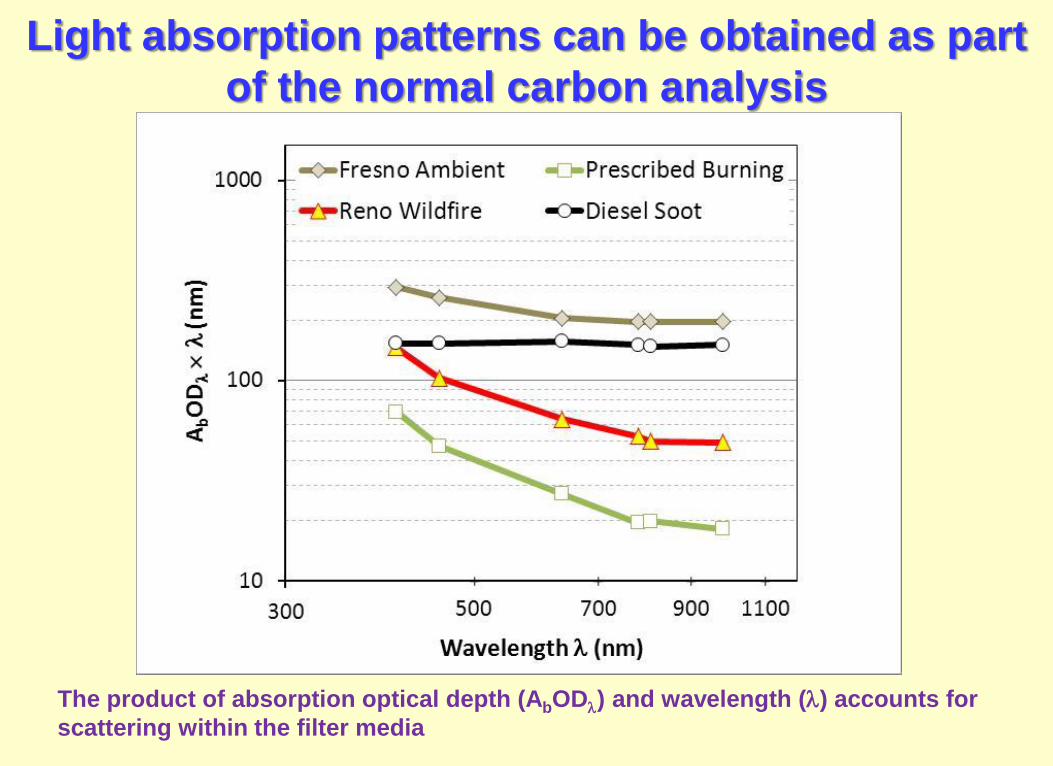
Light absorption patterns can be obtained as part
of the normal carbon analysis
The product of absorption optical depth (AbOD) and wavelength () accounts for
scattering within the filter media

Can obtain H, N, S, and O along with OC, EC, and
thermal fractions with the same analysis
Flow Control
NetworkCHNS Reactor
(MnO2)
C→CO2, H→H2O,
N→NOx/N2, S→SO2
NDIR CO2
Detector
Carrier/Reaction
Gases
98
% H
e,2
% O
2
He
He
, C
H4
He
, O
2, N
O, S
O2
Calibration
Gases
Oven
Filter Loading
Push Rod
UV-VIS-NIR
Light Source
(λ=400-1000 nm) Reflectance
Dector
Transmittance
Detector
Optical
Fibers
Filter
Filter
Holder
Thermocouple
Heated Fused
Silica Capillary
Mass
Spectrometer
Vent
Four-Way
Solenoid Valve
Flow
Splitter
Outputs:
Reflectance/
Transmittance
Spectra
O
Mass Spectra
C, H, N, S
O Reactor
(Ni/C)
O→CO
Oxidation
Oven
(CuO)
CO→CO2
Oxidation
Reactor
C→CO2
FIDMethanator
CO2→CH4
From
Oven
DRI Model 2001 Carbon Analyzer
C
DRI Model 2001
Carbon Analyzer
Outputs:
Thermal
Fragmentation
Oven
650°C
Flow Control
NetworkCHNS Reactor
(MnO2)
C→CO2, H→H2O,
N→NOx/N2, S→SO2
NDIR CO2
Detector
Carrier/Reaction
Gases
98
% H
e,2
% O
2
He
He,
CH
4
He
, O
2, N
O,
SO
2
Calibration
Gases
Oven
Filter Loading
Push Rod
UV-VIS-NIR
Light Source
(λ=400-1000 nm) Reflectance
Dector
Transmittance
Detector
Optical
Fibers
Filter
Filter
Holder
Thermocouple
Heated Fused
Silica Capillary
Mass
Spectrometer
Vent
Four-Way
Solenoid Valve
Flow
Splitter
Outputs:
Reflectance/
Transmittance
Spectra
O
Mass Spectra
C, H, N, S
O Reactor
(Ni/C)
O→CO
Oxidation
Oven
(CuO)
CO→CO2
Oxidation
Reactor
C→CO2
FIDMethanator
CO2→CH4
From
Oven
DRI Model 2001 Carbon Analyzer
C
DRI Model 2001
Carbon Analyzer
Outputs:
Thermal
Fragmentation
Oven
650°C
Flow Control
NetworkCHNS Reactor
(MnO2)
C→CO2, H→H2O,
N→NOx/N2, S→SO2
NDIR CO2
Detector
Carrier/Reaction
Gases
98
% H
e,2
% O
2
He
He
, C
H4
He,
O2,
NO
, S
O2
Calibration
Gases
Oven
Filter Loading
Push Rod
UV-VIS-NIR
Light Source
(λ=400-1000 nm) Reflectance
Dector
Transmittance
Detector
Optical
Fibers
Filter
Filter
Holder
Thermocouple
Heated Fused
Silica Capillary
Mass
Spectrometer
Vent
Four-Way
Solenoid Valve
Flow
Splitter
Outputs:
Reflectance/
Transmittance
Spectra
O
Mass Spectra
C, H, N, S
O Reactor
(Ni/C)
O→CO
Oxidation
Oven
(CuO)
CO→CO2
Oxidation
Reactor
C→CO2
FIDMethanator
CO2→CH4
From
Oven
DRI Model 2001 Carbon Analyzer
C
DRI Model 2001
Carbon Analyzer
Outputs:
Thermal
Fragmentation
Oven
650°C
More information on PM can be gained from thermal/optical analyses with different detectors

Time (min)
20 40 60 80
Ion
Sig
na
l (a
.u.)
0.0
2.0e+4
4.0e+4
6.0e+4
8.0e+4
1.0e+5
1.2e+5
8.0e+5
1.0e+6
1.2e+6
Ove
n T
em
pe
ratu
re (
°C)
0
200
400
600
800
1000
m/z=44 (CO2
+)
m/z=18 (H2O+) m/z=30 (NO
+)
m/z=64 (SO2
+)
CalibrationCH
4 Injection
Temperature
100% He 98% He / 2% O2
140°C
280°C
480°C
580°C
740°C
840°C
(a)
m/z=28 (CO+, N
2
+)
time vs Temp
Time vs m/z18
Time vs m/z28
Time vs m/z30
Time vs m/z64
Time (min)
20 40 60 80
ND
IR S
ign
al
(mV
)
40
60
80
100
400500
Oven
Tem
pera
ture
(°C
)
0
200
400
600
800
1000
140°C
280°C480°C
580°C
CalibrationO
2 Injection
NDIR
Temperature
100% He(b)
y = 0.926x - 0.104
R² = 0.989
0
1
2
3
4
5
6
0 1 2 3 4 5 6
Car
bo
n M
ass
by
Elem
enta
l An
alyz
er (µ
g)
Carbon Mass by Carbon Analyzer (µg)
EC1
OC3
OC2OC4
OC1
EC2EC3
1:1 Line
C, H, N, S, and O can be quantified for each
temperature fraction
Thermogram of Fresno ambient
aerosol sample for (a) CHNS, and
(b) O following the IMPROVE_A
protocol.
Comparison of carbon fractions
measured by elemental analyzer
and DRI Model 2001 carbon
analyzer

Mass spectrometer signals are linear with C, H, N,
and S quantities for calibration chemicals
Sulfanilamide: C6H8N2O2S; L-Cystine: C6H12N2O4S2
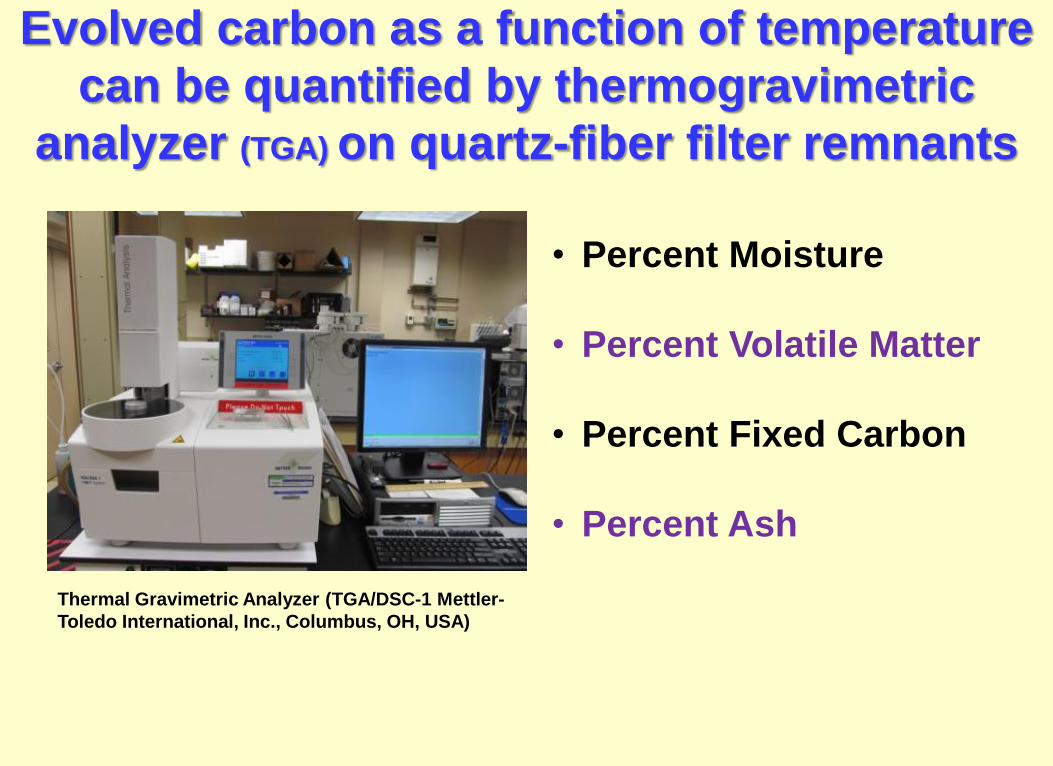
Evolved carbon as a function of temperature
can be quantified by thermogravimetric
analyzer (TGA) on quartz-fiber filter remnants
• Percent Moisture
• Percent Volatile Matter
• Percent Fixed Carbon
• Percent Ash
Thermal Gravimetric Analyzer (TGA/DSC-1 Mettler-
Toledo International, Inc., Columbus, OH, USA)

Thermal desorption-Gas Chromatography/Mass
Spectrometry (TD-GC/MS) can provide ~110 non-polar
organic compoundsa
• 37 Polycyclic aromatic hydrocarbons (PAHs)
• 26 n-alkanes
• 10 iso/anteiso-alkanes
• 2 methyl-alkanes
• 3 branched-alkanes
• 5 cycloalkanes
• 1 alkene
• 18 hopanes
• 12 steranes
Gas Chromatography with Mass Spectrometric
Detector (Model 6890 /Model 5975C, Agilent
Technologies, Santa Clara, CA, USA)
a Using ~1–2 cm2 of filter aliquot without solvent extraction
Acenapthene
Fluorene
Phenanthrene
Fluoranthene
Anthracene
Benzo(B)fluoranthene
Benzo(j+k)fluoranthene
Perylene

Water- and acid-extracted solutions
can be used for multiple analyses
Ultra-sonication
Sonicator (Branson Model
5200 Danbury, CT)
Mechanical Shaking
Sample shaker (Cole-Parmer Model
51401-00, Vernon Hills, IL)
Microwave Extraction(MCEM Mars 5, Matthews, NC)
Acid Digestion
Hot block digestor
(Environmental Express,
Ventura, CA)

More ions can be quantified with the same
analysis (Ion Chromatography with conductivity detector [IC-CD])
• Chloride (Cl-)
• Bromide (Br-)
• Nitrite (NO2-)
• Nitrate (NO3-)
• Phosphate (PO43-)
• Sulfate (SO4=)
• Ammonium (NH4+)
• Soluble Sodium (Na+)
• Soluble Magnesium (Mg2+)
• Soluble Potassium (K+)
• Soluble Calcium (Ca2+)
Ion Chromatograph (Dionex Model ICS
3000, Sunnyvale, CA, USA
NH4+
Mg2+
Ca2+
Na+
K+
Cl-
Br- NO3-
PO43- SO4
=
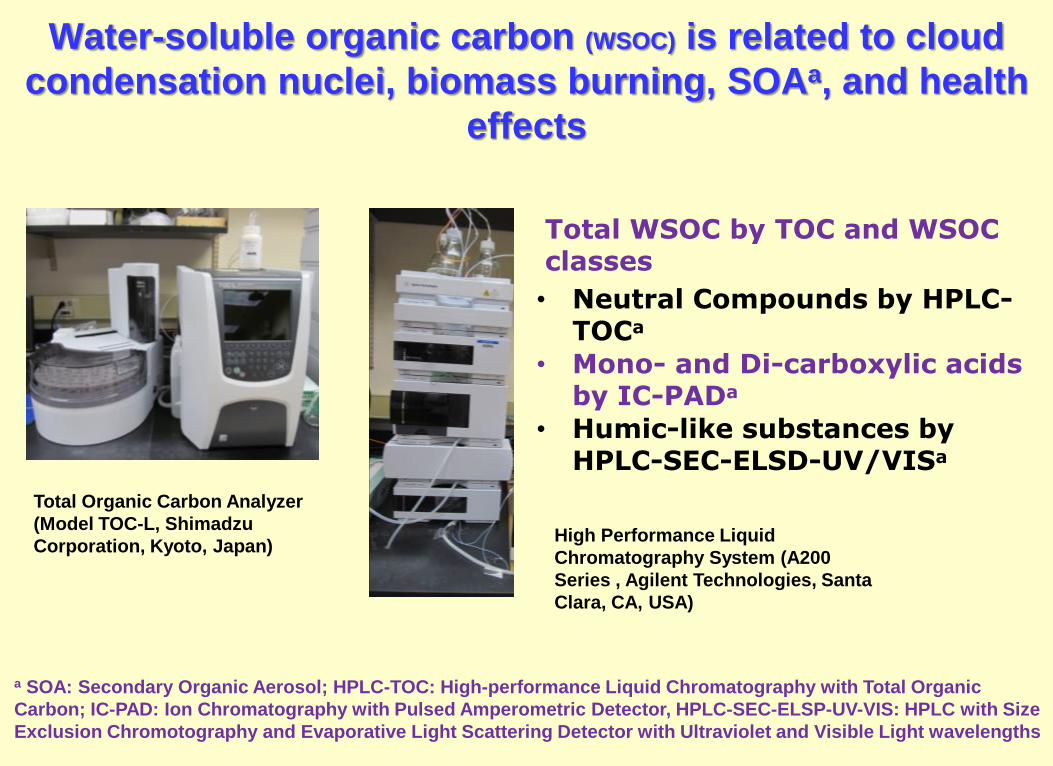
Water-soluble organic carbon (WSOC) is related to cloud
condensation nuclei, biomass burning, SOAa, and health
effects
Total WSOC by TOC and WSOC classes
• Neutral Compounds by HPLC-TOCa
• Mono- and Di-carboxylic acids by IC-PADa
• Humic-like substances by HPLC-SEC-ELSD-UV/VISa
Total Organic Carbon Analyzer
(Model TOC-L, Shimadzu
Corporation, Kyoto, Japan)
a SOA: Secondary Organic Aerosol; HPLC-TOC: High-performance Liquid Chromatography with Total Organic
Carbon; IC-PAD: Ion Chromatography with Pulsed Amperometric Detector, HPLC-SEC-ELSP-UV-VIS: HPLC with Size
Exclusion Chromotography and Evaporative Light Scattering Detector with Ultraviolet and Visible Light wavelengths
High Performance Liquid
Chromatography System (A200
Series , Agilent Technologies, Santa
Clara, CA, USA)
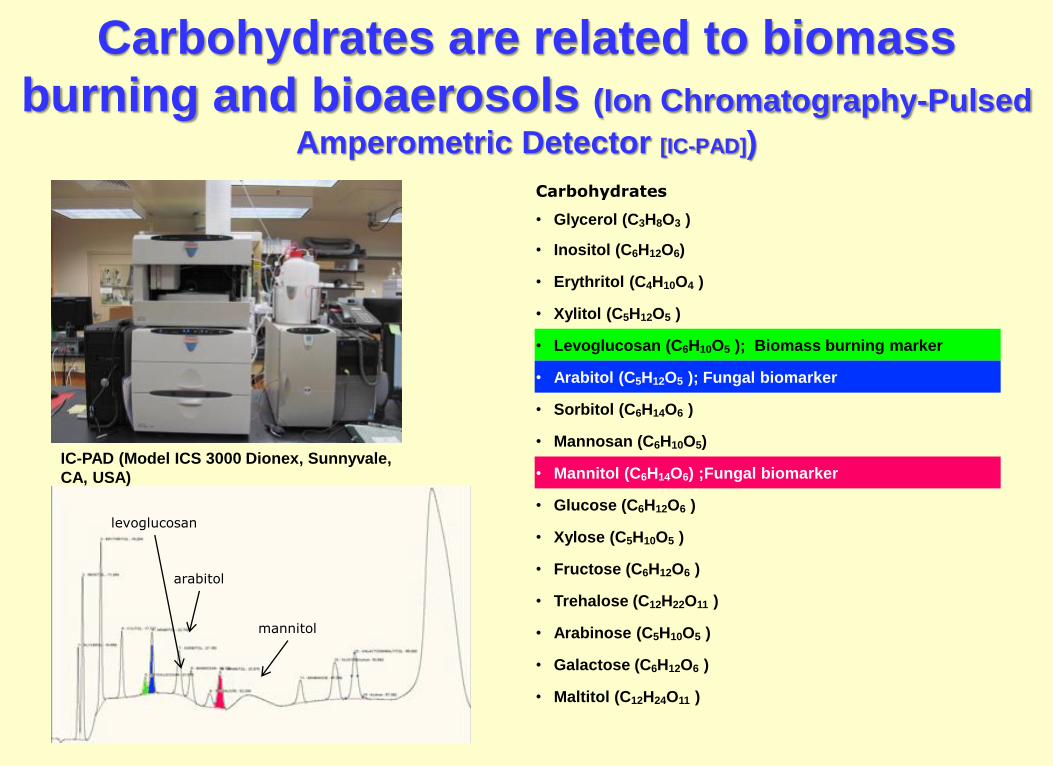
Carbohydrates are related to biomass
burning and bioaerosols (Ion Chromatography-Pulsed
Amperometric Detector [IC-PAD])
Carbohydrates
• Glycerol (C3H8O3 )
• Inositol (C6H12O6)
• Erythritol (C4H10O4 )
• Xylitol (C5H12O5 )
• Levoglucosan (C6H10O5 ); Biomass burning marker
• Arabitol (C5H12O5 ); Fungal biomarker
• Sorbitol (C6H14O6 )
• Mannosan (C6H10O5)
• Mannitol (C6H14O6) ;Fungal biomarker
• Glucose (C6H12O6 )
• Xylose (C5H10O5 )
• Fructose (C6H12O6 )
• Trehalose (C12H22O11 )
• Arabinose (C5H10O5 )
• Galactose (C6H12O6 )
• Maltitol (C12H24O11 )
IC-PAD (Model ICS 3000 Dionex, Sunnyvale,
CA, USA)
levoglucosan
arabitol
mannitol

Organic acids are related to biomass
burning and cooking emissions
Monocarboxylic acids:
• Lactic acid (C3H6O3 )
• Acetic acid (C2H4O2)
• Formic acid (CH2O)
• Methanesulfonic acid (CH4SO3 )
Dicarboxylic acids:
• Glutaric acid (C5H8O4 )
• Succinic acid (C4H6O4)
• Malonic acid (C3H4O4 )
• Maleic acid (C4H4O4)
• Oxalic acid (C2H2O4)
Ion Chromatography with Electrochemical
Detector (IC-ECD, Dionex Model ICS 2100 Ion
Chromatograph, Sunnyvale, CA, USA)
Formate
Succinate
Oxalate

Elemental analysis quantifies total C, H, N, S,
and O for OM to OC ratios on liquids and
quartz-fiber filters
• Carbon (C)
• Hydrogen (H)
• Nitrogen (N)
• Sulfur (S)
• Oxygen (O)
Elemental Analyzer (FlashEA 1112 , Thermo Fischer
Scientific, Waltham, MA, USA)

Conclusions
• A large variety of analyses, especially for organic compounds, can be applied to recent or archived samples to verify source contribution estimates
• Teflon-membrane filters can yield much information from non-destructive IR and UV-VIS analysis. Rare-earth elements and some isotopes can be determined by ICP-MS after acid extraction
• Quartz-fiber filters can yield more optical and chemical information from routine thermal/optical analyses with multi-wavelength lasers and multi-elemental detectors. TD-GC/MS is an established and efficient method for non-extraction organic marker analysis
• Water extracts are amenable to several analyses for polar organics, including biomass burning and secondary organic aerosol markers

Challenges for Enhanced Chemical
Characterization of Filter Samples
• Perfecting, evaluating, and making more efficient procedures for
additional characterization
• Modifying instrumentation and procedures to incorporate more
specific analyses methods into long-term chemical speciation
networks to obtain more information from existing samples
• Maintaining continuity and consistency with the long-term
trends data sets
• Developing more detailed source profiles with these methods
for speciated inventories and source apportionment

Questions?