improved winter european atmospheric blocking frequencies in high ... · euro-atlantic sector. this...
TRANSCRIPT
RESEARCH ARTICLE10.1002/2017MS001082
Improved Winter European Atmospheric Blocking Frequenciesin High-Resolution Global Climate SimulationsP. Davini1,2 , S. Corti3 , F. D’Andrea1, G. Riviere1, and J. von Hardenberg2
1Laboratoire de M�et�eorologie Dynamique/IPSL, �Ecole Normale Sup�erieure, PSL Research University, CNRS, Paris, France,2Istituto di Scienze dell’Atmosfera e del Clima, Consiglio Nazionale delle Ricerche (ISAC-CNR), Torino, Italy, 3Istituto diScienze dell’Atmosfera e del Clima, Consiglio Nazionale delle Ricerche (ISAC-CNR), Bologna, Italy
Abstract The numerical simulation of atmospheric blocking, in particular over the Euro-Atlantic region,still represents a main concern for the climate modeling community. We discuss the Northern Hemispherewinter atmospheric blocking representation in a set of 30 year atmosphere-only simulations using theEC-Earth Earth System Model with several ensemble members at five different horizontal resolutions (from125 to 16 km). Results show that the negative bias in blocking frequency over Europe becomes negligibleat resolutions of about 40 and 25 km. A combined effect by the more resolved orography and by a changein tropical precipitation is identified as the source of an upper tropospheric planetary wave. At the sametime, a weakening of the meridional temperature gradient reduces the upper level baroclinicity and thezonal mean winds. Following these changes, in the high-resolution configurations the Atlantic eddy-drivenjet stream is weakened favoring the breaking of synoptic Rossby waves over the Atlantic ridge and thusincreasing the simulated European blocking frequency. However, at high-resolution the Atlantic jet streamis too weak and the blocking duration is still underestimated. This suggests that the optimal blockingfrequencies are achieved through compensation of errors between eddies found at upper levels (toostrong) and eddies at lower levels (too weak). This also implies that eddies are not necessarily betterrepresented at higher resolutions.
1. Introduction
Atmospheric blocking is a midlatitude weather pattern characterized by a quasi-stationary, long-lasting,equivalent-barotropic, high-pressure system that ‘‘blocks’’ and diverts the movement of the synoptic cyclones(Berggren et al., 1949; Rex, 1950). It usually occurs following the breaking of a Rossby wave in diffluenceregions at the exit of the Pacific and Atlantic storm track. Here a subtropical low-vorticity air mass is advectedpoleward, developing an anticyclonic circulation (Davini et al., 2012; Pelly & Hoskins, 2003; Tyrlis & Hoskins,2008a). Blocking occurs more frequently in winter and spring—when the jet streams and the storm tracks arestronger—although it may be observed all over the year (Barriopedro et al., 2006; Tyrlis & Hoskins, 2008b).
Atmospheric blocking is characterized by a complex dynamic, and often by a blurry definition: several com-plementary phenomena operate within the word ‘‘blocking,’’ from Rossby wave breaking (Masato et al.,2011; Pelly & Hoskins, 2003) to transient baroclinic eddies (Green, 1977; Nakamura et al., 1997; Shutts, 1983),passing through diabatic effects (Pfahl et al., 2015) and the resonance with planetary waves (Austin, 1980).Even if all these mechanisms contribute to the onset and maintenance of blocking anomalies, to this day acomprehensive theoretical interpretation of blocking dynamics has yet to be developed: this is mainly dueto its nonlinear dynamics, which makes theoretical approaches often ineffective in the real world (Charney& DeVore, 1979; Malguzzi & Malanotte-Rizzoli, 1984; McWilliams, 1980). Moreover, finding a common objec-tive detection index is also not straightforward: several indices have been developed (see Barriopedro et al.,2010, for details), both monodimensional and bidimensional, using absolute fields or anomalies, potentialvorticity or geopotential height, sometimes leading to contradicting results (Barnes et al., 2014; Scherreret al., 2006). However, they all concur in defining a ‘‘blocking frequency,’’ i.e., the percentage of number ofdays for which blocking is occurring at a certain grid point.
Among others, one of the reasons why blocking is still in the spotlight of climate research after more than60 years is that numerical models have always shown limited skill in reproducing it, in particular over the
Key Points:� 25-km resolution EC-Earth GCM is
able to simulate winter atmosphericblocking frequency over Europe witha negligible bias� Improvements are caused by the
more refined orography and by theweakening of the storm track� Blocking duration and jet speed are
underestimated suggesting thatpositive results are due to biascompensation
Correspondence to:P. Davini,[email protected]
Citation:Davini, P., Corti, S., D’Andrea, F.,Riviere, G., & von Hardenberg, J. (2017).Improved Winter EuropeanAtmospheric Blocking Frequencies inHigh-Resolution Global ClimateSimulations. Journal of Advances inModeling Earth Systems, 9, 2615–2634.https://doi.org/10.1002/2017MS001082.
Received 7 JUN 2017
Accepted 7 OCT 2017
Accepted article online 16 OCT 2017
Published online 17 NOV 2017
VC 2017. The Authors.
This is an open access article under the
terms of the Creative Commons
Attribution-NonCommercial-NoDerivs
License, which permits use and
distribution in any medium, provided
the original work is properly cited, the
use is non-commercial and no
modifications or adaptations are
made.
DAVINI ET AL. IMPROVED BLOCKING IN HIGH-RESOLUTION 2615
Journal of Advances in Modeling Earth Systems
PUBLICATIONS

Euro-Atlantic sector. This poor skill is still widely documented for general circulation models, both forweather prediction (Matsueda, 2011; Tibaldi & Molteni, 1990) and for climate purposes (Davini & D’Andrea,2016; Vial & Osborn, 2012). Even the more recent analyses from the Coupled Model IntercomparisonProject-Phase 5 (Taylor et al., 2012) still show a negative bias in blocking frequencies, especially over Europe(Anstey et al., 2013; Dunn-Sigouin and Son, 2013; Masato et al., 2013)
The origin of the underestimation of blocking frequencies over Europe has been often connected with anincorrect representation of the mean state that affects Rossby waves propagation and consequently block-ing dynamics (Scaife et al., 2010; Vial & Osborn, 2012). In general, it has been shown that a large part of theblocking bias is associated with the mean state bias rather than to the capacity of representing single block-ing events (Davini & D’Andrea, 2016).
A good representation of sea-surface temperatures (SST) has been claimed to be important, showing thatsimulations can be improved by reducing biases in the North Atlantic SSTs (O’Reilly et al., 2016; Scaife et al.,2011). However, this can be considerably model-dependent (Davini & D’Andrea, 2016).
Finally, an increase in the horizontal resolution of the atmospheric model has generally been invoked as asolution to improve blocking (Jung et al., 2012; Matsueda et al., 2009): again, even if this clearly emerges inmultimodel assessment of climate models (Davini & D’Andrea, 2016), there is evidence that it may be inef-fective for some specific models (Schiemann et al., 2017).
Blocking may benefit of horizontal grid refinement for at least two main reasons: first, this is associated withbetter resolved transient eddy fluxes, which should sustain the blocking persistence (Shutts, 1983). Second,higher horizontal resolution implies a better resolved mean orography, that can affect the mean state byshaping the planetary waves (Berckmans et al., 2013; Jung et al., 2012). It is important to recall thatorography-related improvements can be obtained also with the introduction/improvement of parameter-izations that mimic the drag on the flow by subgrid orography (Jung et al., 2010a; Pithan et al., 2016). Theseimprovements can affect both the model variability and the model mean state: for instance, a finer grid canprovide an improvement in the jet stream properties, which in turn modifies the Rossby wave guide andindirectly help the blocking dynamics.
Recently Davini et al. (2017) presented preliminary results of the Climate SPHINX (Stochastic Physics HIghresolutioN eXperiments) PRACE project, a set of ensemble simulations aimed at evaluating the sensitivity ofpresent and future climate to model resolution and stochastic parameterization, with resolutions from 125to 16km. They showed that increased atmospheric horizontal resolution can provide a significant benefitfor the simulation of European blocking, as illustrated by a basic monodimensional blocking index.
In this work we aim at extending the results of Davini et al. (2017), by analyzing the output of present dayclimate simulations performed within the SPHINX project. In particular, we use a modern bidimensionalblocking index comparing EC-Earth to other CMIP5 models, in order to accurately assess whether or not theimprovements seen can be associated with resolution increase. Further, we investigate which are the rea-sons behind these changes.
2. Data and Methods
A subset of the simulations carried out within the Climate SPHINX project (Davini et al., 2017) is used. This ismade by an ensemble of atmospheric-only simulations for 30 consecutive years, from 1979 up to 2008,with forcing according to the historical CMIP5 protocol (Moss et al., 2010). The runs were performed withversion 3.1 of the atmosphere-ocean Earth System Model EC-Earth (Hazeleger et al., 2010, 2012).
The atmospheric component of EC-Earth is based on cycle 36r4 of the Integrated Forecast System (IFS) cir-culation model (ECWMF, 2010), which has been developed by the European Centre for Medium RangeWeather Forecasts (ECMWF). The model has been tuned and improved for climate purposes by the EC-EarthConsortium. To represent land surface dynamics, IFS integrates the Hydrology Tiled ECMWF Scheme of Sur-face Exchanges over Land (H-TESSEL) land surface scheme (Balsamo et al., 2009). A specific feature of theClimate SPHINX simulations is to have the same vertical grid with 91 levels (L91) but to explore five differenthorizontal resolutions with several ensemble members: 10 ensemble members are run at T159 (�125km),10 at T255 (�80 km), six at T511 (�40 km), three at T799 (�25 km), and one at T1279 (�16 km).
Journal of Advances in Modeling Earth Systems 10.1002/2017MS001082
DAVINI ET AL. IMPROVED BLOCKING IN HIGH-RESOLUTION 2616
SST and sea ice concentration for the Climate SPHINX simulations have been obtained from theHadISST2.1.1 data set (Titchner & Rayner, 2014). It is important to point out that model tuning has beenperformed only for the ‘‘standard’’ T255 EC-Earth configuration, i.e., the one that will be used for theupcoming CMIP6 project. Therefore energy budgets at resolutions different from T255 present smallbiases that, together with details on the setup of the Climate SPHINX simulations, are described in Daviniet al. (2017).
In order to provide a comparison with other state-of-the-art Global Climate Models (GCMs), 18 differ-ent atmospheric-only climate models from the CMIP5 project have been considered. A single ensem-ble member over the same time window (1979–2008) has been analyzed for ACCESS1-0, BCC-CSM1-1,BNU-ESM, CanAM4, CCSM4, CNRM-CM5, EC-Earth, FGOALS-g2, GFDL-CM3, HadGEM2-A, IPSL-CM5A-LR,IPSL-CM5A-MR, IPSL-CM5B-LR, MIROC5, MPI-ESM-LR, MPI-ESM-MR, MRI-CGCM3, and NorESM1-M. Forconvenience, since these are atmospheric-only models, we will refer to them as AMIP5 in thefollowing.
In order to evaluate biases of the EC-Earth simulations, we use 1979–2008 data from the ECMWF ERA-Interim Reanalysis (Dee et al., 2011) and, for blocking diagnostic only, also from the NCEP/NCAR Reanalysis(Kalnay et al., 1996). In all the manuscript we focus on the extended winter season (defined as December–March, DJFM), for a total of 29 consecutive seasons. Before any computation, all data are interpolated on acommon 2.58 x 2.58 grid with a second-order conservative remapping method.
To objectively recognize blocking events a 2-D index based on the reversal of the gradient of geopotentialheight measured at 500hPa (Z500) has been adopted (Davini et al., 2012; Scherrer et al., 2006). This is anextension of the most known index by Tibaldi and Molteni (1990). Two meridional gradients of geopotentialheight are defined:
GHGSðk0;/0Þ5Z500ðk0;/0Þ2Z500ðk0;/SÞ
/02/S; (1)
GHGNðk0;/0Þ5Z500ðk0;/NÞ2Z500ðk0;/0Þ
/N2/0(2)
and /0 ranges from 308N to 758N while k0 ranges from 08 to 3608. /S5 /0 – 158, /N5 /0 1 158. Instanta-neous Blocking is thus identified when:
GHGSðk0;/0Þ > 0 GHGNðk0;/0Þ < 210m=�lat (3)
Further constraints have been applied to Instantaneous Blocking. First, Large-Scale Blocking is definedwhen an Instantaneous Blocking is extended for at least 158 of continuous longitude. Second, a Large-ScaleBlocking Event is defined for each grid point when a Large-Scale Blocking is occurring within 58 lon (2 gridpoints) and 2.58 lat (1 grid point) of it. Finally, a Blocking Event at a certain grid point is defined when aLarge-Scale Blocking Events lasts for at least 5 days. Those constraints ensure that Blocking Events have asignificant longitudinal extension, are persistent and quasi-stationary. The percentage of days per season inwhich Blocked Events occur (i.e., blocked days) defines the blocking frequency climatology. A completedescription of the blocking climatology and of the blocking detection scheme may be found in Davini et al.(2012).
We make use of other diagnostics to study the midlatitude climate variability. In order to evaluate the baro-clinic instability changes along the storm track, we make use the Eady Growth Rate maximum, defined fol-lowing Vallis (2006):
rBI50:3068 f
���� @�u@z
����N21; (4)
where the overbar denotes a time average, u is the eastward wind component, f the Coriolis frequency, andN is the Brunt-V€ais€al€a frequency, defined as:
N25gh@�h@z; (5)
where h is the air potential temperature and g the standard gravity acceleration.
Journal of Advances in Modeling Earth Systems 10.1002/2017MS001082
DAVINI ET AL. IMPROVED BLOCKING IN HIGH-RESOLUTION 2617
High-frequency variability is measured applying a bandpass Fourier filtering between 2 and 6 days and fil-tered variables are hereafter indicated with a prime sign. Transient eddies activity is then evaluated usingthe standard deviation of the bandpass filtered daily geopotential height (Z0). In analogy, eddy kineticenergy (EKE) is computed using the bandpass filtered zonal and meridional wind so that EKE51=2ðu021v02Þ.In addition, the low level heat fluxes are evaluated to provide supplementary information on the storm trackdevelopment. These are measured as the product of the bandpass filtered meridional velocity and tempera-ture so that HF5v0T 0.
Two more diagnostics are introduced to evaluate the transfer of energy from the mean flow to the eddiesand vice versa. The role of the eddy forcing on the large-scale flow is analyzed using the scalar productE � D, which is a measure of barotropic exchange of kinetic energy between the transient eddies and thelarge-scale flow (Cai & Mak, 1990). E is defined as the horizontal part of the local Eliassen-Palm vector (Tren-berth, 1986) which is very similar to the Hoskins E-vector (Hoskins et al., 1983) and is computed evaluatingthe bandpass filtered (2–6 days) u and v as
E5v022u02
2;2u0v0
� �: (6)
Conversely, D is the deformation of the mean field, where Dx is the stretching deformation and Dy the sheardeformation (Black & Dole, 2000; Cai & Mak, 1990):
D5@�u@x
2@�v@y;@�v@x
1@�u@y
� �: (7)
E � D is usually computed in the upper troposphere (i.e., 250 hPa) where it reaches its highest values. Posi-tive values of the E � D scalar (also known as barotropic energy conversion) indicate regions where themean flow is feeding the synoptic eddies, while negative values point to regions where the mean flow isfed by the eddies. Large negative values are commonly seen in the exit region of the storm track, where theeddies are ‘‘barotropizing’’ the flow while smaller positive values are found in the entrance region (Black &Dole, 2000; Lee, 2000).
Similarly to the barotropic conversion, we introduce the baroclinic conversion energy term. It is defined fol-lowing Riviere and Joly (2006) as
F521S
v0h0@�h@y; (8)
which is the product between the meridional temperature gradient and the high-frequency heat fluxesdivided by a static stability parameter S, here defined as
S52R
p0
p0
p
� �cvcp @�h@p; (9)
where p0 is the reference density (i.e., 1000 hPa), cv and cp are the atmospheric specific heat at constant vol-ume and pressure, respectively, and R is the gas constant for dry air. The baroclinic conversion term F, usu-ally evaluated in lower-middle troposphere, is mainly characterized by positive values, highlighting areaswhere the available potential energy of the mean flow is transferred to the eddies, namely in the core ofthe storm tracks (Cai & Mak, 1990; Riviere & Joly, 2006).
3. Results
3.1. Blocking FrequencyThe top row of Figure 1 shows the climatology of blocking events frequency averaged over the extendedwinter season (December–March, DJFM) for the 1979–2008 period. The ensemble mean of the five resolu-tions explored in Climate SPHINX is plotted.
In Figure 1 two main areas of blocking are identified, over the Pacific and the Atlantic basins. The maximumblocking events frequency is found over the Pacific at high latitudes. Conversely over the Atlantic sector afirst relative maximum is seen over Greenland—which is associated with cyclonic Rossby wave breaking—
Journal of Advances in Modeling Earth Systems 10.1002/2017MS001082
DAVINI ET AL. IMPROVED BLOCKING IN HIGH-RESOLUTION 2618
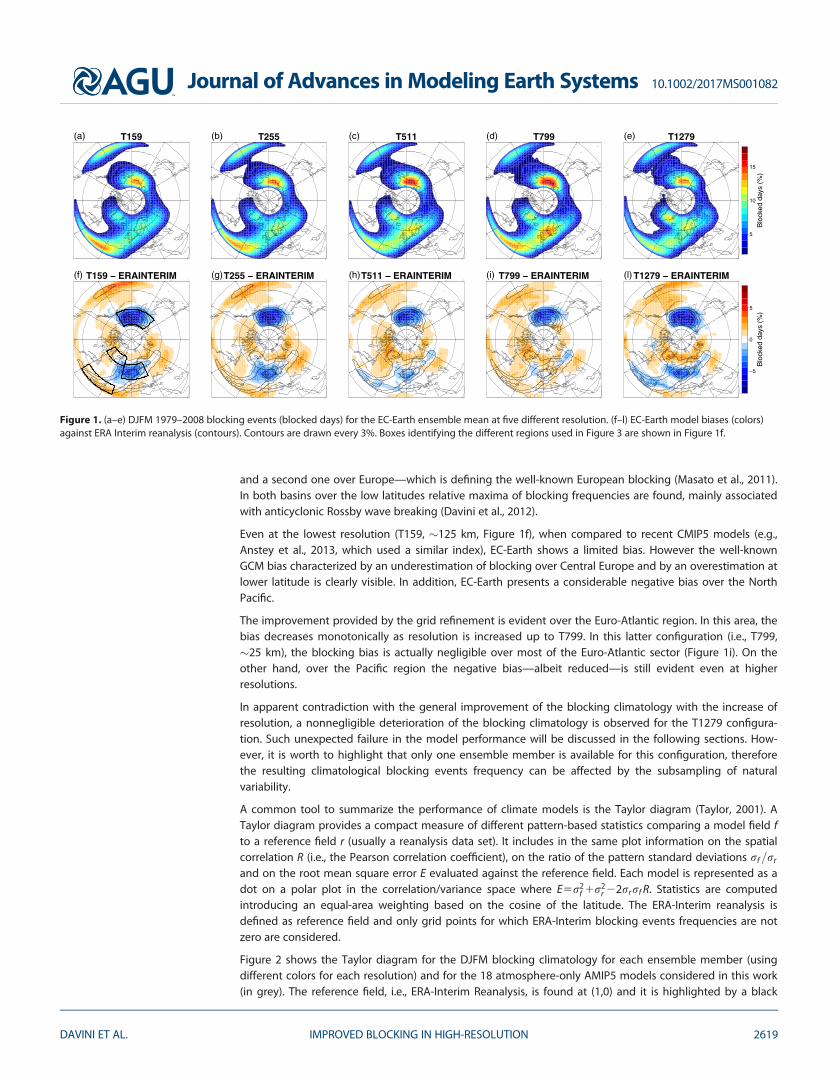
and a second one over Europe—which is defining the well-known European blocking (Masato et al., 2011).In both basins over the low latitudes relative maxima of blocking frequencies are found, mainly associatedwith anticyclonic Rossby wave breaking (Davini et al., 2012).
Even at the lowest resolution (T159, �125 km, Figure 1f), when compared to recent CMIP5 models (e.g.,Anstey et al., 2013, which used a similar index), EC-Earth shows a limited bias. However the well-knownGCM bias characterized by an underestimation of blocking over Central Europe and by an overestimation atlower latitude is clearly visible. In addition, EC-Earth presents a considerable negative bias over the NorthPacific.
The improvement provided by the grid refinement is evident over the Euro-Atlantic region. In this area, thebias decreases monotonically as resolution is increased up to T799. In this latter configuration (i.e., T799,�25 km), the blocking bias is actually negligible over most of the Euro-Atlantic sector (Figure 1i). On theother hand, over the Pacific region the negative bias—albeit reduced—is still evident even at higherresolutions.
In apparent contradiction with the general improvement of the blocking climatology with the increase ofresolution, a nonnegligible deterioration of the blocking climatology is observed for the T1279 configura-tion. Such unexpected failure in the model performance will be discussed in the following sections. How-ever, it is worth to highlight that only one ensemble member is available for this configuration, thereforethe resulting climatological blocking events frequency can be affected by the subsampling of naturalvariability.
A common tool to summarize the performance of climate models is the Taylor diagram (Taylor, 2001). ATaylor diagram provides a compact measure of different pattern-based statistics comparing a model field fto a reference field r (usually a reanalysis data set). It includes in the same plot information on the spatialcorrelation R (i.e., the Pearson correlation coefficient), on the ratio of the pattern standard deviations rf=rr
and on the root mean square error E evaluated against the reference field. Each model is represented as adot on a polar plot in the correlation/variance space where E5r2
f 1r2r 22rrrf R. Statistics are computed
introducing an equal-area weighting based on the cosine of the latitude. The ERA-Interim reanalysis isdefined as reference field and only grid points for which ERA-Interim blocking events frequencies are notzero are considered.
Figure 2 shows the Taylor diagram for the DJFM blocking climatology for each ensemble member (usingdifferent colors for each resolution) and for the 18 atmosphere-only AMIP5 models considered in this work(in grey). The reference field, i.e., ERA-Interim Reanalysis, is found at (1,0) and it is highlighted by a black
T159(a) T255(b) T511(c) T799(d) T1279(e)
5
10
15
Blo
cked
day
s (%
)
T159 − ERAINTERIM(f) T255 − ERAINTERIM(g) T511 − ERAINTERIM(h) T799 − ERAINTERIM(i) T1279 − ERAINTERIM(l)
−5
0
5
Blo
cked
day
s (%
)
Figure 1. (a–e) DJFM 1979–2008 blocking events (blocked days) for the EC-Earth ensemble mean at five different resolution. (f–l) EC-Earth model biases (colors)against ERA Interim reanalysis (contours). Contours are drawn every 3%. Boxes identifying the different regions used in Figure 3 are shown in Figure 1f.
Journal of Advances in Modeling Earth Systems 10.1002/2017MS001082
DAVINI ET AL. IMPROVED BLOCKING IN HIGH-RESOLUTION 2619
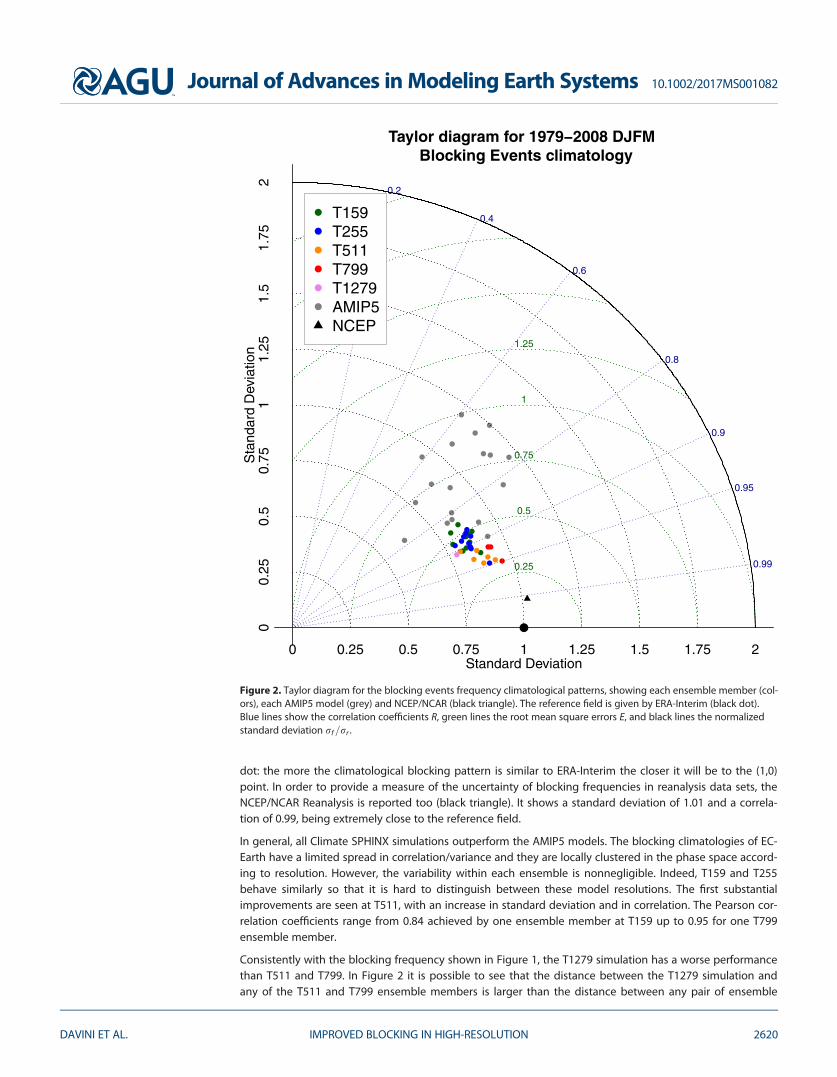
dot: the more the climatological blocking pattern is similar to ERA-Interim the closer it will be to the (1,0)point. In order to provide a measure of the uncertainty of blocking frequencies in reanalysis data sets, theNCEP/NCAR Reanalysis is reported too (black triangle). It shows a standard deviation of 1.01 and a correla-tion of 0.99, being extremely close to the reference field.
In general, all Climate SPHINX simulations outperform the AMIP5 models. The blocking climatologies of EC-Earth have a limited spread in correlation/variance and they are locally clustered in the phase space accord-ing to resolution. However, the variability within each ensemble is nonnegligible. Indeed, T159 and T255behave similarly so that it is hard to distinguish between these model resolutions. The first substantialimprovements are seen at T511, with an increase in standard deviation and in correlation. The Pearson cor-relation coefficients range from 0.84 achieved by one ensemble member at T159 up to 0.95 for one T799ensemble member.
Consistently with the blocking frequency shown in Figure 1, the T1279 simulation has a worse performancethan T511 and T799. In Figure 2 it is possible to see that the distance between the T1279 simulation andany of the T511 and T799 ensemble members is larger than the distance between any pair of ensemble
Figure 2. Taylor diagram for the blocking events frequency climatological patterns, showing each ensemble member (col-ors), each AMIP5 model (grey) and NCEP/NCAR (black triangle). The reference field is given by ERA-Interim (black dot).Blue lines show the correlation coefficients R, green lines the root mean square errors E, and black lines the normalizedstandard deviation rf =rr .
Journal of Advances in Modeling Earth Systems 10.1002/2017MS001082
DAVINI ET AL. IMPROVED BLOCKING IN HIGH-RESOLUTION 2620
members from these two latter configurations. This opens the possibility that the poor performance of theT1279 configuration may be not simply induced by the small sample examined, but that it could be linkedto this specific configuration. Indeed, it should be recalled that model tuning has been carried out at T255,a resolution five times coarser than T1279.
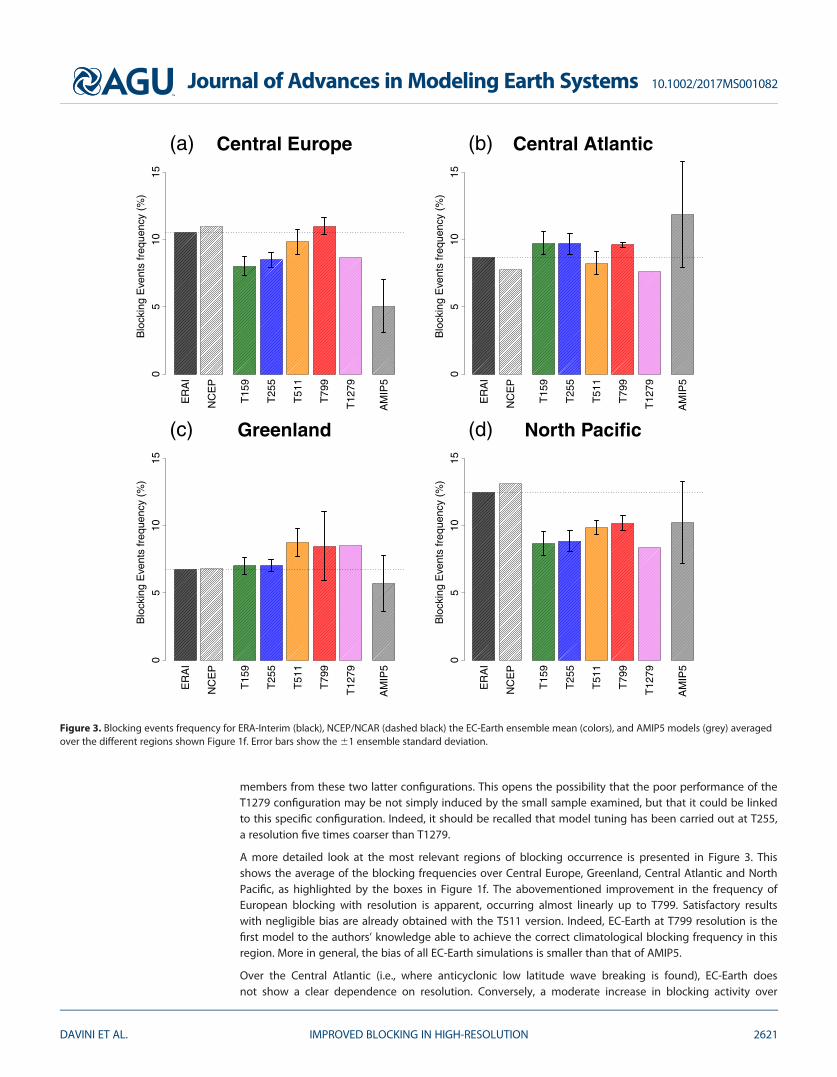
A more detailed look at the most relevant regions of blocking occurrence is presented in Figure 3. Thisshows the average of the blocking frequencies over Central Europe, Greenland, Central Atlantic and NorthPacific, as highlighted by the boxes in Figure 1f. The abovementioned improvement in the frequency ofEuropean blocking with resolution is apparent, occurring almost linearly up to T799. Satisfactory resultswith negligible bias are already obtained with the T511 version. Indeed, EC-Earth at T799 resolution is thefirst model to the authors’ knowledge able to achieve the correct climatological blocking frequency in thisregion. More in general, the bias of all EC-Earth simulations is smaller than that of AMIP5.
Over the Central Atlantic (i.e., where anticyclonic low latitude wave breaking is found), EC-Earth doesnot show a clear dependence on resolution. Conversely, a moderate increase in blocking activity over
ER
AI
NC
EP
T15
9
T25
5
T51
1
T79
9
T12
79
AM
IP5
Central EuropeB
lock
ing
Eve
nts
freq
uenc
y (%
)0
510
15(a)
ER
AI
NC
EP
T15
9
T25
5
T51
1
T79
9
T12
79
AM
IP5
Central Atlantic
Blo
ckin
g E
vent
s fr
eque
ncy
(%)
05
1015
(b)
ER
AI
NC
EP
T15
9
T25
5
T51
1
T79
9
T12
79
AM
IP5
Greenland
Blo
ckin
g E
vent
s fr
eque
ncy
(%)
05
1015
(c)
ER
AI
NC
EP
T15
9
T25
5
T51
1
T79
9
T12
79
AM
IP5
North PacificB
lock
ing
Eve
nts
freq
uenc
y (%
)0
510
15
(d)
Figure 3. Blocking events frequency for ERA-Interim (black), NCEP/NCAR (dashed black) the EC-Earth ensemble mean (colors), and AMIP5 models (grey) averagedover the different regions shown Figure 1f. Error bars show the 61 ensemble standard deviation.
Journal of Advances in Modeling Earth Systems 10.1002/2017MS001082
DAVINI ET AL. IMPROVED BLOCKING IN HIGH-RESOLUTION 2621
Greenland (i.e., where cyclonic wave breaking occurs) is observed following grid refinement. This is consis-tent with Figure 1, where the T511, T799 and T1279 configurations show a systematic overestimation ofblocking frequency over Eastern Canada (pointing to a westward displacement of cyclonic wave breaking).However, the internal variability (especially at T799) is very large and the limited number of ensemble mem-bers might be critical to assess this quantity. Finally, Figure 3d confirms that a nonnegligible improvementis seen over the North Pacific region, where a consistent reduction of the bias is observed up to resolutionT799.
3.2. Mean Model BiasGiven the important improvements observed by increasing the atmospheric horizontal resolution of EC-Earth, it is interesting to understand the mechanisms at work.
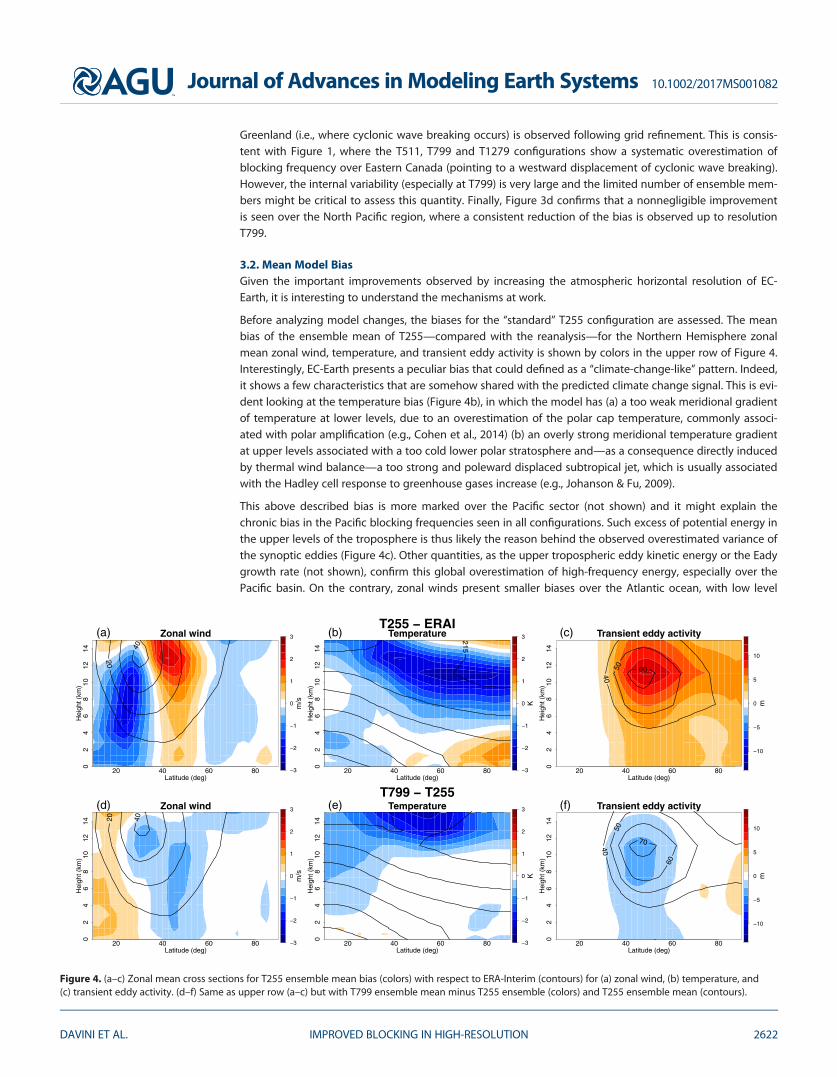
Before analyzing model changes, the biases for the ‘‘standard’’ T255 configuration are assessed. The meanbias of the ensemble mean of T255—compared with the reanalysis—for the Northern Hemisphere zonalmean zonal wind, temperature, and transient eddy activity is shown by colors in the upper row of Figure 4.Interestingly, EC-Earth presents a peculiar bias that could defined as a ‘‘climate-change-like’’ pattern. Indeed,it shows a few characteristics that are somehow shared with the predicted climate change signal. This is evi-dent looking at the temperature bias (Figure 4b), in which the model has (a) a too weak meridional gradientof temperature at lower levels, due to an overestimation of the polar cap temperature, commonly associ-ated with polar amplification (e.g., Cohen et al., 2014) (b) an overly strong meridional temperature gradientat upper levels associated with a too cold lower polar stratosphere and—as a consequence directly inducedby thermal wind balance—a too strong and poleward displaced subtropical jet, which is usually associatedwith the Hadley cell response to greenhouse gases increase (e.g., Johanson & Fu, 2009).
This above described bias is more marked over the Pacific sector (not shown) and it might explain thechronic bias in the Pacific blocking frequencies seen in all configurations. Such excess of potential energy inthe upper levels of the troposphere is thus likely the reason behind the observed overestimated variance ofthe synoptic eddies (Figure 4c). Other quantities, as the upper tropospheric eddy kinetic energy or the Eadygrowth rate (not shown), confirm this global overestimation of high-frequency energy, especially over thePacific basin. On the contrary, zonal winds present smaller biases over the Atlantic ocean, with low level
20 40 60 80
02
46
810
1214
Latitude (deg)
Hei
ght (
km)
20
40
(a)T255 − ERAI
Zonal wind
−3
−2
−1
0
1
2
3
m/s
20 40 60 80
02
46
810
1214
Latitude (deg)
Hei
ght (
km)
512
(b) Temperature
−3
−2
−1
0
1
2
3
K
20 40 60 80
02
46
810
1214
Latitude (deg)
Hei
ght (
km)
40
50
60
(c) Transient eddy activity
−10
−5
0
5
10
m
20 40 60 80
02
46
810
1214
Latitude (deg)
Hei
ght (
km)
20
40
(d)T799 − T255
Zonal wind
−3
−2
−1
0
1
2
3
m/s
20 40 60 80
02
46
810
1214
Latitude (deg)
Hei
ght (
km)
(e) Temperature
−3
−2
−1
0
1
2
3
K
20 40 60 80
02
46
810
1214
Latitude (deg)
Hei
ght (
km)
40
50
60
70
(f) Transient eddy activity
−10
−5
0
5
10
m
Figure 4. (a–c) Zonal mean cross sections for T255 ensemble mean bias (colors) with respect to ERA-Interim (contours) for (a) zonal wind, (b) temperature, and(c) transient eddy activity. (d–f) Same as upper row (a–c) but with T799 ensemble mean minus T255 ensemble (colors) and T255 ensemble mean (contours).
Journal of Advances in Modeling Earth Systems 10.1002/2017MS001082
DAVINI ET AL. IMPROVED BLOCKING IN HIGH-RESOLUTION 2622
transient meridional heat fluxes which are slightly too strong over the North American East coast and tooweak over the ocean (not shown).
3.3. Large-Scale Changes: An Upper Tropospheric WaveSince an extensive comparison of the resolution-dependent changes of all EC-Earth configurations wouldbe overly long to be included in the manuscript, the presentation is limited to the comparison of theensemble means of the T799 and of the T255 configurations. The former would then be a reference for the‘‘high-resolution’’—since it provides three ensemble members and has the best simulated blocking fre-quency—while the latter is the standard ‘‘low-resolution’’ tuned EC-Earth version. However, it is importantto stress out that our findings are similar when any permutation of a higher-resolution version (T799 andT511) versus a lower-resolution version (T255 and T159). The only exception is the T1279 simulation, that, asalready stated, behaves in a peculiar way.
The same comparison performed to identify the T255 bias against reanalysis (i.e., zonal mean vertical cross-sections) is plotted in the lower row of Figure 4, showing the differences between the T799 and the T255configurations (in colors). It is possible to see that at high resolution there is a weak but vertically extendeddecrease of the zonal wind (Figure 4d). Even if the zonal mean temperature is dominated by a furtherstratospheric cooling, the equatorial midtropospheric cooling observed in the T799 configuration has thenet effect of reducing the pole-to-equator gradient. This explains why the T799 shows an upper-tropospheric reduction of the zonal wind and of the eddy transient activity (Figure 4f). Although it is notstraightforward to investigate the origin of this change, this should be connected to the new radiative bal-ance that is set in the high-resolution version. However, this decrease is barotropic throughout the column,suggesting that something is occurring also at lower levels: this change cannot simply be explained by thethermal wind balance.
A more detailed look at the changes between the T799 and the T255 can be appreciated in Figure 5, wherethe differences between the two model configurations for several horizontal fields are shown. The most evi-dent element emerges when looking at the zonally asymmetric component of the upper troposphericstream function (Figure 5a). Here a wave train propagating in the upper troposphere can be clearly spotted,showing a wave 2 pattern, characterized by a strong ridge over the Rockies and weakening downstream.This is undoubtedly the most prominent feature of the resolution increase, and it is present also in the T511and T1279 configurations (not shown). Furthermore, the ridge over the Eastern North Atlantic suggests anincrease of the amplitude of the stationary wave over Northern Europe. Indeed, this in agreement with thestronger ridges over Europe and the Rocky Mountains already shown by Davini et al. (2017) and with theincrease of European blocking frequencies seen above.
The circulation anomaly associated with the abovementioned wave—stronger over North America—advects warm air poleward from lower latitudes, bringing an extensive warming (about a couple of degrees)over the western coast of North America, from California to Alaska (Figure 5b). Similarly, the stronger meridi-onal component of wind leads to a cooling downstream over Eastern Canada. Further East, a widespreadcooling is observed over Eastern Siberia.
As already highlighted by the zonal means in Figure 4, the T799 configuration has considerable weaker jetstreams. This weakening is especially evident in the exit region of the Atlantic eddy-driven jet (Figure 5d)where the reduction is found also at the upper levels (Figure 5c), but a weaker jet is observed also over thePacific basin (Figure 5c). Due to the reduced meridional temperature gradient (shown in Figure 4), transienteddies are appreciably weakened too (Figure 5f).
Finally, Figure 5e shows also that considerable changes of precipitation (on the order of several millimeter/day) are occurring in the equatorial region. This can have an important impact on the extratropical climateand it will be discussed in detail later.
3.4. North Atlantic Changes: A Weakened Storm TrackBefore investigating the origin of the upper tropospheric wave seen in Figure 5a, it is interesting to analyzethe dynamical connection between the stream function anomaly that peaks over the Rockies and theincreased blocking frequency over Europe. This can be better appreciated looking at the cross section ofzonal wind, temperature, and the Eady growth rate right upstream and downstream of the mountain range(Figure 6).
Journal of Advances in Modeling Earth Systems 10.1002/2017MS001082
DAVINI ET AL. IMPROVED BLOCKING IN HIGH-RESOLUTION 2623
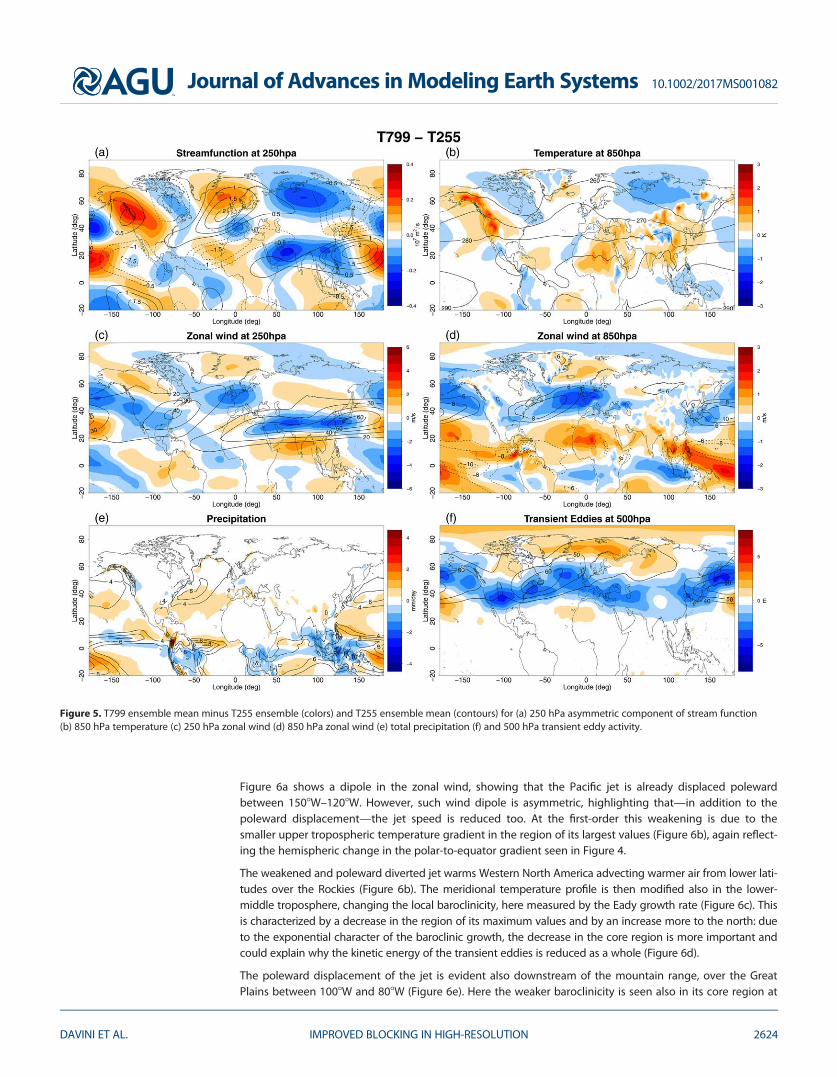
Figure 6a shows a dipole in the zonal wind, showing that the Pacific jet is already displaced polewardbetween 1508W–1208W. However, such wind dipole is asymmetric, highlighting that—in addition to thepoleward displacement—the jet speed is reduced too. At the first-order this weakening is due to thesmaller upper tropospheric temperature gradient in the region of its largest values (Figure 6b), again reflect-ing the hemispheric change in the polar-to-equator gradient seen in Figure 4.
The weakened and poleward diverted jet warms Western North America advecting warmer air from lower lati-tudes over the Rockies (Figure 6b). The meridional temperature profile is then modified also in the lower-middle troposphere, changing the local baroclinicity, here measured by the Eady growth rate (Figure 6c). Thisis characterized by a decrease in the region of its maximum values and by an increase more to the north: dueto the exponential character of the baroclinic growth, the decrease in the core region is more important andcould explain why the kinetic energy of the transient eddies is reduced as a whole (Figure 6d).
The poleward displacement of the jet is evident also downstream of the mountain range, over the GreatPlains between 1008W and 808W (Figure 6e). Here the weaker baroclinicity is seen also in its core region at
Figure 5. T799 ensemble mean minus T255 ensemble (colors) and T255 ensemble mean (contours) for (a) 250 hPa asymmetric component of stream function(b) 850 hPa temperature (c) 250 hPa zonal wind (d) 850 hPa zonal wind (e) total precipitation (f) and 500 hPa transient eddy activity.
Journal of Advances in Modeling Earth Systems 10.1002/2017MS001082
DAVINI ET AL. IMPROVED BLOCKING IN HIGH-RESOLUTION 2624
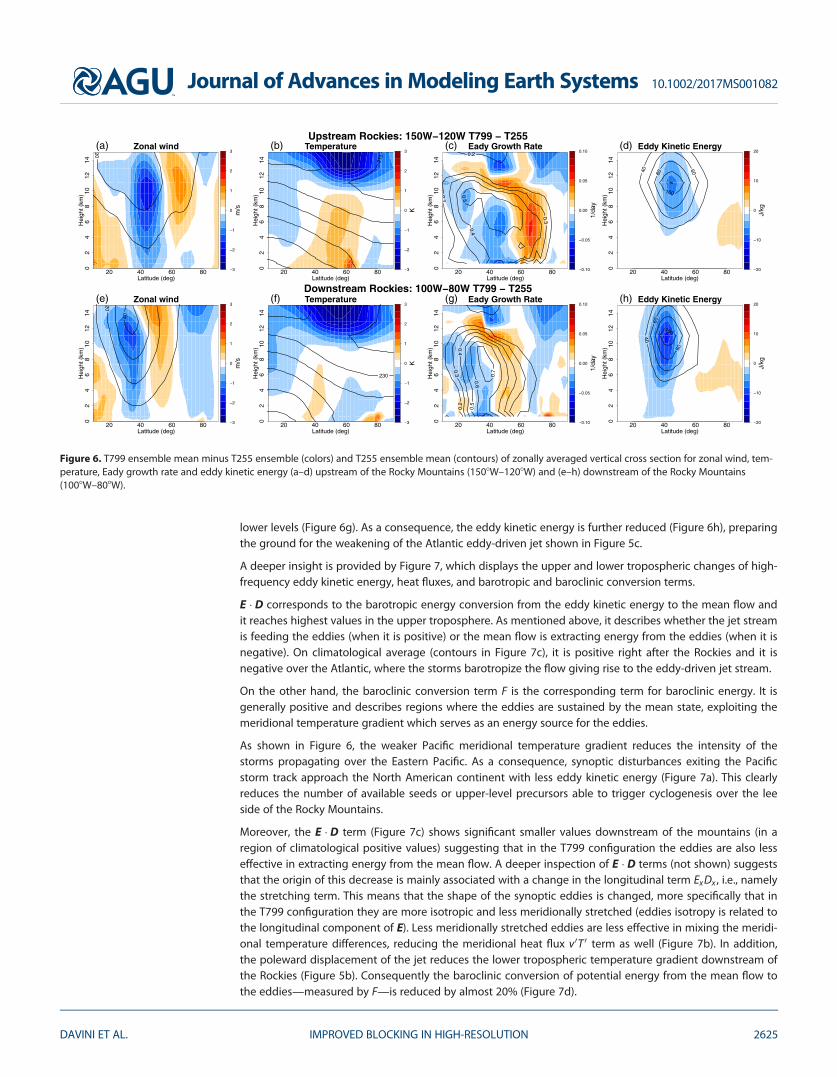
lower levels (Figure 6g). As a consequence, the eddy kinetic energy is further reduced (Figure 6h), preparingthe ground for the weakening of the Atlantic eddy-driven jet shown in Figure 5c.
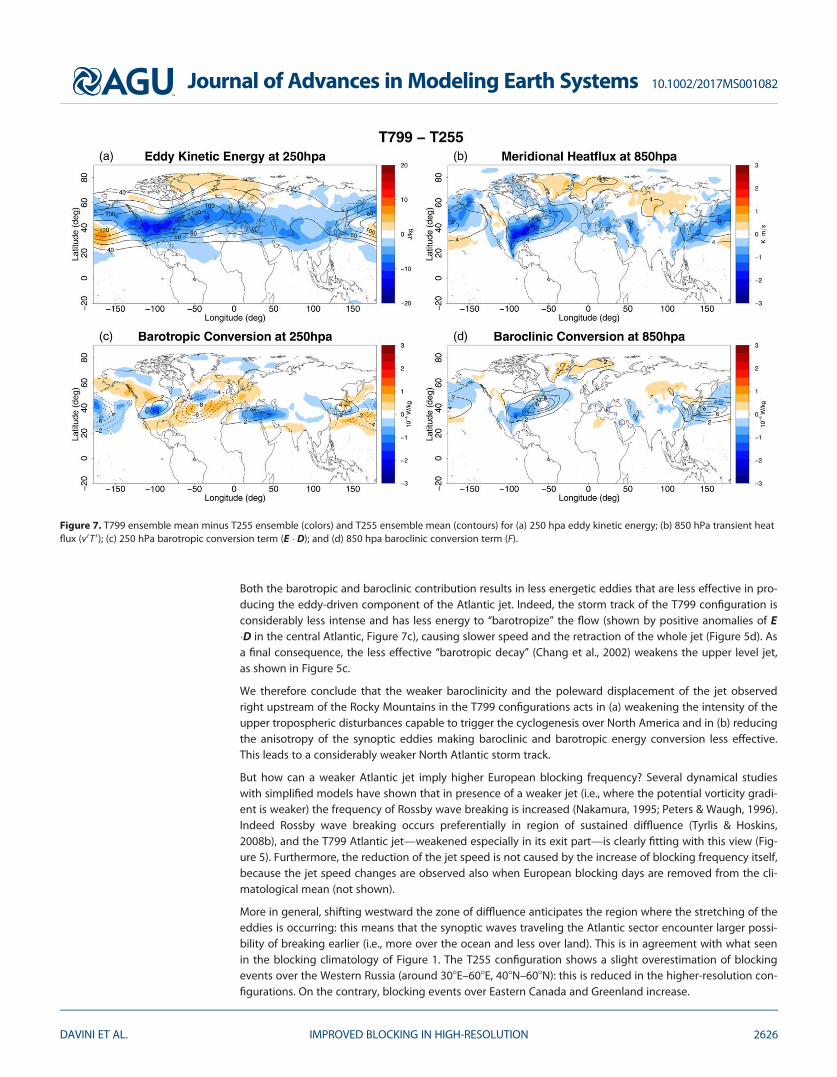
A deeper insight is provided by Figure 7, which displays the upper and lower tropospheric changes of high-frequency eddy kinetic energy, heat fluxes, and barotropic and baroclinic conversion terms.
E � D corresponds to the barotropic energy conversion from the eddy kinetic energy to the mean flow andit reaches highest values in the upper troposphere. As mentioned above, it describes whether the jet streamis feeding the eddies (when it is positive) or the mean flow is extracting energy from the eddies (when it isnegative). On climatological average (contours in Figure 7c), it is positive right after the Rockies and it isnegative over the Atlantic, where the storms barotropize the flow giving rise to the eddy-driven jet stream.
On the other hand, the baroclinic conversion term F is the corresponding term for baroclinic energy. It isgenerally positive and describes regions where the eddies are sustained by the mean state, exploiting themeridional temperature gradient which serves as an energy source for the eddies.
As shown in Figure 6, the weaker Pacific meridional temperature gradient reduces the intensity of thestorms propagating over the Eastern Pacific. As a consequence, synoptic disturbances exiting the Pacificstorm track approach the North American continent with less eddy kinetic energy (Figure 7a). This clearlyreduces the number of available seeds or upper-level precursors able to trigger cyclogenesis over the leeside of the Rocky Mountains.
Moreover, the E � D term (Figure 7c) shows significant smaller values downstream of the mountains (in aregion of climatological positive values) suggesting that in the T799 configuration the eddies are also lesseffective in extracting energy from the mean flow. A deeper inspection of E � D terms (not shown) suggeststhat the origin of this decrease is mainly associated with a change in the longitudinal term Ex Dx , i.e., namelythe stretching term. This means that the shape of the synoptic eddies is changed, more specifically that inthe T799 configuration they are more isotropic and less meridionally stretched (eddies isotropy is related tothe longitudinal component of E). Less meridionally stretched eddies are less effective in mixing the meridi-onal temperature differences, reducing the meridional heat flux v0T 0 term as well (Figure 7b). In addition,the poleward displacement of the jet reduces the lower tropospheric temperature gradient downstream ofthe Rockies (Figure 5b). Consequently the baroclinic conversion of potential energy from the mean flow tothe eddies—measured by F—is reduced by almost 20% (Figure 7d).
20 40 60 80
02
46
810
1214
Latitude (deg)
Hei
ght (
km)
20
(a)Upstream Rockies: 150W−120W T799 − T255
Zonal wind
−3
−2
−1
0
1
2
3
m/s
20 40 60 80
02
46
810
1214
Latitude (deg)
Hei
ght (
km)
215
(b) Temperature
−3
−2
−1
0
1
2
3
K
20 40 60 80
02
46
810
1214
Latitude (deg)
Hei
ght (
km) 0
2
0.2
0.3
0.4
0.5
(c) Eady Growth Rate
−0.10
−0.05
0.00
0.05
0.10
1/da
y
20 40 60 80
02
46
810
1214
Latitude (deg)
Hei
ght (
km)
40 60 8
0
100
(d) Eddy Kinetic Energy
−20
−10
0
10
20
J/kg
20 40 60 80
02
46
810
1214
Latitude (deg)
Hei
ght (
km)
20
40
(e)Downstream Rockies: 100W−80W T799 − T255
Zonal wind
−3
−2
−1
0
1
2
3
m/s
20 40 60 80
02
46
810
1214
Latitude (deg)
Hei
ght (
km)
230
(f) Temperature
−3
−2
−1
0
1
2
3
K
20 40 60 80
02
46
810
1214
Latitude (deg)H
eigh
t (km
)
0.2
0.3 4
.0
0.5
0.6
0.7
(g) Eady Growth Rate
−0.10
−0.05
0.00
0.05
0.10
1/da
y
20 40 60 80
02
46
810
1214
Latitude (deg)
Hei
ght (
km)
40
60
80
100
(h) Eddy Kinetic Energy
−20
−10
0
10
20
J/kg
Figure 6. T799 ensemble mean minus T255 ensemble (colors) and T255 ensemble mean (contours) of zonally averaged vertical cross section for zonal wind, tem-perature, Eady growth rate and eddy kinetic energy (a–d) upstream of the Rocky Mountains (1508W–1208W) and (e–h) downstream of the Rocky Mountains(1008W–808W).
Journal of Advances in Modeling Earth Systems 10.1002/2017MS001082
DAVINI ET AL. IMPROVED BLOCKING IN HIGH-RESOLUTION 2625
Both the barotropic and baroclinic contribution results in less energetic eddies that are less effective in pro-ducing the eddy-driven component of the Atlantic jet. Indeed, the storm track of the T799 configuration isconsiderably less intense and has less energy to ‘‘barotropize’’ the flow (shown by positive anomalies of E�D in the central Atlantic, Figure 7c), causing slower speed and the retraction of the whole jet (Figure 5d). Asa final consequence, the less effective ‘‘barotropic decay’’ (Chang et al., 2002) weakens the upper level jet,as shown in Figure 5c.
We therefore conclude that the weaker baroclinicity and the poleward displacement of the jet observedright upstream of the Rocky Mountains in the T799 configurations acts in (a) weakening the intensity of theupper tropospheric disturbances capable to trigger the cyclogenesis over North America and in (b) reducingthe anisotropy of the synoptic eddies making baroclinic and barotropic energy conversion less effective.This leads to a considerably weaker North Atlantic storm track.
But how can a weaker Atlantic jet imply higher European blocking frequency? Several dynamical studieswith simplified models have shown that in presence of a weaker jet (i.e., where the potential vorticity gradi-ent is weaker) the frequency of Rossby wave breaking is increased (Nakamura, 1995; Peters & Waugh, 1996).Indeed Rossby wave breaking occurs preferentially in region of sustained diffluence (Tyrlis & Hoskins,2008b), and the T799 Atlantic jet—weakened especially in its exit part—is clearly fitting with this view (Fig-ure 5). Furthermore, the reduction of the jet speed is not caused by the increase of blocking frequency itself,because the jet speed changes are observed also when European blocking days are removed from the cli-matological mean (not shown).
More in general, shifting westward the zone of diffluence anticipates the region where the stretching of theeddies is occurring: this means that the synoptic waves traveling the Atlantic sector encounter larger possi-bility of breaking earlier (i.e., more over the ocean and less over land). This is in agreement with what seenin the blocking climatology of Figure 1. The T255 configuration shows a slight overestimation of blockingevents over the Western Russia (around 308E–608E, 408N–608N): this is reduced in the higher-resolution con-figurations. On the contrary, blocking events over Eastern Canada and Greenland increase.
Figure 7. T799 ensemble mean minus T255 ensemble (colors) and T255 ensemble mean (contours) for (a) 250 hpa eddy kinetic energy; (b) 850 hPa transient heatflux (v0T 0); (c) 250 hPa barotropic conversion term (E � D); and (d) 850 hpa baroclinic conversion term (F).
Journal of Advances in Modeling Earth Systems 10.1002/2017MS001082
DAVINI ET AL. IMPROVED BLOCKING IN HIGH-RESOLUTION 2626
3.5. Causes of the Upper Level Wave: Mean Wind, Orography, and PrecipitationIt is now crucial to investigate the origin of the increased amplitude of the planetary waves observed in thehigh-resolution configurations.
Already presented in section 3.3, one of the most relevant differences between the high-resolution and thelow-resolution is the weaker upper level pole-to-equator temperature gradient. Figure 4 shows that theT799 is characterized by a globally weaker jet stream. This is confirmed locally by its eddy-driven and sub-tropical components, both weaker on the Atlantic and the Pacific basins (Figures 5c and 5d). Given theimportance of such a reduced meridional gradient for the baroclinicity and the cyclogenesis—discussed insection 3.4—this might be a primary element leading to the increase of blocking frequency at T799.
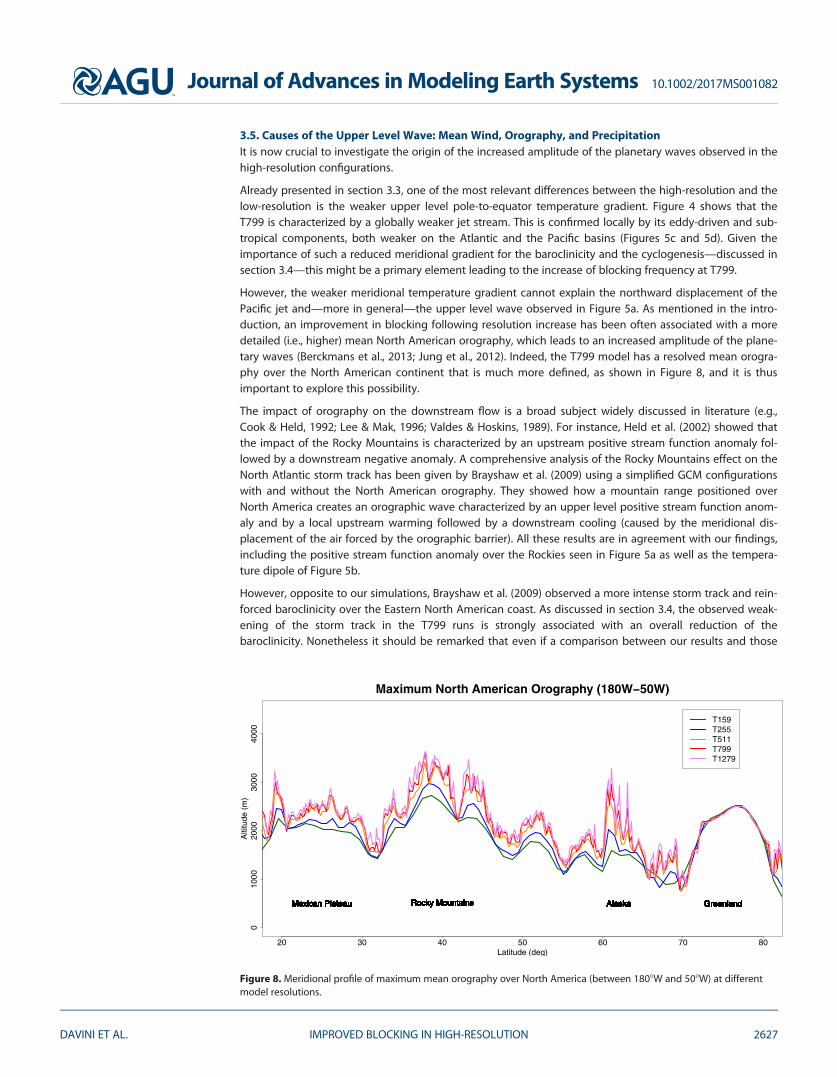
However, the weaker meridional temperature gradient cannot explain the northward displacement of thePacific jet and—more in general—the upper level wave observed in Figure 5a. As mentioned in the intro-duction, an improvement in blocking following resolution increase has been often associated with a moredetailed (i.e., higher) mean North American orography, which leads to an increased amplitude of the plane-tary waves (Berckmans et al., 2013; Jung et al., 2012). Indeed, the T799 model has a resolved mean orogra-phy over the North American continent that is much more defined, as shown in Figure 8, and it is thusimportant to explore this possibility.
The impact of orography on the downstream flow is a broad subject widely discussed in literature (e.g.,Cook & Held, 1992; Lee & Mak, 1996; Valdes & Hoskins, 1989). For instance, Held et al. (2002) showed thatthe impact of the Rocky Mountains is characterized by an upstream positive stream function anomaly fol-lowed by a downstream negative anomaly. A comprehensive analysis of the Rocky Mountains effect on theNorth Atlantic storm track has been given by Brayshaw et al. (2009) using a simplified GCM configurationswith and without the North American orography. They showed how a mountain range positioned overNorth America creates an orographic wave characterized by an upper level positive stream function anom-aly and by a local upstream warming followed by a downstream cooling (caused by the meridional dis-placement of the air forced by the orographic barrier). All these results are in agreement with our findings,including the positive stream function anomaly over the Rockies seen in Figure 5a as well as the tempera-ture dipole of Figure 5b.
However, opposite to our simulations, Brayshaw et al. (2009) observed a more intense storm track and rein-forced baroclinicity over the Eastern North American coast. As discussed in section 3.4, the observed weak-ening of the storm track in the T799 runs is strongly associated with an overall reduction of thebaroclinicity. Nonetheless it should be remarked that even if a comparison between our results and those
20 30 40 50 60 70 80
010
0020
0030
0040
00
Maximum North American Orography (180W−50W)
Latitude (deg)
Alti
tude
(m
)
Mexican Plateau Rocky Mountains Alaska GreenlandMexican Plateau Rocky Mountains Alaska GreenlandMexican Plateau Rocky Mountains Alaska GreenlandMexican Plateau Rocky Mountains Alaska GreenlandMexican Plateau Rocky Mountains Alaska GreenlandMexican Plateau Rocky Mountains Alaska GreenlandMexican Plateau Rocky Mountains Alaska GreenlandMexican Plateau Rocky Mountains Alaska GreenlandMexican Plateau Rocky Mountains AlaskaMexican Plateau Rocky Mountains Alaska GreenlandMexican Plateau Rocky Mountains Alaska GreenlandMexican Plateau Rocky Mountains Alaska GreenlandMexican Plateau Rocky Mountains Alaska GreenlandMexican Plateau Rocky Mountains Alaska GreenlandMexican Plateau Rocky Mountains Alaska GreenlandMexican Plateau Rocky Mountains Alaska GreenlandMexican Plateau Rocky Mountains Alaska GreenlandMexican Plateau Rocky Mountains AlaskaMexican Plateau Rocky Mountains Alaska GreenlandMexican Plateau Rocky Mountains Alaska GreenlandMexican Plateau Rocky Mountains Alaska GreenlandMexican Plateau Rocky Mountains Alaska GreenlandMexican Plateau Rocky Mountains Alaska GreenlandMexican Plateau Rocky Mountains Alaska GreenlandMexican Plateau Rocky Mountains Alaska GreenlandMexican Plateau Rocky Mountains Alaska GreenlandMexican Plateau Rocky Mountains AlaskaMexican Plateau Rocky Mountains Alaska GreenlandMexican Plateau Rocky Mountains Alaska GreenlandMexican Plateau Rocky Mountains Alaska GreenlandMexican Plateau Rocky Mountains Alaska GreenlandMexican Plateau Rocky Mountains Alaska GreenlandMexican Plateau Rocky Mountains Alaska GreenlandMexican Plateau Rocky Mountains Alaska GreenlandMexican Plateau Rocky Mountains Alaska GreenlandMexican Plateau Rocky Mountains AlaskaMexican Plateau Rocky Mountains Alaska GreenlandMexican Plateau Rocky Mountains Alaska GreenlandMexican Plateau Rocky Mountains Alaska GreenlandMexican Plateau Rocky Mountains Alaska GreenlandMexican Plateau Rocky Mountains Alaska GreenlandMexican Plateau Rocky Mountains Alaska GreenlandMexican Plateau Rocky Mountains Alaska GreenlandMexican Plateau Rocky Mountains Alaska GreenlandMexican Plateau Rocky Mountains Alaska
T159T255T511T799T1279
Figure 8. Meridional profile of maximum mean orography over North America (between 1808W and 508W) at differentmodel resolutions.
Journal of Advances in Modeling Earth Systems 10.1002/2017MS001082
DAVINI ET AL. IMPROVED BLOCKING IN HIGH-RESOLUTION 2627
previous works (e.g., Brayshaw et al., 2009; Held et al., 2002; Valdes & Hoskins, 1989) is undoubtedly fruitful,our simulations are inherently different. First, we use a full GCMs including thus a higher degree of complex-ity. Second, they performed sensitivity ideal experiments removing the entire Rocky Mountains, while in ourcase the difference (between T255 and T799) is limited to a moderate increase of the mean orography.
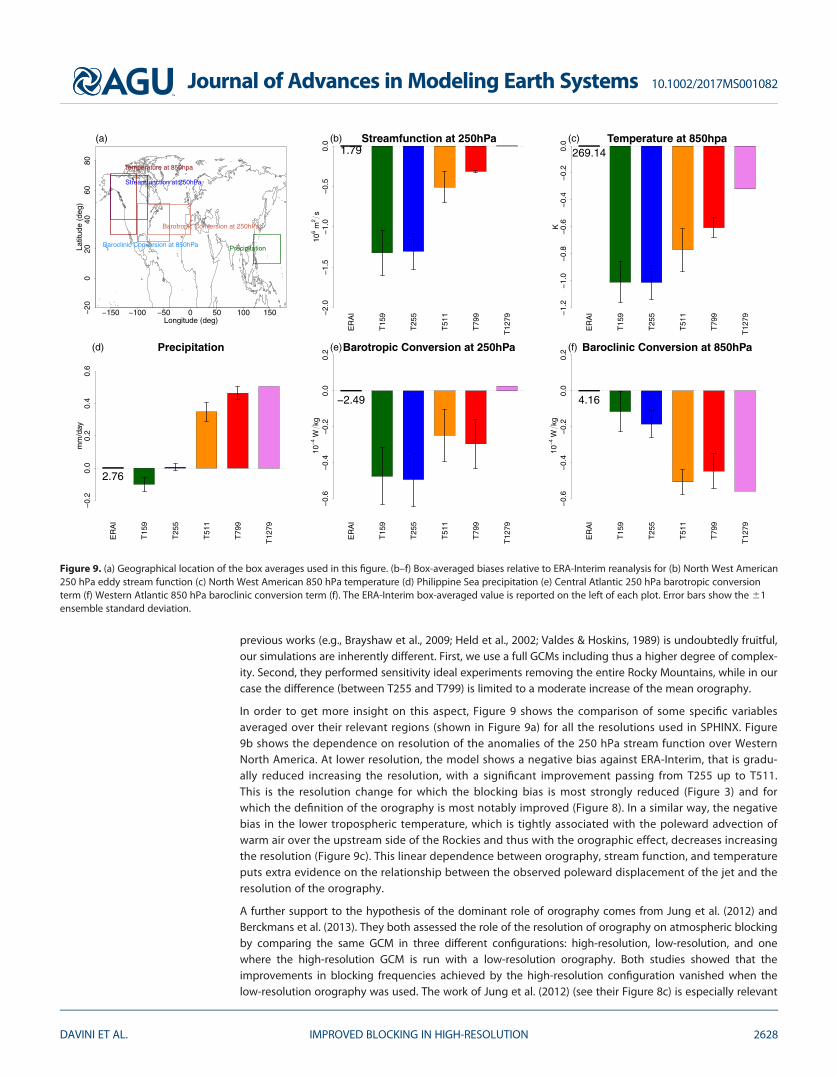
In order to get more insight on this aspect, Figure 9 shows the comparison of some specific variablesaveraged over their relevant regions (shown in Figure 9a) for all the resolutions used in SPHINX. Figure9b shows the dependence on resolution of the anomalies of the 250 hPa stream function over WesternNorth America. At lower resolution, the model shows a negative bias against ERA-Interim, that is gradu-ally reduced increasing the resolution, with a significant improvement passing from T255 up to T511.This is the resolution change for which the blocking bias is most strongly reduced (Figure 3) and forwhich the definition of the orography is most notably improved (Figure 8). In a similar way, the negativebias in the lower tropospheric temperature, which is tightly associated with the poleward advection ofwarm air over the upstream side of the Rockies and thus with the orographic effect, decreases increasingthe resolution (Figure 9c). This linear dependence between orography, stream function, and temperatureputs extra evidence on the relationship between the observed poleward displacement of the jet and theresolution of the orography.
A further support to the hypothesis of the dominant role of orography comes from Jung et al. (2012) andBerckmans et al. (2013). They both assessed the role of the resolution of orography on atmospheric blockingby comparing the same GCM in three different configurations: high-resolution, low-resolution, and onewhere the high-resolution GCM is run with a low-resolution orography. Both studies showed that theimprovements in blocking frequencies achieved by the high-resolution configuration vanished when thelow-resolution orography was used. The work of Jung et al. (2012) (see their Figure 8c) is especially relevant
−150 −100 −50 0 50 100 150−20
020
4060
80
Longitude (deg)
Latit
ude
(deg
)
(a)
Streamfunction at 250hPa
Temperature at 850hpa
Precipitation
Barotropic Conversion at 250hPa
Baroclinic Conversion at 850hPa
ER
AI
T15
9
T25
5
T51
1
T79
9
T12
79
Streamfunction at 250hPa
106
m2
s−
2.0
−1.
5−
1.0
−0.
50.
0
1.79(b)
ER
AI
T15
9
T25
5
T51
1
T79
9
T12
79
Temperature at 850hpa
K−
1.2
−1.
0−
0.8
−0.
6−
0.4
−0.
20.
0
269.14(c)
ER
AI
T15
9
T25
5
T51
1
T79
9
T12
79
Precipitation
mm
/day
−0.
20.
00.
20.
40.
6
2.76
(d)E
RA
I
T15
9
T25
5
T51
1
T79
9
T12
79
Barotropic Conversion at 250hPa
10−4
Wk g
−0.
6−
0.4
−0.
20.
00.
2
−2.49
(e)
ER
AI
T15
9
T25
5
T51
1
T79
9
T12
79
Baroclinic Conversion at 850hPa
10− 4
Wkg
−0.
6−
0.4
−0.
20.
00.
2
4.16
(f)
Figure 9. (a) Geographical location of the box averages used in this figure. (b–f) Box-averaged biases relative to ERA-Interim reanalysis for (b) North West American250 hPa eddy stream function (c) North West American 850 hPa temperature (d) Philippine Sea precipitation (e) Central Atlantic 250 hPa barotropic conversionterm (f) Western Atlantic 850 hPa baroclinic conversion term (f). The ERA-Interim box-averaged value is reported on the left of each plot. Error bars show the 61ensemble standard deviation.
Journal of Advances in Modeling Earth Systems 10.1002/2017MS001082
DAVINI ET AL. IMPROVED BLOCKING IN HIGH-RESOLUTION 2628
for the present study because they used an older version the ECMWF model, that shares large portions ofthe code with the EC-Earth version used for Climate SPHINX.
Tropical diabatic heating deserves a final comment: an intense change in precipitation, as the one observedbetween the T799 and T255 configurations in the Western Pacific (Figure 5e), is known for being able totrigger Rossby wave trains that propagate poleward up to the extratropics (Hoskins & Karoly, 1981). This hasproven to be able to influence European climate and potentially blocking frequencies (Cassou, 2008; Hen-derson et al., 2016). As shown by Figure 9d, also the increase of precipitation over tropical Western Pacific isproportional to resolution.
Nonetheless there are a couple of reasons why this should be considered as unlikely: even if wave trainsgenerated by change in deep convection depends strongly on the mean flow (a) these waves do not usu-ally have the capacity to circumnavigate the whole globe (Jin & Hoskins, 1995) (b) they have usually ahigher wavenumber, on the order of k 5 5–6 versus k 5 2 in EC-Earth simulations (Ambrizzi & Hoskins, 1997;Hoskins & Ambrizzi, 1993).
However, considering the fact that the ECMWF model is known to have a pronounced sensitivity to tropicalforcing (e.g., Jung et al., 2010b) precipitation might represent an additional mechanism that—interactingnon-linearly with the increase of mean orography—may be able to weaken and shift poleward the Pacificjet generating thus the observed upper level stream function anomaly.
3.6. Correct Blocking Frequencies for the Wrong ReasonsLooking back at Figure 4b, it is possible to see that from an energetic point of view EC-Earth is characterizedby an overestimation of the potential energy available in the upper tropospheric levels—due to the overlystrong meridional temperature gradient. This is in turn followed by too strong upper level transient eddies(Figure 4c). Even if this potential energy available is reduced at T799, there is still an evident overestimationof both variables (Figures 4e and 4f).
Conversely, the lower level baroclinicity is reasonably well represented at T255 and it becomes too weak atT511, T799, and T1279. This can be appreciated looking at the baroclinic conversion term over WesternNorth Atlantic (i.e., where baroclinicity is stronger) in Figure 9f, that is showing a decrease of 10–15% in thehigher-resolution configurations. The contribution from the barotropic term over Central North Atlantic,shown in Figure 9e, is also less important, with its magnitude reduced by more than 25%, suggesting thateddies are no longer able to sustain the Atlantic jet stream. It is important to point out that even if the biasof the barotropic conversion term against ERA-Interim reanalysis is now smaller, the high-resolution config-urations show an overall reduction in the amplitude of both baroclinic and barotropic energy conversion.At high resolution, the Atlantic eddies are thus weaker than at low resolution, and consequently the Atlanticjet stream, that shows a small bias at T255, is characterized by a larger negative bias at higher resolution(T511, T799, and T1279).
Therefore, even though the T511 and T799 configurations show a representation of blocking events fre-quencies over Europe with negligible biases, they present a too weak Atlantic storm track and eddy-drivenjet. This is somewhat counterintuitive: in general one may think that a higher-resolution simulation shouldbe characterized by stronger and/or more frequent transient eddies (e.g., Guemas & Codron, 2011). The lackof such findings forces us to conclude that the correct blocking frequency simulated by the T799 configura-tion is due to wrong reasons, likely following bias compensation.
Figure 10 shows that the T511 and T799 resolution configurations (characterized by a correct blocking fre-quency) underestimate the blocking duration in favor of an overestimation of the number of blockingevents. Indeed, even the best simulation run at T799 (red dots) is unable to level out the blocking durationobserved in ERA-Interim Reanalysis (black dot) or in NCEP/NCAR Reanalysis (black triangle). Conversely thereare four simulations that clearly overestimate the number of blocking events. This peculiar EC-Earth bias iswell represented by the linear regression between the ensemble mean duration and the ensemble meannumber of events, showed by the dotted line in Figure 10.
The onset of a blocking event is usually associated with Rossby wave breaking: this occurs more easily inzone of diffluence, i.e., where the jet is weaker (Peters & Waugh, 1996). Conversely, blocking maintenancemechanisms are likely associated with the presence of transient eddies (e.g., Shutts, 1983). The results fromFigure 10 fit well with this interpretation. Over the North Atlantic, the T799 underestimates the magnitude
Journal of Advances in Modeling Earth Systems 10.1002/2017MS001082
DAVINI ET AL. IMPROVED BLOCKING IN HIGH-RESOLUTION 2629
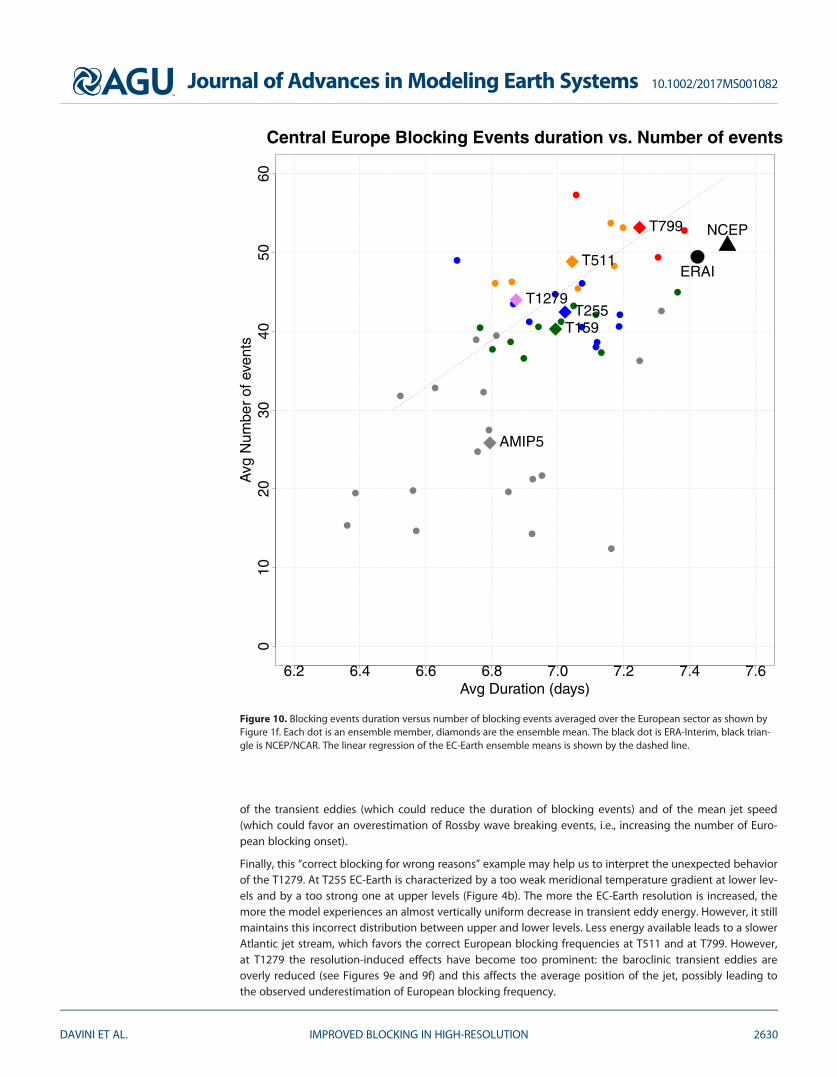
of the transient eddies (which could reduce the duration of blocking events) and of the mean jet speed(which could favor an overestimation of Rossby wave breaking events, i.e., increasing the number of Euro-pean blocking onset).
Finally, this ‘‘correct blocking for wrong reasons’’ example may help us to interpret the unexpected behaviorof the T1279. At T255 EC-Earth is characterized by a too weak meridional temperature gradient at lower lev-els and by a too strong one at upper levels (Figure 4b). The more the EC-Earth resolution is increased, themore the model experiences an almost vertically uniform decrease in transient eddy energy. However, it stillmaintains this incorrect distribution between upper and lower levels. Less energy available leads to a slowerAtlantic jet stream, which favors the correct European blocking frequencies at T511 and at T799. However,at T1279 the resolution-induced effects have become too prominent: the baroclinic transient eddies areoverly reduced (see Figures 9e and 9f) and this affects the average position of the jet, possibly leading tothe observed underestimation of European blocking frequency.
Figure 10. Blocking events duration versus number of blocking events averaged over the European sector as shown byFigure 1f. Each dot is an ensemble member, diamonds are the ensemble mean. The black dot is ERA-Interim, black trian-gle is NCEP/NCAR. The linear regression of the EC-Earth ensemble means is shown by the dashed line.
Journal of Advances in Modeling Earth Systems 10.1002/2017MS001082
DAVINI ET AL. IMPROVED BLOCKING IN HIGH-RESOLUTION 2630
4. Discussions and Conclusions
A large set of atmospheric-only climate simulations at five different horizontal resolutions with the EC-EarthEarth System Model has been analyzed to evaluate the impact of increased resolution in simulating theatmospheric blocking. Results show that at lower resolutions (T159–T255, i.e., 125–80 km) EC-Earth underes-timates blocking frequencies over both Europe and North Pacific (Figures 1f and 1g). The negative bias overEurope is however less pronounced than in the majority of AMIP5 models (Figure 3a).
When the EC-Earth horizontal resolution is increased to 40 km (T511) and 25 km (T799), the Pacific bias isalmost halved (if compared to T159 and T255). Most importantly, the European blocking frequency bias isreduced to the point that it can be confidently considered as negligible—especially at T799.
Such a dramatic improvement in the frequencies of blocking events seems to be mainly caused by two con-curring factors. (a) Following the grid refinement, a different radiative balance is set causing a reduction ofthe upper tropospheric pole-to-equator gradient, more prominent over the Pacific and the Atlantic sector.This leads to a reduction of the upper level baroclinicity, which weakens the jet streams and reduces theeddy kinetic energy. (b) The higher resolution implies a more refined—and thus higher—mean orographywhich (possibly in association with a change in tropical precipitation), forces a stationary planetary wave,which deflects northward the jet stream over the Rocky Mountains. This in turn changes the meridionaltemperature gradient over North America, further affecting the position and the speed of the Atlantic jetstream.
These two factors lead to a decrease of both barotropic and baroclinic energy conversion and to a reductionof the eddy efficiency in extracting energy (due to the less meridionally stretched eddies in the high-resolution configurations). The Atlantic storm track and the Atlantic jet stream are consequently weakened,especially in their exit region. This results in a less sharp potential vorticity gradient over North Atlanticwhich favors the occurrence of Rossby wave breaking in the diffluence region of the jet—which is now dis-placed westward—increasing the number of onsets of blocking there. Indeed, EC-Earth high-resolution con-figurations show not only an increase in European blocking frequencies but also a slight overestimation ofblocking events over Western Greenland and Eastern Canada, pointing to a basin-wide westward displace-ment of wave breaking activity.
However, this is only one side of the coin: if compared to reanalyses, the T511 and T799 resolution configu-rations show that correct blocking frequencies are achieved with an overestimation of blocking onsets thatcompensates an underestimation of the blocking duration. This behavior can be explained looking at theT511 and T799 biases over the North Atlantic: they are both characterized by a jet stream that is too weak(which, reducing the potential vorticity gradient, should favor an overestimation of the number of blockingonsets) and by too weak transient eddies (which should favor the underestimation of the blockingduration).
Ultimately, it appears clear that correct blocking frequencies are achieved through bias compensationbetween the eddies found at upper levels (too strong) and at lower levels (too weak). This interpretationmay provide an explanation of why the highest resolution (T1279) shows worse results than T799 and T511.The overly strong upper level eddy activity (seen in all the EC-Earth configurations) may be compensated,up to a certain amount (i.e., in the T511 and T799), by a weak low level baroclinicity, decreasing the Atlanticjet speed and increasing the blocking frequencies. However, if the eddies are too weak (as in the T1279)blocking is no longer sustained. This can be thought as an analogy to what occurs in summer, where the jetstream is weaker (and displaced poleward) and blocking frequencies are considerably lower.
The observed winter blocking frequencies appears to be a specific solution of the ‘‘climate model phase-space’’: on the one side, when the Atlantic jet is too strong, no wave breaking occurs as in many CMIP5models (Anstey et al., 2013). On the other side, if the jet is too weak then wave breaking is misplaced in theEuro Atlantic basin, leading to a strong bias in blocking events frequencies (see MIROC5 GCM in Ansteyet al., 2013). More in general, these findings suggest three main considerations:
1. The ‘‘correct blocking frequency’’ is not necessarily the result of a more realistic simulation of the atmo-spheric dynamics: a numerical model can achieve several error compensations in its internal dynamics ofthe jet stream, which may lead to a perfect blocking frequency even if other elements of the large-scaledynamics present substantial biases.
Journal of Advances in Modeling Earth Systems 10.1002/2017MS001082
DAVINI ET AL. IMPROVED BLOCKING IN HIGH-RESOLUTION 2631
2. Horizontal resolution may not be the unique remedy to obtain an unbiased blocking frequency. Even ifthe better representation of orography associated with the increase in resolution represents of course acrucial component, the good results of the EC-Earth T799 configuration are to a large extent associatedwith the weakening of the Atlantic storm track. This is clearly not due to some specific feature of highhorizontal resolution. Indeed, this weakening could be potentially simulated with improved subgridorography-related parameterizations (Pithan et al., 2016; Sandu et al., 2016), or perhaps with a more pre-cise simulation of the meridional temperature gradient.
3. It has been long claimed that transient eddies can be obtained only with high resolution and that theyare fundamental for blocking simulations (e.g., Berckmans et al., 2013; Shutts, 1983). In the EC-Earth simu-lations transient eddies are still underestimated even at 16 km resolution, suggesting that they are notnecessarily better represented at higher resolution. However, the observed underestimation of durationputs a further element in favor of the relevance of transient eddies in the blocking maintenancemechanisms.
To conclude, this analysis shows that huge improvements can be achieved in simulating atmospheric block-ing with the help of high resolution, but many further issues should be addressed in order to disentanglethe different mechanisms and unveil the driving dynamics of blocking onset/maintenance.
To this end, more targeted sensitivity experiments should be carried out to estimate the respective role oforography, subgrid-scale parameterization and climate model tuning in order to highlight what are the keyphysical processes whose correct simulation is relevant (if not essential) for a correct (i.e., physically sound)simulation of atmospheric blocking. More in general, this analysis suggests that there is still the need todesign and setup idealized experiments, possibly with simplified GCMs, to test the blocking sensitivity tocertain parameters (such as orography, SST front strength, lower and upper meridional temperature gra-dients, precipitation changes in specific regions).
ReferencesAmbrizzi, T., & Hoskins, B. J. (1997). Stationary Rossby-wave propagation in a baroclinic atmosphere. Quarterly Journal of the Royal Meteoro-
logical Society, 123(540), 919–928.Anstey, J. A., Davini, P., Gray, L. J., Woollings, T. J., Butchart, N., Cagnazzo, C., . . . Yang, S. (2013). Multi-model analysis of northern hemi-
sphere winter blocking: Model biases and the role of resolution. Journal of Geophysical Research: Atmospheres, 118, 3956–3971. https://doi.org/10.1002/jgrd.50231
Austin, J. (1980). The blocking of middle latitude westerly winds by planetary waves. Quarterly Journal of the Royal Meteorological Society,106(448), 327–350.
Balsamo, G., Viterbo, P., Beljaars, A., van den Hurk, B., Hirschi, M., Betts, A. K., & Scipal, K. (2009). A revised hydrology for the ECMWFmodel: Verification from field site to terrestrial water storage and impact in the Integrated Forecast System. Journal of Hydrometeorol-ogy, 10(3), 623–643.
Barnes, E. A., Dunn-Sigouin, E., Masato, G., & Woollings, T. (2014). Exploring recent trends in northern hemisphere blocking. GeophysicalResearch Letters, 41, 638–644. https://doi.org/10.1002/2013GL058745
Barriopedro, D., Garcia-Herrera, R., Lupo, A., & Hernandez, E. (2006). A climatology of Northern hemisphere blocking. Journal of Climate, 19,1042–1063.
Barriopedro, D., Garcia-Herrera, R., & Trigo, R. (2010). Application of blocking diagnosis methods to General Circulation Models. Part I: Anovel detection scheme. Climate Dynamics, 35(7–8), 1373–1391.
Berckmans, J., Woollings, T., Demory, M.-E., Vidale, P.-L., & Roberts, M. (2013). Atmospheric blocking in a high resolution climate model:Influences of mean state, orography and eddy forcing. Atmospheric Science Letters, 14(1), 34–40.
Berggren, R., Bolin, B., & Rossby, C. (1949). An aerological study of zonal motion, its perturbations and break-down. Tellus, 1(2), 14–37.Black, R. X., & Dole, R. M. (2000). Storm tracks and barotropic deformation in climate models. Journal of Climate, 13(15), 2712–2728.Brayshaw, D., Hoskins, B., & Blackburn, M. (2009). The basic ingredients of the North Atlantic storm track. Part I: Land-sea contrast and orog-
raphy. Journal of the Atmospheric Science, 66, 2539–2558.Cai, M., & Mak, M. (1990). Symbiotic relation between planetary and synoptic-scale waves. Journal of the Atmospheric Sciences, 47(24),
2953–2968.Cassou, C. (2008). Intraseasonal interaction between the Madden–Julian oscillation and the north Atlantic oscillation. Nature, 455(7212),
523–527.Chang, E. K., Lee, S., & Swanson, K. L. (2002). Storm track dynamics. Journal of Climate, 15(16), 2163–2183.Charney, J., & DeVore, J. (1979). Multiple flow equilibria in the atmosphere and blocking. Journal of the Atmospheric Sciences, 36(7), 1205–
1216.Cohen, J., J. A., Screen, J. C., Furtado, M., Barlow, D., Whittleston, D., Coumou, J., . . . Jones, J. (2014). Recent Arctic amplification and extreme
mid-latitude weather. Nature Geoscience, 7(9), 627–637.Cook, K. H., & Held, I. M. (1992). The stationary response to large-scale orography in a general circulation model and a linear model. Journal
of the Atmospheric Sciences, 49(6), 525–539.Davini, P., Cagnazzo, C., Gualdi, S., & Navarra, A. (2012). Bidimensional diagnostics, variability and trends of Northern hemisphere blocking.
Journal of Climate, 25(19), 6996–6509.Davini, P., & D’andrea, F. (2016). Northern hemisphere atmospheric blocking representation in global climate models: Twenty years of
improvements? Journal of Climate, 29(24), 8823–8840.
AcknowledgmentsFree data accessibility to the climateuser community is granted through adedicated THREDDS Web Serverhosted by CINECA (https://sphinx.hpc.cineca.it/thredds/sphinx.html), whereit is possible to browse and directlydownload any of the Climate SPHINXdata used in the present work. Furtherdetails on the data accessibility and onthe Climate SPHINX project itself areavailable on the official website of theproject (http://www.to.isac.cnr.it/sphinx/). The authors acknowledgecomputing resources provided byCINECA and LRZ in the framework ofClimate SPHINX PRACE project. PaoloDavini and Fabio D’Andrea gratefullyacknowledge the funding from theEuropean Union’s Horizon 2020research and innovation programCOGNAC under the European UnionMarie Skłodowska-Curie grantagreement 654942. Jost vonHardenberg acknowledges supportfrom the European Union’s Horizon2020 research and innovationprogramme under grant agreement641816 (CRESCENDO). Susanna Cortiacknowledges support by thePRIMAVERA project, funded by theEuropean Commission under grantagreement 641727 of the Horizon2020 research programme. Weacknowledge the contribution of theC3S 34a Lot 2 Copernicus ClimateChange Service project, funded by theEuropean Union, to the developmentof software tools used in this work.
Journal of Advances in Modeling Earth Systems 10.1002/2017MS001082
DAVINI ET AL. IMPROVED BLOCKING IN HIGH-RESOLUTION 2632

Davini, P., Hardenberg, J. V., Corti, S., Christensen, H. M., Juricke, S., Subramanian, A., . . . Palmer, T. N. (2017). Climate SPHINX: Evaluating theimpact of resolution and stochastic physics parameterisations in the EC-Earth Global Climate Model. Geoscientific Model Development,10(3), 1383–1402.
Dee, D., S., Uppala, A., Simmons, P., Berrisford, P., Poli, S., Kobayashi, U., . . .Vitart, F. (2011). The ERA-Interim reanalysis: Configuration andperformance of the data assimilation system. Quarterly Journal of the Royal Meteorological Society, 137(656), 553–597.
Dunn-Sigouin, E., & Son, S.-W. (2013). Northern Hemisphere blocking frequency and duration in the CMIP5 models. Journal of GeophysicalResearch: Atmospheres, 118, 1179–1188. https://doi.org/10.1002/jgrd.50143
ECWMF (2010). IFS cycle36r1 (technical report). Shinfield Park, Reading, UK: European Center for Medium Range Forecast. Retrieved fromhttps://www.ecmwf.int/sites/default/files/elibrary/2010/9233-part-iv-physical-processes.pdf
Green, J. (1977). The weather during July 1976: Some dynamical considerations of the drought. Weather, 32(4), 120–126.Guemas, V., & Codron, F. (2011). Differing impacts of resolution changes in latitude and longitude on the midlatitudes in the LMDZ atmo-
spheric GCM. Journal of Climate, 24(22), 5831–5849.Hazeleger, W., C., Severijns, T., Semmler, S., Stef�anescu, S., Yang, X., Wang, K., . . . Will�en, U. (2010). Ec-earth: A seamless earth-system predic-
tion approach in action. Bulletin of the American Meteorological Society, 91(10), 1357–1363.Hazeleger, W., X., Wang, C., Severijns, S., Stef�anescu, R., Bintanja, A., Sterl, K., . . . van der Wiel, K. et al. (2012). EC-Earth V2.2: Description and
validation of a new seamless Earth system prediction model. Climate Dynamics, 39(11), 2611–2629.Held, I. M., Ting, M., & Wang, H. (2002). Northern winter stationary waves: Theory and modeling. Journal of Climate, 15(16), 2125–2144.Henderson, S. A., Maloney, E. D., & Barnes, E. A. (2016). The influence of the Madden–Julian oscillation on Northern Hemisphere winter
blocking. Journal of Climate, 29(12), 4597–4616.Hoskins, B. J., & Ambrizzi, T. (1993). Rossby wave propagation on a realistic longitudinally varying flow. Journal of the Atmospheric Sciences,
50(12), 1661–1671.Hoskins, B. J., James, I. N., & White, G. H. (1983). The shape, propagation and mean-flow interaction of large-scale weather systems. Journal
of the Atmospheric Sciences, 40(7), 1595–1612.Hoskins, B. J., & Karoly, D. J. (1981). The steady linear response of a spherical atmosphere to thermal and orographic forcing. Journal of the
Atmospheric Sciences, 38(6), 1179–1196.Jin, F., & Hoskins, B. J. (1995). The direct response to tropical heating in a baroclinic atmosphere. Journal of the Atmospheric Sciences, 52(3),
307–319.Johanson, C. M., & Fu, Q. (2009). Hadley cell widening: Model simulations versus observations. Journal of Climate, 22(10), 2713–2725.Jung, T., Balsamo, G., Bechtold, P., Beljaars, A., K€ohler, M., Miller, M., . . . Tompkins, A. (2010a). The ECMWF model climate: Recent progress
through improved physical parametrizations. Quarterly Journal of the Royal Meteorological Society, 136(650), 1145–1160.Jung, T., Miller, M. J., & Palmer, T. N. (2010b). Diagnosing the origin of extended-range forecast errors. Monthly Weather Review, 138(6),
2434–2446. http://doi.org/10.1175/2010MWR3255.1Jung, T., Miller, T., Palmer, P., Towers, N., Wedi, D., Achuthavarier, J., . . . Hodges, K. I. (2012). High-resolution global climate simulations with
the ECMWF model in project Athena: Experimental design, model climate, and seasonal forecast skill. Journal of Climate, 25(9), 3155–3172.Kalnay, E., Kanamitsu, M., Kistler, R., Collins, W., Deaven, D., Gandin, L., . . . Joseph, D. (1996). The NCEP/NCAR 40-year reanalysis project.
Bulletin of the American Meteorological Society, 77, 437–471.Lee, S. (2000). Barotropic effects on atmospheric storm tracks. Journal of the Atmospheric Sciences, 57(9), 1420–1435.Lee, W.-J., & Mak, M. (1996). The role of orography in the dynamics of storm tracks. Journal of the Atmospheric Sciences, 53(12), 1737–1750.Malguzzi, P., & Malanotte-Rizzoli, P. (1984). Nonlinear stationary Rossby waves on nonuniform zonal winds and atmospheric blocking.
Part I: The analytical theory. Journal of Atmospheric Sciences, 41, 2620–2628.Masato, G., Hoskins, B., & Woollings, T. (2011). Wave-breaking characteristics of Mid-latitude Blocking, Quarterly Journal of Royal Meteorolog-
ical Society, 138, 1285–1296.Masato, G., Hoskins, B. J., & Woollings, T. (2013). Winter and Summer Northern Hemisphere blocking in CMIP5 models. Journal of Climate,
26, 7044–7059.Matsueda, M. (2011). Predictability of Euro-Russian blocking in summer of 2010. Geophysical Research Letters, 38, L06801. https://doi.org/
10.1029/2010GL046557Matsueda, M., Mizuta, R., & Kusunoki, S. (2009). Future change in wintertime atmospheric blocking simulated using a 20-km-mesh atmo-
spheric global circulation model. Journal of Geophysical Research, 114, D12114. https://doi.org/10.1029/2009JD011919McWilliams, J. C. (1980). An application of equivalent modons to atmospheric blocking. Dynamics of Atmospheres and Oceans, 5, 43–66.Moss, R. H., Edmonds, J. A., Hibbard, K. A., Manning, M. R., Rose, S. K., van Vuuren, D. P., . . . Wilbanks, T. J. (2010). The next generation of sce-
narios for climate change research and assessment. Nature, 463(7282), 747–756.Nakamura, H., Nakamura, M., & Anderson, J. (1997). The role of high- and low-frequency dynamics in blocking formation. Monthly Weather
Review, 125(9), 2074–2093.Nakamura, M. (1995). Characteristics of potential vorticity mixing by breaking Rossby waves in the vicinity of a jet (PhD thesis, 253 pp.). Cam-
bridge, MA: Department of Earth, Atmospheric and Planetary Sciences, Massachusetts Institute of Technology.O’Reilly, C. H., Minobe, S., & Kuwano-Yoshida, A. (2016). The influence of the Gulf Stream on wintertime European blocking. Climate Dynam-
ics, 47(5–6), 1545–1567.Pelly, J., & Hoskins, B. (2003). A new perspective on blocking. Journal of the Atmospheric Science, 60, 743–755.Peters, D., & Waugh, D. (1996). Influence of barotropic shear on the poleward advection of upper-tropospheric air. Journal of Atmospheric
Science, 53, 3013–3031.Pfahl, S., Schwierz, C., Croci-Maspoli, M., Grams, C. M., & Wernli, H. (2015). Importance of latent heat release in ascending air streams for
atmospheric blocking. Nature Geoscience, 8(8), 610–614.Pithan, F., Shepherd, T. G., Zappa, G., & Sandu, I. (2016). Climate model biases in jet streams, blocking and storm tracks resulting from miss-
ing orographic drag. Geophysical Research Letters, 43, 7231–7240. https://doi.org/10.1002/2016GL069551Rex, D. (1950). Blocking action in the middle troposphere and its effect upon regional climate: I. An aerological study of blocking action.
Tellus, 2, 196–211.Riviere, G., & Joly, A. (2006). Role of the low-frequency deformation field on the explosive growth of extratropical cyclones at the jet exit.
Part II: Baroclinic critical region. Journal of the Atmospheric Sciences, 63(8), 1982–1995.Sandu, I., Bechtold, P., Beljaars, A., Bozzo, A., Pithan, F., Shepherd, T. G., & Zadra, A. (2016). Impacts of parameterized orographic drag on
the northern hemisphere winter circulation. Journal of Advances in Modeling Earth Systems, 8, 196–211. https://doi.org/10.1002/2015MS000564
Journal of Advances in Modeling Earth Systems 10.1002/2017MS001082
DAVINI ET AL. IMPROVED BLOCKING IN HIGH-RESOLUTION 2633

Scaife, A., Copsey, D., Gordon, C., Harris, C., Hinton, T., Keeley, S., . . . Williams, K. (2011). Improved Atlantic winter blocking in a climatemodel. Geophysical Research Letters, 38, L23703. https://doi.org/10.1029/2011GL049573
Scaife, A., Woollings, T., Knight, J., Martin, G., & Hinton, T. (2010). Atmospheric blocking and mean biases in climate models. Journal of Cli-mate, 23, 6143–6152.
Scherrer, S., Croci-Maspoli, M., Schwierz, C., & Appenzeller, C. (2006). Two-dimensional indices of atmospheric blocking and their statisticalrelationship with winter climate patterns in the Euro-Atlantic region. International Journal of Climatology, 26, 233–249.
Schiemann, R., Demory, M.-E., Shaffrey, L. C., Strachan, J., Vidale, P. L., Mizielinski, M. S., . . . Jung, T. (2017). The resolution sensitivity ofNorthern Hemisphere blocking in four 25-km atmospheric global circulation models. Journal of Climate, 30(1), 337–358.
Shutts, G. (1983). The propagation of eddies in diffluent jetstreams: Eddy vorticity forcing of blocking flow fields. Quarterly Journal of theRoyal Meteorological Society, 109, 737–761.
Taylor, K. (2001). Summarizing multiple aspects of model performance in a single diagram. Journal of Geophysical Research, 106(D7), 7183–7192.
Taylor, K., Stouffer, R., & Meehl, G. (2012). An overview of CMIP5 and the experiment design. Bulletin of the American Meteorological Society,93(4), 485–498.
Tibaldi, S., & Molteni, F. (1990). On the operational predictability of blocking. Tellus, Series A, 42, 343–365.Titchner, H. A., & Rayner, N. A. (2014). The Met Office Hadley Centre sea ice and sea surface temperature data set, version 2: 1. Sea ice con-
centrations. Journal of Geophysical Research: Atmospheres, 119, 2864–2889. https://doi.org/10.1002/2013JD020316Trenberth, K. E. (1986). An assessment of the impact of transient eddies on the zonal flow during a blocking episode using localized
Eliassen-Palm flux diagnostics. Journal of the Atmospheric Sciences, 43(19), 2070–2087.Tyrlis, E., & Hoskins, B. (2008a). The morphology of northern hemisphere blocking. Journal of Atmospheric Science, 65, 1653–1665.Tyrlis, E., & Hoskins, B. (2008b). Aspects of a northern hemisphere atmospheric blocking climatology. Journal of Atmospheric Science, 65,
1638–1652.Valdes, P., & Hoskins, B. (1989). Linear stationary wave simulations of the time-mean climatological flow. Journal of Atmospheric Sciences,
46, 2509–2527.Vallis, G. (2006). Atmospheric and oceanic fluid dynamics: Fundamentals and large-scale circulation. Cambridge, UK: Cambridge University
Press.Vial, J., & Osborn, T. (2012). Assessment of atmosphere-ocean general circulation model simulations of winter northern hemisphere atmo-
spheric blocking. Climate Dynamics, 39(1), 95–112.
Journal of Advances in Modeling Earth Systems 10.1002/2017MS001082
DAVINI ET AL. IMPROVED BLOCKING IN HIGH-RESOLUTION 2634