improvedperitonealcavityandabdominalorganimagingusinga ... · cartography of pm to identify the...
TRANSCRIPT

ORIGINAL ARTICLE
Improved Peritoneal Cavity and Abdominal Organ ImagingUsing aBiphasic Contrast Agent Protocol and Spectral Photon Counting
Computed Tomography K-Edge Imaging
Salim Si-Mohamed, MD,*†‡ Arnaud Thivolet, MD,*‡§ Pierre-Emmanuel Bonnot, MD,‡§||Daniel Bar-Ness, BSc,†‡ Vahan Képénékian, MD,‡§|| David P. Cormode, PhD,¶Philippe Douek, MD, PhD,*†‡ and Pascal Rousset, MD, PhD*‡§
Objectives: To validate in vitro the capability of a high-spatial-resolution proto-type spectral photon-counting computed tomography (SPCCT) scanner to differ-entiate between 2 contrast agents and to assess in vivo the image quality and thefeasibility to image the peritoneal cavity in rats using the 2 contrast agents simul-taneously within the vascular and peritoneal compartments.Materials and Methods: The authors performed SPCCT imaging (100 mAs,120 kVp) with energy bin thresholds set to 30, 51, 64, 72, and 85 keV in vitroon a custom-made polyoxymethylene cylindrical phantom consisting of tubeswith dilutions of both contrast agents and in vivo on 2 groups of adult rats using2 injection protocols. Approval from the institutional animal ethics committeewas obtained. One group received macrocylic gadolinium chelate intraperitoneal(IP) and iodine intravenous (IV) injections (protocol A, n = 3), whereas the sec-ond group received iodine IP and gadolinium IV (protocol B, n = 3). Helical scanswere performed 35 minutes after IP injection and 20 seconds after IV injection.The SPCCT and contrast material images, that is, iodine and gadolinium maps,were reconstructed with a field of view of 160 mm, an isotropic voxel size of250 μm, and a matrix size of 640� 640 pixels using a soft reconstruction kernel.The SPCCT images were reconstructed with 2 different spatial resolutions tocompare the image quality (sharpness, diagnostic quality, and organ visualiza-tion) of SPCCT (250 μm) with single-energy computed tomography (CT)(600 μm). Two radiologists evaluated the peritoneal opacification index in 13 re-gions (score = 0–3 per region) on each type of image. Concentrations of contrastagents were measured in the organs of interest.Results: In vitro, the concentration measurements correlated well with the ex-pected concentrations. The linear regressions both had R2 values of 0.99, slopesof 0.84 and 0.87, and offsets at −0.52 and −0.38 mg/mL for iodine and gadolin-ium, respectively. In vivo, the SPCCT images were of better diagnostic quality,with increased sharpness compared with the CT-like images (P < 0.0001). Intra-peritoneal diffusion was excellent, with similar peritoneal opacification index onSPCCT images and overlay of contrast material maps (P = 1) without a
Received for publication December 30, 2017; and accepted for publication, after revi-sion, April 10, 2018.
From the *Radiology Department, Lyon University Hospital; †CREATIS, CNRS UMR5220, INSA-Lyon; ‡University Lyon, Lyon, France; §EMR 3738, Oullin,France; ||Surgical Department, Centre Hospitalier Universitaire, Lyon, France;and ¶Department of Radiology, University of Pennsylvania, Philadelphia.
Conflicts of interest and sources of funding: This work was supported by the EuropeanUnion Horizon 2020 (grant no. 643694) and France Life Imaging (FLI).
The authors report no conflicts of interest.Supplemental digital contents are available for this article. Direct URL citations appear
in the printed text and are provided in the HTML and PDF versions of this articleon the journal’s Web site (www.investigativeradiology.com).
Correspondence to: Salim Si-Mohamed, MD, CHU Cardiologique Louis Pradel,Département D'imagerie Cardiovasculaire, 59 Boulevard Pinel, 69500 Bron,France. E-mail: [email protected]; [email protected].
Copyright © 2018 The Author(s). Published byWolters Kluwer Health, Inc. This is anopen-access article distributed under the terms of the Creative CommonsAttribution-Non Commercial-No Derivatives License 4.0 (CCBY-NC-ND),where it is permissible to download and share the work provided it is properlycited. The work cannot be changed in any way or used commercially without per-mission from the journal.
ISSN: 0020-9996/18/0000–0000DOI: 10.1097/RLI.0000000000000483
Investigative Radiology • Volume 00, Number 00, Month 2018
significant difference between protocol A (37.0 ± 1.7) and protocol B(35.3 ± 1.5) (P = 0.34). Only the contrast material maps demonstrated clear visualseparation of the contrast agents, allowing specific quantification of the physio-logical enhancement in the liver, spleen, and kidney and the urinary clearancein the renal pelvis and bladder. Renal excretion of the contrast agents injectedIP was observed and was consistent with blood diffusion.Conclusions: Spectral photon-counting CT can be used to perform a completeperitoneal dual-contrast protocol, enabling a good assessment of the peritonealcavity and abdominal organs in rats.
Key Words: multidetector computed tomography, spectral CT,dual-contrast imaging, K-edge imaging, photon-counting detectors,peritoneal imaging
(Invest Radiol 2018;00: 00–00)
S pectral photon-counting computed tomography (SPCCT) technol-ogy is emerging as a new and promising imaging modality in the
field of computed tomography (CT) x-ray imaging, owing to its energyresolving detectors, known as photon counting detectors.1–4 They allowthe analysis of the energy of each photon of the transmitted spectrum,with the capability of dividing them between multiple energy windows,leading to improved information on the interaction between the x-raybeam and the matter. One of the main advantages of SPCCT is the pos-sibility to map K-edge materials by using specific reconstructed im-ages. This approach, called K-edge imaging, is based on the detectionof the strong attenuation variation owing to the photoelectric effect atthe specific binding energy of the K shell electron of an atom.1,4–6 Thisfeature provides specific information on elements that have a K-edge inthe energy range of clinical imaging where there is high photon flux(≈40–100 keV), such as gadolinium (50.2 keV).7,8 Therefore, SPCCTsystems can differentiate 2 contrast agents in the same compartment,as demonstrated in animal models by Symons et al9 via intravenous(IV) use of gadolinium and iodine based contrast agents and abdominalimaging or by Cormode et al10 with the IVuse of gold nanoparticles andan iodine-based contrast agent and kidney imaging. In addition, K-edgeimaging allows measuring the absolute concentration of the targetedmaterial used, as demonstrated by Dangelmaier et al,11 de Vries et al,5
and Si-mohamed et al12 with the use of gadolinium, iodine, and goldnanoparticle-based contrast agents, respectively. Indeed, photon-countingdetectors (PCDs) allow an exact physical representation of pixel values,with quantitative information processed by the SPCCT system from thespectrum transmitted through the subject.2 Moreover, PCDs havehigher spatial resolution that allows differentiation of smaller structures,such as parenchymal arteries, or very small lesionswith a size below thedetection limit of standard CT.2,13
Peritoneal imaging is crucial for the evaluation of invasive tu-mors that can spread to the peritoneal cavity, such as ovarian, colorectal,gastric, appendix tumors, or primary peritoneal tumors such as mesothe-lioma.14 Delay in diagnosis with high tumoral volume of synchronousor metachronous peritoneal metastases (PMs) may alter the surgical
www.investigativeradiology.com 1

Si-Mohamed et al Investigative Radiology • Volume 00, Number 00, Month 2018
treatment management, resulting in a poor prognosis.15 Indeed, survivalof patients with PM has been dramatically improved, thanks to the de-velopment of surgical curative intent procedures with cytoreductive sur-gery that aim to perform a complete visual removal of all lesions,completed by hyperthermic intraperitoneal (IP) chemotherapy to treatresidual microscopic disease.16–18 Such procedures are very demand-ing, with high potential for morbidity, and therefore require careful se-lection of patients via accurate preoperative quantitative and qualitativecartography of PM to identify the tumor volume and distribution, aswell as potentially unresectable lesions.19,20 In oncological clinical prac-tice, CT is the first-line examination, but magnetic resonance imaging(MRI) and positron emission tomography-CT are also routinely per-formed to complete the PM staging.21–23 Unfortunately, each techniquehas some intrinsic limitations, such as low contrast resolution for CTand low spatial resolution for MRI and positron emission tomography-CT, resulting in a consistent underestimation of the PM spread mostlybecause of false-negatives of thin or small lesions less than 1 cm.24–28
In addition, none of these 3 techniques allows spectral capabilities suchas differentiation of 2 contrast agents.
Over the past 10 years, dual-energy CT approaches have beendeveloped, presenting the capability of base material decomposition.However, dual-energy CT cannot use the K-edge effect described previ-ously, which allows specific discrimination of a K-edge contrast agentsuch as gadolinium from another contrast agent. Hence, it seems thatSPCCT has promise to address the limitations mentioned above, owingto its increased spatial resolution, as well as contrast resolution, thanksto specific material discrimination with all the advantages of x-ray im-aging, that is, rapid image acquisition, large volume coverage, and con-venience. These advantages would be suitable for a complete explorationof the peritoneal cavity and organ using a dual-contrast imaging protocoltargeted to 2 different compartments, for example, the peritoneal cavityand abdominal and pelvic organs.
The purpose of this studywas tovalidate in vitro the capability ofa high-spatial-resolution prototype SPCCT scanner to differentiate be-tween 2 contrast agents and to assess in vivo the image quality and thefeasibility to image the peritoneal cavity in rats using the 2 contrast agentssimultaneously within the vascular and peritoneal compartments.
MATERIALS AND METHODS
Spectral Photon-Counting Computed TomographyAn SPCCT prototype system (Philips Healthcare, Haifa, Israel)
was used for this study. It is a modified base clinical system equippedwith a conventional x-ray tube that can be set with a tube voltage at 80,100, or 120 kVp and tube current values between 10 and 100 mA. Thefilters between the tube and the subject absorb low-energy x-ray so thesubject is exposed to a spectrum that ranges from 30 to 120 keV. The fo-cal spot is 0.6� 0.7 mm in size. The in-plane resolutions that were deter-mined from the modulation transfer function (MTF) are 11.4 lp/cm at50%MTFand 22.4 lp/cm at 10%MTF, at a distance of 15 mm to the ro-tation center. TheMTFs were determined using the approach reported byYu et al.29 The system is based on hybrid photon counting detectors of2-mm-thickcadmiumzinc telluridewithapixelpitchof500μm�500μm,ChromAIX2 application-specific integrated circuits combined withcadmiun zinc telluride as sensor material, and operates in singlephoton-counting mode with energy discrimination.30–32 The PCD al-lows up to 5 consecutive energy bins between 30 and 120 keV. The scanfield of view is 168 mm in-plane, with a z-coverage of 2.5 mm in thescanner isocenter. Axial and helical scans over 360° are performed at100 mA tube current and 120 kVp tube voltage with a scanner rotationtime of 1 second and 2400 projections per rotation.
For the scans of the iodine and gadolinium contrast agents, en-ergy thresholds are set to differentiate their attenuation profiles and tocoincide with the K-edge of gadolinium at 50.2 keV (30, 51, 64, 72,
www.investigativeradiology.com
and 85 keV).33 Of note, thresholds were not placed to coincide withthe K-edge of iodine. This is because there are too few photons betweenthe start of the spectrum at 30 keV and iodine's K-edge energy(33.2 keV) to yield data of useful quality.34 Such an approach wouldlikely be used for most clinical-scale photon-counting CT systems, be-cause transmitted spectra almost always have few photons at 33.2 keVanda large number at 50.2 keV.
Phantom PreparationFor the purpose of evaluating in vitro, the capability of the SPCCT
system to differentiate between the contrast agents, a phantom imagingstudy was performed. A custom-made polyoxymethylene cylindricalphantom with a diameter of 13 cm and 10 holes of 1.5 cm in diameterwas used. Samples were loaded into the phantom using 1.5-mL polypro-pylene centrifuge tubes (Dominique Dutscher SAS, Brumath, France). Aset of 10 tubeswas prepared, consisting of contrast agents of awide rangeof concentrations and diluted in phosphate buffered saline (PBS),9,12 atube of calcium phosphate (used as a bone simulant), and one of PBS.The contrast agents were gadolinium (Dotarem [gadoterate meglumine],0.5 mmol/mL; Guerbet, Villepinte, France) and iodine (Xenetix [iobitridol],350 mg/mL; Guerbet, Aulnay-sous-Bois, France) at concentrations of2, 5, 8, and 12 mg/mL. The concentration ranges for the 2 clinicallyavailable contrast agents was based on current practice.
Animal PreparationApproval from the animal ethics committee was obtained before
the start of this study. Two groups of 3 Sprague-Dawley adult rats(Charles River, France; 14–16 weeks old; 510 ± 64 g [mean ± SD])were used for the experiments. Animals were housed in a colony roomwith a 12/12-hour light/dark cycle; temperature range was set between20°C and 24°C. An acclimation period of 7 full days was respected be-fore the first experiment. An infrared lampwas used as an artificial heatsource to keep the rat warm. Rats were monitored with a pulse oximeterand a heart rate sensor during anesthesia and blood glucose level wasalso checked both before glucagon injection and after the experiment.The first group of rats was imaged with IP gadolinium and IV iodine(protocol A, n = 3). The second group was imaged with IP iodine andIV gadolinium (protocol B, n = 3). The 2 contrast agents used were amacrocyclic gadolinium chelate (Dotarem [gadoterate meglumine],0.5 mmol/mL; Guerbet, Villepinte, France) 5 mL/kg for IV injectionsand 18mL/kg of a 20% dilute solution for IP injections, iodine (Xenetix[iobitridol], 350mg/mL; Guerbet, Aulnay-sous-Bois, France) 2.1 ml/kgfor IV injections, and 18 mL/kg of a 5% solution diluted with PBS forIP injections. The IP injections were of lower concentrations because ofthe lack of dilution through the pulmonary vasculature.
Animals were fasted for 3 hours and then gavage-fed with ahyperosmolar agent (2.5 mL of 20% mannitol; B-Braun Medical,Boulogne-Biliancourt, France) commonly used for CTor magnetic res-onance enterography to minimize peristaltism and enhance small bowelanalysis.35 During preparation and acquisitions, rats were anaesthetizedwith isoflurane (4% for induction, 1.5-2.5% for maintenance) in oxygen(1.5 L/min for induction, 0.6 L/min for maintenance). A tail vein (22 Gcatheter) and an IP (20 G catheter) were inserted for contrast injections.Pulling the skin, the peritoneum was accessed in the right iliac fossa toavoid the caecum and the abdominal organs. The IP catheter was re-moved after injection. A bed was fabricated via 3-dimensional printingthat allowed the rat to be positioned ventrally during the imaging ses-sion to reduce motion artifacts caused by respiration and bowel peristal-sis. In addition, a polymethyl methacrylate custom-made cylindricalholder with 160mm outer diameter and 70 mm inner diameter surroundedthe rats, to create similar attenuation to the in vitro study. An IV injection ofan antiperistaltic (0.1mLofGlucaGen [glucagon], 1mg/mL;NovoNordisk,Chartres, France)was performed before the acquisition to reduce bowel peri-stalsis. Additional details of the animal care and imaging protocol areprovided as Supplemental Digital Content, http://links.lww.com/RLI/A383.
© 2018 Wolters Kluwer Health, Inc. All rights reserved.

Investigative Radiology • Volume 00, Number 00, Month 2018 Spectral Photon Counting CT Peritoneal Imaging
Image Acquisition and ReconstructionThe z-coverage length acquisition was evaluated using anatomi-
cal marks for imaging the abdomen and pelvic areas. First, 6 axial slicesof 2-mm z-coverage were performed to confirm successful IP injec-tion and to localize the organs of interest (liver, spleen, kidney, andbladder). Thirty-five minutes were allowed to elapse before performingthe IV injection, to allow the IP agent to fully diffuse through the cavity.This acquisition therefore captures the early IV and IP phase. In addi-tion, the same 6 axial slices that were imaged earlier were again imaged3 minutes after IV injection, representing the late IVand IP phase, overthe organs of interest. The timeline for the in vivo experiment is shownin Figure 1. After the completion of the experiment, the rats showed noadverse effects from the procedure.
The SPCCT images and contrast material images, that is, iodine,water, and gadolinium maps, were reconstructed with a field of view of160 mm, an isotropic voxel size of 250 μm, and a matrix size of640 � 640 pixels using a soft reconstruction kernel. For each pixel, amaximum likelihood estimator was used to derive an equivalentwater-thickness per pixel from the photon counts in the 5 energy bins.Synthetic SPCCT images were then reconstructed from the water-thickness equivalent sinograms using a filtered back-projection algo-rithm. The SPCCT images are generated by best fit of the measuredcount rates to calibration data based on a phantom with various pathlengths. Contrast material maps are based on projection space decom-position per detector. Their solutions are based on maximum likelihoodof forward projection models using literature data of the attenuations ofthe target materials. For example, for water, iodine, and gadolinium, theforward model includes the tube spectrum; the attenuation through pathlengths of LW, LIo, and LGd of water, iodine, and gadolinium, respec-tively; and the detector response. A maximum likelihood function isused to properly take into account the quantum Poisson noise that im-pacts the different energy bins.8,32 Filtered back-projection reconstruc-tions were used without further postprocessing apart from deringing, aswell as smoothing of the contrast material images with a Gaussian ker-nel of 2-pixelwidth that would decrease the noise (standard deviation ofthe mean) by a factor between 2 and 4 without significantly changingthe mean values. Overlay images of the SPCCT and contrast materialmaps images were formed using Image J software.36 To evaluate theadded value of the SPCCT system in image quality compared withsingle-energy CT images, we performed a second reconstruction of
FIGURE 1. Timeline of the in vivo imaging protocol.
© 2018 Wolters Kluwer Health, Inc. All rights reserved.
the SPCCT images with a similar voxel size as with a standard CT sys-tem to obtain so-called CT-like images, that is, with isotropic voxels of600 μm, resulting in a matrix size of 266 � 266.24
In Vitro Image AnalysisImage analysis was performed using Image J software. Circular
regions of interest (ROIs) were manually placed in the middle of eachtube on SPCCT images. The same ROIs were used on the contrast ma-terial images generated and mean concentrations were measured foreach ROI. Linear regression was used to assess the correlation betweenthe measured and the expected concentrations.
In Vivo Image Analysis
Subjective Image Quality Analysis of SPCCT VersusCT-Like Images
The subjective image quality of the SPCCT and CT-like imageswas rated independently by 3 radiologists who were blinded in regardsto the spatial resolution chosen, 2 being experienced in SPCCT imaging(SSM, AT, 8 and 3 years of experience in abdominal imaging, respec-tively) and 1 without any experience in SPCCT imaging (PR), 14 yearsof experience in abdominal imaging). The dataset with images from he-lical acquisitions (the early IVand IP phase) was prepared a month be-fore the analysis by the senior radiologist experienced in SPCCTimaging (SSM) and included 5 slices for each rat that were chosen forthe visualization of small structures at the abdominopelvic levels, thatis, the portal vein, the mesenteric vessels, the ureters, the wall of the lastileal loop, and the pouch of Douglas. The analysis was based on a4-point Likert-scale37 (1: poor, 2: acceptable, 3: good, 4: excellent)for image noise defined by the grainy appearance of images (poor beingwhen the image noise altered the identification of normal and/or abnor-mal structures), image sharpness (poor being when image sharpness al-tered the identification of borders of structures), diagnostic quality(poor being when diagnosis evaluation is not possible). An additionalsubjective analysis based on score of image criteria38 (1: visualizationjust possible, 2: unsharp borders but different structures already visible,3: very good visualization, well-defined anatomy, 4: perfect delineationwell-defined anatomy) was performed for identification of the afore-mentioned 5 small structures.
www.investigativeradiology.com 3

Si-Mohamed et al Investigative Radiology • Volume 00, Number 00, Month 2018
Image Analysis for the 2 Injection Protocols
Peritoneal Opacification AnalysisThe SPCCT images and contrast material maps overlay images
reconstructed from the helical acquisitions (early IVand IP phase) wereanalyzed by 2 radiologists PR, AT, 14 and 3 years of experience in ab-dominal imaging, respectively) in consensus using a standardized gridbased on a modified peritoneal cancer index of the Sugarbaker modelfor animal experiments to evaluate the peritoneal opacification through-out the 13 regions from 0 to 3, depending on the degree of opacification(0 = none; 1 = few; 2 = correct; 3 = good), producing a peritonealopacification index (POI) rating from 0 to 39 (Fig. 2).39 In this proce-dure, regions 10 (the distal portion of the jejunum) and 11 (the proximalportion of the ileum) were rated the same score, owing to the difficultyof differentiating between them.
FIGURE 2. Schematic representation of the POI.
www.investigativeradiology.com
Contrast Agents AnalysisIodine and gadolinium concentrations in the organs of interest
(liver, spleen, kidney, renal pelvis, and bladder) and in the peritonealcavity were obtained by manually drawing ROIs of at least 50 pixelsby using Image J software for each rat on helical scans (early IVandIP phase) and the second axial scans (late IVand IP phase). The ROIswere defined on SPCCT images before retrieval of the gadolinium andiodine concentrations per organ to avoid operator bias. After obtainingthe concentrations, no adjustments of the ROIs were made. The ROIswere manually placed by a senior radiologist (SSM, 8 years of experi-ence) in the organs of interest and were automatically copied onto thecontrast material maps by the image analysis software. The data ob-tained are the absolute mean concentration of gadolinium and iodinein mg/mL (mean ± standard deviation).
© 2018 Wolters Kluwer Health, Inc. All rights reserved.

Investigative Radiology • Volume 00, Number 00, Month 2018 Spectral Photon Counting CT Peritoneal Imaging
Contrast-to-noise ratios (CNRs) among the 3 rats in each proto-col were measured by manually drawing the ROIs of at least 50 pixelson the SPCCT images within the peritoneal cavity, the bone, and a rep-resentative abdominal organ such as the kidney. The ROIs were then au-tomatically copied-pasted on the contrast material maps that weresmoothed with a Gaussian kernel of 2 pixel width. The CNR were thencalculated as follows:
CNR ¼ meanCTnumberkidney or bone � meanCTnumberperitoneal��
��
SDperitoneal
The choice of analyzing the kidney cortex wasmade because it does notsuffer frombowel or respiratorymotion artifacts owing to its retroperitoneallocalization and because it has a simpler model of enhancement
FIGURE 3. A, Schematic drawing, SPCCT images and contrast material mapswith increasing concentrations of contrast agents (2, 5, 8, and 12mg/mL), withmeasured contrast agent concentrations, showing a linear correlation.
© 2018 Wolters Kluwer Health, Inc. All rights reserved.
comparedwith either the liver, which has a complex double vascularisa-tion (portal and arterial), or the spleen, which has a terminal capillaryvascularization.40 The choice of analyzing the bone was made toinvestigate the specificity of the gadolinium images versus theiodine images.
Statistical AnalysisStatistical analysis was performed using the software StataSE
(StataCorp, 2011, Stata Statistical Software: Release 12, StataCorp LP, Col-lege Station, TX). To evaluate differences in POI between the 2 protocolsand differences in ordinal qualitative data of the image quality analysis be-tween the images with different spatial resolutions, the Wilcoxon signed-rank test for paired samples was applied. A P value < 0.05 was consideredstatistically significant. The interrater reliability between the senior
(water, gadolinium, and iodine maps) of the phantom containing tubescalcium phosphate and PBS tubes. B, Comparison of actual and SPCCT
www.investigativeradiology.com 5

Si-Mohamed et al Investigative Radiology • Volume 00, Number 00, Month 2018
radiologist experienced in SPCCT imaging and the 2 other radiologistswas calculated by the linearly weighted Cohen κ values (poor,= 0.00–0.20; fair, κ = 0.21–0.40; moderate, κ = 0.41–0.60; good,= 0.61–0.80; or excellent, κ = 0.81–1.00).41
RESULTS
In Vitro ImagingAs expected from the experimental design, the solutions of con-
trast agents could not be differentiated on SPCCT images without pre-vious knowledge, revealing higher attenuation for the tubes containinghigher concentrations of contrast media and for the calcium phosphatetubes. However, we found that gadolinium and iodine contrast agentswere accurately separated from each other in their respective materialimages (Fig. 3A). In addition, a strong signal arising from the calciumphosphate tube was observed in the iodine map, but not in the gadoliniummap. No signal of the polyoxymethylene phantom or tubes was foundin these images, but signal from these objects was observed in the waterimages because of their composition, having an effective atomic numberslightly below that of water. We observed a linear correlation between
FIGURE 4. Coronal (A) and axial (B, C) SPCCT images of a rat from the inject(full arrowhead: inferior vena cava, empty arrowhead: right hepatic veins, full arstar: large bowel), the urinary tract (empty arrow: ureters) and the opacified pstructures. The positions of panels B and C are denoted on panel A by the ann
www.investigativeradiology.com
the signal in the contrast material maps and contrast agent concentrationwith good accuracy (all R2 values = 0.99) (Fig. 3B).
In Vivo Imaging
Subjective Image Quality Analysis of SPCCT VersusCT-Like Images
Given the ability of the SPCCT system to distinguish the contrastagents in the phantom, we then performed invivo experimentswith rats.On SPCCT images acquired 20 seconds after IV injection of contrastagent, with both protocols, organs and vessels were well delineated(Fig. 4). Small to very small structures were also observable all alongtheir way, such as the mesenteric vessels, the hepatic veins, as well asthe retroperitoneal space with the urinary tract.
The SPCCT imageswere of better diagnostic quality, with increasedsharpness compared with CT-like images (Fig. 5 and Table 1). The imagesharpness, diagnostic quality, and organs of interest were given low scoresfor the CT-like images of 1.1 [1–2], 1 [1–1], and 1.5 [1–2] respectively,compared with high scores for the SPCCT images (3.4 [3–4], 3.3[2–4], and 3.4 [2–4], respectively) (all P values < 0.0001). The imagenoise was not statistically significantly different between both protocols,with very good scores for both images (2.7 [3–4] vs. 3.0 [3–4] for
ion protocol B show exploration of the abdominal organs and vesselsrow:mesenteric vessels), the digestive tract (empty star: small bowel, fulleritoneal cavity with hyperdense content surrounding the abdominalotated white dotted lines.
© 2018 Wolters Kluwer Health, Inc. All rights reserved.
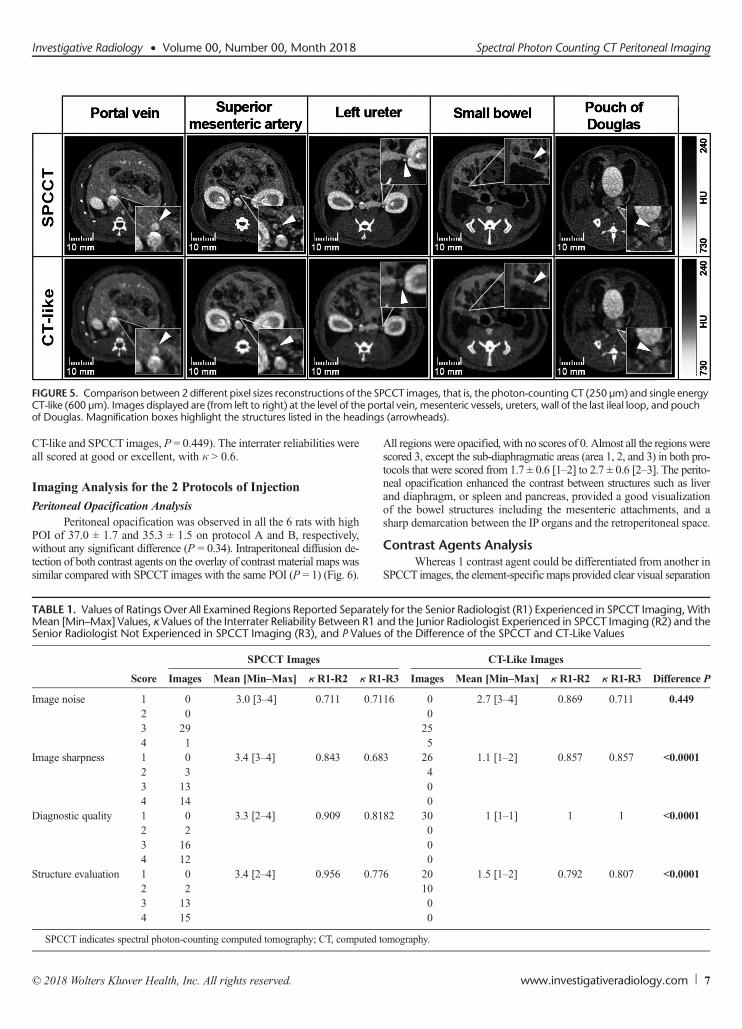
FIGURE 5. Comparison between 2 different pixel sizes reconstructions of the SPCCT images, that is, the photon-counting CT (250 μm) and single energyCT-like (600 μm). Images displayed are (from left to right) at the level of the portal vein, mesenteric vessels, ureters, wall of the last ileal loop, and pouchof Douglas. Magnification boxes highlight the structures listed in the headings (arrowheads).
Investigative Radiology • Volume 00, Number 00, Month 2018 Spectral Photon Counting CT Peritoneal Imaging
CT-like and SPCCT images, P = 0.449). The interrater reliabilities wereall scored at good or excellent, with κ > 0.6.
Imaging Analysis for the 2 Protocols of Injection
Peritoneal Opacification AnalysisPeritoneal opacification was observed in all the 6 rats with high
POI of 37.0 ± 1.7 and 35.3 ± 1.5 on protocol A and B, respectively,without any significant difference (P = 0.34). Intraperitoneal diffusion de-tection of both contrast agents on the overlay of contrast material maps wassimilar compared with SPCCT images with the same POI (P = 1) (Fig. 6).
TABLE 1. Values of Ratings Over All Examined Regions Reported SeparateMean [Min–Max] Values, κ Values of the Interrater Reliability Between R1 aSenior Radiologist Not Experienced in SPCCT Imaging (R3), and P Values
Score
SPCCT Images
Images Mean [Min–Max] κ R1-R2 κ R1
Image noise 1 0 3.0 [3–4] 0.711 0.712 03 294 1
Image sharpness 1 0 3.4 [3–4] 0.843 0.682 33 134 14
Diagnostic quality 1 0 3.3 [2–4] 0.909 0.812 23 164 12
Structure evaluation 1 0 3.4 [2–4] 0.956 0.772 23 134 15
SPCCT indicates spectral photon-counting computed tomography; CT, computed
© 2018 Wolters Kluwer Health, Inc. All rights reserved.
All regionswere opacified, with no scores of 0. Almost all the regionswerescored 3, except the sub-diaphragmatic areas (area 1, 2, and 3) in both pro-tocols that were scored from 1.7 ± 0.6 [1–2] to 2.7 ± 0.6 [2–3]. The perito-neal opacification enhanced the contrast between structures such as liverand diaphragm, or spleen and pancreas, provided a good visualizationof the bowel structures including the mesenteric attachments, and asharp demarcation between the IP organs and the retroperitoneal space.
Contrast Agents AnalysisWhereas 1 contrast agent could be differentiated from another in
SPCCT images, the element-specific maps provided clear visual separation
ly for the Senior Radiologist (R1) Experienced in SPCCT Imaging,Withnd the Junior Radiologist Experienced in SPCCT Imaging (R2) and theof the Difference of the SPCCT and CT-Like Values
CT-Like Images
Difference P-R3 Images Mean [Min–Max] κ R1-R2 κ R1-R3
16 0 2.7 [3–4] 0.869 0.711 0.4490255
3 26 1.1 [1–2] 0.857 0.857 <0.0001400
82 30 1 [1–1] 1 1 <0.0001000
6 20 1.5 [1–2] 0.792 0.807 <0.00011000
tomography.
www.investigativeradiology.com 7

FIGURE 6. Abdominopelvic spectral photon-counting CT images and contrast material maps acquired at 20 seconds post-IV injections for both protocols(100mA, 120 kVp, 0.25mm isotropic voxel size). Protocol A used a combination of IP gadolinium and IV iodine based contrast agents. Protocol B useda combination of IP iodine and IV gadolinium contrast agents (POI: iodine: purple, gadolinium: green, bone: white). The bone structures that appear inthe iodine images were segmented on the SPCCT images based on a windowing threshold and a specific white overlay was applied.
Si-Mohamed et al Investigative Radiology • Volume 00, Number 00, Month 2018
of the contrast agents, allowing assessment of specific peritonealopacification and organ enhancement (Fig. 6). On the iodine map,the signalwas preserved in the structures enhanced, either the peritonealcavity or the organs of interest, without discrimination from the bonesignal, as was seen for the phantom. On the gadolinium map, only thesignal arising from gadolinium was seen with the benefit of removalof all the other structures, such as bone and soft tissue. The specificdiscrimination of the contrast agent was seen in both protocols, with theadditional value to be absolutely quantitative, as confirmed by thephantom study.
In addition, the material maps allowed the quantification ofthe concentrations of contrast agents in the organs of interest and theperitoneal cavity and showed physiological enhancement withinthe organs of interest (Fig. 7). Moreover, material maps highlightedlate renal excretion of the IP agent with accumulation within thebladder (Fig. 8) and inconsistent concentrations of contrast agents
FIGURE 7. Concentrations of the contrast agents in the peritoneal cavity andpresented as mean ± standard deviation of the absolute concentrations amongconcentrations in green.
www.investigativeradiology.com
within the bladder due to the frequent urination of the rats during im-aging protocol (Fig. 7).
The CNR values between the renal cortex during the enhance-ment phase and the peritoneal cavity were higher on the material maps(14.2 ± 1.0 and 12.1 ± 0.4 on iodine and gadoliniummaps, respectively)for protocol A compared to the SPCCT images (5.0 ± 2.5) (Fig. 9A).The CNR values between the peritoneal cavity and the bone were alsohigher on the gadolinium map (23.0 ± 1.0) for protocol A (Fig. 9B)than on the SPCCT images (18.8 ± 1.3) because the gadolinium maphas no signal arising from the bone. Protocol B resulted in lower CNRthan protocol A for the evaluation of the renal cortex enhancement(7.4 ± 1.2 vs 14.2 ± 1.0 on gadolinium and iodine maps, respectively;P = 0.0495) (Fig. 9, A and C) and for the CNR between the bone andperitoneal cavity since the signal arising from the bone is present onthe iodine maps (1.9 ± 2.0 vs 23.0 ± 1.0 on iodine and gadoliniummaps, respectively, P = 0.0495) (Fig. 9, B and D).
the organs of interest (liver, spleen, kidney, renal pelvis, bladder). Data areeach group. Iodine concentrations are given in purple and gadolinium
© 2018 Wolters Kluwer Health, Inc. All rights reserved.
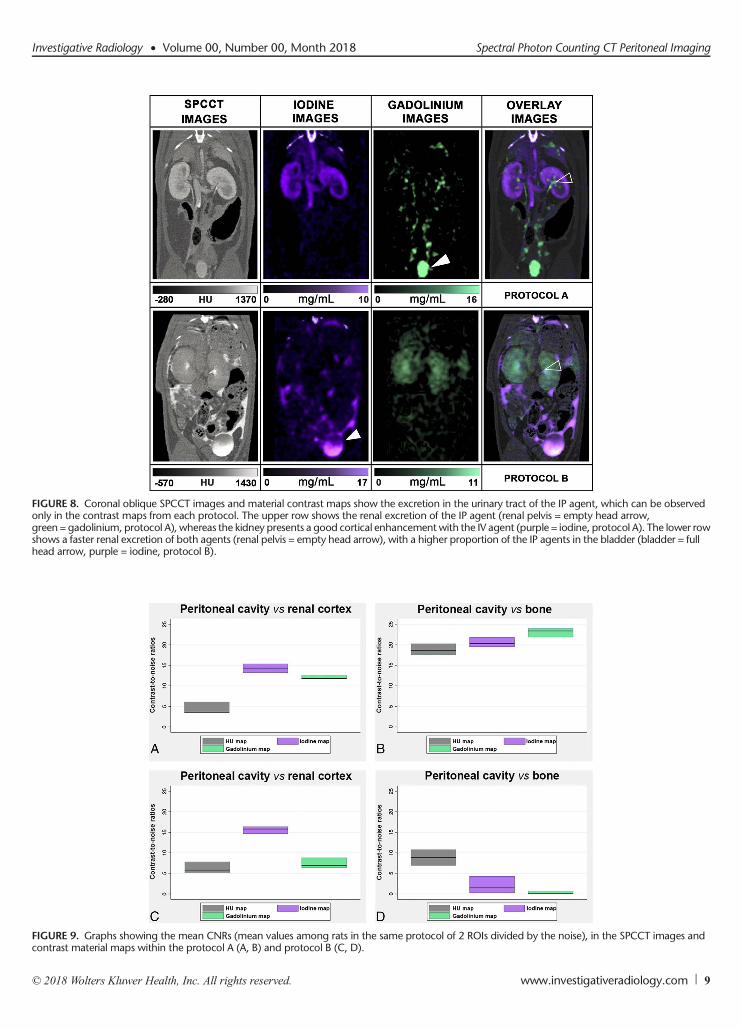
FIGURE 8. Coronal oblique SPCCT images and material contrast maps show the excretion in the urinary tract of the IP agent, which can be observedonly in the contrast maps from each protocol. The upper row shows the renal excretion of the IP agent (renal pelvis = empty head arrow,green = gadolinium, protocol A), whereas the kidney presents a good cortical enhancement with the IV agent (purple = iodine, protocol A). The lower rowshows a faster renal excretion of both agents (renal pelvis = empty head arrow), with a higher proportion of the IP agents in the bladder (bladder = fullhead arrow, purple = iodine, protocol B).
FIGURE 9. Graphs showing the mean CNRs (mean values among rats in the same protocol of 2 ROIs divided by the noise), in the SPCCT images andcontrast material maps within the protocol A (A, B) and protocol B (C, D).
Investigative Radiology • Volume 00, Number 00, Month 2018 Spectral Photon Counting CT Peritoneal Imaging
© 2018 Wolters Kluwer Health, Inc. All rights reserved. www.investigativeradiology.com 9

Si-Mohamed et al Investigative Radiology • Volume 00, Number 00, Month 2018
DISCUSSIONPeritoneal diseases are common, but their diagnostic still represents
a challenge for general radiologists because of the overlap in radiologic im-aging appearances. Indeed, even CT, which is the first choice imaging mo-dality in these diseases, is limited by its low sensitivity for the detectionof small structures (eg, metastases <1 cm) and mesenteric landmark.27
In this study, we demonstrated the ability of a prototype SPCCTsystem, adapted from a clinical CT base, to perform in vivo high spatialresolution and multicolor dynamic peritoneal imaging in rats. We used2 clinically approved contrast agents, gadolinium, a K-edge contrastmaterial, and iodine, a non-K-edge contrast agent, which were adminis-tered simultaneously, one of them IP and the other IV. Taking advantageof the spectral capabilities of the SPCCT system, we could collect bothqualitative and quantitative information and obtain complete peritonealdual-contrast imaging.
Our protocol led to peritoneal opacification that enhanced thecontrast resolution on both SPCCTand contrast material overlay imagesand permitted a good delineation of the organs, digestive and smallstructures, as well as a complete and specific visualization of the perito-neal cavity. This was confirmed by the excellent POI in each protocol.Moreover, using the material decomposition of the attenuation into theiodine and the gadoliniummaterial maps, it was possible to differentiatethe peritoneal cavity from the abdominal and pelvic organs with goodCNR. A good CNR was somewhat expected with gadolinium, as al-though calcium-rich structures appear in the iodine maps using our mate-rial decomposition approach, their attenuation profile is far from thegadolinium, and so no signal from calcium contaminates the gadolin-ium maps. Interestingly, despite the calcium attenuation profile beingclose to that of iodine,3 we also observed high CNR for the visualiza-tion of renal cortex using the IV iodine injection. Moreover, we ob-served higher CNR between the renal cortex and the peritoneal cavityusing IV iodine injection on the appropriate material maps. This wasprobably due to the higher load of iodine atoms injected compared togadolinium. However, we were limited in the visualization of the re-gions nearby the diaphragm, likely because of motion from breathing.Furthermore, the acquisition of the peritoneal cavity images neededtemporary inhibition of gastroduodenal movements induced by gluca-gon to allow visualization of digestive structures. Fasting and gavagefeeding the animals with hyperosmotic solution were also necessaryto improve the bowel structure visualization, by filling the lumen withliquid that replaced the high attenuating feces and air present in therat digestive system. Hence, this indicates the potential of dual-contrastenhanced SPCCT for peritoneal opacification, which can be performedin patients for preoperative imaging.42–45 In addition, to the best ofour knowledge, this study is the first to use a clinical-scale prototypeSPCCT for peritoneal opacification imaging in a small animal model.Previous studies in small animals used a micro-CTwith the drawbackof long time acquisitions, limiting the use of IV contrast media.46,47
Asmentioned above, a major limitation of peritoneal imaging to-day is its low sensitivity for the detection of small structures, includingsmall PMs. In the present study, we could clearly visualize, on the gen-erated SPCCT images, the superior mesenteric artery collaterals and themesenteric attachments, which are structuresmeasuring less than 1mm.This finding can be explained by the high intrinsic spatial resolutionconfirmed by the MTF (22.4 lp/cm at 10% MTF at a distance of 15 mmto the rotation center). This is mostly because of the smaller pixelsize of PCDs compared with that of energy integrating detectors,which are used in typical CT scanners.2,13 Altogether, these resultssuggest that SPCCT should have a tumor identification potential be-yond current detection.27 This will have to be tested in an animalmodel of peritoneal carcinomatosis by simultaneously injecting gad-olinium IP to highlight PMs via negative contrast and iodine IV toimprove the contrast resolution between normal tissue and PM en-hancement. We would then quantify the 2 different contrast agentson overlay maps.
10 www.investigativeradiology.com
Interestingly, in the present study, we show that SPCCT allowsthe quantification of material concentration, both in vitro and in vivo.Indeed, wemeasured a very accurate response of the material decompositionprocess, with a quantifiable offset. However, the system underestimatedthe iodine and gadolinium concentrations, similar to previously pub-lished results.9,11 This underestimation can partly be explained by pulsepile-up at high flux levels and maybe an indication of a suboptimalspectral model. The contribution of scatter to the detector signal is an-other potential source for systematic quantification errors. Hence, theobserved imperfections in the spectral decomposition limit the spectralperformance at high flux levels, and improvements of the spectralmodel of the detection chain should be considered. Nevertheless, weobserved an expected enhancement in the organs immediately after IVinjection, which had largely dissipated at the late IV phase except for inthe renal cortex in the case of the gadolinium contrast agent. This out-come can be explained by the fact that the iodinated compounds areknown to have a faster renal clearance, compared with the gadolinatedones.48,49We also observed a high concentration of the IP contrast agentsin the bladder at the late IP phase in favor of a blood diffusion, which isexplained by the absorption by the vascular system and terminal lym-phatics within the peritoneal cavity.50
Altogether, the peritoneal imaging methodology we present hereseems particularly suitable for clinical research, although there are somelimitations to our study. First, as it was not possible to select a softer re-construction kernel, which would yield similar image resolution as atypical reconstruction kernel on a clinical CT scanner, we tried to sim-ulate the image resolution of such a system by reconstructing largerpixels. The accuracy of this simulation will not be perfect. Second,some adjustment would have to be made to translate it to humans (eg,the beam hardening in small animal is low and may result in some dif-ferences in patients). Moreover, the concentrations of gadolinium usedin the present study were higher than the clinical concentrations used inMRI owing to the low sensitivity of SPCCT. However, applying moreadvanced reconstruction methods or postprocessing treatments eitherin the image or the raw data domains would likely result in improvedsensitivity and decrease the dose of contrast agent needed.
CONCLUSIONSpectral photon counting CT is feasible using dual-contrast agents
within peritoneal and blood compartments, allowing a good assessmentof the peritoneal cavity and abdominal organs in rats. The advantagesof SPCCT for this application are a result of its high spatial resolutionand higher CNR in element-specific images than in standard CT. Anapplication of SPCCT may therefore be improved detection of PMs.
ACKNOWLEDGMENTWe thank Dr Valérie Tatard-Leitman, Dr Cyril Mory, Pr Loic
Boussel, Dr Monica Sigovan, Dr Luisa Poggi, Dr Yoad Yagil, and DrMichal Rokni for their help in writing the manuscript. We thank CarolineBouillot for helping with the experiment and the animal care.
REFERENCES
1. Si-mohamed S, Bar-Ness D, SigovanM, et al. Reviewof an initial experiencewithan experimental spectral photon-counting computed tomography system. NuclInstrum Methods Phys Res. 2017;873:27–35.
2. Taguchi K, Iwanczyk JS. Vision 20/20: single photon counting x-ray detectors inmedical imaging.Med Phys. 2013;40:100901.
3. McColloughCH, Leng S,Yu L, et al. Dual- andmulti-energyCT: principles, tech-nical approaches, and clinical applications. Radiology. 2015;276:637–653.
4. Pourmorteza A, Symons R, Sandfort V, et al. Abdominal imaging with contrast-enhanced photon-counting CT: first human experience. Radiology. 2016;279:239–245.
5. de Vries A, Roessl E, Kneepkens E, et al. Quantitative spectral K-edge imaging inpreclinical photon-counting x-ray computed tomography. Invest Radiol. 2015;50:297–304.
© 2018 Wolters Kluwer Health, Inc. All rights reserved.

Investigative Radiology • Volume 00, Number 00, Month 2018 Spectral Photon Counting CT Peritoneal Imaging
6. Schlomka JP, Roessl E, Dorscheid R, et al. Experimental feasibility of multi-energy photon-counting K-edge imaging in pre-clinical computed tomography.Phys Med Biol. 2008;53:4031–4047.
7. Roessl E, Brendel B, Engel KJ, et al. Sensitivity of photon-counting based K-edge im-aging in x-ray computed tomography. IEEE TransMed Imaging. 2011;30:1678–1690.
8. Roessl E, Proksa R. K-edge imaging in x-ray computed tomography using multi-bin photon counting detectors. Phys Med Biol. 2007;52:4679.
9. Cormode DP, Si-mohamed S, Bar-Ness D, et al. Multicolor spectral photon-counting computed tomography: in vivo dual contrast imaging with a high countrate scanner. Sci Rep. 2017;7:4784.
10. Symons R, Krauss B, Sahbaee P, et al. Photon-counting CT for simultaneous im-aging of multiple contrast agents in the abdomen: an in vivo study. Med Phys.2017;44:5120–5127.
11. Dangelmaier J, Bar-Ness D, Daerr H, et al. Experimental feasibility of spectralphoton-counting computed tomography with two contrast agents for the detectionof endoleaks following endovascular aortic repair. Eur Radiol. 2018;33:497–504.
12. Si-mohamed S, Cormode DP, Bar-Ness D, et al. Evaluation of spectral photoncounting computed tomography K-edge imaging for determination of gold nano-particle biodistribution in vivo. Nanoscale. 2017;9:18246–18257.
13. MannilM, Hickethier T, von Spiczak J, et al. Photon-counting CT: high-resolutionimaging of coronary stents. Invest Radiol. 2018;53:143–149.
14. Patel CM, Sahdev A, Reznek RH. CT, MRI and PET imaging in peritoneal malig-nancy. Cancer Imaging. 2011;11:123–139.
15. Jayne DG, Fook S, Loi C, et al. Peritoneal carcinomatosis from colorectal cancer.Br J Surg. 2002;89:1545–1550.
16. Glehen O, Kwiatkowski F, Sugarbaker PH, et al. Cytoreductive surgery combinedwith perioperative intraperitoneal chemotherapy for the management of peritonealcarcinomatosis from colorectal cancer: a multi-institutional study. J Clin Oncol.2004;22:3284–3292.
17. Elias D, Goéré D, Dumont F, et al. Role of hyperthermic intraoperative peritonealchemotherapy in the management of peritoneal metastases. Eur J Cancer. 2014;50:332–340.
18. Verwaal VJ, Bruin S, Boot H, et al. 8-year follow-up of randomized trial:cytoreduction and hyperthermic intraperitoneal chemotherapy versus systemicchemotherapy in patients with peritoneal carcinomatosis of colorectal cancer.Ann Surg Oncol. 2008;15:2426–2432.
19. Sugarbaker PH, Sardi A, Brown G, et al. Concerning CT features used to selectpatients for treatment of peritoneal metastases, a pictoral essay. Int J Hyperther-mia. 2017;33:497–504.
20. Mohkam K, Passot G, Cotte E, et al. Resectability of peritoneal carcinomatosis:learnings from a prospective cohort of 533 consecutive patients selected forcytoreductive surgery. Ann Surg Oncol. 2016;23:1261–1270.
21. Pfannenberg C, Königsrainer I, Aschoff P, et al. (18)F-FDG-PET/CT to select pa-tients with peritoneal carcinomatosis for cytoreductive surgery and hyperthermicintraperitoneal chemotherapy. Ann Surg Oncol. 2009;16:1295–1303.
22. Low RN, Barone RM. Combined diffusion-weighted and gadolinium-enhancedMRI can accurately predict the peritoneal cancer index preoperatively in patientsbeing considered for cytoreductive surgical procedures. Ann Surg Oncol. 2012;19:1394–1401.
23. Yan TD, Morris DL, Shigeki K, et al. Preoperative investigations in the manage-ment of peritoneal surface malignancy with cytoreductive surgery and periopera-tive intraperitoneal chemotherapy: expert consensus statement. J Surg Oncol.2008;98:224–227.
24. Dohan A, Hoeffel C, Soyer P, et al. Evaluation of the peritoneal carcinomatosis in-dex with CT and MRI. Br J Surg. 2017;104:1244–1249.
25. Dromain C, Leboulleux S, Auperin A, et al. Staging of peritoneal carcinomatosis:enhanced CT vs. PET/CT. Abdom Imaging. 2008;33:87–93.
26. de Bree E, Koops W, Kröger R, et al. Preoperative computed tomography andselection of patients with colorectal peritoneal carcinomatosis for cytoreductivesurgery and hyperthermic intraperitoneal chemotherapy. Eur J Surg Oncol.2006;32:65–71.
27. Coakley FV, Choi PH, Gougoutas CA, et al. Peritoneal metastases: detection withspiral CT in patients with ovarian cancer. Radiology. 2002;223:495–499.
28. de Bree E, KoopsW, Kröger R, et al. Peritoneal carcinomatosis from colorectal orappendiceal origin: correlation of preoperative CT with intraoperative findingsand evaluation of interobserver agreement. J Surg Oncol. 2004;86:64–73.
© 2018 Wolters Kluwer Health, Inc. All rights reserved.
29. Yu Z, Leng S, Jorgensen SM, et al. Evaluation of conventional imaging perfor-mance in a research whole-body CT systemwith a photon-counting detector array.Phys Med Biol. 2016;61:1572–1595.
30. Steadman R, Herrmann C, Livne A. ChromAIX2: A large area, high count-rateenergy-resolving photon countingASIC for a spectral CT prototype.Nucl InstrumMethods Phys Res. 2017;862:18–24.
31. Blevis IM, Altman A, Berman Y, et al. Introduction of Philips preclinical pho-ton counting scanner and detector technology development. IEEE Med ImagingConf. 2015.
32. Roessl EE. Imaging performance of a photon-counting computed tomographyprototype. Geneva, Switzerland: CERN; 2015.
33. Roessl E, Herrmann C. Cramér-Rao lower bound of basis image noise inmultiple-energy x-ray imaging. Phys Med Biol. 2009;54:1307–1318.
34. Cormode DP, Roessl E, Thran A, et al. Atherosclerotic plaque composition: anal-ysis with multicolor CT and targeted gold nanoparticles. Radiology. 2010;256:774–782.
35. Hahnemann ML, Nensa F, Kinner S, et al. Improved detection of inflammatorybowel disease by additional automated motility analysis in magnetic resonanceimaging. Invest Radiol. 2015;50:67–72.
36. Schneider CA, Rasband WS, Eliceiri KW. NIH image to ImageJ: 25 years of im-age analysis. Nat Methods. 2012;9:671–675.
37. Wenz H,MarosME,MeyerM, et al. Image quality of 3rd generation spiral cranialdual-source CT in combination with an advanced model iterative reconstructiontechnique: a prospective intra-individual comparison study to standard sequentialcranial CTusing identical radiation dose. PLoS One. 2015;10:e0136054.
38. Wenz H,MarosME,MeyerM, et al. Intra-individual diagnostic image quality andorgan-specific-radiation dose comparison between spiral cCTwith iterative imagereconstruction and z-axis automated tube current modulation and sequential cCT.Eur J Radiol Open. 2016;3:182–190.
39. Jacquet P, Sugarbaker PH. Clinical research methodologies in diagnosis andstaging of patients with peritoneal carcinomatosis. Cancer Treat Res. 1996;82:359–374.
40. Lemoine S, Papillard M, Belloi A, et al. Renal perfusion: noninvasive measure-ment with multidetector CT versus fluorescent microspheres in a pig model. Ra-diology. 2011;260:414–420.
41. Hallgren KA. Computing inter-rater reliability for observational data: an overviewand tutorial. Tutor Quant Methods Psychol. 2012;8:23–34.
42. Gryspeerdt S, Clabout L, Van Hoe L, et al. Intraperitoneal contrast material com-bined with CT for detection of peritoneal metastases of ovarian cancer. Eur JGynaecol Oncol. 1998;19:434–437.
43. Hughes PM, Zammit-Maempel I, Murphy D. Computed tomographic assessmentof intraperitoneal fluid distribution prior to intraperitoneal chemotherapy for ovar-ian cancer. Br J Radiol. 1992;65:295–297.
44. Barlin JN, Bristow RE, Bleich K, et al. Computed tomographic peritoneographyprior to intraperitoneal chemotherapy in advancedMüllerian cancer: a pilot study.Clin Imaging. 2010;34:191–195.
45. Halvorsen RA Jr, Panushka C, Oakley GJ, et al. Intraperitoneal contrast materialimproves the CT detection of peritoneal metastases. AJR Am J Roentgenol.1991;157:37–40.
46. Rathnayake S, Mongan J, Torres AS, et al. In vivo comparison of tantalum, tung-sten, and bismuth enteric contrast agents to complement intravenous iodine fordouble-contrast dual-energy CT of the bowel. Contrast Media Mol Imaging.2016;11:254–261.
47. Paulus MJ, Gleason SS, Kennel SJ, et al. High resolution X-ray computed tomog-raphy: an emerging tool for small animal cancer research. Neoplasia. 2000;2:62–70.
48. Harpur ES, Worah D, Hals PA, et al. Preclinical safety assessment and pharmaco-kinetics of gadodiamide injection, a new magnetic resonance imaging contrastagent. Invest Radiol. 1993;28(Suppl 1):S28–S43.
49. Dencausse A, Violas X, Feldman H, et al. Pharmacokinetic profile of iobitridol.Acta Radiol Suppl. 1996;400:25–34.
50. Tsilibary EC, Wissig SL. Lymphatic absorption from the peritoneal cavity:regulation of patency of mesothelial stomata. Microvasc Res. 1983;25:22–39.
www.investigativeradiology.com 11