improvement in in vitro growth rates of ganoderma species
TRANSCRIPT
Vol. 7(29), pp. 3772-3788, 19 July, 2013
DOI: 10.5897/AJMR12.2076
ISSN 1996-0808 ©2013 Academic Journals
http://www.academicjournals.org/AJMR
African Journal of Microbiology Research
Full Length Research Paper
Improvement in in vitro growth rates of Ganoderma species with industrial wood waste supplements
Fahimeh Alizadeh1, Siti Nor Akmar Abdullah1,2*, Alireza Khodavandi3 and Pei Pei Chong3
1Institute of Tropical Agriculture, Universiti Putra Malaysia, 43400 Serdang, Selangor, Malaysia.
2Department of Agriculture Technology, Faculty of Agriculture, Universiti Putra Malaysia,
43400 Serdang, Selangor, Malaysia. 3Department of Biomedical Science, Faculty of Medicine and Health Sciences,
Universiti Putra Malaysia, 43400 Serdang, Selangor, Malaysia.
Accepted 26 April, 2013
The bracket-like polypore fungi of the genus Ganoderma, as a pathogen of oil palm (Elaeis guineensis Jacq.), is a major concern primarily because it plays a significant role in the economy of many countries in South-East-Asia. Growth of several Ganoderma isolates was examined on various culture media to develop a medium for rapid growth. Growth analyses revealed that growth of the different isolates was different on various culture media which differed in their nutrient composition and their growth levels were influenced by industrial wood waste. High rate of growth was achieved on rubber/oil palm wood extract agar. Potato dextrose agar supplemented with wood powder and peptone also favoured mycelial growth. Malt extract agar was the poorest among the media investigated for obtaining rapid mycelial growth of Ganoderma isolates. G. boninense PER 71, G. tornatum POR 57 and G. subamboinense var. laevisporium (ATCC 52419) presented higher growth rate on the different culture media. The G. boninense PER 71 showed the fastest growth on the different media, while the minimum growth was achieved for G. tornatum POR 54. Rubber/oil palm wood extract agar media appears to increase growth rate of the different Ganoderma isolates. Increase growth rate of different Ganoderma isolates by industrial wood waste suggested that industrial wood waste is sufficient to improve mycelial growth of Ganoderma isolates. Supporting the assumption, industrial wood waste could be a useful renewable source for the early detection of Ganoderma disease that will improve efforts to prevent economic losses in oil palm. Our rapid and less expensive culture media may also have commercial potential and novel biotechnological applications. Keywords: Ganoderma, mycelial growth rate, oil palm, wood waste.
INTRODUCTION Ganoderma species, the white rot basidiomycete have been associated with the devastating basal stem rot (BSR) disease of oil palm in various South-East-Asian countries. At present the number of Ganoderma species involved in the disease has not been resolved. The species was described originally as G. lucidum in
Malaysia (Ho and Nawawi, 1985). G. boninense Pat. is the main causal agent of oil palm diseases in Malaysia (Ho and Nawawi, 1985; Pilotti, 2005). In addition, several Ganoderma species have been isolated and charac-terized from infected oil palm in Malaysia, including G. miniatocinctum, G. zonatum and G. tornatum (Idris et
*Corresponding author. E-mail: [email protected]. Tel: +603-8947 1099. Fax: +603-8938 1015.

al., 2006; Paterson et al., 2009). White rot basidio-mycetes are unique in their ability to degrade most components of wood due to their capability to synthesize the relevant hydrolytic and oxidative extracellular enzymes including the endo-1,4-ß-D-glucanase, exo-1,4-ß-D-glucanase and xylanase. The fungi also secrete extracellular non-specific and non-stereoselective lignin degrading enzymes essential for the fungal survival. The lignin-degrading enzymes associated with white rot fungi are lignin peroxidase, manganese peroxidase and laccase. The white rot basidiomycetes have been classified with respect to the potential to express ligninolytic enzymes (Leonowicz et al., 1999; Arora and Gill, 2000; Paterson, 2007; Elisashvili et al., 2009). Like other white rot basidiomycetes, Ganoderma species are capable of selective delignification of wood leaving white cellulose exposed. Ganoderma species are capable to produce hemicellulase, ligninase and amylase. The lignin-degrading enzymes consist of lignin peroxidase, manganese peroxidase and laccase. They gain energy from carbohydrates such as cellulose, starch and pectin (Leonowicz et al., 1999; Paterson et al., 2000; Paterson, 2007).
Although the genus Ganoderma, a mushroom-like fungus is an economically important plant pathogen; some of these species have been used in traditional Asian medicines (Seo and Kirk, 2000) and for industrial applications such as biopulping (Mendonca et al., 2008), bioremediation (Rigas et al., 2007), bioconversion (Elisashvili et al., 2009), waste water treatment and development of animal food sources from lignocellulose (Adaskaveg et al., 1991).
Growth and development of fungi in vitro depend on successful cultivation that satisfies their nutritional requirement. Although it is relatively easy to culture fungi on complex synthetic media such as malt extract agar (MEA) or potato dextrose agar (PDA) but they can also be grown on different special substrates depending on the main provincial availability (Walker and White, 2005). Undoubtedly, many factors including type of fungi, age of the culture and composition of the medium, as well as chemical, physical and environmental factors play pivotal roles in mycelial growth rates of fungi (Kalm and Kalyoncu, 2008).
The accumulation of industrial wood wastes and the efficient capture of their bioconversion potential are widespread concerns. Industrial wood wastes from wood processing constitute vast available renewable energy resource. The structural components of industrial wood wastes are suitable for bioproduct development (Van Wyk, 2001). Several lines of study demonstrate that wood blocks from rubber (Hevea brasiliensis) tree and sawdust provide a suitable growth environment for Ganoderma species (Sariah et al., 1994; Susanto et al., 2005).
Studying the genotypic and phenotypic diversity and the dynamics of pathogen populations can be achieved
Alizadeh et al. 3773 by recovery and isolation of plant pathogens (Amiri et al., 2009). However, the most obvious consequence of culture media contamination is the presence of bacterial, yeast, and several other fungal contaminants which can make such efforts difficult. Isolation of Ganoderma species is difficult due to the presence of bacterial, yeast, and several fast-growing fungal species. It can take at least seven days to obtain a result using commercial media. The nature of a particular culture medium has a major role to play in the growth of fungi (Zhao and Shamoun, 2006). For this reason, it is possible to develop a substantial number of alternative rapid culture media to produce results more quickly for various biotechnological applications.
The overall objective of this study was to improve culture media for Ganoderma species in order to find a medium that would allow for rapid colony growth. For this purpose, the influence of industrial wood waste on growth rate of Ganoderma isolates was investigated by studying the mycelial growth area, relative density and relative growth rate of colony. We selected rubber and oil palm wood powder as the major substance in the media because they are the most abundant industrial wood waste in Malaysia. MATERIALS AND METHODS
Experimental design and statistical analysis
The two-factorial experiment of eight Ganoderma (G) isolates and 14 culture media (M) was conducted in which the replications were nested within each G × M combination. The statistical analysis that is the analysis of variance (ANOVA) was performed by the following liner additive model (LAM):
wherein Yijk = ijkth
observations; αi = ith Ganoderma effects; βj = jth media effects; (αβ)ij = ijth G× M interactions effects; and εijk = ijkth
error term.
In the above LAM, εijk was the pooled error term of experimental and sampling errors. The experimental error was the biological replicate nested to G× M combinations, while the sampling error was the software readings nested within biological replicate × G × M. The protected least-significant difference (LSD) test was used
for multiple mean comparisons. Statistical analysis was performed using SAS software (version 9.1; SAS Institute Inc.). All experi-ments were repeated two times to compensate for possible errors. As the results of analysis obtained in the second repeat were the same as the first, results were only shown for the data of the first experiment. Fungi and culture media preparation
Isolates of G. subamboinense var. laevisporium (ATCC 52419), G.
boninense PER 71, G. zonatum POR 67, G. zonatum POR 69, G. miniatocinctum 331035, G. miniatocinctum 331037, G. tornatum POR 54 and G. tornatum POR 57 were obtained from the culture collection of Malaysian Palm Oil Board (MPOB) and Mycology Laboratory, Biology Department, Faculty of Science, Universiti Putra Malaysia.
The culture media compositions used in this study are presented in Table 1. The wood powder (WP, 20 mesh); from either rubber (H.

3774 Afr. J. Microbiol. Res.
Table 1. Candidate culture media.
Annotation culture media*
pH
RWEA 3.5
OPWEA 3.5
PDA-P-RWP 3.5
PDA-P-OPWP 3.5
PDA-RWP 3.5
PDA-OPWP 3.5
MEA-P-RWP 4.7
MEA-P-OPWP 4.7
MEA-RWP 4.7
MEA-OPWP 4.7
PDA-P 3.5
PDA 3.5
MEA-P 4.7
MEA 4.7
*R, rubber; WEA, wood extract agar; OP, oil palm; P,
peptone; WP, wood powder; PDA, potato dextrose agar; MEA, malt extract agar.
brasiliensis) or oil palm (E. guineensis Jacq.) wood used as industrial wood waste was obtained from Huot Hing Factory in Semenyih, Selangor, Malaysia. The ingredients for novel culture
media, oil palm/rubber wood extract agar (OP/RWEA) were 500 mL WP extract, 30 g Bacto™ malt extract, 5 g dextrose, 5 g peptone, 0.25 g KH2PO4 and 15 g agar made up to 1 L volume with distilled water. For WP extract, 65 g of WP was infused in 1 L of tap water and autoclaved at 121°C for 25 min. The WP extract was filtered through cotton and filter paper (no. 42, Whatman). PDA (Difco Laboratories, Detroit, Michigan, USA) and MEA (Difco Laboratories, Detroit, Michigan, USA) were made according to the manufacturer’s directions. The basal culture media PDA and MEA were
supplemented with 5 g/L of peptone or 20 g/L
WP or both peptone
and WP. The culture media were amended with streptomycin sulfate (100 mg/L).
Inoculum preparation
Ganoderma isolates were cultivated in freshly made culture media for three days and used as inoculum. Inoculum for different culture
media was provided from identical (Table 1) media. 5 mm diameter mycelial discs were aseptically transferred upside-down from the periphery of each Ganoderma colony to the centre of a 90 mm Petri plates containing 25 mL of medium. The Petri plates were wrapped in aluminum foil and incubated in a plastic bag at 28°C. Ganoderma inoculum plated on Ganoderma selective medium (GSM) and mycelia morphology observed under a light microscope was used to confirm the identity of Ganoderma. All experiments were
performed two times with five independent replicates to compensate for possible errors.
Image acquisition and determination of growth profile
Growth profiles of Ganoderma isolates were estimated by image analysis using UTHSCSA ImageTool software 3.0 (http://ddsdx.uthscsa.edu/dig/itdesc.html). The growth of Ganoderma isolates colony was daily photographed with a digital camera at zero time until the colony covered the entire area of Petri plate. The colonies were photographed under similar condition
(position of camera, distance, background and light) by Canon digital camera (model power shot SD1000/Digital ELPH/Digital IXUS70). Images were expressed in gray-scale and objects were found manually. Each image was threshold manually.
The relative density of colony was determined. The optical density step tablet standard was used to generate calibration of gray-scale values according to the UTHSCSA ImageTool manufacturer’s instruction. At least three replicate were performed for each colony.
The relative growth rate (RGR) of Ganoderma isolates was determined using standard formula (Sundari and Adholeya, 2003):
Where, At is the area of the colony at time t; A0 is the area of the colony at zero time and t is the time period. Identification of differential relative growth rate was based on consistent fold change across experimental replicates relative to commercial media, PDA and MEA. Fold changes of ≥2-fold or ≤0.5-fold were considered as significant.
RESULTS Mycelial growth area, relative density and relative growth rate of Ganoderma colony was analyzed on various culture media. Different culture media had a significant effect on Ganoderma isolates. The interaction of Ganoderma isolates × culture media was significant (p≤0.0001) for all Ganoderma isolates because of the different mycelial growth area, relative density and relative growth rate of Ganoderma colony on various culture media.
Mycelial growth area of Ganoderma isolates Mycelial growth area of colonies on various culture media demonstrated that the growth of Ganoderma isolates was significantly different in gray-scale display and their levels are influenced by wood powder (Figure 1 and Supplementary Table 1). The mycelial growth area of Ganoderma isolates on media supplemented with rubber WP was higher than those growing on oil palm WP containing media. The results of mycelial growth area of different Ganoderma isolates were in the order of G. boninense PER 71> G. tornatum POR 57> G. zonatum POR 69> G. subamboinense var. laevisporium (ATCC 52419)> G. miniatocinctum 331035> G. miniatocinctum 331037> G. zonatum POR 67> G. tornatum POR 54 on R/OPWEA and PDA-P-R/OPWP at four days post-inoculation (dpi). Our results demonstrate that the pattern of mycelial growth area of colonies was different in G. tornatum and G. zonatum species on various culture media. G. tornatum POR 57 and G. zonatum POR 69 isolates presented high mycelial growth area than G. tornatum POR 54 and G. zonatum POR 67 isolates. The G. miniatocinctum species showed similar mycelial growth area of colonies on various culture media. G. boninense PER 71, G. tornatum POR 57, G. zonatum
Alizadeh et al. 3775
0
10
20
30
40
50
60
0 1 2 3 4 5 6 7 8 9
Myceli
al
gro
wth
area (
mm
2)
Days postinoculation (dpi)
G. subamboinense var. laevisporium (ATCC 52419)
RWEA
OPWEA
PDA-P-RWP
PDA-P-OPWP
PDA-RWP
PDA-OPWP
MEA-P-RWP
MEA-P-OPWP
MEA-RWP
MEA-OPWP
PDA-P
PDA
MEA-P
MEA
0
10
20
30
40
50
60
0 1 2 3 4 5 6 7 8 9
Myceli
al
gro
wth
area (
mm
2)
Days postinoculation (dpi)
G. boninense PER 71RWEA
OPWEA
PDA-P-RWP
PDA-P-OPWP
PDA-RWP
PDA-OPWP
MEA-P-RWP
MEA-P-OPWP
MEA-RWP
MEA-OPWP
PDA-P
PDA
MEA-P
MEA
0
10
20
30
40
50
60
0 1 2 3 4 5 6 7 8 9
Myceli
al
gro
wth
area (
mm
2)
Days postinoculation (dpi)
G. zonatum POR 67RWEA
OPWEA
PDA-P-RWP
PDA-P-OPWP
PDA-RWP
PDA-OPWP
MEA-P-RWP
MEA-P-OPWP
MEA-RWP
MEA-OPWP
PDA-P
PDA
MEA-P
MEA
0
10
20
30
40
50
60
0 1 2 3 4 5 6 7 8 9
Myceli
al
gro
wth
area (
mm
2)
Days postinoculation (dpi)
G. zonatum POR 69
RWEA
OPWEA
PDA-P-RWP
PDA-P-OPWP
PDA-RWP
PDA-OPWP
MEA-P-RWP
MEA-P-OPWP
MEA-RWP
MEA-OPWP
PDA-P
PDA
MEA-P
MEA
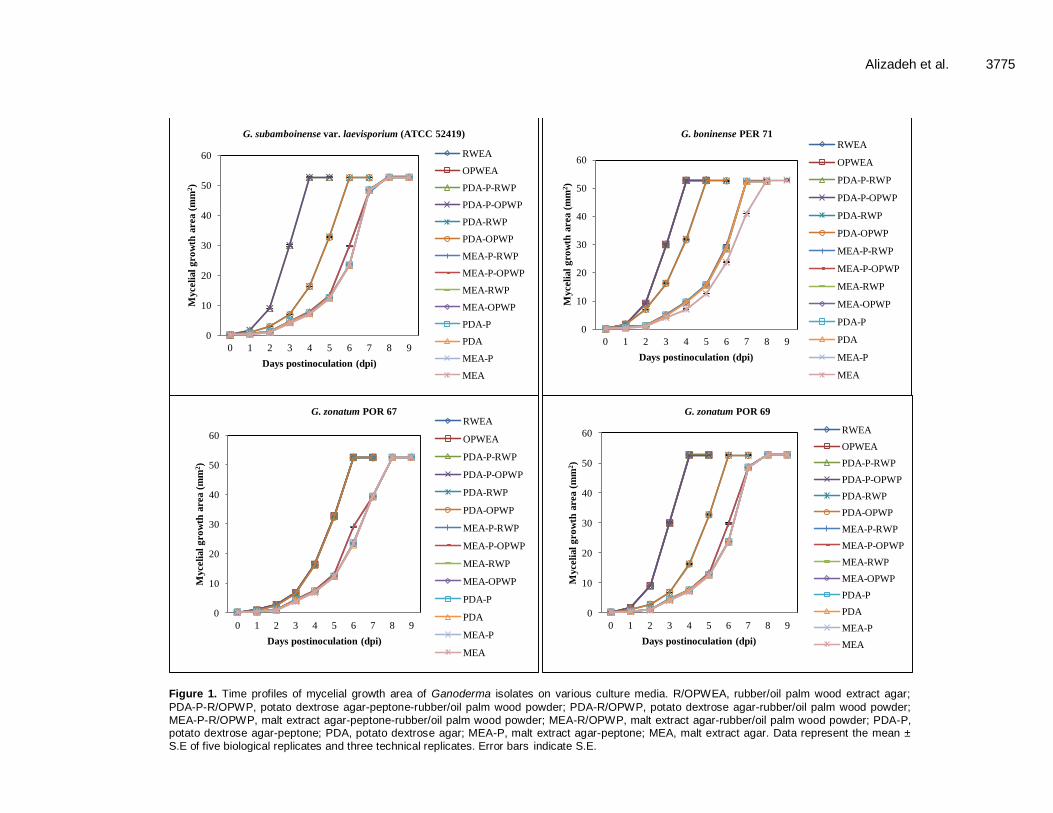
Figure 1. Time profiles of mycelial growth area of Ganoderma isolates on various culture media. R/OPWEA, rubber/oil palm wood extract agar;
PDA-P-R/OPWP, potato dextrose agar-peptone-rubber/oil palm wood powder; PDA-R/OPWP, potato dextrose agar-rubber/oil palm wood powder; MEA-P-R/OPWP, malt extract agar-peptone-rubber/oil palm wood powder; MEA-R/OPWP, malt extract agar-rubber/oil palm wood powder; PDA-P, potato dextrose agar-peptone; PDA, potato dextrose agar; MEA-P, malt extract agar-peptone; MEA, malt extract agar. Data represent the mean ± S.E of five biological replicates and three technical replicates. Error bars indicate S.E.

3776 Afr. J. Microbiol. Res.
0
10
20
30
40
50
60
0 1 2 3 4 5 6 7 8 9
Myceli
al
gro
wth
area (
mm
2)
Days postinoculation (dpi)
G. miniatocinctum 331035
RWEA
OPWEA
PDA-P-RWP
PDA-P-OPWP
PDA-RWP
PDA-OPWP
MEA-P-RWP
MEA-P-OPWP
MEA-RWP
MEA-OPWP
PDA-P
PDA
MEA-P
MEA
0
10
20
30
40
50
60
0 1 2 3 4 5 6 7 8 9
Myceli
al
gro
wth
area (
mm
2)
Days postinoculation (dpi)
G. miniatocinctum 331037
RWEA
OPWEA
PDA-P-RWP
PDA-P-OPWP
PDA-RWP
PDA-OPWP
MEA-P-RWP
MEA-P-OPWP
MEA-RWP
MEA-OPWP
PDA-P
PDA
MEA-P
MEA
0
10
20
30
40
50
60
0 1 2 3 4 5 6 7 8 9 10 11 12 13
Myceli
al
gro
wth
area (
mm
2)
Days postinoculation (dpi)
G. tornatum POR 54
RWEA
OPWEA
PDA-P-RWP
PDA-P-OPWP
PDA-RWP
PDA-OPWP
MEA-P-RWP
MEA-P-OPWP
MEA-RWP
MEA-OPWP
PDA-P
PDA
MEA-P
MEA
0
10
20
30
40
50
60
0 1 2 3 4 5 6 7 8 9
Myceli
al
gro
wth
area (
mm
2)
Days postinoculation (dpi)
G. tornatum POR 57
RWEA
OPWEA
PDA-P-RWP
PDA-P-OPWP
PDA-RWP
PDA-OPWP
MEA-P-RWP
MEA-P-OPWP
MEA-RWP
MEA-OPWP
PDA-P
PDA
MEA-P
MEA
Figure 1. Contd.
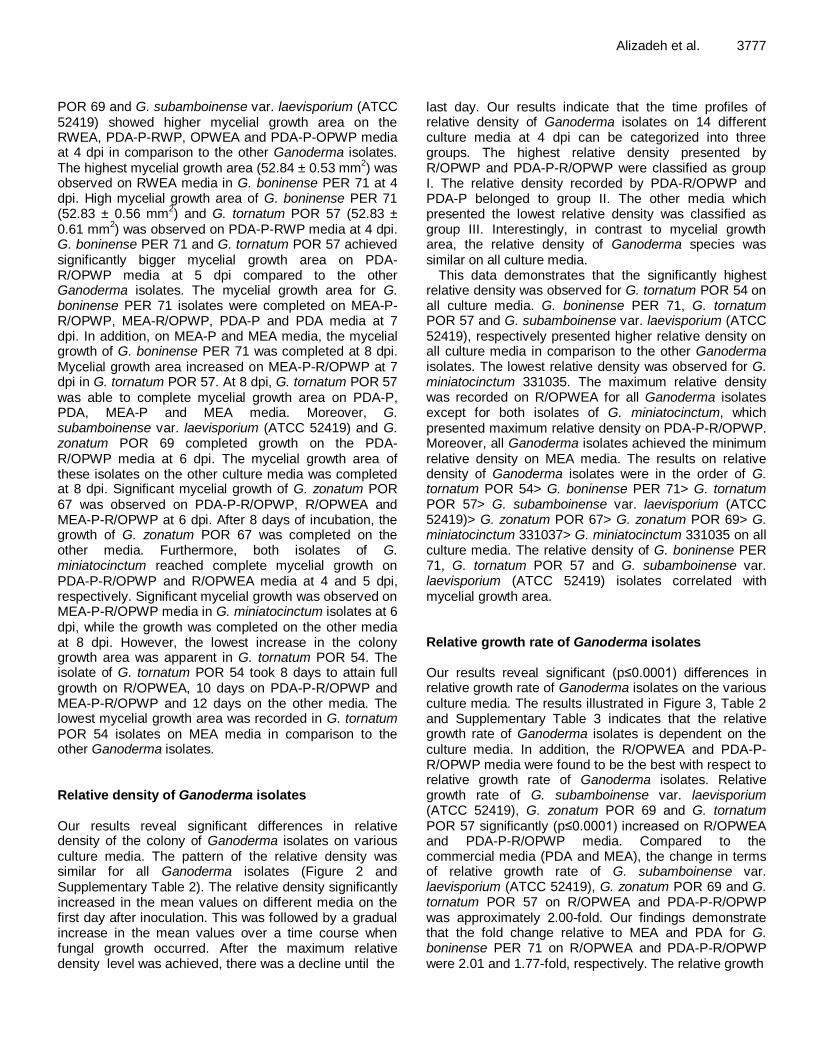
POR 69 and G. subamboinense var. laevisporium (ATCC 52419) showed higher mycelial growth area on the RWEA, PDA-P-RWP, OPWEA and PDA-P-OPWP media at 4 dpi in comparison to the other Ganoderma isolates. The highest mycelial growth area (52.84 ± 0.53 mm
2) was
observed on RWEA media in G. boninense PER 71 at 4 dpi. High mycelial growth area of G. boninense PER 71 (52.83 ± 0.56 mm
2) and G. tornatum POR 57 (52.83 ±
0.61 mm2) was observed on PDA-P-RWP media at 4 dpi.
G. boninense PER 71 and G. tornatum POR 57 achieved significantly bigger mycelial growth area on PDA-R/OPWP media at 5 dpi compared to the other Ganoderma isolates. The mycelial growth area for G. boninense PER 71 isolates were completed on MEA-P-R/OPWP, MEA-R/OPWP, PDA-P and PDA media at 7 dpi. In addition, on MEA-P and MEA media, the mycelial growth of G. boninense PER 71 was completed at 8 dpi. Mycelial growth area increased on MEA-P-R/OPWP at 7 dpi in G. tornatum POR 57. At 8 dpi, G. tornatum POR 57 was able to complete mycelial growth area on PDA-P, PDA, MEA-P and MEA media. Moreover, G. subamboinense var. laevisporium (ATCC 52419) and G. zonatum POR 69 completed growth on the PDA-R/OPWP media at 6 dpi. The mycelial growth area of these isolates on the other culture media was completed at 8 dpi. Significant mycelial growth of G. zonatum POR 67 was observed on PDA-P-R/OPWP, R/OPWEA and MEA-P-R/OPWP at 6 dpi. After 8 days of incubation, the growth of G. zonatum POR 67 was completed on the other media. Furthermore, both isolates of G. miniatocinctum reached complete mycelial growth on PDA-P-R/OPWP and R/OPWEA media at 4 and 5 dpi, respectively. Significant mycelial growth was observed on MEA-P-R/OPWP media in G. miniatocinctum isolates at 6 dpi, while the growth was completed on the other media at 8 dpi. However, the lowest increase in the colony growth area was apparent in G. tornatum POR 54. The isolate of G. tornatum POR 54 took 8 days to attain full growth on R/OPWEA, 10 days on PDA-P-R/OPWP and MEA-P-R/OPWP and 12 days on the other media. The lowest mycelial growth area was recorded in G. tornatum POR 54 isolates on MEA media in comparison to the other Ganoderma isolates. Relative density of Ganoderma isolates Our results reveal significant differences in relative density of the colony of Ganoderma isolates on various culture media. The pattern of the relative density was similar for all Ganoderma isolates (Figure 2 and Supplementary Table 2). The relative density significantly increased in the mean values on different media on the first day after inoculation. This was followed by a gradual increase in the mean values over a time course when fungal growth occurred. After the maximum relative density level was achieved, there was a decline until the
Alizadeh et al. 3777 last day. Our results indicate that the time profiles of relative density of Ganoderma isolates on 14 different culture media at 4 dpi can be categorized into three groups. The highest relative density presented by R/OPWP and PDA-P-R/OPWP were classified as group I. The relative density recorded by PDA-R/OPWP and PDA-P belonged to group II. The other media which presented the lowest relative density was classified as group III. Interestingly, in contrast to mycelial growth area, the relative density of Ganoderma species was similar on all culture media.
This data demonstrates that the significantly highest relative density was observed for G. tornatum POR 54 on all culture media. G. boninense PER 71, G. tornatum POR 57 and G. subamboinense var. laevisporium (ATCC 52419), respectively presented higher relative density on all culture media in comparison to the other Ganoderma isolates. The lowest relative density was observed for G. miniatocinctum 331035. The maximum relative density was recorded on R/OPWEA for all Ganoderma isolates except for both isolates of G. miniatocinctum, which presented maximum relative density on PDA-P-R/OPWP. Moreover, all Ganoderma isolates achieved the minimum relative density on MEA media. The results on relative density of Ganoderma isolates were in the order of G. tornatum POR 54> G. boninense PER 71> G. tornatum POR 57> G. subamboinense var. laevisporium (ATCC 52419)> G. zonatum POR 67> G. zonatum POR 69> G. miniatocinctum 331037> G. miniatocinctum 331035 on all culture media. The relative density of G. boninense PER 71, G. tornatum POR 57 and G. subamboinense var. laevisporium (ATCC 52419) isolates correlated with mycelial growth area. Relative growth rate of Ganoderma isolates Our results reveal significant (p≤0.0001) differences in relative growth rate of Ganoderma isolates on the various culture media. The results illustrated in Figure 3, Table 2 and Supplementary Table 3 indicates that the relative growth rate of Ganoderma isolates is dependent on the culture media. In addition, the R/OPWEA and PDA-P-R/OPWP media were found to be the best with respect to relative growth rate of Ganoderma isolates. Relative growth rate of G. subamboinense var. laevisporium (ATCC 52419), G. zonatum POR 69 and G. tornatum POR 57 significantly (p≤0.0001) increased on R/OPWEA and PDA-P-R/OPWP media. Compared to the commercial media (PDA and MEA), the change in terms of relative growth rate of G. subamboinense var. laevisporium (ATCC 52419), G. zonatum POR 69 and G. tornatum POR 57 on R/OPWEA and PDA-P-R/OPWP was approximately 2.00-fold. Our findings demonstrate that the fold change relative to MEA and PDA for G. boninense PER 71 on R/OPWEA and PDA-P-R/OPWP were 2.01 and 1.77-fold, respectively. The relative growth

3778 Afr. J. Microbiol. Res.
Figure 2
0
10
20
30
40
50
60
0 1 2 3 4 5 6 7 8 9
Rel
ativ
e d
ensi
ty o
f co
lon
y
Days postinoculation (dpi)
G. subamboinense var. laevisporium (ATCC 52419)
RWEA
OPWEA
PDA-P-RWP
PDA-P-OPWP
PDA-RWP
PDA-OPWP
MEA-P-RWP
MEA-P-OPWP
MEA-RWP
MEA-OPWP
PDA-P
PDA
MEA-P
MEA
0
10
20
30
40
50
60
0 1 2 3 4 5 6 7 8 9
Rel
ativ
e d
ensi
ty o
f co
lon
y
Days postinoculation (dpi)
G. boninense PER 71
RWEA
OPWEA
PDA-P-RWP
PDA-P-OPWP
PDA-RWP
PDA-OPWP
MEA-P-RWP
MEA-P-OPWP
MEA-RWP
MEA-OPWP
PDA-P
PDA
MEA-P
MEA
0
10
20
30
40
50
60
0 1 2 3 4 5 6 7 8 9
Rel
ativ
e d
ensi
ty o
f co
lon
y
Days postinoculation (dpi)
G. zonatum POR 67
RWEA
OPWEA
PDA-P-RWP
PDA-P-OPWP
PDA-RWP
PDA-OPWP
MEA-P-RWP
MEA-P-OPWP
MEA-RWP
MEA-OPWP
PDA-P
PDA
MEA-P
MEA
0
10
20
30
40
50
60
0 1 2 3 4 5 6 7 8 9
Rel
ativ
e d
ensi
ty o
f co
lon
y
Days postinoculation (dpi)
G. zonatum POR 69
RWEA
OPWEA
PDA-P-RWP
PDA-P-OPWP
PDA-RWP
PDA-OPWP
MEA-P-RWP
MEA-P-OPWP
MEA-RWP
MEA-OPWP
PDA-P
PDA
MEA-P
MEA
Figure 2. Time profiles of relative density of Ganoderma isolates on various culture media. R/OPWEA, rubber/oil palm wood extract agar; PDA-P-R/OPWP, potato
dextrose agar-peptone-rubber/oil palm wood powder; PDA-R/OPWP, potato dextrose agar-rubber/oil palm wood powder; MEA-P-R/OPWP, malt extract agar-peptone-rubber/oil palm wood powder; MEA-R/OPWP, malt extract agar-rubber/oil palm wood powder; PDA-P, potato dextrose agar-peptone; PDA, potato dextrose agar; MEA-P, malt extract agar-peptone; MEA, malt extract agar. Data represent the mean ± S.E of five biological replicates and three technical replicates. Error bars indicate S.E.

Alizadeh et al. 3779
0
10
20
30
40
50
60
0 1 2 3 4 5 6 7 8 9
Rela
tiv
e d
en
sity
of
co
lon
y
Days postinoculation (dpi)
G. miniatocinctum 331035
RWEA
OPWEA
PDA-P-RWP
PDA-P-OPWP
PDA-RWP
PDA-OPWP
MEA-P-RWP
MEA-P-OPWP
MEA-RWP
MEA-OPWP
PDA-P
PDA
MEA-P
MEA
0
10
20
30
40
50
60
0 1 2 3 4 5 6 7 8 9
Rela
tiv
e d
en
sity
of
co
lon
y
Days postinoculation (dpi)
G. miniatocinctum 331037
RWEA
OPWEA
PDA-P-RWP
PDA-P-OPWP
PDA-RWP
PDA-OPWP
MEA-P-RWP
MEA-P-OPWP
MEA-RWP
MEA-OPWP
PDA-P
PDA
MEA-P
MEA
0
10
20
30
40
50
60
0 1 2 3 4 5 6 7 8 9 10 11 12 13
Rela
tiv
e d
en
sity
of
co
lon
y
Days postinoculation (dpi)
G. tornatum POR 54
RWEA
OPWEA
PDA-P-RWP
PDA-P-OPWP
PDA-RWP
PDA-OPWP
MEA-P-RWP
MEA-P-OPWP
MEA-RWP
MEA-OPWP
PDA-P
PDA
MEA-P
MEA
0
10
20
30
40
50
60
0 1 2 3 4 5 6 7 8 9
Rela
tiv
e d
en
sity
of
co
lon
y
Days postinoculation (dpi)
G. tornatum POR 57
RWEA
OPWEA
PDA-P-RWP
PDA-P-OPWP
PDA-RWP
PDA-OPWP
MEA-P-RWP
MEA-P-OPWP
MEA-RWP
MEA-OPWP
PDA-P
PDA
MEA-P
MEA
Figure 2. Contd.

3780 Afr. J. Microbiol. Res.
a a a a
b b
a a a a
c c c c c c c c d d d c d d
b b
e e
a a a a a a
b b b b b b b b
a a a a
b b
c c c c c c c c
Figure 3. Relative growth rate of Ganoderma isolates on various culture media. Data represent the mean ± S.E of five biological
replicates and three technical replicates and two times repeat. Error bars indicate S.E. Means with different letters indicate statistically significant differences at p ≤ 0.0001 for each Ganoderma isolate.

Alizadeh et al. 3781
a a
b b
c c
d d d d d d d d d d d d d d d d
a a
b b
c c
a a
b b b b c c c c c c c c
a a a a
b b
c c d d d d d d
Figure 3. Contd.
rate of G. zonatum POR 67 did not significantly increase on different culture media. The relative growth rate of G. zonatum POR 67 achieved approximately 1.33-fold increase in the mean values on R/OPWEA, PDA-P-
R/OPWP and PDA-R/OPWP media. In the case of G. miniatocinctum isolates, the relative growth rate significantly (p≤0.0001) increased by 2.00-fold on PDA-P-R/OPWP. G. tornatum POR 54 did not show a significant

3782 Afr. J. Microbiol. Res.
Table 2. Comparison of relative growth rate of Ganoderma isolates based on consistent fold change across experimental replicates relative to commercial media, PDA and MEA.
Ganoderma isolates /cultures media
Mean/fold change
G. subamboniase var. laevisoporum
(ATCC52419)
G. boninense PER 71
G. zonatum POR 67
G. zonatum POR 69
G. miniatocinctum
331035
G. miniatocinctum
331037
G. tornatum POR 54
G. tornatum POR 57
RWEA
Mean RGR/d 67.09 ± 0.47 67.49 ± 0.68 44.62 ± 0.40 67.32 ± 0.64 53.56 ± 0.26 53.52 ± 0.49 33.59 ± 0.39 67.33 ± 0.81
Fold change to PDA
2.00 ± 0.02* 1.78 ± 0.02 1.34 ± 0.01 2.01 ± 0.04* 1.60 ± 0.03 1.60 ± 0.02 1.51 ± 0.01 2.00 ± 0.06*
Fold change to MEA
2.00 ± 0.03* 2.01 ± 0.04* 1.34 ± 0.02 2.01 ± 0.04* 1.60 ± 0.02 1.60 ± 0.02 1.51 ± 0.02 2.01 ± 0.03*
OPWEA
Mean RGR/d 66.96 ± 1.02 67.31 ± 0.61 44.57 ± 0.34 67.09 ± 0.79 53.51 ± 0.37 53.56 ± 0.78 33.56 ± 0.24 67.03 ± 0.79
Fold change to PDA
2.00 ± 0.05* 1.77 ± 0.03 1.33 ± 0.02 2.00 ± 0.04* 1.60 ± 0.03 1.60 ± 0.02 1.51 ± 0.02 2.00 ± 0.04*
Fold change to MEA
2.00 ± 0.04* 2.00 ± 0.02* 1.33 ± 0.01 2.00 ± 0.03* 1.60 ± 0.02 1.60 ± 0.02 1.51 ± 0.01 2.00 ± 0.03*
PDA-P-RWP
Mean RGR/d 67.05 ± 0.63 67.49 ± 0.70 44.57 ± 0.19 67.30 ± 0.25 67.21 ± 0.73 67.27 ± 1.42 26.84 ± 0.20 67.31 ± 0.90
Fold change to PDA
2.00 ± 0.03* 1.77 ± 0.02 1.33 ± 0.01 2.01 ± 0.04* 2.00 ± 0.04* 2.01 ± 0.02* 1.21 ± 0.01 2.00 ± 0.06*
Fold change to MEA
2.00 ± 0.04* 2.01 ± 0.02* 1.33 ± 0.01 2.01 ± 0.03* 2.01 ± 0.03* 2.01 ± 0.05* 1.21 ± 0.02 2.01 ± 0.04*
PDA-P-OPWP
Mean RGR/d 66.92 ± 0.54 67.23 ± 1.07 44.58 ± 0.42 67.07 ± 0.43 67.06 ± 0.37 67.01 ± 0.80 26.85 ± 0.27 67.17 ± 1.31
Fold change to PDA
2.00 ± 0.02* 1.77 ± 0.04 1.33 ± 0.02 2.00 ± 0.03* 2.00 ± 0.04* 2.00 ± 0.02* 1.21 ± 0.01 2.00 ± 0.07*
Fold change to MEA
2.00 ± 0.03* 2.00 ± 0.04* 1.33 ± 0.01 2.00 ± 0.03* 2.01 ± 0.01* 2.00 ± 0.02* 1.21 ± 0.02 2.01 ± 0.05*
PDA-RWP
Mean RGR/d 44.68 ± 0.25 53.29 ± 0.48 44.44 ± 0.66 44.52 ± 0.46 44.47 ± 0.34 44.50 ± 0.37 26.79 ± 0.27 53.44 ± 0.65
Fold change to PDA
1.33 ± 0.02 1.40 ± 0.02 1.33 ± 0.02 1.33 ± 0.02 1.33 ± 0.01 1.33 ± 0.02 1.20 ± 0.02 1.60 ± 0.03
Fold change to MEA
1.33 ± 0.02 1.60 ± 0.01 1.33 ± 0.01 1.33 ± 0.01 1.33 ± 0.01 1.33 ± 0.01 1.20 ± 0.02 1.60 ± 0.02
PDA-OPWP
Mean RGR/d 44.61 ± 0.33 53.38 ± 0.97 44.40 ± 0.52 44.41 ± 0.59 44.43 ± 0.42 44.51 ± 0.51 26.74 ± 0.21 53.30 ± 0.80
Fold change to PDA
1.33 ± 0.02 1.40 ± 0.03 1.33 ± 0.01 1.33 ± 0.01 1.33 ± 0.02 1.33 ± 0.03 1.20 ± 0.01 1.60 ± 0.02
Fold change to MEA
1.33 ± 0.02 1.60 ± 0.04 1.33 ± 0.02 1.33 ± 0.03 1.33 ± 0.01 1.33 ± 0.01 1.20 ± 0.01 1.60 ± 0.03
MEA-P-RWP
Mean RGR/d 33.56 ± 0.49 38.16 ± 0.73 33.44 ± 0.41 33.53 ± 0.80 33.49 ± 0.34 33.49 ± 0.44 22.32 ± 0.21 38.13 ± 0.76
Fold change to PDA
1.00 ± 0.02 1.00 ± 0.02 1.00 ± 0.01 1.00 ± 0.02 1.00 ± 0.02 1.00 ± 0.02 1.00 ± 0.02 1.13 ± 0.02
Fold change to MEA
1.00 ± 0.03 1.14 ± 0.03 1.00 ± 0.01 1.00 ± 0.04 1.00 ± 0.02 1.00 ± 0.02 1.00 ± 0.02 1.14 ± 0.01

Alizadeh et al. 3783 Table 2 Contd.
MEA-P-OPWP
Mean RGR/d 33.58 ± 0.29 38.15 ± 0.39 33.47 ± 0.13 33.51 ± 0.37 33.52 ± 0.29 33.50 ± 0.24 22.33 ± 0.28 38.11 ± 0.42
Fold change to PDA
1.00 ± 0.02 1.00 ± 0.02 1.00 ± 0.01 1.00 ± 0.02 1.00 ± 0.02 1.00 ± 0.01 1.00 ± 0.01 1.13 ± 0.02
Fold change to MEA
1.00 ± 0.01 1.14 ± 0.02 1.00 ± 0.01 1.00 ± 0.01 1.00 ± 0.01 1.00 ± 0.01 1.00 ± 0.03 1.13 ± 0.01
MEA-RWP
Mean RGR/d 33.53 ± 0.39 38.06 ± 0.64 33.43 ± 0.43 33.53 ± 0.32 33.48 ± 0.57 33.48 ± 0.55 22.29 ± 0.38 33.57 ± 0.53
Fold change to PDA
1.00 ± 0.02 1.00 ± 0.03 1.00 ± 0.01 1.00 ± 0.01 1.00 ± 0.02 1.00 ± 0.02 1.00 ± 0.01 1.00 ± 0.03
Fold change to MEA
1.00 ± 0.02 1.14 ± 0.02 1.00 ± 0.01 1.00 ± 0.01 1.00 ± 0.01 1.00 ± 0.02 1.00 ± 0.01 1.00 ± 0.01
MEA-OPWP
Mean RGR/d 33.54 ± 0.42 38.93 ± 2.44 33.44 ± 0.25 33.57 ± 0.43 33.48 ± 0.40 33.45 ± 0.68 22.30 ± 0.17 33.56 ± 0.57
Fold change to PDA
1.00 ± 0.01 1.00 ± 0.06 1.00 ± 0.01 1.00 ± 0.01 1.00 ± 0.02 1.00 ± 0.03 1.00 ± 0.01 1.00 ± 0.02
Fold change to MEA
1.00 ± 0.01 1.17 ± 0.06 1.00 ± 0.01 1.00 ± 0.01 1.00 ± 0.01 1.00 ± 0.02 1.00 ± 0.02 1.00 ± 0.02
PDA-P
Mean RGR/d 33.53 ± 0.34 38.02 ± 0.50 33.43 ± 0.39 33.52 ± 0.67 33.49 ± 0.41 33.47 ± 0.38 22.29 ± 0.27 33.59 ± 0.69
Fold change to PDA
1.00 ± 0.01 1.00 ± 0.02 1.00 ± 0.01 1.00 ± 0.01 1.00 ± 0.02 1.00 ± 0.02 1.00 ± 0.01 1.00 ± 0.01
Fold change to MEA
1.00 ± 0.01 1.14 ± 0.02 1.00 ± 0.01 1.00 ± 0.01 1.00 ± 0.01 1.00 ± 0.01 1.00 ± 0.02 1.00 ± 0.02
PDA
Mean RGR/d 33.5 ± 0.34 37.99 ± 0.39 33.41 ± 0.30 33.51 ± 0.51 33.46 ± 0.54 33.48 ± 0.48 22.27 ± 0.21 33.59 ± 0.62
Fold change to PDA
1.00 ± 0.00 1.00 ± 0.00 1.00 ± 0.00 1.00 ± 0.00 1.00 ± 0.00 1.00 ± 0.00 1.00 ± 0.00 1.00 ± 0.00
Fold change to MEA
1.00 ± 0.01 1.14 ± 0.02 1.00 ± 0.01 1.00 ± 0.02 1.00 ± 0.02 1.00 ± 0.02 1.00 ± 0.02 1.00 ± 0.02
MEA-P
Mean RGR/d 33.49 ± 0.34 33.53 ± 1.09 33.41 ± 0.54 33.38 ± 0.58 33.44 ± 0.42 33.43 ± 0.40 22.27 ± 0.40 33.51 ± 0.34
Fold change to PDA
1.00 ± 0.02 0.88 ± 0.03 1.00 ± 0.01 1.00 ± 0.02 1.00 ± 0.02 1.00 ± 0.02 1.00 ± 0.02 1.00 ± 0.02
Fold change to MEA
1.00 ± 0.02 1.00 ± 0.03 1.00 ± 0.02 1.00 ± 0.02 1.00 ± 0.01 1.00 ± 0.01 1.00 ± 0.03 1.00 ± 0.01
MEA
Mean RGR/d 33.49 ± 0.39 33.51 ± 0.33 33.41 ± 0.21 33.47 ± 0.44 33.44 ± 0.24 33.40 ± 0.22 22.27 ± 0.21 33.50 ± 0.21
Fold change to PDA
1.00 ± 0.01 0.88 ± 0.02 1.00 ± 0.01 1.00 ± 0.02 1.00 ± 0.02 1.00 ± 0.02 1.00 ± 0.02 1.00 ± 0.02
Fold change to MEA
1.00 ± 0.00 1.00 ± 0.00 1.00 ± 0.00 1.00 ± 0.00 1.00 ± 0.00 1.00 ± 0.00 1.00 ± 0.00 1.00 ± 0.00
RGR/d, relative growth rate/day; R/OPWEA, rubber/oil palm wood extract agar; PDA-P-R/OPWP, potato dextrose agar-peptone- rubber/oil palm wood powder; PDA-R/OPWP, potato dextrose agar-rubber/oil palm wood powder; MEA-P-R/OPWP, malt extract agar-peptone-rubber/oil palm wood powder; MEA-R/OPWP, malt extract agar-rubber/oil palm wood powder; PDA-P, potato dextrose agar-peptone; PDA, potato dextrose agar; MEA-P, malt extract agar-peptone; MEA, malt extract agar. Data represent the mean ± S.E of five biological replicates and three technical replicates.
*,Significant relative growth rate compared to commercial media.

3784 Afr. J. Microbiol. Res. increase of relative growth rate on the various culture media. Furthermore, relative growth rate of G. tornatum POR 54 demonstrates 1.51- and 1.21-fold increase on R/OPWEA and PDA-P-R/OPWP media, respectively. DISCUSSION A typical growth rate of the Ganoderma isolates is dependent on the media composition and modified by other environmental factors. Mycelial growth of the fungi was found to be strongly influenced by the different complex media (Walker and White, 2005; Kalm and Kalyoncu, 2008). In this study, we succeeded to optimize a novel culture media with industrial wood waste and improved commercial synthetic media in our efforts to identify the best culture media for rapid colony growth of Ganoderma isolates.
Data from our analyses indicate that growth rate of Ganoderma is dependent on isolates as well as culture media. In this study, it was observed that the different Ganoderma isolates could grow rapidly on four out of the 14 culture media. The R/OPWEA and PDA-P-R/OPWP culture media favoured growth of the Ganoderma iso-lates. A relatively high level of growth was achieved on R/OPWEA media. MEA and MEA supplemented with peptone were poor media, resulting in low mycelial growth for all Ganoderma isolates. Studies with different fungi on agar surface demonstrated that the nutrient com-position in culture media influenced the growth rate of fungi (Xiao and Sitton, 2004).
Growth requirements for fungi include carbon and nitrogen sources, vitamins, minerals, air and water (Booth, 1971). The R/OPWEA culture media contains several carbon sources such as dextrose, WP (cellulose, hemicelluloses and lignin) and malt extract. Protein is the most abundant source of nitrogen from wood (Venables and Watkinson, 1989). The culture media supplemented with WP and peptone demonstrated high level of growth rate for all Ganoderma isolates. Increase in the growth rate of Ganoderma species is related to hydrolytic and oxidative enzymes produced by Ganoderma (Leonowicz et al., 1999; Paterson, 2007; Elissetche et al., 2007). The ability of the Ganoderma species to degrade a wide variety of carbon compounds has been reported. The wood-degrading organisms secrete a large quantity of cellulase and hemicellulase complexes. Several lines of evidence documented that the lignin degrading enzymes are essential for the fungal survival which employs an oxidative process (Adaskaveg et al., 1991; Paterson, 2007; Rigas et al., 2007). Malt extracts are of high nutritional value with notable amounts of several of the vitamin B complexes, minerals and amino acids. The R/OPWEA cultures media also contains peptone and KH2PO4 as nitrogen and phosphorus source, respec-tively. The genus Ganoderma needs inorganic nutrients such as nitrogen and phosphorus to support cell growth
(Rigas et al., 2007). An invading fungal pathogen will encounter a range of different forms of nitrogen in the apoplast and symplast of the plant tissue, ranging from inorganic N like nitrate through to organic N like glutamine (Walters and Bingham, 2007). Nitrogen is accumulated in the basidiomycete mycelium as free amino acids and an ethanol-insoluble protein fraction yielding amino acids on hydrolysis (Wadekar et al., 1995). Peptone seems to enhance the density of Ganoderma isolates. Recent findings demonstrate that the supplementation of media with additional nitrogen source in some cases significantly affected the extra-cellular enzyme yield in Ganoderma species (Elisashvili et al., 2008). Wood-decaying basidiomycetes are able to regulate proteinase activity. The proteinase activity is part of the physiological processes of morpho-genesis, because of the close relationship between fungal nutrition and morphogenesis. The composition and spatial arrangement of the nutrient substrate affects not only the rate of growth of the colony but also the differen-tiation of structures such as mycelial strands (Wadekar et al., 1995). In this study, the culture media supplemented with rubber wood was found to exhibit higher growth rate of Ganoderma isolates than media supplemented with oil palm wood. The better growth may be related to the chemical composition of rubber wood compared to oil palm wood (Simatupang et al., 1994; Ratnasingam et al., 2008; Chin et al., 2010).
Our results demonstrate that growth rate of different Ganoderma isolates were significantly different on various culture media. These results indicate that G. boninense PER 71, G. tornatum POR 57 and G. subamboinense var. laevisporium (ATCC 52419) pre-sented higher mycelial growth area, relative density and relative growth rate of colonies on different culture media. The G. boninense PER 71 showed the fastest growth on media, while the minimum growth was achieved by G. tornatum POR 54. Ganoderma metabolite mixtures may have a role in growth rate, which is essential for the fungal survival (Paterson, 2007; Rigas et al., 2007). The production of extracellular enzymes varies in the Ganoderma genus and depends on substrate type and culture conditions (Teerapatsakul et al., 2007; Elisashvili et al., 2008). The rapid growth of Ganoderma isolates using wood improved culture media would facilitate signi-ficantly the studies on white rot fungi action on woody materials.
Here we report a novel, rapid and less expensive culture media, which may also have commercial poten-tial. The results suggest that industrial wood waste with supplements on N and P is sufficient to improve mycelial growth rate of Ganoderma isolates. The Indus-trial wood waste could be a useful renewable source for enhance-ment of mycelial growth for the early detection of Ganoderma disease to reduce economic losses in oil palm. This culture media may be useful to isolate Ganoderma species for biotechnological applications.

REFERENCES Adaskaveg JE, Blanchetter A, Gilbertsorn L (1991). Decay of date palm
wood by white-rot and brown-rot fungi. Can. J. Bot. 69:615-629. Amiri A, Holb IJ, Schnabel G (2009). A new selective medium for the
recovery and enumeration of Monilinia fructicola, M. fructigena, and
M. laxa from stone fruits. Phytopathology 99:1199-1208.
Arora DS, Gill PK (2000). Laccase production by some white rot fungi under different nutritional conditions. Bioresour Technol. 73:283-285.
Booth C (1971). Fungal culture media. Booth C. Methods in Microbiology. London and New York: Academic Press. pp. 49-94.
Chin KL, Hng PS, Wong LJ, Tey BT, Paridah MT ( 2010). Optimization
study of ethanolic fermentation from oil palm trunk, rubberwood and mixed hard wood hydrolysates using Saccharomyces cerevisiae.
Bioresour Technol. 101:3287-3291.
Elisashvili V, Kachlishvili E, Penninckx M (2008). Effect of growth substrate, method of fermentation, and nitrogen source on lignocellulose-degrading enzymes production by white-rot
basidiomycetes. J. Ind. Microbiol. Biotechnol. 35:1531-1538. Elisashvili V, Kachlishvili E, Tsiklauri N, Metreveli E, Khardziani T,
Agathos SN (2009). Lignocellulose-degrading enzyme production by white-rot Basidiomycetes isolated from the forests of Georgia. World
J. Microbiol. Biotechnol. 25:331-339. Elissetche JP, Ferraz A, Freer J, Rodriguez J (2007). Enzymes
produced by Ganoderma australe growing on wood and in
submerged cultures. World J. Microbiol. Biotechnol. 23:429-434. Ho YW, Nawawi A (1985). Ganoderma boninense Pat. from basal stem
rot of oil palm (Elaeis guineensis) in Peninsular Malaysia. Pertanika
8:425-428. Idris AS, Kushairi A, Ariffin D, Basri MW (2006). Technique for
inoculating oil palm germinated seeds. MPOB TT 321. Kalm E, Kalyoncu F (2008). Mycelial growth rate of some morels
(Morchella spp.) in four different microbiological media. Am. Eurasian
J. Agric. Environ. Sci. 3:861-864. Leonowicz A, Matuszewska A, Luterek J, Ziegenhagen D, Wojtas-
Wasilewska M, Cho NS, Hofrichter M, Rogalski J (1999).
Biodegradation of lignin by white rot fungi. Fungal Genet. Biol. 27:175-185.
Mazliham MS, Loonis P, Idris AS (2007). Towards automatic recognition and grading of Ganoderma infection pattern using fuzzy
systems. Int. J. Biol. Med. Sci. 2:89-94. Mendonca RT, Jara JF, Gonzalez V, Elissetche JP, Freer J (2008).
Evaluation of the white-rot fungi Ganoderma australe and Ceriporiopsis subvermispora in biotechnological applications. J. Ind.
Microbiol. Biotechnol. 35:1323-1330. Paterson RRM (2007). Ganoderma disease of oil palm-a white rot
perspective necessary for integrated control. Crop Prot. 26:1369-1376.
Paterson RRM, Holderness M, Kelley J, Miller R, O’Grady E (2000). In
vitro biodegradation of oil palm stem using macroscopic fungi from
southeast Asia: A preliminary investigation. Flood J, Bridge PD, Holderness M. Ganoderma Diseases of Perennial Crops.
W allingford, UK: CABI Publishing. pp. 129-138. Paterson RRM, Sariah M, Lima N (2009). The feasibility of producing oil
palm with altered lignin content to control Ganoderma disease. J.
Phytopathol. 57:649-656. Pilotti CA (2005). Stem rots of oil palm caused by Ganoderma
boninense: pathogen biology and epidemiology. Mycopathology
159:129-137. Ratnasingam J, Ma TP, Manikam M, Farrokhpayam SR (2008).
Evaluating the machining characteristics of oil palm lumber. Asian J.
Appl. Sci. 1:334-340. Rigas F, Papadopoulou K, Dritsa V, Doulia D (2007). Bioremediation of
a soil contaminated by lindane utilizing the fungus Ganoderma
australe via response surface methodology. J. Hazard Mater.
140:325-332.
Alizadeh et al. 3785 Sariah M, Hussin MZ, Miller RNG, Holderness M (1994). Pathogenicity
of Ganoderma boninense tested by inoculation of oil palm seedlings.
Plant Pathol. 43:507-510.
Seo GS, Kirk PM (2000). Ganodermataceae: nomenclature and classification. Flood J, Bridge PD, Holderness M. Ganoderma
Diseases of Perennial Crops. Wallingford, UK: CABI Publishing. pp.
3-22. Simatupang MH, Schmitt U, Kasim A (1994). Wood extractives of
rubberwood (Hevea Brasiliensis) and their influences on the setting of
the inorganic binder in gypsum-bonded particleboards. J. Trop. For. Sci. 6:269-285.
Sundari SK, Adholeya A (2003). Growth profile of ectomycorrhizal fungal mycelium: emphasis on substrate pH influence. A. van Leeuw.
83:209-214. Susanto A, Sudharto PS, Purba RY (2005). Enhancing biological control
of basal stem rot disease (Ganoderma boninense) in oil palm
plantations. Mycopathology 159:153-157. Teerapatsakul C, Abe N, Bucke C, Kongkathip N, Jareonkitmongkol S,
Chitradon L (2007). Novel laccases of Ganoderma sp. KU-Alk4,
regulated by different glucose concentration in alkaline media. World J. Microbiol. Biotechnol. 23:1559-1567.
Van Wyk JPH (2001). Biotechnology and the utilization of biowaste as a resource for bioproduct development. Trends Biotechnol. 19:172-177.
Venables CE, Watkinson SC (1989). Production and localization of proteinases in colonies of timber-decaying. J. Gen. Microbiol. 135:1369-1374.
Wadekar RV, North MJ, Watkinson SC (1995). Proteolytic activities in two wood-decaying basidiomycete fungi, Serpula lacrymans and Coriolus versicolor. Microbiology 141:1575-1583.
Walker G, White NA (2005). Introduction to fungal physiology. Kavanagh K. Fungi: Biology and Applications. Chichester, UK: John Wiley & Sons. pp.1-34.
Walters DR, Bingham IJ (2007). Influence of nutrition on disease development caused by fungal pathogens: implications for plant disease control. Annals Appl. Biol. 151:307-324.
Xiao CL, Sitton JW (2004). Effects of culture media and environmental factors on mycelia growth and pycnidial production of Potebniamyces pyri. Mycol. Res. 108:926-932.
Zhao S, Shamoun SF (2006). The effects of culture media, solid substraes, and relative humidity on growth, sporulation and conidial discharge of Valdensinia heterodoxa. Mycol. Res. 110:1340-1346.
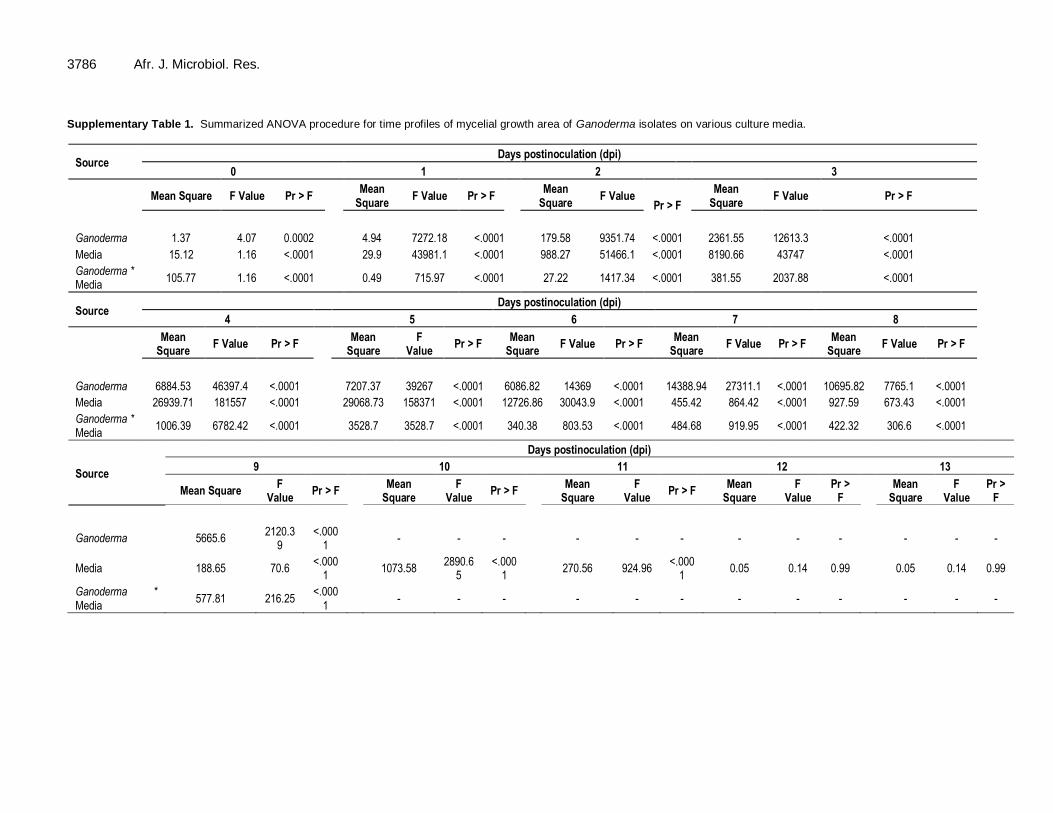
3786 Afr. J. Microbiol. Res. Supplementary Table 1. Summarized ANOVA procedure for time profiles of mycelial growth area of Ganoderma isolates on various culture media.
Source Days postinoculation (dpi)
0 1 2 3
Mean Square F Value Pr > F
Mean Square
F Value Pr > F
Mean Square
F Value Pr > F
Mean Square
F Value Pr > F
Ganoderma 1.37 4.07 0.0002 4.94 7272.18 <.0001 179.58 9351.74 <.0001 2361.55 12613.3 <.0001
Media 15.12 1.16 <.0001 29.9 43981.1 <.0001 988.27 51466.1 <.0001 8190.66 43747 <.0001
Ganoderma * Media
105.77 1.16 <.0001 0.49 715.97 <.0001 27.22 1417.34 <.0001 381.55 2037.88 <.0001
Source Days postinoculation (dpi)
4 5 6 7 8
Mean Square
F Value Pr > F
Mean Square
F Value
Pr > F Mean
Square F Value Pr > F
Mean Square
F Value Pr > F Mean
Square F Value Pr > F
Ganoderma 6884.53 46397.4 <.0001 7207.37 39267 <.0001 6086.82 14369 <.0001 14388.94 27311.1 <.0001 10695.82 7765.1 <.0001
Media 26939.71 181557 <.0001 29068.73 158371 <.0001 12726.86 30043.9 <.0001 455.42 864.42 <.0001 927.59 673.43 <.0001
Ganoderma * Media
1006.39 6782.42 <.0001 3528.7 3528.7 <.0001 340.38 803.53 <.0001 484.68 919.95 <.0001 422.32 306.6 <.0001
Source
Days postinoculation (dpi)
9 10 11 12 13
Mean Square F
Value Pr > F
Mean Square
F Value
Pr > F
Mean Square
F Value
Pr > F Mean
Square F
Value Pr >
F
Mean Square
F Value
Pr > F
Ganoderma 5665.6 2120.3
9 <.000
1 - - - - - - - - - - - -
Media 188.65 70.6 <.000
1 1073.58
2890.65
<.0001
270.56 924.96 <.000
1 0.05 0.14 0.99 0.05 0.14 0.99
Ganoderma * Media
577.81 216.25 <.000
1 - - - - - - - - - - - -
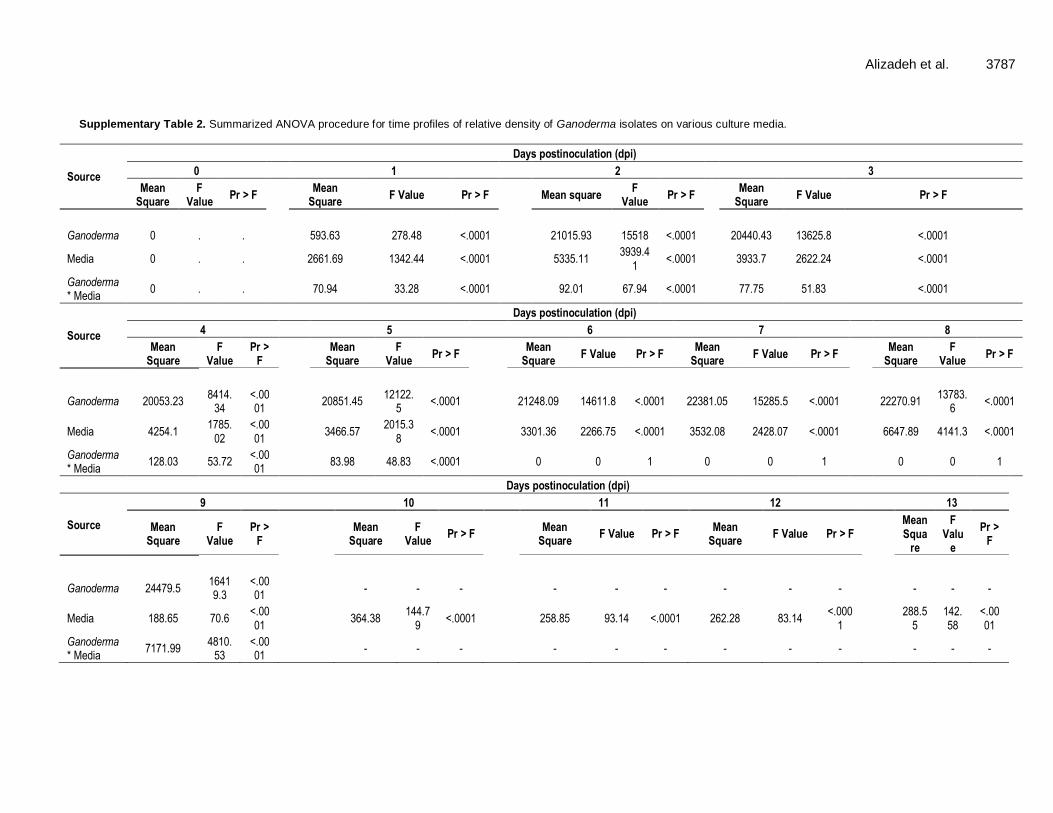
Alizadeh et al. 3787
Supplementary Table 2. Summarized ANOVA procedure for time profiles of relative density of Ganoderma isolates on various culture media.
Source
Days postinoculation (dpi)
0 1 2 3
Mean Square
F Value
Pr > F
Mean Square
F Value Pr > F
Mean square F
Value Pr > F
Mean Square
F Value Pr > F
Ganoderma 0 . . 593.63 278.48 <.0001 21015.93 15518 <.0001 20440.43 13625.8 <.0001
Media 0 . . 2661.69 1342.44 <.0001 5335.11 3939.4
1 <.0001 3933.7 2622.24 <.0001
Ganoderma * Media
0 . . 70.94 33.28 <.0001 92.01 67.94 <.0001 77.75 51.83 <.0001
Source
Days postinoculation (dpi)
4 5 6 7 8
Mean Square
F Value
Pr > F
Mean Square
F Value
Pr > F
Mean Square
F Value Pr > F Mean
Square F Value Pr > F
Mean Square
F Value
Pr > F
Ganoderma 20053.23 8414.
34 <.0001
20851.45 12122.
5 <.0001 21248.09 14611.8 <.0001 22381.05 15285.5 <.0001 22270.91
13783.6
<.0001
Media 4254.1 1785.
02 <.0001
3466.57 2015.3
8 <.0001 3301.36 2266.75 <.0001 3532.08 2428.07 <.0001 6647.89 4141.3 <.0001
Ganoderma * Media
128.03 53.72 <.0001
83.98 48.83 <.0001 0 0 1 0 0 1 0 0 1
Days postinoculation (dpi)
Source
9 10 11 12 13
Mean Square
F Value
Pr > F
Mean Square
F Value
Pr > F
Mean Square
F Value Pr > F Mean
Square F Value Pr > F
Mean Squa
re
F Valu
e
Pr > F
Ganoderma 24479.5 16419.3
<.0001
- - - - - - - - - - - -
Media 188.65 70.6 <.0001
364.38 144.7
9 <.0001 258.85 93.14 <.0001 262.28 83.14
<.0001
288.5
5 142.58
<.0001
Ganoderma * Media
7171.99 4810.
53 <.0001
- - - - - - - - - - - -

3788 Afr. J. Microbiol. Res.
Supplementary Table 3. Summarized ANOVA procedure for
relative growth rate of Ganoderma isolates on various culture media.
Source Mean Square F Value Pr > F
Ganoderma 11099.31 35089.60 <.0001
Media 11113.09 50940.3 <.0001
Ganoderma * Media 408.67 1291.98 <.0001
G. subamboinense var. laevisporium (ATCC 52419)
Media 3501.22 12472.1 <.0001
G. boninense PER 71
Media 2944.92 4653.94 <.0001
G. zonatum POR 67
Media 487.66 2547.34 <.0001
G. zonatum POR 69
Media 3492.24 10601.00 <.0001
G. miniatocinctum 331035
Media 2441.11 13240.7 <.0001
G. miniatocinctum 331037
Media 2444.73 6453.73 <.0001
G. tornatum POR 54
Media 251.11 3124.66 <.0001
G. tornatum POR 57
Media 3410.78 7535.98 <.0001