improvement of radiation treatment conditions in ... · improvement of radiation treatment...
TRANSCRIPT
Improvement of radiation
treatment conditions in
postoperative prostate cancer
The impact of a bladder filling protocol
Absorbed dose obtained from kV imaging
Evaluation of deformable image registration software
A Master Thesis
by
Rimon Thomas
Supervisors
Ulrika Lindencrona PhD
Marcus Krantz
Roumiana Chakarova PhD
Karin Braide
Submitted to the University of Gothenburg
In partial fulfillment of the requirements for the degree
of Master of Science in Medical Physics

Table of Contents Abstract ..........................................................................................................................................3
Background and purpose.............................................................................................................3
Material and methods .................................................................................................................3
Results ........................................................................................................................................3
Conclusion ..................................................................................................................................3
Abbreviations and Acronyms...........................................................................................................4
Acknowledgments...........................................................................................................................4
Introduction ....................................................................................................................................5
Postoperative prostate cancer.....................................................................................................5
Cone Beam Computed Tomography ............................................................................................7
Adaptive radiotherapy .............................................................................................................. 10
Aims ............................................................................................................................................. 11
Theoretical overview..................................................................................................................... 12
Treatment system and exposure parameters ............................................................................ 12
Material and methods ................................................................................................................... 14
Bladder filling protocol .............................................................................................................. 14
Pre-study – Inter-patient bladder filling variation ...................................................................... 14
Reproducibility of the bladder volume for postoperative prostate cancer patients .................... 14
Absorbed dose for 2D kV-imaging ............................................................................................. 15
Absorbed dose for CBCT pelvis scan .......................................................................................... 16
Evaluation of SmartAdapt® deformation algorithm ................................................................... 17
Results and discussion................................................................................................................... 19
Pre-study – Inter-patient bladder filling variation ...................................................................... 19
Reproducibility of the bladder volume for postoperative prostate cancer patients .................... 20
Absorbed dose for 2D kV-imaging ............................................................................................. 22
Absorbed dose for CBCT pelvis scan .......................................................................................... 25
Evaluation of SmartAdapt® deformation algorithm ................................................................... 27
Conclusions and Future work ........................................................................................................ 38
Appendix ...................................................................................................................................... 39
References .................................................................................................................................... 40

3
Abstract
Background and purpose
Regarding postoperative prostate cancer patients there is no visible tumor when planning the
radiation treatment. Hence, a well-defined target area is of great importance in the radiation
treatment, when possible displacements in the location caused by nearby organs are not fully known.
This information can be provided with a CBCT scan prior to the radiation treatment. The study’s
purpose was to evaluate three things: 1) the impact of a bladder filling protocol on the bladder
volume, 2) the absorbed dose obtained using OBI® version 1.5, 3) the deformable image registration
software, SmartAdapt®, with the purpose to extend adaptive radiotherapy for postoperative prostate
cancer.
Material and methods
Two patients were included in the study of bladder volumes reproducibility. The bladder filling
protocol used in this study involves the patient emptying the bladder and in conjunction drink 300 ml
of liquid. Toshiba Aquilion LB and Varian™ OBI® Advanced Imaging version 1.5 were used for the CT
and CBCT scans, respectively. The absorbed doses were measured in a polystyrene phantom with an
ion chamber, Exradin A3. The evaluation of the deformation algorithm of SmartAdapt® was
performed with CT and CBCT scans using a pelvis phantom of PMMA.
Results
The patient following the bladder filling protocol had mean bladder volume of 72 cm3 with a
standard deviation of 7 cm3 in contrast to a mean bladder volume of 175 cm3 and a standard
deviation of 93 cm3 for the patient not following the bladder filling protocol. The absorbed dose rates
for 2D kV imaging were calculated to 1 - 13 mGys-1 and the absorbed doses for the CBCT pelvis scans
were approximately 29 – 51 mGy.
The deformation algorithm of SmartAdapt® showed a dependence on the VOI, the magnitude of the
presented changes and the standard deviation of HU in the image. Also, the deformed CT images
showed that a higher priority is placed on the source image rather than the target image.
Conclusion
The results in this study indicate that the bladder volume was reproducible with a bladder filling
protocol, although a larger patient group is required to achieve statistical confidence in the results.
Furthermore, the bladder filling protocol should include easy instructions and be integrated in the
treatment process in such way that it is unaffected by possible holdups or delays.
If CBCT scans are to be performed regularly on patients, one needs to be aware of the additional
absorbed dose, which was shown to be considerable in this study.
The deformation algorithm was not always seen to perform accurately in the deformations of the CT
images. Possible errors in deformations for different patient cases, e.g. in the pelvis region, needs to
be further investigated if the software is to be used in the clinic.
4
Abbreviations and Acronyms
ART Adaptive Radiation Therapy
CTV Clinical Target Volume
PTV Planning Target Volume
CTDI Computed Tomography Dose Index
dCT Deformed CT
pCT Planning CT
EPID Electronic Portal Imaging Device
FOV Field of View
HVL Half value layer
HU Hounsfield Unit
IGRT Image-Guided Radiation Therapy
kV Kilo voltage
OBI® On-Board Imager®
PMMA Poly Methyl-Methacrylate
PSA Prostate-Specific Antigen
SAD Source to Axis Distance
TLD Thermoluminescence Dosimeter
VOI Volume Of Interest
Acknowledgments
Firstly, I wish to thank my supervisors Ulrika Lindencrona PhD, Marcus Krantz, Roumiana Chakarova
PhD and Karin Braide. Their guidance and support over the time of my studies, and the input they
have made to the research presented here, were invaluable and gratefully received.
I would also like to thank RTI Electronics for providing necessary data for the measurements
performed in this study.
In addition to these people, I would like to thank everyone at the radio physics department
for all the additional help and moral support.

5
Introduction
Postoperative prostate cancer
Prostate cancer is the most common form of cancer in Sweden. Almost 10 000 were diagnosed in the
year 2010.1 The disease mainly affects older men, half over 70 years old and a few under 40 when
receiving the diagnose
Patients which have been diagnosed with prostate cancer may undergo a radical prostatectomy,
termed as postoperative prostate cancer patients. As no prostate is present, there should be no
epithelial cells left producing prostate-specific antigen (PSA). Unfortunately, the removing of all
cancerous cells is not always possible and if PSA levels are detected in the blood test after the radical
prostatectomy, patients may have to undergo radiotherapy.2
Radical prostatectomy involves a new attachment of the bladder and urethra (Figure 1). The site
were this connection is made is suggested to be the predominant site where possible cancerous cell
remains. This site is the target area in the radiation treatment planning; therefore, displacements in
this area during the radiation treatment period are of great interest. The filling in small intestine,
bladder and rectum may affect the position of nearby organs. To derive a relation between the target
volume and nearby organs for all patients is an impossible task as there are always anatomical
differences, even in the same patient at different times.
Figure 1. Schematic picture of the urinary bladder, urethra and the prostate. To the left is a coronal image for the position of the bladder, urethra and prostate relative to each other. The process of removing the prostate and stitching the bladder and urethra together, also called a radical prostatectomy is shown to the right. Images are modified and taken from Abrahamsson, Per-Anders. Prostatacancer - information för patienter och anhöriga : Astra Zeneca Sverige, 2006. ISBN 91-86327-64-X
6
A large margin for planning target volume (PTV) results in increased amount of healthy tissue
irradiated which could cause complications, new induced tumors or even worse complete organ
failure. A small margin however, could mean failing to treat all cancerous cells. An alternative
approach is to reduce the organs influence on the target location. In order to control the bladder
volume, a protocol instructing the patient to drink an amount of liquid and/or void the bladder at a
certain time could be introduced.4-6, 9, 12
There have been several studies on the outcome of different bladder filling protocols for patients
diagnosed with localized prostate cancer where the patients prostate are still intact.4, 5, 8, 9, 11-14
Bladder filling protocols aiming for the patient to maintain a full bladder has the advantage of an
upward push on the small intestine from the bladder, placing them further away from the treatment
area. The bladder wall is also expanded leaving a smaller part of the bladder wall in the treatment
region.10 Bladder filling protocols aiming for the patient to maintain an empty bladder can be
preferred due to the easiness in implementation, relieving the patient from any preparations and
increase in patient comfort.10 Studies have showed a smaller inter-and intra-patient variation in
bladder volumes when patients are told to have an empty bladder compared to when the patients
are told to maintain a full bladder, implying a higher reproducibility in bladder volumes.7, 8 However,
the drawback with an empty bladder is an increased amount of bladder volume in the high dose
region and a higher dose to bowel loops.8
When studying the prostate and seminal vesicle movement in computed tomography (CT) images
for patients with full and empty bladder respectively, it was reported that the displacements of the
prostate and the seminal vesicles were statistically not different when full bladder scans were
compared with empty bladder scans following immediately after voiding.8 When studying the
movements of PTV and clinical target volume (CTV) for postoperative prostate cancer patients, no
improvement in CTV stability was seen when patients had an empty bladder compared to a full
bladder. Yet the center of mass displacements were reported to be larger along the superior –
inferior axis with an empty bladder.7 It should be noted that the criterion of a full bladder was based
on the patient’s self-assessment. This criterion was evaluated in two studies where the patient’s self-
assessment showed weak correlations to the bladder volume with large inter-and intra-patient
variance.3, 4 Thus, further investigations of the effects of a well-defined bladder filling protocol with
clear instructions to postoperative prostate cancer patients are of importance.
7
Cone Beam Computed Tomography
Image-guided radiation therapy (IGRT) has emerged as the new paradigm in radiotherapy. The
increased clinical availability of the new imaging technology has resulted in a growth in its diagnostic
usage and therefore may significantly increase the absorbed dose to the patient’s normal tissues.28
Cone Beam Computed Tomography (CBCT) is an imaging method that is similar in acquisition and
reconstruction technique of a CT. A kV beam is rotated around the patient where the acquired
projections are reconstructed to a 3D volume. However, during a CBCT scan the kV source rotates a
maximum of 360o around the patient and the irradiated volume is larger in the cranial – caudal
direction, requiring a larger detector area to collect the information and also causing an increase in
scattering in the irradiated volume resulting in a degraded image quality when compared to a CT.31
The couch does not move during a CBCT scan as the required imaged volume is irradiated during one
rotation, whereas during a CT scan the thin kV beam requires the couch to move in a cranial-caudal
direction to irradiate the required imaged volume. The difference in absorbed dose delivered to the
patient between CT and CBCT depends upon the exposure parameters used and the irradiated
volume.22, 29
Although the radiation dose from kV imaging is often considered as negligible compared to the
therapeutic radiation dose, studies have shown that the use of CBCT contributes to a considerable
amount of radiation dose to healthy tissue and are similar to those resulting from conventional
multiple setup field imaging using an electronic portal imaging device (EPID).24, 25 The measurement
of absorbed dose in the kV region is not a straightforward procedure. The Institution of Physics and
Engineering in Medicine and Biology (IPEMB) provides a code of practice for measurements of
absorbed dose at the surface and at 2 cm depth in a water phantom.27 There is to date, no code of
practice for measuring the absorbed dose at larger depths. This is due to the uncertainty in the
mean mass energy-absorption coefficient and the low signal or charge collected in the
measurements caused by the low penetration of kV beam in water.27 Furthermore, the photon
fluence is continuously changing as a result of a rotating kV source causing different attenuation and
scatter conditions inside the phantom at different angles.

8
Absorbed doses from pelvis CBCT scan using Varian™ OBI®
The default exposure parameters for pelvis mode in Varian™ OBI® (On-Board Imager®) (Varian
Medical Systems, Palo Alto, CA) are 125 kV, 80 mA, 360o rotation, half fan and half fan bow-tie filter,
regardless of OBI® version. However, exposure time (ms) or the total tube current multiplied with the
exposure time (mAs), differ depending on the OBI® version used.15, 16, 20-23
Absorbed doses has been reported to be 30 – 60 mGy in a homogenous phantom using ionization
chambers (Table 1) and 3.63 – 110 mGy in various organs in an anthropomorphic phantom – Rando®,
using thermoluminescence dosimeter (TLD) (Table 2). These variations are due to different phantom
material, position relative to the beam axis and the exposure parameters used.
In the Rando® phantom only TLD’s can be used as detector due to their small size, enabling them
to be placed in small cavities which gives a more correct view of the absorbed doses to various
organs compared to the measurements performed in a homogenous phantom with an ionization
chamber. However, the calculation of absorbed dose with an ionization chamber is a more straight
forward procedure and can be made more sensitive than TLD’s.30 Furthermore, the accuracy of CBCT
measurements can increase by using a spherical ionization chambers which is completely
symmetrical in all angles and is easily centered to allow precise positioning.32
The Varian™ OBI® has underwent large changes in radiation dose delivery between the version
1.3 and 1.4.15-17 The changes include lower exposure parameters and the choice of a 200o acquisition
to minimize direct exposure on sensitive structures. Ding et al. (2010)17 reported a reduction in
absorbed dose with a factor of 60 to the eyes when performing head scans in version 1.4 compared
to in version 1.3. Another study reported an absorbed dose reduction up to 2.5 for a pelvis scan
when using version 1.4 compared to version 1.3.15 The previous reported absorbed doses are
obtained with different OBI® versions than installed in our clinic (version 1.5). It is therefore of
interest to investigate the absorbed doses received with currently used OBI® system and to obtain
reference measurements for future quality assurance (QA).

9
Table 1. The absorbed doses reported from the literature using Varian™ OBI® in various water equivalent homogenous phantoms for the default pelvis mode with two different exposure time settings, 13 ms and 25 ms.
Author Phantom material Exposure time
setting [ms]
Absorbed dose
[mGy]
Cheng et al. 2011 Perspex 13 29.4
25 58.2
Song et al. 2008 Acrylic 25 54
Ding and Coffey,
2010
Water tank
Plastic Water® low energy range
Solid Water®
Poly Methyl-Methacrylate (PMMA)
slabs
13
28.7
53.5
46.5
61.1
Table 2. The absorbed and effective doses reported from the literature using Varian™ OBI® measured in a Rando® phantom for the default pelvis mode with two different exposure time settings, a – 13 ms and b – 25 ms.
Author Location Exposure time
setting [ms]
Absorbed dose
[mGy]
Effective dose
[mSv]
Wen et al.
2007
Femoral bones
Soft tissue
25
60 – 110
30
-
Kan et al.
2008
Gonads
Uterus
Small intestine
Bone marrow
Colon
Bladder
Skin
25
37.5
38
62.3
54.3
54.3
52.9
54.3
22.72
Cheng et al.
2011
Gonads
Small intestine
Bone marrow
Colon
Bladder
Rectum
Spinal cord
a25
b13
22.11a – 11.66b
6.93a – 3.63
b
28.68a – 14.59
b
12.50a – 6.45b
59.35a – 30.37b
46.48a – 22.75
b
13.82a – 7.08
b
8.21a
16b
Palm et al.
2010
Average in a transverse
plane
a25
b13
87a
34.2b
-

10
Adaptive radiotherapy
Adaptive radiotherapy (ART) is the process of optimizing the prescription dose to the patient and
aims to achieve the golden rules in radiotherapy; maximizing damage to target and spare normal
tissue. This can be achieved in three different ways33:
1. Offline adaption generates new, more accurate radiation treatment plans as gradual changes
occur between treatment fractions.
2. Real-time adaptation, continuous patient monitoring during treatment combined with pre-
plotted beam trajectories to make sure that the maximum dose is delivered to the precise
target while avoiding other organs.
3. Online adaptation, radiation treatment based on new information on a specific day to
account for variations in patient anatomy or physiology, which cannot be corrected by
repositioning the patient alone.
There are plenty of technologies aiming for a better patient treatment, however, the benefits and
drawbacks needs to be evaluated to determine the usability of the new technology in the clinic. A
recently developed software by Varian™, SmartAdapt®, uses a deformation algorithm to conform the
planning CT (pCT) based on the new anatomical information of the patient at a different time in the
treatment period with e.g. CBCT images. This is an interesting development and would fall in the
category offline adaption, as mentioned above.

11
Aims
Studying the effects of a bladder filling protocol on postoperative prostate cancer patients
Estimating the absorbed dose obtained from 2D kV imaging and a CBCT pelvis scan with OBI®
version 1.5
Evaluating the deformation algorithm of SmartAdapt® to determine the software’s
predictability, uncertainty, accuracy and usability
12
Theoretical overview
Treatment system and exposure parameters
The treatment system used in this study was Varian™ Clinac® Xi and the CBCT were acquired with the
OBI® Advanced Imaging version 1.5 which is mounted orthogonally to the gantry axis using a robotic
arm Exact™. The default exposure parameters for the three different pelvis modes available for
Varian™ OBI® version 1.5 are seen in Table 3.
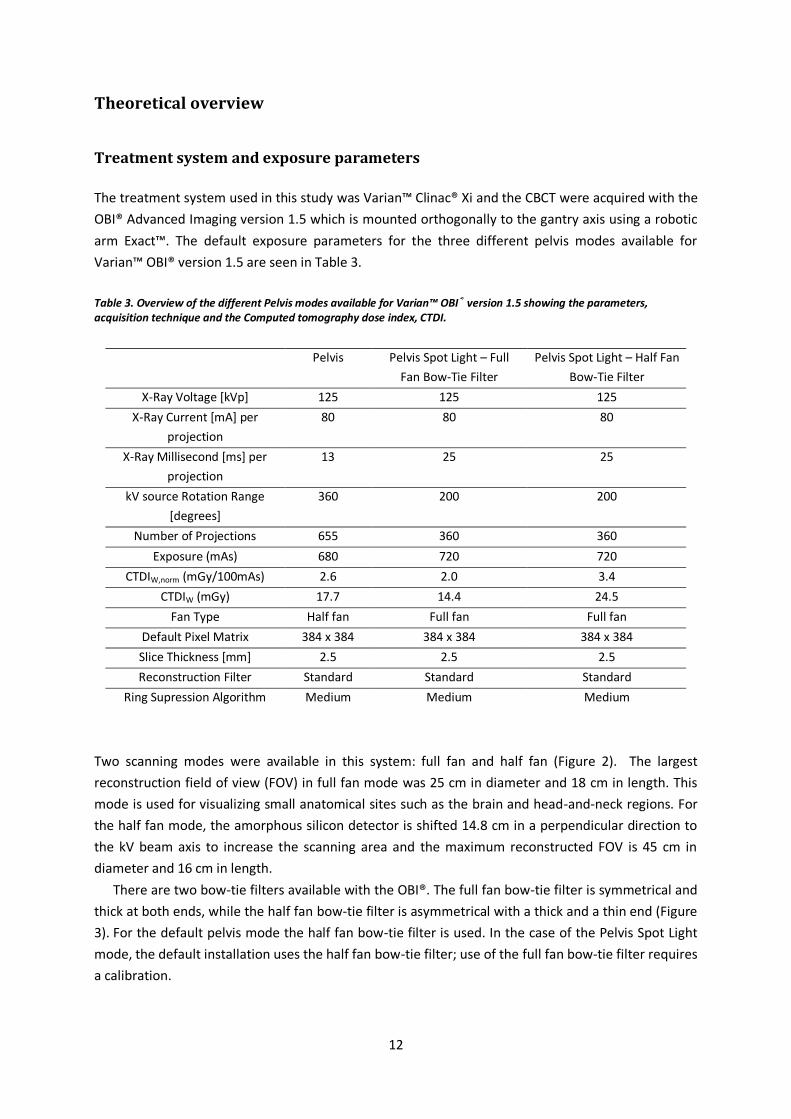
Table 3. Overview of the different Pelvis modes available for Varian™ OBI® version 1.5 showing the parameters, acquisition technique and the Computed tomography dose index, CTDI.
Two scanning modes were available in this system: full fan and half fan (Figure 2). The largest
reconstruction field of view (FOV) in full fan mode was 25 cm in diameter and 18 cm in length. This
mode is used for visualizing small anatomical sites such as the brain and head-and-neck regions. For
the half fan mode, the amorphous silicon detector is shifted 14.8 cm in a perpendicular direction to
the kV beam axis to increase the scanning area and the maximum reconstructed FOV is 45 cm in
diameter and 16 cm in length.
There are two bow-tie filters available with the OBI®. The full fan bow-tie filter is symmetrical and
thick at both ends, while the half fan bow-tie filter is asymmetrical with a thick and a thin end (Figure
3). For the default pelvis mode the half fan bow-tie filter is used. In the case of the Pelvis Spot Light
mode, the default installation uses the half fan bow-tie filter; use of the full fan bow-tie filter requires
a calibration.
Pelvis Pelvis Spot Light – Full
Fan Bow-Tie Filter
Pelvis Spot Light – Half Fan
Bow-Tie Filter
X-Ray Voltage [kVp] 125 125 125
X-Ray Current [mA] per
projection
80 80 80
X-Ray Millisecond [ms] per
projection
13 25 25
kV source Rotation Range
[degrees]
360 200 200
Number of Projections 655 360 360
Exposure (mAs) 680 720 720
CTDIW,norm (mGy/100mAs) 2.6 2.0 3.4
CTDIW (mGy) 17.7 14.4 24.5
Fan Type Half fan Full fan Full fan
Default Pixel Matrix 384 x 384 384 x 384 384 x 384
Slice Thickness [mm] 2.5 2.5 2.5
Reconstruction Filter Standard Standard Standard
Ring Supression Algorithm Medium Medium Medium

13
Figure 2. The scanning modes available in OBI® version 1.5, full fan and half fan with the reconstructed volume and the position of the detector relative to the x-ray tube. Images are modified and taken from OBI® 1.5 Physicist Operations Manual Revision 3.1.0.
Figure 3. The two bow-tie filters used with OBI® version 1.5 half fan filter to the left and full fan filter to the right.

14
Material and methods
Bladder filling protocol
The bladder filling protocol used in this study instructs patients to void the bladder one hour prior to
radiation treatment and in conjunction drink 300 ml of optional liquid excluding coffee and tea.
Pre-study – Inter-patient bladder filling variation
Before the main study was carried out, a pre-study was conducted to investigate the inter-patient
differences between the use of bladder filling protocol and instructing patients to maintain a
comfortably full bladder volume. Data was collected from the pCT using Toshiba Aquilion LB (Toshiba
America Medical, Tustin, CA) for 24 patients from Sahlgrenska University Hospital, not following a
bladder filling protocol (instructed to maintain a comfortable bladder filling), and for 24 from Södra
Älvsborg Hospital, following a bladder filling protocol. The minimum, maximum and mean bladder
volumes in each group were compared and a Mann-Whitney test was performed with a 95% level of
confidence to test the significance in the volume sample.
Reproducibility of the bladder volume for postoperative prostate cancer patients
Between September 2012 and December 2012 two patients with postoperative prostate cancer were
available and enrolled into this study:
Patient#1 – Age 69 – Following the bladder filling protocol
Patient#2 – Age 79 – Instructed to maintain a comfortable filled bladder
The patients were scanned with Toshiba Aquilion LB to obtain the pCT. A weekly CBCT using OBI®
version 1.5 was obtained to quantify the volumetric changes of the bladder throughout the
treatment period. Prior to the CBCT scan, the patients answered a questionnaire (seen in Appendix)
regarding recently fluid intake and bladder voiding. The bladder was contoured on all CT and CBCT
images by the same oncologist to exclude inter observer uncertainties. The volumetric changes of the
bladder were compared between the two patients to investigate the impact of the bladder filling
protocol on the bladder volume.
The junction between the urethra and the bladder is one of the reference areas in the dose
planning for these patients, it is regarded that the position of this site is unaffected by nearby organs.
To evaluate this hypothesis, the lowermost part of the bladder’s contour in all scans performed for
the same patient, were compared in the cranial – caudal direction to determine if any displacement
was evident in this area during the treatment period.
15
Absorbed dose for 2D kV-imaging
The absorbed dose from 2D kV-image using OBI® version 1.5 was measured with the kV source fixed
and positioned above the polystyrene phantom measuring 20x20x20 cm3 (Figure 4). The exposure
parameters used, kV and mAs, were the same as the default pelvis mode for a CBCT scan (Table 3). A
spherical ionization chamber was used – Exradin A3 (Standard Imaging Inc., Middleton, WI) which
was connected to an electrometer – Dose 1 (IBA Dosimetry, Schwarzenbruck, Germany).
HVL data for the OBI® used in this study was available for the tube voltage 125 kVp with full fan
bow-tie filter at three different locations with source to axis distance (SAD) 100 cm, central axis, 6.1
mm, 5 cm off-axis, 7.7 mm and 10 cm off-axis, 10.2 mm aluminum. These data were measured and
provided by RTI Electronics (Mölndal, Sweden) obtained with the Pirahna® detector.
The absorbed doses were calculated through the recommendations given from the American
association of physicists in medicine (AAPM) on a reference depth of 2 cm in a water phantom18 as
seen in equation 1:
[( ̅̅ ̅̅ ̅
) ⁄]
(1)
Where
Dw,z=2 is the absorbed dose to water at the position of the chamber center at a depth z = 2 cm when
the chamber is replaced by water.
M is the instrument reading obtained with a chamber corrected to standard pressure and
temperature.
NK is the chamber calibration factor in gray per scale reading to convert the instrument reading at the
beam quality concerned to air kerma free in air at the reference point of the chamber assembly
replaced by air.
PQ,cham is the overall chamber correction factor that accounts for the change in the chamber response
due to the displacement of water by the ionization chamber (air cavity and wall) and the presence of
the chamber stem, the change in the energy and angular distribution of the photon beam in the
phantom compared to that used for the calibration in air.
[( ̅en/ρ)w/air]water is the mean mass energy-absorption coefficient water to air, averaged over the
photon spectrum at 2 cm depth in water.
The mean mass energy-absorption coefficients water to air were taken from Ma and Seuntjens
(1999)19 and were linearly interpolated to obtain the coefficients for HVL 6.1, 7.7 and 10.2 mm
aluminum. PQ,cham was set to unity in this study.

16
Measurements at 2 cm and 10 cm depth were performed with the x-ray tube perpendicular to the
ionization chamber with the full fan bow-tie filter, at the central axis, 5 cm and 10 cm to the left (off-
axis) (Figure 4). One measurement was performed 10 cm to the left (off-axis) with the half fan bow-
tie filter to estimate the increase in absorbed dose received. The absorbed dose rates were
calculated for these measurements.
Absorbed dose for CBCT pelvis scan
The absorbed dose from a CBCT pelvis scan using OBI® version 1.5 were investigated for the depth 10
cm (isocenter of the phantom) in the central axis and 10 cm off-axis, measurement A and B
respectively. The ionization chamber was also placed at 2 cm depth in central axis, measurement C,
to estimate the skin dose (Figure 4).
The current [nA] given by the electrometer were logged to visualize the charge deposited as a
function of time and position relative to the central axis.
It should be mentioned that the kV source in the OBI® version 1.5 (in our clinic) rotates either
178o to 182o in a clockwise direction or 182o to 178o in a counterclockwise direction resulting in a 4o
of over-scan.
Figure 4. The experimental setup for the 2D kV-imaging and CBCT scan measurements at 2 cm and 10 cm depth in the central axis, 5 cm off-axis and 10 cm off-axis. A: 2 cm depth and in central axis. B: 10 cm depth and in central axis. C: 10 cm depth and 10 cm off-axis.
17
Evaluation of SmartAdapt® deformation algorithm
SmartAdapt® is a software released in 2010 from Varian™ which enables easy tracking and adapting
of the interfractional changes in a patients anatomy throughout the treatment. Structures outlined
on the pCT are deformed based on the new anatomical information from e.g. CBCT images.
The deformation algorithm is a grayscale-based fully automatic deformable image registration
algorithm originally known as the Demons algorithm, described in a paper by Thirion.26
The algorithm was studied on a pelvis PMMA phantom with the size 37x22x5 cm3 in the transverse,
sagittal and coronal direction respectively. It contains four exchangeable hole fillings, two 2.5 cm and
two 2.9 cm in diameter. The smaller holes can be filled with 4.9 cm long stainless steel cylinders or
PMMA cylinders with the same size. The larger holes can be filled with 4.9 cm long PMMA cylinders
or 8.5 cm long tube containing an optional filling. In this study this tube were filled with water (Figure
5).
A total of seven scans were performed (Table 4). Five CT scans were acquired with Toshiba
Aquilion LB using the default pelvis mode: 120 kV and 100 mAs and slice thickness 3 mm. Two CBCT
acquired with OBI® version 1.5 using the default pelvis mode.
The evaluation of the software’s deformation algorithm was performed with different VOI
(Volume of Interest) sizes and different deformation combinations using various hole fillings and
modality image-sets e.g. CT and CBCT. The propagated structures were interpreted visually and the
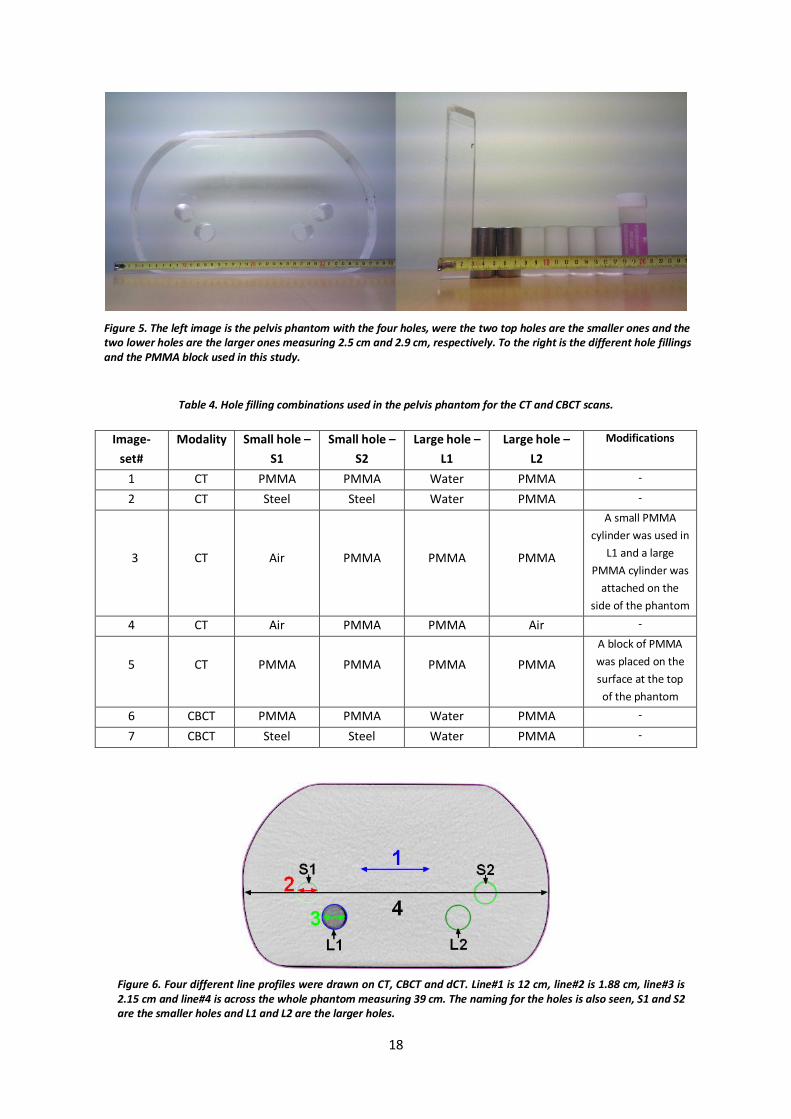
deformations effect on Hounsfield units (HU) was quantified with line profiles (Figure 6). In addition,
the algorithm’s ability to treat changes such as tumor shrinkage and swellings was tested. This were
simulated using a large PMMA cylinder, 2.9 cm in diameter, and a PMMA block, 17.5x2.8x2.8 cm3,
placed on the side and on the top of phantom, respectively.
Fourteen deformation combinations were performed whereas twelve of them were with a VOI
sizes precisely encompassing the phantom, the remaining two were deformed with smaller VOI sizes.
When deforming images in SmartAdapt®, a rigid registration is required by the software in order
to generate a deformable registration. The source and the target image needs to be selected. The
source is the image to be deformed, thus the pCT, whereas the target is the image-set the
deformation should be based upon, e.g. CBCT images. To evaluate the algorithm’s accuracy for the
deformation combinations, CT images were always chosen as the target image to avoid uncertainties
in the deformation caused by the degraded image quality of CBCT images. The deformed CT (dCT)
can be obtained by one of two deformation algorithms, default or soft. In this study, default
deformation algorithm was used for all deformations.
18
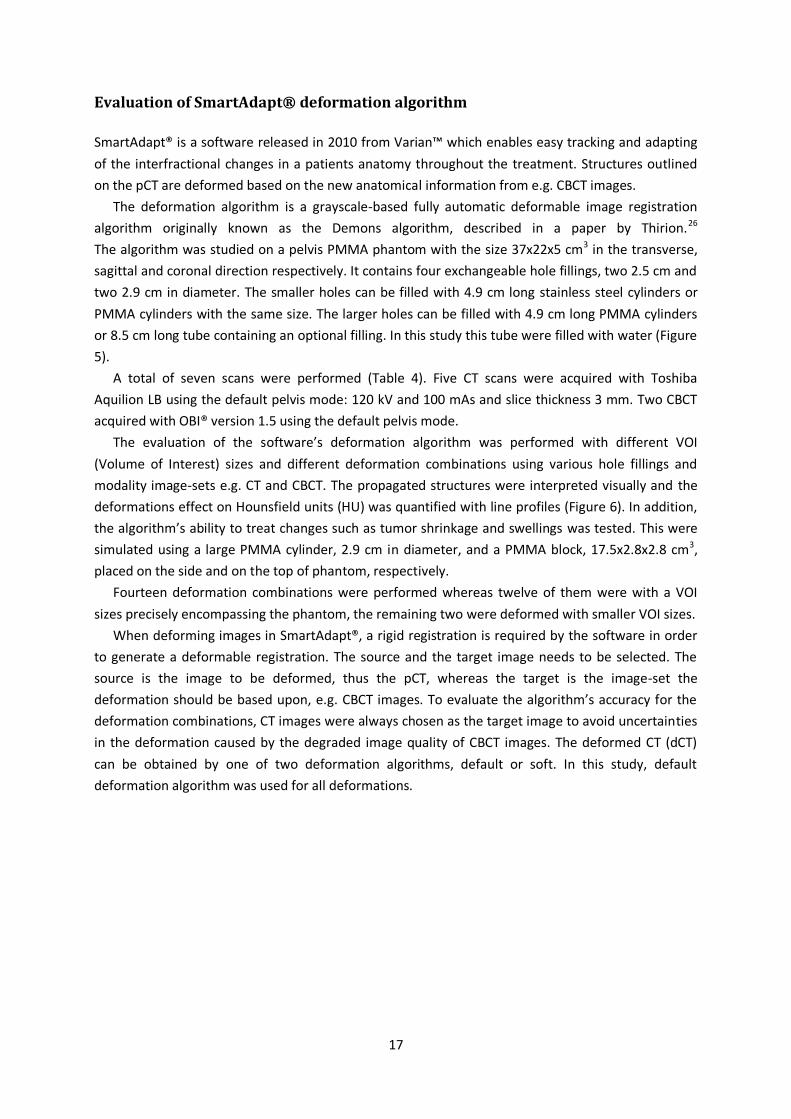
Table 4. Hole filling combinations used in the pelvis phantom for the CT and CBCT scans.
Image-
set#
Modality Small hole –
S1
Small hole –
S2
Large hole –
L1
Large hole –
L2
Modifications
1 CT PMMA PMMA Water PMMA -
2 CT Steel Steel Water PMMA -
3
CT
Air
PMMA
PMMA
PMMA
A small PMMA
cylinder was used in
L1 and a large
PMMA cylinder was
attached on the
side of the phantom
4 CT Air PMMA PMMA Air -
5
CT
PMMA
PMMA
PMMA
PMMA
A block of PMMA
was placed on the
surface at the top
of the phantom
6 CBCT PMMA PMMA Water PMMA -
7 CBCT Steel Steel Water PMMA -
Figure 5. The left image is the pelvis phantom with the four holes, were the two top holes are the smaller ones and the two lower holes are the larger ones measuring 2.5 cm and 2.9 cm, respectively. To the right is the different hole fillings and the PMMA block used in this study.
Figure 6. Four different line profiles were drawn on CT, CBCT and dCT. Line#1 is 12 cm, line#2 is 1.88 cm, line#3 is 2.15 cm and line#4 is across the whole phantom measuring 39 cm. The naming for the holes is also seen, S1 and S2 are the smaller holes and L1 and L2 are the larger holes.
19
Results and discussion
Pre-study – Inter-patient bladder filling variation
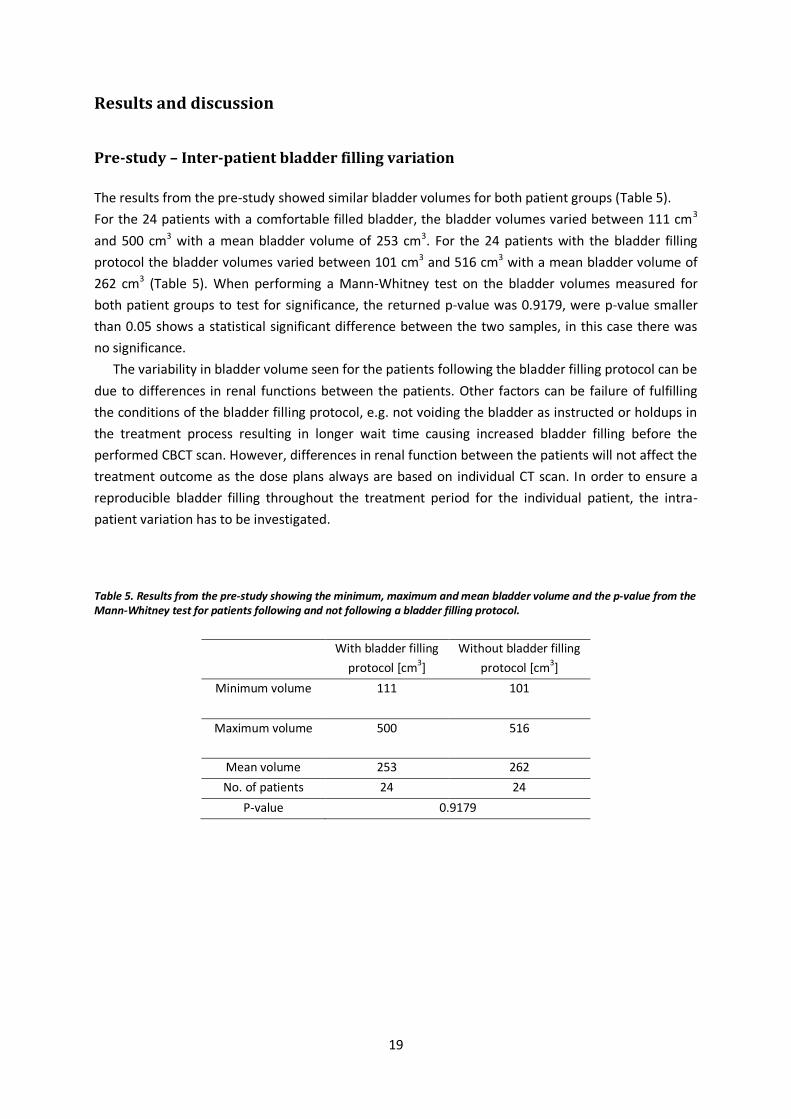
The results from the pre-study showed similar bladder volumes for both patient groups (Table 5).
For the 24 patients with a comfortable filled bladder, the bladder volumes varied between 111 cm3
and 500 cm3 with a mean bladder volume of 253 cm3. For the 24 patients with the bladder filling
protocol the bladder volumes varied between 101 cm3 and 516 cm3 with a mean bladder volume of
262 cm3 (Table 5). When performing a Mann-Whitney test on the bladder volumes measured for
both patient groups to test for significance, the returned p-value was 0.9179, were p-value smaller
than 0.05 shows a statistical significant difference between the two samples, in this case there was
no significance.
The variability in bladder volume seen for the patients following the bladder filling protocol can be
due to differences in renal functions between the patients. Other factors can be failure of fulfilling
the conditions of the bladder filling protocol, e.g. not voiding the bladder as instructed or holdups in
the treatment process resulting in longer wait time causing increased bladder filling before the
performed CBCT scan. However, differences in renal function between the patients will not affect the
treatment outcome as the dose plans always are based on individual CT scan. In order to ensure a
reproducible bladder filling throughout the treatment period for the individual patient, the intra-
patient variation has to be investigated.
Table 5. Results from the pre-study showing the minimum, maximum and mean bladder volume and the p-value from the Mann-Whitney test for patients following and not following a bladder filling protocol.
With bladder filling
protocol [cm3]
Without bladder filling
protocol [cm3]
Minimum volume 111 101
Maximum volume 500 516
Mean volume 253 262
No. of patients 24 24
P-value 0.9179

20
Reproducibility of the bladder volume for postoperative prostate cancer patients
A total of one CT and six CBCT images were scanned, utilized and analyzed per patient.
Patient#1 – following a bladder filling protocol, had a mean bladder volume of 71.7 cm3, ranging from
64 cm3 – 79 cm3, with the standard deviation of 7.18 cm3 (Table 6). Patient#2 – not following a
bladder filling protocol, had a mean bladder volume of 170 cm3, ranging from 50 cm3 – 290 cm3, with
the standard deviation of 93.3 cm3 (Table 6). The smaller bladder volumes for patient#1 resulted in a
larger part of the bladder was irradiated compared to patient#2. If the bladder filling protocol
induces smaller volumes compared to when patients are instructed to maintain a comfortably full
bladder, than the benefits of the bladder filling protocol can be questioned. Interestingly, the
answers given by patient#1 in the questionnaire showed that the conditions for the bladder filling
protocol were not always fulfilled. The fluid intake and voiding of the bladder were in most cases 1 –
2 hours prior to the radiation treatment where the instructed time was 1 hour.
Several studies have shown a time trend in decrease of bladder filling volume throughout the
treatment period.35-37, 39 However, this was not seen in this study. Other studies investigating the
impact of bladder filling protocol on the bladder volume did not show any stability in the bladder
volumes measured, it should be noted that the largest patient group in these studies were 25.35, 38, 39
Since only two patients were included during this study period, no conclusion can be drawn
regarding if bladder filling protocol contributes to a reproducible bladder volume or not. It is clear
that further investigation is required with a larger patient group to draw conclusions on the bladder
filling protocols impact on the bladder volume. However, the experience learned in this study can be
used as a framework for future investigation. The bladder filling protocol should be easy to follow
and possible to fulfill independent of patient condition. It should also be integrated in the treatment
process in such way that it is unaffected by possible holdups or delays. In this study the CBCT scans
were performed after the radiation treatment which resulted in failure of fulfilling the conditions
when delays occurred in the treatment process.
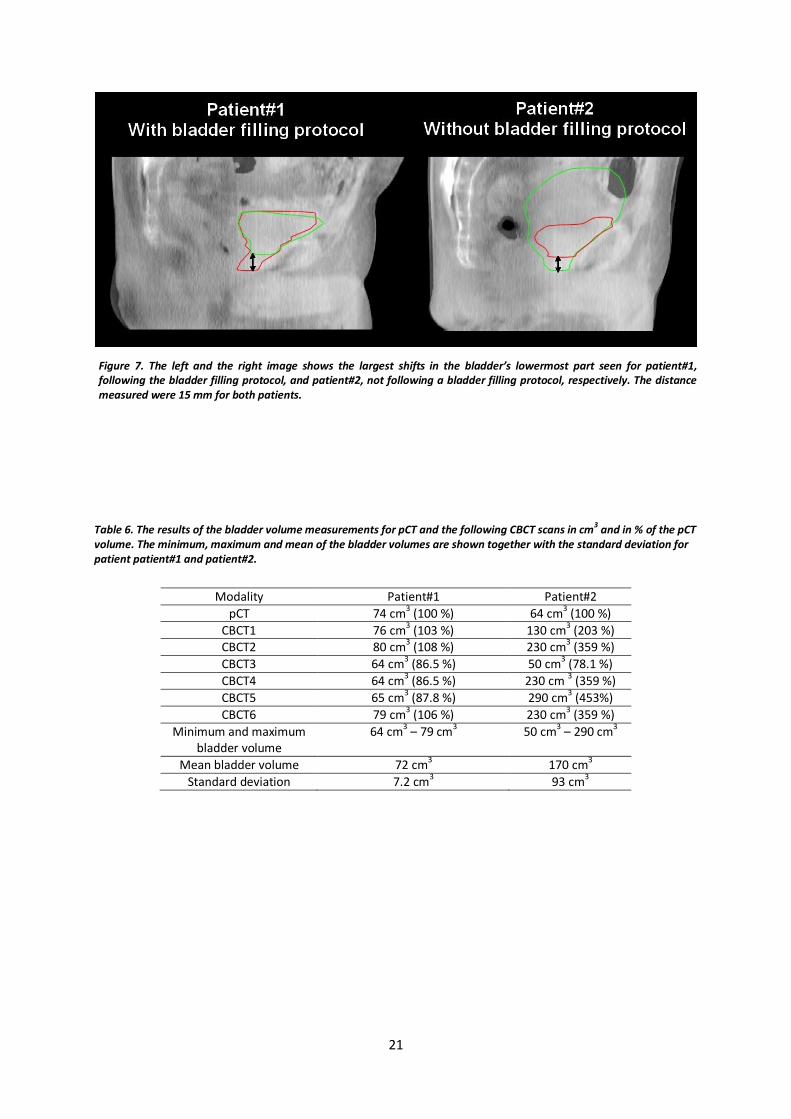
Regarding the comparison of the lowermost part of the bladder, the results showed at most a 15
mm displacement in the cranial – caudal direction for both patient#1 and patient#2 (Figure 7). These
results imply that a movement in the junction between the urethra and the bladder exists. However,
it should be noted that these results are dependent on the perception of the clinician drawing the
bladder contours. To draw any definitive conclusions, a larger patient group is required to determine
if the results are representative for postoperative cancer patients.
21
Table 6. The results of the bladder volume measurements for pCT and the following CBCT scans in cm3 and in % of the pCT volume. The minimum, maximum and mean of the bladder volumes are shown together with the standard deviation for patient patient#1 and patient#2.
Modality Patient#1 Patient#2
pCT 74 cm3 (100 %) 64 cm
3 (100 %)
CBCT1 76 cm3 (103 %) 130 cm3 (203 %) CBCT2 80 cm3 (108 %) 230 cm3 (359 %)
CBCT3 64 cm3 (86.5 %) 50 cm3 (78.1 %)
CBCT4 64 cm3 (86.5 %) 230 cm 3 (359 %)
CBCT5 65 cm3 (87.8 %) 290 cm3 (453%)
CBCT6 79 cm3 (106 %) 230 cm3 (359 %)
Minimum and maximum bladder volume
64 cm3 – 79 cm3
50 cm3 – 290 cm3
Mean bladder volume 72 cm3 170 cm3
Standard deviation 7.2 cm3 93 cm
3
Figure 7. The left and the right image shows the largest shifts in the bladder’s lowermost part seen for patient#1, following the bladder filling protocol, and patient#2, not following a bladder filling protocol, respectively. The distance measured were 15 mm for both patients.

22
Absorbed dose for 2D kV-imaging
The mean mass energy-absorption coefficients used in the calculations of absorbed dose at 2 cm
depth with a full fan bow-tie filter were 1.059, 1.048 and 1.041 cm2g-1 for 10 cm off-axis, 5 cm off-axis
and in the central axis, respectively. The dose rate at 2 cm depth and 10 cm off-axis were calculated
to 3.08 – and 3.50 mGys-1 for full fan and half fan bow-tie filter respectively (Table 7). The value given
for the full fan bow-tie filter is assumed to be within 5 % accuracy (Table 8). In a study by Ding et al.
(2010)17 the surface dose was halved when using full fan bow-tie filter instead of half fan bow-tie
filter, in this study a 12 % reduction were seen.
The mean mass energy-absorption coefficient used for the half fan bow-tie filter measurement
was chosen to be the same as the full fan bow-tie filter at the central axis, 1.041 cm2g-1, as the full fan
bow-tie filter are equally thick in the central axis as the half fan bow-tie filter are at the thin end
(Figure 3). This assumption adds further uncertainty to the value presented for the half fan bow-tie
filter and is estimated to be within 7 % accuracy (Table 8).
For the measurements at 2 cm depth with the full fan bow-tie filter at 5 cm off-axis and at central
axis the dose rate were calculated to 9.34 and 13.1 mGys-1 respectively (Table 7). The large difference
in the dose rate for the 5 cm displacement from the central axis is due to the shape of the full fan
bow-tie filter (Figure 3). The central axis includes more low-energy photons due to the lesser
filtration, causing an increase in surface dose. This was shown by Ding an Coffey (2010)17 for the
pelvis spot light mode, where the relative absorbed dose reduced with 66 % for a 5 cm displacement
from the central axis when using full fan bow-tie filter. These dose rates calculated are estimated to
be within 5 % accuracy (Table 8).
The charge collected per second at 10 cm depth for central axis, 5 cm off-axis and 10 cm off-axis
were 0.60, 0.41 and 0.13 nCs-1, respectively (Table 7). These results show the reduced charge
collected due to the increased attenuation at 10 cm depth. The measurement at central axis was
seen to reduce by 57 % compared to the measurement at 2 cm depth. Similar results were seen for
the 2 cm depth measurements where the charge collected decreased the further the ionization
chamber were placed from the central axis. Furthermore, the results also showed the relative energy
independence of the ion chamber used in this study (Exradin A3) in the kV region where the
reduction in the charges collected decreased in similar ratios compared to the measurements at 2 cm
depth. The charge collected is assumed to be within 2 % accuracy (Table 8).
The presented mean mass energy absorption coefficients from Ma and Seuntjens (1999)19 ranges
from 1.022 to 1.109 cm2g-1 for the HVL 0.3 to 20.8 mm in aluminum. If a mean value based on these
two coefficients is used for the calculations of absorbed dose rates at 10 cm depth, then the largest
error in the chosen mean mass energy-absorption coefficient, in this case 1.066 cm2g-1, would be an
additional 4 %. The HVL for 125 keV photons is approximately 17 mm in aluminum.34 Therefore the
spectra of relevant mean mass energy absorption coefficients for the measurements at 10 cm depth
are in the range of approximately 0.3 mm to 20 mm HVL aluminum

23
The calculated absorbed dose rates at 10 cm depth were 5.82, 3.98 and 1.26 mGys-1 for the
measurements at central axis, 5 cm off-axis and 10 cm off-axis, respectively (Table 7). These values
are estimated to be within 7 % accuracy (Table 8).
It should be noted that measurements of the absorbed dose in homogenous phantoms under-and
overestimate the true absorbed dose. The underestimation is caused by the lack of high atomic
number materials, such as bone, in the phantom, which receives a higher dose due to the increased
photoelectric effect interaction in bone. The overestimation is in the soft tissue behind e.g. bone
caused by higher attenuation and fewer photons passing through. However, tissue in front of bone
receives a higher dose caused by the increase backscattering in the surface of the bone. AAPM does
not recommend plastic phantoms to be used for in depth measurements of the absorbed dose as the
chamber correction factors and the conversion factors to derive dose at a depth within water are not
well known. Furthermore, the recommended size of the phantom should be at least 30x30x30 cm3 to
include the contribution from the scattered radiation caused by the large kV beam.18 Despite this
knowledge, the polystyrene phantom was chosen as a consequence of using the spherical ionization
chamber as this was the only phantom available that was customized built for the spherical shape of
the chamber.
The effects of increased absorbed dose in water equivalent phantoms compared to
measurements in a water tank were reported by Ding and Coffey (2010)20 (Table 3), which implies
that the calculated dose rates in this study are an overestimation of the true dose rate in water.
Table 7. The absorbed doses and charge collected for the 2D kV-imaging measurements performed in the polystyrene phantom at 2 and 10 cm depth for 10 cm off-axis, 5 cm off-axis and in the central axis using full fan bow-tie filter and half fan bow-tie filter.
Depth
[cm]
Distance from
central axis [cm]
Bow-tie
filter
Charge
collected
[nCs-1]
Dose rate
[mGys-1]
2 10 Half fan 0.37 3.50
2 10 Full fan 0.32 3.08
2 5 Full fan 0.98 9.34
2 0 Full fan 1.38 13.1
10 0 Full fan 0.60 5.82
10 5 Full fan 0.41 3.98
10 10 Full fan 0.13 1.26
24
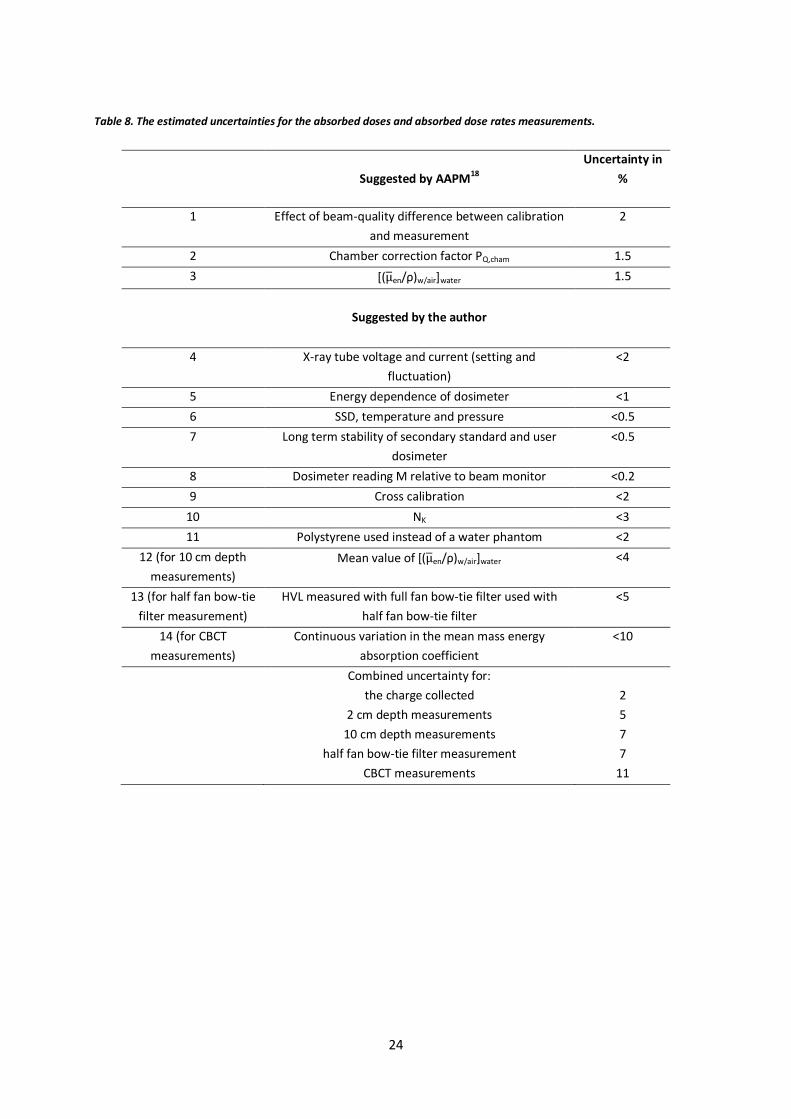
Table 8. The estimated uncertainties for the absorbed doses and absorbed dose rates measurements.
Suggested by AAPM18
Uncertainty in
%
1 Effect of beam-quality difference between calibration
and measurement
2
2 Chamber correction factor PQ,cham 1.5
3 [( ̅en/ρ)w/air]water 1.5
Suggested by the author
4 X-ray tube voltage and current (setting and
fluctuation)
<2
5 Energy dependence of dosimeter <1
6 SSD, temperature and pressure <0.5
7 Long term stability of secondary standard and user
dosimeter
<0.5
8 Dosimeter reading M relative to beam monitor <0.2
9 Cross calibration <2
10 NK <3
11 Polystyrene used instead of a water phantom <2
12 (for 10 cm depth
measurements)
Mean value of [( ̅en/ρ)w/air]water <4
13 (for half fan bow-tie
filter measurement)
HVL measured with full fan bow-tie filter used with
half fan bow-tie filter
<5
14 (for CBCT
measurements)
Continuous variation in the mean mass energy
absorption coefficient
<10
Combined uncertainty for:
the charge collected
2 cm depth measurements
10 cm depth measurements
half fan bow-tie filter measurement
CBCT measurements
2
5
7
7
11
25
Absorbed dose for CBCT pelvis scan
The charge collected from the CBCT pelvis mode at central axis for measurement A (ion chamber at
central axis and 2 cm depth) and B (ion chamber at central axis and 10 cm depth) were 5.37 and 4.59
nC, respectively (Table 9).
As mentioned before in the results for 2D kV imaging, the difference in the charge collected
between the measurements at 2 cm and 10 cm depth in the central axis were 57 %. However, when
performing a CBCT scan with similar exposure parameters, the difference were seen to be 15 %. This
is due to the rotation of the kV source compensating the difference in attenuation from opposite
angles, e.g. if the attenuation is increased in the angle 1800, then the attenuation will decrease in the
opposite angle 0o. This can be seen when the current-reading [nA] from the electrometer is plotted
as a function of time (Figure 8). For measurement A, as the kV source rotated around the phantom,
the current reached its highest value when the phantom were irradiated from above due to the
lesser attenuation in this direction, and its lowest value when the phantom were irradiated from
below due to the increase of attenuating material (18 cm of polystyrene). For measurement B, being
completely in the isocenter of the phantom, this resulted in a more stable current as the photons
from the rotating x-ray tube traversed approximately the same distance to the ionization chamber
from every angle except for the angles 45o, 135o, 225o and 315o which corresponds to the corners of
the square shape phantom. These angles occurred approximately between 0 – 10 seconds, 20 – 30
seconds, 30 – 40 seconds and 50 – 60 seconds causing a drop in the current due to the increased
attenuation as the photons traveled a further distance to the ion chamber (Figure 8).
For measurement C (ion chamber 10 cm off-axis and at 10 cm depth), the charge collected was
lower than the above measurements (Table 9). This is due to the larger air gap for the angles 135o –
225o causing an increased attenuation and a larger part of the primary photons to miss the phantom
compared to the measurements in A and B. These two effects outweighs the increase in charge
collected for the angles 315o – 45o (the opposite direction). As the ion chamber was placed at the
isocenter of the phantom, the current were still relatively stable throughout the scan (Figure 8).
The mean mass energy-absorption coefficient used for the calculations of absorbed dose were the
mean of the coefficients presented by Ma et al (1999)19, 1.058 cm2g-1. This value was chosen due to
the continuous variation of the mass energy-absorption coefficient as a result of a rotating kV source.
Therefore, a mean value of the mass energy-absorption coefficient is assumed to be more accurate.
The absorbed doses were calculated to 51.7, 44.2 and 28.9 mGy for measurement A, B and C,
respectively (Table 9), and are assumed to be within about 11 % accuracy (Table 8). If CBCT scans
were performed regularly on patients, e.g. once a week during a treatment period of 7 weeks, the
additional absorbed dose caused by CBCT scans would approximately be 0.3 Gy using the mean value
of the A, B and C measurements.

26
Table 9. The charge collected and the absorbed doses from a CBCT pelvis scan in a polystyrene phantom for 2 and 10 cm depth at central axis and 10 cm off-axis.
Measurement Depth
[cm]
Distance from
central axis [cm]
kV source rotation
[degrees]
Charge collected
[nC]
Absorbed
dose [mGy]
A 2 0 178o – 182o 5,37 51.7
B 10 0 182o – 178
o 4,59 44.2
C 10 10 182o – 178o 3,00 28.9
Figure 8. The current reading from the electrometer as a function of time during a pelvis CBCT scan. The green and the red line – measurement A and B, shows the polystyrene placed in the central axis where the ionization chamber is placed at 2 and 10 cm depth, respectively. The blue line – measurement C shows the polystyrene placed 10 cm off-axis and the ionization chamber placed at 10 cm depth. Measurement B and C were obtained with the kV source rotating from 182o to 178o in a anticlockwise direction and the measurement A were obtained with the kV source rotating from 178o to 182o in a clockwise direction.
27
Evaluation of SmartAdapt® deformation algorithm
This study investigated nine deformation combinations based on steel, PMMA and water cylinders.
The following letter and number codes will be used to describe the results:
The seven scans were given a number from 1 – 7, imageset#1, imageset#2 etc. The small and large
hole to the left were called S1 and L1 and the small and large hole to the right were called S2 and L2,
respectively. The deformed images will be written as dCTx,y where x is the source and y the target
image. It should be mentioned that the analysis of the presented images in this section were
performed on the slice in the isocenter. Furthermore, the contours outlined for S1, S2, L1 and L2
were done manually whereas the body structure was obtained automatically by the treatment
system (TPS).
The effects of the VOI size on the deformation
Imageset#1 and imageset#6 were deformed to investigate the VOI size impact on the deformation.
These images did not differ in composition, however, imageset#1 was obtained with a CT scanner
and imageset#6 was obtained with a CBCT scanner (OBI®). Figure 9 shows the dCT1,6 with three
different VOI sizes, the top images to the right shows the deformation when the VOI includes the
whole phantom. The middle and bottom images shows the deformation when the VOI encompassed
S2 in different ways.
When choosing a VOI that includes the whole phantom, changes in the contours were seen for all
structures. The most pronounced change was seen for the body structure where the contours took a
diffused shape. This is due to the characteristics of CBCT images as this effect on the body structure
was only seen when CBCT images were chosen as the target image. When choosing a VOI that
includes S2, only the contours of S2 were affected. In the bottom image to the right in Figure 9, the
contours for S2 was seen to shrink and maintained the shape of a circle. When the VOI was chosen
asymmetrically (middle image to the right in Figure 9) the contours were seen to propagate more to
the left and right as a consequence of the VOI size shape. Although the source and target image were
identical in composition and the phantom was mostly homogeneous, the structures were seen to
change in shape and size, however no change in HU was seen when the dCT was compared to the
target and source image (data not shown).
The results indicate that a large VOI will affect and deform more of the structures. Larger errors
can occur due to the increased area for the algorithm to influence. A smaller VOI reduces the extent
of such errors, although only a small part of the image will be deformed which may not represent the
true anatomical situation. Furthermore, even a small VOI can cause large errors if it is chosen
asymmetrical as shown in this study. Nevertheless, the option to determine the area for deformation
brings great flexibility for clinicians. If only a small site in the patient is determined to have changed
during the treatment period, the clinician can choose to only deform that site to reduce possible
errors that originate from nearby structures and reduce computation time (a deformation takes
about 30 seconds). However, a methodology regarding the definition of VOI sizes for certain
structures should be available in clinics to minimize possible inter-user variation.

28
Figure 9. dCT1,6 and the effect of VOI size on the propagated structures. The images to the left are the rigid registration images (source and target image overlaid) with the chosen VOI size and the images to the right are the deformed images for the respective VOI sizes.
29
The effects on the propagated structures depending on the material combination
deformed
Five deformations were performed with hole fillings varied between PMMA, air and steel. The
deformations were made on CT images to exclude possible errors caused by the degraded image
quality in CBCT images. The VOI size chosen included the whole phantom.
PMMA source, Air target
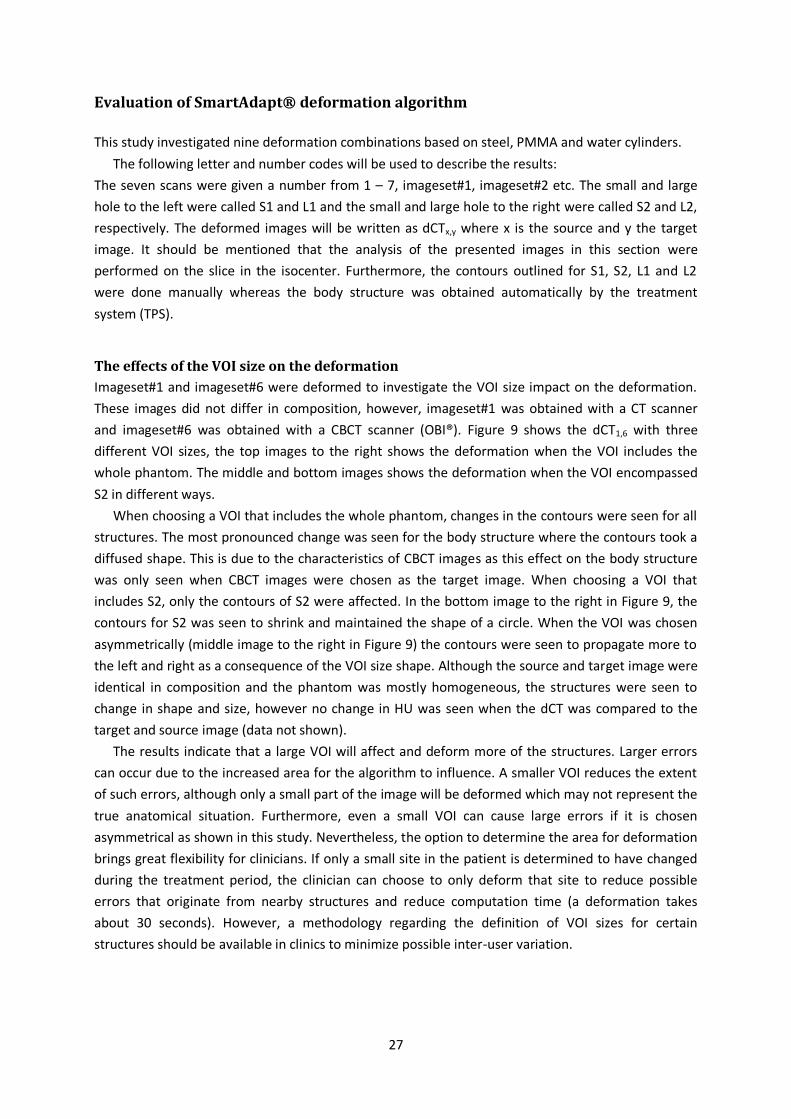
Imageset#1 and imageset#4 were deformed to investigate the transition from PMMA to air
simulating a patient case with a filled colon in the pCT and an empty colon at the next scanning
session. Figure 10 shows the results of dCT1,4 where S1 is filled with PMMA in the source image and
air-filled in the target image. No changes in the size of the contours were seen and the air cavity in
the target image is completely ignored resulting in no change in HU when drawing lineprofile#4
(through the phantom across the small holes S1 and S2). However, the contours of L2 were seen to
increase in size. The desired outcome of this deformation would be inclusion of the air cavity in the
dCT with no changes in the contours size and shape.
Figure 10. dCT1,4 with the source and target image and lineprofile#4 where the red and blue line shows the variation in HU for the deformed and target image, respectively. Before the deformation the source image had a mean HU of 110 in S1 and S2, and 110 for lineprofile#1 – in the middle of the phantom.
30
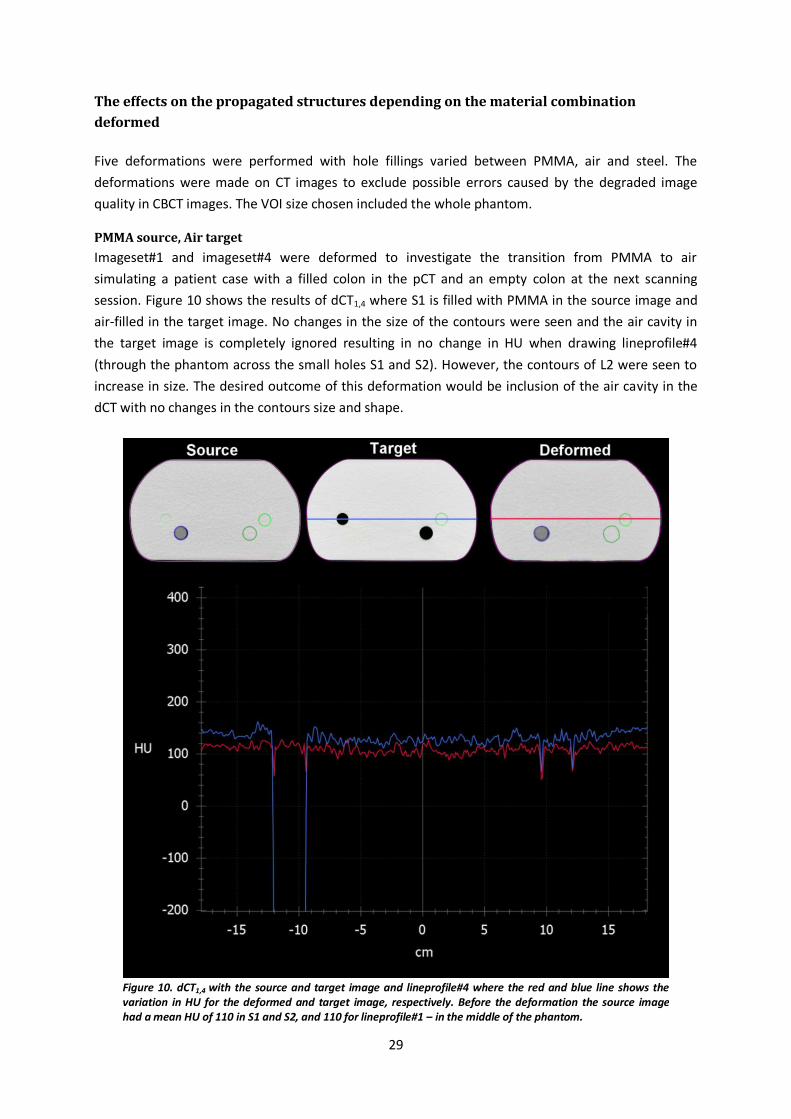
Air source, PMMA target
The opposite deformation was also performed, simulating an empty colon in the pCT and a full colon
at the next scanning session. Figure 11 shows the results of dCT4,1 where S1 is air filled in the source
image and PMMA-filled in the target image. Changes in the size, shape and HU of S1 were seen and
the deformation algorithm partially filled the air cavity with HU corresponding to PMMA. The
partially filling could be due to the nature of the algorithm being an iterative algorithm with fixed
amount of iterations.
The difference in the outcome of dCT1,4 and dCT4,1 is explained by the deformation algorithm’s
higher priority of the source image than the target image. This is seen in Figure 10 and where the
deformed image is more identical to the source image than the target image.
Figure 11. dCT4,1 with the source and target image and lineprofile#4 where the red and blue line shows the variation in HU for the deformed and target image, respectively. Before the deformation the source image had a mean HU of -976 in S1 and S2, and 130 for lineprofile#1 – in the middle of the phantom.

31
PMMA source, Steel target
Deformations with steel cylinders were performed to present extreme cases and test the limitations
of the deformation algorithm. These deformations simulate patient cases where an object with high
atomic number is present causing artifacts in the image as seen in Figure 12 and 13.
Figure 12 shows the results of dCT1,2 where S1 and S2 are PMMA-filled in the source image and
replaced by steel cylinders in the target image. The contours of S1 and S2 were deformed and
increased in size. However, although two metal cylinders and large air artifacts were presented in the
target image, no changes in HU were observed in the deformed image. Even though the target image
had a standard deviation in HU up to 3293, the deformed image maintained a standard deviation of
6.
Figure 12. dCT1,2 with the source and target image and lineprofile#4 where the red and blue line shows the variation in HU for the deformed and target image, respectively. Before the deformation the source image had a mean HU of 110 in S1 and S2, and 110 for lineprofile#1 – in the middle of the phantom.
32
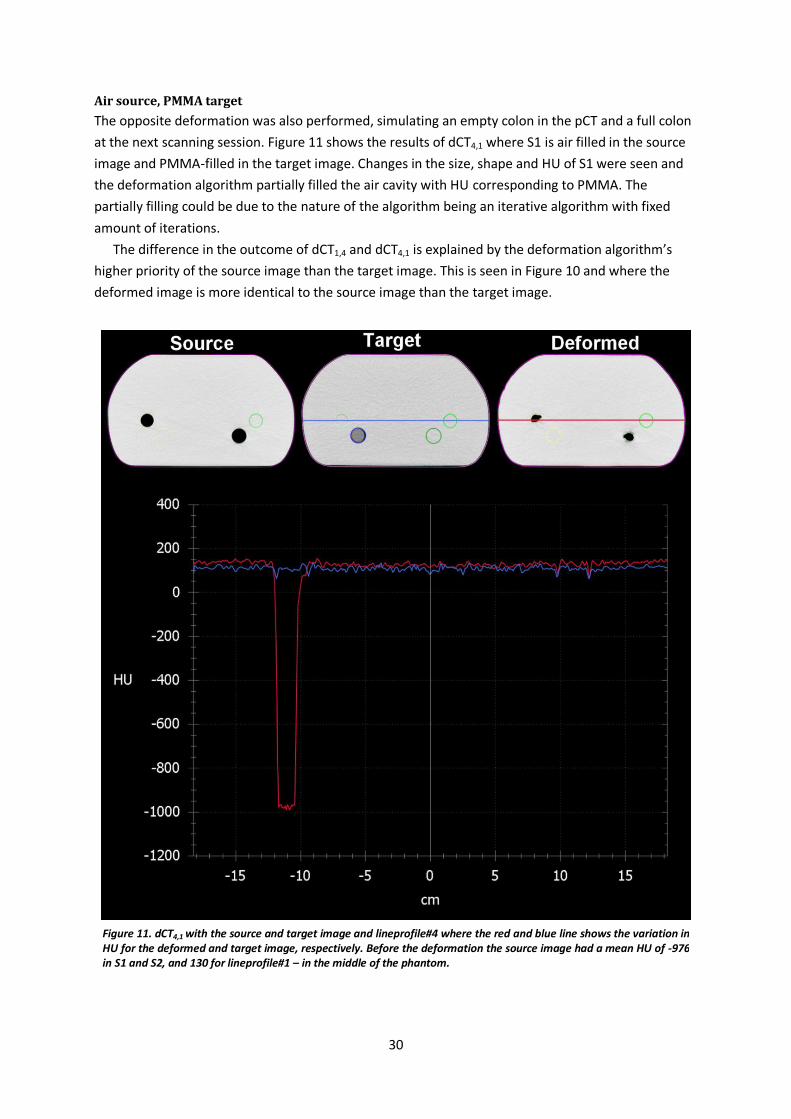
Air source, Steel target
Figure 13 shows the results of dCT4,2 where S1 and S2 were filled with air and PMMA, respectively in
the source image, and then replaced by steel cylinders in the target image. The contours of both S1
and S2 was deformed and seen to shrink in size. Furthermore, S1 was pushed to the left about 1 cm
and S2 were pushed several centimeters upwards. These results differed from previously shown
(Figure 12) where the contours remained at the same position. This could be due to the air artifacts
affecting the air cavities in S1 and L2 – which are displaced several centimeters upwards and
increased in size, almost drawn in by the air artifacts.
When drawing a line profile across the displaced S1 in the deformed image, the change in HU was
seen as a gradual slope in HU from PMMA to air at the periphery of the cavity. When choosing a large
window level to enhance low contrast pixels, the change in HU was seen as gray pixels (data not
shown). As previously concluded, the large standard deviation in HU present in the target image was
not transferred over to the deformed image (data not shown).
Figure 13. dCT4,2 with the source and target image and an enlarged lineprofile#2 where the red and blue line shows the variation in HU for the deformed and target image respectively. Before the deformation the source image had a mean HU of -976 in S1.
33
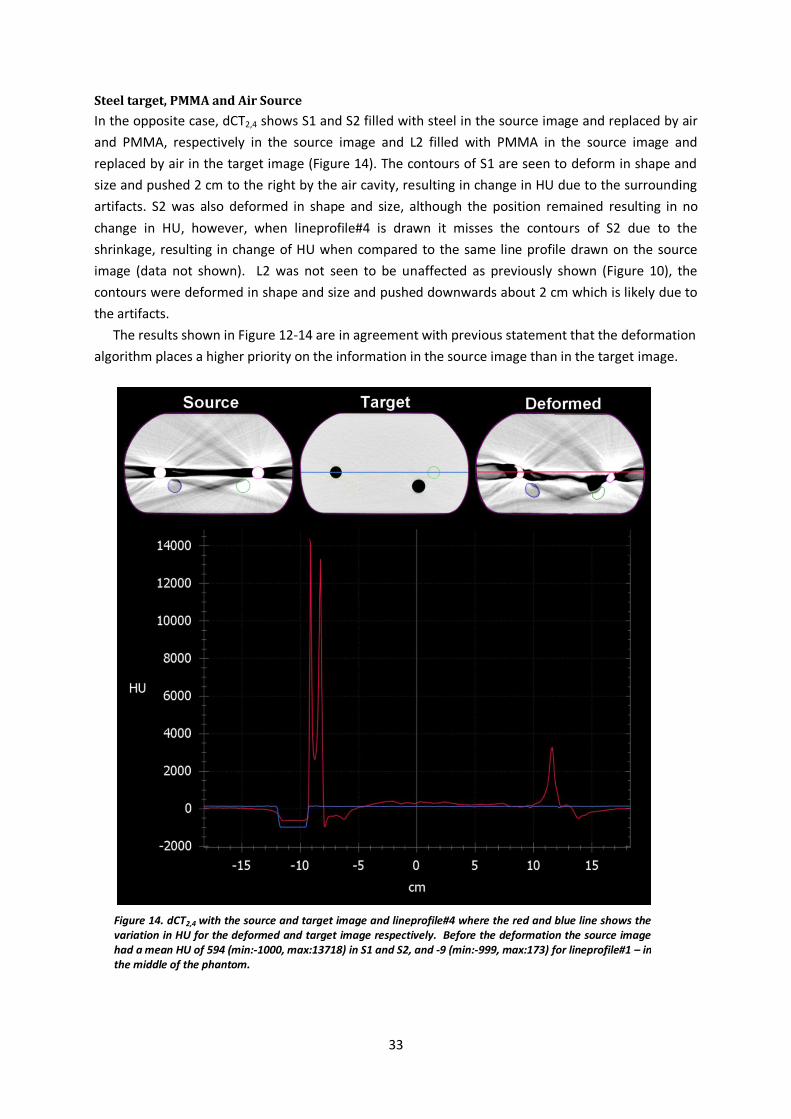
Steel target, PMMA and Air Source
In the opposite case, dCT2,4 shows S1 and S2 filled with steel in the source image and replaced by air
and PMMA, respectively in the source image and L2 filled with PMMA in the source image and
replaced by air in the target image (Figure 14). The contours of S1 are seen to deform in shape and
size and pushed 2 cm to the right by the air cavity, resulting in change in HU due to the surrounding
artifacts. S2 was also deformed in shape and size, although the position remained resulting in no
change in HU, however, when lineprofile#4 is drawn it misses the contours of S2 due to the
shrinkage, resulting in change of HU when compared to the same line profile drawn on the source
image (data not shown). L2 was not seen to be unaffected as previously shown (Figure 10), the
contours were deformed in shape and size and pushed downwards about 2 cm which is likely due to
the artifacts.
The results shown in Figure 12-14 are in agreement with previous statement that the deformation
algorithm places a higher priority on the information in the source image than in the target image.
Figure 14. dCT2,4 with the source and target image and lineprofile#4 where the red and blue line shows the variation in HU for the deformed and target image respectively. Before the deformation the source image had a mean HU of 594 (min:-1000, max:13718) in S1 and S2, and -9 (min:-999, max:173) for lineprofile#1 – in the middle of the phantom.

34
Tumor shrinkage and swelling
Deformations simulating tumor shrinkage and swelling were performed with PMMA cylinders and
blocks to investigate the deformation algorithm’s ability to deform objects placed on the surface of
the pelvis phantom, and to determine if the size of the object matters. In addition, a small cylinder
was placed in L1, to investigate if less pronounced changes were included in the deformation.
Figure 15 shows the results of dCT3,4 where a PMMA cylinder, 2.9 cm in diameter, was placed on
the surface of the source image and later removed in the target image. It was seen that only a
quarter of the cylinder was removed in the dCT. The small cylinder placed in L1 in the source image,
was not seen to change in the deformed image. However, the contours of L2 were seen to increase in
size which was in agreement with the previous results shown in Figure 10.
Figure 15 dCT3,4 with the source and target image where the cylinder on the surface was seen to be partially removed in the deformed image. The contours of L2 were seen to increase in size.

35
For the opposite case, simulating swelling, Figure 16 shows the results of dCT4,3 were the cylinder on
the surface in the target image was not completely adopted in the dCT. However, the body structure
did try to include the cylinder resulting in a gradual change in HU which were seen when drawing line
profiles through the cylinder in the dCT. The changes in HU were also seen when choosing a large HU
window. The small cylinder in L1 in the target image was not included in the dCT.
Figure 16. dCT4,3 with the source and target image simulating swelling. The dCT did not completely adopt the changes in the body structure given in the target image. A gradual change in HU was seen in the line profiles drawn through the cylinder in the superior – inferior and right – left direction. The changes in HU are also seen in an enlarged image of the cylinder with a large HU window.

36
When testing the algorithm for larger changes with the use of a PMMA block, similar results as above
were seen.
Figure 17 shows dCT5,3 where a cylinder was placed on the surface in the source image and a
PMMA block was placed at the top of the phantom in the target image. The deformed image showed
a complete adoption of the PMMA block, resulting in a more accurate deformation compared to
dCT4,3 (Figure 16). Regarding swellings, the algorithm performed better than dCT3,4. This is somewhat
confusing results as the shrinking was simulated with the same cylinder used in dCT3,4. This shows
that a cluster of pixels at one location will not only be affected by the nearby pixels but also by pixels
positioned several centimeters away. The deformed contours of S1 and L1 were in agreement with
previous obtained results (Figure 11 and 15).
In Figure 18 the PMMA block was placed on the top of the phantom in the source image to
simulate a large weight loss. The PMMA block were seen to be removed from dCT5,4 showing a more
accurate deformation compared to the cylinder in dCT3,4 (Figure 15).
The results shown in Figure 16 and 17 contradict the previous statement that the deformation
algorithm places a higher priority on the information in the source image than in the target image,
which were not seen for these two cases. The deformed image was more identical to the target
image rather than the source image. This could be explained by assuming large changes are more
prioritized than the source image.
Figure 17. dCT5,3 with the source and target image simulating tumor shrinkage and swelling. The algorithm is seen to perform better than dCT3,4 showing only a small part of the cylinder remaining on the surface. The accuracy of the deformation was also better than dCT4,3 where the swellings was seen to be completely adopted in dCT5,3.
Figure 18. dCT5,4 with the source and target image simulating tumor shrinkage. The deformed image is seen to completely remove the PMMA block as a result from the information given in the target image.

37
The effects on the deformation when CBCT is chosen as the target
The images seen in Figure 19 compare the difference in the deformed images when CT or CBCT were
chosen as the target. The top images shows imageset#1 (CT), imageset#2 (CT) and dCT1,2. The bottom
images shows imageset#1 (CT), imageset#7 (CBCT) and dCT1,7. When drawing lineprofile#1 the
standard deviation in HU for imageset#2 and imageset#7 was 35 and 75 respectively, and for
lineprofile#2 the difference was 11 and 79 respectively. It is clearly seen that there are larger
variation in HU for CBCT images compared to CT images. dCT1,7 showed larger errors in all the
structures except for L2 (Figure 19), the most pronounced error were seen for the body structure
(also seen in Figure 9) as a consequence of deforming with a CBCT image as the target. However,
there were no changes in HU for the deformed images dCT1,2 and dCT1,7.
Overall, the deformations performed showed a dependence on the VOI, the magnitude of the
presented changes and the standard deviation of HU in the image. The deformed CT images also
showed that a higher priority is placed on the source image rather than the target image. Errors in
the deformation were seen in all images presented, however, the largest errors were evident in the
deformations including artifacts.
It is emphasized that this is the first step in the evaluation of SmartAdapt® where the
deformations were performed in a homogenous phantom to easily visualize the results. If the
software is to be used in clinics, one needs to analyze the possible errors in the deformations for
different patient cases and determine if the PTV for that treatment covers any possible error-margin
in deformation.
Figure 19. Showing the source, target and deformed image of dCT1,2 (top images) and dCT1,7 (bottom images) to visualize the effect on the propagated structures and on the contours of the body when CT or CBCT is used as target image.
38
Conclusions and Future work
Since only two patients were included during the study period, no conclusion can be drawn
regarding if the bladder filling protocol contributes to a reproducible bladder volume. When
comparing the results between the patient following the bladder filling protocol and the
patient with a comfortable filled bladder, the results showed a higher reproducibility in
bladder volume for the patient following the bladder filling protocol. However, a larger
patient group is required to achieve statistical confidence in the results. Furthermore, the
bladder filling protocol used should be easy to follow and possible to fulfill independent of
patient condition. It should also be integrated in the treatment process in such way that it is
unaffected by possible holdups or delays.
The absorbed dose rates for the 2D kV imaging measurements were between 3 – 13 mGys-1.
The absorbed doses measured for a pelvis CBCT scan with OBI® version 1.5 were calculated
to 30 – 50 mGy. These results were seen to depend on measuring depth and location relative
to the central axis of the beam and should solely be used as guidelines. The use of full fan
bow-tie filter was seen to reduce the absorbed dose by 12 % compared to the half fan bow-
tie filter.
The deformation algorithm of SmartAdapt® showed a dependence on the VOI, the
magnitude of the presented changes and the standard deviation of HU in the image. The
deformed CT images showed that a higher priority is placed on the source image rather than
the target image. Possible errors in deformations for different patient cases, e.g. in the pelvis
region, needs to be further investigated if the software is to be used in the clinic.

39
Appendix
Frågeformulär till studie avseende postoperativ prostatabestrålning
En studie har påbörjats för att få en ökad förståelse för hur urinblåsan påverkar närliggande organ vid
bestrålning i bäcken. För att kunna förstå denna relation skulle vi önska att ni ställer följande frågor till
patienterna i samband med CBCT-bildtagningen.
Tack på förhand
Med vänliga hälsningar
Ulrika Lindencrona, Marcus Krantz, Karin Braide och Rimon Thomas
Patient id/nr: ___________________________
Frågor till patient
1. När drack du senast och hur mycket
Datum
[MM/DD]
____dl
____h
____dl
____h
____dl
____h
____dl
____h
____dl
____h
____dl
____h
____dl
____h
____dl
____h
____dl
____h
2. När tömde du blåsan senast
Datum
[MM/DD]
____h ____h ____h ____h ____h ____h ____h ____h ____h
Övriga kommentarer (ifylles av personal):
40
References
1 Anders Nystrand, 'Prostatacancer - Cancerfonden', (2012). 2 Per-Anders Abrahamsson, Prostatacancer - Information För Patienter Och Anhöriga (Astra
Zeneca Sverig, 2006). 3 Marcel R. Stam, Emile N. J. Th van Lin, Lisette P. van der Vight, Johannes H. A. M. Kaanders,
and Andries G. Visser, 'Bladder Filling Variation During Radiation Treatment of Prostate Cancer: Can the Use of a Bladder Ultrasound Scanner and Biofeedback Optimize Bladder Filling?', International Journal of Radiation Oncology, Biology, Physics, 65 (2006), 371-77.
4 Úna M. O'Doherty, David P. Dearnaley, Robert A. Huddart, Helen A. McNair, Andrew R. Norman, Elizabeth Miles, Simon Hooper, Mark Davies, Naomi Lincoln, Jan Balyckyi, and Peter Childs, 'Variability of Bladder Filling in Patients Receiving Radical Radiotherapy to the Prostate', Radiotherapy and Oncology, 79 (2006), 335-40.
5 Michele Stasi, Fernando Munoz, Claudio Fiorino, Massimo Pasquino, Barbara Baiotto, Piergiorgio Marini, Giuseppe Malinverni, Riccardo Valdagni, and Pietro Gabriele, 'Emptying the Rectum before Treatment Delivery Limits the Variations of Rectal Dose–Volume Parameters During 3dcrt of Prostate Cancer', Radiotherapy and Oncology, 80 (2006), 363-70.
6 Claudio Fiorino, Franca Foppiano, Paola Franzone, Sara Broggi, Pietro Castellone, Michela Marcenaro, Riccardo Calandrino, and Giuseppe Sanguineti, 'Rectal and Bladder Motion During Conformal Radiotherapy after Radical Prostatectomy', Radiotherapy and Oncology, 74 (2005), 187-95.
7 Michael Pinkawa, Jaroslav Siluschek, Bernd Gagel, Marc D. Piroth, Cengiz Demirel, Branka Asadpour, and Michael J. Eble, 'Postoperative Radiotherapy for Prostate Cancer : Evaluation of Target Motion and Treatment Techniques (Intensity-Modulated Versus Conformal Radiotherapy)', Strahlentherapie und Onkologie : Organ der Deutschen Röntgengesellschaft ... [et al], 183 (2007), 23-29.
8 Michael Pinkawa, Branka Asadpour, Bernd Gagel, Marc D. Piroth, Richard Holy, and Michael J. Eble, 'Prostate Position Variability and Dose-Volume Histograms in Radiotherapy for Prostate Cancer with Full and Empty Bladder', International journal of radiation oncology, biology, physics, 64 (2006), 856-61.
9 Andrew John Bayley, Michael McLean, Michael Milosevic, Pardraig Warde, Charles Nicholas Catton, Pamela Catton, Tara Haycocks, Valerie Kelly, Hamideh Alasti, Robert Bristow, Juanita Crook, and Mary Krystyna Gospodarowicz, 'A Randomized Trial of Supine Vs. Prone Positioning in Patients Undergoing Escalated Dose Conformal Radiotherapy for Prostate Cancer', Radiotherapy and Oncology, 70 (2004), 37-44.
10 Joep C. Stroom, Peter C. M. Koper, Gert A. Korevaaar, Marjolein van Os, Marjolein Janssen, Hans C. J. de Boer, Peter C. Levendag, and Ben J. M. Heijmen, 'Internal Organ Motion in Prostate Cancer Patients Treated in Prone and Supine Treatment Position', Radiotherapy and Oncology, 51 (1999), 237-48.
11 R. C. Zellars, P. L. Roberson, M. Strawderman, D. Zhang, H. M. Sandler, R. K. Ten Haken, D. Osher, and P. W. McLaughlin, 'Prostate Position Late in the Course of External Beam Therapy: Patterns and Predictors', International journal of radiation oncology, biology, physics, 47 (2000), 655-60.
12 J. V. Lebesque, A. M. Bruce, A. P. Kroes, A. Touw, R. T. Shouman, and M. van Herk, 'Variation in Volumes, Dose-Volume Histograms, and Estimated Normal Tissue Complication Probabilities of Rectum and Bladder During Conformal Radiotherapy of T3 Prostate Cancer', International journal of radiation oncology, biology, physics, 33 (1995), 1109-19.
13 Chiao-Ling Tsai, Jian-Kuen Wu, Chun-Wei Wang, Feng-Ming Hsu, Ming-Kuen Lai, and Jason Chia-Hsien Cheng, 'Using Cone-Beam Computed Tomography to Evaluate the Impact of Bladder Filling Status on Target Position in Prostate Radiotherapy', Strahlentherapie und Onkologie : Organ der Deutschen Röntgengesellschaft ... [et al], 185 (2009), 588-95.
41
14 J. M. Crook, Y. Raymond, D. Salhani, H. Yang, and B. Esche, 'Prostate Motion During Standard Radiotherapy as Assessed by Fiducial Markers', Radiotherapy and Oncology, 37 (1995), 35-42.
15 Åsa Palm, Elisabeth Nilsson, and Lars Herrnsdorf, 'Absorbed Dose and Dose Rate Using the Varian Obi 1.3 and 1.4 Cbct System', (2010).
16 Harry C. Y. Cheng, Vincent W. C. Wu, Eva S. F. Liu, and Dora L. W. Kwong, 'Evaluation of Radiation Dose and Image Quality for the Varian Cone Beam Computed Tomography System', International Journal of Radiation Oncology, Biology, Physics, 80 (2011), 291-300.
17 George X. Ding, Peter Munro, Jason Pawlowski, Arnold Malcolm, and Charles W. Coffey, 'Reducing Radiation Exposure to Patients from Kv-Cbct Imaging', Radiotherapy and Oncology, 97 (2010), 585-92.
18 C. M. Ma, C. W. Coffey, L. A. DeWerd, C. Liu, R. Nath, S. M. Seltzer, J. P. Seuntjens, and Medicine American Association of Physicists in, 'Aapm Protocol for 40-300 Kv X-Ray Beam Dosimetry in Radiotherapy and Radiobiology', Medical physics, 28 (2001), 868.
19 C-M Ma, and J P Seuntjens, 'Mass-Energy Absorption Coefficient and Backscatter Factor Ratios for Kilovoltage X-Ray Beams', Physics in Medicine and Biology, 44 (1999), 131.
20 George X. Ding, and Charles W. Coffey, 'Beam Characteristics and Radiation Output of a Kilovoltage Cone-Beam Ct', Physics in medicine and biology, 55 (2010), 5231.
21 Ning Wen, Huaiqun Guan, Rabih Hammoud, Deepak Pradhan, T. Nurushev, Shidong Li, and Benjamin Movsas, 'Dose Delivered from Varian's Cbct to Patients Receiving Imrt for Prostate Cancer', Physics in Medicine and Biology, 52 (2007), 2267-76.
22 Monica W. K. Kan, Lucullus H. T. Leung, Wicger Wong, and Nelson Lam, 'Radiation Dose from Cone Beam Computed Tomography for Image-Guided Radiation Therapy', International journal of radiation oncology, biology, physics, 70 (2008), 272-79.
23 William Y. Song, Srijit Kamath, Shuichi Ozawa, Shlomi Al Ani, Alexei Chvetsov, Niranjan Bhandare, Jatinder R. Palta, Chihray Liu, and Jonathan G. Li, 'A Dose Comparison Study between Xvi and Obi Cbct Systems', Medical physics, 35 (2008), 480.
24 J. Murphy Martin, J. Ruchala Kenneth, Shirato Hiroki, Yin Fang-Fang, Balter James, Balter Stephen, A. BenComo Jose, Jr., J. Das Indra, B. Jiang Steve, C. M. Ma, H. Olivera Gustavo, and F. Rodebaugh Raymond, 'The Management of Imaging Dose During Image-Guided Radiotherapy: Report of the Aapm Task Group 75', Medical Physics, 34 (2007), 4041.
25 George X. Ding, 'Radiation Dose from Kilovoltage Cone Beam Computed Tomography in an Image-Guided Radiotherapy Procedure', International Journal of Radiation Oncology, Biology and Physics, 73 (2009), 610-17.
26 J. P. Thirion, 'Image Matching as a Diffusion Process: An Analogy with Maxwell's Demons', Medical Image Analysis, 2 (1998), 243-60.
27 S C Klevenhagen, R J Aukett, R M Harrison, C Moretti, A E Nahum, and K E Rosser, 'The Ipemb Code of Practice for the Determination of Absorbed Dose for X-Rays Below 300 Kv Generating Potential (0.035 Mm Al - 4 Mm Cu Hvl; 10 - 300 Kv Generating Potential)', Physics in Medicine and Biology, 41 (1996), 2605.
28 G. X. Ding, and C. W. Coffey, 'Is It Time to Include Imaging Doses in the Reportable Total Radiation Doses of Radiotherapy Patients?', International Journal of Radiation Oncology, Biology, Physics, 72 (2008), S145-S46.
29 D. Schulze, M. Heiland, H. Thurmann, and G. Adam, 'Radiation Exposure During Midfacial Imaging Using 4- and 16-Slice Computed Tomography, Cone Beam Computed Tomography Systems and Conventional Radiography', Dento maxillo facial radiology, 33 (2004), 83-86.
30 Glenn F. Knoll, Radiation Detection and Measurement. 4th Edition edn (John Wiley & Sons, 2010).
31 Jiang Hsieh, Computed Tomography: Principles, Design, Artifacts, and Recent Advances. Second Edition edn (2009).
32 Standard-Imaging, 'Spherical Ion Chambers'2012) <http://www.standardimaging.com/>.

42
33 Varian Medical Systems, 'Dynamic Adaptive Radiotherapy'2012) <http://www.varian.com/us/oncology/treatments/treatment_techniques/DART/treatment_process.html#.UOv73jWjSJM>.
34 National Institute of Standards and Technology, 'Nist Standard Reference Database 126'2004) <http://www.nist.gov/index.html>.
35 C. Fiorino, F. Foppiano, P. Franzone, S. Broggi, P. Castellone, M. Marcenaro, R. Calandrino, and G. Sanguineti, 'Rectal and Bladder Motion During Conformal Radiotherapy after Radical Prostatectomy', Radiother Oncol, 74 (2005), 187-95.
36 M. R. Stam, E. N. van Lin, L. P. van der Vight, J. H. Kaanders, and A. G. Visser, 'Bladder Filling Variation During Radiation Treatment of Prostate Cancer: Can the Use of a Bladder Ultrasound Scanner and Biofeedback Optimize Bladder Filling?', Int J Radiat Oncol Biol Phys, 65 (2006), 371-7.
37 H. Zhang, R. Wang, H. Yan, W. Zhao, R. Feng, S. Jiang, and J. Yu, 'Influence of Bladder Distension Control on Postoperative Intensity-Modulated Radiotherapy in Rectal Cancer Patients', Asian Pac J Cancer Prev, 12 (2011), 2969-72.
38 U. M. O'Doherty, H. A. McNair, A. R. Norman, E. Miles, S. Hooper, M. Davies, N. Lincoln, J. Balyckyi, P. Childs, D. P. Dearnaley, and R. A. Huddart, 'Variability of Bladder Filling in Patients Receiving Radical Radiotherapy to the Prostate', Radiother Oncol, 79 (2006), 335-40.
39 J. V. Lebesque, A. M. Bruce, A. P. Kroes, A. Touw, R. T. Shouman, and M. van Herk, 'Variation in Volumes, Dose-Volume Histograms, and Estimated Normal Tissue Complication Probabilities of Rectum and Bladder During Conformal Radiotherapy of T3 Prostate Cancer', Int J Radiat Oncol Biol Phys, 33 (1995), 1109-19.