improvement of serbian power plants te nt a … · improvement of serbian power plants te nt a and...
TRANSCRIPT

Page 1 of 18
IMPROVEMENT OF SERBIAN POWER
PLANTS TE NT A AND TE NT B BASED
ON ALSTOM ECO|RAMTM STUDY
PERFORMED
Authors:
Dirk Renjewski, ALSTOM Power Service
GmbH, Germany
Vladimir Bozinovic, Thermal Power Plants
Nikola Tesla Ltd., Serbia
Peter Stegelitz, ALSTOM Power Service
GmbH, Germany

Page 2 of 18
1. Abstract
In 2006 ALSTOM was awarded a contract for a study for increase of power output,
efficiency and availability on the Power Plant TE NT A, unit 6. In a second contract was
performed a study for the unit 4 in the same plant focussing just on power output and
efficiency. A third contract for the Power Plant TE NT B, unit 2 was given by EPS in 2007
with the same aims. Both plants are lignite fired.
Forming a joint team of EPS and ALSTOM the three units have been assessed and areas for
potential improvements have been defined. The potential improvements are mainly focused
on:
- Increase of unit power output based on increased main steam generation in the boiler and
modernisation of steam turbines
- Increase of unit efficiency based on improvements in Ljungstroem type air preheater,
electrostatic precipitator, boiler feed pump and steam turbine
- Increase of availability based on a change in maintenance strategy
- Necessary adoptions and modernisations of other equipment like alternator, pulverisers,
pumps, fans, piping etc. in order to meet the requirements of an increased power output.
In a first phase after the assessment the jointly defined potentials have been elaborated
conceptually and the economic effects have been defined. Based on those economic effects
several potentials have been selected for further elaboration in detail.
It has been defined, that the unit power output can be increased in the range of 10 % mainly
based on the increased steam generation in the boiler while the efficiency increase is be
mainly based on steam turbine modernisations and improvements in the equipment as
mentioned above.
The approach used by EPS and ALSTOM in this study and the further project execution is of
wide interest for other power plant owners as it can be easily used and grant improvements in
power plant output, efficiency and availability.
2. ECORAM™
ECORAM is a tool developed by ALSTOM for detailed analysis of plant design, operation
and maintenance of a unit. Based on a systematic investigation of the plant as a whole and
considering most modern design approach ideas for increase of power output, increase of
operational flexibility, increase of availability, reduction of maintenance cost, reduction of
environmental impact are generated. By this the customer of ALSTOM is selecting the goal
to be reached. The customer provides the current operation data, the information regarding
Page 3 of 18
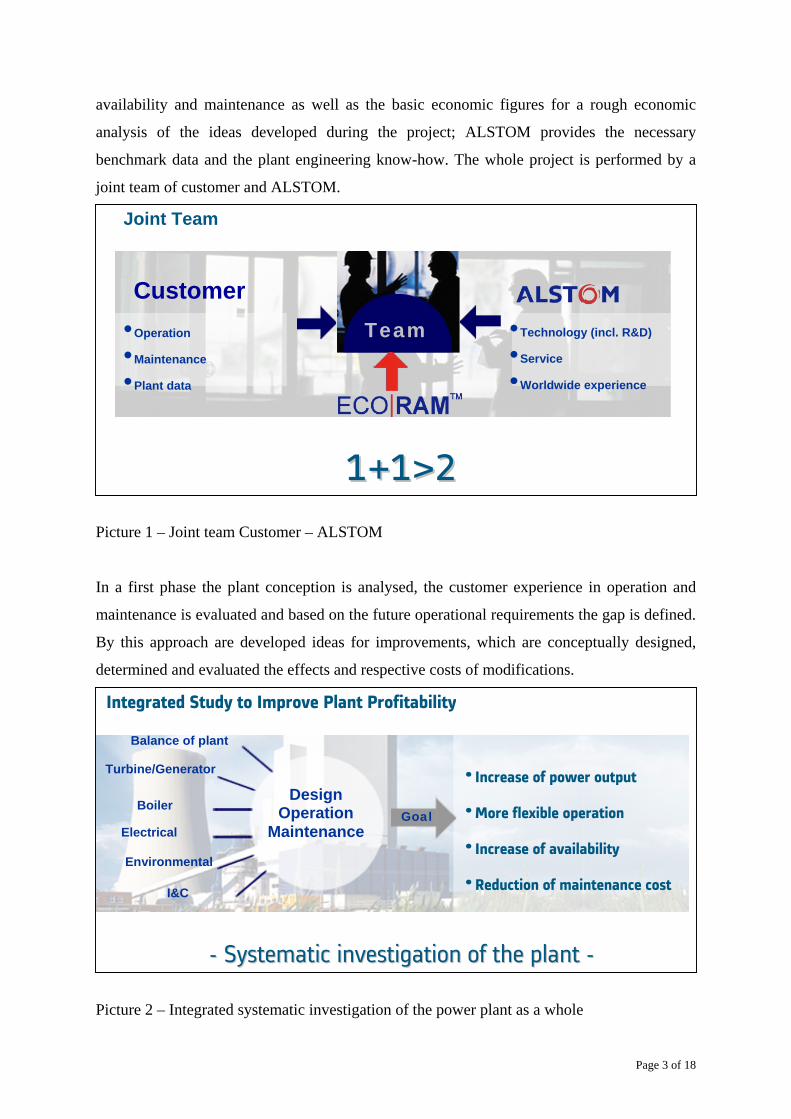
availability and maintenance as well as the basic economic figures for a rough economic
analysis of the ideas developed during the project; ALSTOM provides the necessary
benchmark data and the plant engineering know-how. The whole project is performed by a
joint team of customer and ALSTOM.
Picture 1 – Joint team Customer – ALSTOM
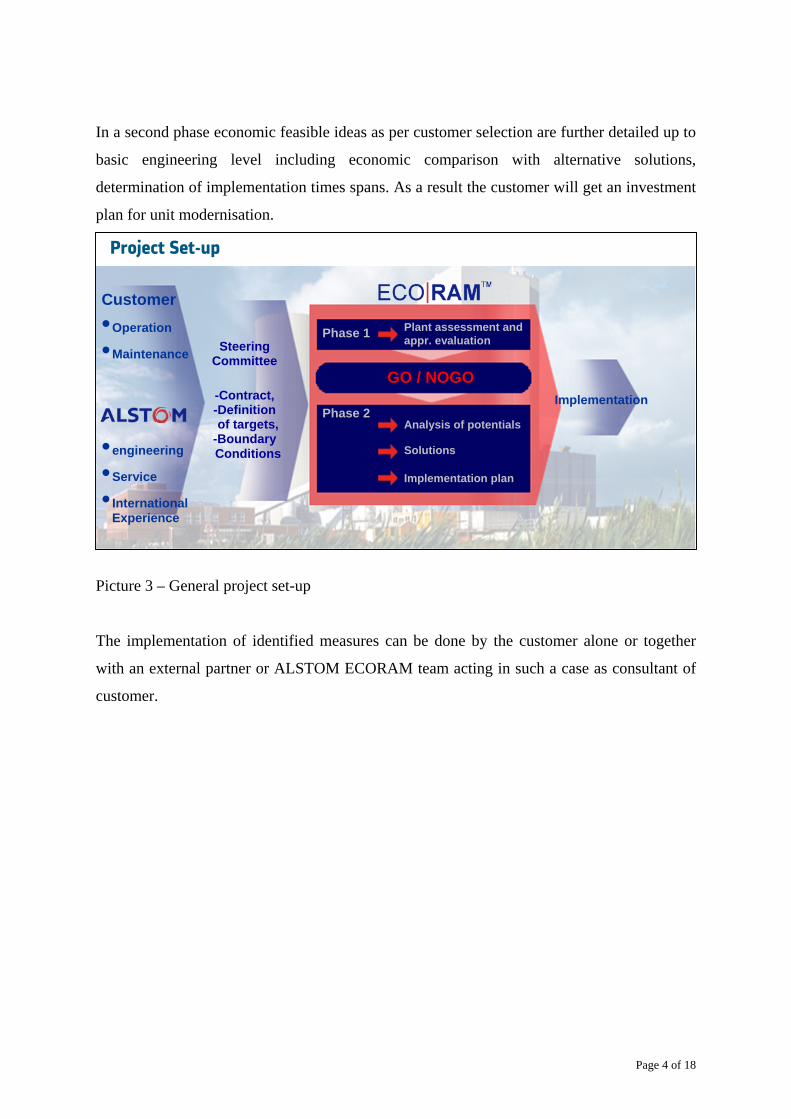
In a first phase the plant conception is analysed, the customer experience in operation and
maintenance is evaluated and based on the future operational requirements the gap is defined.
By this approach are developed ideas for improvements, which are conceptually designed,
determined and evaluated the effects and respective costs of modifications.
Picture 2 – Integrated systematic investigation of the power plant as a whole
• Technology (incl. R&D)
• Service
• Worldwide experience
• Operation
• Maintenance
• Plant data
Team
11++11>>22
Joint Team
Customer
• Increase of power output
• More flexible operation
• Increase of availability
• Reduction of maintenance cost
Goal
Balance of plant
Turbine/Generator
Boiler
Electrical
Environmental
I&C
Design Operation
Maintenance
-- SSyysstteemmaattiicc iinnvveessttiiggaattiioonn ooff tthhee ppllaanntt --
Integrated Study to Improve Plant Profitability
Page 4 of 18
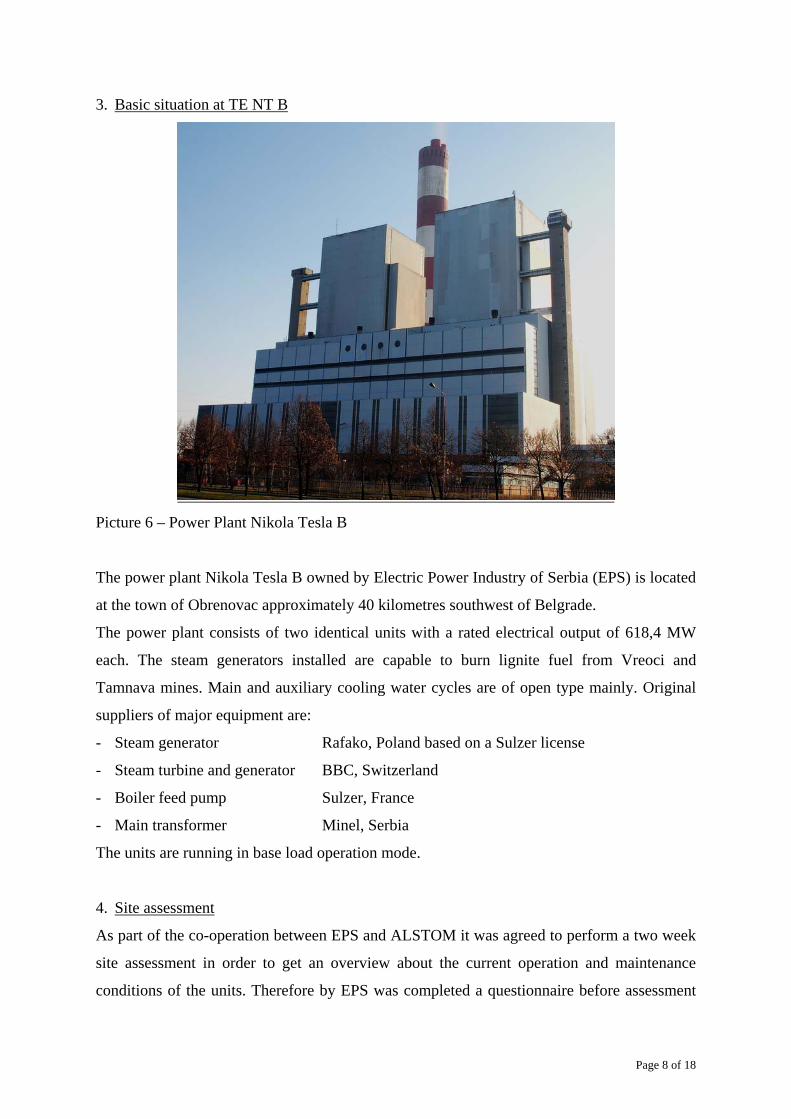
In a second phase economic feasible ideas as per customer selection are further detailed up to
basic engineering level including economic comparison with alternative solutions,
determination of implementation times spans. As a result the customer will get an investment
plan for unit modernisation.
Picture 3 – General project set-up
The implementation of identified measures can be done by the customer alone or together
with an external partner or ALSTOM ECORAM team acting in such a case as consultant of
customer.
Project Set-up
Customer • Operation
• Maintenance
• engineering
• Service
• International Experience
Implementation
Plant assessment and appr. evaluation
Analysis of potentials
Solutions
Implementation plan
Phase 1
Phase 2
GO / NOGO
Steering Committee
-Contract, -Definition of targets, -Boundary
Conditions

Page 5 of 18
The ECO|RAM product family was started to be developed in the year 2000. Since that time
several projects have been performed. The next picture shows the reference list as per August
2008.
Status Customer Country Power Station/
Unit
Output Main Fuel
Order Year
Phase 1 Phase 2
Vattenfall Europe Generation (VE-G)
Germany Jänschwalde 6 x 500 MW
Lignite 2001 Finalised
DSK Germany EVA Ibbenbüren
27 MW Mining Gas
2003 Finalised
Hidrocantabrico Spain Abono 1 350 MW Hard Coal
2003 Finalised
RWE Power Germany Neurath E 600 MW Lignite 2003 Finalised
VE-G Germany Schwarze Pumpe
2 x 800 MW
Lignite 2004 Finalised
E.on UK United Kingdom
Ironbridge 2 x 500 MW
Hard Coal
2006 Finalised
Energy Randers Denmark Randers CHP
49 MWe + 105 MWth
Coal / Wood
2006 Finalised
EPS Serbia TE NT A6 308,5 MW Lignite 2006 Finalised Start November
2007
British Energy United Kingdom
Eggborough 4 x 500 MW
Hard Coal
2006 Finalised Start September
2007
EPS Serbia TE NT B2 620 MW Lignite 2007 Finalised Start November
2007
EPS Serbia TE KO B 2 x 348,5 MW
Lignite 2008 Start February
2008
Picture 4 – ECO|RAM references

Page 6 of 18
During the execution of several ECO|RAM projects it was found that in some cases the
ECO|RAM is too large to find a solution for the certain problems in plant operation and
maintenance. That’s why a new product group called STEP|x was developed. The generic
approach to such projects is the same as for ECO|RAM but as the project is fixed on the
solution of a more single problem like just output increase or increase of some equipment
capacity etc. the projects can become much smaller and faster to be done.
Currently the STEP|x product family consists of:
STEP|C Capacity/ Flexibility Increase
STEP|L Lifetime Extension
STEP|R System Re-Design
STEP|S Plant Status (Due Diligence)
STEP|W Water Chemistry/ Water Management
Customer Country Power Station/ Unit
Output Main Fuel
Order Year
STEP|x Status
ESKOM South Africa Arnot 6 x 350 MW
Hard Coal
2003 STEP|C Finalised
Vattenfall Heat Germany HKW Berlin-Mitte
400 MWth Gas / Oil
2004 STEP|C Finalised
Tavanir Iran Bandar Abbas 4 x 320 MW
Oil / Gas
2004 STEP|S Finalised
VE-G Germany Jänschwalde / Boxberg
8 x 500 MW
Lignite 2005 STEP|L Finalised
EnBW Germany Heilbronn 7 750 MW Hard Coal
2005 STEP|C Finalised
RWE Germany BASF 3 x 200 MW
Gas / Oil
2005 STEP|R Finalised
ESKOM South Africa Matla 6 x 600 MW
Hard Coal
2005 STEP|C Finalised
STEAG SaarEnergie
Germany Weiher 680 MW Hard Coal
2006 STEP|W Finalised
DONG Denmark Studstrup 4 350 MW Hard Coal
2006 STEP|R Finalised
ESKOM South Africa Kendal 6 x 730 MW
Hard Coal
2006 STEP|C Finalised
E.on Germany Franken 426 MW Gas / Oil
2006 STEP|C Finalised

Page 7 of 18
Customer Country Power
Station/ Unit Output Main
Fuel Order Year
STEP|x Status
RWE Germany BASF 3 x 200 MW
Gas / Oil
2006 STEP|R Finalised
DONG Denmark Esbjerg 417 MW Hard Coal
2006 STEP|C Finalised
EnBW Germany Heilbronn 7 750 MW Hard Coal
2006 STEP|C Finalised
ESKOM South Africa Matimba 6 x 670 MW
Hard Coal
2007 STEP|C Finalised
ESKOM South Africa Lethabo 6 x 620 MW
Hard Coal
2007 STEP|C Finalised
ESKOM South Africa Tutuka 6 x 610 MW
Hard Coal
2007 STEP|C Finalised
ESKOM South Africa Duvha 6 x 600 MW
Hard Coal
2007 STEP|C Finalised
ESKOM South Africa Majuba 6 x 660 MW
Hard Coal
2007 STEP|C Finalised
ESKOM South Africa Kriel 6 x 500 MW
Hard Coal
2007 STEP|C Finalised
EPS Serbia TE NT A4 308,5 MW Lignite 2007 STEP|C Finalised
Hidrocantabrico Spain Abono 1 350 MW Hard Coal
2007 STEP|C Finalised
SNET France Gardanne 868 MW Hard Coal
2007 STEP|W Finalised
Vattenfall Heat Germany HKW Berlin-Mitte
400 MWth Gas / Oil
2008 STEP|C Start September
2008
EnBW Germany Marbach 55 MW + 265 MW
Gas / Oil
2008 STEP|C Finalised
DELTA Australia Vales Point 2 x 660 MW
Hard Coal
2008 STEP|S Finalised
CGTEE Brazil Presidente Medici
2 x 63 MW Hard Coal
2008 STEP|S Finalised
Picture 5 – STEP|x references
Page 8 of 18
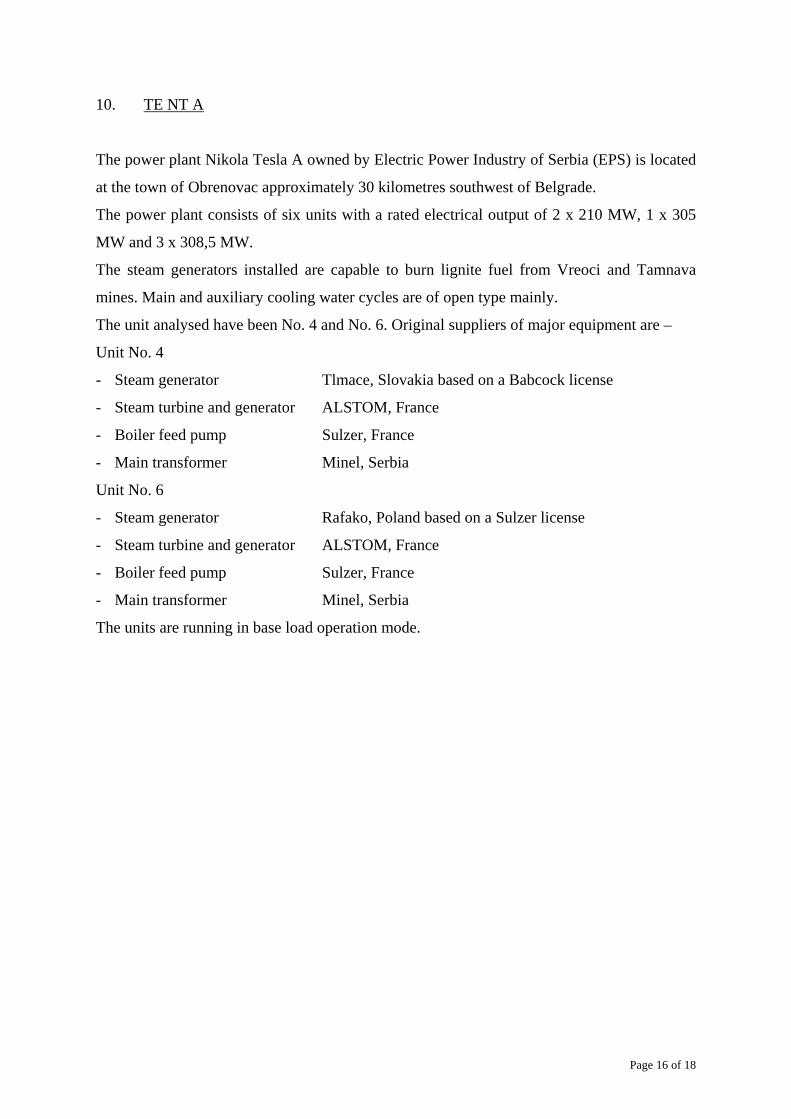
3. Basic situation at TE NT B
Picture 6 – Power Plant Nikola Tesla B
The power plant Nikola Tesla B owned by Electric Power Industry of Serbia (EPS) is located
at the town of Obrenovac approximately 40 kilometres southwest of Belgrade.
The power plant consists of two identical units with a rated electrical output of 618,4 MW
each. The steam generators installed are capable to burn lignite fuel from Vreoci and
Tamnava mines. Main and auxiliary cooling water cycles are of open type mainly. Original
suppliers of major equipment are:
- Steam generator Rafako, Poland based on a Sulzer license
- Steam turbine and generator BBC, Switzerland
- Boiler feed pump Sulzer, France
- Main transformer Minel, Serbia
The units are running in base load operation mode.
4. Site assessment
As part of the co-operation between EPS and ALSTOM it was agreed to perform a two week
site assessment in order to get an overview about the current operation and maintenance
conditions of the units. Therefore by EPS was completed a questionnaire before assessment

Page 9 of 18
start and during the assessment interviews regarding all operation and maintenance questions
have been performed.
It was found during the assessment that the boiler operation represents the most non-reliable
part of the unit. The reasons for this circumstances are mainly seen in big fluctuations in coal
quality as delivered from the mines to the power plant in regard of heating value range from
6,0 MJ/kg up to 9,3 MJ/kg and particle size resulting in damages based on corrosion and
erosion on the several heating surfaces as well as lack of pulveriser capacity from time to
time. Furthermore it was found that the fresh air flow through the Ljungstroem type air
preheater is just 70 % and the other 30 % of fresh air for burning is false air.
During the site assessment 25 ideas have been developed. They have been grouped into:
- Power output increase Boiler feed pump capacity
Pulveriser capacity
Boiler improvements in order to reach increase steam
flows
Cooling water flow increase through auxiliary condenser
Increase of steam turbine swallowing capacity in order to
meet increased steam flows from boiler
- Unit efficiency increase Improve of pulveriser operation
Reduction of hot gas recirculation
Improve Ljungstroem type air preheater sealing
Energy optimisation and improved control system of
Electrostatic precipitator
In the following two examples the major interest is laid on the power output increase.

Page 10 of 18
5. Example 1 – Optimisation of steam generator area
Picture 7 – Optimisation of steam generator and air preheater
As determined during the site assessment the steam generator is in general capable for a 10 %
main and reheat steam output increase. To reach this it is necessary to bring the steam
generator back to the original design conditions including an improved sealing of the furnace
and the Ljungstroem type air preheater.
The bottleneck for the output increase in this area is seen in the capacity of the beater wheel
mills. In general - the beater wheel mill as hearth of a lignite firing system is determining
directly the power output of the boiler. Based on the function of the mill acting like a radial
fan, the mill sucks the hot flue gases required for coal drying and transport out of the
combustion chamber independently. In the same time the lignite is pulverised to a predefined
fineness of the coal dust. The basic processes drying, pulverising and dust transport –
ventilation – are linked together in a way that a system analysis is mandatory.
Optimisation of Steam generator and Air Heater
1
2
3
4
1 – High leakage rate across air heater 2 – High leakage rate in the boiler area 3 – Low amount of combustion air 4 – Low amount of secondary air at
burners 5 - High damage rate of heating surfaces 6 – Limits for a 110 % load operation
5 6

Page 11 of 18
The picture 8 shows in a schematic manner the circuit of the system beater wheel mill
consisting of:
- Recirculation duct
- Mill
- Classifier
- Dust piping
- Burner
- Combustion chamber
Picture 8 – Circuit lignite firing with beater wheel mill
Com
bust
ion
Cha
mbe
r
Burner
Primary Air (~300°C)Hot Gas
(>1000°C)
Lignite(Feeder)
Beater Wheel Mill with Classifier
Height [m]
Pressure [mbar]
(-) 0 (+)
Com
bust
ion
Cha
mbe
r
Burner
Primary Air (~300°C)Hot Gas
(>1000°C)
Lignite(Feeder)
Beater Wheel Mill with Classifier
Height [m]
Pressure [mbar]
(-) 0 (+)
Com
bust
ion
Cha
mbe
r
Burner
Primary Air (~300°C)Hot Gas
(>1000°C)
Lignite(Feeder)
Beater Wheel Mill with Classifier
Height [m]
Pressure [mbar]
(-) 0 (+)Height [m]
Pressure [mbar]
(-) 0 (+)Height [m]
Pressure [mbar]
(-) 0 (+)

Page 12 of 18
System parts Pressure loss Pressure win Pressure build up
(1) Recirculation duct X
(2) Mill door X
(3) Combustion chamber X
(4) Burner and pulverised coal duct
X X
(5) Classifier X X
Summary PL + PW = (6) Mill – Beater Wheel
Table 1 – Rough system analysis
The picture shows that changes on the single components of the system (dimensions, shape,
baffles etc.) are changing the requirements on the power output of the mill itself. The same
applies if the coal quality is changed and/ or the coal quality range width is widened.
The following reasons can reduce the output of the beater wheel mill system:
- Pressure loss
- Wear or maintenance strategy
- Maintenance quality
- False or uncontrolled air
- Improper measurement instruments or insufficient number thereof installed
- Overloading by fuel
In order to define the fuel quality depending system optimum in regard of fuel amount and
efficiency/ economy the following should be performed:
- Detailed assessment of the system
- Process analysis
- Mill measuring based on mill test operation
- Detailed fuel analysis including determination of pulverising capabilities in a beater wheel
mill
- Assessment of maintenance approach and quality
- Theoretical simulation.

Page 13 of 18
After the first estimation and after the implementation of the measures as mentioned below,
the capability of the plant components are likely to be sufficient in order to achieve the
requested targets of the mill process:
- Coal – homogenisation (decreased range of heat value variations), reduction of xylite
parts, coal – ONLINE - analysis as an active control value etc.
- Intense decrease of leakage resulting in improvement of combustion, temperature control,
flow etc.
- Decrease of pressure loss in the mill
- Optimisation of the coal distribution
- Increase of the control ability of the mill (new control curves, more and/ or modern
measurement equipment)
- Use of wear-material with higher life time
- Optimisation of the maintenance and repair
- Adaptation of the pulverized fuel ducts and the firing system
6. Example 2 - Increase swallowing capacity of steam turbine
Picture 9 – New HP-Turbine blade path
On turbine and generator side the HP-turbine represents a bottleneck. The currently installed
HP-turbine is not capable to cover the increased main steam flow without increase in main
steam pressure. Therefore it is necessary to redesign the steam path of this turbine.
It was performed additionally an analysis of the other equipment in the water-steam-cycle in
order to determine other systems to be modified, e.g. alternator and condensate extraction
pumps.

Page 14 of 18
7. Example 3 – Energy optimisation of Electrostatic precipitator
The currently installed ESP control is trying to introduce as much energy as possible into the
system and therefore to remove the maximum possible amount of dust.
It is proposed to install a different control system as the recent experience with different
lignite fuel types has shown that there will be no any further decrease of dust emissions upon
certain strength of the electric field. The proposed system performs automatic self
optimisation of the power input in relation to the required dust emission level. By this power
savings in the range of up to 80 % can be realised without an important change of the emitted
dust level.
Picture 10 – Energy optimisation of ESP
8. Example 4 – Change in maintenance strategy
The currently used in TE NT B maintenance strategy is based on performing major overhauls
every 8 years with a usual 120 days period, medium overhaul every 3 years – 45 days period
planned - and minor overhauls each year for a time span of 30 days. This maintenance
strategy is reflecting the pure preventive maintenance approach and does not fit to current
needs in Serbian electric power grid suffering a lack of electricity.
Installation of dust emission measurement and connection with the control cubicles and installation of new control equipment
Energy optimisation of ESP
Control cubiclesHigh Tension
Rectifier Dust emission
measuring

Page 15 of 18
In order to improve the maintenance strategy it is recommended to perform intensive
technical and social competency based training for operation and maintenance staff on all
levels and to provide them with modern computerised maintenance management systems.
After performing those measures it is possible to change the maintenance strategy to a more
predictive type one in one of the following two alternatives:
Major overhaul every 8 years for a 73 days period
Medium overhaul every 4 years for a 44 days period
Minor overhaul every year for a 9 days period
Or
Major overhaul every 6 years for an 86 days period
Medium overhaul every 6 years for a 60 days period
No minor overhaul as the equipment will be maintained during unplanned shutdowns only.
For this an unplanned unavailability of the unit per year should be considered. As the major
reason for unplanned shutdown of the unit is seen in boiler area no change compared to
today’s situation in unavailability is expected.
The installation of new or modernised/ retrofitted equipment in the power plant gives the
additional chance to increase the time span between two overhauls. E.g. for ALSTOM steam
turbines the maintenance recommendation shows a time span of 100000 equivalent operation
hours between two major overhauls.
9. Summary TE NT B
The study performed show that it will be possible to increase the power output of each unit in
TE NT B by 49 MW without major investments required. A further output increase is
possible based on new IP- and LP-turbine design but is requiring major changes in the
alternator and therefore higher investments.
By this the steam generator is not overloaded – the material limits are used to a higher extend
only.
Page 16 of 18
10. TE NT A
The power plant Nikola Tesla A owned by Electric Power Industry of Serbia (EPS) is located
at the town of Obrenovac approximately 30 kilometres southwest of Belgrade.
The power plant consists of six units with a rated electrical output of 2 x 210 MW, 1 x 305
MW and 3 x 308,5 MW.
The steam generators installed are capable to burn lignite fuel from Vreoci and Tamnava
mines. Main and auxiliary cooling water cycles are of open type mainly.
The unit analysed have been No. 4 and No. 6. Original suppliers of major equipment are –
Unit No. 4
- Steam generator Tlmace, Slovakia based on a Babcock license
- Steam turbine and generator ALSTOM, France
- Boiler feed pump Sulzer, France
- Main transformer Minel, Serbia
Unit No. 6
- Steam generator Rafako, Poland based on a Sulzer license
- Steam turbine and generator ALSTOM, France
- Boiler feed pump Sulzer, France
- Main transformer Minel, Serbia
The units are running in base load operation mode.

Page 17 of 18
Picture 11 – Power Plant Nikola Tesla A
It was determined by the assessment and further home office elaborations that on both units
the steam production from the steam generator can be increased by 10 % as well as for TE
NT B. This was taken as basic point for the further elaborations.
On unit A4 the maximum achievable power output is limited by the alternator design to a
maximum of 386 MVA while on unit A6 this value is 405 MVA – both based on stator
cooling water flow and hydrogen pressure increase to a technically reasonable and economic
extend.

Page 18 of 18
As EPS is considering the installation of an additional district heating extraction from the
power plant, the study recommended using for this the unit A4. On unit A6 it was
recommended to use the maximum permissible power output increase. In order to reach this
it was proposed to perform the following activities:
- Steam generator Extended major overhaul
- Beater wheel mills system Improve operation
- Steam turbine Retrofit of all turbine parts
- Alternator Increase of stator cooling water flow and hydrogen
pressure after major overhaul
- Boiler feed pump Replacement of pump cartridge