improvements in piezoelectric sensors and wim data
TRANSCRIPT

- 1-
Improvements in Piezoelectric Sensors and WIM Data Collection Technology
Xiaohua Jiang Associate Professor
Department of Mechatronics Engineering Nanjing University of Science and Technology, China
E-mail: [email protected] Shahram H. Vaziri
PhD Candidate Department of Civil and Environmental Engineering
University of Waterloo, Canada E-mail: [email protected]
Carl Haas Professor, Canada Research Chair
Department of Civil and Environmental Engineering University of Waterloo, Canada
E-mail: [email protected] Leo Rothenburg
Professor, Dean of Engineering Office Department of Civil and Environmental Engineering
University of Waterloo, Canada E-mail: [email protected]
Gerhard Kennepohl Adjunct Professor
Department of Civil and Environmental Engineering University of Waterloo, Canada
E-mail: [email protected] Ralph Haas
The Roman W. McLeod Engineering Professor Department of Civil and Environmental Engineering
University of Waterloo, Canada E-mail: [email protected]
Paper prepared for presentation at the _ Innovations in Pavement Monitoring and Evaluation_Session of the 2009 Annual Conference of the Transportation Association of Canada Vancouver, British Columbia

- 2-
ABSTRACT Weigh-in-Motion (WIM) technology has been applied in traffic monitoring and weight enforcement, pavement design protocols, pavement management, and transportation safety for approximately fifty years. In September 2007 three types of WIM piezoelectric sensors (ceramic, polymer and quartz) were installed at the Centre for Pavement & Transportation Technology (CPATT) test site and then evaluated. Surveys of the test site showed that the WIM test site was qualified and met the North American WIM calibration standard ASTM E1318-02. The layout of the three sensors and the differences in their installation procedure are described in this paper and their calibration procedure and performances compared. Comparisons of static weights with the measured weight data for each type of sensor under different test runs, speeds, temperatures and different vehicles, as well as monthly statistical analyses of the three types of sensors, were completed. To better understand the inherent performance of the sensors, a data acquisition system was also introduced for raw signal collection. The objective of this paper is to report in detail on preliminary evaluation results from this installation and to make suggestions based on these results for low cost improvements in piezoelectric WIM technology. The evaluation verified that the piezoelectric quartz sensor technology has the best weight measurement accuracy, non-sensitivity to temperature change, and an overall best performance among these three sensors. Therefore, the quartz sensor was also chosen for the Ontario Ministry of Transportation (MTO) Hwy-401 LTPP project for field data collection and further research. However, this performance comes at a higher cost than the other sensors. Research is being directed forward to improve the other sensors’ performance with inexpensive auto-calibration methods based on temperature, vehicle class, and speed adjustments.
INTRODUCTION With the rapid development of Weigh-in-Motion (WIM) technology, more and more WIM applications have been introduced in many countries around the world. WIM technology has been widely applied in traffic monitoring and weight enforcement, up-to-date pavement design protocols, pavement management, and transportation safety. For the purpose of improving static weight estimation of WIM systems, many new types of sensors, such as Fiber Optic Sensors and strain gauges have been developed in WIM applications. However, traditional pressure sensors such as piezoelectric sensors, bending plates and load cells still play very important roles in this technology. Among them, the bending plate based WIM system is a strain-based scale with relatively inexpensive installation and intermediate performance; the load-cell based WIM provides an accurate and easily maintainable system at a higher equipment and installation cost, while conventional piezoelectric sensors provide the lowest accuracy with the lowest cost [1]. Because of the low installation and maintenance cost, piezoelectric sensors are widely used in various applications in WIM technology.

- 3-
Piezo-ceramic, piezo-polymer and piezo-quartz sensors are three widely used piezoelectric sensors. These sensors are different in shape, dimension, cost and sensitivity to environmental conditions. To evaluate these sensors’ performance and have a better understanding of their behavior, three typical piezoelectric sensors provided by three different vendors were installed in Centre for Pavement and Transportation Technology (CPATT) test site and tested. These sensors are described below:
1. Roadtrax® Brass Linguini® (BL) (named for what it looks like - a Brass Linguini) class I axle polarized polyvinylidene fluoride (PVDF) WIM sensor made by Measurement Specialties, Inc. (MSI);
2. Piezolor® type PE polarized ceramic WIM sensor made by Electronique Contrôle Mesure (ECM); and
3. Lineas® quartz piezoelectric Type 9195E WIM sensor made by Kistler Instrumente AG (Kistler).
According to these three types of sensors’ specifications, all of them are suitable to be used in WIM applications. The Roadtrax® BL Sensor uses spiral-wrapped PVDF Piezoelectric film as the piezoelectric material. It can be installed directly into a slot cut into the road with a relatively small cross section for permanent applications, or taped down for portable applications. Its physical flexibility makes it easily conformable to any road transverse profile. According to its vendors, “the BL sensors' unique flat design results in a more accurate count by excellent signal to noise ratio (SNR) which has an inherent 10:1 rejection of road noise and reduction of "ghost axles" due to road bending, adjacent lanes and bow waves of approaching vehicles, conforming to the road profile giving a clean easy-to-read signal that translates into accurate vehicle count, speed and WIM data” [2].
The type PE Piezolor® ceramic piezoelectric sensor can be applied in WIM, speed measurement and vehicle classification. It can be used in asphalt and concrete slab roads. According to its vendor’s literature, with its epoxy resin material reinforced by an aluminum support, its accuracy class could be I (±7%) or 0 (±3%). It is also estimated that the effective life time of these piezoelectric sensors is better than five years with mean time between failures (MTBF), of 20 million equivalent single axle loads (ESALs), and without any deformation or cracking of the road [3].
The Lineas® quartz piezoelectric Type 9195E WIM sensor utilizes quartz crystal force sensing technology. It consists of an aluminum alloy profile in the middle of which quartz discs are fitted every 5 cm under pre-loading. This structure allows the measurement of vertical forces, such as wheel loads. The sensor is isolated from side forces by a special elastic material. It is decoupled from lateral forces and measures only vertical forces, so no ghost axles appear. On the other hand, 100% of the forces on the top of the sensor are measured, so there is no lost information. These

sensors must be installed flush with the surface of any existing or new asphalt or concrete pavement surface with epoxy adhesive [4].
These three sensing technologies are characterized in the following sections based on extensive field data. Based on the knowledge gained in this analysis, suggestions are made for low cost improvements to these technologies. The layout and installation of WIM sensors are introduced, followed by the calibration of these sensors. Their performance is reported in this paper with respect to wheel path, vehicle speed and temperature. Future analysis is focusing on a much larger database which allows study of the impact of vehicle class and weight as well.
LAYOUT AND INSTALLATION OF WIM SENSORS Research on WIM technology at CPATT began in September 2003. A piezoelectric WIM system was installed on the two-lane stone mastic asphalt (SMA) section of the test track at the Landfill of the Regional Municipality of Waterloo’s Waste Management facility, 925 Erb Street West, Waterloo, Ontario [5] (Figure 1).
Figure 1 Regional Municipality of Waterloo’s Waste Management Facility
The site is only 6 km from the University of Waterloo main campus. In addition, shown in Figure 2, static scales of the Waste Management facility exist at the entrance of the test track, only 800 meters upstream from the WIM sensors, such that accurate static vehicle weights are readily available for comparison with WIM weight estimations. These advantages make the site an ideal location for WIM research.
- 4-

Figure 2 Static scales on site
The first permanent WIM system at CPATT, installed in September 2003, consisted of two BL Class I piezoelectric sensors plus two inductive loops on each lane. A roadside cabinet was installed to house the electronics for the WIM system, with a solar panel to provide a power supply for the system. The data logger used for data collection was the TCC-540 provided by International Road Dynamics Inc. In the spring of 2006, a detailed field survey found that the sensors on the southbound lane were damaged. In May 2006, the site was rehabilitated to a stable structure according to ASTM standards, and the damaged sensors were replaced in June 2006.
After some calibration efforts on this installation, the research team decided to install three new sets of piezoelectric sensors. In September 2007, these WIM sensor sets were installed. They included a ceramic sensor, a polymer and a quartz sensor. For convenience, they are called by the names of the manufacturers (ECM, MSI and Kistler) in this paper. These three additional sets of sensors are configured as double strip piezoelectric sensors centered on single induction loops (Figure 3). The TCC-540 data logger was replaced by a Hestia P station purchased from ECM which has 4 universal detector boards to collect 4 WIM sensor set inputs. A layout and a photo of these four types of sensors are shown in Figure 3 and Figure 4 respectively.
Figure 3 Layout of WIM sensors
- 5-

Figure 4 WIM sensors on CPATT test road
Several sensor configurations are used for piezoelectric based WIM sensor systems. They include Loop-Piezo-Loop-Piezo, Loop-Piezo-Piezo-Loop and Piezo-Loop-Piezo. For the IRD WIM set installed in 2003, the system was configured as Loop-Piezo-Piezo-Loop. For the Hestia P traffic analysis station installed in 2007, the sensor sets were configured as Piezo-Loop-Piezo.
For the Kistler quartz sensing system, only 1.00 m and 0.75 m long sensor segments are available. To make up a 3.5 meter long sensor strip, two 1.00 m and two 0.75 m 9195E sensors were combined and installed next to each other. They are connected electrically in parallel with a BNC connector to cover the full width of the lane. A Kistler specially designed 5038A2Y43 two channels charge amplifier was installed to connect each sensor strip to the Hestia P station.
To make the IRD sensor configuration compatible with the Hestia P station, its two Loop detectors were connected in series. Under this condition, and according to the product specifications, to calibrate the IRD WIM set for vehicle length, a variable called “chamb0” should be adjusted according to the change of effective loop field length. This reconfiguration was not successful and it was not possible to collect data from the IRD sensor set with the Hestia P station.
Using the WIM sensors and upstream static scale configuration described in the preceding paragraphs, three research interests can be addressed: (1) each type of WIM sensor’s performance can be evaluated, (2) methods for low cost auto-compensation can be developed, and (3) these WIM sensors can be regarded as a multiple WIM sensor system (MS-WIM) in order to achieve higher accuracies. Studies have shown that a MS-WIM can lower the dynamic effects induced by vehicles compared to a single sensor [6].
CALIBRATION OF WIM SENSORS After the systems were installed, according to WIM site condition standard ASTM E 2415-2005,
- 6-

site longitudinal and transverse profiles were acquired by surveying 1500 points in total on November 27, 2007. Results show that the site characteristics essentially met the standard requirements, with the exception that the average gradient at the site is 2.19% which is very close to the ASTM E 1318-02 standard that emphasizes: “the longitudinal gradient of the road surface for 200 ft (60 m) in advance of and 100 ft (30 m) beyond the WIM system sensors shall not exceed 2%” [7].
To learn about the sensors’ responses and to organize effective calibration efforts according to ASTM standards, primary testing of sensors was carried out after the new WIM system was installed. These tests were performed using the CPATT van (Dodge Sprinter, see Figure 5), which has two axles and a 2,780 kg gross vehicle weight (GVW).
Figure 5 Calibration van selected by CPATT
According to ASTM E1318, at least two types of vehicles should be introduced to accomplish the calibration procedure. Three paths called “runs” should be used. Those calibration vehicles should pass all three runs over the sensors, each run with three different speeds.
Three calibration speeds are specified as:
i. The minimum speed of the vehicles on the test track (assume 30 km/h) ii. The maximum speed of the vehicles on the test track (assume 60 km/h, which
should have at least 30 km/h difference with the minimum speed) iii. The average speed of the vehicles on the test track (assume 50 km/h)
To specify, the runs include:
i. Run 1, for which the test vehicle tires are near the right-hand edge of the lane. In this case, the process includes three or more traverses over the sensors with the three different speeds mentioned above.
ii. Run 2, for which the test vehicle tires are approximately on the wheel path (centered on the lane). In this case, the process also includes three or more traverses
- 7-

- 8-
over the sensors with the three different speeds mentioned above. iii. Run 3, for which the test vehicle tires are near the left-hand edge of the lane. In this
case, the process also includes three or more traverses over the sensors with the three different speeds mentioned above.
The CPATT van was chosen as a calibration vehicle at the beginning of this research. This vehicle is not ideal according to the ASTM standard, but it met research needs and cost limitations.
Based on the characteristics of each type of WIM sensor, according to the vendor’s recommendation, piezoelectric ceramic and polymer WIM sensor systems should apply an automatic calibration algorithm; while for a quartz sensor the manual calibration method should be applied. This is mainly because both ceramic and polymer sensors are temperature sensitive, requiring compensation of some kind. On the other hand, the quartz sensor is by design insensitive to temperature and does not need temperature influence compensation. For the study environment described in this paper, as it is located in the waste management facility, mostly there are only garbage trucks and management vehicles travelling by the WIM site, and there is less traffic than needed to meet the data acquisition system vendor’s requirements of automatic calibration, so the research team mainly focused on manual calibration method. Thus, after calibration of the system, all parameters are fixed. In this condition, the sensors’ performance under varied conditions could be studied.
PERFORMANCE COMPARISON FOR DIFFERENT SENSORS There are several factors which may affect WIM sensors’ accuracy such as vehicle speed, vehicle class, wheel path, pavement temperature, soil moisture etc. For instance, ceramic piezoelectric sensors have different performances in different parts of the world such as the U.S., Canada, Germany, Australia, New Zealand, Qatar, etc., since these locations have different climates and different temperature and moisture patterns to which the sensors respond differently [8]. Previous research shows that it is very important to conduct both laboratory and field evaluation for piezoelectric WIM sensors before they are applied in practice [9]. To evaluate each type of installed WIM sensors’ performance under Canada conditions, after installation and calibration of the systems, comparisons of static weights with the measured weights were made for each type of sensor under different test runs, speeds, temperatures and types of vehicles. Monthly statistical accuracies of the three types of sensors were also evaluated. The CPATT van was selected for the tests. In all performance comparison experiments, only one parameter is varied during the test, other parameters remain the same. Data for over 20,000 vehicles that have passed over the site and also been weighed at the static weigh station in 2008 and 2009 are also being analyzed in a related study.

Sensor performance for different wheel paths Because of WIM sensors’ inherent characteristics and the way WIM system algorithms estimate weight of a vehicle, sensor lane edge effects will influence the estimation results. To verify different sensors’ GVW estimation accuracy under tests of different vehicle wheel paths defined as run 1, run 2 and run 3 in section 3 of this paper, experiments were conducted with the CPATT test vehicle passing by three sets of WIM sensors at the same travel speed (50 km/h) during the test in a short period of time (within 2 to 3 hours). In the morning of March 03, 2009, 60 tests were done to test performance for vehicle travel over different wheel paths for the Kistler, MSI and ECM sensors, with the sequence of test group 1 in run path 1, group 2 in run path 2, group 3 in run path 3, group 4 in run path 1, group 5 in run path 2, and group 6 in run path 3. The experiment started at 10:50 and finished at 13:01. The records from measurement results of a temperature gun show that pavement surface temperature varied from 0 to minus 5 degrees centigrade during the test. The averages of both sensors’ GVW estimation for each test group are listed in Table 1.
Table 1 Average weight estimation results at different run GVW estimation average (kg) Group Number Test time period Test Run
(Test number) Kistler MSI ECM 1 10:50-11:09 1 (1-10) 2122.4 2507.0 2693.8 2 11:15-11:34 2 (11-21) 2698.4 2362.9 3714.6 3 11:40-11:59 3 (22-31) 2521.3 2489.8 2884.3 4 12:05-12:21 1 (32-41) 2185.8 2625.9 2762 5 12:25-12:40 2 (42-50) 2657.6 2498.9 3918.5 6 12:45-13:01 3 (51-60) 2630.2 2498.8 2639.5
Figure 6 GVW on average of both sensors
- 9-

Figure 6 shows GVW estimations based on the average of the two piezoelectric sensors of each WIM sensor set for each test and Figure 7 shows average GVW estimations for each test group. Several observations can be made according to the results:
1) For the quartz sensor, GVW estimation on run path 1 is about 2150 kg which means that when the vehicle travels along the right side of the lane, the estimation made by the quartz sensor is about 23% less than the real vehicle weight (2780 kg). Results from run path 2 and run path 3 are much more accurate.
2) According to Table1 and Figure 6, the polymer sensor is less sensitive to run path than the other two types of sensors.
3) For the ceramic sensor, GVW estimation on run path 2 is much greater than that on run paths 1 and 3. According to this test, results in run paths 1 and 3 are close to the actual weight, however, the conclusion cannot be made that when a vehicle travel by run paths 1 and 3 the GVW estimation accuracy is improved. It is more correct to conclude that run paths 1 and 3 have lower GVW estimations on account of the sensor’s edge effect [10].
Figure 7 Average GVW on average of both sensors for each test group
Sensor performance at different vehicle speeds Because of the difference in dynamic response of each type of sensor and pavement system, the GVW estimation at different speeds may vary. For the speed tests, all travel was conducted in run path 2 (in the middle of the lane). Test speeds were 30, 50 and 70 km/h respectively. Results are shown in Table 2 and Figure 8.
In Table 2 “Error” is the percentage difference of the WIM estimation with respect to the static weight. Figure 8 shows GVW estimation of three types of sensors vs. test sequence. Based on these data, the following observations can be made. 1) All sensors seem to have lower GVW estimation at lower speed, especially when van speed
is lower than 30 km/h; this is more obvious in the results of the ceramic sensor; 2) Results of both the quartz sensor and the polymer sensor are more concentrated from one test
- 10-
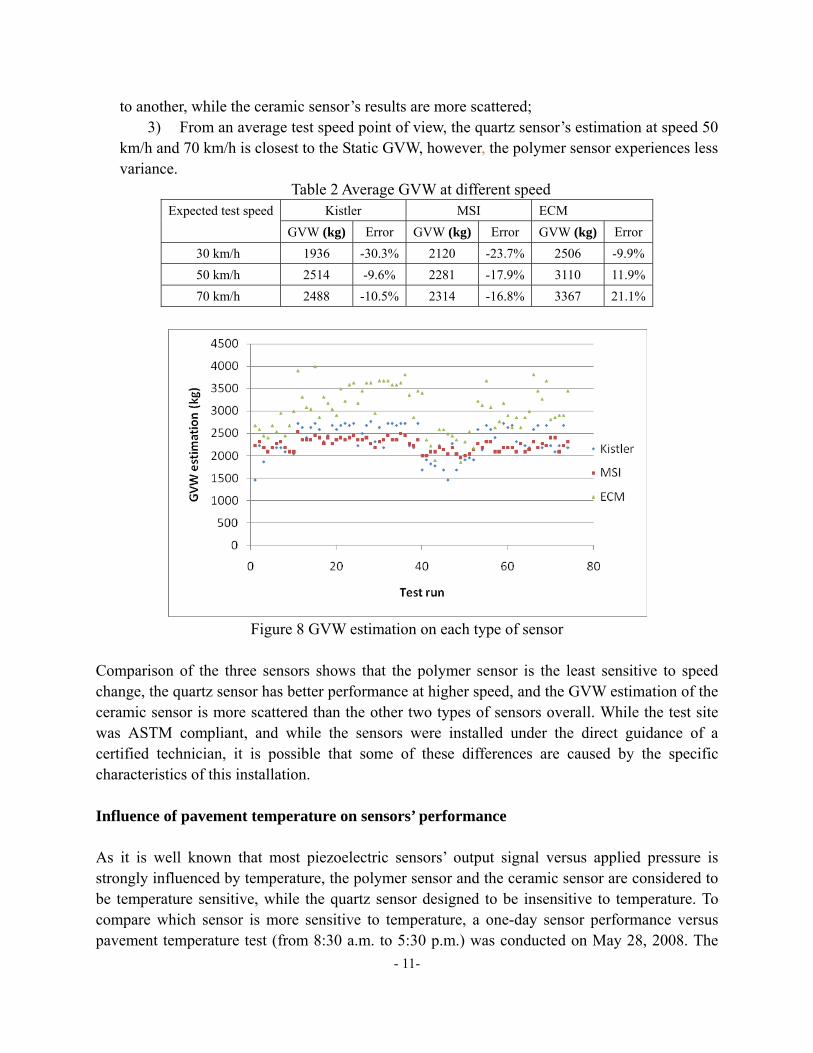
to another, while the ceramic sensor’s results are more scattered; 3) From an average test speed point of view, the quartz sensor’s estimation at speed 50
km/h and 70 km/h is closest to the Static GVW, however, the polymer sensor experiences less variance.
Table 2 Average GVW at different speed Kistler MSI ECM Expected test speed
GVW (kg) Error GVW (kg) Error GVW (kg) Error 30 km/h 1936 -30.3% 2120 -23.7% 2506 -9.9% 50 km/h 2514 -9.6% 2281 -17.9% 3110 11.9% 70 km/h 2488 -10.5% 2314 -16.8% 3367 21.1%
Figure 8 GVW estimation on each type of sensor
Comparison of the three sensors shows that the polymer sensor is the least sensitive to speed change, the quartz sensor has better performance at higher speed, and the GVW estimation of the ceramic sensor is more scattered than the other two types of sensors overall. While the test site was ASTM compliant, and while the sensors were installed under the direct guidance of a certified technician, it is possible that some of these differences are caused by the specific characteristics of this installation. Influence of pavement temperature on sensors’ performance As it is well known that most piezoelectric sensors’ output signal versus applied pressure is strongly influenced by temperature, the polymer sensor and the ceramic sensor are considered to be temperature sensitive, while the quartz sensor designed to be insensitive to temperature. To compare which sensor is more sensitive to temperature, a one-day sensor performance versus pavement temperature test (from 8:30 a.m. to 5:30 p.m.) was conducted on May 28, 2008. The
- 11-

van was travelling through the middle of the lane (run path 2) at a speed of 50 km/h according to its speedometer. Pavement temperature near each WIM sensor was recorded during the test.
Table 3 Average GVW estimation at different pavement temperatures (kg)
Kistler MSI ECM Time
Average temperature GVW Error GVW Error GVW Error
8:00-8:30 10.2
2644 -4.9% 2077 -25.3% 1157 -58.4%
9:00-9:30 15.8
2595 -6.7% 2427 -12.7% 1329 -52.2%
10:00-10:40 22.2
2604 -6.3% 2767 -0.5% 2059 -25.9%
11:30-12:15 29.0
2658 -4.4% 3039 9.3% 2699 -2.9%
13:00-13:45 34.4
2631 -5.4% 3239 16.5% 2948 6.1%
14:30-15:00 36.7
2626 -5.5% 3207 15.4% 3289 18.3%
15:30-16:00 35.1
2667 -4.1% 3189 14.7% 3243 16.7%
16:25-17:30 31.6
2708 -2.6% 3012 8.3% 2821 1.5%
Figure 9 Average GVW estimation vs. pavement temperature
In total, 114 passes with the van were conducted in this test with the group interval of one hour or one and half hours described in Table 3. Figure 9 reveals the relationship between pavement temperature and average GVW estimation for each type of sensor. According to Figure 9, the ceramic sensor is most sensitive to pavement temperature, the polymer sensor is less sensitive to temperature compared with the ceramic sensor, and the quartz sensor seems to be independent of
- 12-

- 13-
temperature, which validated previous research results for this type of sensor. According to Table 3 and Figure 9, all sensors seem to have reasonable estimation when pavement temperature is 29~32oC. This is possibly because when the WIM system was calibrated, the pavement temperature was around 30 oC. Results of this experiment clearly demonstrate that when applying the piezoelectric sensor as a pressure sensitive element, temperature influence should be considered. That is the reason why vendors highly recommended that automatic calibration for both polymer and ceramic sensors should be applied to compensate for the influence of temperature changes on sensor output. Example of a monthly statistical WIM estimation accuracy analysis WIM estimation accuracy analysis is performed at the CPATT site on a monthly basis. Several thousand data points per month are available. To analyze the accuracy of WIM GVW estimation, both WIM results for each vehicle and the static weight of each vehicle should be recorded.
After the WIM system was well calibrated on June 25, 2008, the system ran with no interruption and no re-calibration until March 04, 2009, except for a monthly data downloading operation. Thus the system had recorded 8 months data from summer high temperatures through winter low temperatures in a Canadian environment.
Thanks to the contribution of the Waste Management Department of the Regional Municipality of Waterloo, static vehicle weights were recorded. With both dynamic WIM data and static weights, WIM accuracy can be evaluated. Due to the layout of the Waste Management site, not all vehicles passing over the WIM sensors were weighed by the static scale, though most were. Also, not all vehicles weighed by the static scale will visit the WIM sensors. About half do. Additional work was required to match dynamic data and static data before further analysis. The following procedures show how the data matching was done.
1) WIM data selection and conversion which involve deleting all invalid data and converting all parameters’ measurements to international metric scales;
2) Static data selection principals which include selecting records of vehicles passing by the WIM sensors according to vehicle load material type and transaction type, and that deal with repeat records caused by manual modifications to the database;
3) Criteria for WIM-Static data matching based on considering: (1) the possible range of travel time intervals from the static scale to the first WIM sensor, (2) asynchronicity of the WIM controller and the static scale due to an inaccurate WIM system clock and (3) the ratio between suspected pairs for WIM sensor and static scale results. Control of repeat data matching should also be considered.
This matching process was manually validated in a set of experiments and is over 95% correct. As only July to November 2008 static data were initially available, the data analysis reported here is for these months. Table 4 shows records and proportions of WIM system GVW estimation error within 20% of static data from July to November. Figure 10 and Figure 11 show

distribution of records for WIM system GVW estimation error within 5%, 5~10% and 10~20% for each type of sensor.
Table 4 Monthly records of GVW estimation error less than 20% for matched data (kg) Samples Proportion in selected sample
Month Matched Kistler MSI ECM Kistler MSI ECM July 1910 1730 1341 1394 0.906 0.703 0.731
August 2322 2145 1706 1726 0.924 0.734 0.744 September 2767 2587 2018 2065 0.935 0.73 0.746
October 2888 2634 1844 2352 0.912 0.639 0.814 November 2110 1903 760 1672 0.902 0.36 0.792
From Table 4, it is clear that more than 90% of the quartz sensor estimations are within 20% estimation error for possible vehicles, while about 73% of the polymer and ceramic sensor estimates fall within this range. The polymer sensor’s very low estimation accuracy in November is caused by the estimation offset, mainly because of very low temperatures (the air ambient temperature was less than 0oC in most of the time during this month), which means that the polymer sensor’s performance will decrease sharply at low temperatures unless compensated for with auto- calibration or other methods. It is anticipated that temperature based auto-compensation would improve the polymer sensors’ estimates substantially, since the relationship between temperature and weight error is clear in the data collected to date.
Figure 10 Estimation errors in July, 08 Figure 11 Estimation errors in November, 08
- 14-

OUTPUT SIGNAL PRODUCED BY QUARTZ SENSOR According to the performance analysis in the previous section, the quartz sensor has the best performance compared with the other two piezoelectric sensors, when temperature based auto-compensation has not been applied. For a better understanding of the inherent behavior of the quartz sensor, a data acquisition system was introduced for raw signal collection. The chosen data logger has a cRIO-9014 as the embedded real-time controller. The data logger also includes 1 digital input module and 4 A/D modules which can collect 8 channels of digital input and 16 channels A/D channels. This meets the requirements for WIM information collection at the CPATT test site. With a generator to provide a 110V power supply to an AC/DC converter, 24V DC is connected and provides power to the data logger. An Ethernet cable connects directly between the lap-top computer and the data logger. The data acquisition control software was developed using NI Labview version 8.2.1.
- 101234567
0 0. 2 0. 4 0. 6 0. 8 1Ti me ( s)
Volt
age
(V)
CH1CH2
Figure 12 Three axle waste management truck signal at the quartz sensor
Figure 12 shows an example of the waveform collected for the quartz sensor. A three axle truck was passing by these two sensor strips. In this test, the data sampling rate was set to 1000 Hz. This figure shows that the quartz sensor has good performance when a dynamic pressure is applied on it, and that the approaching vehicle’s pressure wave is isolated from the sensor’s transducers effectively. As all these WIM sensors applied at the CPATT test site are piezoelectric sensors which have very high insulation resistance (1010 Ω), and whereas the data logger’s A/D module NI 9215 only has a 200 KΩ input resistance, when sampling a piezoelectric sensor a charge amplifier is needed to convert a high insulation resistance sensor’s electric charge signal to a low resistance voltage output signal. Then these signals can be collected by a NI 9215 A/D module. Unfortunately, only one charge amplifier was available, which prevented collection of the three types of sensors’ signals synchronously.
CONCLUSIONS AND SUGGESTIONS Sensor performance comparisons are presented in this paper for an installation in a typical
- 15-

- 16-
Canadian environment. The influence of different run paths, different traveling speeds, and different pavement temperatures has been tested.
Different test run paths show that the quartz sensor has a lower GVW estimation when a vehicle travels by the right side of the lane rather than the other two run paths. This may be because of the pavement profile or an undetected installation blemish. The piezoelectric polymer sensor is less sensitive to run path than the other two types of sensor. The piezoelectric ceramic sensor’s GVW estimation on run path 2 is much bigger than that of on run path 1 & 3, which can be explained by the sensor’s known edge effect.
As for the influence of a vehicle’s travelling speed, the comparison of the three sensors shows that the polymer sensor is least sensitive to speed change. However, the quartz sensor seems to have better performance at higher speed. The GVW estimation of the ceramic sensor is more scattered than the other two types of sensors at different speeds.
Results of experiments considering pavement temperature variation during a day indicate that when applying piezoelectric sensors as pressure sensitive elements, temperature influence should be considered for piezoelectric polymer and piezoelectric ceramic sensors, however quartz sensors are insensitive to temperature, and there is no need for their automatic or seasonal calibration. This advantage may make the quartz sensor an attractive piezoelectric sensor in many WIM applications.
Monthly data analysis shows that the quartz sensor has the best estimation accuracy for all test records with different GVW classes of vehicles. The evaluation verified that the piezoelectric quartz sensor technology has the best weight measurement accuracy, non-sensitivity to temperature change, and an overall best performance among these three sensors. Therefore, the quartz sensor was also chosen for MTO’s Hwy-401 LTPP project for field data collection and further research. However, this performance comes at a higher cost than the other sensors. Research is being directed forward improving other sensors’ performance with auto-calibration methods. It is recommended that the extensive data collected be used to develop low cost auto-compensation methods for the polymer piezoelectric sensor technology based on temperature, vehicle class and speed information. This could provide a low cost high performance alternative WIM technology. It is also recommended that where multiple WIM installations exist in sequence that data fusion methods, which are being developed to improve estimation accuracy, be considered for adoption.
ACKNOWLEDGMENTS The authors would like to thank Mr. Dave McCaughan at the Waste Management Department, Regional Municipality of Waterloo to be so kind to provide vehicles’ static information at the static scale. Dr. Susan L. Tighe’s assistance is also appreciated.

- 17-
REFERENCES 1. Lixin Zhang. An evaluation of the technical and economic performance of
Weigh-in-Motion sensing technology. Master’s thesis, University of Waterloo, 2007. 2. Roadtrax BL Traffic Sensors, Revised October 2001, Measurement Specialties Inc,
Sensor Products Division, 2001 3. http://www.ecm-france.com/gb/doc/index.php 4. Planning manual, Planning of a WIM station, Type 9195E, Kistler, 002-300E-07.04
(200-348e) 5. Susan Tighe et al. Field experiments in CPATT’s long term program of pavement
research. In 2003 Annual Conference of the Transportation Association of Canada, St John’s, Newfoundland and Labrador, 2003.
6. European Commission DG VII-Transport 2001, Weigh-in-Motion of Axles & Vehicles for Europe (WAVE), Laboratoire Central Des Ponts et Chaussees (LCPC), France
7. ASTM E 1318 2002, Standard Specification for Highway Weigh in Motion (WIM) Systems with User Requirements and Test Method, ASTM Designation E 1318-02, ASTM International, USA, 2007 p.1093
8. Koniditsiotis, C., Weigh-in-Motion Technology, Austroads Incorporated, Sydney, Australia. 2000
9. Papagiannakis, A.T. et al. Laboratory and field evaluation of piezoelectric Weigh-in-Motion sensors, Journal of Testing and Evaluation, 2001. vol. 29 no. 6, pp535-543
10. Labry, D, et al. Piezoelectric sensors for Weigh-in-Motion systems: Sensor behaviour analysis and recommendations, 4th International Conference on Weigh-in-Motion (ICWIM4-2005), Taipei, Taiwan. 2005