improving basic services for the bottom forty percent...
TRANSCRIPT

Document of
The World Bank
Report No: 84215-ET
Improving Basic Services for the Bottom Forty Percent:
Results of the Poverty and Social Impact Assessment of Decentralized Basic Service Delivery in Ethiopia
(Review Meeting Version - For Internal Use Only)
Social Protection Sector
Country Department AFCE3
Africa Region

2
REVIEW MEETING VERSION FOR INTERNAL USE ONLY
CURRENCY EQUIVALENTS
(Exchange Rate Effective December 19, 2013)
Currency Unit = Ethiopian Birr (ETB)
ETB 19.10 = USD 1
FISCAL YEAR July 8 – July 7
Ethiopian FY 06 – IDA FY14
ABBREVIATIONS AND ACRONYMS AGSS Agriculture Sample Survey
ANC Antenatal Care
CAR Contraceptive Acceptance Rate
CSA Central Statistical Agency
DA Development Agent also known as Agriculture Extension Worker
DHS Demographic and Health Survey
EDHS Ethiopia Demographic and Health Survey
GDP Gross Domestic Product
ETB Ethiopian Birr
GoE Government of Ethiopia
GRM Grievance Redress Mechanisms
GTP Growth and Transformation Plan
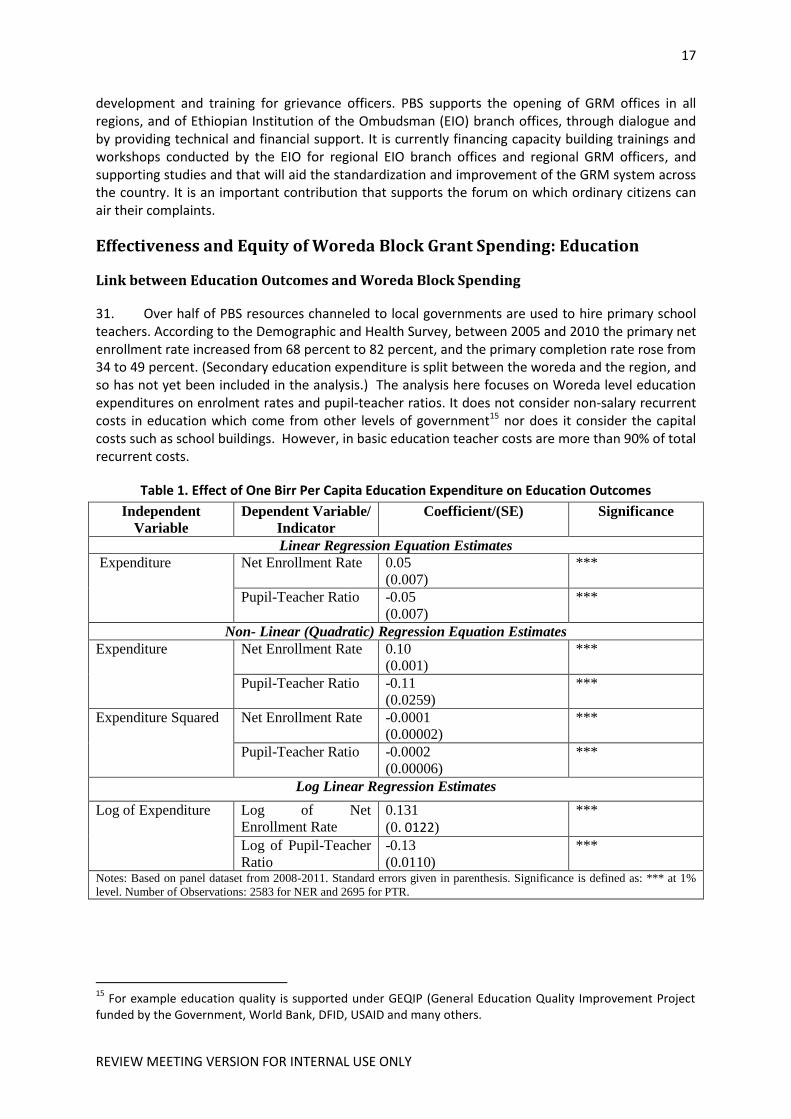
HEW Health Extension Worker
IGFT Inter-Governmental Fiscal Transfers
MDG Millennium Development Goals
M&E Monitoring and Evaluation
MOFED Ministry of Finance and Economic Development
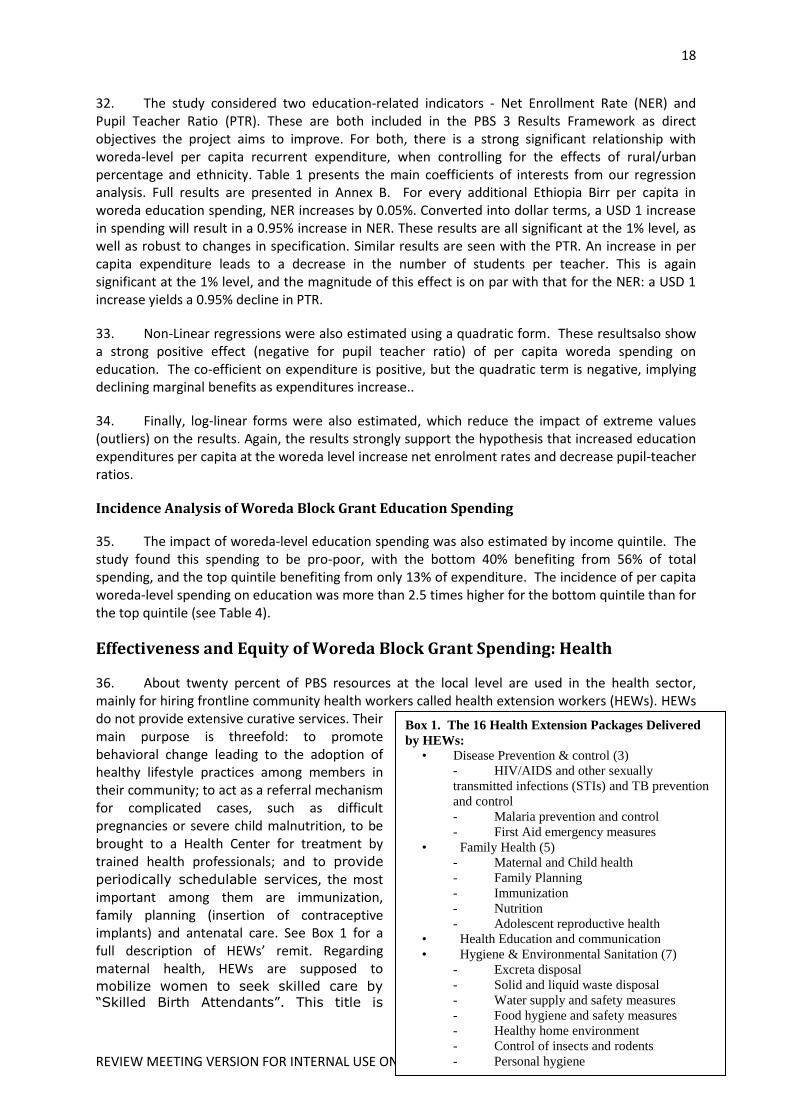
MOWE Ministry of Water and Energy
PBS Promoting Basic Services Program (formerly, Protection of Basic Services)
NER Net Enrollment Rate
PTR Pupil-teacher Ratio
SA SBA
Social Accountability Skilled Birth Attendant
U5MR Under-five Mortality Rate
WDR 2004 World Development Report 2004

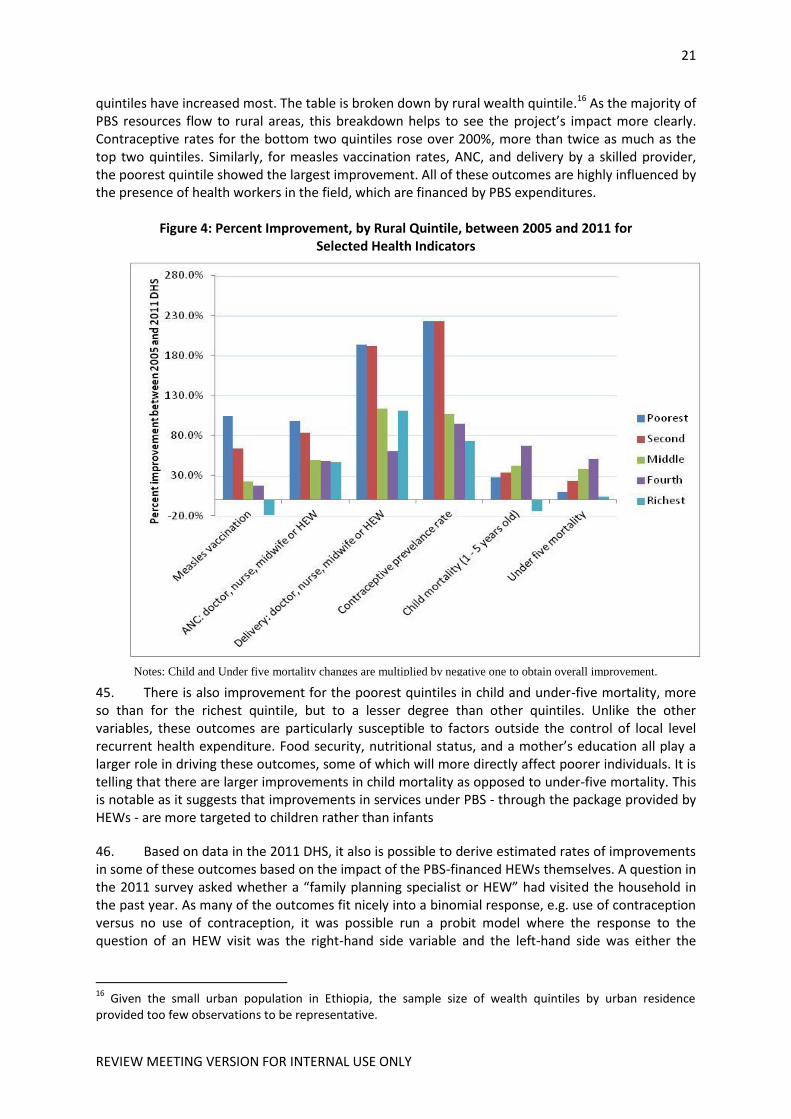
3
REVIEW MEETING VERSION FOR INTERNAL USE ONLY
Regional Vice President: Makhtar Diop
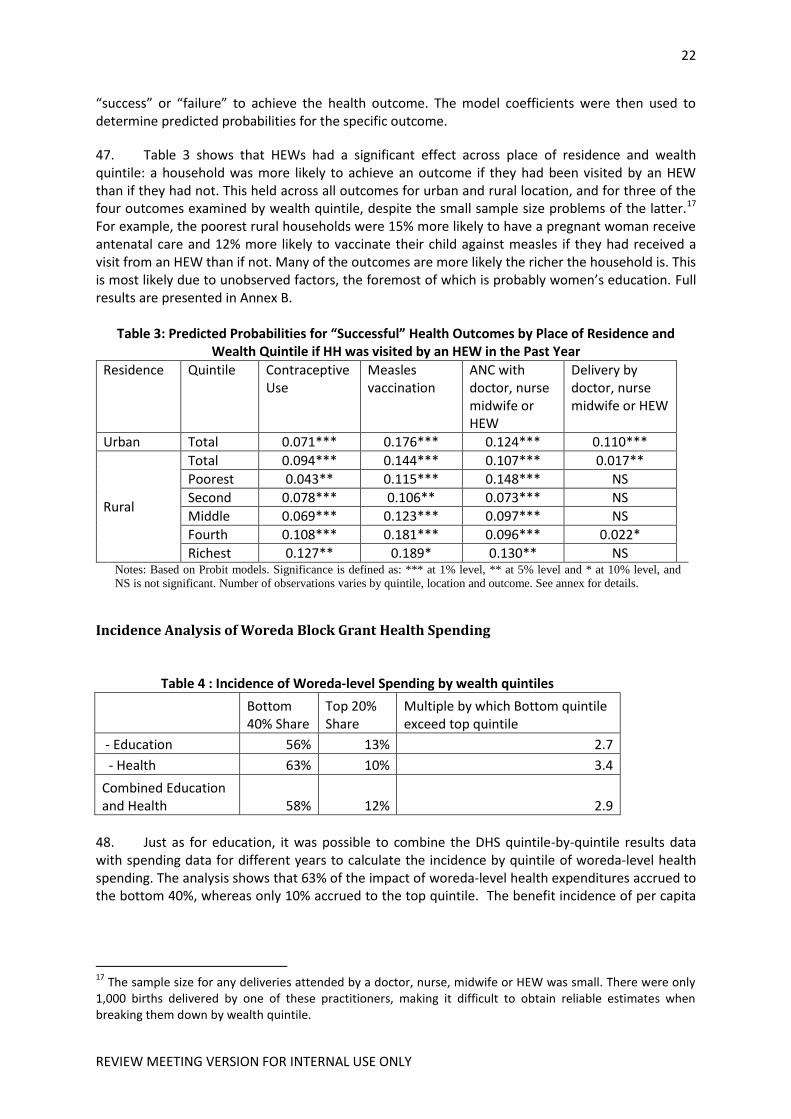
Country Director: Guang Zhe Chen
Sector Director: Tawhid Nawaz (Acting)
Sector Manager: Lynne Sherburne-Benz
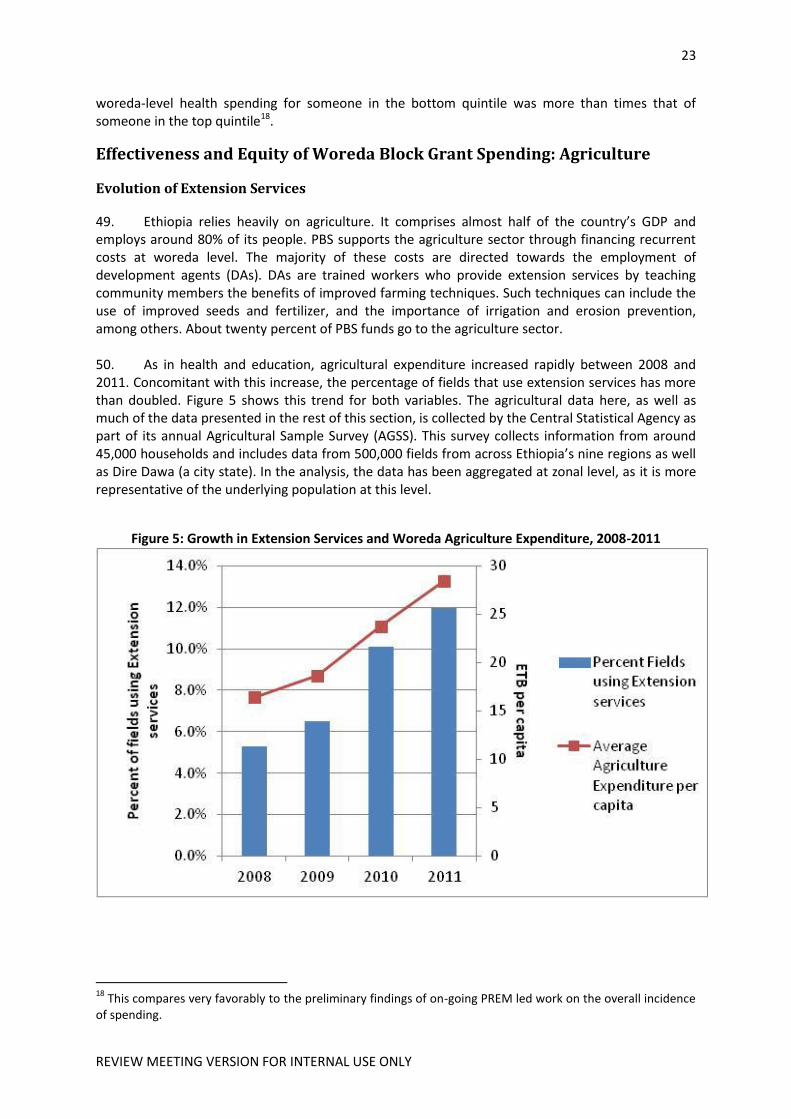
Task Team Leader: Qaiser M. Khan
This paper was prepared by a team led by Qaiser M. Khan (Lead Economist, World Bank), including Jean-Paul Faguet (Professor, London School of Economics), Chris Gaukler (Monitoring and Evaluation Specialist, World Bank) and Wendmsyamregne Mekasha (Senior Social Protection Specialist, World Bank). This study is the first of a series of reports coming out of the programmatic knowledge management series (P146931) for Ethiopia on improving services for the poorest. Other studies are planned. The sub-task code for this report is P149520. The team would like to acknowledge the invaluable assistance provided by members of the Ethiopian government and donor partners. These include: Ato Temesgen Walelign (Development Planning and Research Directorate), Ato Degu Lakew (Government Accounts), Ato Alemayhu Gebretsadik, Ato Biratu Yigezu and Ato Habekristos Beyene (Central Statistical Agency), Ato Feta Zeberga (Ministry of Agriculture), Ato Asmelash Mersa (Ministry of Education), and Ato Wondimu Ayele (Ministry of Health). We would also like to acknowledge support from Ato Getachew Negera, Head of COPCU (Ministry of Finance).

Contents Summary and Recommendations ....................................................................................................... 5
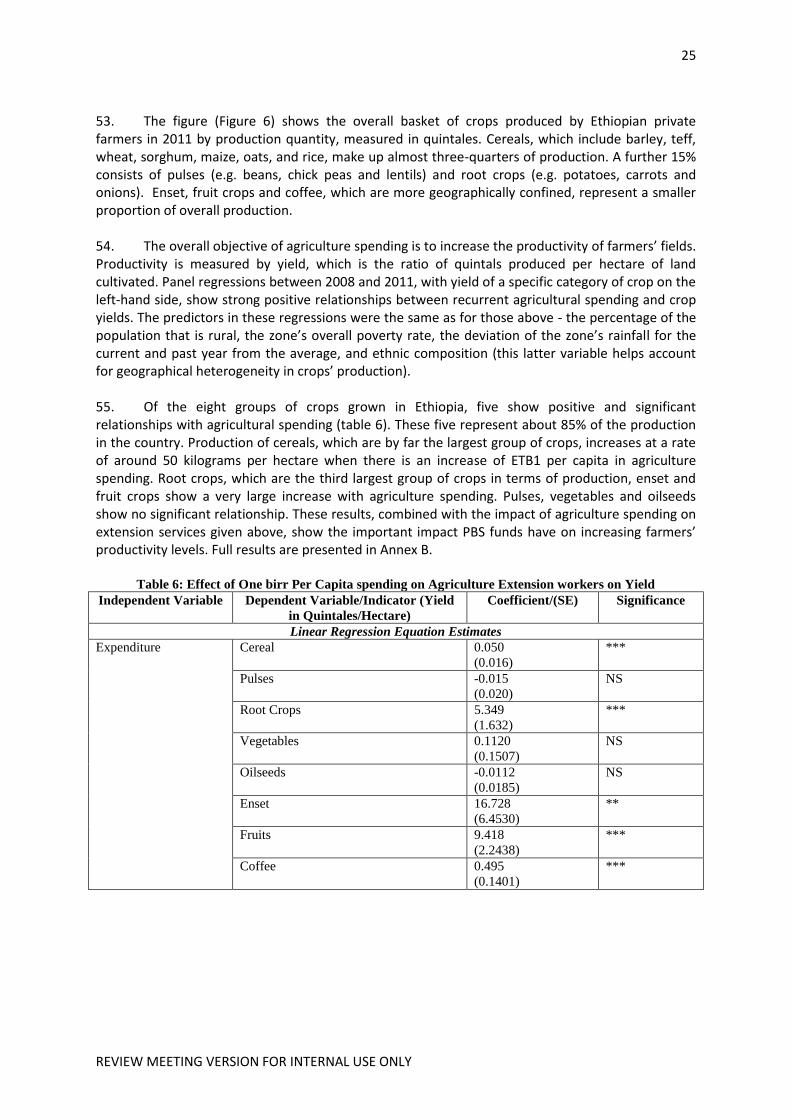
Ethiopia’s Approach to Basic Service Delivery ................................................................................ 5 Overall Findings ............................................................................................................................... 5 Objectives and Methodology .......................................................................................................... 6
Effectiveness ................................................................................................................................... 6
Improved Woreda Management .................................................................................................... 7
Equity .............................................................................................................................................. 7
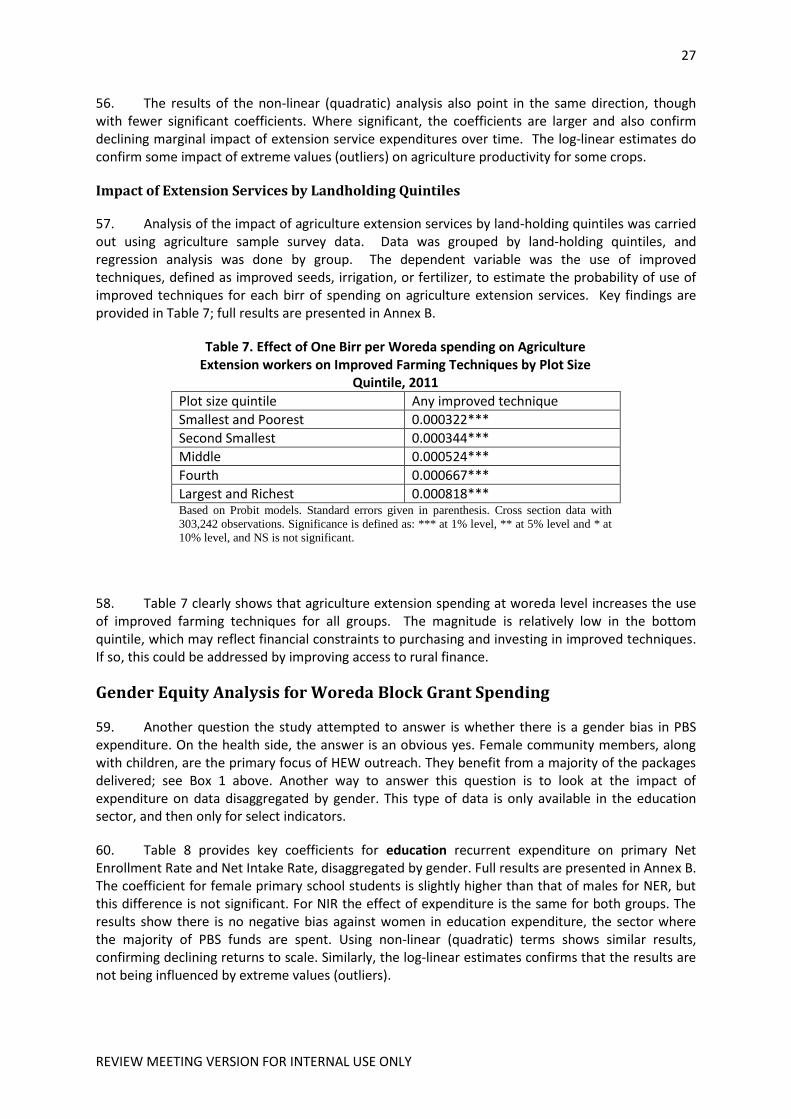
Citizen Voice .................................................................................................................................... 7
Conclusions and Recommendations ............................................................................................... 7
Introduction and Background ............................................................................................................. 9 Country and Sector Background ..................................................................................................... 9
The Promotion of Basic Services Project ...................................................................................... 10
Study Approach ................................................................................................................................. 12 Methodology ..................................................................................................................................... 13 Citizen Direct Voice and Accountability ............................................................................................ 15
Financial Transparency and Accountability (FTA) ......................................................................... 15
Social Accountability ..................................................................................................................... 16
Grievance Redress Mechanisms (GRM) ........................................................................................ 16
Effectiveness and Equity of Woreda Block Grant Spending: Education ........................................... 17 Link between Education Outcomes and Woreda Block Spending ................................................ 17
Incidence Analysis of Woreda Block Grant Education Spending .................................................. 18
Effectiveness and Equity of Woreda Block Grant Spending: Health ................................................. 18 Impact of Woreda Block Grant Health Spending by Wealth Quintile ........................................... 20
Incidence Analysis of Woreda Block Grant Health Spending ........................................................ 22
Effectiveness and Equity of Woreda Block Grant Spending: Agriculture ......................................... 22 Evolution of Extension Services .................................................................................................... 23
Impact of Extension Services on Productivity ............................................................................... 24
Impact of Extension Services by Landholding Quintiles ............................................................... 25
Gender Equity Analysis for Woreda Block Grant Spending .............................................................. 27 Ethnic disaggregated Analysis for Woreda Block Grant Spending .................................................... 29 Regionally disaggregated Analysis for Woreda Block Grant Spending ............................................. 30 Conclusions and Recommendations ................................................................................................. 33 Annex A: Detailed Methodology and Sources of Data ..................................................................... 35
Methodology ................................................................................................................................. 35
Sources of Data ............................................................................................................................. 37
Annex B: Detailed Regression Results .............................................................................................. 38 Annex C: Brief background on the relationship between central and peripheral areas in Ethiopia – The Evolution of Today’s Federal State ............................................................................................ 50
History and Background ................................................................................................................ 50
The Modern Ethiopian Federal State ............................................................................................ 52
References ........................................................................................................................................ 54

5
REVIEW MEETING VERSION FOR INTERNAL USE ONLY
Summary and Recommendations
Ethiopia’s Approach to Basic Service Delivery
Like the majority of developing countries across Africa, Asia and Latin America (Treisman 2007, Manor 1999), Ethiopia has opted for a highly decentralized approach to service delivery in agriculture extension, basic education, primary health care, rural roads and water supply. This follows a long tradition of theoretical analyses of how decentralizing government could make government more responsive to diverse local needs, and more efficient in the provision of public goods (e.g. Besley and Coate 2003, Faguet 2012, Oates 1972, and Tiebout 1956, to name a few).
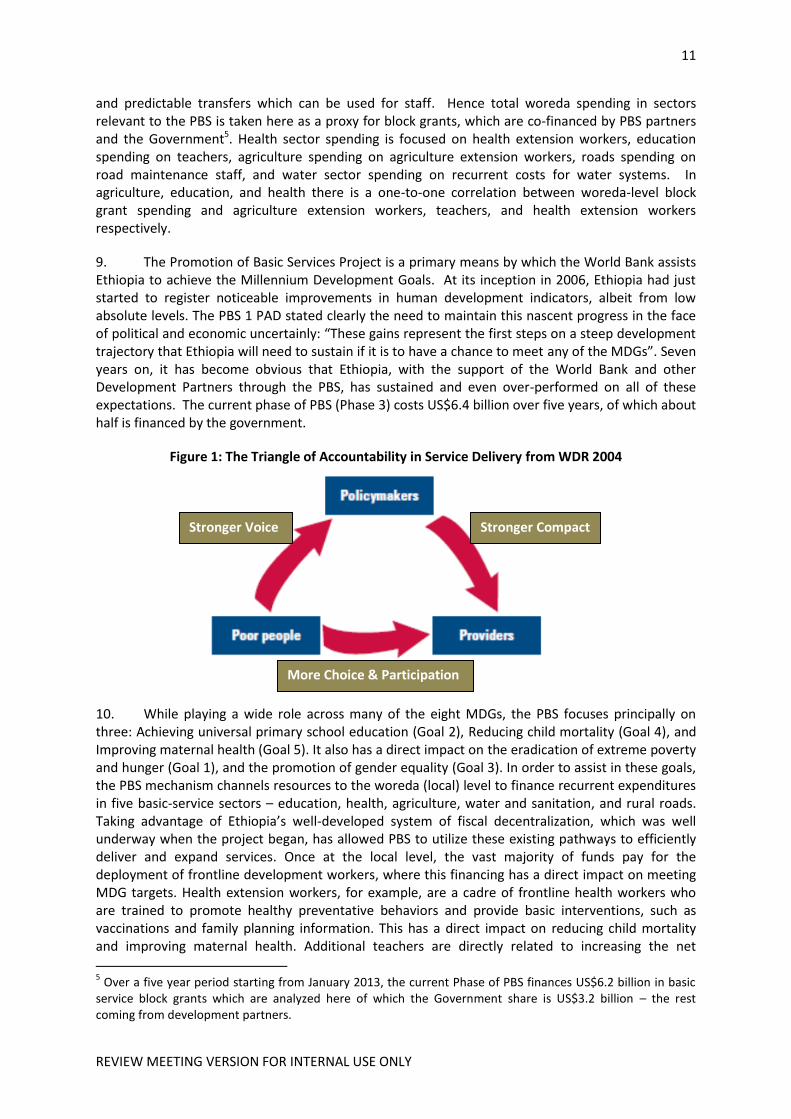
In Ethiopia, these services are primarily managed at the woreda (district) level and mostly financed by Inter-Governmental Fiscal Transfers (IGFTs), though some woredas do raise own revenues. Block grants for decentralized services have been co-financed by development partners through the Promotion of Basic Services (PBS) program, which not only provides development partner resources for service provision, but also supports a variety of measures designed to improve service quality as well local government capacity. Influenced by the idea of an accountability triangle as presented in the 2004 World Development Report1 (Figure 1), PBS also supports the direct voice of citizens by emphasizing transparency and governance for the block grants through a variety of measures. These range from financial transparency and citizen education on budget issues, to grievance redress mechanisms and specific measures for social accountability.
Overall Findings
Woreda-level spending financed through IGFTs, and supported by PBS, have been a very effective way of pushing Ethiopia forward to attaining its MDG goals. Health and education spending account for 80% of PBS-financed woreda spending. Health spending pays for health extension workers while education spending pays for teachers. Econometric results show that a US$1 increase in woreda health spending per capita increases the contraceptive prevalence rate by 2.66%, and the percentage of births delivered by skilled birth attendants by 2.04% within that woreda. This means a US$10/capita spending increase can result in a 23% improvement in the proportion of births by skilled birth attendants. Both of these contribute sharply to reducing maternal mortality, as global evidence shows and recent results from Ethiopia confirm. Similarly, an increase of US$1 per capita of woreda-level health spending increases the coverage of Penta-3 vaccination by 1.74%, which can significantly help reduce infant and child mortality. With regard to education, an increase of US$1 per capita in woreda-level education spending results in a 0.88% increase in the net primary enrollment rate within that woreda. In addition, woreda health and education-level spending is pro-poor, with 58% of the incidence accruing to the two bottom quintiles. These results demonstrate the power of the PBS-financed decentralized approach to improving access to basic services. Similarly, woreda-level agriculture spending, primarily for agriculture extension workers, drives increases in output and the adoption of new, improved methods across all asset quintiles.
Agriculture, education and health account for 97% of woreda spending, which in turn comprises 97% of PBS spending. The remaining 3% supports citizen engagement, improvement of local level capacity to manage resources, and improved national-level information. While it is difficult to provide precise estimates of the impact of the latter activities, the direction of their effect
1 World Bank, World Development Report 2004: Making Services Work for Poor People, 2003

6
REVIEW MEETING VERSION FOR INTERNAL USE ONLY
is clear: spending efficiency is improved through better capacity, more transparency, and more citizen accountability.
Objectives and Methodology
The primary objective of this study is to assess the impact of woreda-level expenditures for decentralized service provision on key policy outputs and human outcomes. A secondary objective was to assess the incidence of these expenditures by income quintile, in line with the Bank’s new objective of shared growth that targets the bottom 40%. A third objective was to investigate possible ethnic biases in the allocation of woreda-level block grants, and if so, whether any bias is in line with the constitutional objective of providing additional resources to historically underserved populations.
Effectiveness
The analysis finds that woreda-level spending in education, health and agriculture is effective in achieving important results in each sector. It is improving net enrolments in education, access to basic services in health, and increasing productivity in agriculture. These three sectors account for 97% of woreda-level spending, and thus the spending can be considered both effective and well-targeted. We find a one-to-one relation between woreda-level spending in agriculture, education and health, and the numbers of agriculture extension workers, teachers and health extension workers respectively. Thus, per capita woreda-level spending is a good proxy indicator for the level of service delivery in these sectors.
The results reported in the summary are based on the linear regression estimates. Non-linear and log-linear regressions were also estimated and the results, which are similar, are discussed in the main text.
The study considered two education-related indicators: the net primary enrollment rate (NER), and the pupil teacher ratio (PTR). These are both included in the PBS 3 Results Framework as direct objectives that the project aims to improve. For both there is a strong, significant relationship with woreda-level per capita recurrent expenditure, when controlling for the effects of rural/urban population and ethnicity. Table 1 shows the relevant regression results. For every additional Ethiopia Birr per capita in woreda education spending, there is an NER increase of 0.05%. Expressed in US dollar terms, a $1 increase in per capita spending yields a 0.95% increase in the NER. These results are significant at the 1% level, and are robust to different data sources and estimation techniques.
The analysis of woreda-level expenditures in health shows a positive impact on vaccinations, access to antenatal care, contraceptive prevalence rate, and deliveries by skilled birth attendants. These are primary drivers that reduce child mortality (MDG 4) and maternal mortality (MDG 5). Linear regression results using woreda-level data are corroborated using probit regressions on DHS 2011 household data. We find that visits from health extension workers increase the probability of contraceptive use, vaccinations, use of antenatal care and assisted childbirths in both rural and urban areas. Most of these results were found significant for all five DHS wealth quintiles.
In agriculture, the effect of woreda-level spending on agriculture extension workers increases yields for major crops such as cereals, root crops, vegetables, enset, coffee and fruits. When the data is divided into plot size quintiles, we find that spending on agriculture extension workers increases the probability of using improved farming techniques across all quintiles.
Taken together, the results underline that Ethiopia’s rapid progress towards its MDG goals is a direct result of the country’s highly decentralized approach to basic service delivery.
7
REVIEW MEETING VERSION FOR INTERNAL USE ONLY
Improved Woreda Management
PBS has also improved the efficiency of resource use by improving financial management and procurement capacity at the woreda level via support for accountability to citizens through financial transparency, social accountability, and a formal grievance redress mechanism (under the Ethiopian Institution of the Ombudsman).
Equity
The analysis also considered equity consequences by income/wealth group, gender, ethnicity and geography. Overall the report finds the impact of PBS expenditure on equity in income/wealth terms to be positive, in that benefits accrued to all quintiles in all sectors. The results are better still in health and education – the impact of PBS resources was much higher for the bottom two quintiles, where 58% of total benefit incidence accrues. In agriculture, the magnitude of the impact was smaller for the bottom quintile, which could be related to a lack of financing to purchase necessary inputs.
Gender impact was also positive, especially for education and health. In Ethiopia, 87% of farmers are males. Access to extension services for female farmers was tested and found to favor males. It is not clear whether this bias is driven by a gender difference in choice of crops or quality of land, or some other inherent gender bias.
An analysis of the regional incidence of PBS benefits found the two most favored regions to be Gambella and Benishangul-Gumuz – the two historically most disadvantaged regions in the country. Similarly, ethnic dimensions were analyzed and found to favor historically disadvantaged groups, in accordance with constitutional provisions.
Citizen Voice
The PBS’ social accountability program generally increased demand-side opportunities for constructive citizens-state collaborations to improve basic public services in pilot areas. Evidence shows that the program increased citizen awareness of their rights, responsibilities and entitlements to basic services, with over 84% of those surveyed in pilot areas responding positively. Citizens have also become more aware of their government budgeting process, and are intervening more effectively in pushing for their rights as a result of the Financial Transparency and Accountability (FTA) component.
Conclusions and Recommendations
The evidence shows that decentralized spending at the woreda level is both effective and pro-poor. The high spending impact estimates provided here imply that Ethiopia is far from decreasing returns, and hence there is scope to increase such spending further to accelerate progress towards its MDGs. In agriculture, increasing access to rural finance for the poorest could help improve the pro-poor impact of PBS spending in this sector. It should be noted that causality from woreda spending to results is direct for education where teachers help drive enrolments and catalytic in health and agriculture where the health and agriculture extension workers help increase the effectiveness of system wide spending.
Historically disadvantaged areas are significantly favored under the current regime. The distribution of expenditure across space is broadly equal amongst Ethiopia’s woredas, with the striking exception of a small number of woredas concentrated in the country’s most disadvantaged regions that receive significantly greater resources. By contrast, the most disadvantaged woredas in terms of resource flows are concentrated in the more developed, historically dominant regions. Five
8
REVIEW MEETING VERSION FOR INTERNAL USE ONLY
majority-Anyiwak woredas are noteworthy for receiving the most public resources of all woredas in the nation.
In contrast to the predictions of some public management theories, the decentralized provision of services in Ethiopia is not increasing regional, ethnic or gender inequalities in terms of investment inputs or service outputs. Indeed, we found the opposite effect in education and health, where the impact of PBS resources was disproportionately high amongst the bottom two quintiles, and for women. Hence support for decentralized services in Ethiopia is an effective use of development partner resources from both efficiency and equity perspectives.
The only exception to these findings is agriculture, where the impact of PBS expenditures was smaller for the bottom quintile. This is likely related to a lack of agricultural financing to purchase necessary inputs, and suggests a need for complementary rural finance schemes.
Although quantitative evidence is unavailable at present, descriptive evidence implies that structured feedback sessions between citizens and service providers have helped to strengthen citizens’ participation in pilot areas under ESAP1, on which basis ESAP2 is being implemented. This experience, combined with the strong recommendations of theories of governance and accountability, point to a need for continued application of social accountability tools, and seeking acceptable policy options for sustainability in the Ethiopian context.
It is difficult to overstate the difficulty of doing subnational empirical work on Ethiopia. Creating the database required for this report has required a huge amount of work and improvisation on the part of the research team. A major output of this study is the production of a standardized database of woreda-level expenditures and characteristics, which will be made public. It is our hope that this dataset will in time become a useful tool for researchers and students elsewhere in Africa and beyond.
Introduction and Background
Country and Sector Background
1. Ethiopia has achieved impressive development results in recent years. That progress includes rapid and significant improvements in basic service delivery indicators. An Overseas Development Institute study2 noted that Ethiopia is making the third-fastest improvements of any country towards reaching the Millennium Development Goals (MDG). The latest Ethiopia Demographic and Health Survey data show that child mortality has fallen from 123 per thousand in 2005 to 88 in 2010, and primary net enrollment rates rose from 68 percent in 2004/2005 to 82 percent in 2009/2010. This progress on basic service delivery is coupled with an impressive growth record over the past 10 years. GDP grew on average 11 percent per annum during 2004/5-2009/10, according to official estimates. Initially led by agriculture, growth has become more broad-based, with a rising contribution from the mining, services and manufacturing sectors. While growth has slowed recently, it still remains among the highest in the world. Together, a sharp focus on decentralized basic service delivery, efforts to maintain equity, and rapid growth have led to overall improvements in welfare. Based on official data, the population below the poverty line fell from 38.7 percent in 2004/2005 to 29.6 percent in 2011.
2. These MDG, growth and poverty results spring from a long-term, concerted government commitment to pro-poor development. Building on the Sustainable Development and Poverty Reduction Program 2002-2004/5, and A Plan For Accelerated and Sustained Development to End Poverty 2005-2010 (PASDEP), the government’s current development plan, the Growth and Transformation Plan (GTP), aims to achieve the Millennium Development Goals by 2015, and middle-income status for Ethiopia by 2020-2023. Ethiopia achieved the MDG-4 (Child Mortality) target earlier this year, ahead of schedule, and appears to be on track to reach the other MDGs by 2015 according the UN progress reports.
3. The Constitution and legal framework commit the government to maintain the integrity and capacity of decentralzied administrations down to woreda level3. Within Ethiopia’s federal structure, central government provides un-earmarked block grants through regional governments. These in turn provide block grants to woreda administrations, which deliver decentralized services to citizens. This administrative and financial structure has provided timely, predictable financing that supports a steady and impressive increase in basic services throughout the country. This follows a long tradition of theoretical analyses of how decentralizing government could make government more responsive to diverse local needs, and more efficient in the provision of public goods (e.g. Besley and Coate 2003, Faguet 2012, Oates 1972, and Tiebout 1956, to name a few).
4. There is a need to consider whether the approach followed by the government is cost-effective within the decentralized constitutional context. Basic services are primarily the role of local governments, and therefore building local government capacity is an important element in improving basic services for the bottom 40%. Its fiscal architecture additionally makes Ethiopia a rich, promising empirical setting for investigating the effectiveness of decentralization as a tool for improving public sector outputs, in terms of both quality and distribution. The evidence that Ethiopia can offer is especially welcome in light of the inconclusive nature of the empirical evidence that has accumulated over the past four decades.
2 Overseas Development Institute, Millennium Development Goals Report Card: Measuring Progress Countries,
September 2010. 3 See Annex C for background and evolution of the modern Ethiopian Federal State

10
REVIEW MEETING VERSION FOR INTERNAL USE ONLY
5. Consider the broadest empirical surveys: Rondinelli, Cheema and Nellis (1983) note that decentralization has usually disappointed its partisans. Most developing countries implementing decentralization experienced serious administrative problems. Although few comprehensive evaluations of the benefits and costs of decentralization efforts have been conducted, those that were attempted indicate limited success in some countries but not others. A decade and a half later, surveys by Piriou-Sall (1998), Manor (1999) and Smoke (2001) are slightly more positive, but with caveats about the strength of the evidence in decentralization’s favor. Manor notes that the evidence, though extensive, is still incomplete, but ends his study with the opinion that ‘while decentralization …is no panacea, it has many virtues and is worth pursuing’. Smoke, by contrast, finds the evidence mixed and anecdotal, and asks whether there is empirical justification for pursuing decentralization at all. Given the sheer size of this literature, the lack of progress is surprising.
6. It is worth noting that more recent empirical studies, which are often technically more sophisticated as developing-country datasets have improved enormously over recent decades, are generally more positive about decentralization’s potential. Five recent studies that address the link between decentralization and substantive outcomes directly and with rigorous quantitative evidence include: Escaleras and Register (Forthcoming), who find that fiscal decentralization is associated with lower natural disaster death rates, implying more effective preparation and/or responses to natural disasters by countries with decentralized governments. Clark (2009) applies regression discontinuity to a natural experiment from Britain to show that schools that opt out of the centralized educational regime – in effect decentralizing themselves – enjoy large increases in student achievement. Galiani, Gertler and Schargrodsky (2008) find that decentralization of school control from central to provincial governments in Argentina had a positive impact on student test scores. The poorest, however, did not gain, and indeed may have lost. And Barankay and Lockwood (2007) find that greater decentralization of education to Swiss cantons is associated with higher educational attainment, especially for boys. This study hopes to add empirical evidence from a low income country with large, important decentralization and public investment programs, where results are potentially significant.
The Promotion of Basic Services Project
7. Block grants for decentralized services have been co-financed by Ethiopia’s development partners through the Promotion of Basic Services (PBS) program, although the government share is larger and rising. The block grants are distributed from federal government to regional governments using a formula that adjust for population, and need based on level of development and historic lack of access to services. The funds are transmitted from the regions to woredas using regional formulas based on similar criteria. This program not only provides development partner financial support for block grants to woredas, but also supports a variety of measures designed to improve service quality as well local government capacity to manage basic services. Influenced by the accountability triangle presented in the 2004 World Development Report4 (Figure 1), PBS supports transparency and governance through a variety of measures. These measures range from financial transparency and citizen education in budget issues, to grievance redress mechanisms and social accountability through structured feedback. Recognizing the critical role of good information to improve development outcomes, PBS finances a range of surveys and data collection and management efforts. Capacity building efforts include financial management and procurement for local woredas, in addition to other needs based on demand.
8. Woreda-level block grants primarily support locally-recruited staff in the five decentralized sectors. With some minor exceptions, woredas have very little own revenue and no other regular
4 World Bank, World Development Report 2004: Making Services Work for Poor People, 2003
11
REVIEW MEETING VERSION FOR INTERNAL USE ONLY
and predictable transfers which can be used for staff. Hence total woreda spending in sectors relevant to the PBS is taken here as a proxy for block grants, which are co-financed by PBS partners and the Government5. Health sector spending is focused on health extension workers, education spending on teachers, agriculture spending on agriculture extension workers, roads spending on road maintenance staff, and water sector spending on recurrent costs for water systems. In agriculture, education, and health there is a one-to-one correlation between woreda-level block grant spending and agriculture extension workers, teachers, and health extension workers respectively.
9. The Promotion of Basic Services Project is a primary means by which the World Bank assists Ethiopia to achieve the Millennium Development Goals. At its inception in 2006, Ethiopia had just started to register noticeable improvements in human development indicators, albeit from low absolute levels. The PBS 1 PAD stated clearly the need to maintain this nascent progress in the face of political and economic uncertainly: “These gains represent the first steps on a steep development trajectory that Ethiopia will need to sustain if it is to have a chance to meet any of the MDGs”. Seven years on, it has become obvious that Ethiopia, with the support of the World Bank and other Development Partners through the PBS, has sustained and even over-performed on all of these expectations. The current phase of PBS (Phase 3) costs US$6.4 billion over five years, of which about half is financed by the government.
Figure 1: The Triangle of Accountability in Service Delivery from WDR 2004
10. While playing a wide role across many of the eight MDGs, the PBS focuses principally on three: Achieving universal primary school education (Goal 2), Reducing child mortality (Goal 4), and Improving maternal health (Goal 5). It also has a direct impact on the eradication of extreme poverty and hunger (Goal 1), and the promotion of gender equality (Goal 3). In order to assist in these goals, the PBS mechanism channels resources to the woreda (local) level to finance recurrent expenditures in five basic-service sectors – education, health, agriculture, water and sanitation, and rural roads. Taking advantage of Ethiopia’s well-developed system of fiscal decentralization, which was well underway when the project began, has allowed PBS to utilize these existing pathways to efficiently deliver and expand services. Once at the local level, the vast majority of funds pay for the deployment of frontline development workers, where this financing has a direct impact on meeting MDG targets. Health extension workers, for example, are a cadre of frontline health workers who are trained to promote healthy preventative behaviors and provide basic interventions, such as vaccinations and family planning information. This has a direct impact on reducing child mortality and improving maternal health. Additional teachers are directly related to increasing the net
5 Over a five year period starting from January 2013, the current Phase of PBS finances US$6.2 billion in basic
service block grants which are analyzed here of which the Government share is US$3.2 billion – the rest coming from development partners.
Stronger Compact
More Choice & Participation
Stronger Voice

12
REVIEW MEETING VERSION FOR INTERNAL USE ONLY
enrollment rate in order to achieve universal primary education. Through its first two phases, PBS helped to hire over 100,000 new primary school teachers, 38,000 health extension workers and 45,000 agricultural extension agents, dramatically expanding the reach of these services to those previously inaccessible.
11. Despite this impressive scale of the PBS, up to now there has been no empirical analysis demonstrating the effects of project spending on the outcomes achieved. Partly this has been due to the difficulty of obtaining local-level expenditure and outcome data over time. Compiling comprehensive expenditure data through time and consolidating it into a database with output indicators in health and education (also with the same time period) has been one of this study’s accomplishments. This study first addresses the data deficiency, and then provides empirical analysis on the effectiveness of Ethiopia’s decentralized approach to basic service delivery.
Study Approach
12. A primary objective of this study is to assess the impact of woreda-level expenditures for decentralized sectors on key sectoral outputs and outcomes.6 As noted in the previous section, there is a direct relation between woreda-level spending in agriculture, education and health, and key service outputs, such as the numbers of agriculture extension workers, teachers and health extension workers respectively. Thus, per capita woreda-level spending is a good proxy indicator for the level of service delivery in these sectors7, and this study focuses instead on such outcomes as the net enrollment rate, rates of vaccination and contraceptive use, and agricultural yields of a variety of crops (see figure 2 for a diagrammatic representation of PBS impact). A secondary objective is to assess the incidence of local expenditures by income quintile in line with the Bank’s new objective of shared growth targeting the bottom 40%. A third objective is to investigate possible ethnic bias in the allocation of woreda-level block grants, keeping in mind Ethiopia’s constitutional objective of providing additional resources to historically underserved populations.
13. Another objective of this study, in line with the WDR 2004 triangle of accountability concept, is to assess PBS components designed to strengthen citizen voice as a critical element driving service improvements. Following this causal logic, the study investigates the effectiveness of Citizen Voice aspects of the program before turning to the effectiveness of the spending on outcomes. 14. One caveat should be mentioned. As always, the results presented are subject to the quality of data used. While the management information systems of the education and health systems, especially the former, are fairly reliable and improving (not least through PBS support), there still remains much room for improvement. Fortunately, our results in health and education are confirmed by national level analysis of DHS data. Our agriculture analysis used agriculture sample survey data, which is considered reliable.
6 The study does not look at quality and service delivery effectiveness issues. PBS-3 is funding service delivery
indicator data collection for health and education and future studies are planned on those results. 7 It should be noted that in education learning materials are financed separately, in health facilities above the
health center are financed separately, in agriculture this only include development agent spending and in roads road maintenance staff spending.

13
REVIEW MEETING VERSION FOR INTERNAL USE ONLY
Figure 2: Conceptual model of the impact of PBS spending
Figure 3: Woreda-level expenditure in the five PBS Sectors, 2011
Methodology
15. This study relies on a database of woreda-level recurrent expenditure and outcome information for a variety of health and education indicators at woreda level between 2008 and 2011.
Outcomes
Teachers & Health/ Agriculture Extension workers hired
Spending for salaries of Teachers & Health/ Agriculture Extension workers
Direct impact:
Net enrollment ratio
Pupil-teacher ratio Gains in literacy
Increased life expectancy
Lower infant mortality
Increased agricultural income
Outputs Delivery Inputs
Catalytic impact:
Number of children vaccinated
Women receiving ANC
Number of people using contraception
Yield from agricultural crops

14
REVIEW MEETING VERSION FOR INTERNAL USE ONLY
Also included are woreda demographic characteristics, including the population, ethnicities, rural vs. urban, and other variables drawn from the 2007 census. We use econometric modeling to assess the impact of increased local spending on the expansion of basic services and outcomes, and by extension the efficiency of the PBS in meeting its development objective. The study also verifies the woreda level findings in health and education using the household data from DHS 2005 and DHS 2011 including use of probit regressions to predict impact on household behavior resulting from interactions with health extension agents.
16. Panel regressions with the outcome variable of interest on the left-hand side were run to evaluate the impact of per capita sector expenditure, controlling for rural/urban percentage and ethnicity, over the four years. The indicators evaluated are mostly drawn from the PBS Results Framework. In those sectors for which no reliable outcome data at local level could be gathered – two different approaches are followed one for agriculture and one for water supply and roads. In agriculture, zonal level data is available for outcomes. By taking the average per capita woreda spending on agriculture as a proxy for services offered by agriculture extension workers, zonal outcome data can be used to assess the effectiveness of this spending. Data constraints are more severe for water supply and roads, forcing us to revert to desk reviews.8
17. It is difficult to overstate the difficulty of doing subnational empirical work on Ethiopia. As far as can be gleaned from official sources, relatively little data is collected, the data is often of poor quality, and few attempts are made to systematize the results into any obviously comparable framework. A few illustrations are telling. Fiscal data on subnational expenditures in health, education, agriculture, water, and roads were until very recently available only for EFY 2003. Their geographic identifying codes and names do not match those of census data, whose geographic codes and names vary in unpredictable but pervasive ways from fiscal data. The last census counted some 740 woredas, zones, and regions, but the fiscal dataset includes more than 850. Consolidating these two yielded a dataset of 989 subnational units, 250 more than in the census.
18. Regressions were also run using a quadratic format using the square of the expenditure variable, in addition to the linear form to check for decreasing marginal returns. Log-linear regressions were also run to reduce the effect of extreme values (outliers) on the results.
19. The analysis consists of three key stages. Stage I follows the approach of Faguet (2012) and Faguet and Sánchez (2013), examining the relationship between woreda-level spending (a proxy for service delivery as noted above in paragraphs 6 and 10) in each sector on results in those sectors. Ideally we would use first differences on the outcome LHS variables. But unfortunately the few years of data we currently have available make this impractical. So instead we place levels on the LHS and in effect estimate trends.
20. Stage II conducts an incidence analysis of woreda-level spending by quintiles, using the wealth quintile breakdown from the DHS survey. The incidence analysis was done by allocating improvements in health and education outcomes to each quintile by pro-rating the expenditure increases to each quintile by the improvement in outcomes achieved for that quintile controlling for the average improvement for all groups9. The results indicator for education was the net enrolment rate which is directly affected by woreda recruited teachers where for health the results indicator is average of three indicators which are directly affected by locally recruited health extension workers.
8 Normally, DHS has good water supply data but in the case of Ethiopia due some definitional changes the
water supply data between the two rounds of DHS are not compatible. This is also true for national data as revealed in a recent census. 9 This methodology was adopted due to the lack of data on direct use of different services by quintile. This
assumes a link between woreda recruited staff and results.
15
REVIEW MEETING VERSION FOR INTERNAL USE ONLY
These are: increase use of contraception, increased rates of immunization, increased use of pre-natal care and increased use skilled birth attendants.
21. Stage III uses limited dependent variable regressions to examine the link between woreda expenditure and sectoral results for different wealth quintiles10 to estimate probabilities of households acting in a certain manner. This three stage analysis was limited to sectors where data on woreda-level results was reliable, and corresponding household survey data on health and education available. In the case of education, the third stage test was not considered necessary due the direct linkage between woreda-level spending, which is mostly for teachers, and the Net Enrolment Rate. This was needed for health because the linkage is more indirect. Woreda-level spending is on health extension workers, and therefore the link between contact with health extension workers and health sector outcomes was tested using DHS data.
22. With regard to agriculture, results (or output data) was not available at the woreda level – only at the zonal level. Incidence analysis was not possible, but the impact of agriculture extension services by land-holding quintile was analyzed. In the case of water supply, a recent national census found that the data was unreliable, and thus analysis was not carried out for this sector either nationally or locally. But as this accounts for only 2% of woreda-level expenditures, this does not really pose a problem. Finally, for roads – which account for only one percent of woreda-level expenditures – this level of in-depth analysis was not possible.
Citizen Direct Voice and Accountability
Financial Transparency and Accountability (FTA)
23. Over the last five years, the Financial Transparency and Accountability (FTA) tools designed under PBS have been rolled out and used to disclose regional and local-level budget and service delivery information. As a result, more than 90% of all woredas and city administrations across the country now post information on local budgets and service delivery targets and accomplishments publicly. This is a significant change that has revolutionized transparency, as there was no such public release of this key information before 2006.
24. A recently conducted survey11 shows that 42.5% of respondents have seen FTA templates posted in their jurisdictions, and 37% of those have discussed budget information with their woreda/city officials, while another 26% have discussed the information with other citizens. In addition to posting information, regions use radio and TV programs, brochures, t-shirts, and other innovative means of information dissemination. Budget Literacy Training (BLT) was also delivered for more than 230,000 citizens across the country in all woredas and city administrations. This has contributed to enhance the understanding of citizens on budget process and service delivery issues.
25. These efforts have helped improve citizen direct voice, with 37% of survey12 respondents indicating that woreda and city officials had sought citizens views on budgetary issues, and 43% revealing that officials had also sought the views of the people on the quality of public services. Citizens have thus started to provide feedback on budget execution and participate in monitoring project implementation. Creating linkage and synergies between FTA and Social Accountability will play a significant role in promoting transparency and accountability in the system in years to come.
10
Education and health quintiles were based on DHS quintiles while for agriculture the quintile estimates used land-size quintiles. 11
Financial Transparency and Accountability Implementation Assessment Report, September 2013, Addis Ababa, pp34-35 12
ibid
16
REVIEW MEETING VERSION FOR INTERNAL USE ONLY
Social Accountability
26. As a complement to the financial transparency and accountability results, the Social Accountability program supports civil society organizations that improve opportunities for citizens to provide feedback to local administrators and service providers. The social accountability component piloted Community Score Cards, Citizen Report Cards and Participatory Budgeting. It also promoted interface meetings between citizens and local authorities to provide feedback on service delivery. During the earlier phases of PBS, social accountability was piloted in 86 woredas. During the current phase, social accountability is being implemented in 224 woredas by a total of 49 Social Accountability Implementing Partners (SAIPs) by supporting public service providers to deliver improved quality of services in education, health, agriculture, water and sanitation, and rural roads, in response to feedback from communities and citizen groups. PBS social accountability activities are financed through a programmatic multi-donor trust fund administered by IDA, though without IDA resources. During PBS Phase 3, the program will continue the use of tools piloted in the first phase, including Community Score Cards, Citizen Report Cards, and Participatory Budgeting. Interface meetings between users and providers of services, along with woreda and kebele officials, will also continue, as will the development of agreed joint action plans monitored by joint committees of service users and providers. Other social accountability tools will also be carefully considered based on their value added, including participatory planning and budgeting, budget tracking, gender responsive budgeting, and service charters.
27. The expansion of Social Accountability under the new phase of PBS is based on the findings of an impact assessment of the pilot phase.13 This found that the social accountability program had increased citizen awareness of their rights, responsibilities, and entitlements to basic services, with over 84% of those surveyed in pilot areas responding positively. Evidence showed that basic services improved as a result of the joint service improvement plans drawn up between service providers and users. The quality of engagement between citizens and service providers also improved as a result. These findings bear out the prediction of the WDR 2004 model shown in Figure 1. Assessment was not via formal evaluation, but relied more on recapitulative data; going forward a full evaluation has been built into the design, and a baseline survey has been completed.
28. An additional policy element being explored with the government is how to sustain initiatives currently being implemented under social accountability. Initial thoughts point to a need to strengthen linkages between social accountability and FTA, an evaluation of implementation of recommendations on linkages, and an elaboration of more medium and long term choices based on those evaluations.
Grievance Redress Mechanisms (GRM)
29. A study14 conducted in Ethiopia under the auspices of PBS in 2011 found that GRMs exist in several of the country’s regions using different regional level mechanisms established during the past decade under the government’s various programs. However, the mechanisms were set up differently and display significant variations in terms of legal underpinnings, government entity responsible, accountability, procedures, and the finality and enforcement of grievance findings.
30. PBS aims to help strengthen existing GRM offices at the regional/state level, including contributing to information and public awareness of the services they provide, delivering technical assistance to develop a common standard of grievance redress procedures, and capacity
13
IPE Global Evaluation and Design of Social the Social Accountability Component of the Protection of Basic Services Project, New Delhi 2010 14
Strengthening Grievance Redress Mechanisms for the Protection of Basic Services Program in Ethiopia, September, 2011
17
REVIEW MEETING VERSION FOR INTERNAL USE ONLY
development and training for grievance officers. PBS supports the opening of GRM offices in all regions, and of Ethiopian Institution of the Ombudsman (EIO) branch offices, through dialogue and by providing technical and financial support. It is currently financing capacity building trainings and workshops conducted by the EIO for regional EIO branch offices and regional GRM officers, and supporting studies and that will aid the standardization and improvement of the GRM system across the country. It is an important contribution that supports the forum on which ordinary citizens can air their complaints.
Effectiveness and Equity of Woreda Block Grant Spending: Education
Link between Education Outcomes and Woreda Block Spending
31. Over half of PBS resources channeled to local governments are used to hire primary school teachers. According to the Demographic and Health Survey, between 2005 and 2010 the primary net enrollment rate increased from 68 percent to 82 percent, and the primary completion rate rose from 34 to 49 percent. (Secondary education expenditure is split between the woreda and the region, and so has not yet been included in the analysis.) The analysis here focuses on Woreda level education expenditures on enrolment rates and pupil-teacher ratios. It does not consider non-salary recurrent costs in education which come from other levels of government15 nor does it consider the capital costs such as school buildings. However, in basic education teacher costs are more than 90% of total recurrent costs.
Table 1. Effect of One Birr Per Capita Education Expenditure on Education Outcomes
Independent
Variable
Dependent Variable/
Indicator
Coefficient/(SE) Significance
Linear Regression Equation Estimates
Expenditure Net Enrollment Rate 0.05
(0.007)
***
Pupil-Teacher Ratio -0.05
(0.007)
***
Non- Linear (Quadratic) Regression Equation Estimates
Expenditure Net Enrollment Rate 0.10
(0.001)
***
Pupil-Teacher Ratio -0.11
(0.0259)
***
Expenditure Squared Net Enrollment Rate -0.0001
(0.00002)
***
Pupil-Teacher Ratio -0.0002
(0.00006)
***
Log Linear Regression Estimates
Log of Expenditure Log of Net
Enrollment Rate
0.131
(0. 0122)
***
Log of Pupil-Teacher
Ratio
-0.13
(0.0110)
***
Notes: Based on panel dataset from 2008-2011. Standard errors given in parenthesis. Significance is defined as: *** at 1%
level. Number of Observations: 2583 for NER and 2695 for PTR.
15
For example education quality is supported under GEQIP (General Education Quality Improvement Project funded by the Government, World Bank, DFID, USAID and many others.
18
REVIEW MEETING VERSION FOR INTERNAL USE ONLY
32. The study considered two education-related indicators - Net Enrollment Rate (NER) and Pupil Teacher Ratio (PTR). These are both included in the PBS 3 Results Framework as direct objectives the project aims to improve. For both, there is a strong significant relationship with woreda-level per capita recurrent expenditure, when controlling for the effects of rural/urban percentage and ethnicity. Table 1 presents the main coefficients of interests from our regression analysis. Full results are presented in Annex B. For every additional Ethiopia Birr per capita in woreda education spending, NER increases by 0.05%. Converted into dollar terms, a USD 1 increase in spending will result in a 0.95% increase in NER. These results are all significant at the 1% level, as well as robust to changes in specification. Similar results are seen with the PTR. An increase in per capita expenditure leads to a decrease in the number of students per teacher. This is again significant at the 1% level, and the magnitude of this effect is on par with that for the NER: a USD 1 increase yields a 0.95% decline in PTR.
33. Non-Linear regressions were also estimated using a quadratic form. These resultsalso show a strong positive effect (negative for pupil teacher ratio) of per capita woreda spending on education. The co-efficient on expenditure is positive, but the quadratic term is negative, implying declining marginal benefits as expenditures increase..
34. Finally, log-linear forms were also estimated, which reduce the impact of extreme values (outliers) on the results. Again, the results strongly support the hypothesis that increased education expenditures per capita at the woreda level increase net enrolment rates and decrease pupil-teacher ratios.
Incidence Analysis of Woreda Block Grant Education Spending
35. The impact of woreda-level education spending was also estimated by income quintile. The study found this spending to be pro-poor, with the bottom 40% benefiting from 56% of total spending, and the top quintile benefiting from only 13% of expenditure. The incidence of per capita woreda-level spending on education was more than 2.5 times higher for the bottom quintile than for the top quintile (see Table 4).
Effectiveness and Equity of Woreda Block Grant Spending: Health
36. About twenty percent of PBS resources at the local level are used in the health sector, mainly for hiring frontline community health workers called health extension workers (HEWs). HEWs do not provide extensive curative services. Their main purpose is threefold: to promote behavioral change leading to the adoption of healthy lifestyle practices among members in their community; to act as a referral mechanism for complicated cases, such as difficult pregnancies or severe child malnutrition, to be brought to a Health Center for treatment by trained health professionals; and to provide
periodically schedulable services, the most important among them are immunization, family planning (insertion of contraceptive implants) and antenatal care. See Box 1 for a full description of HEWs’ remit. Regarding maternal health, HEWs are supposed to mobilize women to seek skilled care by
“Skilled Birth Attendants”. This title is
Box 1. The 16 Health Extension Packages Delivered
by HEWs:
• Disease Prevention & control (3)
- HIV/AIDS and other sexually
transmitted infections (STIs) and TB prevention
and control
- Malaria prevention and control
- First Aid emergency measures
• Family Health (5)
- Maternal and Child health
- Family Planning
- Immunization
- Nutrition
- Adolescent reproductive health
• Health Education and communication
• Hygiene & Environmental Sanitation (7)
- Excreta disposal
- Solid and liquid waste disposal
- Water supply and safety measures
- Food hygiene and safety measures
- Healthy home environment
- Control of insects and rodents
- Personal hygiene

19
REVIEW MEETING VERSION FOR INTERNAL USE ONLY
reserved for nurses, health officers, trained midwives and physicians. While taking up a smaller percentage of expenditure, these positions are nonetheless funded from the local level budget.
Table 2. Effect of Per Capita Health Expenditure on Health Outcomes
Indicator Coefficient/(SE) Significance
Linear Regression Equation Estimates
Expenditure Penta 3 vaccinations* 0.12
(0.039)
***
Antenatal Care 0.18
(0.027)
***
Contraceptive
Acceptance Rate
0.14
(0.037)
***
Deliveries by Skilled
Birth Attendants
0.11
(0.020)
***
Non- Linear (Quadratic) Regression Equation Estimates
Expenditure Penta 3 vaccinations* 0.13
(0.057)
***
Antenatal Care 0.31
(0.0477)
***
Contraceptive
Acceptance Rate
0.32
(0.0441)
***
Deliveries by Skilled
Birth Attendants
0.15
(0.0320)
***
Expenditure Squared Penta 3 vaccinations* -0.00007
(0.0004)
NS
Antenatal Care -0.0011
(0.0003)
***
Contraceptive
Acceptance Rate
-0.001
(0.0002)
***
Deliveries by Skilled
Birth Attendants
-0.0003
(0.0002)
NS
Log Linear Regression Estimates
Log of Expenditure Log of Penta 3
vaccinations*
0.02
(0.0532)
NS
Log of Antenatal
Care
0.13
(0.0317)
***
Log of Contraceptive
Acceptance Rate
0.16
(0.464)
***
Log of Deliveries by
Skilled Birth
Attendants
0.30
(0.0500)
***
Notes: Based on panel dataset from 2008-2011. Standard errors given in parenthesis. Significance is defined as: *** at 1%
level, ** and at 5% level. The coefficient for Penta 3 vaccinations is based on lagging the impact of health expenditure by
one year in view of the timing of the immunization campaigns. Number of Observations: 1664 for Penta 3, 2277 for ANC,
2243 for Contraceptive acceptance rate and 2154 for Deliveries by skilled birth attendants.
37. This study considered the impact of expenditure on four health-related outcomes – the Penta3 vaccination rate, percentage of pregnant women who received Antenatal Care (ANC), Contraceptive Acceptance Rate (CAR), and percentage of Deliveries by Skilled Birth Attendants (DelSBA). The first two of these are included in the PBS 3 Results Framework, while the latter two were included in the Framework for PBS 2. Each is directly related to local-level health expenditure. Table 2 presents the main coefficients of interests from our regression analysis. Full results are presented in Annex B.

20
REVIEW MEETING VERSION FOR INTERNAL USE ONLY
38. The results show that increased health expenditures by woredas improve rates of Penta 3 vaccinations, women receiving antenatal care, contraceptive use, and deliveries by SBAs. All of these results are significant at the 1% level, and all are robust to changes in specification. Again as for education, we only consider the impact of woreda level spending which covers health extension workers and health center staff. Non-salary and capital costs are not covered, but clearly can also impact final results. HEWs can convince mothers to immunize their children, but the immunization must also be available; these are financed separately.
39. Non-Linear regressions were estimated using a quadratic form, which also shows a strong positive effect of per capita woreda spending on all four health indicators. The co-efficient on expenditure is greater than in the linear form especially for antenatal care and contraceptive acceptance, but for both of these the expenditure square term shows strongly significant negative values, implying declining marginal returns to expenditure over time. The square of expenditure per capita is not significant for Penta-3 vaccinations and delivery by skilled birth attendants, which could imply that declining returns have yet to set in for these two results.
40. Finally, log-linear forms were also estimated to reduce the impact of extreme values on the results. Again, the results strongly support the hypothesis that increased health expenditures per capita at the woreda level increases immunization rates, contraceptive acceptance rates, deliveries by skilled birth attendants and use of antenatal care services.
41. All of these indicators are directly related to the responsibilities of HEWs, where the majority of local level recurrent health expenditure is directed. In terms of vaccination rates, HEWs are the frontline workers meant to mobilize the community during immunization campaigns. They also are the first source for pregnant women to seek ANC services, as well as being the primary spokespeople informing the community of the importance of contraception in family planning. While not technically “skilled birth attendants”, their focus on referral of pregnancies to those professionals in health centers impacts the proportion of women who are able to give birth with a trained provider.
42. A smaller percentage of local health expenditure is directed to the health center level. By federal mandate, each of the 3,000 health centers is supposed to be staffed by one to three health officers, depending on the characteristics of the host community. Each health officer is backed up by a team of about four nurses. There is also at least one trained midwife at each health center. While each of the indicators assessed could be subject to a mixture of influences between HEWs and health center staff, the majority of the impact for all except deliveries by skilled birth attendant would be expected to come from HEWs. Deliveries by SBAs would be influenced more equally by both HEWs and health center staff.
Impact of Woreda Block Grant Health Spending by Wealth Quintile
43. As mentioned above, Ethiopia has already met its MDG Goal 4 of reducing the under-five mortality rate (U5MR) by two thirds. This impressive achievement is due in no small part to rising local health budgets. These increased resources finance staff who provide the services and promote the healthy actions needed to reduce under-five mortality. The improvements seen in U5MR are seen across other health indicators as well. Conveniently, Ethiopia’s Demographic and Health Survey was conducted one year prior to PBS and again after five years of implementation, allowing the study to analyze before and after changes by place of residence (urban vs rural) and wealth quintile.
44. Figure 4 below demonstrates that there has been substantial improvement across all six indicators examined between 2005 and 2011, and that – in the majority of cases – the bottom two
21
REVIEW MEETING VERSION FOR INTERNAL USE ONLY
quintiles have increased most. The table is broken down by rural wealth quintile.16 As the majority of PBS resources flow to rural areas, this breakdown helps to see the project’s impact more clearly. Contraceptive rates for the bottom two quintiles rose over 200%, more than twice as much as the top two quintiles. Similarly, for measles vaccination rates, ANC, and delivery by a skilled provider, the poorest quintile showed the largest improvement. All of these outcomes are highly influenced by the presence of health workers in the field, which are financed by PBS expenditures.
Figure 4: Percent Improvement, by Rural Quintile, between 2005 and 2011 for Selected Health Indicators
45. There is also improvement for the poorest quintiles in child and under-five mortality, more so than for the richest quintile, but to a lesser degree than other quintiles. Unlike the other variables, these outcomes are particularly susceptible to factors outside the control of local level recurrent health expenditure. Food security, nutritional status, and a mother’s education all play a larger role in driving these outcomes, some of which will more directly affect poorer individuals. It is telling that there are larger improvements in child mortality as opposed to under-five mortality. This is notable as it suggests that improvements in services under PBS - through the package provided by HEWs - are more targeted to children rather than infants
46. Based on data in the 2011 DHS, it also is possible to derive estimated rates of improvements in some of these outcomes based on the impact of the PBS-financed HEWs themselves. A question in the 2011 survey asked whether a “family planning specialist or HEW” had visited the household in the past year. As many of the outcomes fit nicely into a binomial response, e.g. use of contraception versus no use of contraception, it was possible run a probit model where the response to the question of an HEW visit was the right-hand side variable and the left-hand side was either the
16
Given the small urban population in Ethiopia, the sample size of wealth quintiles by urban residence provided too few observations to be representative.
Notes: Child and Under five mortality changes are multiplied by negative one to obtain overall improvement.
22
REVIEW MEETING VERSION FOR INTERNAL USE ONLY
“success” or “failure” to achieve the health outcome. The model coefficients were then used to determine predicted probabilities for the specific outcome.
47. Table 3 shows that HEWs had a significant effect across place of residence and wealth quintile: a household was more likely to achieve an outcome if they had been visited by an HEW than if they had not. This held across all outcomes for urban and rural location, and for three of the four outcomes examined by wealth quintile, despite the small sample size problems of the latter.17 For example, the poorest rural households were 15% more likely to have a pregnant woman receive antenatal care and 12% more likely to vaccinate their child against measles if they had received a visit from an HEW than if not. Many of the outcomes are more likely the richer the household is. This is most likely due to unobserved factors, the foremost of which is probably women’s education. Full results are presented in Annex B.
Table 3: Predicted Probabilities for “Successful” Health Outcomes by Place of Residence and Wealth Quintile if HH was visited by an HEW in the Past Year
Residence Quintile Contraceptive Use
Measles vaccination
ANC with doctor, nurse midwife or HEW
Delivery by doctor, nurse midwife or HEW
Urban Total 0.071*** 0.176*** 0.124*** 0.110***
Rural
Total 0.094*** 0.144*** 0.107*** 0.017**
Poorest 0.043** 0.115*** 0.148*** NS
Second 0.078*** 0.106** 0.073*** NS
Middle 0.069*** 0.123*** 0.097*** NS
Fourth 0.108*** 0.181*** 0.096*** 0.022*
Richest 0.127** 0.189* 0.130** NS Notes: Based on Probit models. Significance is defined as: *** at 1% level, ** at 5% level and * at 10% level, and
NS is not significant. Number of observations varies by quintile, location and outcome. See annex for details.
Incidence Analysis of Woreda Block Grant Health Spending
Table 4 : Incidence of Woreda-level Spending by wealth quintiles
Bottom 40% Share
Top 20% Share
Multiple by which Bottom quintile exceed top quintile
- Education 56% 13% 2.7
- Health 63% 10% 3.4
Combined Education and Health 58% 12% 2.9
48. Just as for education, it was possible to combine the DHS quintile-by-quintile results data with spending data for different years to calculate the incidence by quintile of woreda-level health spending. The analysis shows that 63% of the impact of woreda-level health expenditures accrued to the bottom 40%, whereas only 10% accrued to the top quintile. The benefit incidence of per capita
17
The sample size for any deliveries attended by a doctor, nurse, midwife or HEW was small. There were only 1,000 births delivered by one of these practitioners, making it difficult to obtain reliable estimates when breaking them down by wealth quintile.
23
REVIEW MEETING VERSION FOR INTERNAL USE ONLY
woreda-level health spending for someone in the bottom quintile was more than times that of someone in the top quintile18.
Effectiveness and Equity of Woreda Block Grant Spending: Agriculture
Evolution of Extension Services
49. Ethiopia relies heavily on agriculture. It comprises almost half of the country’s GDP and employs around 80% of its people. PBS supports the agriculture sector through financing recurrent costs at woreda level. The majority of these costs are directed towards the employment of development agents (DAs). DAs are trained workers who provide extension services by teaching community members the benefits of improved farming techniques. Such techniques can include the use of improved seeds and fertilizer, and the importance of irrigation and erosion prevention, among others. About twenty percent of PBS funds go to the agriculture sector. 50. As in health and education, agricultural expenditure increased rapidly between 2008 and 2011. Concomitant with this increase, the percentage of fields that use extension services has more than doubled. Figure 5 shows this trend for both variables. The agricultural data here, as well as much of the data presented in the rest of this section, is collected by the Central Statistical Agency as part of its annual Agricultural Sample Survey (AGSS). This survey collects information from around 45,000 households and includes data from 500,000 fields from across Ethiopia’s nine regions as well as Dire Dawa (a city state). In the analysis, the data has been aggregated at zonal level, as it is more representative of the underlying population at this level.
Figure 5: Growth in Extension Services and Woreda Agriculture Expenditure, 2008-2011
18
This compares very favorably to the preliminary findings of on-going PREM led work on the overall incidence of spending.

24
REVIEW MEETING VERSION FOR INTERNAL USE ONLY
Impact of Extension Services on Productivity
51. When panel regressions are run on AGSS data between 2008 and 2011, there is a significant effect of zonal agriculture expenditure on a variety of improved farming techniques (Table 5). The regressions control for the same aspects as those for health and education – the percentage of the population that is rural, and the ethnic composition of the zone. Here the deviation in rainfall for both the current and previous year from the average rainfall between 1996 and 2011 at zonal level is also included as a predictor. In all regressions where an agricultural variable is included on the left-hand side, both the current year’s as well as the previous year’s deviation from average rainfall is a significant predictor. Full results are presented in Annex B.
Table 5: Effect of One birr per Capita spending on Agriculture Extension workers on usage of Farmers’ Extension Services
Indicator Coefficient/(SE) Significance
Field using Extension Services 0.0008
(0.0004)
**
Field using Improved Seeds 0.0002
(0.0001)
*
Field using Fertilizer 0.0007
(0.0003)
**
Notes: Based on Probit models. Panel data drawn from Agricultural Sample Survey data from 2008-2011, pooled at zonal
level. Number of observations: 191. Controls include current and previous years’ deviations from average rainfall
(calculated as the average between 1996 and 2011), zonal poverty rate, percentage of the zone’s population that is rural, and
the same ethnic groupings as used in the regressions above. Standard errors given in parenthesis. Significance is defined as:
** at 5% level and * at 10% level. 52. Although the effects appear to be relatively small, the results show that for several aspects of improved farming techniques there are significant and positive associations with zonal per capita agriculture spending. For every additional USD 1 per capita spent, for example, the probability that a field in that zone will benefit from extension services increases by about 0.2% (assuming and exchange rate of ETB20/USD). Specifically, usage of fertilizer and improved seeds has smaller coefficients but remain positively significant. Irrigation is one technique that is not associated with higher agriculture spending. This could be due to higher capital costs associated with irrigating fields, and would therefore be dependent more on a particular zone’s expenditure in the water sector.
Figure 6: Quantity of Production (quintales) by Crop Type, 2011
Notes: Other includes hops and chat. The chart does not include sugar, which is not often grown on
privately held land.
25
REVIEW MEETING VERSION FOR INTERNAL USE ONLY
53. The figure (Figure 6) shows the overall basket of crops produced by Ethiopian private farmers in 2011 by production quantity, measured in quintales. Cereals, which include barley, teff, wheat, sorghum, maize, oats, and rice, make up almost three-quarters of production. A further 15% consists of pulses (e.g. beans, chick peas and lentils) and root crops (e.g. potatoes, carrots and onions). Enset, fruit crops and coffee, which are more geographically confined, represent a smaller proportion of overall production. 54. The overall objective of agriculture spending is to increase the productivity of farmers’ fields. Productivity is measured by yield, which is the ratio of quintals produced per hectare of land cultivated. Panel regressions between 2008 and 2011, with yield of a specific category of crop on the left-hand side, show strong positive relationships between recurrent agricultural spending and crop yields. The predictors in these regressions were the same as for those above - the percentage of the population that is rural, the zone’s overall poverty rate, the deviation of the zone’s rainfall for the current and past year from the average, and ethnic composition (this latter variable helps account for geographical heterogeneity in crops’ production). 55. Of the eight groups of crops grown in Ethiopia, five show positive and significant relationships with agricultural spending (table 6). These five represent about 85% of the production in the country. Production of cereals, which are by far the largest group of crops, increases at a rate of around 50 kilograms per hectare when there is an increase of ETB1 per capita in agriculture spending. Root crops, which are the third largest group of crops in terms of production, enset and fruit crops show a very large increase with agriculture spending. Pulses, vegetables and oilseeds show no significant relationship. These results, combined with the impact of agriculture spending on extension services given above, show the important impact PBS funds have on increasing farmers’ productivity levels. Full results are presented in Annex B.
Table 6: Effect of One birr Per Capita spending on Agriculture Extension workers on Yield
Independent Variable Dependent Variable/Indicator (Yield
in Quintales/Hectare)
Coefficient/(SE) Significance
Linear Regression Equation Estimates
Expenditure Cereal 0.050
(0.016)
***
Pulses -0.015
(0.020)
NS
Root Crops 5.349
(1.632)
***
Vegetables 0.1120
(0.1507)
NS
Oilseeds -0.0112
(0.0185)
NS
Enset 16.728
(6.4530)
**
Fruits 9.418
(2.2438)
***
Coffee 0.495
(0.1401)
***
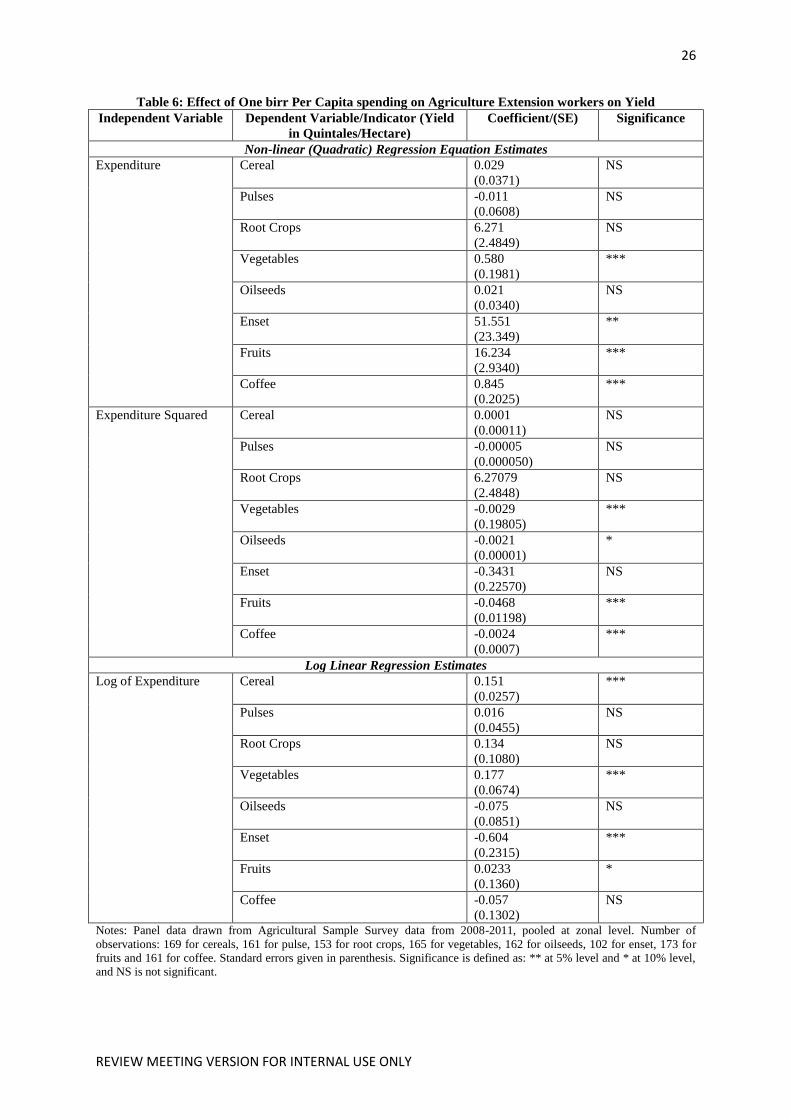
26
REVIEW MEETING VERSION FOR INTERNAL USE ONLY
Table 6: Effect of One birr Per Capita spending on Agriculture Extension workers on Yield
Independent Variable Dependent Variable/Indicator (Yield
in Quintales/Hectare)
Coefficient/(SE) Significance
Non-linear (Quadratic) Regression Equation Estimates
Expenditure Cereal 0.029
(0.0371)
NS
Pulses -0.011
(0.0608)
NS
Root Crops 6.271
(2.4849)
NS
Vegetables 0.580
(0.1981)
***
Oilseeds 0.021
(0.0340)
NS
Enset 51.551
(23.349)
**
Fruits 16.234
(2.9340)
***
Coffee 0.845
(0.2025)
***
Expenditure Squared Cereal 0.0001
(0.00011)
NS
Pulses -0.00005
(0.000050)
NS
Root Crops 6.27079
(2.4848)
NS
Vegetables -0.0029
(0.19805)
***
Oilseeds -0.0021
(0.00001)
*
Enset -0.3431
(0.22570)
NS
Fruits -0.0468
(0.01198)
***
Coffee -0.0024
(0.0007)
***
Log Linear Regression Estimates
Log of Expenditure Cereal 0.151
(0.0257)
***
Pulses 0.016
(0.0455)
NS
Root Crops 0.134
(0.1080)
NS
Vegetables 0.177
(0.0674)
***
Oilseeds -0.075
(0.0851)
NS
Enset -0.604
(0.2315)
***
Fruits 0.0233
(0.1360)
*
Coffee -0.057
(0.1302)
NS
Notes: Panel data drawn from Agricultural Sample Survey data from 2008-2011, pooled at zonal level. Number of
observations: 169 for cereals, 161 for pulse, 153 for root crops, 165 for vegetables, 162 for oilseeds, 102 for enset, 173 for
fruits and 161 for coffee. Standard errors given in parenthesis. Significance is defined as: ** at 5% level and * at 10% level,
and NS is not significant.
27
REVIEW MEETING VERSION FOR INTERNAL USE ONLY
56. The results of the non-linear (quadratic) analysis also point in the same direction, though with fewer significant coefficients. Where significant, the coefficients are larger and also confirm declining marginal impact of extension service expenditures over time. The log-linear estimates do confirm some impact of extreme values (outliers) on agriculture productivity for some crops.
Impact of Extension Services by Landholding Quintiles
57. Analysis of the impact of agriculture extension services by land-holding quintiles was carried out using agriculture sample survey data. Data was grouped by land-holding quintiles, and regression analysis was done by group. The dependent variable was the use of improved techniques, defined as improved seeds, irrigation, or fertilizer, to estimate the probability of use of improved techniques for each birr of spending on agriculture extension services. Key findings are provided in Table 7; full results are presented in Annex B.
Table 7. Effect of One Birr per Woreda spending on Agriculture Extension workers on Improved Farming Techniques by Plot Size
Quintile, 2011
Plot size quintile Any improved technique
Smallest and Poorest 0.000322***
Second Smallest 0.000344***
Middle 0.000524***
Fourth 0.000667***
Largest and Richest 0.000818*** Based on Probit models. Standard errors given in parenthesis. Cross section data with
303,242 observations. Significance is defined as: *** at 1% level, ** at 5% level and * at
10% level, and NS is not significant.
58. Table 7 clearly shows that agriculture extension spending at woreda level increases the use of improved farming techniques for all groups. The magnitude is relatively low in the bottom quintile, which may reflect financial constraints to purchasing and investing in improved techniques. If so, this could be addressed by improving access to rural finance.
Gender Equity Analysis for Woreda Block Grant Spending
59. Another question the study attempted to answer is whether there is a gender bias in PBS expenditure. On the health side, the answer is an obvious yes. Female community members, along with children, are the primary focus of HEW outreach. They benefit from a majority of the packages delivered; see Box 1 above. Another way to answer this question is to look at the impact of expenditure on data disaggregated by gender. This type of data is only available in the education sector, and then only for select indicators.
60. Table 8 provides key coefficients for education recurrent expenditure on primary Net Enrollment Rate and Net Intake Rate, disaggregated by gender. Full results are presented in Annex B. The coefficient for female primary school students is slightly higher than that of males for NER, but this difference is not significant. For NIR the effect of expenditure is the same for both groups. The results show there is no negative bias against women in education expenditure, the sector where the majority of PBS funds are spent. Using non-linear (quadratic) terms shows similar results, confirming declining returns to scale. Similarly, the log-linear estimates confirms that the results are not being influenced by extreme values (outliers).
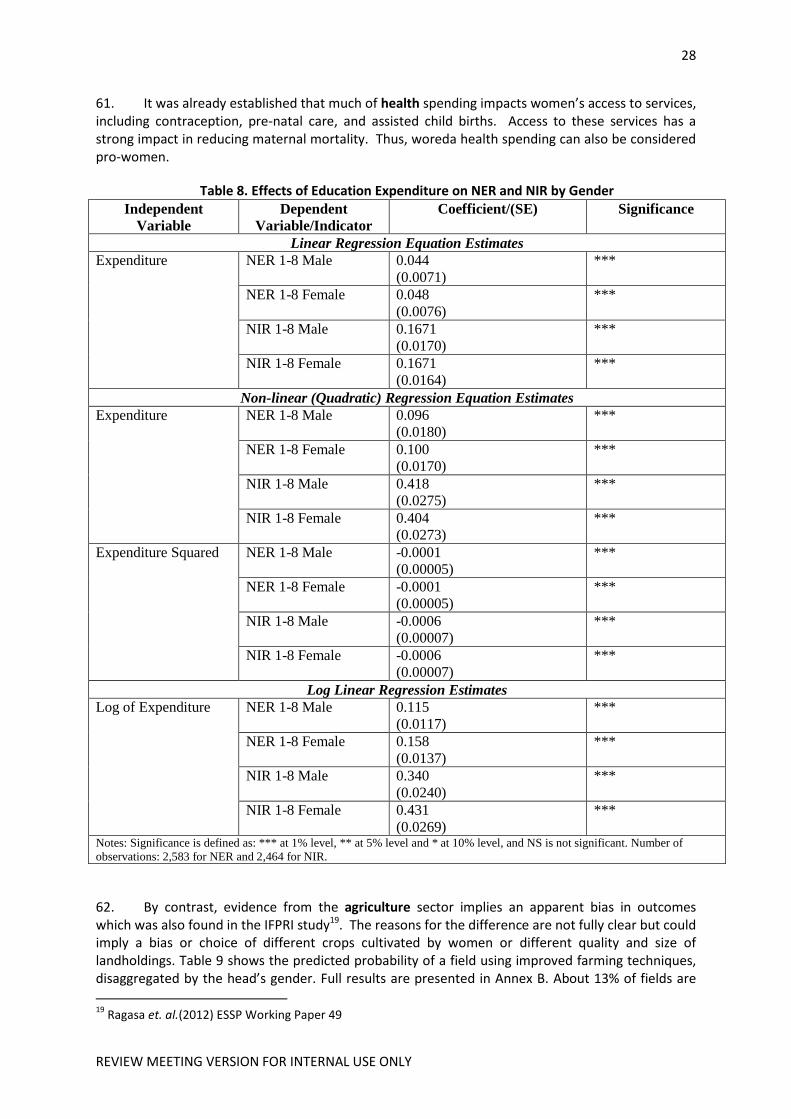
28
REVIEW MEETING VERSION FOR INTERNAL USE ONLY
61. It was already established that much of health spending impacts women’s access to services, including contraception, pre-natal care, and assisted child births. Access to these services has a strong impact in reducing maternal mortality. Thus, woreda health spending can also be considered pro-women.
Table 8. Effects of Education Expenditure on NER and NIR by Gender Independent
Variable
Dependent
Variable/Indicator
Coefficient/(SE) Significance
Linear Regression Equation Estimates
Expenditure NER 1-8 Male 0.044
(0.0071)
***
NER 1-8 Female 0.048
(0.0076)
***
NIR 1-8 Male 0.1671
(0.0170)
***
NIR 1-8 Female 0.1671
(0.0164)
***
Non-linear (Quadratic) Regression Equation Estimates
Expenditure NER 1-8 Male 0.096
(0.0180)
***
NER 1-8 Female 0.100
(0.0170)
***
NIR 1-8 Male 0.418
(0.0275)
***
NIR 1-8 Female 0.404
(0.0273)
***
Expenditure Squared NER 1-8 Male -0.0001
(0.00005)
***
NER 1-8 Female -0.0001
(0.00005)
***
NIR 1-8 Male -0.0006
(0.00007)
***
NIR 1-8 Female -0.0006
(0.00007)
***
Log Linear Regression Estimates
Log of Expenditure NER 1-8 Male 0.115
(0.0117)
***
NER 1-8 Female 0.158
(0.0137)
***
NIR 1-8 Male 0.340
(0.0240)
***
NIR 1-8 Female 0.431
(0.0269)
***
Notes: Significance is defined as: *** at 1% level, ** at 5% level and * at 10% level, and NS is not significant. Number of
observations: 2,583 for NER and 2,464 for NIR.
62. By contrast, evidence from the agriculture sector implies an apparent bias in outcomes which was also found in the IFPRI study19. The reasons for the difference are not fully clear but could imply a bias or choice of different crops cultivated by women or different quality and size of landholdings. Table 9 shows the predicted probability of a field using improved farming techniques, disaggregated by the head’s gender. Full results are presented in Annex B. About 13% of fields are
19
Ragasa et. al.(2012) ESSP Working Paper 49

29
REVIEW MEETING VERSION FOR INTERNAL USE ONLY
from female-headed households. When the household head is a woman, the household’s field is significantly less likely to benefit from extension services, though the effect is relatively small. But some caveats are in order: There will be many other factors influencing adoption of improved farming techniques, the sample size for female headed households is small, and data quality could be improved. Thus, these results only suggest that extension agents might be preferentially targeting male-owned fields. It is an issue that needs to be analyzed, and policy responses developed from such an analysis.
Table 9: Predicted Probabilities a Field using Improved Farming Techniques by Gender, 2011
Gender Probability of field using improved technique
Male headed 0.000027***
Female headed -0.000023***
Notes: Based on Probit models. Standard errors given in parenthesis. Significance is
defined as: *** at 1% level. Number of observations: 303,242.
Ethnic disaggregated Analysis for Woreda Block Grant Spending
63. Ethiopia has a complex history20 that can explain some of the differences in regional levels of development. In the late 19th century, areas consisting of today’s Beneshangul-Gemuz, Gambella, Southern Nations and Nationalities, Afar, Oromia and Somali regions were brought under the feudal system of the Ethiopian empire based in the highlands of north-central Ethiopia. Relations between the newly integrated areas and the historic center of the empire were troubled. Owing to the structural weakness of the center, successive Ethiopian governments did not command effective control over the peripheries. Similarly, exploitative economic policies caused visible marginalization and relative under-development. This dynamic of center-peripheral relations continued throughout the empire and socialist eras. It was not until 1991 with the ascension of the EPRDF into power that ethnic federalism took root in Ethiopia. One of the primary objectives of this new government was to reverse this policy of ethnic homogenization and to promote “equitable and broadly shared” economic growth among all regions. This involved affirmative action in terms of increased budget allocation to historically less developed regions. This preferential treatment of previously disadvantaged ethnic groups within Ethiopia is helping to create a more equitable distribution for development to take place.
64. The Government of Ethiopia has made development of historically disadvantaged groups a priority. Its system of fiscal decentralization transfers funds to local governments through a formula-based system at the federal and regional levels. Of primary consideration in these formulas are relative levels of development. One of this study’s main questions is: “Are woredas with a high proportion of historically disadvantaged ethnic groups favored or disfavored by fiscal transfers? “ Higher distributions to such groups would indicate that PBS funding is pro-developmental.
65. Ethiopia has 91 registered linguistic groups and 93 registered ethnicities, making it impractical to include a full set of dummies for either variable, let alone both, in the econometric estimations. Most of these account for less than one percent of the total population. Also, the five largest ethnicities are heavily concentrated in their five home regions, implying that controlling for region in the regression models is substantially similar to controlling for ethnicity. Hence the
20
For more details see Annex C.
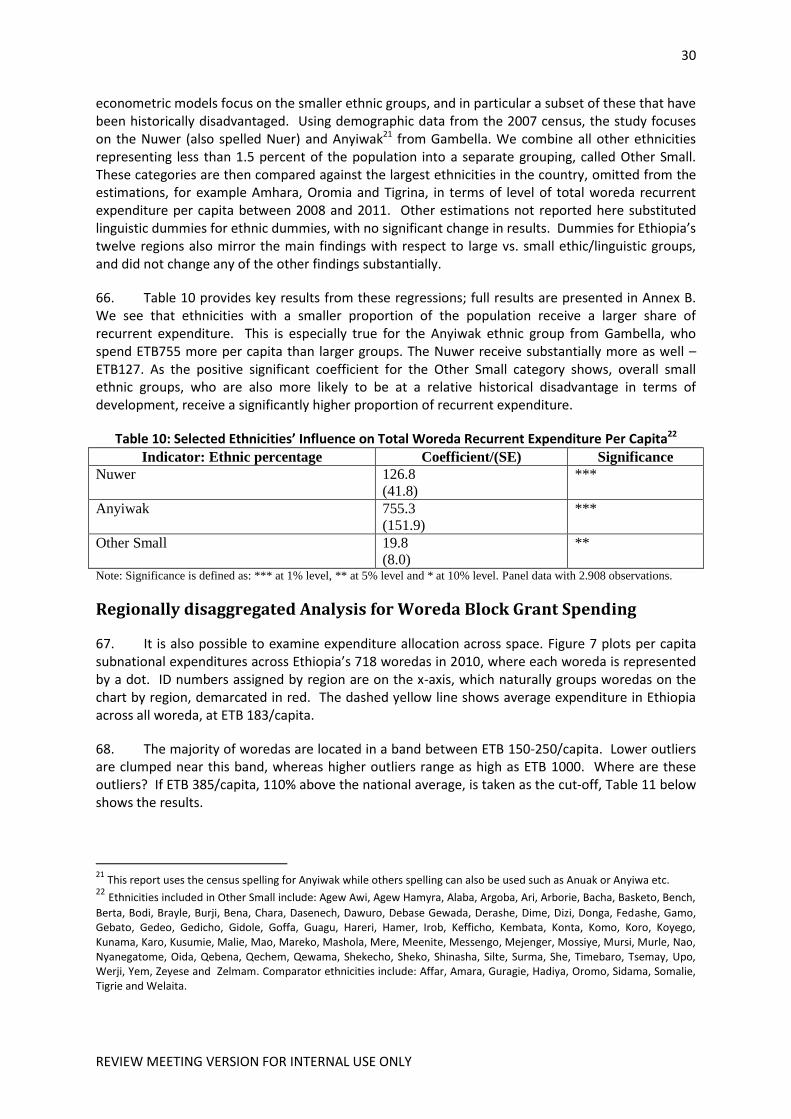
30
REVIEW MEETING VERSION FOR INTERNAL USE ONLY
econometric models focus on the smaller ethnic groups, and in particular a subset of these that have been historically disadvantaged. Using demographic data from the 2007 census, the study focuses on the Nuwer (also spelled Nuer) and Anyiwak21 from Gambella. We combine all other ethnicities representing less than 1.5 percent of the population into a separate grouping, called Other Small. These categories are then compared against the largest ethnicities in the country, omitted from the estimations, for example Amhara, Oromia and Tigrina, in terms of level of total woreda recurrent expenditure per capita between 2008 and 2011. Other estimations not reported here substituted linguistic dummies for ethnic dummies, with no significant change in results. Dummies for Ethiopia’s twelve regions also mirror the main findings with respect to large vs. small ethic/linguistic groups, and did not change any of the other findings substantially.
66. Table 10 provides key results from these regressions; full results are presented in Annex B. We see that ethnicities with a smaller proportion of the population receive a larger share of recurrent expenditure. This is especially true for the Anyiwak ethnic group from Gambella, who spend ETB755 more per capita than larger groups. The Nuwer receive substantially more as well – ETB127. As the positive significant coefficient for the Other Small category shows, overall small ethnic groups, who are also more likely to be at a relative historical disadvantage in terms of development, receive a significantly higher proportion of recurrent expenditure.
Table 10: Selected Ethnicities’ Influence on Total Woreda Recurrent Expenditure Per Capita22
Indicator: Ethnic percentage Coefficient/(SE) Significance
Nuwer 126.8
(41.8)
***
Anyiwak 755.3
(151.9)
***
Other Small 19.8
(8.0)
**
Note: Significance is defined as: *** at 1% level, ** at 5% level and * at 10% level. Panel data with 2.908 observations.
Regionally disaggregated Analysis for Woreda Block Grant Spending
67. It is also possible to examine expenditure allocation across space. Figure 7 plots per capita subnational expenditures across Ethiopia’s 718 woredas in 2010, where each woreda is represented by a dot. ID numbers assigned by region are on the x-axis, which naturally groups woredas on the chart by region, demarcated in red. The dashed yellow line shows average expenditure in Ethiopia across all woreda, at ETB 183/capita.
68. The majority of woredas are located in a band between ETB 150-250/capita. Lower outliers are clumped near this band, whereas higher outliers range as high as ETB 1000. Where are these outliers? If ETB 385/capita, 110% above the national average, is taken as the cut-off, Table 11 below shows the results.
21
This report uses the census spelling for Anyiwak while others spelling can also be used such as Anuak or Anyiwa etc. 22 Ethnicities included in Other Small include: Agew Awi, Agew Hamyra, Alaba, Argoba, Ari, Arborie, Bacha, Basketo, Bench,
Berta, Bodi, Brayle, Burji, Bena, Chara, Dasenech, Dawuro, Debase Gewada, Derashe, Dime, Dizi, Donga, Fedashe, Gamo, Gebato, Gedeo, Gedicho, Gidole, Goffa, Guagu, Hareri, Hamer, Irob, Kefficho, Kembata, Konta, Komo, Koro, Koyego, Kunama, Karo, Kusumie, Malie, Mao, Mareko, Mashola, Mere, Meenite, Messengo, Mejenger, Mossiye, Mursi, Murle, Nao, Nyanegatome, Oida, Qebena, Qechem, Qewama, Shekecho, Sheko, Shinasha, Silte, Surma, She, Timebaro, Tsemay, Upo, Werji, Yem, Zeyese and Zelmam. Comparator ethnicities include: Affar, Amara, Guragie, Hadiya, Oromo, Sidama, Somalie, Tigrie and Welaita.
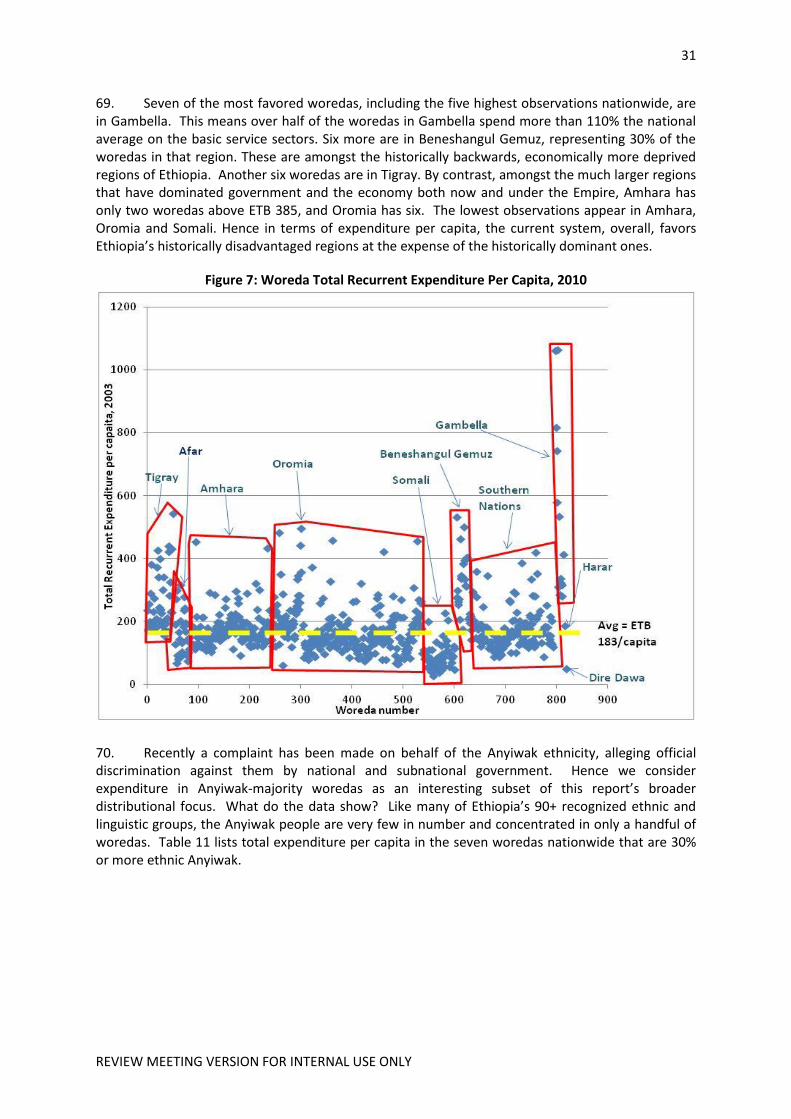
31
REVIEW MEETING VERSION FOR INTERNAL USE ONLY
69. Seven of the most favored woredas, including the five highest observations nationwide, are in Gambella. This means over half of the woredas in Gambella spend more than 110% the national average on the basic service sectors. Six more are in Beneshangul Gemuz, representing 30% of the woredas in that region. These are amongst the historically backwards, economically more deprived regions of Ethiopia. Another six woredas are in Tigray. By contrast, amongst the much larger regions that have dominated government and the economy both now and under the Empire, Amhara has only two woredas above ETB 385, and Oromia has six. The lowest observations appear in Amhara, Oromia and Somali. Hence in terms of expenditure per capita, the current system, overall, favors Ethiopia’s historically disadvantaged regions at the expense of the historically dominant ones.
Figure 7: Woreda Total Recurrent Expenditure Per Capita, 2010
70. Recently a complaint has been made on behalf of the Anyiwak ethnicity, alleging official discrimination against them by national and subnational government. Hence we consider expenditure in Anyiwak-majority woredas as an interesting subset of this report’s broader distributional focus. What do the data show? Like many of Ethiopia’s 90+ recognized ethnic and linguistic groups, the Anyiwak people are very few in number and concentrated in only a handful of woredas. Table 11 lists total expenditure per capita in the seven woredas nationwide that are 30% or more ethnic Anyiwak.

32
REVIEW MEETING VERSION FOR INTERNAL USE ONLY
Table 11: Public Expenditures in Anyiwak Woredas, EFY2003
Name % by Ethnicity
% of Total Expenditure Total Expend/capita Education Agriculture Health Water
Gambella Zuriya 70% 49% 32% 15% 4% 1,062 Abobo 53% 51% 31% 14% 3% 817 Gog 92% 575 26% 14% 3% 743 Jor 88% 52% 30% 13% 5% 581 Dime 51% 44% 27% 25% 3% 1,064 Gambella town 30% 80% 11% 9% 0% 310 Etang Special woreda 30% 56% 26% 14% 4% 414
National Average
0.69%
183
71. Majority-Anyiwak woredas receive between 1.7 and 5.8 times the national average expenditure/capita for all woredas. Interestingly, the multiple seems to rise broadly as the Anyiwak share of the population rises. In sharp contrast with Ethiopia’s “dominant” ethnicities, not a single Anyiwak woreda receives an amount anywhere near the national average, let alone less. They spend about half of these resources on education, one-third on agriculture, and most of the rest on health. Figure 8 makes the point graphically, returning to our previous chart and highlighting where exactly the majority- Anyiwak woredas lie. Five of the six woredas for which there are data receive the highest allocations nationwide. Where public expenditures and essential primary services are concerned, the charge of discrimination against the Anyiwak people is patently absurd.
Figure 8: Woreda Total Recurrent Expenditure Per Capita Highlighting Anyiwak-donminant woredas, 2010
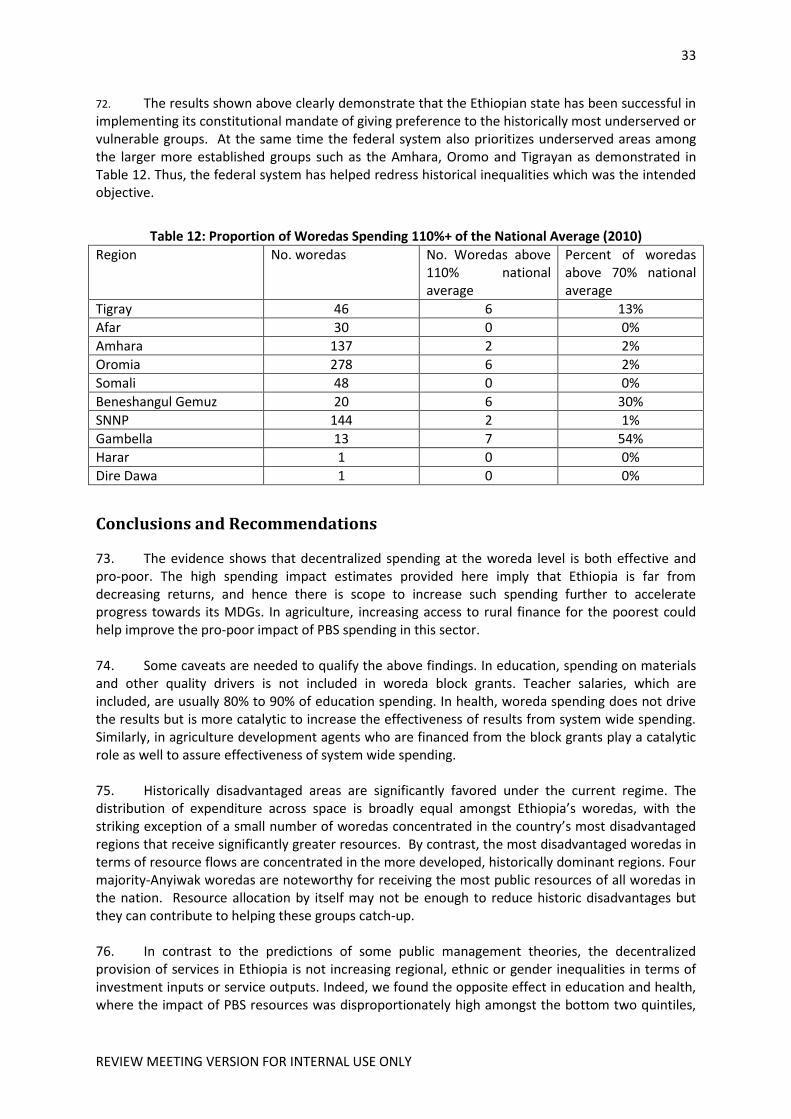
33
REVIEW MEETING VERSION FOR INTERNAL USE ONLY
72. The results shown above clearly demonstrate that the Ethiopian state has been successful in implementing its constitutional mandate of giving preference to the historically most underserved or vulnerable groups. At the same time the federal system also prioritizes underserved areas among the larger more established groups such as the Amhara, Oromo and Tigrayan as demonstrated in Table 12. Thus, the federal system has helped redress historical inequalities which was the intended objective.
Table 12: Proportion of Woredas Spending 110%+ of the National Average (2010)
Region No. woredas No. Woredas above 110% national average
Percent of woredas above 70% national average
Tigray 46 6 13%
Afar 30 0 0%
Amhara 137 2 2%
Oromia 278 6 2%
Somali 48 0 0%
Beneshangul Gemuz 20 6 30%
SNNP 144 2 1%
Gambella 13 7 54%
Harar 1 0 0%
Dire Dawa 1 0 0%
Conclusions and Recommendations
73. The evidence shows that decentralized spending at the woreda level is both effective and pro-poor. The high spending impact estimates provided here imply that Ethiopia is far from decreasing returns, and hence there is scope to increase such spending further to accelerate progress towards its MDGs. In agriculture, increasing access to rural finance for the poorest could help improve the pro-poor impact of PBS spending in this sector. 74. Some caveats are needed to qualify the above findings. In education, spending on materials and other quality drivers is not included in woreda block grants. Teacher salaries, which are included, are usually 80% to 90% of education spending. In health, woreda spending does not drive the results but is more catalytic to increase the effectiveness of results from system wide spending. Similarly, in agriculture development agents who are financed from the block grants play a catalytic role as well to assure effectiveness of system wide spending. 75. Historically disadvantaged areas are significantly favored under the current regime. The distribution of expenditure across space is broadly equal amongst Ethiopia’s woredas, with the striking exception of a small number of woredas concentrated in the country’s most disadvantaged regions that receive significantly greater resources. By contrast, the most disadvantaged woredas in terms of resource flows are concentrated in the more developed, historically dominant regions. Four majority-Anyiwak woredas are noteworthy for receiving the most public resources of all woredas in the nation. Resource allocation by itself may not be enough to reduce historic disadvantages but they can contribute to helping these groups catch-up. 76. In contrast to the predictions of some public management theories, the decentralized provision of services in Ethiopia is not increasing regional, ethnic or gender inequalities in terms of investment inputs or service outputs. Indeed, we found the opposite effect in education and health, where the impact of PBS resources was disproportionately high amongst the bottom two quintiles,

34
REVIEW MEETING VERSION FOR INTERNAL USE ONLY
and for women. Hence support for decentralized services in Ethiopia is an effective use of development partner resources from both efficiency and equity perspectives. 77. The only exception to these findings is agriculture, where the impact of PBS expenditures was smaller for the bottom quintile. This is likely related to a lack of agricultural financing to purchase necessary inputs, and suggests a need for complementary rural finance schemes, plus other programs designed to target the poorest groups. 78. Although quantitative evidence is unavailable at present, descriptive evidence implies that structured feedback sessions between citizens and service providers have helped to strengthen citizens’ participation in pilot areas under ESAP1, on which basis ESAP2 is being implemented. This experience, combined with the strong recommendations of theories of governance and accountability, point to a need for continued application of social accountability tools, and seeking acceptable policy options for sustainability in the Ethiopian context.
79. It is difficult to overstate the difficulty of doing subnational empirical work on Ethiopia. Creating the database required for this report has required a huge amount of work and improvisation on the part of the research team. A major output of this study is the production of a standardized database of woreda-level expenditures and characteristics, which will be made public. The data will be combined with new data coming from on going data collection being financed by PBS-3 and will also be used to prepare future studies under this programmatic knowledge services task. It is our hope that this dataset will in time become a useful tool for researchers and students elsewhere in Africa and beyond.

Annex A: Detailed Methodology and Sources of Data
Methodology
1. This study relies on a database of woreda-level recurrent expenditure and outcome information for a variety of health and education indicators at woreda level between 2008 and 2011. These are the only years of data available currently, although we hope to extend the dataset over time. Also included are woreda demographic characteristics, including the population, ethnicities, rural vs. urban, and other variables drawn from the 2007 census. We use econometric modeling to assess the impact of increased local spending on the expansion of basic services and outcomes, and by extension the efficiency of the PBS in meeting its development objective.
2. It is difficult to overstate the difficulty of doing subnational empirical work on Ethiopia. As far as can be gleaned from official sources, relatively little data is collected, the data is often of poor quality, and few attempts are made to systematize the results into any obviously comparable framework. A few illustrations are telling. Fiscal data on subnational expenditures in health, education, agriculture, water, and roads were until very recently available only for EFY 2003. Their geographic identifying codes and names do not match those of census data, whose geographic codes and names vary in unpredictable but pervasive ways from fiscal data. The last census counted some 740 woredas, zones, and regions, but the fiscal dataset includes more than 850. Consolidating these two yielded a dataset of 989 subnational units, 250 more than in the census. Many woredas are listed under the same name, and geographic codes in both data sets are not unique. Missing data abounds.
3. Creating the database required for this report has required a huge amount of work and improvisation on the part of the team undertaking the empirical analysis. A major output of this study is the production of a standardized database of woreda-level expenditures and characteristics, which will be made public. It is our hope that this dataset will in time become a useful tool for researchers and students elsewhere in Africa and beyond.
4. Panel regressions with the outcome variable of interest on the left-hand side were run to evaluate the impact of per capita sector expenditure, controlling for rural/urban percentage and ethnicity, over the four years. The outcome indicators evaluated are mostly drawn from the PBS Results Framework. In those sectors for which no reliable outcome data at local level could be gathered – two different approaches are followed one for agriculture and one for water supply and roads. In agriculture, zonal level data is available for outcomes. By taking the average per capita woreda spending on agriculture as a proxy for services offered by agriculture extension workers, zonal outcome data can be used to assess the effectiveness of this spending. Data constraints are more severe for water supply and roads, forcing us to revert to desk reviews. But water supply and roads expenditure only account for 3% of total woreda-level spending; agriculture, education and health, which are fully analyzed, amount to 97% of woreda-level spending. Additionally, national surveys such as the DHS and Agriculture Sample Survey are used to complement the analysis from the woreda-level data base.
5. The analysis consists of three key stages. Stage I follows the approach of Faguet (2012) and Faguet and Sánchez (2013), examining the relationship between woreda-level spending (a proxy for service delivery as noted above in paragraphs 6 and 10) in each sector on results in those sectors. We estimate
Omt = + Emt + Rmt + Cmt + mt (1)

36
REVIEW MEETING VERSION FOR INTERNAL USE ONLY
where O is different outcome variables, such as the net enrollment rate or antenatal care usage, capturing key outcomes in each sector. E is yearly expenditure per capita in the relevant sector; R is the percentage of rural population in each woreda; and C is a vector of demographic controls capturing the population percentage of certain historically disadvantaged ethnicities that the analysis focuses on, all indexed by woreda m and year t. The above was also estimated using the quadratic form to check for decreasing marginal returns.
Omt = + Emt +λEmt2 + Rmt + Cmt + mt (2)
6. Finally, a log normal version was also tested which would reduce the effect of extreme values or outlier data on the results. This was done by taking the natural log of both sides of equation (1) as shown below in equation (3).
lnOmt = + lnEmt + mt (3)
For all the above equations, it is expected δO/δE≥0 and similarly δlnO/δlnE≥0 (that the first partial derivatives) while in Equation (2) δ2O/δ2E≤0 (the second partial derivate). . The expected results imply positive association of the dependent variable with the independent variable which is per capita woreda expenditures in the sector. Equation (2) also tests whether the association is positive with a declining marginal impact. 7. The form estimated in equation (2) allows us to verify if the returns to scale are declining and the form in equation (3) reduces the effect of extreme values on the results.
8. Stage II conducts an incidence analysis of woreda-level spending by quintiles, using the wealth quintile breakdown from the DHS survey. The incidence analysis was done by allocating improvements in health and education outcomes to each quintile by pro-rating the expenditure increases to each quintile by the improvement in outcomes achieved for that quintile controlling for the average improvement for all groups. That is,
∆Ei = (∆Ii/∆I)*∆E (3)
where ∆Ei is the per capita increase in expenditure for quintile “i”, ∆E is the overall increase in expenditure per capita, ∆Ii is the change in outcome change for quintile “i”, and ∆I the outcome change for all quintiles. The results indicator for education was the net enrolment rate which is directly affected by woreda recruited teachers where for health the results indicator is average of three indicators which are directly affected by locally recruited health extension workers. These are: increase use of contraception, increased rates of immunization, increased use of pre-natal care and increased use skilled birth attendants.
9. Stage III examines the link between woreda expenditure and sectoral results for different wealth quintiles, using DHS household survey data and limited dependent variable estimations as follows:
Pi,j = f(ϴ,Constant) (4)
10. In equation (3), Pi,j is the probability of improvement for household “j” in the quintile “i” and α whether the household has had contact or not with a health extension worker. ϴ is “yes” or “no” variable, with “yes” being coded 1 and “no” coded 0.

37
REVIEW MEETING VERSION FOR INTERNAL USE ONLY
11. This three stage analysis was limited to sectors where data on woreda-level results was reliable, and corresponding household survey data on health and education available.
12. In the case of education, the third stage test was not considered necessary due the direct linkage between woreda-level spending, which is mostly for teachers, and the Net Enrolment Rate. This was needed for health because the linkage is more indirect. Woreda-level spending is on health extension workers, and therefore the link between contact with health extension workers and health sector outcomes was tested using DHS data.
13. With regard to agriculture, results (or output data) was not available at the woreda level – only at the zonal level. Incidence analysis was not possible, but the impact of agriculture extension services by land-holding quintile was analyzed. In the case of water supply, a recent national census found that the data was unreliable, and thus analysis was not carried out for this sector either nationally or locally. But as this accounts for only 2% of woreda-level expenditures, this does not really pose a problem. Finally, for roads – which account for only one percent of woreda-level expenditures – this level of in-depth analysis was not possible.
Sources of Data
Annual Agriculture Sample Surveys, Central Statistical Agency, 2008 - 2011
Education Management Information System Administrative Data, Ministry of Education, 2007 – 2011
Ethiopia Demographic and Health Survey, 2005 & 2011
Health Management Information System Administrative Data, Ministry of Health, 2007 – 2011
Poverty Map with woreda and zonal poverty rates, Central Statistical Agency, 2012
Population and Housing Census of Ethiopia (using 10% sample), Central Statistical Agency, 2007
Water, Sanitation and Hygiene (WASH) Census, Ministry of Water and Energy, 2012
Woreda Annual Progress Reports, Ministry of Health, 2007 – 2011
Woreda-level recurrent expenditures in basic services, Ministry of Finance and Economic Development, 2007 – 2011
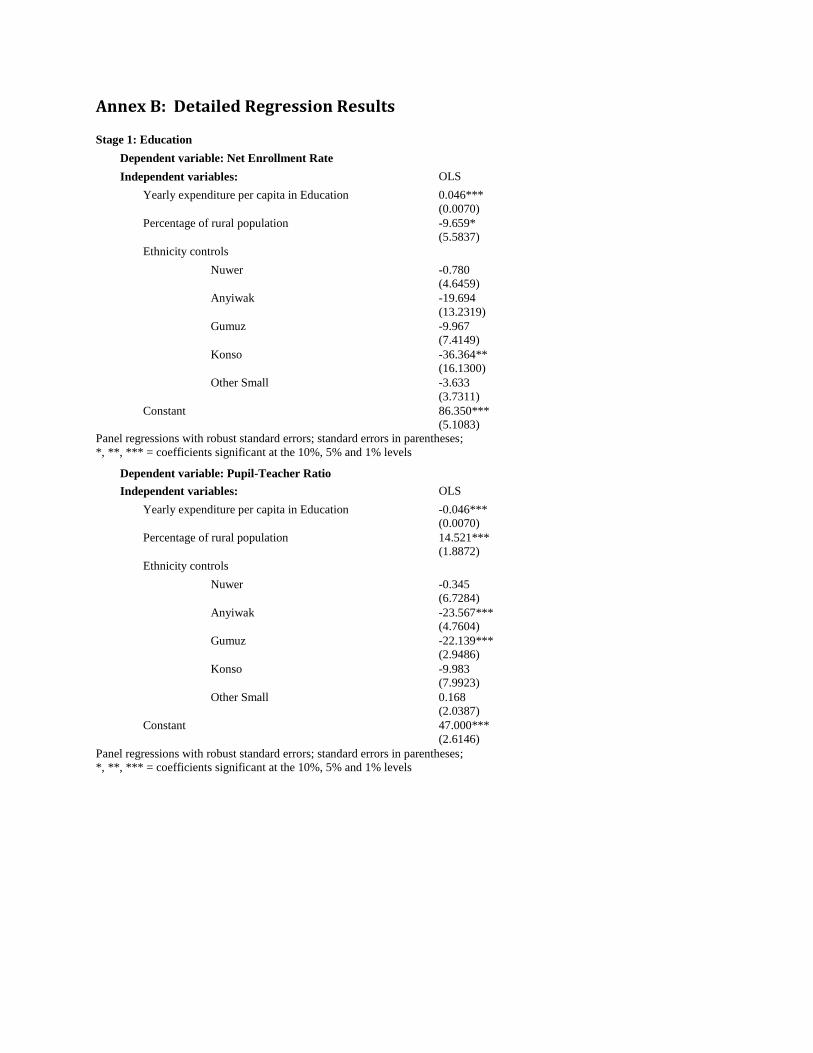
Annex B: Detailed Regression Results
Stage 1: Education
Dependent variable: Net Enrollment Rate
Independent variables: OLS
Yearly expenditure per capita in Education 0.046***
(0.0070)
Percentage of rural population -9.659*
(5.5837)
Ethnicity controls
Nuwer -0.780
(4.6459)
Anyiwak -19.694
(13.2319)
Gumuz -9.967
(7.4149)
Konso -36.364**
(16.1300)
Other Small -3.633
(3.7311)
Constant 86.350***
(5.1083)
Panel regressions with robust standard errors; standard errors in parentheses;
*, **, *** = coefficients significant at the 10%, 5% and 1% levels
Dependent variable: Pupil-Teacher Ratio Independent variables: OLS
Yearly expenditure per capita in Education -0.046***
(0.0070)
Percentage of rural population 14.521***
(1.8872)
Ethnicity controls
Nuwer -0.345
(6.7284)
Anyiwak -23.567***
(4.7604)
Gumuz -22.139***
(2.9486)
Konso -9.983
(7.9923)
Other Small 0.168
(2.0387)
Constant 47.000***
(2.6146)
Panel regressions with robust standard errors; standard errors in parentheses;
*, **, *** = coefficients significant at the 10%, 5% and 1% levels

| 39
REVIEW MEETING VERSION FOR INTERNAL USE ONLY
Stage 1: Health
Dependent variable: Penta3 Vaccination Rate
Independent variables: OLS
Yearly expenditure per capita in Education 0.118***
(0.0389)
Percentage of rural population 9.205***
(2.8169)
Ethnicity controls
Nuwer -55.037***
(6.5583)
Anyiwak -64.001***
(9.149)
Gumuz -36.241***
(8.2573)
Konso -40.974***
(3.1206)
Other Small -0.396
(2.0574)
Constant 67.769***
(2.8846)
Panel regressions with robust standard errors; standard errors in parentheses;
*, **, *** = coefficients significant at the 10%, 5% and 1% levels
Dependent variable: Antenatal Care
Independent variables: OLS
Yearly expenditure per capita in Education 0.157***
(0.0367)
Percentage of rural population -9.894***
(2.7810)
Ethnicity controls
Nuwer -42.392***
(10.2443)
Anyiwak -42.548***
(7.5959)
Gumuz -50.732***
(7.3869)
Konso -9.983***
(8.5488)
Other Small 2.882
(2.3477)
Constant 69.750***
(2.9031)
Panel regressions with robust standard errors; standard errors in parentheses;
*, **, *** = coefficients significant at the 10%, 5% and 1% levels
Dependent variable: Contraceptive Acceptance Rate
Independent variables: OLS
Yearly expenditure per capita in Education 0.139***
(0.0371)
Percentage of rural population -10.517***
(2.8479)
Ethnicity controls
Nuwer -55.699***
(1.6588)
Anyiwak -53.630***
(6.8176)

| 40
REVIEW MEETING VERSION FOR INTERNAL USE ONLY
Gumuz -53.638***
(7.2300)
Konso -2.922
(21.5948)
Other Small -0.627
(2.4920)
Constant 58.860***
(2.9608)
Panel regressions with robust standard errors; standard errors in parentheses;
*, **, *** = coefficients significant at the 10%, 5% and 1% levels
Dependent variable: Delivery by Skilled Birth Attendant Independent variables: OLS
Yearly expenditure per capita in Education 0.107***
(0.0198)
Percentage of rural population -22.258***
(2.8179)
Ethnicity controls
Nuwer -11.491***
(3.7878)
Anyiwak -18.916***
(5.0987)
Gumuz -14.911***
(3.3919)
Konso -0.514
(12.9344)
Other Small -0.143
(1.3709)
Constant 33.949***
(2.7504)
Panel regressions with robust standard errors; standard errors in parentheses;
*, **, *** = coefficients significant at the 10%, 5% and 1% levels

| 41
REVIEW MEETING VERSION FOR INTERNAL USE ONLY
Stage 3: Health Dependent variable: Modern Contraceptive Use
Independent variable: Visit by Health Extension Worker by Wealth Quintile
Quintile Probit Predicted
Probability
Poorest Visit 0.240**
(0.1162) 0.043**
(0.0208) Constant -1.300***
(0.0475)
Second Visit 0.327***
(0.0954) 0.078***
(0.0227) Constant -1.057***
(0.0448)
Middle Visit 0.266***
(0.1005) 0.069***
(0.0259) Constant -0.964***
(0.0447)
Fourth Visit 0.399***
(0.0961) 0.108***
(0.0257) Constant -0.954***
(0.0468)
Richest Visit 0.394**
(0.1821)
0.126**
(0.0574) Constant -0.723***
(0.0842)
Probit regressions with robust standard errors in parentheses; Predicted probabilities with
unconditional standard errors in parentheses.
*, **, *** = coefficients significant at the 10%, 5% and 1% levels Dependent variable: Measles Vaccination Rate
Independent variable: Visit by Health Extension Worker by Wealth Quintile
Quintile Probit Predicted
Probability
Poorest Visit 0.328***
(0.1108) 0.121***
(0.0403) Constant -0.429***
(0.0474)
Second Visit 0.274**
(0.1119) 0.105**
(0.0424) Constant -0.305***
(0.0517)
Middle Visit 0.318***
(0.1213) 0.123***
(0.0463) Constant -0.259***
(0.0537)
Fourth Visit 0.464***
(0.1215) 0.181***
(0.0455) Constant -0.177***
(0.0601)
Richest Visit 0.489*
(0.2666)
0.188*
(0.0984) Constant 0.041
(0.1213)
Probit regressions with robust standard errors in parentheses; Predicted probabilities with
unconditional standard errors in parentheses.
*, **, *** = coefficients significant at the 10%, 5% and 1% levels
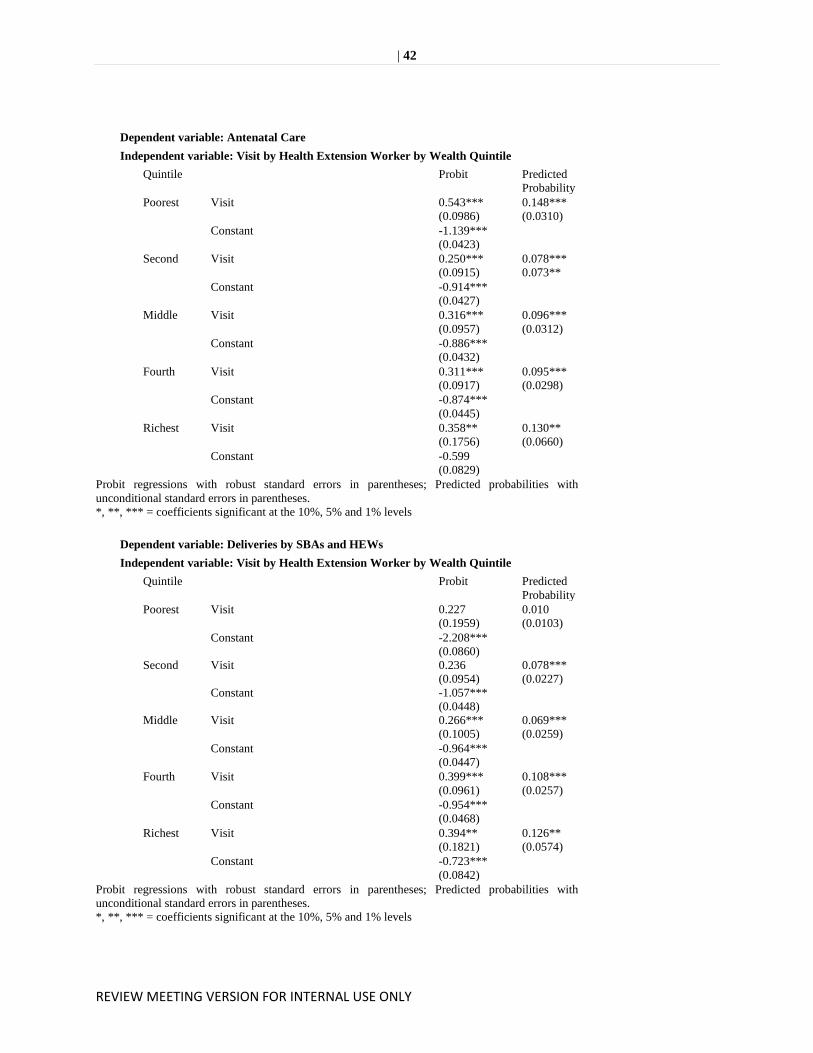
| 42
REVIEW MEETING VERSION FOR INTERNAL USE ONLY
Dependent variable: Antenatal Care
Independent variable: Visit by Health Extension Worker by Wealth Quintile
Quintile Probit Predicted
Probability
Poorest Visit 0.543***
(0.0986) 0.148***
(0.0310) Constant -1.139***
(0.0423)
Second Visit 0.250***
(0.0915) 0.078***
0.073** Constant -0.914***
(0.0427)
Middle Visit 0.316***
(0.0957) 0.096***
(0.0312) Constant -0.886***
(0.0432)
Fourth Visit 0.311***
(0.0917) 0.095***
(0.0298) Constant -0.874***
(0.0445)
Richest Visit 0.358**
(0.1756)
0.130**
(0.0660) Constant -0.599
(0.0829)
Probit regressions with robust standard errors in parentheses; Predicted probabilities with
unconditional standard errors in parentheses.
*, **, *** = coefficients significant at the 10%, 5% and 1% levels
Dependent variable: Deliveries by SBAs and HEWs
Independent variable: Visit by Health Extension Worker by Wealth Quintile
Quintile Probit Predicted
Probability
Poorest Visit 0.227
(0.1959) 0.010
(0.0103) Constant -2.208***
(0.0860)
Second Visit 0.236
(0.0954) 0.078***
(0.0227) Constant -1.057***
(0.0448)
Middle Visit 0.266***
(0.1005) 0.069***
(0.0259) Constant -0.964***
(0.0447)
Fourth Visit 0.399***
(0.0961) 0.108***
(0.0257) Constant -0.954***
(0.0468)
Richest Visit 0.394**
(0.1821)
0.126**
(0.0574) Constant -0.723***
(0.0842)
Probit regressions with robust standard errors in parentheses; Predicted probabilities with
unconditional standard errors in parentheses.
*, **, *** = coefficients significant at the 10%, 5% and 1% levels
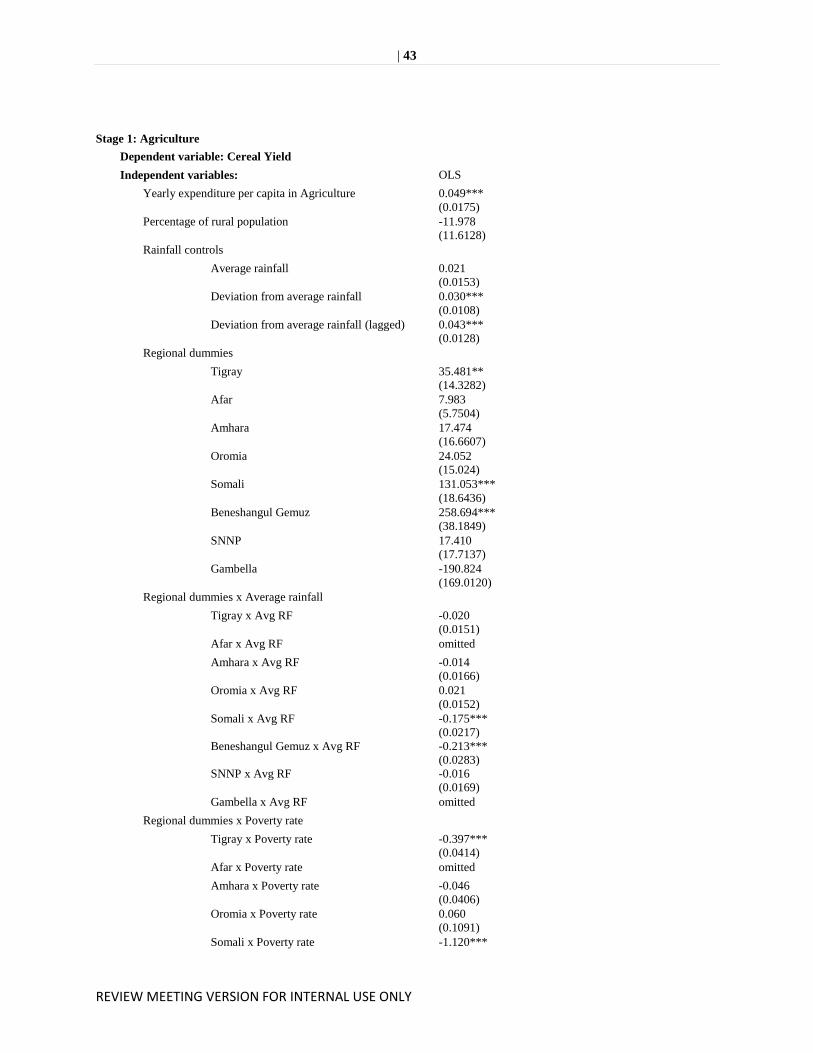
| 43
REVIEW MEETING VERSION FOR INTERNAL USE ONLY
Stage 1: Agriculture Dependent variable: Cereal Yield
Independent variables: OLS
Yearly expenditure per capita in Agriculture 0.049***
(0.0175)
Percentage of rural population -11.978
(11.6128)
Rainfall controls
Average rainfall 0.021
(0.0153)
Deviation from average rainfall 0.030***
(0.0108)
Deviation from average rainfall (lagged) 0.043***
(0.0128)
Regional dummies
Tigray 35.481**
(14.3282)
Afar 7.983
(5.7504)
Amhara 17.474
(16.6607)
Oromia 24.052
(15.024)
Somali 131.053***
(18.6436)
Beneshangul Gemuz 258.694***
(38.1849)
SNNP 17.410
(17.7137)
Gambella -190.824
(169.0120)
Regional dummies x Average rainfall
Tigray x Avg RF -0.020
(0.0151)
Afar x Avg RF omitted
Amhara x Avg RF -0.014
(0.0166)
Oromia x Avg RF 0.021
(0.0152)
Somali x Avg RF -0.175***
(0.0217)
Beneshangul Gemuz x Avg RF -0.213***
(0.0283)
SNNP x Avg RF -0.016
(0.0169)
Gambella x Avg RF omitted
Regional dummies x Poverty rate
Tigray x Poverty rate -0.397***
(0.0414)
Afar x Poverty rate omitted
Amhara x Poverty rate -0.046
(0.0406)
Oromia x Poverty rate 0.060
(0.1091)
Somali x Poverty rate -1.120***

| 44
REVIEW MEETING VERSION FOR INTERNAL USE ONLY
(0.0326)
Beneshangul Gemuz x Poverty rate -0.649***
(0.1010)
SNNP x Poverty rate -0.007
(0.0517)
Gambella x Poverty rate 5.730
(5.1177)
Constant -3.8417
(6.3529)
Panel regressions with robust standard errors; standard errors in parentheses;
*, **, *** = coefficients significant at the 10%, 5% and 1% levels
Dire Dawa and Hara omitted due to small scale of agriculture in these regions
Stage 3: Agriculturee
Dependent variable: Any Improved Technique, 2011
Independent variables: Probit Predicted
Probability
Yearly expenditure per capita in Agriculture 0.0033
(0.00029)
Poverty rate 0.0075**
(0.00295)
Rainfall controls
Average rainfall -0.00078***
(0.00007)
Deviation from average rainfall 2011 -0.00306***
(0.00046)
Deviation from average rainfall 2010 0.0090***
(0.00043)
Regional dummies
Tigray omitted
Afar -5.1478***
(0.58951)
Amhara -2.8538***
(0.13734)
Oromia -0.02614
(0.14042)
Somali -1.1050
(2.79749)
Beneshangul Gemuz -28.8422***
(5.38058)
SNNP -0.9599
(0.14272)
Gambella 40.0622
-
Regional dummies x Average rainfall Tigray x Avg RF omitted Afar x Avg RF omitted
Amhara x Avg RF 0.0031***
(0.00007)
Oromia x Avg RF -0.00001
(0.00007)
Somali x Avg RF -0.0025
(0.00408)
Beneshangul Gemuz x Avg RF 0.0234***
(0.00434)
SNNP x Avg RF 0.0005***
(0.00008)
Gambella x Avg RF 0.0022***
0.00066

| 45
REVIEW MEETING VERSION FOR INTERNAL USE ONLY
Regional dummies x Poverty rate
Tigray x Poverty rate omitted
Afar x Poverty rate 0.1298***
(0.01668)
Amhara x Poverty rate -0.0027
(0.00304)
Oromia x Poverty rate -0.0207***
(0.00307)
Somali x Poverty rate -0.0016
(0.02692)
Beneshangul Gemuz x Poverty rate 0.0446***
(0.01563)
SNNP x Poverty rate -0.0010
(0.00298)
Gambella x Poverty rate -1.4040
-
Quintile
Smallest/Poorest omitted 0.0003***
(0.00002) Second/Poorer 0.0445***
(0.01386) 0.0003***
(0.00003) Middle/Middle 0.3727***
(0.01282) 0.0005***
(0.00004) Fourth/Richer 0.5961***
(0.01265) 0.0006***
(0.00005) Largest/Richest 0.8211***
(0.01280)
0.0008***
(0.00007) Constant -1.7225***
(0.15902)
Probit regressions with robust standard errors in parentheses; Predicted probabilities with
unconditional standard errors in parentheses.
*, **, *** = coefficients significant at the 10%, 5% and 1% levels
Dire Dawa and Hara omitted due to small scale of agriculture in these regions
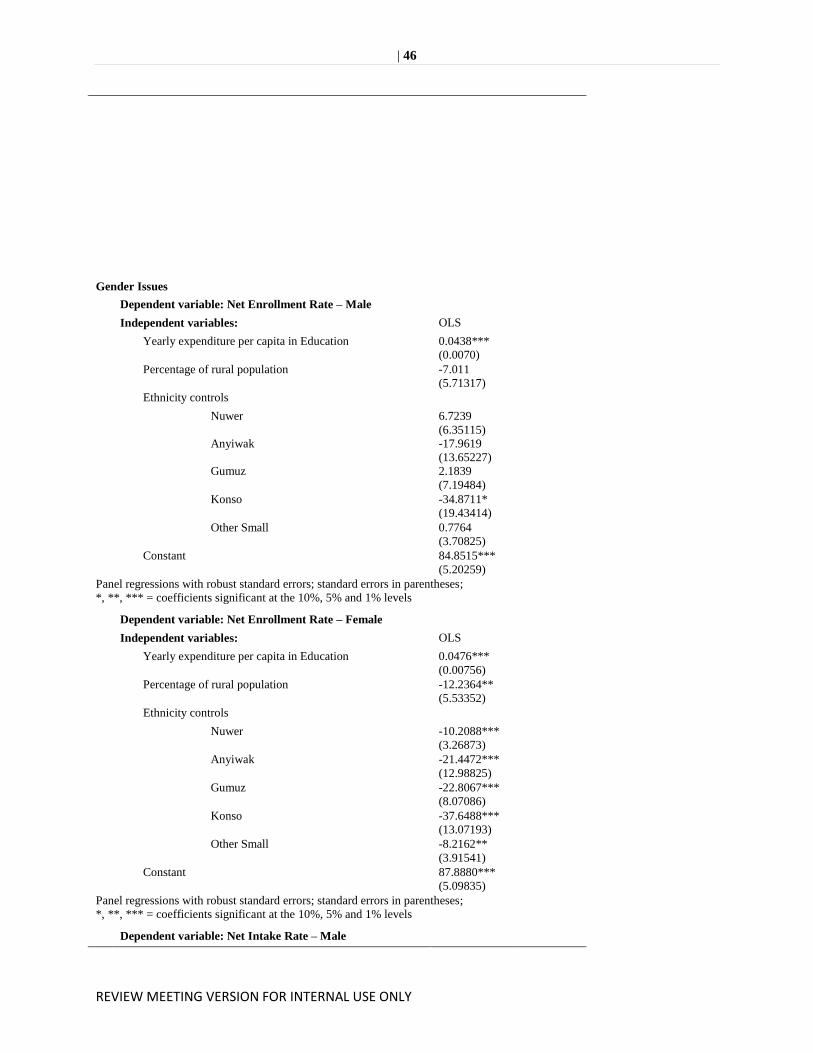
| 46
REVIEW MEETING VERSION FOR INTERNAL USE ONLY
Gender Issues Dependent variable: Net Enrollment Rate – Male
Independent variables: OLS
Yearly expenditure per capita in Education 0.0438***
(0.0070)
Percentage of rural population -7.011
(5.71317)
Ethnicity controls
Nuwer 6.7239
(6.35115)
Anyiwak -17.9619
(13.65227)
Gumuz 2.1839
(7.19484)
Konso -34.8711*
(19.43414)
Other Small 0.7764
(3.70825)
Constant 84.8515***
(5.20259)
Panel regressions with robust standard errors; standard errors in parentheses;
*, **, *** = coefficients significant at the 10%, 5% and 1% levels
Dependent variable: Net Enrollment Rate – Female
Independent variables: OLS
Yearly expenditure per capita in Education 0.0476***
(0.00756)
Percentage of rural population -12.2364**
(5.53352)
Ethnicity controls
Nuwer -10.2088***
(3.26873)
Anyiwak -21.4472***
(12.98825)
Gumuz -22.8067***
(8.07086)
Konso -37.6488***
(13.07193)
Other Small -8.2162**
(3.91541)
Constant 87.8880***
(5.09835)
Panel regressions with robust standard errors; standard errors in parentheses;
*, **, *** = coefficients significant at the 10%, 5% and 1% levels
Dependent variable: Net Intake Rate – Male

| 47
REVIEW MEETING VERSION FOR INTERNAL USE ONLY
Independent variables: OLS
Yearly expenditure per capita in Education 0.1670***
(0.01702)
Percentage of rural population 31.6473***
(5.71317)
Ethnicity controls
Nuwer -74.3077***
(5.43405)
Anyiwak -95.4275***
(20.37484)
Gumuz -54.9533***
(11.42498)
Konso -27.4514
(22.54912)
Other Small -3.7305
(4.52154)
Constant 43.4391***
(6.55315)
Panel regressions with robust standard errors; standard errors in parentheses;
*, **, *** = coefficients significant at the 10%, 5% and 1% levels
Dependent variable: Net Intake Rate – Female Independent variables: OLS Yearly expenditure per capita in Education 0.16698***
(0.01642)
Percentage of rural population 0.0476***
(6.51252)
Ethnicity controls
Nuwer -71.7297***
(5.09329)
Anyiwak -93.7788***
(20.3585)
Gumuz -61.4025***
(9.81233)
Konso -18.8002
(18.30648)
Other Small -10.58377**
(4.31694)
Constant 44.9443***
(6.10655)
Panel regressions with robust standard errors; standard errors in parentheses;
*, **, *** = coefficients significant at the 10%, 5% and 1% levels
Dependent variable: Any Improved Technique by gender,
2011
Independent variables: Probit Predicted
Probability
Yearly expenditure per capita in Agriculture 0.0033
(0.00029)
Poverty rate 0.0075**
(0.00295)
Rainfall controls
Average rainfall -0.00078***
(0.00007)
Deviation from average rainfall 2011 -0.00306***
(0.00046)
Deviation from average rainfall 2010 0.0090***
(0.00043)
Regional dummies
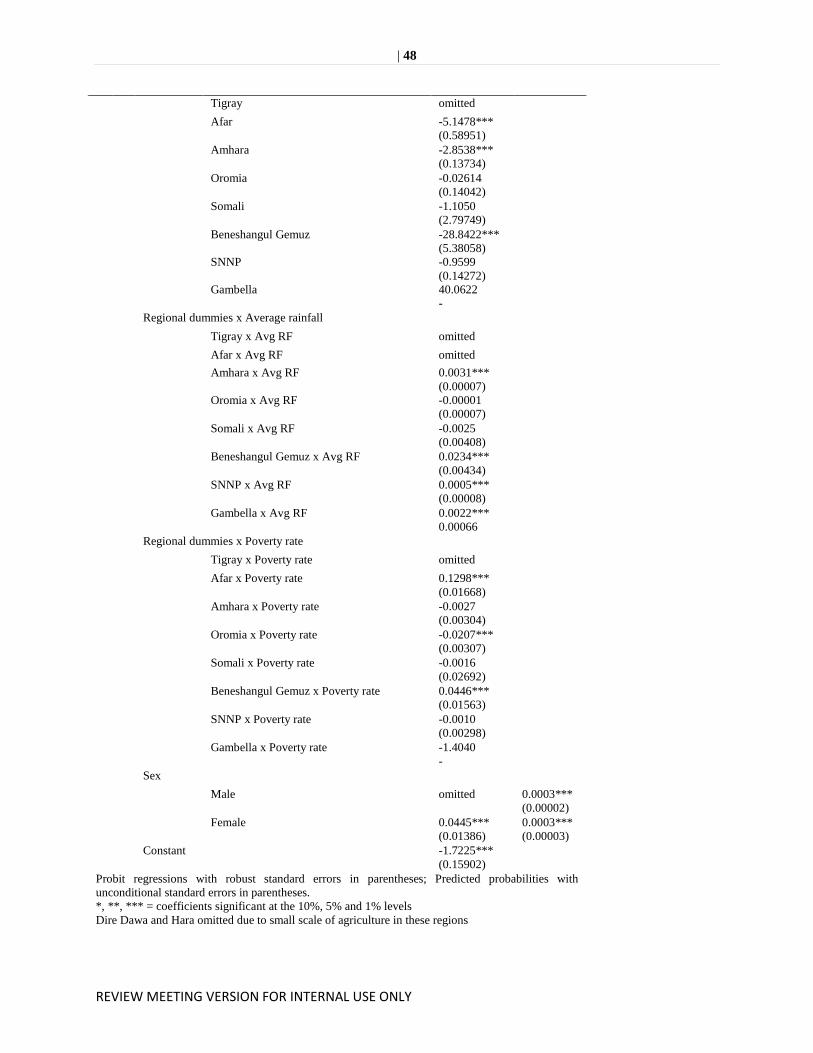
| 48
REVIEW MEETING VERSION FOR INTERNAL USE ONLY
Tigray omitted
Afar -5.1478***
(0.58951)
Amhara -2.8538***
(0.13734)
Oromia -0.02614
(0.14042)
Somali -1.1050
(2.79749)
Beneshangul Gemuz -28.8422***
(5.38058)
SNNP -0.9599
(0.14272)
Gambella 40.0622
-
Regional dummies x Average rainfall
Tigray x Avg RF omitted
Afar x Avg RF omitted Amhara x Avg RF 0.0031***
(0.00007)
Oromia x Avg RF -0.00001
(0.00007)
Somali x Avg RF -0.0025
(0.00408)
Beneshangul Gemuz x Avg RF 0.0234***
(0.00434)
SNNP x Avg RF 0.0005***
(0.00008)
Gambella x Avg RF 0.0022***
0.00066
Regional dummies x Poverty rate
Tigray x Poverty rate omitted
Afar x Poverty rate 0.1298***
(0.01668)
Amhara x Poverty rate -0.0027
(0.00304)
Oromia x Poverty rate -0.0207***
(0.00307)
Somali x Poverty rate -0.0016
(0.02692)
Beneshangul Gemuz x Poverty rate 0.0446***
(0.01563)
SNNP x Poverty rate -0.0010
(0.00298)
Gambella x Poverty rate -1.4040
-
Sex
Male omitted 0.0003***
(0.00002) Female 0.0445***
(0.01386) 0.0003***
(0.00003) Constant -1.7225***
(0.15902)
Probit regressions with robust standard errors in parentheses; Predicted probabilities with
unconditional standard errors in parentheses.
*, **, *** = coefficients significant at the 10%, 5% and 1% levels
Dire Dawa and Hara omitted due to small scale of agriculture in these regions
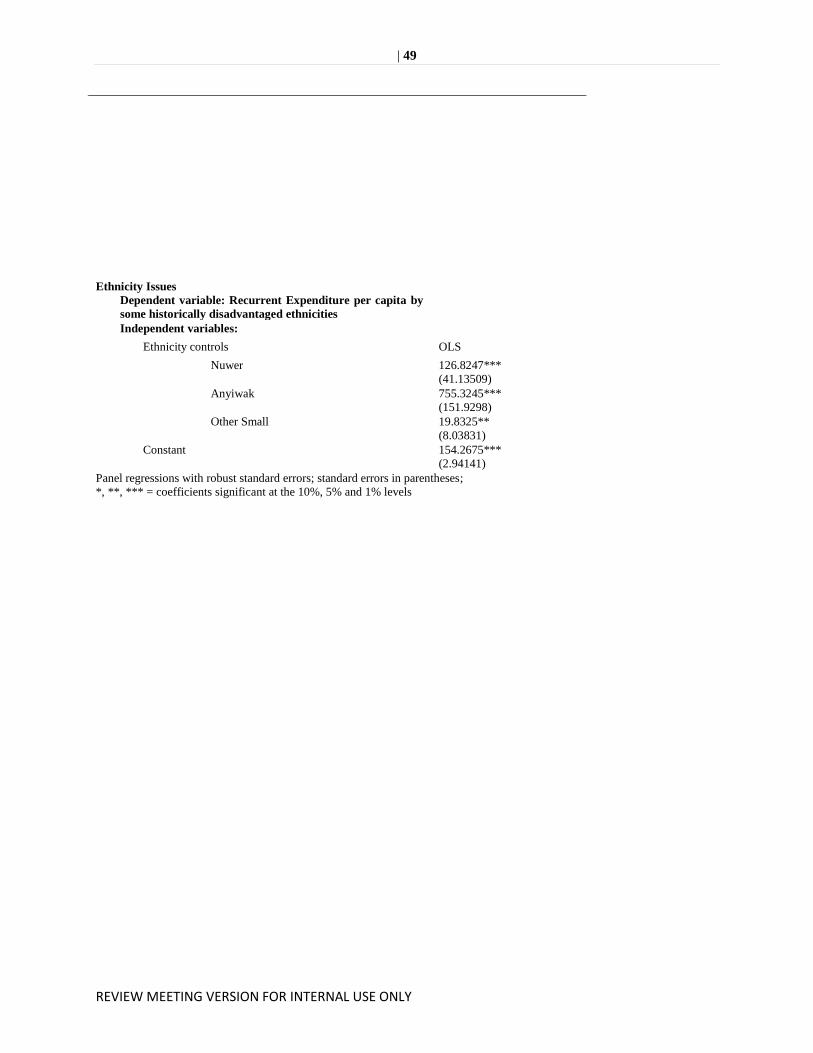
| 49
REVIEW MEETING VERSION FOR INTERNAL USE ONLY
Ethnicity Issues
Dependent variable: Recurrent Expenditure per capita by
some historically disadvantaged ethnicities
Independent variables:
Ethnicity controls OLS
Nuwer 126.8247***
(41.13509)
Anyiwak 755.3245***
(151.9298)
Other Small 19.8325**
(8.03831)
Constant 154.2675***
(2.94141)
Panel regressions with robust standard errors; standard errors in parentheses;
*, **, *** = coefficients significant at the 10%, 5% and 1% levels
Annex C: History of the relationship between central and peripheral areas in Ethiopia – The Evolution of Today’s Federal State
History and Background
1. The ethnic composition of Ethiopia is the result of a turbulent history. As it consolidated itself during the medieval period, the country was comprised primarily of the Tigray, Agaw and Amhara peoples. With Menelik II’s ascension to the throne in 1889, a period of territorial expansion began, whose base was the province of Shoa in the current region of Amhara. Areas consisting of today’s Beneshangul-Gemuz, Gambella, Southern Nations and Nationalities, Afar, Oromia and Somali regions were brought under the feudal system of the Ethiopian empire. Following the battle of Adwa in 1896 and the resulting European recognition of Ethiopian statehood, a series of border treaties with the surrounding colonial powers were signed. The modern Ethiopia state was born. 2. Relations between the newly integrated areas and the historic center of the empire were troubled. Menelik sent governors from the center to administer the periphery, but owing to the structural weakness of the center, successive Ethiopian governments did not command effective control over the peripheries. Similarly, exploitative economic policies caused visible marginalization, relative under-development, and less integration among the border regions within Ethiopia23. This hold of the center over the peripheries continued to increase. According to noted Ethiopian historian Bahru Zewde:
The period after 1941 witnessed the apogee of absolutism. The tentative beginnings in this direction of the pre-1935 years matured into untrammeled autocracy. The power of the state reached a limit unprecedented in Ethiopian history
24.
3. The revised constitution of 1955 solidified the absolute powers of the emperor, claiming “His dignity… inviolable and His power… indisputable”. It also entrenched Amharic as sole the official language and the Ethiopian Orthodox Church as the national religion. 4. The period of socialist rule (1974-1991) saw no diminution in the center’s hold over the peripheries and no change in the prevailing economic policies of exploitation. Despite the regime’s appeal to a socialist ideology, the Derg was identified with an “Amhara suppresser‟ by the nationalist liberation movements25. Any conduct promoting ethnic individualism, and thereby challenging the state’s integrity, was outlawed. 5. The victory of the Ethiopian People’s Revolutionary Democratic Front over the Derg in 1991 saw the reversal of over a hundred years of ethnic homogenization. As Chistopher Clapman says:
The overthrow of the Mengistu government in May 1991 amounted to more than the collapse of a particular regime. It effectively marked the failure of a project, dating back to
23 Mulugeta, Allehone, Issues of Security and Conflict, in the Ethiopian Frontiers: Notes on State Policies and
Strategies, in Report of Ethiopia National Workshop - Conflict in the Horn: Prevention and Resolution, (OSSREA Publications), (2002). 24
Zewde, Bahru, A History of Modern Ethiopia 1855-1974, Addis Ababa: Addis Ababa University Press, (1991). 25
Weldemariam, Alemayehu F, Greater Ethiopia: Evolution of a Pluralist Politico-Legal System in a Pluralist Polity, Department of Polictial Science, Faculty of Social and Behavioural Sciences, Leiden University, (2011).

| 51
REVIEW MEETING VERSION FOR INTERNAL USE ONLY
Menelik’s accession in 1889 of creating a ‘modern’ and centralized Ethiopian state around a Shoan core
26.
6. Ethnic federalism now came to the fore in Transitional Charter, which allowed the rights to self-determination of the country’s various “nations and nationalities”. Like the Charter, a new constitution in 1995 recognized the rights of ethnic self-determination up to succession. It also created a federal government with nine regional states divided along ethno-lingustic lines – Tigray, Afar, Amhara, Oromia, Somali, Beneshangul-Gemuz, South Nations, Nationalities and Peoples, Gambella, and Harari.
Ethiopian regional population distribution and ethnic composition
Region Population Estimated size in square kilometers
Ethnic composition (%)
Tigray 4,316,988 50,078 96.6 Tigray, 1.6 Amhara, 1.8 others
Afar 1,390273 96,707 90.0 Afar, 5.2 Amhara, 1.6 Argobba, 1.2 Tigray, 2.0 others
Amhara 17,221,976 159,173 91.5 Amhara, 4.9 Agaw, 2.6 Oromo, 1.0 others
Oromia 27,158,471 353,006 87.8 Oromo, 7.2 Amhara, 0.9 Gurage, 4.1 others
Somali 4,445,219 279,252 96.2 Somali, 2.3 Oromo, 0.7 Amhara, 0.8 others
Southern Nations, Nationalities and Peoples
14,929,548 112,343 19.4 Sidama, 10.6 Welayta, 8.0 Hadiya, 7.5 Gurage, 7.0 Gamo, 5.4 Kafficho, 5.4 Silt’e, 36.7 others
Gambella 307,096 25,802 47.3 Nuer, 21.7 Anyiwak, 8.0 Amhara, 5.2 Opo and Komo, 4.4 Majangir, 13.4 others
Beneshangul-Gemuz 784,354 49,289 25.4 Berta, 21.7 Amhara, 20.9 Gemuz, 13.6 Oromo, 7.7 Shinasha, 4.2 Agaw-Awi, 6.5 others
Harari 183,415 311 56.4 Oromo, 22.8 Amhara, 8.7 Harari, 4.4 Gurage, 3.9 Somali, 1.5 Tigray, 2.5 others
Data from 2007 census conducted by the Central Statistical Agency
26
Clapham, Christopher, Ethnicity and the National Question in Ethiopia, in Conflict and Peace in the Horn of Africa: Federalism and its Alternatives, Peter Woodward and Murray Forsyth (eds.) (Brookfield: Darmouth publishing co.), (1994).

| 52
REVIEW MEETING VERSION FOR INTERNAL USE ONLY
7. Economic integration and equitable development become a primary focus of the new government. Meles Zenawi, the president of the Federal Democratic Republic of Ethiopia, declared in 1997 that:
It is only through fast economic growth that is broadly shared by the population that we can hope for sustainable peace. And, therefore, one of the most important pillars of our program is fast economic growth that is equitable and broadly shared among the population
27
8. The government adopted a policy of affirmative action towards developing regions whereby Beneshangul-Gemuz, Gambella, Afar and Somali would be provided preferential treatment in terms of budget allocation and increased enrollment in higher education. Even now, however, developing regions still remain to be fully integrated into the economy of the Ethiopian state. Centralization’s legacy left few residents of today’s developing regions involved in running the regional administrative structures. 9. Until recently there remained little investment in social and physical infrastructure. Slowly, the emergence of local native elite officially in charge of the regions, better investment in education, health, infrastructure and others have shown the positive outcomes of the federalisation of Ethiopia28. The preferential treatment of previously disadvantaged ethnic groups within Ethiopia is helping to create a more equitable distribution for development to take place.
The Modern Ethiopian Federal State
10. Decentralization of political, administrative and fiscal authority to regional and local governments has been fundamental to this affirmative action strategy. The Government has a strong commitment to decentralization and building a federal state, as enshrined in the 1995 Federal Constitution. While the first wave of decentralization started only 20 years ago, the process should be seen as a work in progress for which the underpinning institutional arrangements for success are evolving and continue to require focused support. 11. To date, Ethiopia has seen two rounds of decentralization. The first round (devolution) took place during the transitional period from 1991 to 1994. This Proclamation devolved state powers to geographically-defined ethno-linguistic groups and associated pieces of legislation were also passed creating regional and woreda (district) councils. As necessary, regions could decide to establish zones as intermediaries between regional and district administrations. In addition to giving them the right to self-determination, these new regional units were granted a range of executive, legislative, and judicial powers within their defined regions, and exercised jurisdiction over matters of social and economic development as well as basic service delivery. Accordingly, regions were to create the necessary internal institutional arrangements, including: a council; an executive committee; a judicial administration office; a public prosecution office; an audit office; a police and security office; and a service and development committee.
12. Proclamation No. 7/1992 stipulated the regional governing units' revenue sources; these included: tax revenues derived within their jurisdictions; fiscal transfers from the central government;
27 Meles Zenawi, “Premier’s speech at Butare National University in Rwanda”, in The Ethiopian Herald, (December 13, 1997). 28
Adegehe, Asnake, Federalism and ethnic conflict in Ethiopia : a comparative study of the Somali and Benishangul-Gumuz regions, (2009).

| 53
REVIEW MEETING VERSION FOR INTERNAL USE ONLY
domestic borrowing; and other sources of income. The latter category was specified in Proclamation No. 33/1992. However, due to capacity constraints, the regional governments were yet unable to carry out their revenue assignments; as such, they were highly-dependent on grants from the central government to meet their new expenditure obligations in the social sectors. 13. In spite of what appears to be a rather elaborate set of governing arrangements, these new regional governments remained subordinate to the central government. While the regional councils were accountable to citizens living within their regional borders, legally they were also responsible to Council of Representatives of the central government. 14. The promulgation of the 1995 Federal Constitution signified the beginning of Ethiopia's second round of decentralization. The Constitution affirmed the roles and functions of federal vs. regional government. While the federal government retained authority over a broad range of functions and responsibilities (e.g., fiscal and monetary policy, international trade), the regions and woredas were given responsibility for ensuring basic service delivery in their respective jurisdictions. The federal government retained authority over setting policies and standards in each of the major social service delivery sectors. 15. In 2002, decentralization was extended to the woreda level with woreda governments expected to take on the bulk of service delivery responsibilities. Woredas receive block grants from their respective regional governments which, like the federal-regional grants, are also governed by formulas set by the regional governments and using broadly similar methodologies to that used in the federal-regional grant. 16. Decentralization to woreda level is crucial in the context of achieving an equitable distribution of prosperity, as Ethiopian history, sociology, and ethnography, suggest that citizen-state relationships are framed by alternative norms of political culture, power and state-society relations, which are locally evolved, and have arisen in the context of historical processes of state formation29. Concurrent with decentralization to woreda levels, budgets allocated for local level expenditures have increased dramatically, and there have been impressive improvements in indicators of human development, for example, in Net Enrollment and vaccination rates. The effects of the economic policies that were in place for over a hundred years are, through the processes of decentralization and affirmative action towards historically disadvantaged areas, resulting in a more broadly-shared economic prosperity.
29
Understanding Incentives and Strengthening Accountability: The Political Economy of Decentralized Service Delivery in Ethiopia, World Bank, (2013).

| 54
REVIEW MEETING VERSION FOR INTERNAL USE ONLY
References
Assefa, Fisshea Federalism and the Accommodation of Diversity in Ethiopia, Eclipse Press, Addis Ababa, Third Edition 2010
Barankay, I. and Lockwood, B. 2007. Decentralization and the productive efficiency of government: Evidence from Swiss cantons. Journal of Public Economics, 91: 1197–1218.
Batina, R.G. and Ihori, T. 2005. Public goods: theories and evidence. New York: Springer.
Besley, T. and Coate, S. 2003. Centralized versus decentralized provision of local public goods: A political economy approach, Journal of Public Economics, 87: 2611-37.
Bevan, Phillipa, Catherine Dom and Alula Pankhurst. 2010. Long-term Perspectives of Development Impacts in Rural Ethiopia: Wide Stage One Final Report, Mokoro Limited, Oxford.
Boone, P. and J.P. Faguet. 1998. “Multilateral Aid, Politics and Poverty: Past Failures and Future Challenges”, chapter 2 in R. Grant and J. Nijman (eds.). The Global Crisis in Foreign Aid, Syracuse: Syracuse University Press, 11-26.
Cassette, A. and Paty, S. 2010. Fiscal decentralization and the size of government: A European country empirical analysis. Public Choice, 143: 173–189.
Ceballos, M. and Hoyos, D. 2004. Tendencias del comportamiento electoral y descentralización en los municipios de Colombia, 1988-2000. Crisis States Programme Working Paper No. 57, London School of Economics.
Central Statistical Agency of Ethiopia (CSA) Voice of the Central Statistical Agency, Various Issues.
Clark, D. (2009) The performance and competitive effects of school autonomy. Journal of Political Economy, 117(4): 745-782.
Devarajan, S., Khemani, S. and Shah S. 2009. The politics of partial decentralization. In Ahmad, E. and Brosio, G. (Eds.). Does decentralization enhance service delivery and poverty reduction? Cheltenham: Edward Elgar.
Dowding, K. and John, P. 1994. Tiebout: A survey of the empirical literature. Urban Studies, 31 (4/5): 767-97.
Dom, Catherine and Stephen Lister with Manos Antoninis. 2010. An Analysis of Decentralization in Ethiopia, Mokoro Ltd., Oxford.
Eldon, Jack, Abebe, Cunningham and Bibby. 2011. Options for Support to Service Delivery in Ethiopia’s Developing Regional States, draft report.
Escaleras, M. and Register, C.A. Forthcoming. Fiscal decentralization and natural hazard risks. Public Choice. Published online 20 November 2010.
Faguet, J.P. 2013. “Decentralization and Governance.” Lead paper of a special issue on Decentralization and Governance. World Development. http://dx.doi.org/10.1016/j.worlddev.2013.01.002
Faguet, J.P. 2012. Decentralization and Popular Democracy: Governance from Below in Bolivia. Ann Arbor: University of Michigan Press.
Faguet, J.P. 2004. “Why So Much Centralization? A Model of Primitive Centripetal Accumulation.” LSE-STICERD Development Economics Discussion Paper No. 43.
| 55
REVIEW MEETING VERSION FOR INTERNAL USE ONLY
Faguet, J.P. 2000. “Decentralization and Local Government Performance: Improving Public Service Provision in Bolivia”, Revista de Economía del Rosario, 3(1): 127-176.
Faguet, J.P. and Z. Ali. 2009. “Making Reform Work: Institutions, Dispositions and the Improving Health of Bangladesh.” World Development, 37: 208–218.
Faguet, J.P. and F. Sánchez. 2013. “Decentralization and Access to Social Services in Colombia.” Public Choice. DOI 10.1007/s11127-013-0077-7.
Faguet, J.P. and F.B. Wietzke. 2006. “Social Funds and Decentralization: Optimal Institutional Design.” Public Administration and Development, 26(4): 303-315.
Galiani, S., Gertler, P. and Schargrodsky, E. 2008. School decentralization: Helping the good get better, but leaving the poor behind. Journal of Public Economics, 92: 2106–2120.
Garcia, Marito and Andrew Sunil Rajkumar. 2008. Achieving Better Service Delivery in Through Decentralization in Ethiopia, Working Paper No. 131, World Bank, Washington.
Gonçalves, S. 2013. The effects of participatory budgeting on municipal expenditures and infant mortality in Brazil. World Development. http://dx.doi.org/10.1016/j.worlddev.2013.01.009
Granados, C. and F. Sánchez. 2013. Water Reforms, Decentralization and Child Mortality in Colombia, 1990-2005. World Development. In Press.
IPE Global. 2010. Evaluation and Design of Social the Social Accountability Component of the Protection of Basic Services Project, New Delhi.
Krishan, Pramila and Manasa Patnam, 2013 “Neighbours and Extension Agents in Ethiopia: Who matters more” in American Journal of Agriculture Economics 96(1): 308-327
Manor, J. 1999. The political economy of democratic decentralization. Washington, DC: World Bank.
Oates, W. 1972. Fiscal federalism. New York: Harcourt Brace.
Ostrom, E. and Whitaker, G.P. 1973. Does local community control of police make a difference? Some preliminary findings. American Journal of Political Science, 17: 48-76.
Ostrom, E., Schroeder, L. and Wynne, S. 1993. Institutional incentives and sustainable development: Infrastructure policies in perspective. Boulder: Westview Press.
Overseas Development Institute. 2010. Millennium Development Goals Report Card: Measuring Progress Countries, ODI: London.
Piriou-Sall, S. 1998. Decentralisation and Rural Development: A Review of Evidence. Manuscript, Washington, DC.
Prohl, S. and Schneider, F. 2009. Does decentralization reduce government size? A quantitative study of the decentralization hypothesis. Public Finance Review, 37(6): 639-664.
Prud’homme, R. 1995. On the Dangers of Decentralisation. World Bank Research Observer, 10: 210-226.
Putnam, R.D. 1993. Making Democracy Work: Civic Traditions in Modern Italy (Princeton: Princeton University Press).
Ragasa, Catherine, Guush Berhane, Fanayae Tadesse and Alemayehu Seyoum Taffesse 2012 Gender Differences in Access to Extension Services and Agriculture Productivity, Ethiopia Strategy Support Program (ESSP) Ethiopia Development Research Institute (EDRI) and International Food Policy Research Institute (IFPRI) ESSP Working Paper 49
| 56
REVIEW MEETING VERSION FOR INTERNAL USE ONLY
Rondinelli, D.A., Cheema, G.S. and Nellis, J. 1983. Decentralisation in Developing Countries: A Review of Recent Experience. Staff Working Paper No.581, World Bank, Washington, DC.
Reynolds, Robert C. and Buli Edjeta. 2011. Strengthening Grievance Redress Mechanisms for the Protection of Basic Services Program in Ethiopia, Addis Ababa.
Samoff, J. 1990. Decentralisation: The Politics of Interventionism. Development and Change, 21: 513-530.
Selam Development Consultants. 2013. Financial Transparency and Accountability Implementation Assessment Report, Addis Ababa.
Smoke, P. 2001. Fiscal Decentralisation in Developing Countries: A Review of Current Concepts and Practice. Democracy, Governance and Human Rights Programme Paper No. 2, UNRISD, Geneva.
Solomon, Negussie. 2008. Fiscal Federalism in the Ethiopian Ethnic-based Federal System, Forum of Federations, Addis Ababa.
Tiebout, C. M. 1956. A pure theory of local expenditures. Journal of Political Economy, 64:416-24.
Treisman, D. 2007. The architecture of government: Rethinking political decentralization. New York: Cambridge University Press.
Vaillancourt, Francois. 2013. Sharing central revenues with regions: an examination of principles and practices in the context of the PBS (Ethiopia) program, World Bank, Addis Ababa.
Vaughan, Sarah. 2012. Understanding Ethiopia’s Transformation: Vision and Strategies for Development, World Bank Ethiopia Country Office, Addis Ababa.
World Bank Ethiopia. 2011. An Assessment of Public Finance Management Systems in Woreda Governments, Addis Ababa.
World Bank. 2011. Citizens and Service: Assessing use of Social Accountability approaches in the human development sectors, Office of the Chief Economist, Human Development Network.
World Bank. 2010. Financial Transparency and Accountability Initiative in Ethiopia: Progress and Way Forward, Addis Ababa.
World Bank. 2004. Making Services work for the Poor: World Development Report 2004, World Bank: Washington, DC.
World Bank. 2012. Project Appraisal Document for Ethiopia Promoting Basic Services Project Phase III, Report No. 69689-ET, Washington.
World Bank. 2013. Understanding Incentives and Strengthening Services: The Political Economy of Decentralized Delivery in Ethiopia, World Bank: Washington, DC.