improving characterization of anthropogenic...
TRANSCRIPT

Improving Characterization of
Anthropogenic Methane Emissions in
the U.S.
James W.C. White (Chair)
BOARD ON ATMOSPHERIC SCIENCES AND CLIMATE
BOARD ON AGRICULTURE AND NATURAL RESOURCES
BOARD ON EARTH STUDIES AND RESOURCES
BOARD ON ENERGY AND ENVIRONMENTAL SYSTEMS
BOARD ON ENVIRONMENTAL STUDIES AND TOXICOLOGY
1
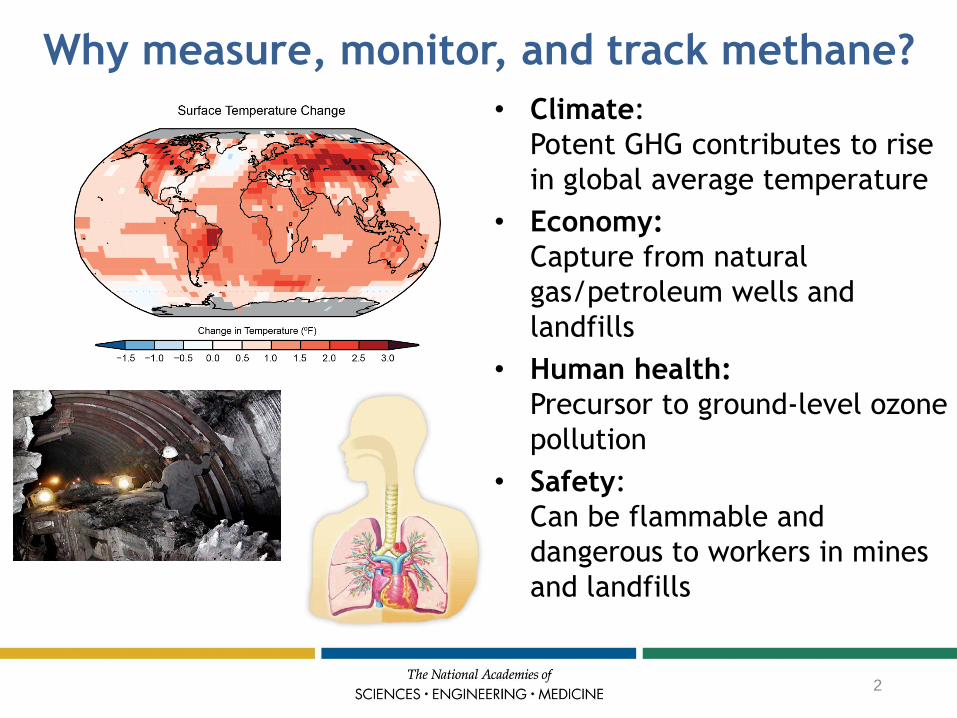
Why measure, monitor, and track methane?
• Climate:
Potent GHG contributes to rise
in global average temperature
• Economy:
Capture from natural
gas/petroleum wells and
landfills
• Human health:
Precursor to ground-level ozone
pollution
• Safety:
Can be flammable and
dangerous to workers in mines
and landfills
2
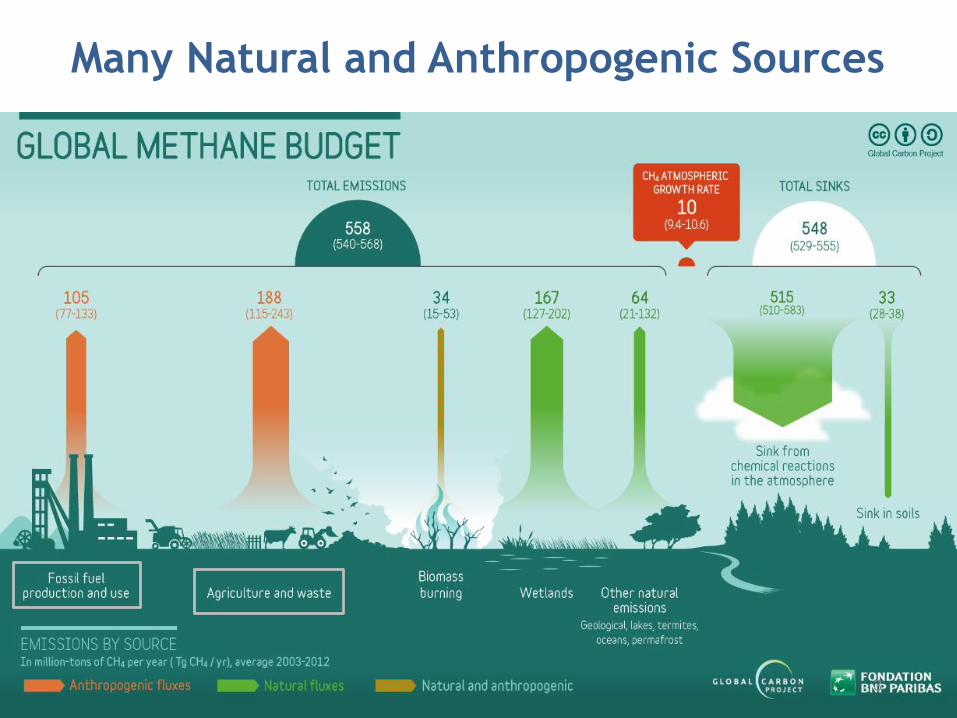
Many Natural and Anthropogenic Sources
3
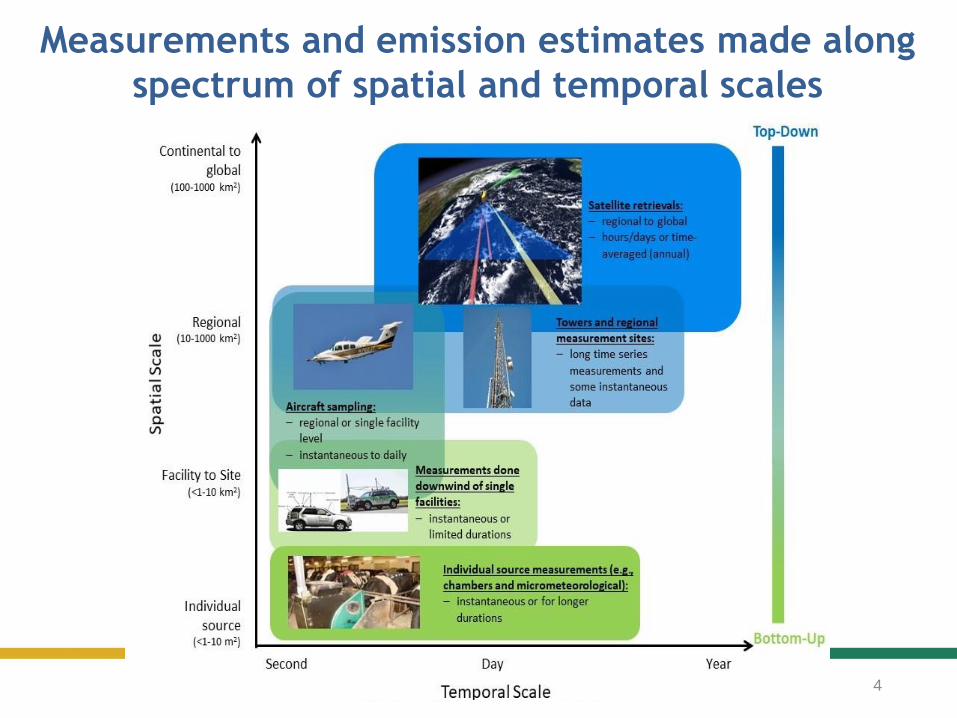
Measurements and emission estimates made along
spectrum of spatial and temporal scales
4
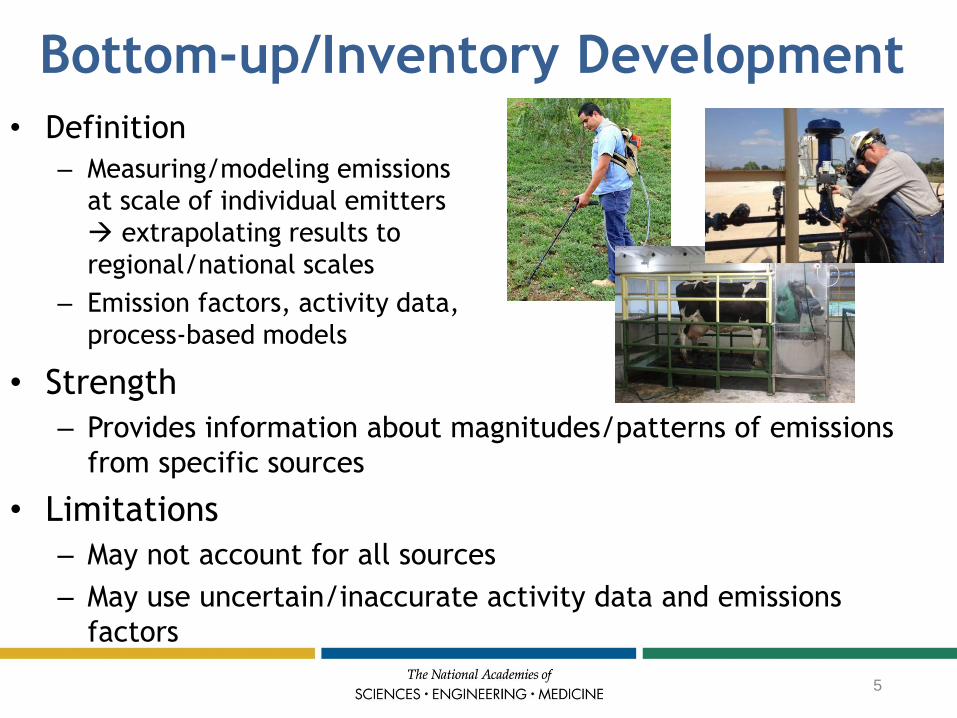
Bottom-up/Inventory Development
• Strength
– Provides information about magnitudes/patterns of emissions
from specific sources
• Limitations
– May not account for all sources
– May use uncertain/inaccurate activity data and emissions
factors
• Definition
– Measuring/modeling emissions
at scale of individual emitters
extrapolating results to
regional/national scales
– Emission factors, activity data,
process-based models
5
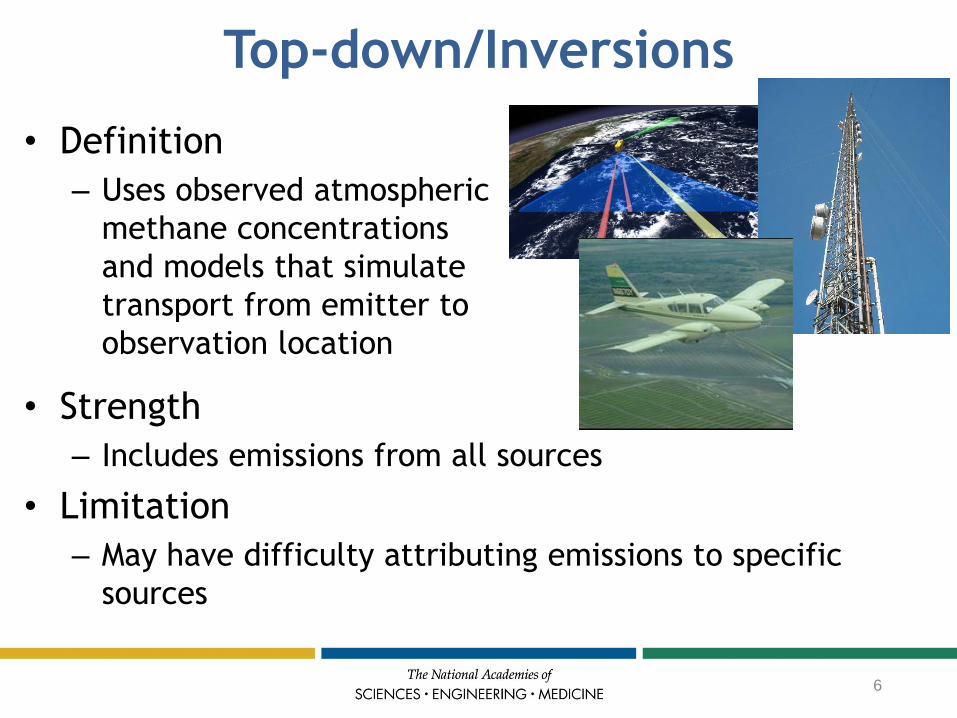
Top-down/Inversions
• Definition
– Uses observed atmospheric
methane concentrations
and models that simulate
transport from emitter to
observation location
• Strength
– Includes emissions from all sources
• Limitation
– May have difficulty attributing emissions to specific
sources
6
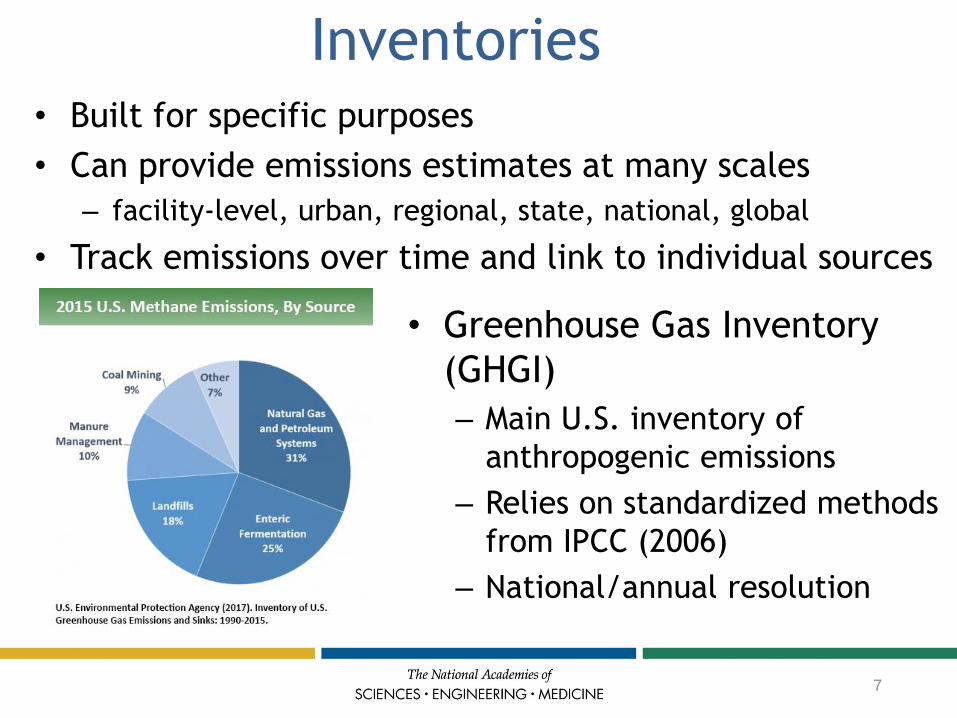
Inventories
• Greenhouse Gas Inventory
(GHGI)
– Main U.S. inventory of
anthropogenic emissions
– Relies on standardized methods
from IPCC (2006)
– National/annual resolution
• Built for specific purposes
• Can provide emissions estimates at many scales
– facility-level, urban, regional, state, national, global
• Track emissions over time and link to individual sources
7
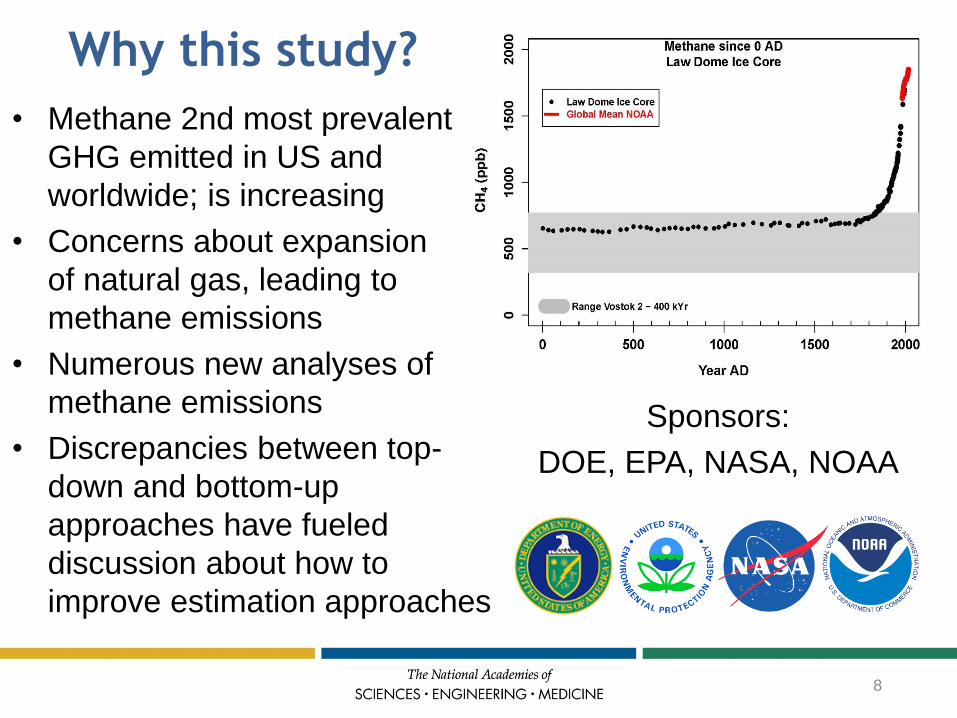
• Methane 2nd most prevalent
GHG emitted in US and
worldwide; is increasing
• Concerns about expansion
of natural gas, leading to
methane emissions
• Numerous new analyses of
methane emissions
• Discrepancies between top-
down and bottom-up
approaches have fueled
discussion about how to
improve estimation approaches
Why this study?
Sponsors:
DOE, EPA, NASA, NOAA
8
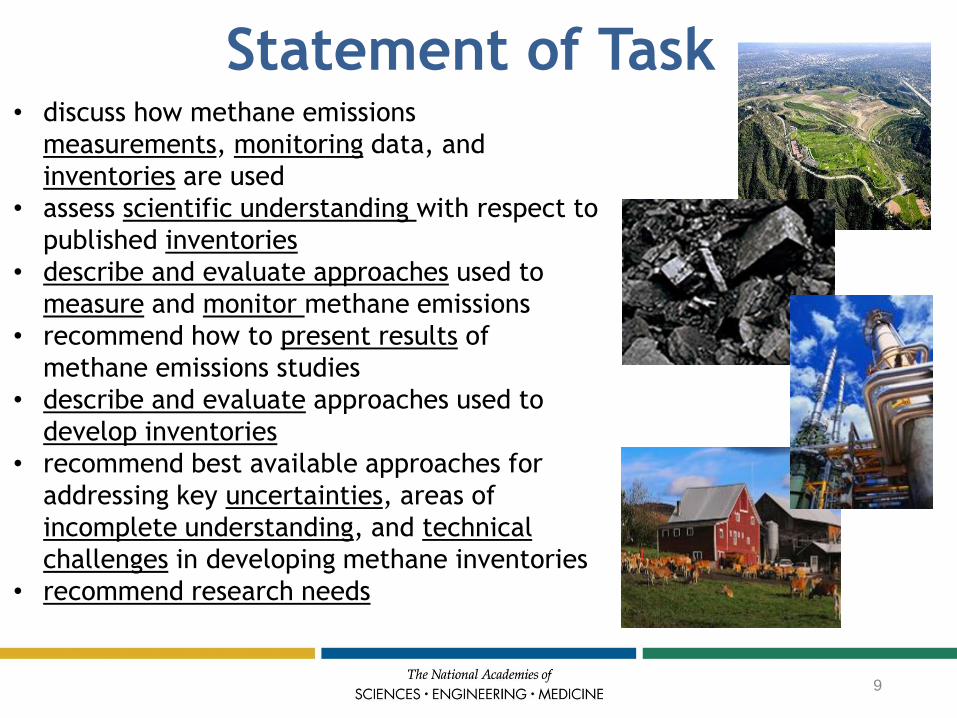
• discuss how methane emissions
measurements, monitoring data, and
inventories are used
• assess scientific understanding with respect to
published inventories
• describe and evaluate approaches used to
measure and monitor methane emissions
• recommend how to present results of
methane emissions studies
• describe and evaluate approaches used to
develop inventories
• recommend best available approaches for
addressing key uncertainties, areas of
incomplete understanding, and technical
challenges in developing methane inventories
• recommend research needs
Statement of Task
9

Committee Members• James W.C. White, Chair, University of Colorado Boulder
• David Allen (NAE) , The University of Texas at Austin
• Praveen K. Amar, Independent Consultant
• Jean Bogner, University of Illinois, Chicago
• Lori Bruhwiler, NOAA Earth Systems Research Laboratory
• Daniel Cooley, Colorado State University
• Christian Frankenberg, California Institute of Technology
• Fiji George, Southwestern Energy
• Lisa Hanle, Independent Consultant
• Alexander Hristov, Pennsylvania State University
• Ermias Kebreab, University of California, Davis
• April Leytem, USDA-Agricultural Research Service
• Maria Mastalerz, Indiana University
• Steven Wofsy (NAS) , Harvard University
NASEM Staff:
• Katie Thomas
• April Melvin
• Michael Hudson
10
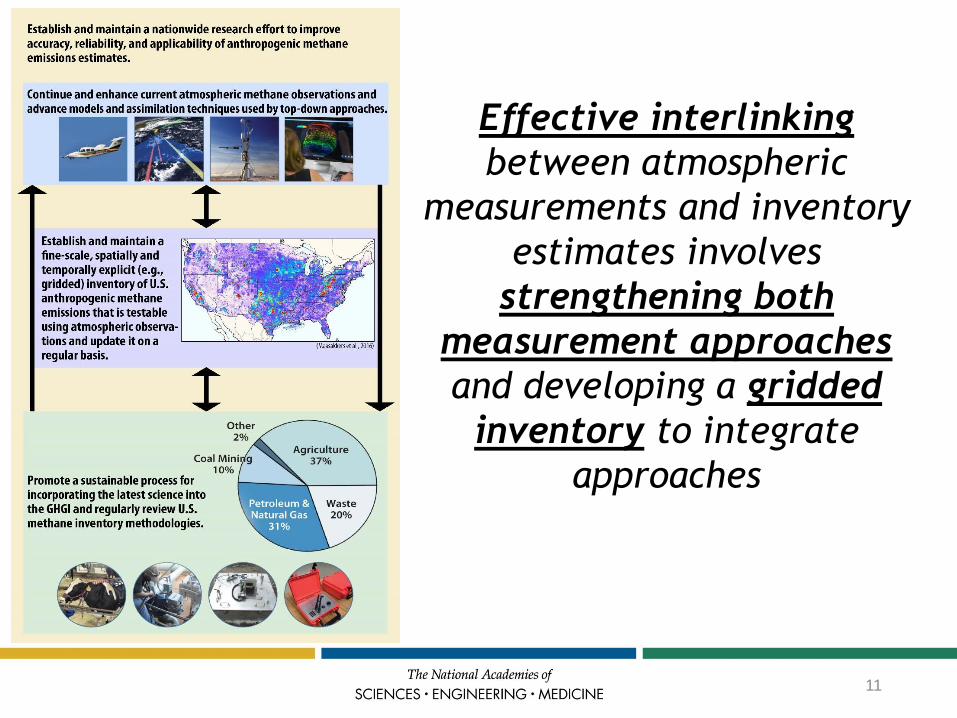
Effective interlinking
between atmospheric
measurements and inventory
estimates involves
strengthening both
measurement approaches
and developing a gridded
inventory to integrate
approaches
11
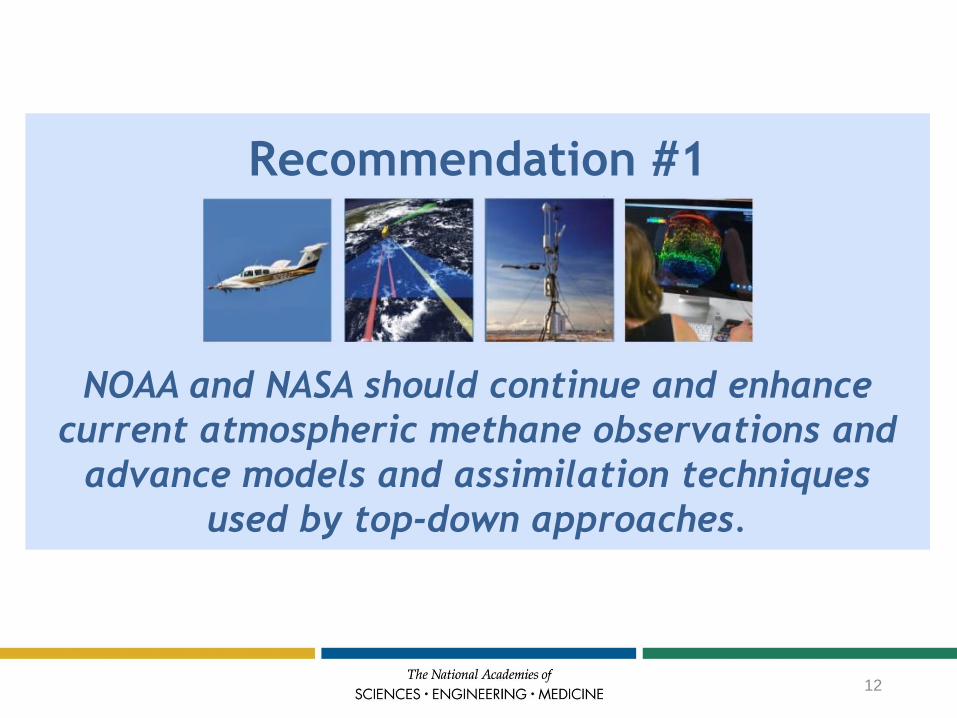
Recommendation #1
NOAA and NASA should continue and enhance
current atmospheric methane observations and
advance models and assimilation techniques
used by top-down approaches.
12
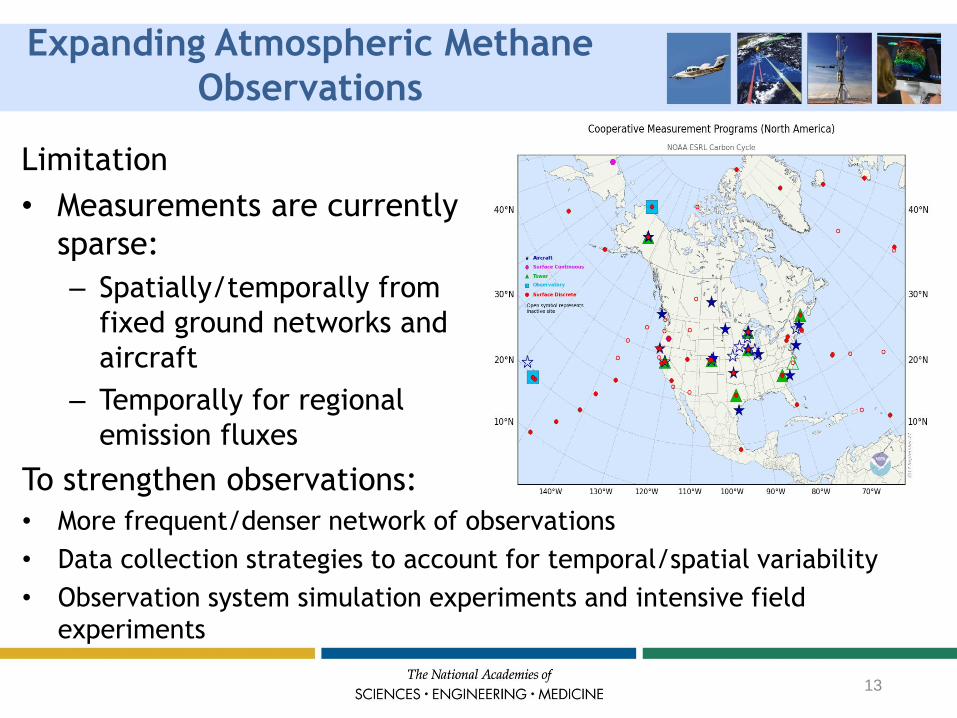
Expanding Atmospheric Methane
Observations
Limitation
• Measurements are currently
sparse:
– Spatially/temporally from
fixed ground networks and
aircraft
– Temporally for regional
emission fluxes
To strengthen observations:
• More frequent/denser network of observations
• Data collection strategies to account for temporal/spatial variability
• Observation system simulation experiments and intensive field
experiments
13

Strengthening Modeling
• Improvements to more accurately simulate observational data in
models:
– Develop/use more accurate prior estimates
– Higher spatial and temporal resolution transport models
– New techniques for model evaluation
– Freely share data so researchers can evaluate effects of using or not using
various data sets
Limitation:
• Inversion modeling based on different
combinations of observational data sets
• Atmospheric transport models cannot
adequately represent small scale processes
that affect measured concentrations
14

Multi-Scale Observational
Strategies
• High-quality, long-term, multi-scale (e.g. aircraft, surface,
tower, and satellite remote sensing) observational strategies:
– supply complementary information
– provide emissions flux estimates from facility through local/regional
scale, which can be compared with gridded inventories
– critical for quantifying and tracking changes in methane emissions on
regional scales
15
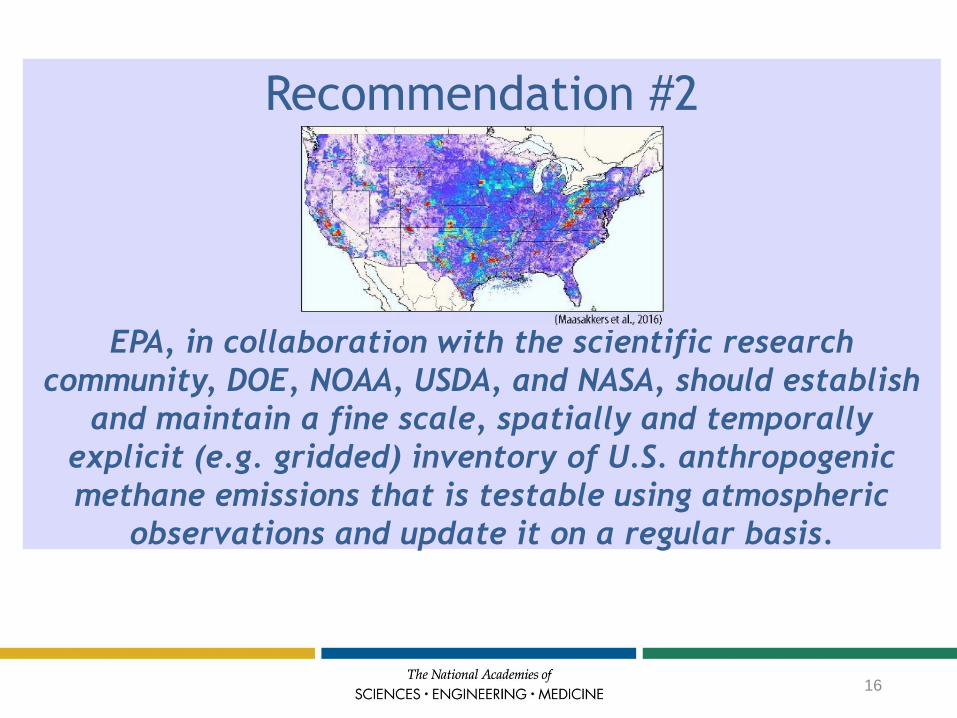
Recommendation #2
EPA, in collaboration with the scientific research
community, DOE, NOAA, USDA, and NASA, should establish
and maintain a fine scale, spatially and temporally
explicit (e.g. gridded) inventory of U.S. anthropogenic
methane emissions that is testable using atmospheric
observations and update it on a regular basis.
16
GHGI Challenging to Verify
• GHGI used by diverse communities
– for array of scientific and policy purposes
– Including for purposes for which it was not designed
• Challenging to test the GHGI against top-down estimates due
to high degree of spatial (national) and temporal (annual)
aggregation
– aircraft campaigns quantify local to regional-scale emissions and report
daily or hourly averages
• Verifiability is bedrock upon which inventories should be built
if they are to be widely applicable to policy needs
17

Recommended Gridded Methane
Emissions Inventory
• Spatial and temporal resolution at as fine a scale as
possible
• GHGI and gridded inventory meet needs of
different users should be viewed as
complementary
• Sufficient documentation to allow scientific/policy
communities interested in regional methane
emissions to adapt inventory to meet their needs
18
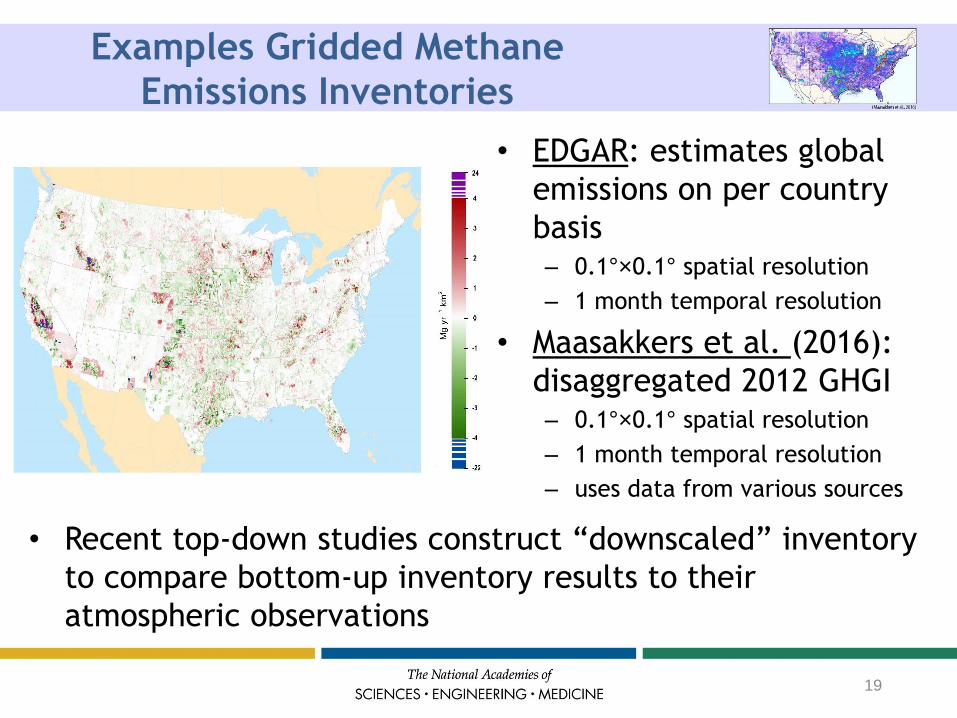
Examples Gridded Methane
Emissions Inventories
• EDGAR: estimates global
emissions on per country
basis– 0.1°×0.1° spatial resolution
– 1 month temporal resolution
• Maasakkers et al. (2016):
disaggregated 2012 GHGI– 0.1°×0.1° spatial resolution
– 1 month temporal resolution
– uses data from various sources
• Recent top-down studies construct “downscaled” inventory
to compare bottom-up inventory results to their
atmospheric observations
19
Recommendation #3
EPA, DOE, NOAA, and USDA should promote a
sustainable process for incorporating the latest
science into the United States Greenhouse Gas
Inventory and regularly review U.S. methane
inventory methodologies.
20
Incorporating New Science into
Inventory Methodologies
• Many inventory methodologies do not reflect current
scientific understanding and engineering practice
• The need to back-cast to 1990 for UNFCCC reporting should
not be a constraint in implementing new methods that
improve emission estimates for current and future
applications • An advisory group could help guide
how new science should be
incorporated into improving GHGI
– Could be facilitated by EPA/NOAA and
comprised of experts from academia,
industry, policymaking, federal agencies,
NGOs
21
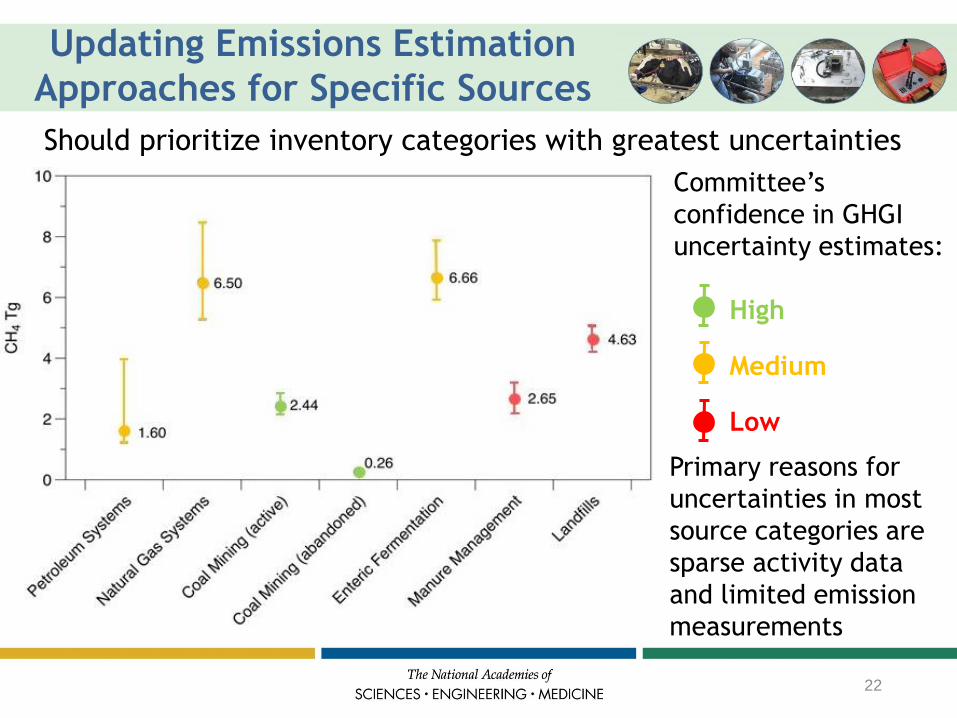
Updating Emissions Estimation
Approaches for Specific Sources
Should prioritize inventory categories with greatest uncertainties
Committee’s
confidence in GHGI
uncertainty estimates:
High
Medium
Low
22
Primary reasons for
uncertainties in most
source categories are
sparse activity data
and limited emission
measurements

Enteric Fermentation
• Uncertainties:
– Lack of activity data for cattle
numbers, feed intake, feed composition
– Emission factors aggregated by
state/region may be inaccurate on local
scale
• To reduce uncertainty:
– Update/simplify existing Tier 2 equations, emission factors, based
on recent studies
– Improve inventory of cattle numbers by category
– Better document feed composition and intake, particularly for
cattle on pasture
– Expand research on predicting dry matter intake estimates for
cattle on pasture/rangeland based on animal and feed
characteristics23
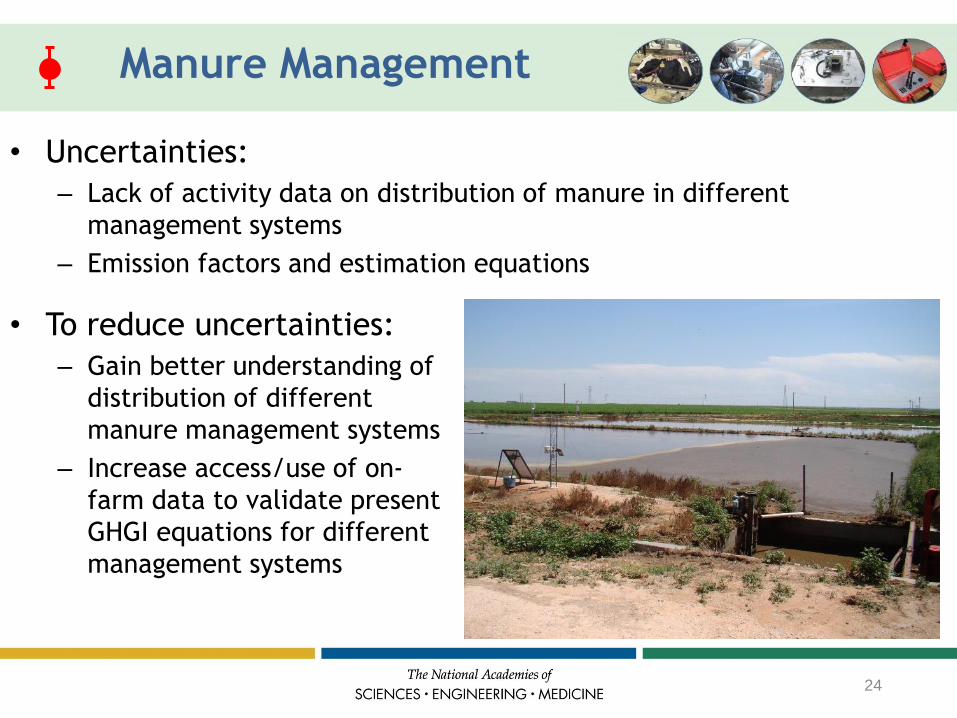
Manure Management
• Uncertainties:
– Lack of activity data on distribution of manure in different
management systems
– Emission factors and estimation equations
• To reduce uncertainties:
– Gain better understanding of
distribution of different
manure management systems
– Increase access/use of on-
farm data to validate present
GHGI equations for different
management systems
24
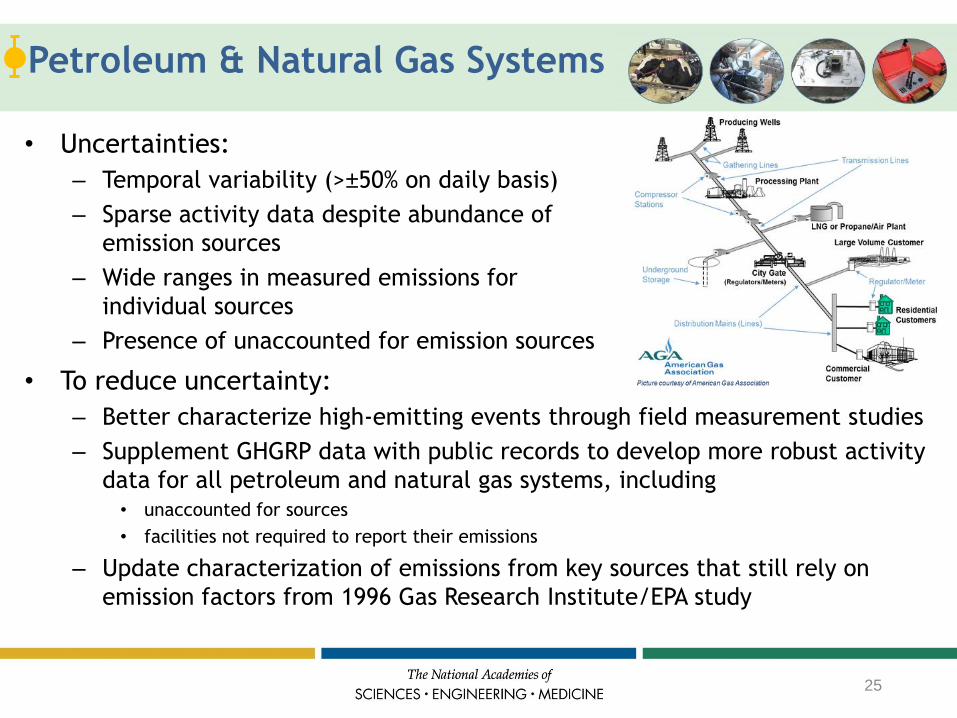
Petroleum & Natural Gas Systems
• To reduce uncertainty:
– Better characterize high-emitting events through field measurement studies
– Supplement GHGRP data with public records to develop more robust activity
data for all petroleum and natural gas systems, including • unaccounted for sources
• facilities not required to report their emissions
– Update characterization of emissions from key sources that still rely on
emission factors from 1996 Gas Research Institute/EPA study
• Uncertainties:
– Temporal variability (>±50% on daily basis)
– Sparse activity data despite abundance of
emission sources
– Wide ranges in measured emissions for
individual sources
– Presence of unaccounted for emission sources
25
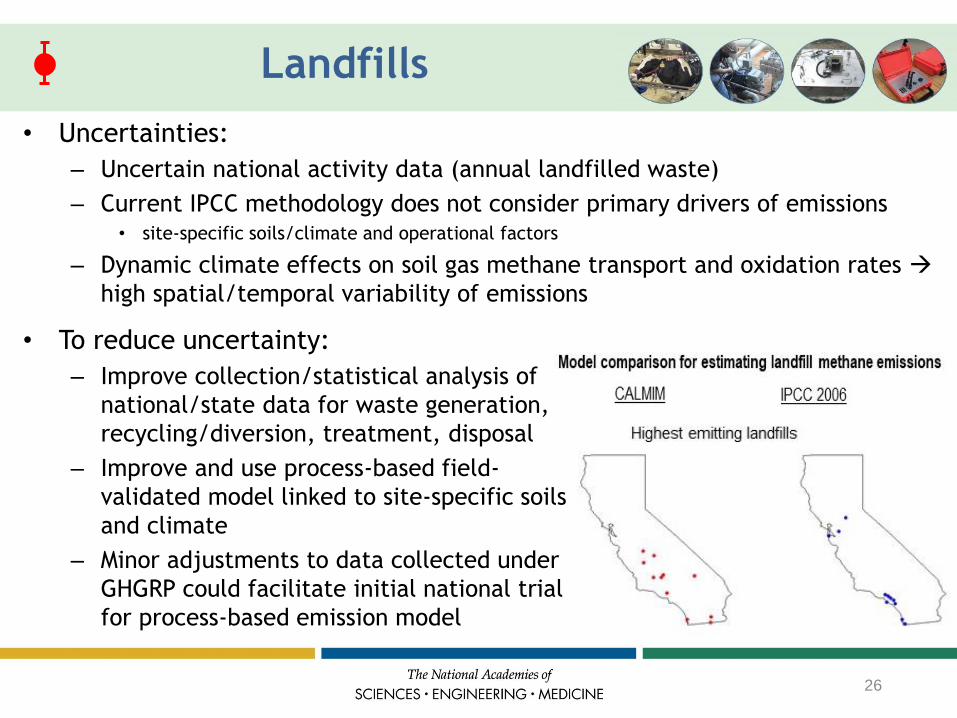
Landfills
• Uncertainties:
– Uncertain national activity data (annual landfilled waste)
– Current IPCC methodology does not consider primary drivers of emissions• site-specific soils/climate and operational factors
– Dynamic climate effects on soil gas methane transport and oxidation rates
high spatial/temporal variability of emissions
• To reduce uncertainty:
– Improve collection/statistical analysis of
national/state data for waste generation,
recycling/diversion, treatment, disposal
– Improve and use process-based field-
validated model linked to site-specific soils
and climate
– Minor adjustments to data collected under
GHGRP could facilitate initial national trial
for process-based emission model
26

Coal Mining
• Uncertainties:
– Underground mine ventilation measurements are not confirmed by
emission measurements at surface
– Abandoned underground mines and surface mines emissions are
calculated based on coal gas content
• Gas content often not representative of specific mines
– Emission factors are state/region based and may not be accurate on
mine scale
• To reduce uncertainty:
– For underground mines, measure at all
entries and monitor emissions at surface
– Update and increase reliability of gas
content data
– For abandoned mines, improve monitoring
including pressure build-up and methane
concentration at surface27
Unaccounted for Sources
• Known sources that may not be fully
accounted for in inventories
– Residential/commercial operations, electric power plants, refineries,
and high-emitting sources
• Previously unknown sources that have been unrecognized
because of their scale, complexity of attribution, or other
factors and are not currently incorporated in GHGI
• To reduce uncertainty:
– Increase measurements of sources ignored
or assumed negligible based on screening
studies
– Integrated top-down and bottom-up
assessments
28
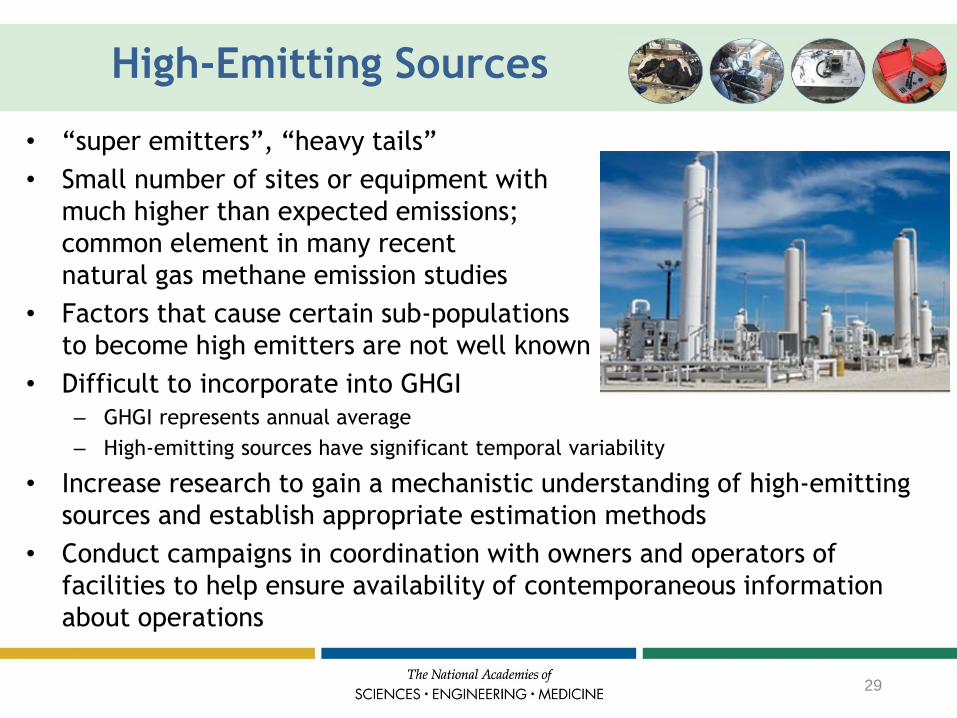
High-Emitting Sources
• “super emitters”, “heavy tails”
• Small number of sites or equipment with
much higher than expected emissions;
common element in many recent
natural gas methane emission studies
• Factors that cause certain sub-populations
to become high emitters are not well known
• Difficult to incorporate into GHGI
– GHGI represents annual average
– High-emitting sources have significant temporal variability
• Increase research to gain a mechanistic understanding of high-emitting
sources and establish appropriate estimation methods
• Conduct campaigns in coordination with owners and operators of
facilities to help ensure availability of contemporaneous information
about operations
29

Recommendation #4
The U.S. should establish and maintain a
nationwide research effort to improve accuracy,
reliability, and applicability of anthropogenic
methane emissions estimates at scales ranging
from individual facilities to gridded
regional/national estimates.
30
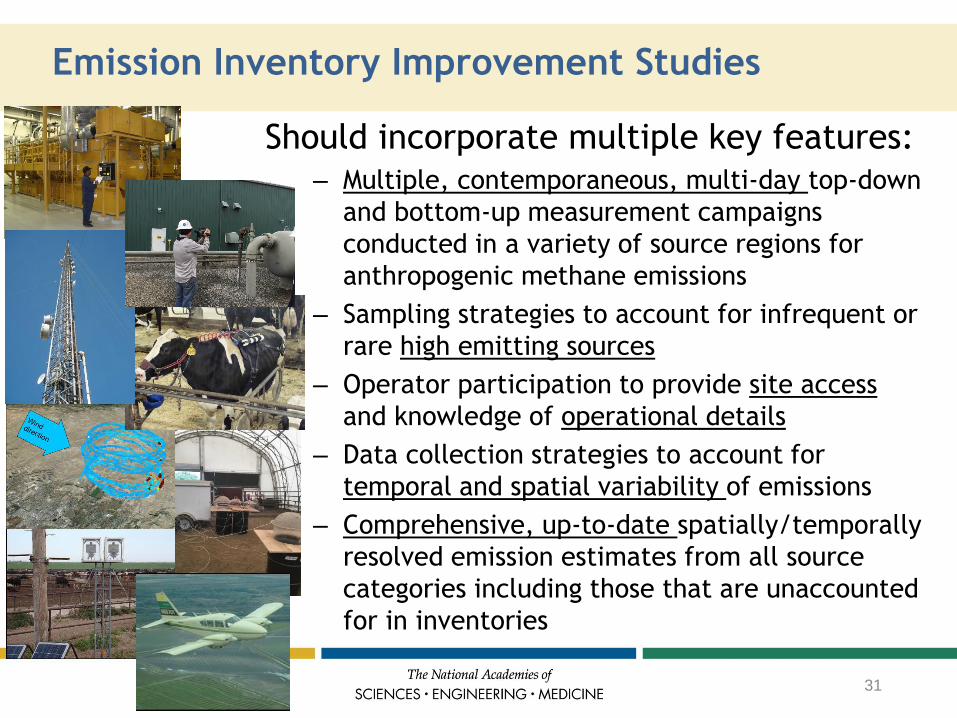
Emission Inventory Improvement Studies
Should incorporate multiple key features: – Multiple, contemporaneous, multi-day top-down
and bottom-up measurement campaigns
conducted in a variety of source regions for
anthropogenic methane emissions
– Sampling strategies to account for infrequent or
rare high emitting sources
– Operator participation to provide site access
and knowledge of operational details
– Data collection strategies to account for
temporal and spatial variability of emissions
– Comprehensive, up-to-date spatially/temporally
resolved emission estimates from all source
categories including those that are unaccounted
for in inventories
31
Presenting Methane Emissions Data and Results
• Common approaches to facilitate presentation of study results
for multiple uses:
– Research networks that help standardize project design
– Clarity on scope, and spatial and temporal boundaries
– Providing data on absolute mass/time basis and other intensity metrics
– Increased data transparency by making underlying report data publicly
available in machine-readable formats and improved documentation
and archiving of GHGRP data
• Methane emissions data generated
by various entities
• Diverse stakeholder community
using these data is even broader
32
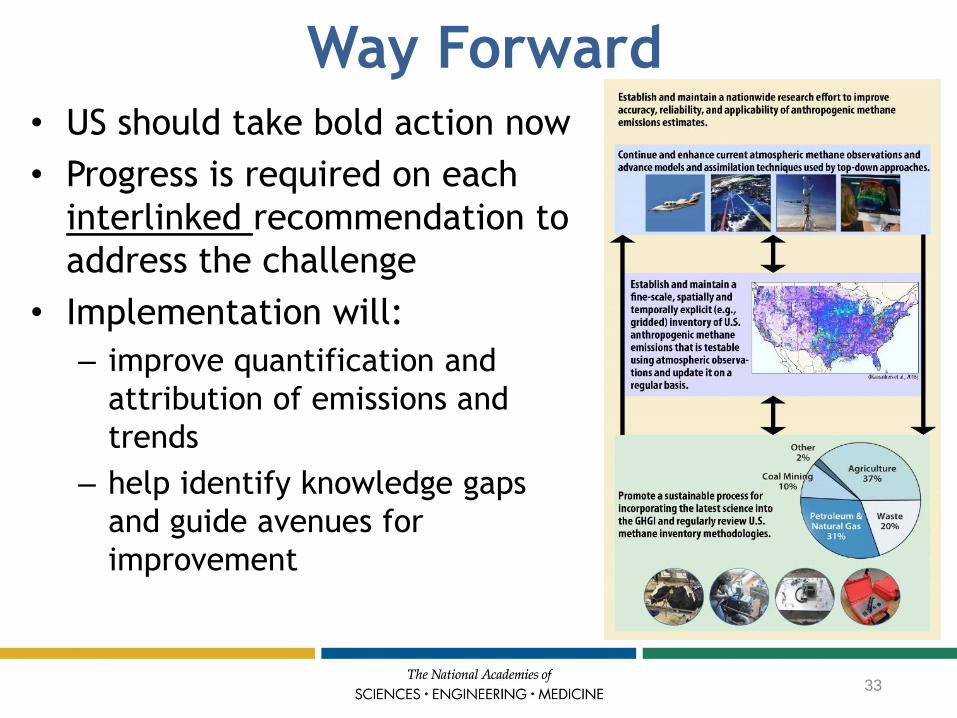
Way Forward• US should take bold action now
• Progress is required on each
interlinked recommendation to
address the challenge
• Implementation will:
– improve quantification and
attribution of emissions and
trends
– help identify knowledge gaps
and guide avenues for
improvement
33

For additional information:Katie Thomas, [email protected], 202-334-3860
April Melvin, [email protected], 202-334-2684
Join the conversation on twitter: #methanestudy
Report available at:
http://nas-sites.org/dels/studies/methane-study/
and
https://www.nap.edu/
34
Extra slides
35
Natural Sources of Methane
Emissions
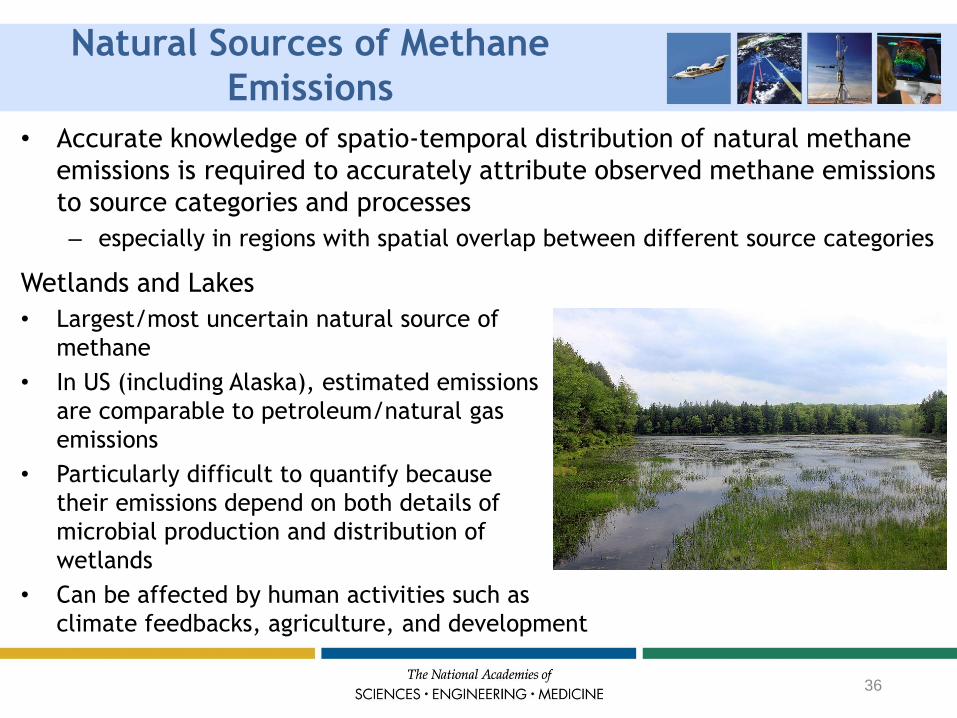
• Accurate knowledge of spatio-temporal distribution of natural methane
emissions is required to accurately attribute observed methane emissions
to source categories and processes
– especially in regions with spatial overlap between different source categories
Wetlands and Lakes
• Largest/most uncertain natural source of
methane
• In US (including Alaska), estimated emissions
are comparable to petroleum/natural gas
emissions
• Particularly difficult to quantify because
their emissions depend on both details of
microbial production and distribution of
wetlands
• Can be affected by human activities such as
climate feedbacks, agriculture, and development
36
Improving Attribution Methods
• Molecular and isotopic tracers can be helpful for source
attribution
• Limitations:
– Many sources do not have unique molecular/isotopic fingerprints
– Some sources require multiple species that may not be sufficiently
inert or useful for robust atmospheric identification
• Additional isotopic and chemical approaches needed:
– carbon monoxide, ethane,13CH4, CH3D, 14CH4, clumped methane
isotopes
37
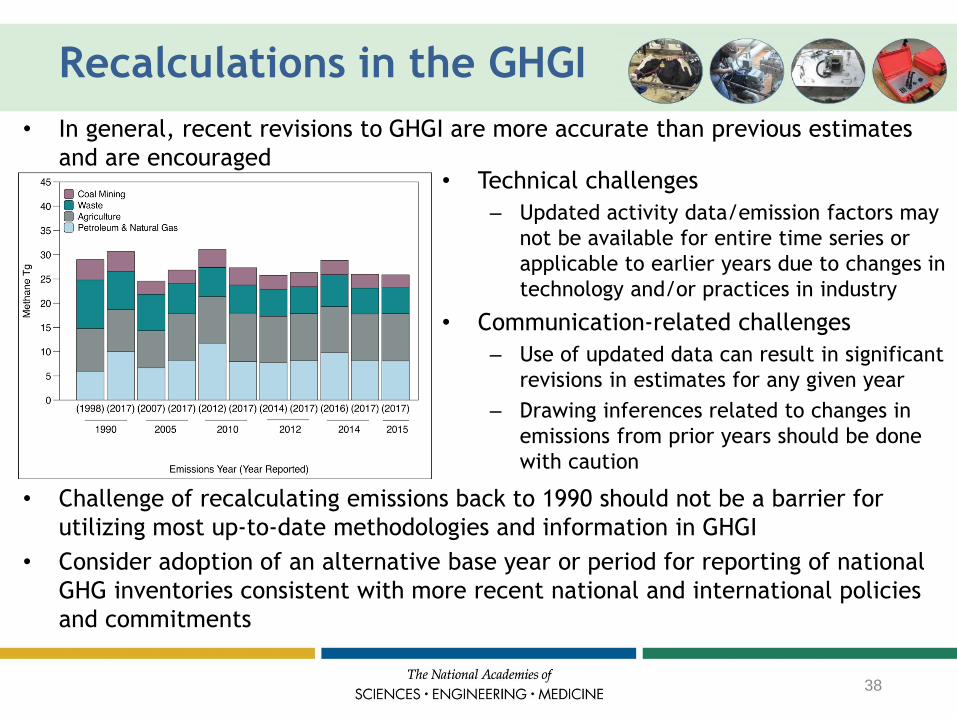
Recalculations in the GHGI
• In general, recent revisions to GHGI are more accurate than previous estimates
and are encouraged
• Challenge of recalculating emissions back to 1990 should not be a barrier for
utilizing most up-to-date methodologies and information in GHGI
• Consider adoption of an alternative base year or period for reporting of national
GHG inventories consistent with more recent national and international policies
and commitments
• Technical challenges
– Updated activity data/emission factors may
not be available for entire time series or
applicable to earlier years due to changes in
technology and/or practices in industry
• Communication-related challenges
– Use of updated data can result in significant
revisions in estimates for any given year
– Drawing inferences related to changes in
emissions from prior years should be done
with caution
38
Projecting Future Methane Emissions
• Accurate projections are critical for planning national policies or goals
• Extremely challenging to do
– Diversity of methane sources that are influenced by many distinct factors
– Climate change
– Projections dependent on factors that are difficult to predict (e.g., future energy
and agriculture policies, population migration)
• Current methods for projecting emissions from key categories may not
be best predictor of future emissions
• Activity data and emission factors that serve as proxies for projecting
future methane emissions need to be robustly investigated regarding
correlations to measured emissions from key categories
– Update EPA Report Methodologies for U.S. Greenhouse Gas Emissions Projections:
Non-CO2 and Non-Energy CO2 Sources
• Future climate projections need to be factored into future emission
estimates for sources where methane is generated, transported, and
oxidized in soils and sediments
39
Updating Emissions Estimation
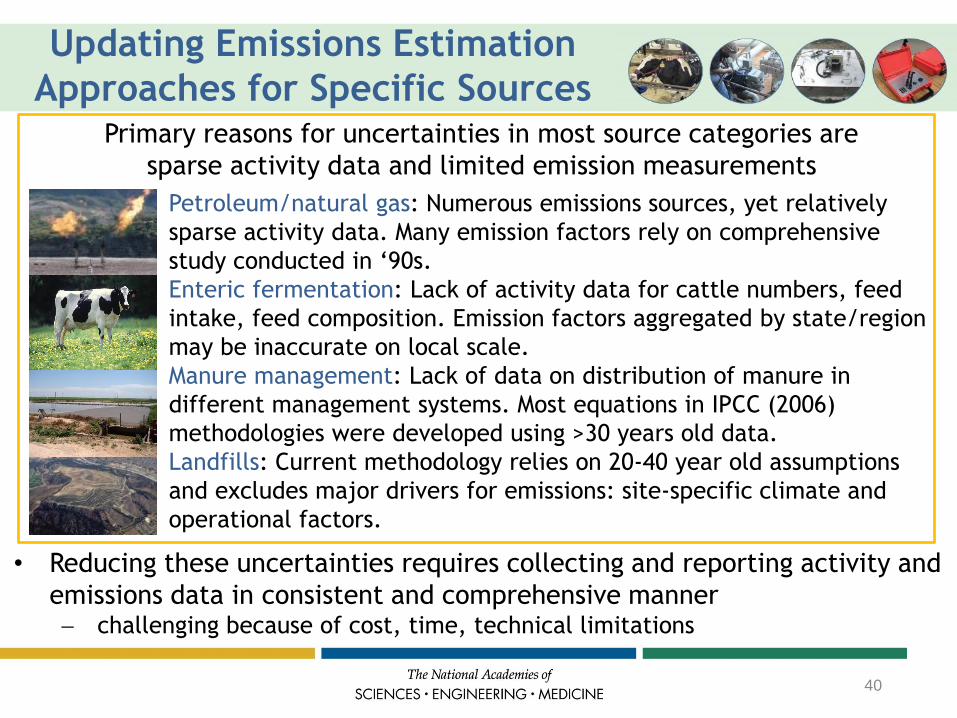
Approaches for Specific Sources Primary reasons for uncertainties in most source categories are
sparse activity data and limited emission measurements
Petroleum/natural gas: Numerous emissions sources, yet relatively
sparse activity data. Many emission factors rely on comprehensive
study conducted in ‘90s.
Enteric fermentation: Lack of activity data for cattle numbers, feed
intake, feed composition. Emission factors aggregated by state/region
may be inaccurate on local scale.
Manure management: Lack of data on distribution of manure in
different management systems. Most equations in IPCC (2006)
methodologies were developed using >30 years old data.
Landfills: Current methodology relies on 20-40 year old assumptions
and excludes major drivers for emissions: site-specific climate and
operational factors.
• Reducing these uncertainties requires collecting and reporting activity and
emissions data in consistent and comprehensive manner challenging because of cost, time, technical limitations
40
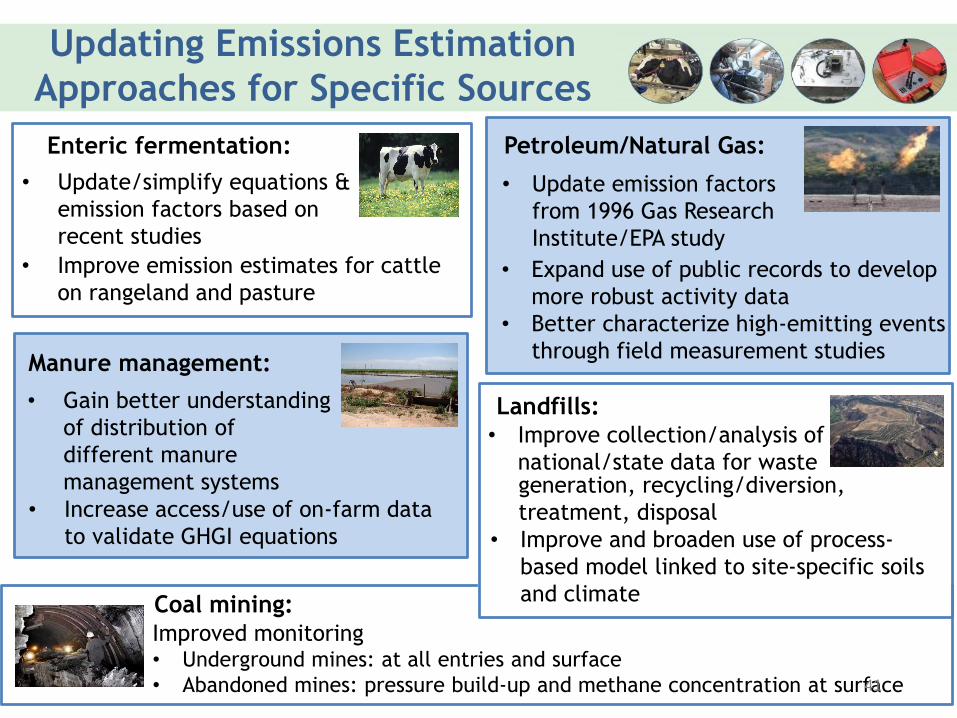
Updating Emissions Estimation
Approaches for Specific Sources
• Update/simplify equations &
emission factors based on
recent studies
• Gain better understanding
of distribution of
different manure
management systems
• Update emission factors
from 1996 Gas Research
Institute/EPA study
Landfills:
Improved monitoring• Underground mines: at all entries and surface
• Abandoned mines: pressure build-up and methane concentration at surface
• Expand use of public records to develop
more robust activity data
• Better characterize high-emitting events
through field measurement studies
Petroleum/Natural Gas:Enteric fermentation:
• Improve emission estimates for cattle
on rangeland and pasture
Manure management:
• Increase access/use of on-farm data
to validate GHGI equations
• Improve collection/analysis of
national/state data for waste
• Improve and broaden use of process-
based model linked to site-specific soils
and climate
generation, recycling/diversion,
treatment, disposal
Coal mining:
41
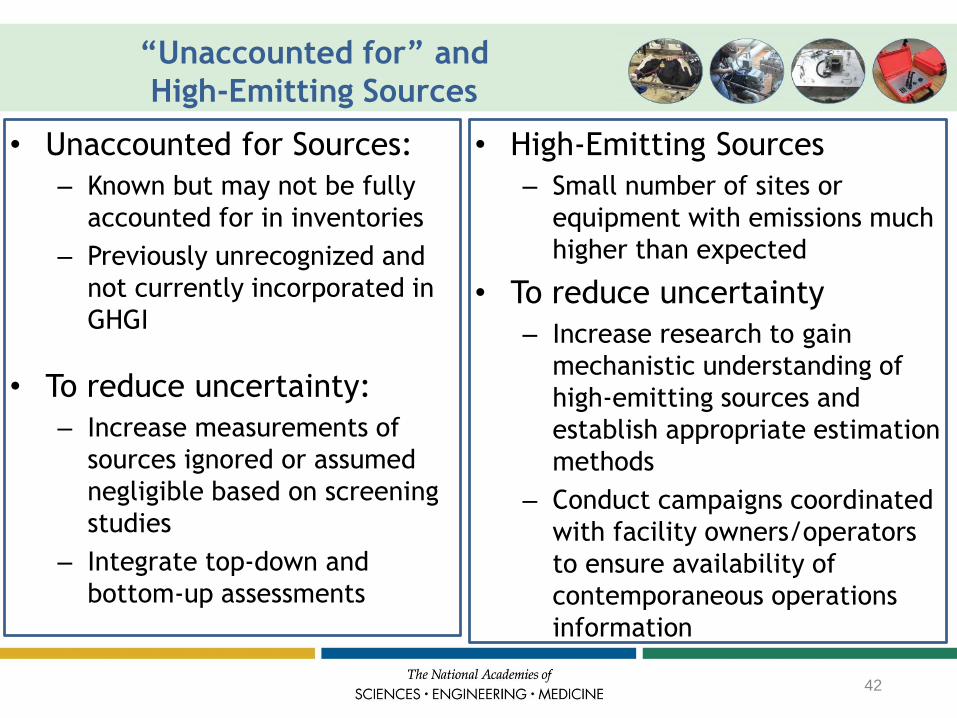
“Unaccounted for” and
High-Emitting Sources
• Unaccounted for Sources:
– Known but may not be fully
accounted for in inventories
– Previously unrecognized and
not currently incorporated in
GHGI
• To reduce uncertainty:
– Increase measurements of
sources ignored or assumed
negligible based on screening
studies
– Integrate top-down and
bottom-up assessments
• High-Emitting Sources
– Small number of sites or
equipment with emissions much
higher than expected
• To reduce uncertainty
– Increase research to gain
mechanistic understanding of
high-emitting sources and
establish appropriate estimation
methods
– Conduct campaigns coordinated
with facility owners/operators
to ensure availability of
contemporaneous operations
information
42
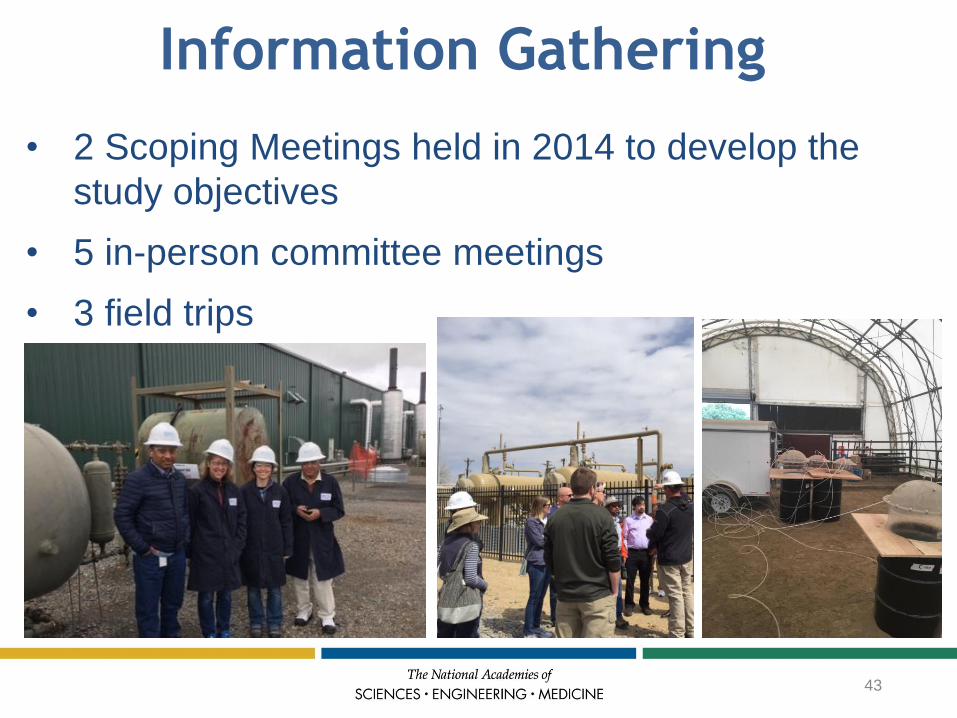
Information Gathering
• 2 Scoping Meetings held in 2014 to develop the
study objectives
• 5 in-person committee meetings
• 3 field trips
43
Stakeholder Engagement• NGOs: EDF, CATF, WRI, Carnegie Endowment for International
Peace, Environmental Research and Education Foundation,
California Farm Bureau Federation
• Industry: Dairy Cares, WM Waste Management, AECOM, Aerodyne,
Gas Technology Institute, Innovation Center for US Dairy
• Academia: Stanford, Washington State, CSU, Purdue, UC Irvine,
California Polytechnic State, CU Boulder
• State and City Governments/Agencies: LA County Sanitation
District, Bay Area Air Quality Management District, CARB, CO. Dept.
of Public Health & Environment
• National Labs: NETL, NREL, LBNL
• Federal Agencies: EPA, USDA, DOE, NOAA, NASA, USGCRP,
USGS, DOT
44