improving child nutrition - unicef · ii improving child nutrition ... of maternal and child...
TRANSCRIPT
IMPROVING CHILD NUTRITIONThe achievable imperative
for global progress
© United Nations Children’s Fund (UNICEF)April 2013
Permission is required to reproduce any part of this publication.Permission will be freely granted to educational or non-profit organizations.Others will be requested to pay a small fee.
For permission please contact:Division of Communication, UNICEFAttention: Permissions, H-6F3 United Nations Plaza, New York, NY 10017 USATel: +1 (212) 326-7434Email: [email protected]
This report and any corrigenda subsequent to printing are available at www.unicef.org/publications/index.html
ISBN: 978-92-806-4686-3eISBN: 978-92-806-4689-4 United Nations Publications Sales No.: E.13.XX.4
Photo creditsCover: © UNICEF/NYHQ2010-3063/PirozziPage 1: © UNICEF/INDA2012-00208/VishwanathanPage 2: © UNICEF/NYHQ2010-3088/PirozziPage 3: © UNICEF/NYHQ2010-3087/PirozziPage 7: © UNICEF/NYHQ2009-0812/RamonedaPage 17: © UNICEF/NYHQ2011-0385/AsselinPage 28: © UNICEF/Kyrgyzstan/2009/GorshkovaPage 33: © UNICEF/NYHQ2012-1793/SokolPage 34: © UNICEF/NYHQ2008-1577/PirozziPage 39: © UNICEF/NYHQ2012-0577/OsePage 40: © UNICEF/NYHQ2008-1373/PietrasikPage 42: © UNICEF/NYHQ2006-2243/PirozziPage 44: © UNICEF/BANA2011-00682/SujanPage 47: © UNICEF/NYHQ1998-1166/NooraniPage 49: © UNICEF/NYHQ2012-0178/AsselinPage 51: © UNICEF/NYHQ2008-1390/PietrasikPage 55: © UNICEF/NYHQ2012-0353/AsselinPage 113: © UNICEF/INDA2012-00201/Vishwanathan
IMPROVING CHILD NUTRITIONThe achievable imperative
for global progress
Improving Child Nutritionii
FOREWORD ������������������������������������������������������������������������������������������������������������������������������������� iii
KEY MESSAGES ����������������������������������������������������������������������������������������������������������������������������� iv
CHAPTER 1: INTRODUCTION ���������������������������������������������������������������������������������������������������������1
CHAPTER 2: CAUSES AND CONSEQUENCES OF UNDERNUTRITION ���������������������������������������3
CHAPTER 3: CURRENT STATUS OF NUTRITION ��������������������������������������������������������������������������7Stunting ��������������������������������������������������������������������������������������������������������������������������������������������� 8Underweight ������������������������������������������������������������������������������������������������������������������������������������ 12Wasting ������������������������������������������������������������������������������������������������������������������������������������������� 13Overweight �������������������������������������������������������������������������������������������������������������������������������������� 15Low birthweight ������������������������������������������������������������������������������������������������������������������������������� 16
CHAPTER 4: INTERVENTIONS TO ADDRESS STUNTING AND OTHER FORMS OF UNDERNUTRITION ��������������������������������������������������������������������������������������� 17Nutrition-specific interventions �������������������������������������������������������������������������������������������������������� 17 Maternal nutrition ����������������������������������������������������������������������������������������������������������������������� 18 Infant and young child feeding ���������������������������������������������������������������������������������������������������� 19 Prevention and treatment of micronutrient deficiencies ������������������������������������������������������������� 23 Prevention and treatment of severe acute malnutrition �������������������������������������������������������������� 25 Water, sanitation and hygiene and access to health services����������������������������������������������������� 26Nutrition-sensitive approaches �������������������������������������������������������������������������������������������������������� 26Maintaining the focus on equity ������������������������������������������������������������������������������������������������������ 27
CHAPTER 5: IT CAN BE DONE: SUCCESS STORIES IN SCALING UP NUTRITION ������������������28Ethiopia: Reducing undernutrition with national planning ���������������������������������������������������������������� 28Haiti: Expanding nutrition services in an emergency ����������������������������������������������������������������������� 30India: Improving nutrition governance to reduce child stunting in Maharashtra ������������������������������ 31Nepal: Making steady progress for women and children ���������������������������������������������������������������� 32Peru: Reaching the most disadvantaged by concentrating on equity ���������������������������������������������� 35Rwanda: Reducing stunting through consolidated nationwide action ��������������������������������������������� 37Democratic Republic of the Congo: Scaling up community-based
management of severe acute malnutrition ���������������������������������������������������������������������������������� 38Sri Lanka: Reducing under-five mortality by expanding breastfeeding �������������������������������������������� 40Kyrgyzstan: Reducing iron deficiency with home fortification of food ��������������������������������������������� 41United Republic of Tanzania: Institutionalizing vitamin A supplementation ������������������������������������� 43Viet Nam: Protecting breastfeeding through legislation ������������������������������������������������������������������ 45
CHAPTER 6: NEW DEVELOPMENTS IN GLOBAL PARTNERSHIPS ��������������������������������������������47
CHAPTER 7: THE WAY FORWARD �������������������������������������������������������������������������������������������������49
REFERENCES ���������������������������������������������������������������������������������������������������������������������������������52
NUTRITION PROFILES: 24 COUNTRIES WITH THE LARGEST BURDEN AND HIGHEST PREVALENCE OF STUNTING ��������������������������������������������������������������������������������������������������������55Infant and young child feeding indicators and area graphs ������������������������������������������������������������ 104Definitions of indicators ����������������������������������������������������������������������������������������������������������������� 106Data sources ����������������������������������������������������������������������������������������������������������������������������������111
STATISTICAL TABLES������������������������������������������������������������������������������������������������������������������� 113Table 1: Country ranking based on number of stunted children �����������������������������������������������������114Table 2: Demographic and nutritional status indicators ������������������������������������������������������������������116Table 3: Infant and young child feeding practices and micronutrient indicators ����������������������������� 120Regional classification and general note on the data ��������������������������������������������������������������������� 124
CONTENTS
Foreword iii
FOREWORD
Poor nutrition in the first 1,000 days of children’s lives can have irreversible consequences. For millions of children, it means they are, forever, stunted.
Smaller than their non-stunted peers, stunted children are more susceptible to sickness. In school, they often fall behind in class. They enter adulthood more likely to become overweight and more prone to non-communicable disease. And when they start work, they often earn less than their non-stunted co-workers.
It is difficult to think of a greater injustice than robbing a child, in the womb and in infancy, of the ability to fully develop his or her talents throughout life.
This is a tragedy for the 165 million children under the age of 5 afflicted by stunting in the world today. It is a violation of their rights. It is also a huge burden for nations whose future citizens will be neither as healthy nor as productive as they could have been.
And let us not forget the tens of millions of children around the world who are vulnerable to the ravages of life-threatening, severe acute malnutrition. Slowly, treatment is expanding but, still, too many children remain out of its reach. About one third of under-five mortality is attributable to undernutrition.
At last, the gravity of undernutrition and its long-term effects are being acknowledged and acted upon – with increasing urgency. This is, in large part, in recognition of the ever-growing body of compelling evidence on the short- and long-term impacts of stunting and other forms of undernutrition.
Recognizing that investing in nutrition is a key way to advance global welfare, the G8 has put this high on its agenda. The global nutrition community is uniting around the Scaling Up Nutrition movement. The United Nations Secretary-General has included elimination of stunting as a goal in his Zero Hunger Challenge to the world. The 2013 World Economic Forum highlighted food and nutrition security as a global priority. And a panel of top economists from the most recent Copenhagen Consensus selected stunting reduction as a top investment priority.
More and more countries are scaling up their nutrition programmes to reach children during the critical period from pregnancy to the age of 2. These programmes are working. Countries that are reaching mothers and children with effective nutrition and related interventions during the first 1,000 days are achieving results. Stunting and other forms of undernutrition are decreasing.
But we must still reach millions of mothers and their children, especially those in the hardest to reach areas. Urgently.
The World Health Assembly has set the goal of achieving a 40 per cent reduction in the number of stunted children under 5 years old by 2025, or around 70 million children saved from the misery of stunting.
This report shows that we can attain that target. Countries like Ethiopia, Haiti, Nepal, Peru and Rwanda are leading the way, quickly scaling up equity-focused initiatives. Committed to results, they are achieving progress through advocacy, better allocation of resources and investments in tailored policies and programmes.
And where progress can be made, we have a moral obligation to do so.
The legacy of the first 1,000 days of a child’s life can last forever. So, we must do what we can, as fast as we can, to give the most disadvantaged mothers and children dependable, quality nutrition.
The right start in life is a healthy start – and that is the only start from which children can realize their promise and potential. We owe that to every child, everywhere.
Anthony Lake Executive Director, UNICEF
Improving Child Nutritioniv
KEY MESSAGES
Focus on stunting prevention• Globally, about one in four children under 5 years
old are stunted (26 per cent in 2011). An estimated 80 per cent of the world’s 165 million stunted children live in just 14 countries.
• Stunting and other forms of undernutrition reduce a child’s chance of survival, while also hindering optimal health and growth. Stunting is associated with suboptimal brain development, which is likely to have long-lasting harmful consequences for cognitive ability, school performance and future earnings. This in turn affects the development potential of nations.
• In tackling child undernutrition, there has been a shift from efforts to reduce underweight preva-lence (inadequate weight for age) to prevention of stunting (inadequate length/height for age). There is better understanding of the crucial importance of nutrition during the critical 1,000-day period covering pregnancy and the first two years of the child’s life, and of the fact that stunting reflects deficiencies during this period. The World Health Assembly has adopted a new target of reducing the number of stunted children under the age of 5 by 40 per cent by 2025.
• In addition to the quality and frequency of infant and young child feeding and the incidence of infectious diseases, the mother’s nutrition and health status are important determinants of stunting. An undernourished mother is more likely to give birth to a stunted child, perpetuating a vicious cycle of undernutrition and poverty.
• A stunted child enters adulthood with a greater propensity for developing obesity and chronic diseases. With increasing urbanization and shifts in diet and lifestyle, the result could be a burgeoning epidemic of such conditions in many low- and middle-income countries. This would create new economic and social challenges, especially among vulnerable groups.
Approaches that work• Reductions in stunting and other forms of
undernutrition can be achieved through proven interventions. These include improving women’s nutrition, especially before, during and after preg-nancy; early and exclusive breastfeeding; timely, safe, appropriate and high-quality complementary food; and appropriate micronutrient interventions.
• Timing is important – interventions should focus on the critical 1,000-day window including pregnancy and before a child turns 2. After that window closes, disproportionate weight gain may increase the child’s risk of becoming overweight and developing other health problems.
• Efforts to scale up nutrition programmes are working, benefiting women and children and their communities in many countries. Such programmes all have common elements: political commitment, national policies and programmes based on sound evidence and analysis, the presence of trained and skilled community workers collabo-rating with communities, effective communication and advocacy, and multi-sectoral, integrated service delivery.
Global momentum to scale up nutrition• Globally, interest in nutrition has increased
dramatically. Recurrent food shortages, rising food prices, strengthened evidence and rising obesity have created the impetus for widespread concern and action.
• More than ever, investing in nutrition is seen as a key development priority to benefit global wel-fare. The Group of 8 (G8) of the world’s wealthiest countries has put nutrition high on its development agenda, and the United Nations Secretary-General’s Zero Hunger Challenge includes the elimination of stunting as a goal.
• The global nutrition community is uniting around the Scaling Up Nutrition (SUN) move-ment, which supports nationally driven processes for the reduction of stunting and other forms of malnutrition.
Chapter
Introduction 1
1INTRODUCTION
UNICEF’s 2009 report Tracking Progress on Child and Maternal Nutrition drew attention to the
impact of high levels of undernutrition on child survival, growth and development and their
social and economic toll on nations� It described the state of nutrition programmes worldwide
and argued for improving and expanding delivery of key nutrition interventions during the
critical 1,000-day window covering a woman’s pregnancy and the first two years of her child’s
life, when rapid physical and mental development occurs� This report builds on those earlier
findings by highlighting new developments and demonstrating that efforts to scale up nutrition
programmes are working, benefiting children in many countries�
UNICEF first outlined the nature and determinants of maternal and child undernutrition in a conceptual framework more than two decades ago. Child under-nutrition is caused not just by the lack of adequate, nutritious food, but by frequent illness, poor care practices and lack of access to health and other social services. This conceptual framework is as relevant today as it was then, but it is now influenced by recent shifts and exciting developments in the field of nutrition.
Strengthened by new evidence, an understanding of the short- and long-term consequences of undernutri-tion has evolved. There is even stronger confirmation that undernutrition can trap children, families, com-munities and nations in an intergenerational cycle of poor nutrition, illness and poverty. More is known about the mechanisms that link inadequate growth due to nutritional deficiencies before the age of 2 with impaired brain development and subsequent reduced performance in school. And there is clearer, more comprehensive evidence of the need to promote optimal growth during this critical period
to avoid an elevated risk of non-communicable diseases, such as cardiovascular disease, in adulthood and even in the next generation.
Equipped with this new knowledge, the international community now places more emphasis on stunting (inadequate length/height for age) as the indicator of choice for measuring progress towards reducing undernutrition. This means focusing less on under-weight (inadequate weight for age), which is a key indicator for measuring progress towards Millennium Development Goal (MDG) 1.
In May 2012, the World Health Assembly, the decision-making body of the World Health Organization (WHO), agreed on a new target: reducing the number of stunted children under the age of 5 by 40 per cent by 2025. The United Nations Secretary-General has included elimination of stunting as a goal in his Zero Hunger Challenge, launched in June 2012. This emphasis on stunting has led to a review of national programmes and strategies to increase the focus on prevention and integrated programmes.
Improving Child Nutrition2
In addition to the shift in emphasis towards reducing stunting, there has been a major shift in the global nutrition landscape, sparking unprec-edented momentum for action. Just a few years ago, nutrition was a neglected area of development, and the nutrition community was fragmented, lacking a common voice or unified approach. The initia-tion of the SUN movement in 2010 brought about much-needed change.
The SUN movement seeks to build national commitment to accelerate progress to reduce stunting and other forms of undernutrition, as well as overweight. Through SUN, countries are working to increase access to affordable and nutritious food, as well as demand for it. They are also addressing the other factors that determine nutritional status, such as improved feeding and care practices, clean water, sanitation, health care, social protection and initiatives to empower women.
More than 30 countries in Africa, Asia and Latin America have joined SUN. They are expanding their nutrition programmes, supported by donor countries, United Nations organizations, civil society and the private sector. SUN is assisting nations in meeting their obligations to ensure fulfilment of their citizens’ right to food. As initially codified in the Universal Declaration of Human Rights and reaffirmed by the International Covenant on Economic, Social and Cultural Rights, the right to food is a fundamental human right. Realizing the right to food is critical to fulfilling other rights, most importantly the right to health and the opportunities that it conveys.
Stunting and other forms of undernutrition epitomize societal inequities, and stunting serves as a marker for poverty and underdevelopment. This report shows that there is now an opportunity to address this major inequity by scaling up nutrition programming.
To show that results can be achieved, even within a short time frame, the report includes case studies from countries where nutrition has been improved at scale. It also presents an updated picture of the status of nutrition and profiles countries where the prevalence of stunting in children under the age of 5 is 40 per cent or higher, as well as those with the highest absolute burden of stunting.
Causes and Consequences of Undernutrition 3
2Chapter
CAUSES AND CONSEQUENCES OF UNDERNUTRITION
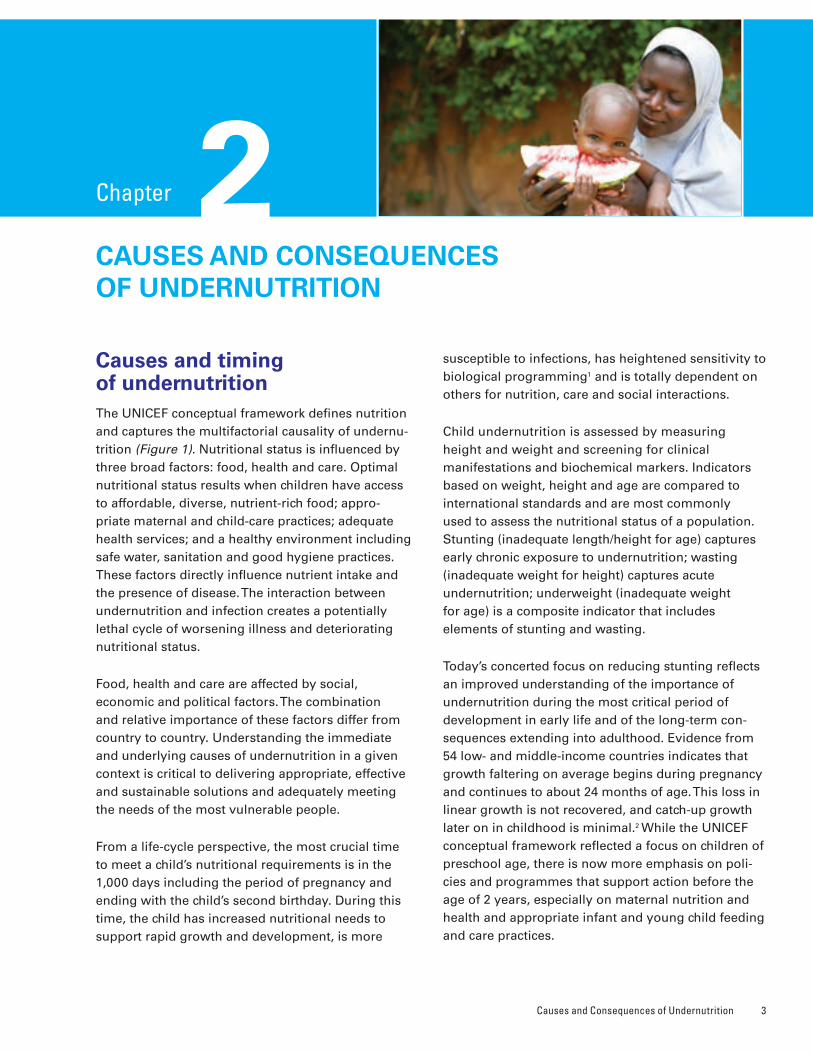
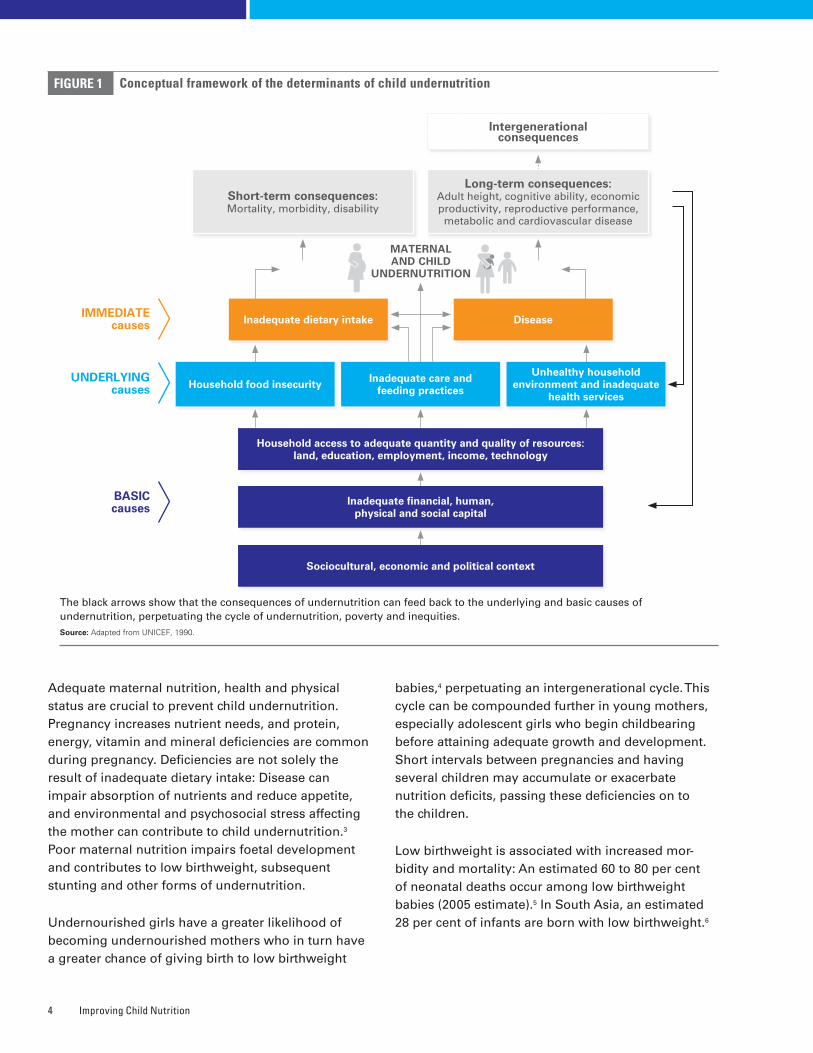
Causes and timing of undernutritionThe UNICEF conceptual framework defines nutrition and captures the multifactorial causality of undernu-trition (Figure 1). Nutritional status is influenced by three broad factors: food, health and care. Optimal nutritional status results when children have access to affordable, diverse, nutrient-rich food; appro-priate maternal and child-care practices; adequate health services; and a healthy environment including safe water, sanitation and good hygiene practices. These factors directly influence nutrient intake and the presence of disease. The interaction between undernutrition and infection creates a potentially lethal cycle of worsening illness and deteriorating nutritional status.
Food, health and care are affected by social, economic and political factors. The combination and relative importance of these factors differ from country to country. Understanding the immediate and underlying causes of undernutrition in a given context is critical to delivering appropriate, effective and sustainable solutions and adequately meeting the needs of the most vulnerable people.
From a life-cycle perspective, the most crucial time to meet a child’s nutritional requirements is in the 1,000 days including the period of pregnancy and ending with the child’s second birthday. During this time, the child has increased nutritional needs to support rapid growth and development, is more
susceptible to infections, has heightened sensitivity to biological programming1 and is totally dependent on others for nutrition, care and social interactions.
Child undernutrition is assessed by measuring height and weight and screening for clinical manifestations and biochemical markers. Indicators based on weight, height and age are compared to international standards and are most commonly used to assess the nutritional status of a population. Stunting (inadequate length/height for age) captures early chronic exposure to undernutrition; wasting (inadequate weight for height) captures acute undernutrition; underweight (inadequate weight for age) is a composite indicator that includes elements of stunting and wasting.
Today’s concerted focus on reducing stunting reflects an improved understanding of the importance of undernutrition during the most critical period of development in early life and of the long-term con-sequences extending into adulthood. Evidence from 54 low- and middle-income countries indicates that growth faltering on average begins during pregnancy and continues to about 24 months of age. This loss in linear growth is not recovered, and catch-up growth later on in childhood is minimal.2 While the UNICEF conceptual framework reflected a focus on children of preschool age, there is now more emphasis on poli-cies and programmes that support action before the age of 2 years, especially on maternal nutrition and health and appropriate infant and young child feeding and care practices.
Improving Child Nutrition4
Adequate maternal nutrition, health and physical status are crucial to prevent child undernutrition. Pregnancy increases nutrient needs, and protein, energy, vitamin and mineral deficiencies are common during pregnancy. Deficiencies are not solely the result of inadequate dietary intake: Disease can impair absorption of nutrients and reduce appetite, and environmental and psychosocial stress affecting the mother can contribute to child undernutrition.3 Poor maternal nutrition impairs foetal development and contributes to low birthweight, subsequent stunting and other forms of undernutrition.
Undernourished girls have a greater likelihood of becoming undernourished mothers who in turn have a greater chance of giving birth to low birthweight
babies,4 perpetuating an intergenerational cycle. This cycle can be compounded further in young mothers, especially adolescent girls who begin childbearing before attaining adequate growth and development. Short intervals between pregnancies and having several children may accumulate or exacerbate nutrition deficits, passing these deficiencies on to the children.
Low birthweight is associated with increased mor-bidity and mortality: An estimated 60 to 80 per cent of neonatal deaths occur among low birthweight babies (2005 estimate).5 In South Asia, an estimated 28 per cent of infants are born with low birthweight.6
FIGURE 1 Conceptual framework of the determinants of child undernutrition
The black arrows show that the consequences of undernutrition can feed back to the underlying and basic causes of undernutrition, perpetuating the cycle of undernutrition, poverty and inequities. Source: Adapted from UNICEF, 1990�
Intergenerational consequences
UNDERLYING causes
BASIC causes
IMMEDIATE causes
Household access to adequate quantity and quality of resources: land, education, employment, income, technology
Household food insecurityUnhealthy household
environment and inadequate health services
Inadequate care and feeding practices
Inadequate dietary intake Disease
Short-term consequences: Mortality, morbidity, disability
Long-term consequences:Adult height, cognitive ability, economic productivity, reproductive performance, metabolic and cardiovascular disease
MATERNAL AND CHILD
UNDERNUTRITION
Inadequate financial, human, physical and social capital
Sociocultural, economic and political context
Causes and Consequences of Undernutrition 5
After birth, a number of practices can directly lead to poor growth: inadequate breastfeeding practices such as non-exclusive breastfeeding; inappropriate complementary feeding, such as starting at the wrong age; poor access to or use of diverse types of food and inadequate intake of micronutrients. Poor growth can be aggravated further by frequent inci-dence of infectious diseases like diarrhoea, malaria or infestation with intestinal worms.
Consequences of undernutritionStunting and other forms of undernutrition are clearly a major contributing factor to child mortality, disease and disability. For example, a severely stunted child faces a four times higher risk of dying, and a severely wasted child is at a nine times higher risk.7 Specific nutritional deficiencies such as vitamin A, iron or zinc deficiency also increase risk of death. Undernutrition can cause various diseases such as blindness due to vitamin A deficiency and neural tube defects due to folic acid deficiency.
The broader understanding of the devastating conse-quences of undernutrition on morbidity and mortality is based on well-established evidence. Knowledge of the impact of stunting and other forms of undernutri-tion on social and economic development and human capital formation has been supported and expanded by more recent research.8
Earlier research clarified the harmful impact of inadequate intake of specific micronutrients such as iron, folic acid and iodine on development of the brain and nervous system and on subsequent school performance. The impact of iron deficiency, which reduces school performance in children and the physical capacity for work among adults, has also been documented.
Undernutrition early in life clearly has major con-sequences for future educational, income and productivity outcomes. Stunting is associated with poor school achievement and poor school perfor-mance.9 Recent longitudinal studies among cohorts of children from Brazil, Guatemala, India, the Philippines and South Africa confirmed the association between stunting and a reduction in schooling, and also found that stunting was a predictor of grade failure.10
Reduced school attendance and educational out-comes result in diminished income-earning capacity in adulthood. A 2007 study estimated an average 22 per cent loss of yearly income in adulthood.11
What is now becoming clearer is that the devel-opmental impact of stunting and other forms of undernutrition happens earlier and is greater than previously thought. Brain and nervous system development begins early in pregnancy and is largely complete by the time the child reaches the age of 2. The timing, severity and duration of nutritional deficiencies during this period affect brain develop-ment in different ways, influenced by the brain’s need for a given nutrient at a specific time.12 While the developing brain has the capacity for repair, it is also highly vulnerable, and nutrient deficiencies during critical periods have long-term effects.
This new knowledge, together with the evidence that the irreversible process of stunting happens early in life, has led to a shift in programming focus. Previously the emphasis was on children under age 5, while now it is increasingly on the 1,000-day period up to age 2, including pregnancy.
Improvements in nutrition after age 2 do not usually lead to recovery of lost potential. Data from the five countries studied indicated that weight gain during the first two years of life, but not afterwards, improved school performance later on in childhood, underlining the critical importance of this window of opportunity.13 Earlier studies of malnourished Korean orphans adopted into American families showed residual poor performance on cognitive tests based on nutritional status at the time of adoption. Adoption before age 2 was associated with significantly higher cognitive test scores compared with children adopted later.14 A series of longitudinal South African studies assessed the impact of severe undernutri-tion before age 2 on physical growth and intellectual functioning in adolescence. Even accounting for improvements in environment and catch-up growth, the children who had experienced chronic under-nutrition in early infancy suffered from irreversible intellectual impairment.15
A consequence that is also emerging more clearly is the impact of stunting and subsequent dispropor-tionate and rapid weight gain on health later in life.
Improving Child Nutrition6
These long-term effects are referred to as the foetal programming concept: Poor foetal growth, small size at birth and continued poor growth in early life followed by rapid weight gain later in childhood raises the risk of coronary heart disease, stroke, hypertension and type II diabetes.16 Attaining optimal growth before 24 months of age is desirable; becoming stunted but then gaining weight disproportionately after 24 months is likely to increase the risk of becoming overweight and devel-oping other health problems.17
As stunted children enter adulthood with a greater propensity for developing obesity and other chronic diseases, the possibility of a burgeoning epidemic of poor health opens up, especially in transitional coun-tries experiencing increasing urbanization and shifts in diet and lifestyle. This epidemiological transition could create new economic and social challenges in many low- and middle-income countries where stunting is prevalent, especially among poorer population groups.
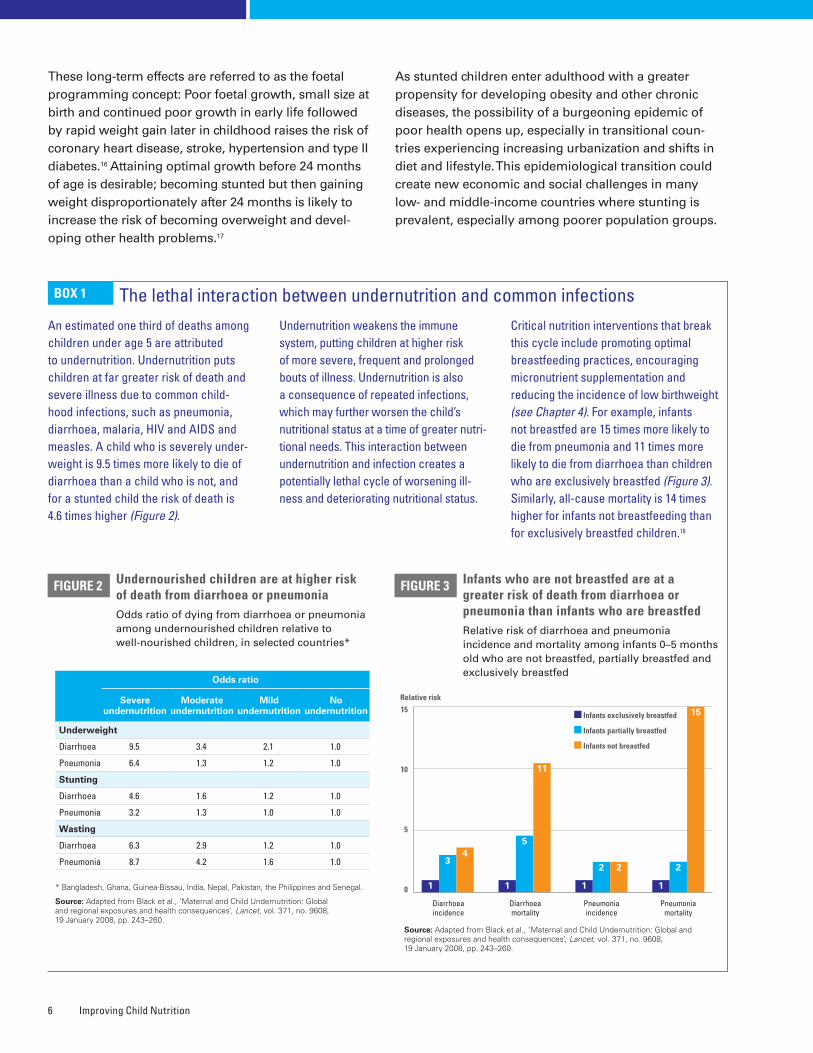
An estimated one third of deaths among children under age 5 are attributed to undernutrition. Undernutrition puts children at far greater risk of death and severe illness due to common child-hood infections, such as pneumonia, diarrhoea, malaria, HIV and AIDS and measles. A child who is severely under-weight is 9.5 times more likely to die of diarrhoea than a child who is not, and for a stunted child the risk of death is 4.6 times higher (Figure 2).
Undernutrition weakens the immune system, putting children at higher risk of more severe, frequent and prolonged bouts of illness. Undernutrition is also a consequence of repeated infections, which may further worsen the child’s nutritional status at a time of greater nutri-tional needs. This interaction between undernutrition and infection creates a potentially lethal cycle of worsening ill-ness and deteriorating nutritional status.
Critical nutrition interventions that break this cycle include promoting optimal breastfeeding practices, encouraging micronutrient supplementation and reducing the incidence of low birthweight (see Chapter 4). For example, infants not breastfed are 15 times more likely to die from pneumonia and 11 times more likely to die from diarrhoea than children who are exclusively breastfed (Figure 3). Similarly, all-cause mortality is 14 times higher for infants not breastfeeding than for exclusively breastfed children.18
BOX 1 The lethal interaction between undernutrition and common infections
Undernourished children are at higher risk of death from diarrhoea or pneumoniaOdds ratio of dying from diarrhoea or pneumonia among undernourished children relative to well-nourished children, in selected countries*
FIGURE 2
* Bangladesh, Ghana, Guinea-Bissau, India, Nepal, Pakistan, the Philippines and Senegal�
Source: Adapted from Black et al�, ‘Maternal and Child Undernutrition: Global and regional exposures and health consequences’, Lancet, vol� 371, no� 9608, 19 January 2008, pp� 243–260�
Odds ratio
Severe undernutrition
Moderate undernutrition
Mild undernutrition
No undernutrition
Underweight
Diarrhoea 9.5 3.4 2.1 1.0
Pneumonia 6.4 1.3 1.2 1.0
Stunting
Diarrhoea 4.6 1.6 1.2 1.0
Pneumonia 3.2 1.3 1.0 1.0
Wasting
Diarrhoea 6.3 2.9 1.2 1.0
Pneumonia 8.7 4.2 1.6 1.0
Infants who are not breastfed are at a greater risk of death from diarrhoea or pneumonia than infants who are breastfedRelative risk of diarrhoea and pneumonia incidence and mortality among infants 0–5 months old who are not breastfed, partially breastfed and exclusively breastfed
FIGURE 3
Diarrhoea mortality
1
5
11
1
34
Diarrhoea incidence
1
2
15
Pneumonia mortality
1
2 2
Pneumonia incidence
Infants exclusively breastfed
Infants partially breastfed
Infants not breastfed
Source: Adapted from Black et al�, ‘Maternal and Child Undernutrition: Global and regional exposures and health consequences’, Lancet, vol� 371, no� 9608, 19 January 2008, pp� 243–260�
0
15
10
5
Relative risk
Current Status of Nutrition 7
3Chapter
CURRENT STATUS OF NUTRITION
Child malnutrition can manifest itself in several ways� It is most commonly assessed
through measurement of a child’s weight and height, as well as through biochemical and
clinical assessment� This chapter reports on the levels and trends of the anthropometric
indicators of nutritional status, gathered from data collected through large nationally
representative household surveys�19
• Stunting reflects chronic undernutrition during the most critical periods of growth and devel-opment in early life. It is defined as the percentage of children aged 0 to 59 months whose height for age is below minus two standard devia-tions (moderate and severe stunting) and minus three standard deviations (severe stunting) from the median of the WHO Child Growth Standards.
• Underweight is a composite form of undernutrition that includes elements of stunting and wasting. It is defined as the percentage of children aged 0 to 59 months whose weight for age is below minus two
standard deviations (moderate and severe underweight) and minus three standard deviations (severe underweight) from the median of the WHO Child Growth Standards.
• Wasting reflects acute undernutri-tion. It is defined as the percentage of children aged 0 to 59 months whose weight for height is below minus two standard deviations (mod-erate and severe wasting) and minus three standard deviations (severe wasting) from the median of the WHO Child Growth Standards.
• Severe acute malnutrition is defined as the percentage of children aged 6 to 59 months whose weight for
height is below minus three standard deviations from the median of the WHO Child Growth Standards, or by a mid-upper-arm circumference less than 115 mm, with or without nutritional oedema.
• Overweight is defined as the percentage of children aged 0 to 59 months whose weight for height is above two standard deviations (overweight and obese) or above three standard deviations (obese) from the median of the WHO Child Growth Standards.
• Low birthweight is defined as a weight of less than 2,500 grams at birth.
BOX 2 Definitions of anthropometric indicators
Improving Child Nutrition8
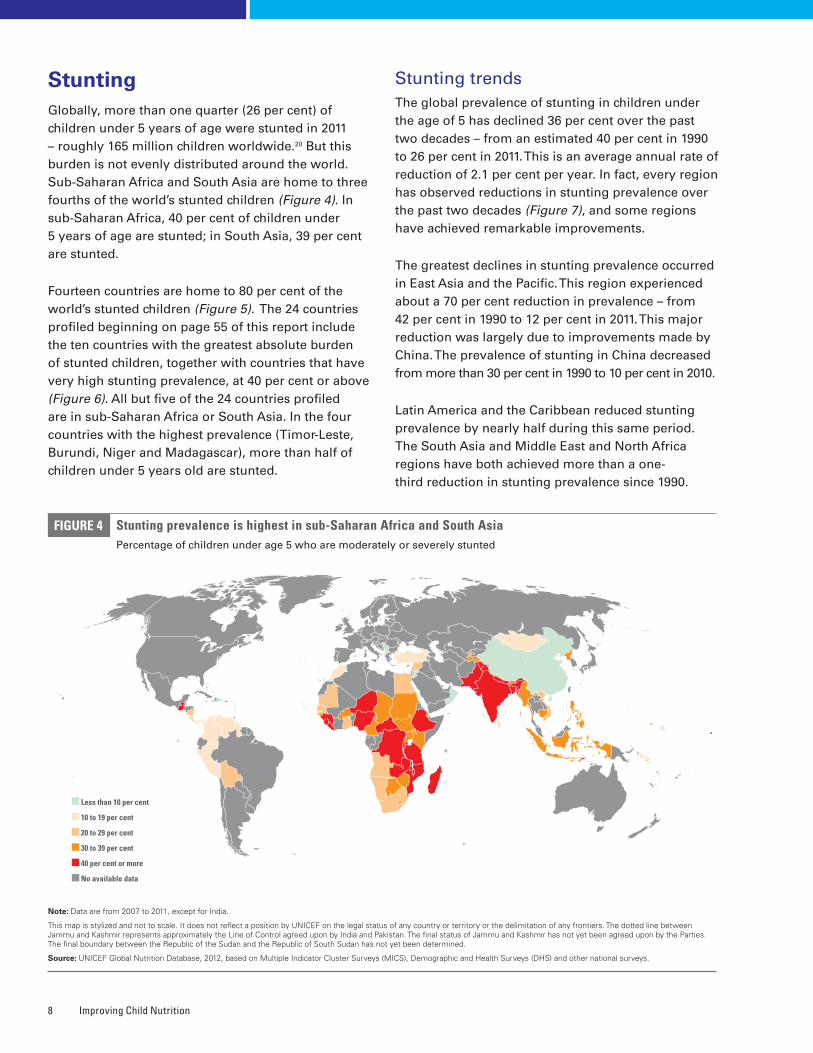
StuntingGlobally, more than one quarter (26 per cent) of children under 5 years of age were stunted in 2011 – roughly 165 million children worldwide.20 But this burden is not evenly distributed around the world. Sub-Saharan Africa and South Asia are home to three fourths of the world’s stunted children (Figure 4). In sub-Saharan Africa, 40 per cent of children under 5 years of age are stunted; in South Asia, 39 per cent are stunted.
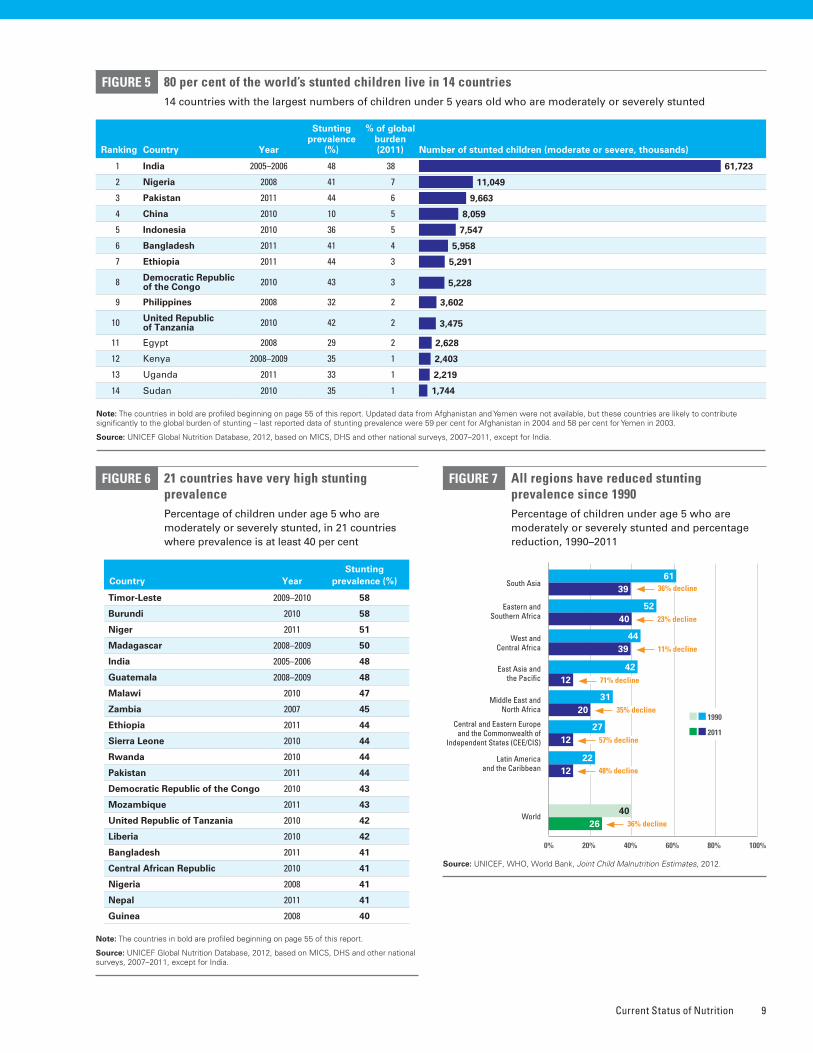
Fourteen countries are home to 80 per cent of the world’s stunted children (Figure 5). The 24 countries profiled beginning on page 55 of this report include the ten countries with the greatest absolute burden of stunted children, together with countries that have very high stunting prevalence, at 40 per cent or above (Figure 6). All but five of the 24 countries profiled are in sub-Saharan Africa or South Asia. In the four countries with the highest prevalence (Timor-Leste, Burundi, Niger and Madagascar), more than half of children under 5 years old are stunted.
Stunting trendsThe global prevalence of stunting in children under the age of 5 has declined 36 per cent over the past two decades – from an estimated 40 per cent in 1990 to 26 per cent in 2011. This is an average annual rate of reduction of 2.1 per cent per year. In fact, every region has observed reductions in stunting prevalence over the past two decades (Figure 7), and some regions have achieved remarkable improvements.
The greatest declines in stunting prevalence occurred in East Asia and the Pacific. This region experienced about a 70 per cent reduction in prevalence – from 42 per cent in 1990 to 12 per cent in 2011. This major reduction was largely due to improvements made by China. The prevalence of stunting in China decreased from more than 30 per cent in 1990 to 10 per cent in 2010.
Latin America and the Caribbean reduced stunting prevalence by nearly half during this same period. The South Asia and Middle East and North Africa regions have both achieved more than a one-third reduction in stunting prevalence since 1990.
FIGURE 4
Note: Data are from 2007 to 2011, except for India�
This map is stylized and not to scale� It does not reflect a position by UNICEF on the legal status of any country or territory or the delimitation of any frontiers� The dotted line between Jammu and Kashmir represents approximately the Line of Control agreed upon by India and Pakistan� The final status of Jammu and Kashmir has not yet been agreed upon by the Parties� The final boundary between the Republic of the Sudan and the Republic of South Sudan has not yet been determined�
Source: UNICEF Global Nutrition Database, 2012, based on Multiple Indicator Cluster Surveys (MICS), Demographic and Health Surveys (DHS) and other national surveys�
Stunting prevalence is highest in sub-Saharan Africa and South AsiaPercentage of children under age 5 who are moderately or severely stunted
Less than 10 per cent
10 to 19 per cent
20 to 29 per cent
30 to 39 per cent
40 per cent or more
No available data
Current Status of Nutrition 9
80 per cent of the world’s stunted children live in 14 countries14 countries with the largest numbers of children under 5 years old who are moderately or severely stunted
FIGURE 5
Note: The countries in bold are profiled beginning on page 55 of this report� Updated data from Afghanistan and Yemen were not available, but these countries are likely to contribute significantly to the global burden of stunting – last reported data of stunting prevalence were 59 per cent for Afghanistan in 2004 and 58 per cent for Yemen in 2003�
Source: UNICEF Global Nutrition Database, 2012, based on MICS, DHS and other national surveys, 2007–2011, except for India�
Ranking Country Year
Stunting prevalence
(%)
% of global burden (2011) Number of stunted children (moderate or severe, thousands)
1 India 2005–2006 48 38 61,723
2 Nigeria 2008 41 7 11,049
3 Pakistan 2011 44 6 9,663
4 China 2010 10 5 8,059
5 Indonesia 2010 36 5 7,547
6 Bangladesh 2011 41 4 5,958
7 Ethiopia 2011 44 3 5,291
8 Democratic Republic of the Congo 2010 43 3 5,228
9 Philippines 2008 32 2 3,602
10 United Republic of Tanzania 2010 42 2 3,475
11 Egypt 2008 29 2 2,628
12 Kenya 2008–2009 35 1 2,403
13 Uganda 2011 33 1 2,219
14 Sudan 2010 35 1 1,744
21 countries have very high stunting prevalence Percentage of children under age 5 who are moderately or severely stunted, in 21 countries where prevalence is at least 40 per cent
FIGURE 6
Note: The countries in bold are profiled beginning on page 55 of this report�
Source: UNICEF Global Nutrition Database, 2012, based on MICS, DHS and other national surveys, 2007–2011, except for India�
Country Year Stunting
prevalence (%)
Timor-Leste 2009–2010 58
Burundi 2010 58
Niger 2011 51
Madagascar 2008–2009 50
India 2005–2006 48
Guatemala 2008–2009 48
Malawi 2010 47
Zambia 2007 45
Ethiopia 2011 44
Sierra Leone 2010 44
Rwanda 2010 44
Pakistan 2011 44
Democratic Republic of the Congo 2010 43
Mozambique 2011 43
United Republic of Tanzania 2010 42
Liberia 2010 42
Bangladesh 2011 41
Central African Republic 2010 41
Nigeria 2008 41
Nepal 2011 41
Guinea 2008 40
FIGURE 7 All regions have reduced stunting prevalence since 1990Percentage of children under age 5 who are moderately or severely stunted and percentage reduction, 1990–2011
Source: UNICEF, WHO, World Bank, Joint Child Malnutrition Estimates, 2012�
2640
3961
4052
3944
1242
2031
1227
1222
0% 80%40%20% 60% 100%
South Asia
Latin America and the Caribbean
Central and Eastern Europe and the Commonwealth of
Independent States (CEE/CIS)
Middle East and North Africa
East Asia and the Pacific
West and Central Africa
Eastern and Southern Africa
World
1990
2011
36% decline
23% decline
11% decline
71% decline
35% decline
57% decline
48% decline
36% decline
Improving Child Nutrition10
However, progress in reducing stunting prevalence in sub-Saharan Africa was limited to 16 per cent, from 47 per cent in 1990 to 40 per cent in 2011. More than one third of countries in sub-Saharan Africa have very high stunting prevalence.
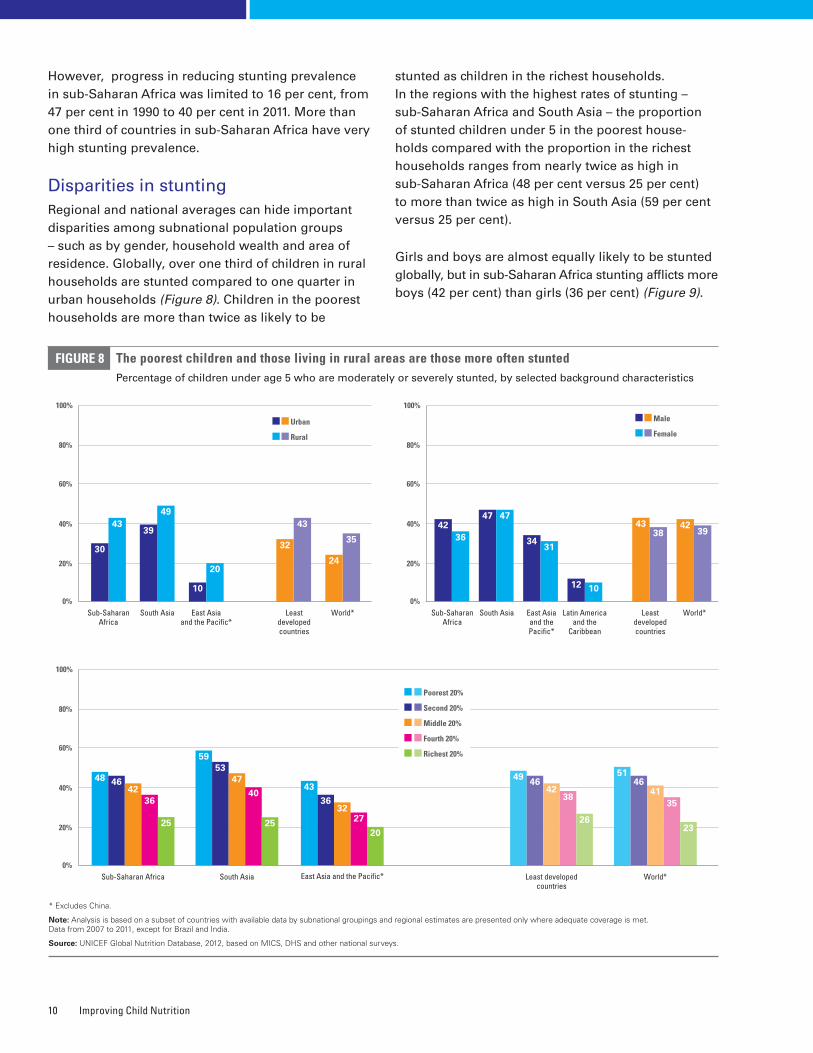
Disparities in stuntingRegional and national averages can hide important disparities among subnational population groups – such as by gender, household wealth and area of residence. Globally, over one third of children in rural households are stunted compared to one quarter in urban households (Figure 8). Children in the poorest households are more than twice as likely to be
stunted as children in the richest households. In the regions with the highest rates of stunting –sub-Saharan Africa and South Asia – the proportion of stunted children under 5 in the poorest house-holds compared with the proportion in the richest households ranges from nearly twice as high in sub-Saharan Africa (48 per cent versus 25 per cent) to more than twice as high in South Asia (59 per cent versus 25 per cent).
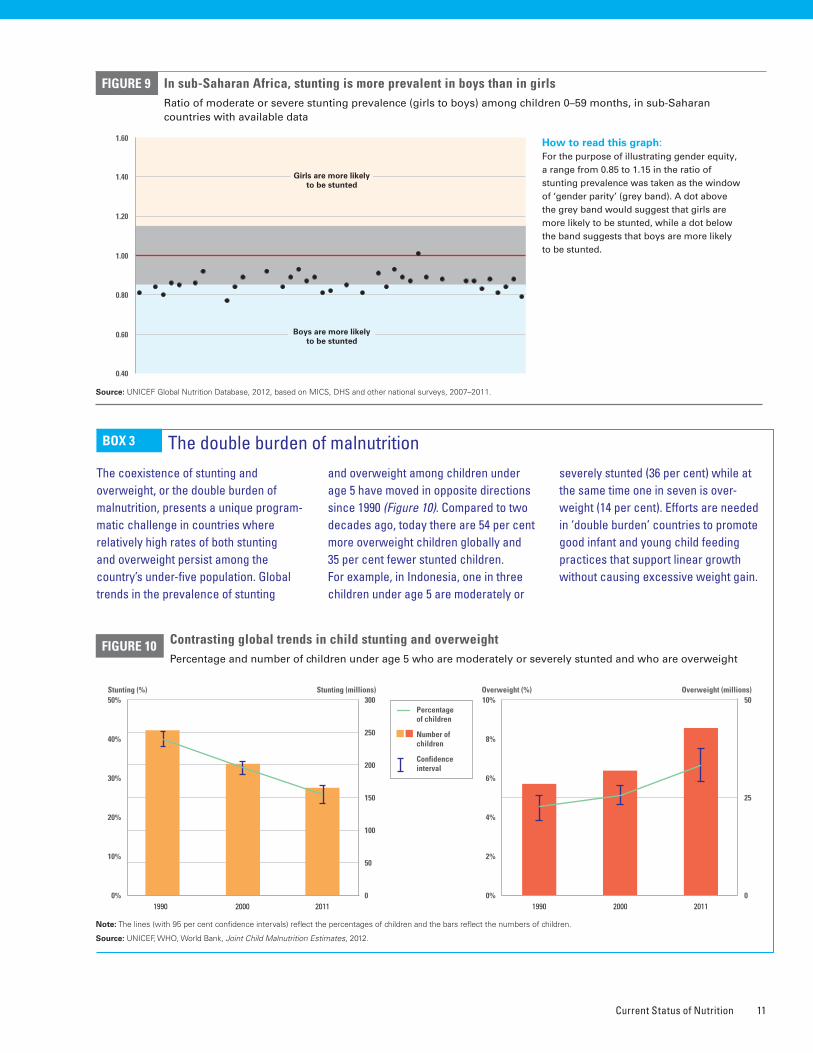
Girls and boys are almost equally likely to be stunted globally, but in sub-Saharan Africa stunting afflicts more boys (42 per cent) than girls (36 per cent) (Figure 9).
The poorest children and those living in rural areas are those more often stunted Percentage of children under age 5 who are moderately or severely stunted, by selected background characteristics
FIGURE 8
* Excludes China�
Note: Analysis is based on a subset of countries with available data by subnational groupings and regional estimates are presented only where adequate coverage is met� Data from 2007 to 2011, except for Brazil and India�
Source: UNICEF Global Nutrition Database, 2012, based on MICS, DHS and other national surveys�
0%
100%
80%
60%
40%
20%
South AsiaSub-Saharan Africa
Least developed countries
World*
35
24
43
32
49
3943
30
Urban
Rural
0%
100%
80%
60%
40%
20%
South AsiaSub-Saharan Africa
Least developed countries
East Asia and the Pacific*
4239
4338
3431
47 4742
36
0%
100%
80%
60%
40%
20%
South AsiaSub-Saharan Africa Least developed countries
World*
5146
4135
23
49 4642
38
26
43
3632
27
20
5953
47
40
25
48 4642
36
25
East Asia and the Pacific*
World*East Asia and the Pacific*
10
20
Male
Female
Latin America and the
Caribbean
12 10
Poorest 20%
Second 20%
Middle 20%
Fourth 20%
Richest 20%
Current Status of Nutrition 11
FIGURE 9 In sub-Saharan Africa, stunting is more prevalent in boys than in girlsRatio of moderate or severe stunting prevalence (girls to boys) among children 0–59 months, in sub-Saharan countries with available data
How to read this graph: For the purpose of illustrating gender equity, a range from 0.85 to 1.15 in the ratio of stunting prevalence was taken as the window of ‘gender parity’ (grey band). A dot above the grey band would suggest that girls are more likely to be stunted, while a dot below the band suggests that boys are more likely to be stunted.
0.40
1.60
1.40
1.20
1.00
0.80
0.60
Girls are more likely to be stunted
Boys are more likely to be stunted
The coexistence of stunting and overweight, or the double burden of malnutrition, presents a unique program-matic challenge in countries where relatively high rates of both stunting and overweight persist among the country’s under-five population. Global trends in the prevalence of stunting
and overweight among children under age 5 have moved in opposite directions since 1990 (Figure 10). Compared to two decades ago, today there are 54 per cent more overweight children globally and 35 per cent fewer stunted children. For example, in Indonesia, one in three children under age 5 are moderately or
severely stunted (36 per cent) while at the same time one in seven is over-weight (14 per cent). Efforts are needed in ‘double burden’ countries to promote good infant and young child feeding practices that support linear growth without causing excessive weight gain.
BOX 3 The double burden of malnutrition
Contrasting global trends in child stunting and overweight Percentage and number of children under age 5 who are moderately or severely stunted and who are overweight
FIGURE 10
Note: The lines (with 95 per cent confidence intervals) reflect the percentages of children and the bars reflect the numbers of children�
Source: UNICEF, WHO, World Bank, Joint Child Malnutrition Estimates, 2012�
0
300
250
200
150
50
100
0%
50%
40%
30%
20%
10%
20001990 2011
Stunting (millions)Stunting (%)
0
50
25
0%
10%
8%
6%
4%
2%
Overweight (millions)Overweight (%)
20001990 2011
Percentage of children
Number of children
Confidence interval
Source: UNICEF Global Nutrition Database, 2012, based on MICS, DHS and other national surveys, 2007–2011�
Improving Child Nutrition12
UnderweightGlobally in 2011, an estimated 101 million children under 5 years of age were underweight, or approxi-mately 16 per cent of children under 5. Underweight prevalence is highest in South Asia, which has a rate of 33 per cent, followed by sub-Saharan Africa, at 21 per cent. South Asia has 59 million underweight children, while sub-Saharan Africa has 30 million.
The prevalence of underweight children under age 5 is an indicator to measure progress towards MDG 1, which aims to halve the proportion of people who suffer from hunger between 1990 and 2015. Globally, underweight prevalence has declined, from 25 per cent in 1990 to 16 per cent today – a 37 per cent reduction. The greatest reductions have been achieved in Central and Eastern Europe and
the Commonwealth of Independent States, where prevalence has declined by 87 per cent, and in East Asia and the Pacific, where it fell 73 per cent (as with stunting, driven largely in the latter region by reductions made in China). In other regions, progress remained slow; in sub-Saharan Africa underweight prevalence dropped by 26 per cent.
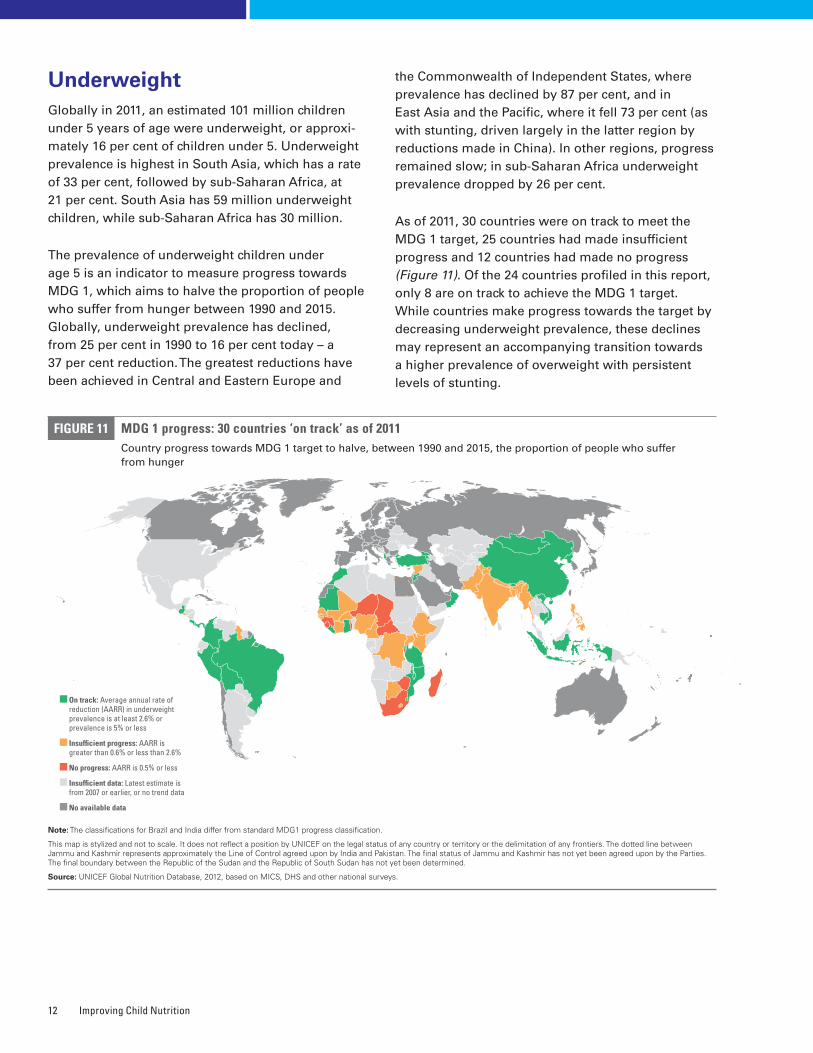
As of 2011, 30 countries were on track to meet the MDG 1 target, 25 countries had made insufficient progress and 12 countries had made no progress (Figure 11). Of the 24 countries profiled in this report, only 8 are on track to achieve the MDG 1 target. While countries make progress towards the target by decreasing underweight prevalence, these declines may represent an accompanying transition towards a higher prevalence of overweight with persistent levels of stunting.
FIGURE 11 MDG 1 progress: 30 countries ‘on track’ as of 2011 Country progress towards MDG 1 target to halve, between 1990 and 2015, the proportion of people who suffer from hunger
Note: The classifications for Brazil and India differ from standard MDG1 progress classification�
This map is stylized and not to scale� It does not reflect a position by UNICEF on the legal status of any country or territory or the delimitation of any frontiers� The dotted line between Jammu and Kashmir represents approximately the Line of Control agreed upon by India and Pakistan� The final status of Jammu and Kashmir has not yet been agreed upon by the Parties� The final boundary between the Republic of the Sudan and the Republic of South Sudan has not yet been determined�
Source: UNICEF Global Nutrition Database, 2012, based on MICS, DHS and other national surveys�
On track: Average annual rate of reduction (AARR) in underweight prevalence is at least 2.6% or prevalence is 5% or less
Insufficient progress: AARR is greater than 0.6% or less than 2.6%
No progress: AARR is 0.5% or less
Insufficient data: Latest estimate is from 2007 or earlier, or no trend data
No available data
Current Status of Nutrition 13
Some countries have low underweight prevalence but unacceptably high stunting rates. For example, in Guatemala, Liberia, Malawi, Mozambique, Rwanda, the United Republic of Tanzania and Zambia, child underweight prevalence is lower than 20 per cent, while stunting prevalence remains above 40 per cent. Of the countries that are on track to achieve MDG 1, many still have high stunting rates. Cambodia, Guatemala, Liberia, Malawi, Mozambique, Rwanda and the United Republic of Tanzania have very high stunting prevalence (at least 40 per cent), while remaining on track to achieve MDG 1. Greater efforts should be made in these countries to prevent stunting, because the lower levels of underweight prevalence mask the continued existence of undernu-trition during the crucial 1,000 days before the child’s second birthday, including the mother’s pregnancy.
WastingModerate and severe wasting represents an acute form of undernutrition, and children who suffer from it face a markedly increased risk of death. Globally in 2011, 52 million children under 5 years of age were moderately or severely wasted, an 11 per cent decrease from the estimated figure of 58 million in 1990. More than 29 million children under 5, an esti-mated 5 per cent, suffered from severe wasting.21
The highest wasting prevalence is in South Asia, where approximately one in six children (16 per cent) is moderately or severely wasted. The burden of wasting
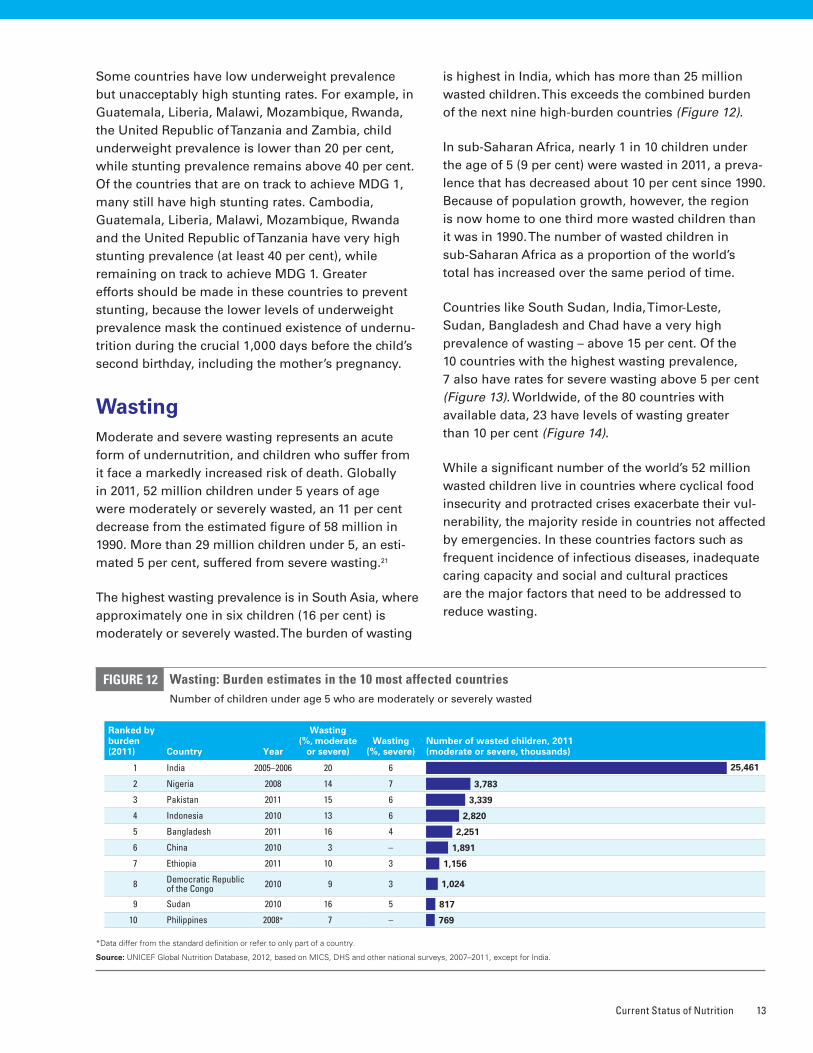
is highest in India, which has more than 25 million wasted children. This exceeds the combined burden of the next nine high-burden countries (Figure 12).
In sub-Saharan Africa, nearly 1 in 10 children under the age of 5 (9 per cent) were wasted in 2011, a preva-lence that has decreased about 10 per cent since 1990. Because of population growth, however, the region is now home to one third more wasted children than it was in 1990. The number of wasted children in sub-Saharan Africa as a proportion of the world’s total has increased over the same period of time.
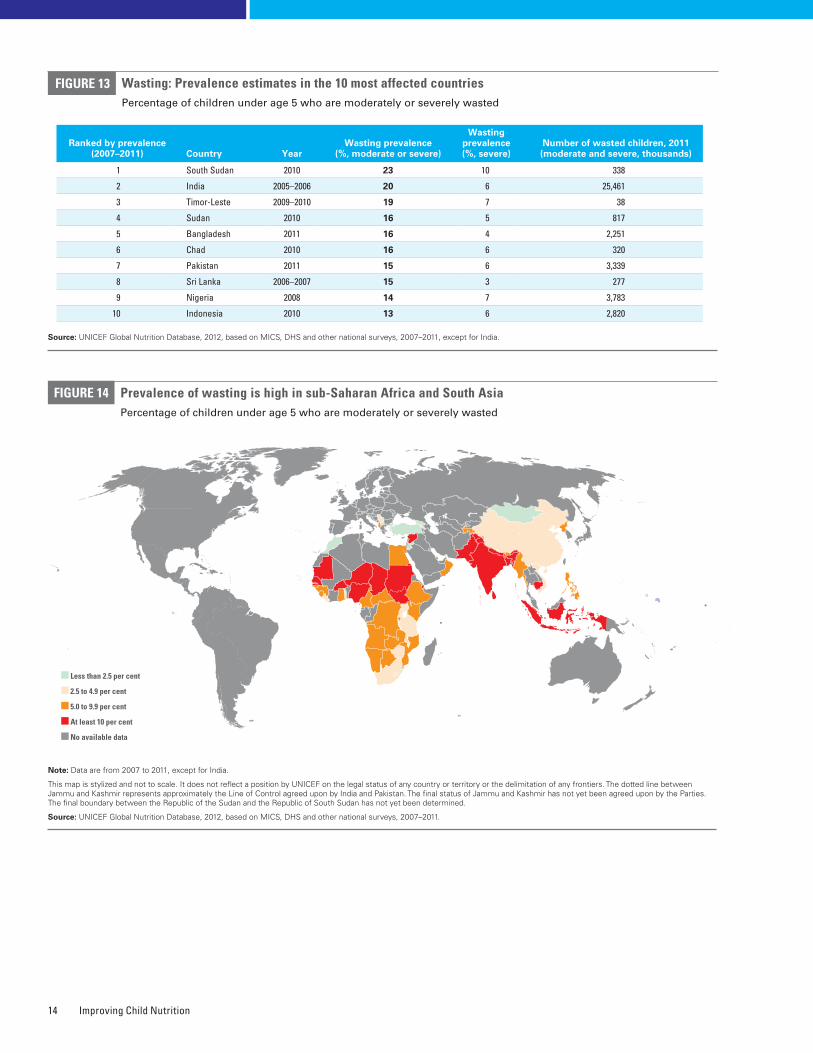
Countries like South Sudan, India, Timor-Leste, Sudan, Bangladesh and Chad have a very high prevalence of wasting – above 15 per cent. Of the 10 countries with the highest wasting prevalence, 7 also have rates for severe wasting above 5 per cent (Figure 13). Worldwide, of the 80 countries with available data, 23 have levels of wasting greater than 10 per cent (Figure 14).
While a significant number of the world’s 52 million wasted children live in countries where cyclical food insecurity and protracted crises exacerbate their vul-nerability, the majority reside in countries not affected by emergencies. In these countries factors such as frequent incidence of infectious diseases, inadequate caring capacity and social and cultural practices are the major factors that need to be addressed to reduce wasting.
*Data differ from the standard definition or refer to only part of a country�
Source: UNICEF Global Nutrition Database, 2012, based on MICS, DHS and other national surveys, 2007–2011, except for India�
Ranked by burden (2011) Country Year
Wasting (%, moderate
or severe)Wasting
(%, severe)Number of wasted children, 2011 (moderate or severe, thousands)
1 India 2005–2006 20 6 25,461
2 Nigeria 2008 14 7 3,783
3 Pakistan 2011 15 6 3,339
4 Indonesia 2010 13 6 2,820
5 Bangladesh 2011 16 4 2,251
6 China 2010 3 – 1,891
7 Ethiopia 2011 10 3 1,156
8 Democratic Republic of the Congo 2010 9 3 1,024
9 Sudan 2010 16 5 817
10 Philippines 2008* 7 – 769
Wasting: Burden estimates in the 10 most affected countriesNumber of children under age 5 who are moderately or severely wasted
FIGURE 12
Improving Child Nutrition14
Wasting: Prevalence estimates in the 10 most affected countriesPercentage of children under age 5 who are moderately or severely wasted
FIGURE 13
Ranked by prevalence (2007–2011) Country Year
Wasting prevalence (%, moderate or severe)
Wasting prevalence (%, severe)
Number of wasted children, 2011 (moderate and severe, thousands)
1 South Sudan 2010 23 10 338
2 India 2005–2006 20 6 25,461
3 Timor-Leste 2009–2010 19 7 38
4 Sudan 2010 16 5 817
5 Bangladesh 2011 16 4 2,251
6 Chad 2010 16 6 320
7 Pakistan 2011 15 6 3,339
8 Sri Lanka 2006–2007 15 3 277
9 Nigeria 2008 14 7 3,783
10 Indonesia 2010 13 6 2,820
Source: UNICEF Global Nutrition Database, 2012, based on MICS, DHS and other national surveys, 2007–2011, except for India�
FIGURE 14 Prevalence of wasting is high in sub-Saharan Africa and South Asia Percentage of children under age 5 who are moderately or severely wasted
Note: Data are from 2007 to 2011, except for India�
This map is stylized and not to scale� It does not reflect a position by UNICEF on the legal status of any country or territory or the delimitation of any frontiers� The dotted line between Jammu and Kashmir represents approximately the Line of Control agreed upon by India and Pakistan� The final status of Jammu and Kashmir has not yet been agreed upon by the Parties� The final boundary between the Republic of the Sudan and the Republic of South Sudan has not yet been determined�
Source: UNICEF Global Nutrition Database, 2012, based on MICS, DHS and other national surveys, 2007–2011�
Less than 2.5 per cent
2.5 to 4.9 per cent
5.0 to 9.9 per cent
At least 10 per cent
No available data
Current Status of Nutrition 15
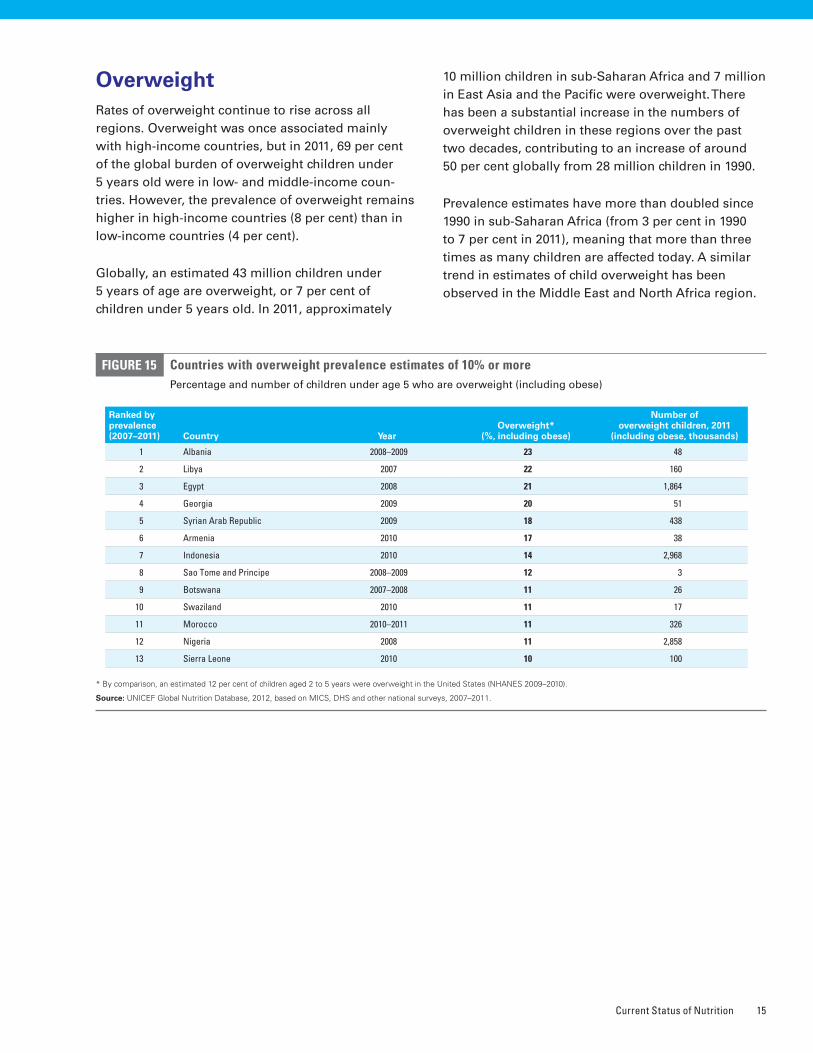
Countries with overweight prevalence estimates of 10% or morePercentage and number of children under age 5 who are overweight (including obese)
FIGURE 15
* By comparison, an estimated 12 per cent of children aged 2 to 5 years were overweight in the United States (NHANES 2009–2010)�
Source: UNICEF Global Nutrition Database, 2012, based on MICS, DHS and other national surveys, 2007–2011�
Ranked by prevalence (2007–2011) Country Year
Overweight* (%, including obese)
Number of overweight children, 2011
(including obese, thousands)
1 Albania 2008–2009 23 48
2 Libya 2007 22 160
3 Egypt 2008 21 1,864
4 Georgia 2009 20 51
5 Syrian Arab Republic 2009 18 438
6 Armenia 2010 17 38
7 Indonesia 2010 14 2,968
8 Sao Tome and Principe 2008–2009 12 3
9 Botswana 2007–2008 11 26
10 Swaziland 2010 11 17
11 Morocco 2010–2011 11 326
12 Nigeria 2008 11 2,858
13 Sierra Leone 2010 10 100
OverweightRates of overweight continue to rise across all regions. Overweight was once associated mainly with high-income countries, but in 2011, 69 per cent of the global burden of overweight children under 5 years old were in low- and middle-income coun-tries. However, the prevalence of overweight remains higher in high-income countries (8 per cent) than in low-income countries (4 per cent).
Globally, an estimated 43 million children under 5 years of age are overweight, or 7 per cent of children under 5 years old. In 2011, approximately
10 million children in sub-Saharan Africa and 7 million in East Asia and the Pacific were overweight. There has been a substantial increase in the numbers of overweight children in these regions over the past two decades, contributing to an increase of around 50 per cent globally from 28 million children in 1990.
Prevalence estimates have more than doubled since 1990 in sub-Saharan Africa (from 3 per cent in 1990 to 7 per cent in 2011), meaning that more than three times as many children are affected today. A similar trend in estimates of child overweight has been observed in the Middle East and North Africa region.
Improving Child Nutrition16
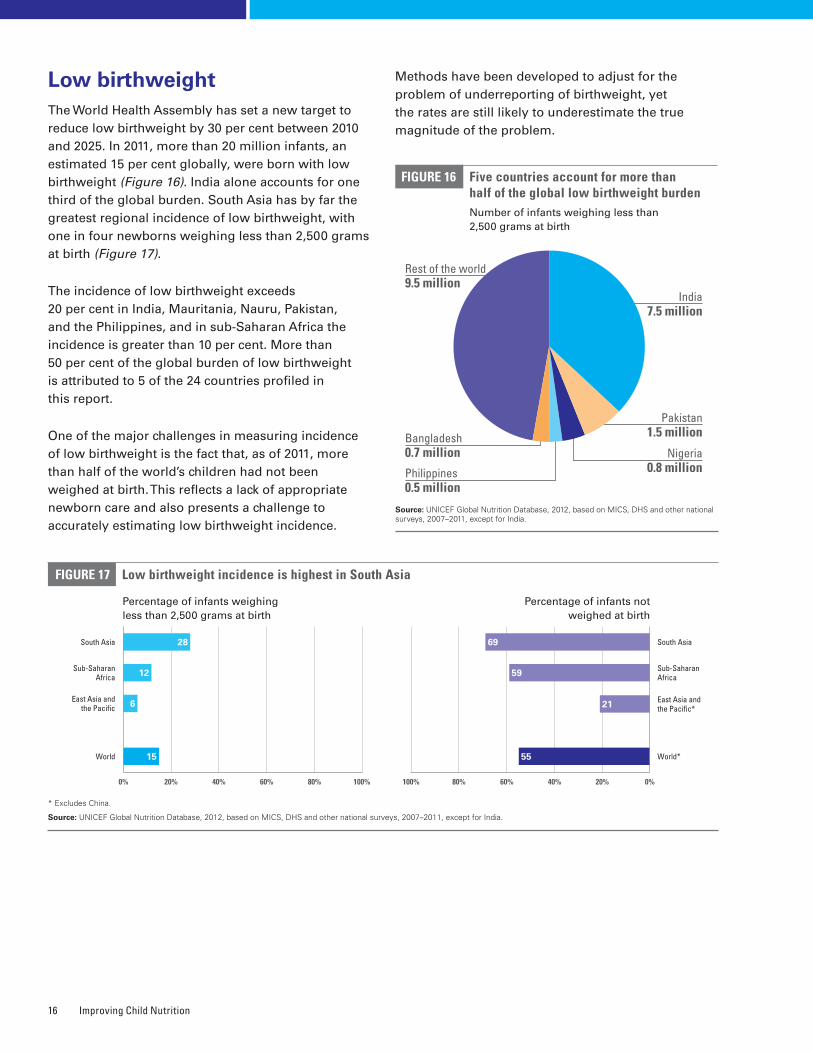
Low birthweightThe World Health Assembly has set a new target to reduce low birthweight by 30 per cent between 2010 and 2025. In 2011, more than 20 million infants, an estimated 15 per cent globally, were born with low birthweight (Figure 16). India alone accounts for one third of the global burden. South Asia has by far the greatest regional incidence of low birthweight, with one in four newborns weighing less than 2,500 grams at birth (Figure 17).
The incidence of low birthweight exceeds 20 per cent in India, Mauritania, Nauru, Pakistan, and the Philippines, and in sub-Saharan Africa the incidence is greater than 10 per cent. More than 50 per cent of the global burden of low birthweight is attributed to 5 of the 24 countries profiled in this report.
One of the major challenges in measuring incidence of low birthweight is the fact that, as of 2011, more than half of the world’s children had not been weighed at birth. This reflects a lack of appropriate newborn care and also presents a challenge to accurately estimating low birthweight incidence.
Methods have been developed to adjust for the problem of underreporting of birthweight, yet the rates are still likely to underestimate the true magnitude of the problem.
Source: UNICEF Global Nutrition Database, 2012, based on MICS, DHS and other national surveys, 2007–2011, except for India�
FIGURE 16 Five countries account for more than half of the global low birthweight burdenNumber of infants weighing less than 2,500 grams at birth
India 7.5 million
Rest of the world 9.5 million
Pakistan 1.5 million
Nigeria 0.8 millionPhilippines
0.5 million
Low birthweight incidence is highest in South AsiaFIGURE 17
* Excludes China�
Source: UNICEF Global Nutrition Database, 2012, based on MICS, DHS and other national surveys, 2007–2011, except for India�
Percentage of infants not weighed at birth
Percentage of infants weighing less than 2,500 grams at birth
South Asia
Sub-Saharan Africa
East Asia and the Pacific*
World*
0%40% 20%60%
South Asia
Sub-Saharan Africa
East Asia and the Pacific
World
100%0% 80%40%20% 60%
15
6
28
12
100% 80%
69
59
21
55
Bangladesh 0.7 million
Chapter
Interventions to Address Stunting and Other Forms of Undernutrition 17
4INTERVENTIONS TO ADDRESS STUNTING AND OTHER FORMS OF UNDERNUTRITION
Nutrition-specific interventions are actions that have a direct impact on the prevention
and treatment of undernutrition, in particular during the 1,000 days covering pregnancy
and the child’s first two years� These interventions should be complemented by broader,
nutrition-sensitive approaches that have an indirect impact on nutrition status� Equity
considerations in nutrition programming are particularly important, as stunting and other
forms of undernutrition afflict the most vulnerable populations�
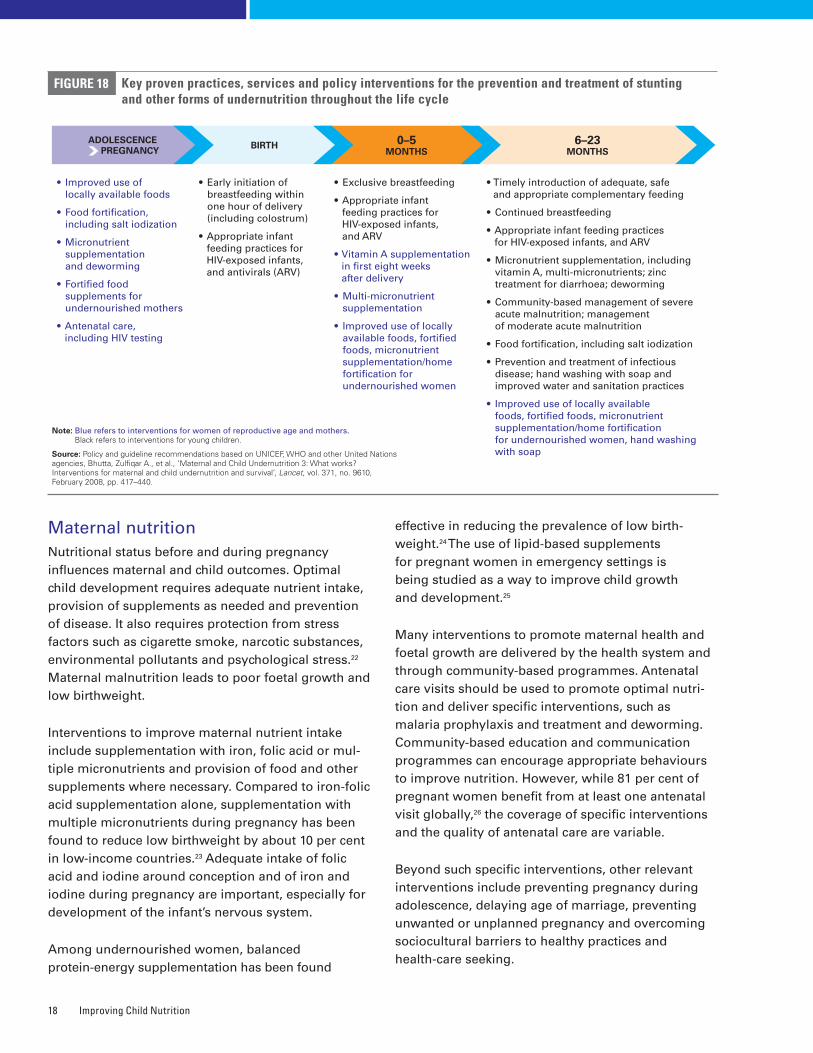
Nutrition-specific interventionsPromoting optimal nutrition practices, meeting micronutrient requirements and preventing and treating severe acute malnutrition are key goals for nutrition programming (Figure 18). The 2009 Tracking Progress on Child and Maternal Nutrition report summarized the evidence base for nutrition-specific interventions. Taking a life-cycle approach, the activities fall broadly into the following categories:
• Maternal nutrition and prevention of low birthweight
• Infant and young child feeding (IYCF)
• Breastfeeding, with early initiation (within one hour of birth) and continued exclusive breastfeeding for the first six months followed by continued breastfeeding up to 2 years
• Safe, timely, adequate and appropriate complementary feeding from 6 months onwards
• Prevention and treatment of micronutrient deficiencies
• Prevention and treatment of severe acute malnutrition
• Promotion of good sanitation practices and access to clean drinking water
• Promotion of healthy practices and appropriate use of health services
Improving Child Nutrition18
Maternal nutritionNutritional status before and during pregnancy influences maternal and child outcomes. Optimal child development requires adequate nutrient intake, provision of supplements as needed and prevention of disease. It also requires protection from stress factors such as cigarette smoke, narcotic substances, environmental pollutants and psychological stress.22 Maternal malnutrition leads to poor foetal growth and low birthweight.
Interventions to improve maternal nutrient intake include supplementation with iron, folic acid or mul-tiple micronutrients and provision of food and other supplements where necessary. Compared to iron-folic acid supplementation alone, supplementation with multiple micronutrients during pregnancy has been found to reduce low birthweight by about 10 per cent in low-income countries.23 Adequate intake of folic acid and iodine around conception and of iron and iodine during pregnancy are important, especially for development of the infant’s nervous system.
Among undernourished women, balanced protein-energy supplementation has been found
effective in reducing the prevalence of low birth-weight.24 The use of lipid-based supplements for pregnant women in emergency settings is being studied as a way to improve child growth and development.25
Many interventions to promote maternal health and foetal growth are delivered by the health system and through community-based programmes. Antenatal care visits should be used to promote optimal nutri-tion and deliver specific interventions, such as malaria prophylaxis and treatment and deworming. Community-based education and communication programmes can encourage appropriate behaviours to improve nutrition. However, while 81 per cent of pregnant women benefit from at least one antenatal visit globally,26 the coverage of specific interventions and the quality of antenatal care are variable.
Beyond such specific interventions, other relevant interventions include preventing pregnancy during adolescence, delaying age of marriage, preventing unwanted or unplanned pregnancy and overcoming sociocultural barriers to healthy practices and health-care seeking.
ADOLESCENCE PREGNANCY BIRTH 0–5
MONTHS6–23
MONTHS
Key proven practices, services and policy interventions for the prevention and treatment of stunting and other forms of undernutrition throughout the life cycle
FIGURE 18
Note: Blue refers to interventions for women of reproductive age and mothers. Black refers to interventions for young children�
Source: Policy and guideline recommendations based on UNICEF, WHO and other United Nations agencies, Bhutta, Zulfiqar A�, et al�, ‘Maternal and Child Undernutrition 3: What works? Interventions for maternal and child undernutrition and survival’, Lancet, vol� 371, no� 9610, February 2008, pp� 417–440�
• Improved use of locally available foods
• Food fortification, including salt iodization
• Micronutrient supplementation and deworming
• Fortified food supplements for undernourished mothers
• Antenatal care, including HIV testing
• Early initiation of breastfeeding within one hour of delivery (including colostrum)
• Appropriate infant feeding practices for HIV-exposed infants, and antivirals (ARV)
• Exclusive breastfeeding
• Appropriate infant feeding practices for HIV-exposed infants, and ARV
• Vitamin A supplementation in first eight weeks after delivery
• Multi-micronutrient supplementation
• Improved use of locally available foods, fortified foods, micronutrient supplementation/home fortification for undernourished women
• Timely introduction of adequate, safe and appropriate complementary feeding
• Continued breastfeeding
• Appropriate infant feeding practices for HIV-exposed infants, and ARV
• Micronutrient supplementation, including vitamin A, multi-micronutrients; zinc treatment for diarrhoea; deworming
• Community-based management of severe acute malnutrition; management of moderate acute malnutrition
• Food fortification, including salt iodization
• Prevention and treatment of infectious disease; hand washing with soap and improved water and sanitation practices
• Improved use of locally available foods, fortified foods, micronutrient supplementation/home fortification for undernourished women, hand washing with soap
Interventions to Address Stunting and Other Forms of Undernutrition 19
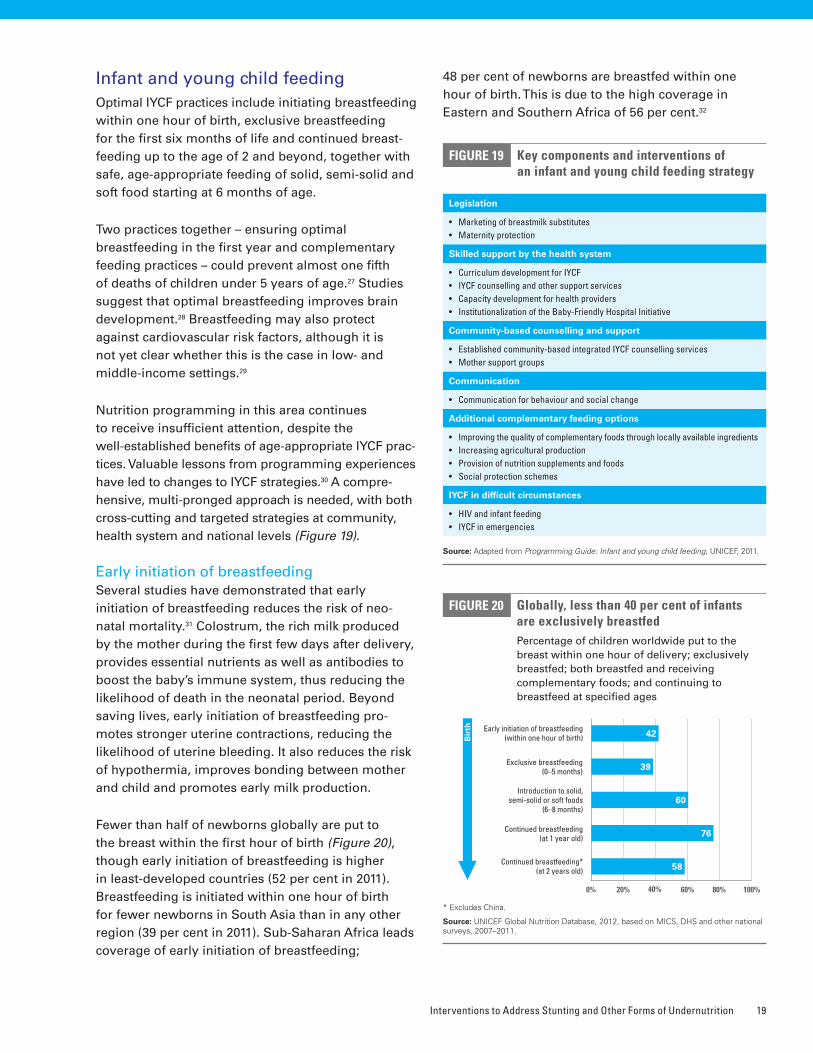
Infant and young child feedingOptimal IYCF practices include initiating breastfeeding within one hour of birth, exclusive breastfeeding for the first six months of life and continued breast-feeding up to the age of 2 and beyond, together with safe, age-appropriate feeding of solid, semi-solid and soft food starting at 6 months of age.
Two practices together – ensuring optimal breastfeeding in the first year and complementary feeding practices – could prevent almost one fifth of deaths of children under 5 years of age.27 Studies suggest that optimal breastfeeding improves brain development.28 Breastfeeding may also protect against cardiovascular risk factors, although it is not yet clear whether this is the case in low- and middle-income settings.29
Nutrition programming in this area continues to receive insufficient attention, despite the well-established benefits of age-appropriate IYCF prac-tices. Valuable lessons from programming experiences have led to changes to IYCF strategies.30 A compre-hensive, multi-pronged approach is needed, with both cross-cutting and targeted strategies at community, health system and national levels (Figure 19).
Early initiation of breastfeedingSeveral studies have demonstrated that early initiation of breastfeeding reduces the risk of neo-natal mortality.31 Colostrum, the rich milk produced by the mother during the first few days after delivery, provides essential nutrients as well as antibodies to boost the baby’s immune system, thus reducing the likelihood of death in the neonatal period. Beyond saving lives, early initiation of breastfeeding pro-motes stronger uterine contractions, reducing the likelihood of uterine bleeding. It also reduces the risk of hypothermia, improves bonding between mother and child and promotes early milk production.
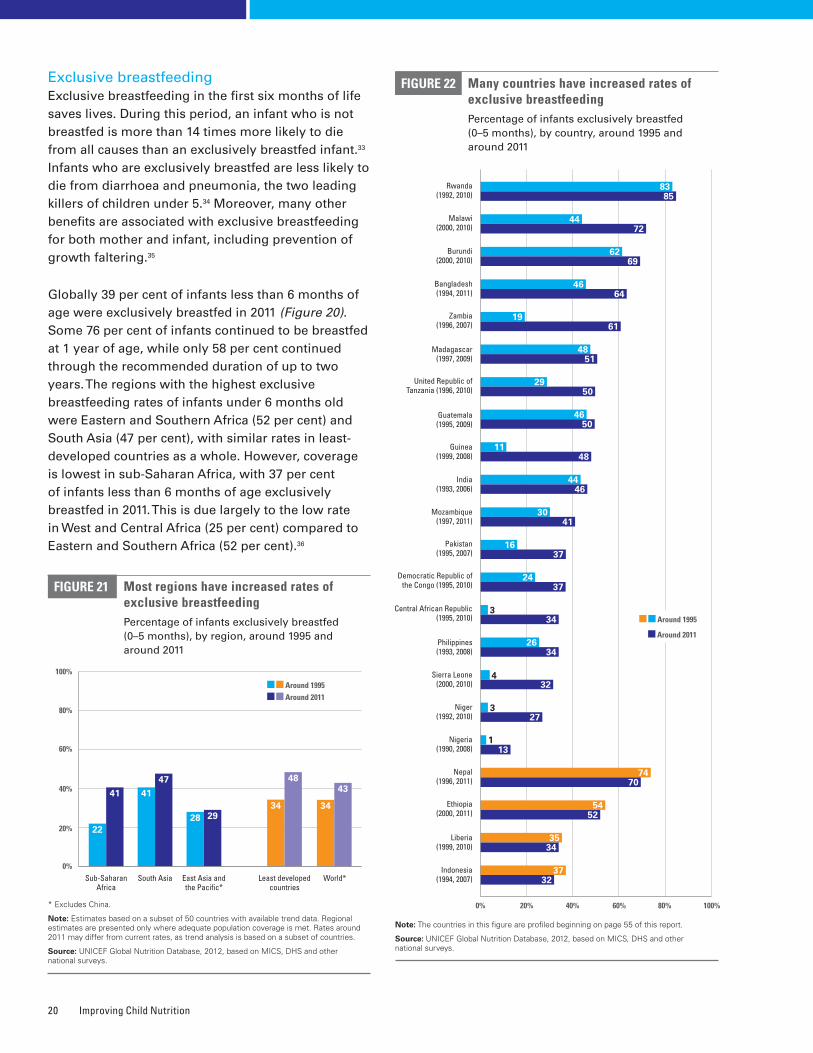
Fewer than half of newborns globally are put to the breast within the first hour of birth (Figure 20), though early initiation of breastfeeding is higher in least-developed countries (52 per cent in 2011). Breastfeeding is initiated within one hour of birth for fewer newborns in South Asia than in any other region (39 per cent in 2011). Sub-Saharan Africa leads coverage of early initiation of breastfeeding;
48 per cent of newborns are breastfed within one hour of birth. This is due to the high coverage in Eastern and Southern Africa of 56 per cent.32
Key components and interventions of an infant and young child feeding strategy
FIGURE 19
Source: Adapted from Programming Guide: Infant and young child feeding, UNICEF, 2011�
Legislation
• Marketingofbreastmilksubstitutes• Maternityprotection
Skilled support by the health system
• CurriculumdevelopmentforIYCF• IYCFcounsellingandothersupportservices• Capacitydevelopmentforhealthproviders• InstitutionalizationoftheBaby-FriendlyHospitalInitiative
Community-based counselling and support
• Establishedcommunity-basedintegratedIYCFcounsellingservices• Mothersupportgroups
Communication
• Communicationforbehaviourandsocialchange
Additional complementary feeding options
• Improvingthequalityofcomplementaryfoodsthroughlocallyavailableingredients• Increasingagriculturalproduction• Provisionofnutritionsupplementsandfoods• Socialprotectionschemes
IYCF in difficult circumstances
• HIVandinfantfeeding• IYCFinemergencies
Globally, less than 40 per cent of infants are exclusively breastfed Percentage of children worldwide put to the breast within one hour of delivery; exclusively breastfed; both breastfed and receiving complementary foods; and continuing to breastfeed at specified ages
FIGURE 20
* Excludes China�
Source: UNICEF Global Nutrition Database, 2012, based on MICS, DHS and other national surveys, 2007–2011�
0% 80%40%20% 60%
Early initiation of breastfeeding (within one hour of birth) 42
Exclusive breastfeeding (0–5 months) 39
Introduction to solid, semi-solid or soft foods
(6–8 months)60
Continued breastfeeding (at 1 year old) 76
Continued breastfeeding* (at 2 years old) 58
Bir
th
100%
Improving Child Nutrition20
Exclusive breastfeedingExclusive breastfeeding in the first six months of life saves lives. During this period, an infant who is not breastfed is more than 14 times more likely to die from all causes than an exclusively breastfed infant.33 Infants who are exclusively breastfed are less likely to die from diarrhoea and pneumonia, the two leading killers of children under 5.34 Moreover, many other benefits are associated with exclusive breastfeeding for both mother and infant, including prevention of growth faltering.35
Globally 39 per cent of infants less than 6 months of age were exclusively breastfed in 2011 (Figure 20). Some 76 per cent of infants continued to be breastfed at 1 year of age, while only 58 per cent continued through the recommended duration of up to two years. The regions with the highest exclusive breastfeeding rates of infants under 6 months old were Eastern and Southern Africa (52 per cent) and South Asia (47 per cent), with similar rates in least-developed countries as a whole. However, coverage is lowest in sub-Saharan Africa, with 37 per cent of infants less than 6 months of age exclusively breastfed in 2011. This is due largely to the low rate in West and Central Africa (25 per cent) compared to Eastern and Southern Africa (52 per cent).36
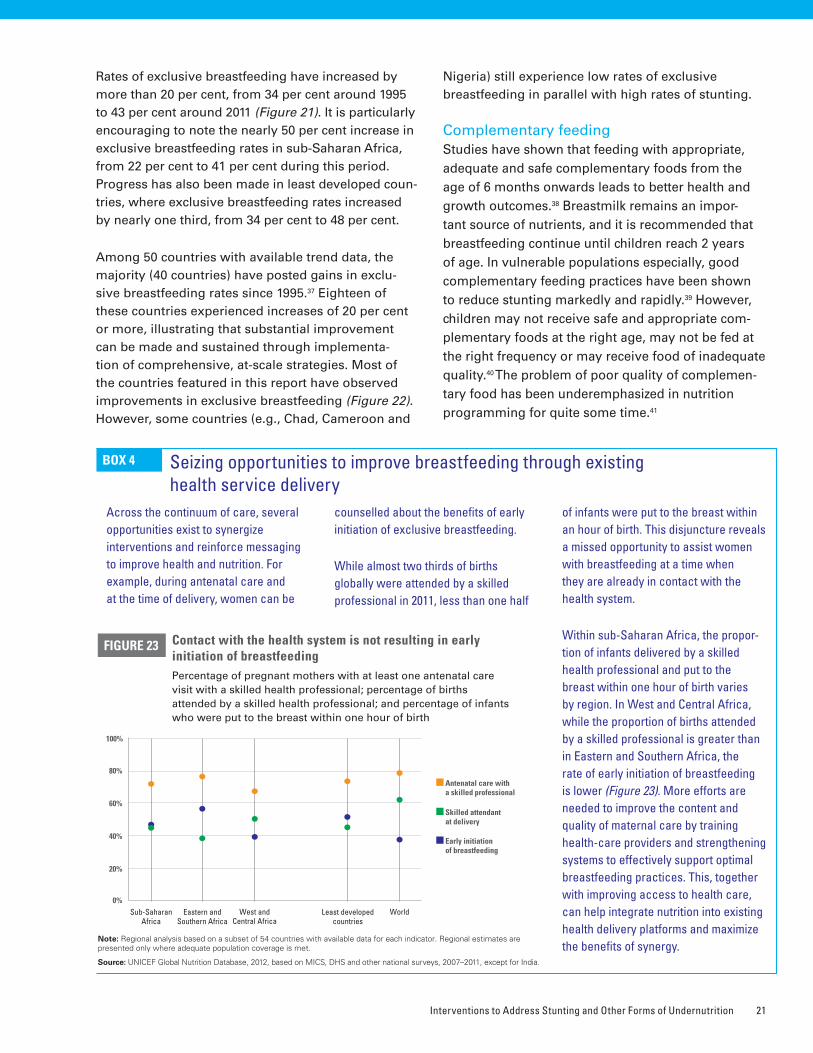
Many countries have increased rates of exclusive breastfeedingPercentage of infants exclusively breastfed (0–5 months), by country, around 1995 and around 2011
FIGURE 22
Note: The countries in this figure are profiled beginning on page 55 of this report�
Source: UNICEF Global Nutrition Database, 2012, based on MICS, DHS and other national surveys�
0% 80%40%20% 60% 100%
Indonesia (1994, 2007)
3732
Liberia (1999, 2010)
3534
Ethiopia (2000, 2011)
5452
Nepal (1996, 2011)
7470
United Republic of Tanzania (1996, 2010)
2950
Madagascar (1997, 2009)
4851
Zambia (1996, 2007)
1961
Bangladesh (1994, 2011)
4664
Burundi (2000, 2010)
6269
Malawi (2000, 2010)
4472
Rwanda (1992, 2010)
8385
Nigeria (1990, 2008) 13
1
Philippines (1993, 2008)
2634
Democratic Republic of the Congo (1995, 2010)
2437
Pakistan (1995, 2007)
1637
Mozambique (1997, 2011)
3041
India (1993, 2006)
4446
Guinea (1999, 2008)
1148
Guatemala (1995, 2009)
4650
Niger (1992, 2010) 27
3
Sierra Leone (2000, 2010) 32
4
Central African Republic (1995, 2010) 34
3 Around 1995
Around 2011
Around 1995 Around 2011
Most regions have increased rates of exclusive breastfeedingPercentage of infants exclusively breastfed (0–5 months), by region, around 1995 and around 2011
FIGURE 21
* Excludes China�
Note: Estimates based on a subset of 50 countries with available trend data� Regional estimates are presented only where adequate population coverage is met� Rates around 2011 may differ from current rates, as trend analysis is based on a subset of countries�
Source: UNICEF Global Nutrition Database, 2012, based on MICS, DHS and other national surveys�
0%
60%
40%
20%
East Asia and the Pacific*
2928
South Asia
4741
Sub-Saharan Africa
41
22
Least developed countries
34
48
World*
34
43
80%
100%
Interventions to Address Stunting and Other Forms of Undernutrition 21
Rates of exclusive breastfeeding have increased by more than 20 per cent, from 34 per cent around 1995 to 43 per cent around 2011 (Figure 21). It is particularly encouraging to note the nearly 50 per cent increase in exclusive breastfeeding rates in sub-Saharan Africa, from 22 per cent to 41 per cent during this period. Progress has also been made in least developed coun-tries, where exclusive breastfeeding rates increased by nearly one third, from 34 per cent to 48 per cent.
Among 50 countries with available trend data, the majority (40 countries) have posted gains in exclu-sive breastfeeding rates since 1995.37 Eighteen of these countries experienced increases of 20 per cent or more, illustrating that substantial improvement can be made and sustained through implementa-tion of comprehensive, at-scale strategies. Most of the countries featured in this report have observed improvements in exclusive breastfeeding (Figure 22). However, some countries (e.g., Chad, Cameroon and
Nigeria) still experience low rates of exclusive breastfeeding in parallel with high rates of stunting.
Complementary feedingStudies have shown that feeding with appropriate, adequate and safe complementary foods from the age of 6 months onwards leads to better health and growth outcomes.38 Breastmilk remains an impor-tant source of nutrients, and it is recommended that breastfeeding continue until children reach 2 years of age. In vulnerable populations especially, good complementary feeding practices have been shown to reduce stunting markedly and rapidly.39 However, children may not receive safe and appropriate com-plementary foods at the right age, may not be fed at the right frequency or may receive food of inadequate quality.40 The problem of poor quality of complemen-tary food has been underemphasized in nutrition programming for quite some time.41
BOX 4 Seizing opportunities to improve breastfeeding through existing health service delivery
Across the continuum of care, several opportunities exist to synergize interventions and reinforce messaging to improve health and nutrition. For example, during antenatal care and at the time of delivery, women can be
counselled about the benefits of early initiation of exclusive breastfeeding.
While almost two thirds of births globally were attended by a skilled professional in 2011, less than one half
of infants were put to the breast within an hour of birth. This disjuncture reveals a missed opportunity to assist women with breastfeeding at a time when they are already in contact with the health system.
Within sub-Saharan Africa, the propor-tion of infants delivered by a skilled health professional and put to the breast within one hour of birth varies by region. In West and Central Africa, while the proportion of births attended by a skilled professional is greater than in Eastern and Southern Africa, the rate of early initiation of breastfeeding is lower (Figure 23). More efforts are needed to improve the content and quality of maternal care by training health-care providers and strengthening systems to effectively support optimal breastfeeding practices. This, together with improving access to health care, can help integrate nutrition into existing health delivery platforms and maximize the benefits of synergy.
Contact with the health system is not resulting in early initiation of breastfeedingPercentage of pregnant mothers with at least one antenatal care visit with a skilled health professional; percentage of births attended by a skilled health professional; and percentage of infants who were put to the breast within one hour of birth
FIGURE 23
Note: Regional analysis based on a subset of 54 countries with available data for each indicator� Regional estimates are presented only where adequate population coverage is met�
Source: UNICEF Global Nutrition Database, 2012, based on MICS, DHS and other national surveys, 2007–2011, except for India�
Early initiation of breastfeeding
Skilled attendant at delivery
0%
100%
80%
60%
40%
20%
Antenatal care with a skilled professional
Sub-Saharan Africa
Eastern and Southern Africa
West and Central Africa
Least developed countries
World
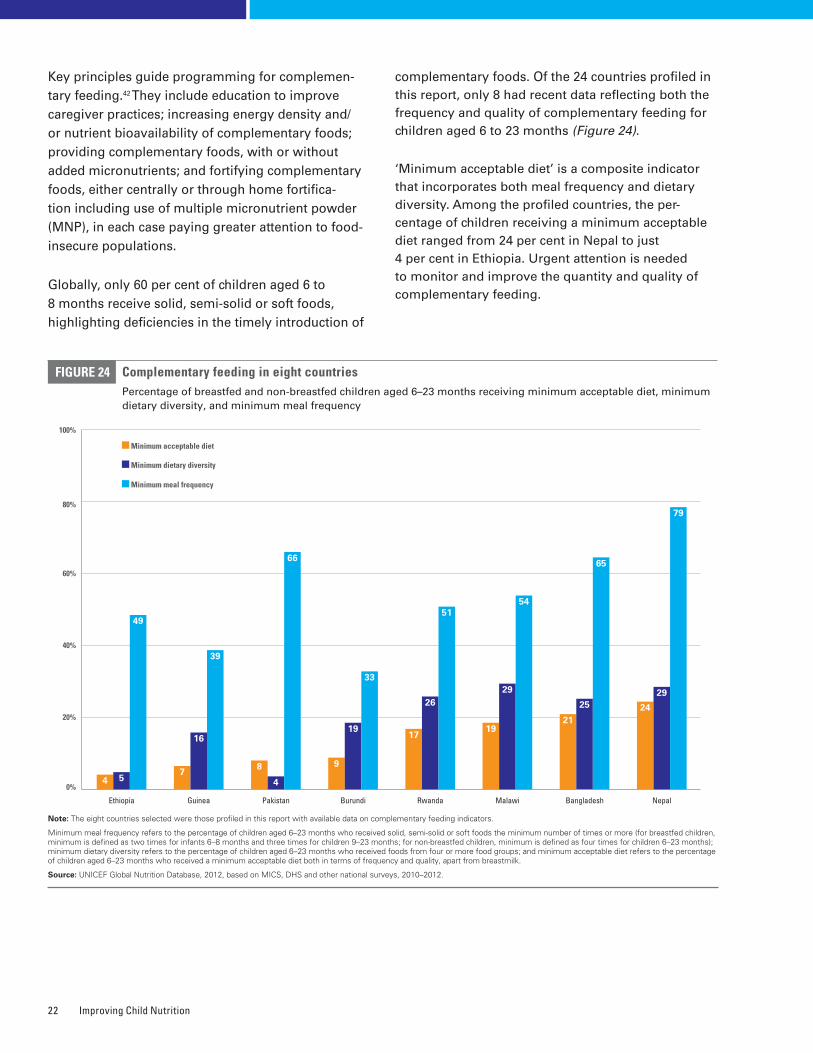
Improving Child Nutrition22
Key principles guide programming for complemen-tary feeding.42 They include education to improve caregiver practices; increasing energy density and/or nutrient bioavailability of complementary foods; providing complementary foods, with or without added micronutrients; and fortifying complementary foods, either centrally or through home fortifica-tion including use of multiple micronutrient powder (MNP), in each case paying greater attention to food-insecure populations.
Globally, only 60 per cent of children aged 6 to 8 months receive solid, semi-solid or soft foods, highlighting deficiencies in the timely introduction of
complementary foods. Of the 24 countries profiled in this report, only 8 had recent data reflecting both the frequency and quality of complementary feeding for children aged 6 to 23 months (Figure 24).
‘Minimum acceptable diet’ is a composite indicator that incorporates both meal frequency and dietary diversity. Among the profiled countries, the per-centage of children receiving a minimum acceptable diet ranged from 24 per cent in Nepal to just 4 per cent in Ethiopia. Urgent attention is needed to monitor and improve the quantity and quality of complementary feeding.
Complementary feeding in eight countriesPercentage of breastfed and non-breastfed children aged 6–23 months receiving minimum acceptable diet, minimum dietary diversity, and minimum meal frequency
FIGURE 24
Note: The eight countries selected were those profiled in this report with available data on complementary feeding indicators�
Minimum meal frequency refers to the percentage of children aged 6–23 months who received solid, semi-solid or soft foods the minimum number of times or more (for breastfed children, minimum is defined as two times for infants 6–8 months and three times for children 9–23 months; for non-breastfed children, minimum is defined as four times for children 6–23 months); minimum dietary diversity refers to the percentage of children aged 6–23 months who received foods from four or more food groups; and minimum acceptable diet refers to the percentage of children aged 6–23 months who received a minimum acceptable diet both in terms of frequency and quality, apart from breastmilk�
Source: UNICEF Global Nutrition Database, 2012, based on MICS, DHS and other national surveys, 2010–2012�
0%
40%
20% 21
25
65
Bangladesh
60%
80%
9
19
33
Burundi
4 5
49
Ethiopia
7
16
39
Guinea
19
29
54
Malawi
24
29
79
Nepal
8
4
66
Pakistan
17
26
51
Rwanda
Minimum meal frequency
Minimum dietary diversity
Minimum acceptable diet
100%
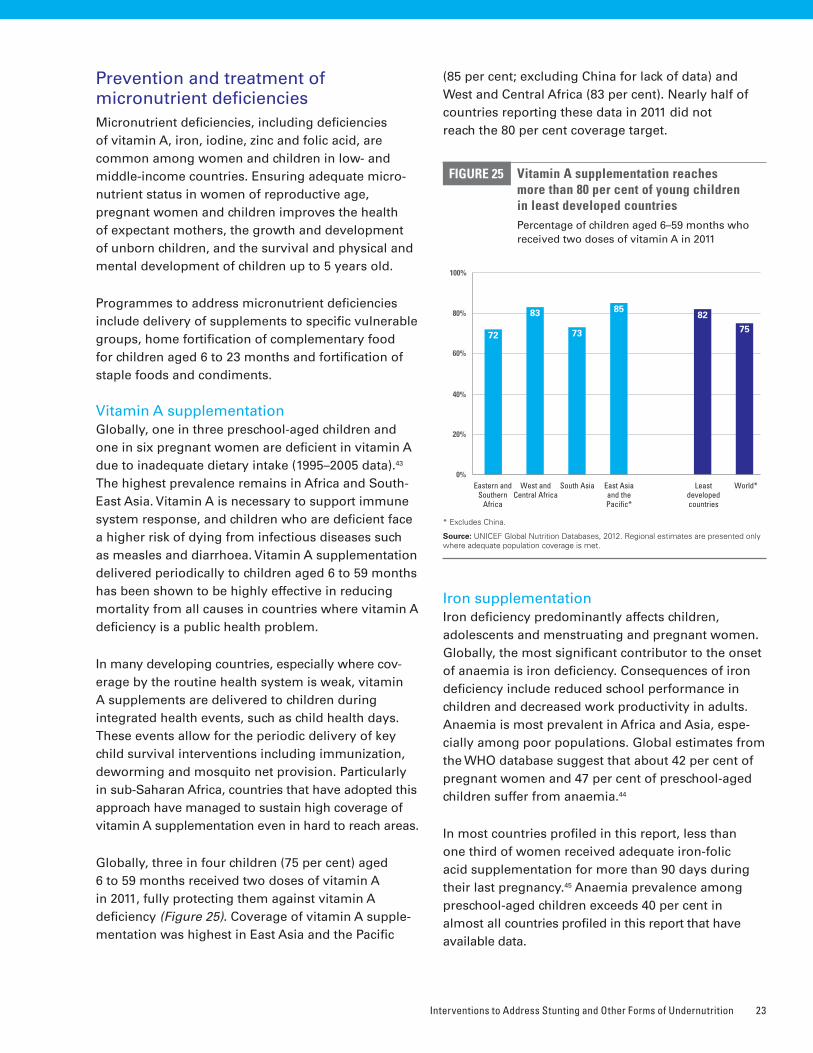
Interventions to Address Stunting and Other Forms of Undernutrition 23
Prevention and treatment of micronutrient deficienciesMicronutrient deficiencies, including deficiencies of vitamin A, iron, iodine, zinc and folic acid, are common among women and children in low- and middle-income countries. Ensuring adequate micro-nutrient status in women of reproductive age, pregnant women and children improves the health of expectant mothers, the growth and development of unborn children, and the survival and physical and mental development of children up to 5 years old.
Programmes to address micronutrient deficiencies include delivery of supplements to specific vulnerable groups, home fortification of complementary food for children aged 6 to 23 months and fortification of staple foods and condiments.
Vitamin A supplementationGlobally, one in three preschool-aged children and one in six pregnant women are deficient in vitamin A due to inadequate dietary intake (1995–2005 data).43 The highest prevalence remains in Africa and South-East Asia. Vitamin A is necessary to support immune system response, and children who are deficient face a higher risk of dying from infectious diseases such as measles and diarrhoea. Vitamin A supplementation delivered periodically to children aged 6 to 59 months has been shown to be highly effective in reducing mortality from all causes in countries where vitamin A deficiency is a public health problem.
In many developing countries, especially where cov-erage by the routine health system is weak, vitamin A supplements are delivered to children during integrated health events, such as child health days. These events allow for the periodic delivery of key child survival interventions including immunization, deworming and mosquito net provision. Particularly in sub-Saharan Africa, countries that have adopted this approach have managed to sustain high coverage of vitamin A supplementation even in hard to reach areas.
Globally, three in four children (75 per cent) aged 6 to 59 months received two doses of vitamin A in 2011, fully protecting them against vitamin A deficiency (Figure 25). Coverage of vitamin A supple-mentation was highest in East Asia and the Pacific
(85 per cent; excluding China for lack of data) and West and Central Africa (83 per cent). Nearly half of countries reporting these data in 2011 did not reach the 80 per cent coverage target.
Iron supplementationIron deficiency predominantly affects children, adolescents and menstruating and pregnant women. Globally, the most significant contributor to the onset of anaemia is iron deficiency. Consequences of iron deficiency include reduced school performance in children and decreased work productivity in adults. Anaemia is most prevalent in Africa and Asia, espe-cially among poor populations. Global estimates from the WHO database suggest that about 42 per cent of pregnant women and 47 per cent of preschool-aged children suffer from anaemia.44
In most countries profiled in this report, less than one third of women received adequate iron-folic acid supplementation for more than 90 days during their last pregnancy.45 Anaemia prevalence among preschool-aged children exceeds 40 per cent in almost all countries profiled in this report that have available data.
0%
100%
80%
60%
40%
20%
Vitamin A supplementation reaches more than 80 per cent of young children in least developed countriesPercentage of children aged 6–59 months who received two doses of vitamin A in 2011
FIGURE 25
* Excludes China�
Source: UNICEF Global Nutrition Databases, 2012� Regional estimates are presented only where adequate population coverage is met�
72
83
73
8582
75
World*Eastern and Southern
Africa
West and Central Africa
South Asia Least developed countries
East Asia and the Pacific*
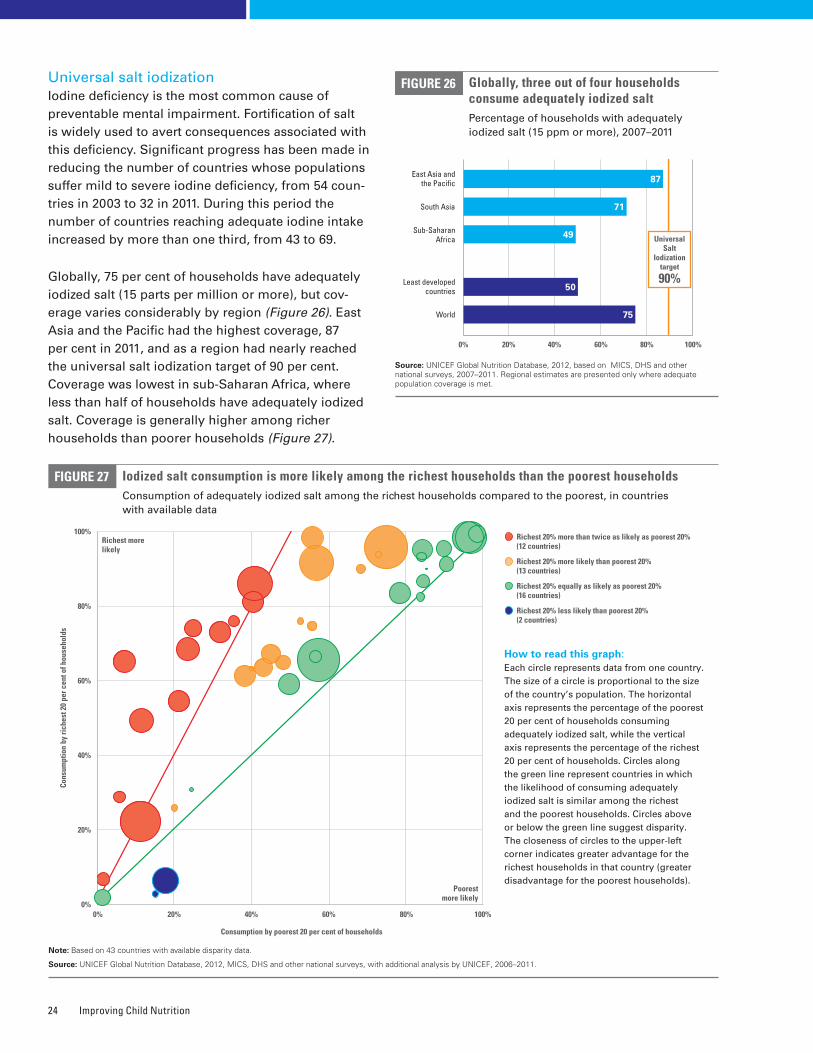
Improving Child Nutrition24
Universal salt iodizationIodine deficiency is the most common cause of preventable mental impairment. Fortification of salt is widely used to avert consequences associated with this deficiency. Significant progress has been made in reducing the number of countries whose populations suffer mild to severe iodine deficiency, from 54 coun-tries in 2003 to 32 in 2011. During this period the number of countries reaching adequate iodine intake increased by more than one third, from 43 to 69.
Globally, 75 per cent of households have adequately iodized salt (15 parts per million or more), but cov-erage varies considerably by region (Figure 26). East Asia and the Pacific had the highest coverage, 87 per cent in 2011, and as a region had nearly reached the universal salt iodization target of 90 per cent. Coverage was lowest in sub-Saharan Africa, where less than half of households have adequately iodized salt. Coverage is generally higher among richer households than poorer households (Figure 27).
Globally, three out of four households consume adequately iodized saltPercentage of households with adequately iodized salt (15 ppm or more), 2007–2011
FIGURE 26
Source: UNICEF Global Nutrition Database, 2012, based on MICS, DHS and other national surveys, 2007–2011� Regional estimates are presented only where adequate population coverage is met�
0% 80%40%20% 60% 100%
World 75
Least developed countries 50
East Asia and the Pacific 87
South Asia 71
Sub-Saharan Africa 49 Universal
Salt Iodization
target
90%
Richest more likely
0%
100%
80%
60%
40%
20%
100%80%60%40%20%0%
Iodized salt consumption is more likely among the richest households than the poorest households Consumption of adequately iodized salt among the richest households compared to the poorest, in countries with available data
FIGURE 27
Note: Based on 43 countries with available disparity data�
Source: UNICEF Global Nutrition Database, 2012, MICS, DHS and other national surveys, with additional analysis by UNICEF, 2006–2011�
Cons
umpt
ion
by ri
ches
t 20
per c
ent o
f hou
seho
lds
How to read this graph: Each circle represents data from one country. The size of a circle is proportional to the size of the country’s population. The horizontal axis represents the percentage of the poorest 20 per cent of households consuming adequately iodized salt, while the vertical axis represents the percentage of the richest 20 per cent of households. Circles along the green line represent countries in which the likelihood of consuming adequately iodized salt is similar among the richest and the poorest households. Circles above or below the green line suggest disparity. The closeness of circles to the upper-left corner indicates greater advantage for the richest households in that country (greater disadvantage for the poorest households).
Consumption by poorest 20 per cent of households
Richest 20% more than twice as likely as poorest 20% (12 countries)
Richest 20% more likely than poorest 20% (13 countries)
Richest 20% equally as likely as poorest 20% (16 countries)
Richest 20% less likely than poorest 20% (2 countries)
Poorest more likely
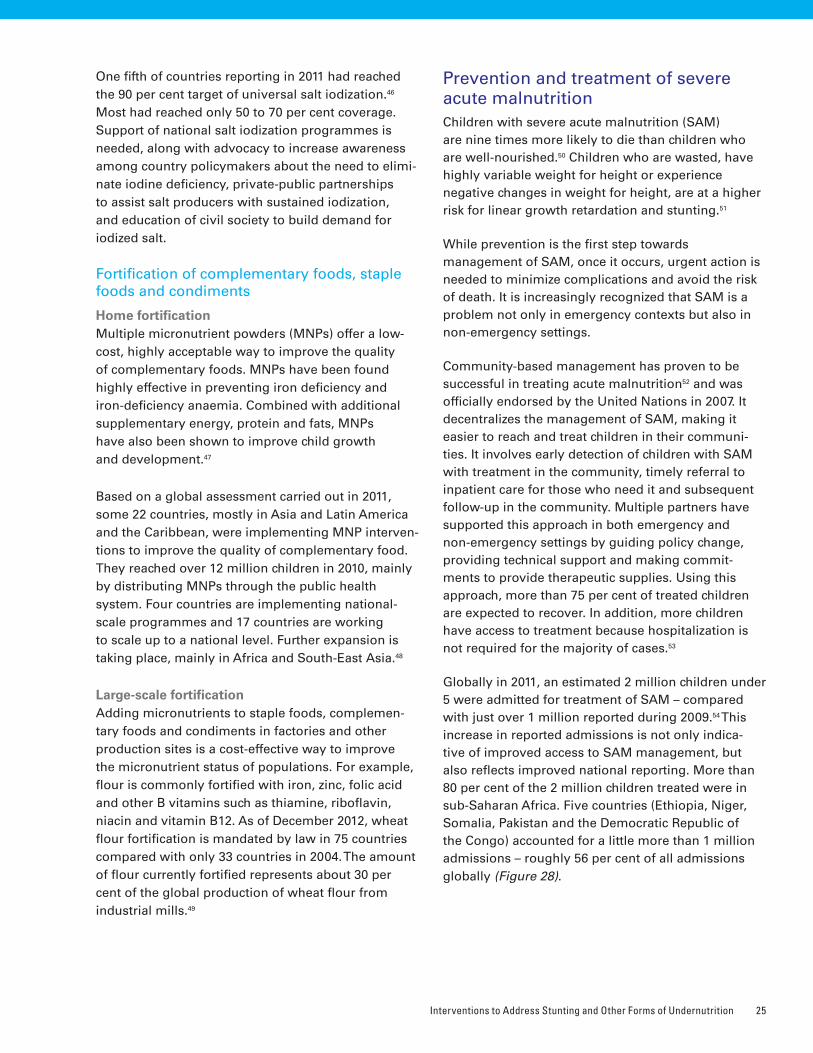
Interventions to Address Stunting and Other Forms of Undernutrition 25
One fifth of countries reporting in 2011 had reached the 90 per cent target of universal salt iodization.46 Most had reached only 50 to 70 per cent coverage. Support of national salt iodization programmes is needed, along with advocacy to increase awareness among country policymakers about the need to elimi-nate iodine deficiency, private-public partnerships to assist salt producers with sustained iodization, and education of civil society to build demand for iodized salt.
Fortification of complementary foods, staple foods and condiments
Home fortification Multiple micronutrient powders (MNPs) offer a low-cost, highly acceptable way to improve the quality of complementary foods. MNPs have been found highly effective in preventing iron deficiency and iron-deficiency anaemia. Combined with additional supplementary energy, protein and fats, MNPs have also been shown to improve child growth and development.47
Based on a global assessment carried out in 2011, some 22 countries, mostly in Asia and Latin America and the Caribbean, were implementing MNP interven-tions to improve the quality of complementary food. They reached over 12 million children in 2010, mainly by distributing MNPs through the public health system. Four countries are implementing national-scale programmes and 17 countries are working to scale up to a national level. Further expansion is taking place, mainly in Africa and South-East Asia.48
Large-scale fortificationAdding micronutrients to staple foods, complemen-tary foods and condiments in factories and other production sites is a cost-effective way to improve the micronutrient status of populations. For example, flour is commonly fortified with iron, zinc, folic acid and other B vitamins such as thiamine, riboflavin, niacin and vitamin B12. As of December 2012, wheat flour fortification is mandated by law in 75 countries compared with only 33 countries in 2004. The amount of flour currently fortified represents about 30 per cent of the global production of wheat flour from industrial mills.49
Prevention and treatment of severe acute malnutritionChildren with severe acute malnutrition (SAM) are nine times more likely to die than children who are well-nourished.50 Children who are wasted, have highly variable weight for height or experience negative changes in weight for height, are at a higher risk for linear growth retardation and stunting.51
While prevention is the first step towards management of SAM, once it occurs, urgent action is needed to minimize complications and avoid the risk of death. It is increasingly recognized that SAM is a problem not only in emergency contexts but also in non-emergency settings.
Community-based management has proven to be successful in treating acute malnutrition52 and was officially endorsed by the United Nations in 2007. It decentralizes the management of SAM, making it easier to reach and treat children in their communi-ties. It involves early detection of children with SAM with treatment in the community, timely referral to inpatient care for those who need it and subsequent follow-up in the community. Multiple partners have supported this approach in both emergency and non-emergency settings by guiding policy change, providing technical support and making commit-ments to provide therapeutic supplies. Using this approach, more than 75 per cent of treated children are expected to recover. In addition, more children have access to treatment because hospitalization is not required for the majority of cases.53
Globally in 2011, an estimated 2 million children under 5 were admitted for treatment of SAM – compared with just over 1 million reported during 2009.54 This increase in reported admissions is not only indica-tive of improved access to SAM management, but also reflects improved national reporting. More than 80 per cent of the 2 million children treated were in sub-Saharan Africa. Five countries (Ethiopia, Niger, Somalia, Pakistan and the Democratic Republic of the Congo) accounted for a little more than 1 million admissions – roughly 56 per cent of all admissions globally (Figure 28).
Improving Child Nutrition26
Key strategies to expand access to quality treatment of SAM include creating national policies to help governments accelerate and sustain scale-up, building national capacities and strengthening systems to support SAM scale-up, and integrating SAM into other health and nutrition activities.
Water, sanitation and hygiene and access to health servicesRepeated episodes of diarrhoea, intestinal infestation with nematode worms and possibly tropical or envi-ronmental enteropathy (in which faecal contamination causes changes to the intestines affecting permea-bility and absorption) can impede nutrient absorption and diminish appetite, resulting in stunting and other forms of undernutrition.55
Improving water, sanitation and hygiene as well as housing and access to and use of health services can promote healthy environments and reduce the prevalence of infectious diseases,56 and key interven-tions implemented at scale can reduce undernutrition. These include immunization, improving sanitation by creating environments free of open defecation, hand washing with soap, access to clean drinking water, use of oral rehydration salts and therapeutic zinc to treat diarrhoea, prevention (with insecticide-treated
mosquito nets) and treatment of malaria, and treatment of pneumonia with antibiotics. Ongoing research is needed to help quantify the effect and the effectiveness of interventions in different settings.
Community-based approachesScale-up of integrated, community-based nutrition programmes linked with health, water and sanita-tion, and other relevant interventions is a priority strategy that can bring measurable improvements in children’s nutritional status, survival and develop-ment. Community support can include providing services such as counselling, support and communi-cation on IYCF; screening for acute malnutrition and follow-up of malnourished children; deworming; and delivering vitamin A and micronutrient supplements. Synergizing nutrition-specific interventions with other early child development interventions at the commu-nity level is also important for holistically promoting early child development and reducing inequalities.
Communication for behaviour and social changeBased on formative research on the barriers to and the facilitators of good nutrition, communication for behaviour and social change can promote behaviour change in communities, raise awareness about nutri-tion services and stimulate shifts in social norms in order to improve the enabling environment for good nutrition in communities.
Nutrition-sensitive approachesNutrition-sensitive approaches involve other sectors in indirectly addressing the underlying causes of undernutrition. There is less evidence for the impact of nutrition-sensitive approaches than for direct nutrition-specific interventions, in part because they are hard to measure. However, policies and program-ming in agriculture, education, social protection and poverty reduction are important for realizing nutri-tion goals. Achieving nutrition-sensitive development requires multi-sectoral coordination and cooperation with many stakeholders, which has historically been challenging in nutrition. Agriculture and social protec-tion programmes are discussed in more detail below.
FIGURE 28
CountryCases admitted for treatment of SAM
Ethiopia 302,000
Niger 299,000
Somalia 167,000
Pakistan 157,000
Democratic Republic of the Congo 157,000
Total 1,082,000
Five countries account for more than half of admissions for treatment of severe acute malnutritionNumber of reported cases admitted for treatment of SAM in 2011
Note: Figures are presented to the nearest 1,000� There is no standardized system of national reporting, therefore the mode of each country’s data collection differs (whether based on health facilities with functional services for SAM or numbers of implementing partners submitting reports)� Also note that while Niger, Somalia and Pakistan received 100 per cent of expected reports for 2011, Ethiopia and the Democratic Republic of the Congo indicated receiving 80 per cent of expected reports�
Source: UNICEF Global Nutrition Database, based on Global SAM Update, 2012�
Interventions to Address Stunting and Other Forms of Undernutrition 27
AgricultureRecently, attention has increasingly been paid to improving synergies and linkages between agriculture and nutrition and health, in both the programmatic and the research communities.57
The global agricultural system is currently producing enough food to feed the world, but access to ade-quate, affordable, nutritious food is more challenging. Improving dietary diversity by increasing production of nutritious foods is achievable, particularly in rural populations. It is done by producing nutrient-dense foods, such as fruits and vegetables, fish, livestock, milk and eggs; increasing the nutritional content of foods through crop biofortification and post-harvest fortification; improving storage and preservation of foods to cover ‘lean’ seasons; and educating people about nutrition and diet. In several settings these types of interventions have been shown to improve dietary patterns and intake of specific micronutrients, either directly or by increasing household income. However, the impact on stunting, wasting and micronutrient deficiencies is less clear.58
More effort is needed to align the pursuit of food security with nutrition security and improved nutritional outcomes.
Social protectionSocial protection involves policies and programmes that protect people against vulnerability, mitigate the impacts of shocks, improve resilience and support people whose livelihoods are at risk. Safety nets are a type of social protection that provides or substitutes for income: Targeted cash transfers and food access-based approaches are the two main categories of safety nets intended to avert starvation and reduce undernutrition among the most vulnerable popula-tions. Food-based safety nets are designed to ensure livelihoods (such as public works employment paid in food), increase purchasing power (through food stamps, coupons or vouchers) and relieve depri-vation (by providing food directly to households or individuals).
While social safety net programmes operate in at least a dozen countries, evidence indicating that these programmes have improved child nutritional status
is still limited.59 A review of evaluations of conditional cash transfer programmes showed an impact on stunting in two of five studies, the Familias en Acción programme in Colombia and the Oportunidades programme in Mexico. Of the three unconditional cash transfer programmes, two (South African Child Support Grants and Ecuador’s Bono Solidario) reduced stunting.60 More research and evidence is needed on the long-term outcomes of these pro-grammes and how they can be better targeted, how long they are needed and with what interventions. But social safety net programmes may be one way to ensure more equitable nutrition-sensitive develop-ment if they are aligned with local and national needs and an understanding of capacity, resources and timeliness aspects in scaling up.
Maintaining the focus on equityAs emphasized throughout this report, maintaining a focus on equity is particularly important, because stunting and other forms of undernutrition are con-centrated among the most disadvantaged in society.
Undernutrition is inextricably linked with poverty. Equity-focused nutrition programming and other development strategies can effectively address the inequalities caused by poverty and the forms of exclu-sion that exist among groups and individuals.
For biological reasons, women and children are more vulnerable to nutritional deficiencies; special efforts are therefore needed to address the biological and social inequities that affect them. Women’s low education levels, unequal social status and limited decision-making power can negatively influence the nutrition status of their children, as well as their own. Improving access to education and creating opportu-nities for both girls and boys, and their families, will confer many benefits in terms of nutritional status and child development.
Creating an enabling environment that targets the needs of vulnerable people is crucial. Since inequalities in nutritional status have a long-lasting, intergenerational impact on a country’s physical, social and economic well-being, the response by communities and governments has implications for the nation’s pursuit of equitable development.
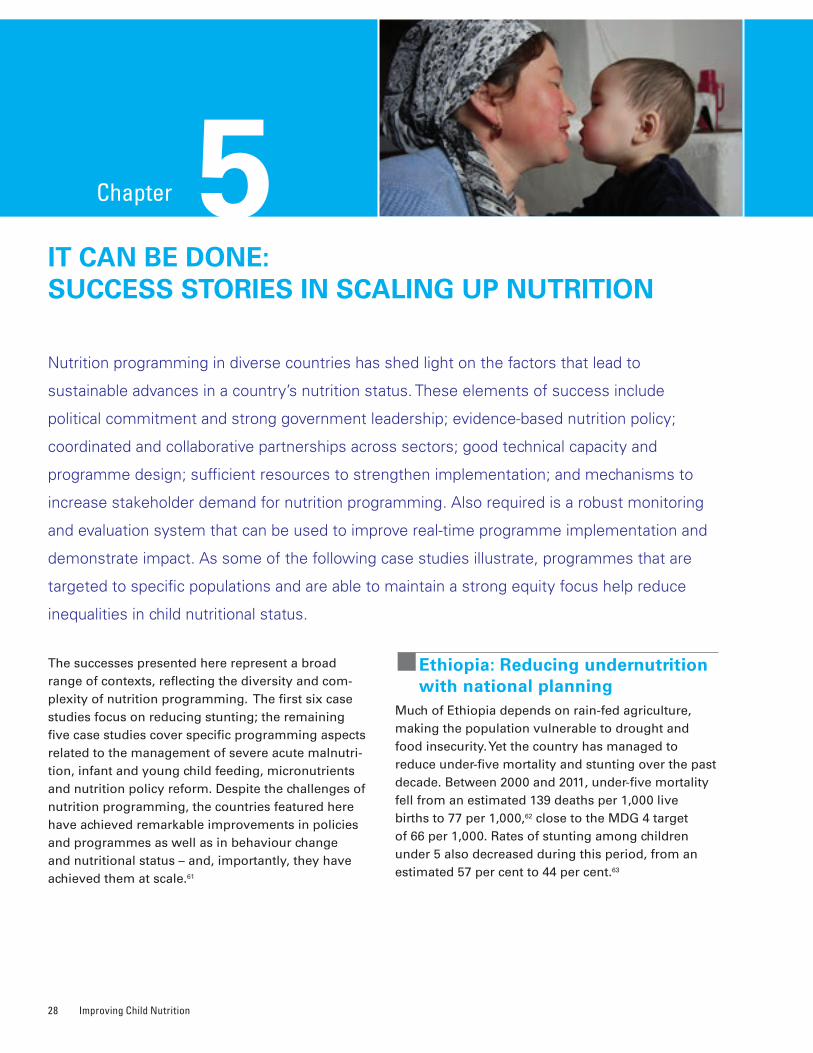
Improving Child Nutrition28
5Chapter
IT CAN BE DONE: SUCCESS STORIES IN SCALING UP NUTRITION
Nutrition programming in diverse countries has shed light on the factors that lead to
sustainable advances in a country’s nutrition status� These elements of success include
political commitment and strong government leadership; evidence-based nutrition policy;
coordinated and collaborative partnerships across sectors; good technical capacity and
programme design; sufficient resources to strengthen implementation; and mechanisms to
increase stakeholder demand for nutrition programming� Also required is a robust monitoring
and evaluation system that can be used to improve real-time programme implementation and
demonstrate impact� As some of the following case studies illustrate, programmes that are
targeted to specific populations and are able to maintain a strong equity focus help reduce
inequalities in child nutritional status�
The successes presented here represent a broad range of contexts, reflecting the diversity and com-plexity of nutrition programming. The first six case studies focus on reducing stunting; the remaining five case studies cover specific programming aspects related to the management of severe acute malnutri-tion, infant and young child feeding, micronutrients and nutrition policy reform. Despite the challenges of nutrition programming, the countries featured here have achieved remarkable improvements in policies and programmes as well as in behaviour change and nutritional status – and, importantly, they have achieved them at scale.61
�Ethiopia: Reducing undernutrition with national planning
Much of Ethiopia depends on rain-fed agriculture, making the population vulnerable to drought and food insecurity. Yet the country has managed to reduce under-five mortality and stunting over the past decade. Between 2000 and 2011, under-five mortality fell from an estimated 139 deaths per 1,000 live births to 77 per 1,000,62 close to the MDG 4 target of 66 per 1,000. Rates of stunting among children under 5 also decreased during this period, from an estimated 57 per cent to 44 per cent.63
It Can Be Done: Success Stories in Scaling Up Nutrition 29
However, more than 5 million children remained stunted in 2011,64 even though per capita gross national income in Ethiopia grew from US$130 in 2000 to US$400 in 2011.65 Stunting existed across households both poor and rich, indicating that economic growth and food security alone were not sufficient to reduce child stunting.66
Key strategy: A strong safety net and a comprehensive planIn 2008, the Government of Ethiopia launched a National Nutrition Programme (NNP), combining nutrition services into one comprehensive strategy. The NNP shifted the previous focus on food aid and humanitarian assistance and increased atten-tion on comprehensive direct nutrition interventions addressing the immediate and underlying causes of malnutrition, especially at community level. This programme is enhanced by Ethiopia’s robust social protection strategies, including:
• A safety net programme covering more than 7 million people in the poorest areas of the country.
• An emergency response system and several programmes reaching populations in areas not covered by the safety net.
• Scaling up of community nutrition programmes, contributing to improved infant feeding practices.
• Micronutrient supplementation and treatment of SAM.
• A package of free health services, providing insecticide-treated mosquito nets, pneumonia treatment, family planning and support for treat-ment of acute diarrhoea.
This comprehensive NNP strategy is well aligned with the government’s Food Security Strategy. One element of this is the Productive Safety Net Programme, introduced in 2005, which hires people for public works or provides food or cash transfers to families. The programme has had a positive impact on addressing food insecurity, one of the under-lying causes of stunting: Between 2006 and 2010, the number of months of food security increased signifi-cantly in covered areas, as did the number of meals children consumed during lean seasons.67
An important NNP component is the Community-Based Nutrition Programme, which concentrates on improving the nutritional status of children under age 2. The programme strengthens communities’ capacity to assess undernutrition, understand the causes and actions needed, and improve use of family, com-munity and external resources. Community health services deliver nutrition interventions through trained health extension workers. Since the programme began in 2008, coverage increased from 39 districts to 228 districts in 2012, with plans to expand further in 2013.
Ethiopia is also addressing SAM by strengthening community management, providing micronutrient supplementation through community health days, and promoting optimal infant and young child feeding.
Community-based nutrition interventions are integrated into health services through the Health Extension Programme. In existence at the launch of the NNP, it expanded to cover all rural communities in 2008, increasing primary-health-care coverage (including nutrition interventions) from 77 per cent of communities in 2004 to 92 per cent in 2010.68 Evidence from evaluations suggests that services have improved and people have changed their behav-iour.69 In 2011, 71 per cent of children 6–59 months were fully protected against vitamin A deficiency with supplementation. Furthermore, 52 per cent of children 0–5 months were exclusively breastfed.
Looking forwardA revised NNP is expected to be released in late 2013, increasing the emphasis on multi-sectoral nutrition interventions. It will align with the Health Sector Development Plan, which provides an opportunity to further expand coverage of key nutrition and health services. The Community-Based Nutrition Programme is a strong vehicle for targeting interventions at community level. It can help to address inequalities in child nutritional status, but it needs to be scaled up nationally, with support from key partners. This will require more financing to support investment in health system capacity. The Government of Ethiopia has joined the SUN movement and is committed to increasing resources for the NNP and putting into place measures to align and accelerate actions to improve food security and nutrition.
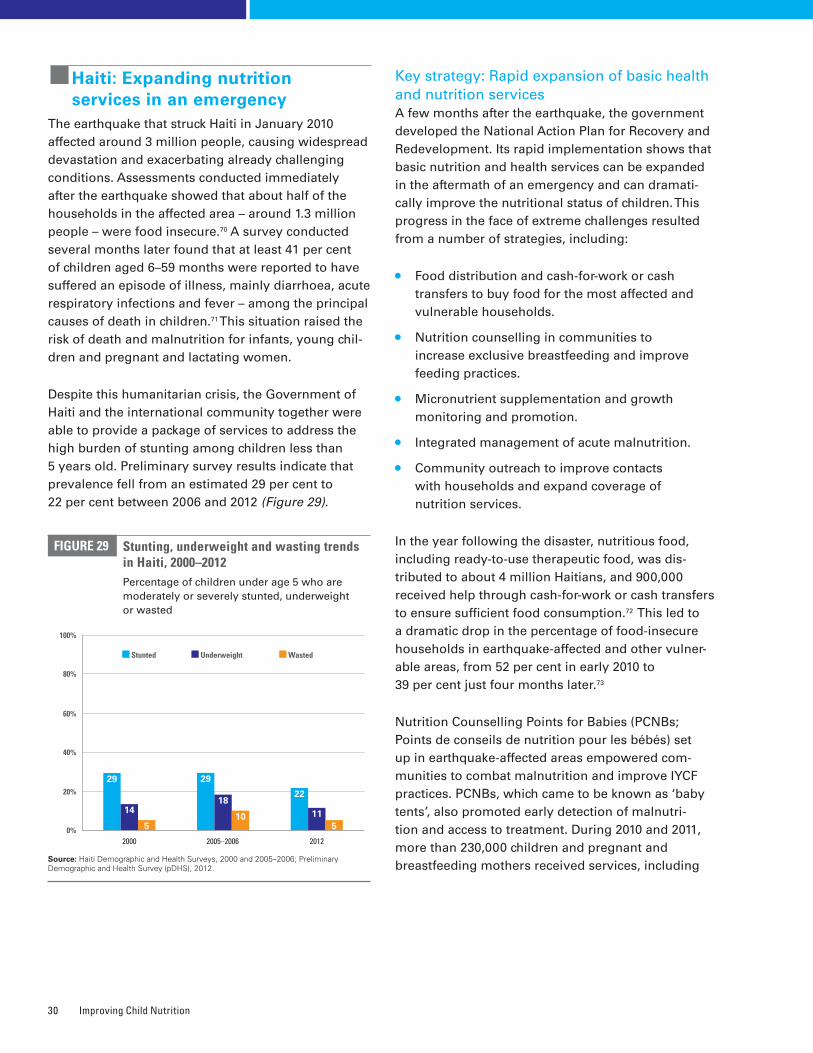
Improving Child Nutrition30
�Haiti: Expanding nutrition services in an emergency
The earthquake that struck Haiti in January 2010 affected around 3 million people, causing widespread devastation and exacerbating already challenging conditions. Assessments conducted immediately after the earthquake showed that about half of the households in the affected area – around 1.3 million people – were food insecure.70 A survey conducted several months later found that at least 41 per cent of children aged 6–59 months were reported to have suffered an episode of illness, mainly diarrhoea, acute respiratory infections and fever – among the principal causes of death in children.71 This situation raised the risk of death and malnutrition for infants, young chil-dren and pregnant and lactating women.
Despite this humanitarian crisis, the Government of Haiti and the international community together were able to provide a package of services to address the high burden of stunting among children less than 5 years old. Preliminary survey results indicate that prevalence fell from an estimated 29 per cent to 22 per cent between 2006 and 2012 (Figure 29).
Key strategy: Rapid expansion of basic health and nutrition servicesA few months after the earthquake, the government developed the National Action Plan for Recovery and Redevelopment. Its rapid implementation shows that basic nutrition and health services can be expanded in the aftermath of an emergency and can dramati-cally improve the nutritional status of children. This progress in the face of extreme challenges resulted from a number of strategies, including:
• Food distribution and cash-for-work or cash transfers to buy food for the most affected and vulnerable households.
• Nutrition counselling in communities to increase exclusive breastfeeding and improve feeding practices.
• Micronutrient supplementation and growth monitoring and promotion.
• Integrated management of acute malnutrition.
• Community outreach to improve contacts with households and expand coverage of nutrition services.
In the year following the disaster, nutritious food, including ready-to-use therapeutic food, was dis-tributed to about 4 million Haitians, and 900,000 received help through cash-for-work or cash transfers to ensure sufficient food consumption.72 This led to a dramatic drop in the percentage of food-insecure households in earthquake-affected and other vulner-able areas, from 52 per cent in early 2010 to 39 per cent just four months later.73
Nutrition Counselling Points for Babies (PCNBs; Points de conseils de nutrition pour les bébés) set up in earthquake-affected areas empowered com-munities to combat malnutrition and improve IYCF practices. PCNBs, which came to be known as ‘baby tents’, also promoted early detection of malnutri-tion and access to treatment. During 2010 and 2011, more than 230,000 children and pregnant and breastfeeding mothers received services, including
Stunting, underweight and wasting trends in Haiti, 2000–2012Percentage of children under age 5 who are moderately or severely stunted, underweight or wasted
FIGURE 29
Source: Haiti Demographic and Health Surveys, 2000 and 2005–2006; Preliminary Demographic and Health Survey (pDHS), 2012�
22
115
29
18
10
29
14
50%
100%
80%
60%
40%
20%
Stunted Underweight Wasted
2000 2005–2006 2012
It Can Be Done: Success Stories in Scaling Up Nutrition 31
counselling on infant and young child feeding, micro-nutrient supplementation and growth monitoring and promotion, at about 200 PCNBs.74
This community outreach strategy contributed significantly to expanded coverage of nutrition interventions. Early initiation of breastfeeding increased from 44 per cent in 200675 to 64 per cent in 2012 as reported by the government;76 in PCNB areas, 70 per cent of children younger than 6 months were exclusively breastfed in 2012, according to UNICEF estimates.77 In 2010, more than 500,000 pregnant women received iron-folic acid and iodine supplements and more than 1 million children aged 6–59 months benefited from interventions to address micronutrient deficiencies. More than 15,000 children aged 6 to 59 months were admitted for treatment of SAM.78 In addition, 31,050 long-lasting insecticide-treated mosquito nets were distributed in four of the most malaria-endemic areas and more than 11,300 latrines were provided.79
Looking forwardHaiti still faces many challenges, including the fact that around one in five children under 5 are stunted. The international community, which rallied around Haiti in the crisis, is phasing out its emergency support. This leaves Haiti with the critical task of providing basic health and nutrition services with insufficient qualified personnel and an infrastructure that is still recovering.
The government and its partners have begun working to build up the long-term capacity of the health system and communities. Haiti has joined the SUN movement, signalling its commitment to prioritize food and nutrition security and invest in direct nutri-tion interventions. A new national nutrition policy has recently been put in place to guide this process.
�India: Improving nutrition governance to reduce child stunting in Maharashtra
More than 60 million children under 5 are stunted in India, comprising almost half the children in this age group. They represent an estimated one third of stunted children worldwide.80 Even in Maharashtra, the wealthiest state in India, 39 per cent of children under age 2 were stunted in 2005–2006. But by 2012, according to a statewide nutrition survey, the prevalence of stunting had dropped to 23 per cent.81 The state’s determined actions and focus on service delivery contributed to this dramatic decline.
Key strategy: Building staff capacity to improve delivery of servicesIn 2005, in response to reports of child deaths from undernutrition in a number of districts, the state launched the Rajmata Jijau Mother-Child Health & Nutrition Mission. It was initially focused on five primarily tribal districts with the highest incidence of child undernutrition (Amravati, Gadchiroli, Nandurbar, Nasik and Thane). But after the National Family Health Survey of 2005–2006, the Mission’s mandate was expanded to coordinate efforts to reduce child undernutrition throughout the state, an initiative of enormous significance given that Maharashtra is the second most populous state in India. The Mission was extended to 10 additional districts with a substantial concentration of tribal populations in 2006–2007 and finally to the remaining districts in 2008–2009.
The State Nutrition Mission began by working to improve the effectiveness of service delivery through the Integrated Child Development Services and the National Rural Health Mission, the national flagship programmes for child nutrition, health and development. Their focus was on filling vacancies in key personnel, particularly front-line workers and supervisors, and on improving their motiva-tion and skills to deliver timely, high-quality services in communities. In the second five-year phase, beginning in 2011, more emphasis was placed on improving the nutrition of children under 2 and their mothers. This shift was made in response to global evidence about the critical 1,000-day window to prevent undernutrition in children.
Improving Child Nutrition32
In 2012, the Government of Maharashtra commis-sioned the first-ever statewide nutrition survey to assess progress and identify areas for future action. Results of this Comprehensive Nutrition Survey in Maharashtra indicated that prevalence of stunting in children under 2 was 23 per cent in 2012 – a decrease of 16 percentage points over a seven-year period.82 Progress was associated with improvements in how children were fed, the care they and their mothers received, and the environments in which they lived. From 2005–2006 to 2012, the percentage of children 6 to 23 months old who were fed a required minimum number of times per day increased from 34 to 77 and the proportion of mothers who benefited from at least three antenatal visits during pregnancy increased from 75 to 90 per cent.83
The Maharashtra Nutrition Mission is tackling stunting among children under age 2 statewide by promoting more effective delivery of interventions through flagship programmes for child survival, growth and development. Four factors are seen as key to the state’s success:
• Remaining focused: Efforts are concentrated on delivering evidence-based interventions for infants, young children and their mothers to prevent stunting while simultaneously addressing adolescent girls’ nutrition, education and empowerment to improve the start in life for the next generation.
• Delivering at scale with equity: Efforts are made to combine services in facilities with outreach and community-based interventions to bring them closer to children under 2, adolescent girls and mothers. To ensure equity and impact, the focus is on the most vulnerable children, households, districts and divisions.
• Improving children’s birthweight: The approach calls for monitoring pregnancy weight gain at every antenatal care visit and counselling and supporting mothers to gain adequate weight during pregnancy. In addition, all children are weighed at birth, and children born weighing below 2,500 grams are monitored to ensure they catch up.
• Coordinating and measuring for nutrition results across sectors: Planning and management are focused on nutrition results, and indicators of child nutrition are integrated across programmes and sectors. Another emphasis is on building strong monitoring and evaluation frameworks to measure programme performance.
Looking forwardThe provisional results of the Maharashtra survey showed that in spite of more frequent meals, only 7 per cent of children 6–23 months old received a minimal acceptable diet in 2012. Too few children are being fed an adequately diverse diet rich in essential nutrients with the appropriate frequency to ensure their optimal physical growth and cogni-tive development. A statewide strategy to improve the quality of complementary foods and feeding and hygiene practices is essential to further reduce stunting levels and bring about far-reaching benefits.
�Nepal: Making steady progress for women and children
About one quarter of Nepal’s people live below the national poverty line, and the country has emerged from a decade-long internal conflict that ended with a peace accord in 2006. Despite these challenges, Nepal has made impressive progress for human development over the past decade.
The proportion of people living on less than US$1.25 per day has fallen by half in seven years, from 53 per cent in 2003 to 25 per cent in 2010.84 Under-five mortality has also decreased substantially since 2000, from 83 deaths per 1,000 live births to 48 per 1,000 in 2011.85 Stunting prevalence among children under age 5 dropped from 57 per cent in 2001 to 41 per cent in 2011,86 showing that even in difficult conditions, impressive gains can be made.
Key strategy: Community-based interventions to reduce child stunting The success in reducing child stunting took place against a backdrop of economic growth and pov-erty reduction, but it was also driven by combining important health and nutrition strategies:
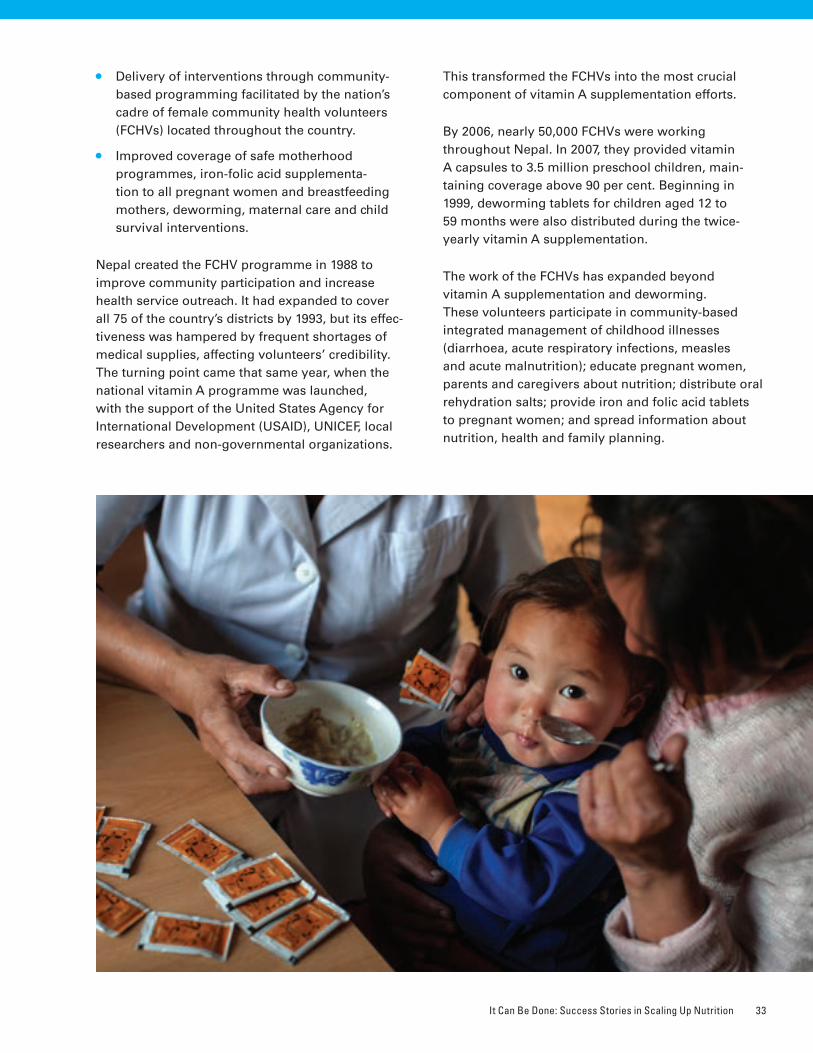
It Can Be Done: Success Stories in Scaling Up Nutrition 33
• Delivery of interventions through community-based programming facilitated by the nation’s cadre of female community health volunteers (FCHVs) located throughout the country.
• Improved coverage of safe motherhood programmes, iron-folic acid supplementa-tion to all pregnant women and breastfeeding mothers, deworming, maternal care and child survival interventions.
Nepal created the FCHV programme in 1988 to improve community participation and increase health service outreach. It had expanded to cover all 75 of the country’s districts by 1993, but its effec-tiveness was hampered by frequent shortages of medical supplies, affecting volunteers’ credibility. The turning point came that same year, when the national vitamin A programme was launched, with the support of the United States Agency for International Development (USAID), UNICEF, local researchers and non-governmental organizations.
This transformed the FCHVs into the most crucial component of vitamin A supplementation efforts.
By 2006, nearly 50,000 FCHVs were working throughout Nepal. In 2007, they provided vitamin A capsules to 3.5 million preschool children, main-taining coverage above 90 per cent. Beginning in 1999, deworming tablets for children aged 12 to 59 months were also distributed during the twice-yearly vitamin A supplementation.
The work of the FCHVs has expanded beyond vitamin A supplementation and deworming. These volunteers participate in community-based integrated management of childhood illnesses (diarrhoea, acute respiratory infections, measles and acute malnutrition); educate pregnant women, parents and caregivers about nutrition; distribute oral rehydration salts; provide iron and folic acid tablets to pregnant women; and spread information about nutrition, health and family planning.
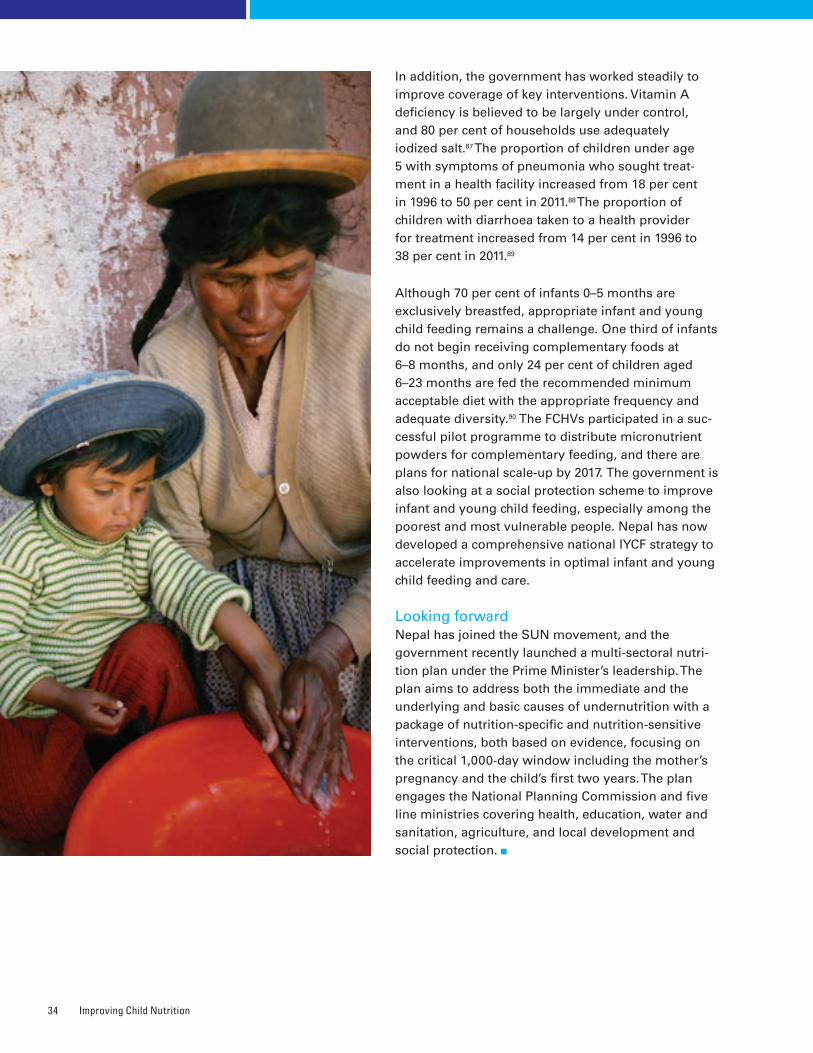
Improving Child Nutrition34
In addition, the government has worked steadily to improve coverage of key interventions. Vitamin A deficiency is believed to be largely under control, and 80 per cent of households use adequately iodized salt.87 The proportion of children under age 5 with symptoms of pneumonia who sought treat-ment in a health facility increased from 18 per cent in 1996 to 50 per cent in 2011.88 The proportion of children with diarrhoea taken to a health provider for treatment increased from 14 per cent in 1996 to 38 per cent in 2011.89
Although 70 per cent of infants 0–5 months are exclusively breastfed, appropriate infant and young child feeding remains a challenge. One third of infants do not begin receiving complementary foods at 6–8 months, and only 24 per cent of children aged 6–23 months are fed the recommended minimum acceptable diet with the appropriate frequency and adequate diversity.90 The FCHVs participated in a suc-cessful pilot programme to distribute micronutrient powders for complementary feeding, and there are plans for national scale-up by 2017. The government is also looking at a social protection scheme to improve infant and young child feeding, especially among the poorest and most vulnerable people. Nepal has now developed a comprehensive national IYCF strategy to accelerate improvements in optimal infant and young child feeding and care.
Looking forwardNepal has joined the SUN movement, and the government recently launched a multi-sectoral nutri-tion plan under the Prime Minister’s leadership. The plan aims to address both the immediate and the underlying and basic causes of undernutrition with a package of nutrition-specific and nutrition-sensitive interventions, both based on evidence, focusing on the critical 1,000-day window including the mother’s pregnancy and the child’s first two years. The plan engages the National Planning Commission and five line ministries covering health, education, water and sanitation, agriculture, and local development and social protection.
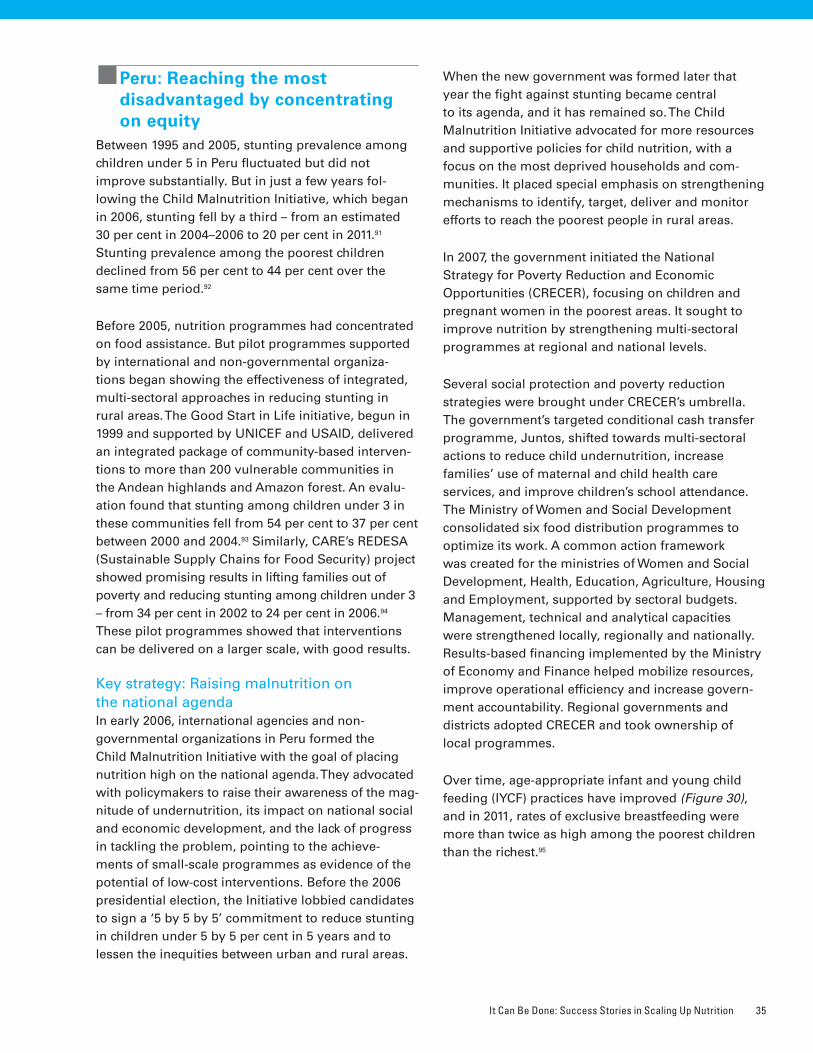
It Can Be Done: Success Stories in Scaling Up Nutrition 35
�Peru: Reaching the most disadvantaged by concentrating on equity
Between 1995 and 2005, stunting prevalence among children under 5 in Peru fluctuated but did not improve substantially. But in just a few years fol-lowing the Child Malnutrition Initiative, which began in 2006, stunting fell by a third – from an estimated 30 per cent in 2004–2006 to 20 per cent in 2011.91 Stunting prevalence among the poorest children declined from 56 per cent to 44 per cent over the same time period.92
Before 2005, nutrition programmes had concentrated on food assistance. But pilot programmes supported by international and non-governmental organiza-tions began showing the effectiveness of integrated, multi-sectoral approaches in reducing stunting in rural areas. The Good Start in Life initiative, begun in 1999 and supported by UNICEF and USAID, delivered an integrated package of community-based interven-tions to more than 200 vulnerable communities in the Andean highlands and Amazon forest. An evalu-ation found that stunting among children under 3 in these communities fell from 54 per cent to 37 per cent between 2000 and 2004.93 Similarly, CARE’s REDESA (Sustainable Supply Chains for Food Security) project showed promising results in lifting families out of poverty and reducing stunting among children under 3 – from 34 per cent in 2002 to 24 per cent in 2006.94 These pilot programmes showed that interventions can be delivered on a larger scale, with good results.
Key strategy: Raising malnutrition on the national agendaIn early 2006, international agencies and non-governmental organizations in Peru formed the Child Malnutrition Initiative with the goal of placing nutrition high on the national agenda. They advocated with policymakers to raise their awareness of the mag-nitude of undernutrition, its impact on national social and economic development, and the lack of progress in tackling the problem, pointing to the achieve-ments of small-scale programmes as evidence of the potential of low-cost interventions. Before the 2006 presidential election, the Initiative lobbied candidates to sign a ‘5 by 5 by 5’ commitment to reduce stunting in children under 5 by 5 per cent in 5 years and to lessen the inequities between urban and rural areas.
When the new government was formed later that year the fight against stunting became central to its agenda, and it has remained so. The Child Malnutrition Initiative advocated for more resources and supportive policies for child nutrition, with a focus on the most deprived households and com-munities. It placed special emphasis on strengthening mechanisms to identify, target, deliver and monitor efforts to reach the poorest people in rural areas.
In 2007, the government initiated the National Strategy for Poverty Reduction and Economic Opportunities (CRECER), focusing on children and pregnant women in the poorest areas. It sought to improve nutrition by strengthening multi-sectoral programmes at regional and national levels.
Several social protection and poverty reduction strategies were brought under CRECER’s umbrella. The government’s targeted conditional cash transfer programme, Juntos, shifted towards multi-sectoral actions to reduce child undernutrition, increase families’ use of maternal and child health care services, and improve children’s school attendance. The Ministry of Women and Social Development consolidated six food distribution programmes to optimize its work. A common action framework was created for the ministries of Women and Social Development, Health, Education, Agriculture, Housing and Employment, supported by sectoral budgets. Management, technical and analytical capacities were strengthened locally, regionally and nationally. Results-based financing implemented by the Ministry of Economy and Finance helped mobilize resources, improve operational efficiency and increase govern-ment accountability. Regional governments and districts adopted CRECER and took ownership of local programmes.
Over time, age-appropriate infant and young child feeding (IYCF) practices have improved (Figure 30), and in 2011, rates of exclusive breastfeeding were more than twice as high among the poorest children than the richest.95
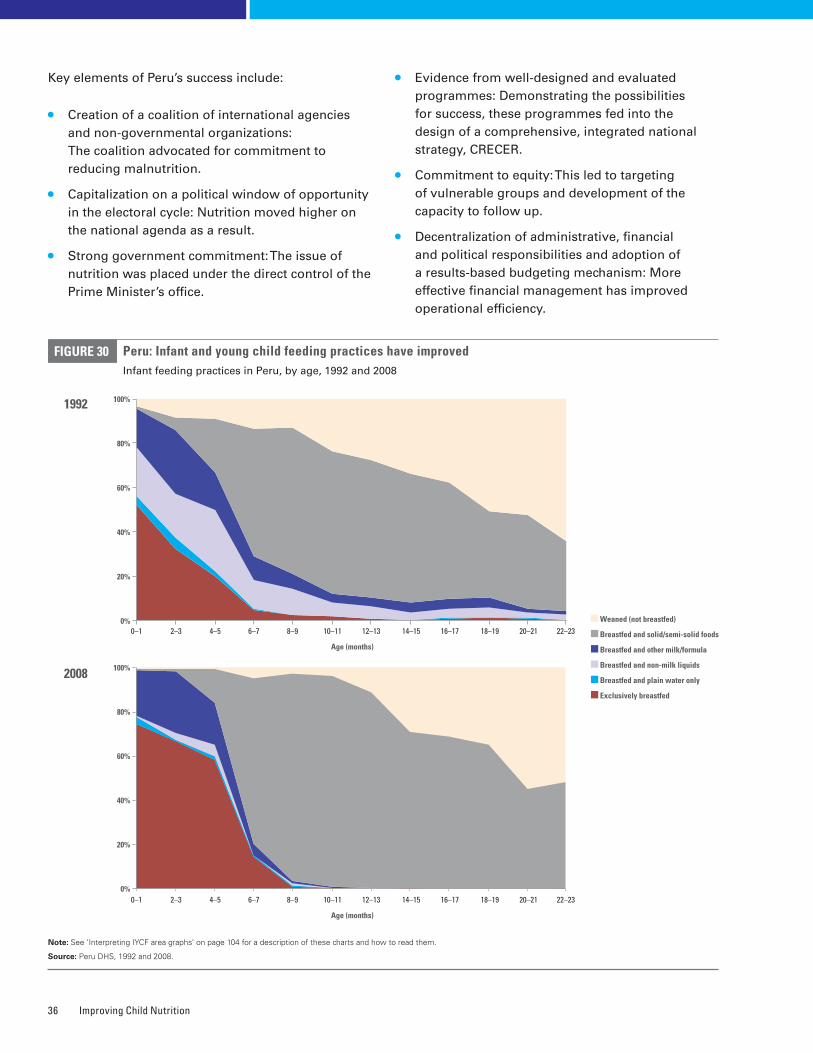
Improving Child Nutrition36
Key elements of Peru’s success include:
• Creation of a coalition of international agencies and non-governmental organizations: The coalition advocated for commitment to reducing malnutrition.
• Capitalization on a political window of opportunity in the electoral cycle: Nutrition moved higher on the national agenda as a result.
• Strong government commitment: The issue of nutrition was placed under the direct control of the Prime Minister’s office.
• Evidence from well-designed and evaluated programmes: Demonstrating the possibilities for success, these programmes fed into the design of a comprehensive, integrated national strategy, CRECER.
• Commitment to equity: This led to targeting of vulnerable groups and development of the capacity to follow up.
• Decentralization of administrative, financial and political responsibilities and adoption of a results-based budgeting mechanism: More effective financial management has improved operational efficiency.
Peru: Infant and young child feeding practices have improvedInfant feeding practices in Peru, by age, 1992 and 2008
FIGURE 30
Note: See ‘Interpreting IYCF area graphs’ on page 104 for a description of these charts and how to read them�
Source: Peru DHS, 1992 and 2008�
Weaned (not breastfed)
Breastfed and solid/semi-solid foods
Breastfed and other milk/formula
Breastfed and non-milk liquids
Breastfed and plain water only
Exclusively breastfed
2008
1992
0%
100%
80%
60%
40%
20%
0%
100%
80%
60%
40%
20%
0–1 2–3 22–2318–1916–1714–1512–1310–118–96–74–5 20–21
Age (months)
0–1 2–3 22–2318–1916–1714–1512–1310–118–96–74–5 20–21
Age (months)
It Can Be Done: Success Stories in Scaling Up Nutrition 37
Looking forwardPeru’s commitment to reducing child undernutrition has been successfully translated into action. Thanks to interventions supported by CRECER, stunting has fallen substantially over a short period of time. Yet more needs to be done. More than half a million children under the age of 5 are too short for their age.96 Inequalities have narrowed nationally, but they persist: Over the past five years, stunting rates among the poorest children have remained 10 times higher than among the richest.97
Peru must now turn to maintaining its commitment to scaling up nutrition and ensure the sustainability of recent successes, despite political and economic challenges. The country has underscored its commit-ment by joining the SUN movement and renewing its pledge to reduce the prevalence of chronic mal-nutrition. The newly created Ministry of Inclusion and Social Development, which leads the intersec-toral coordination of nutrition, is working to further reduce inequities.
�Rwanda: Reducing stunting through consolidated nationwide action
In 2005, more than half of Rwanda’s children under 5 (nearly 800,000) were stunted. Just five years later, stunting prevalence had decreased from an esti-mated 52 per cent to 44 per cent.98 This success was achieved through multi-sectoral approaches, led by the government, and the scaling up of community-based nutrition programming to all of the country’s 30 districts.
Rwanda had been working to improve social services for some time. These efforts included a nearly universal community-based health insurance scheme and health financing and delivery of community-based nutrition programmes in districts since the 1990s. A boost for nutrition came when advocacy led to consolidated nationwide action. Strong evi-dence on the effectiveness of nutrition interventions and programme successes in parts of the country persuaded the government of the importance of investing in nutrition and demonstrated the possi-bility of eliminating undernutrition.
Key strategy: Transitioning a national emergency plan into a community-centred approachIn April 2009, building on the previous community-based nutrition programmes and energized by the personal interest of the nation’s President, Rwanda initiated a National Emergency Plan to Eliminate Malnutrition (EPEM). This move created new momentum and led to opportunities to strengthen collaboration between sectors and support innovative programming.
The EPEM addressed both acute and chronic undernutrition, focusing first on the most vulner-able. Village-level identification and treatment of severe acute malnutrition in facilities was scaled up beginning in 2009. Around 30,000 community health workers received refresher training on how to screen, identify and refer cases for treatment.
At the same time, additional preventive measures were initiated in communities to improve household food security and care practices nationwide.
Interventions to assure sustainable household food security included expanding kitchen gardens and increasing the availability of livestock. Behaviour change interventions helped promote optimal maternal and child care and feeding practices, and growth moni-toring was combined with nutrition programming in 15,000 villages. Monthly data collection and analysis at district and national levels helped to monitor progress and improve planning. It should be noted that in 2010, 85 per cent of infants aged 0–5 months were exclu-sively breastfed in Rwanda, and almost 80 per cent of infants 6-8 months received timely introduction to solid, semi-solid or soft foods.
Lessons learned from the EPEM were incorporated into the subsequent National Multisectoral Strategy to Eliminate Malnutrition (NmSEM) in 2010. This strategy is being implemented primarily in communi-ties, guided by district-level multi-sectoral plans to strengthen and scale up nutrition interventions. The emphasis is on behaviour change communication to promote optimal nutrition practices during pregnancy and the first two years of the child’s life.
Improving Child Nutrition38
Responsive planning and monitoring at the local level have been bolstered by improvements in information-gathering capacity. An electronic health monitoring and information system integrates nutrition data and other local information, allowing for evaluation of district-level performance. More recently, techno-logical advances are supporting real-time collection of data on stunting – for example, rapid SMS will be used nationwide to track children’s progress during their first two years.
The elements of Rwanda’s approach include:
• Strong national resolve to eliminate malnutrition, by both the national government (championed by the President) and citizens.
• Rapid action to implement an emergency response followed by development of a long-term multi-sectoral strategy that incorporated lessons learned from earlier experiences.
• A community-centred approach to reducing stunting, with investment in both food secu-rity and behaviour change strategies to promote optimal nutrition practices in a sustainable manner.
• Decentralized planning, with strong monitoring and evaluation systems to improve programme performance.
Looking forwardRwanda joined the SUN movement in 2011, signalling its ongoing commitment to addressing undernutri-tion. The government now develops an annual Joint Action Plan to eliminate undernutrition. Coordination mechanisms need further strengthening as the nation transitions from sector-specific to multi-sectoral plan-ning and implementation. Rwanda is also working to maintain the quality of its interventions during the national scale-up, along with timely monitoring for continual improvement. Additional resources will be needed to invest in these efforts. In overcoming these challenges, Rwanda hopes to deliver on its vision of eliminating undernutrition across the country.
�Democratic Republic of the Congo: Scaling up community-based management of severe acute malnutrition
In the Democratic Republic of the Congo, severe acute malnutrition affected nearly 1 million children in 2011. However, a community-based approach is dramati-cally increasing the number of children receiving treatment for SAM – from fewer than 46,000 in 2007 to 157,000 in 2011.99
Until about a decade ago, efforts to treat SAM were mostly concentrated in the conflict-affected eastern provinces and were carried out mainly by humanitarian NGOs. To harmonize interventions, the government adopted a national protocol in 2002. It required hospitalization of all children with SAM, whether or not they had medical complications. This approach proved difficult to implement, given the limited number of treatment centres and the burden of hospitalization on families.
Key strategy: Evidence-based advocacy to build broad support for actionIn 2008, the country’s Ministry of Health undertook to address this problem. With technical support from Valid International and other NGOs, a protocol was developed that included community-based treatment, allowing parents to treat most children at home. Initially, the protocol was implemented mainly in the eastern provinces, but the following year sur-veys found that acute malnutrition was even more prevalent in four central and western provinces.100
Survey data were key to efforts to persuade the government to address undernutrition across the whole country, as well as to make the case for more funding with donors and for more presence in the central and western regions with NGOs. The commu-nity-based protocol was revised to ensure integration of SAM treatment into primary health services and to emphasize the importance of preventive interventions such as counselling and promotion of good infant and young child feeding and hygiene practices.
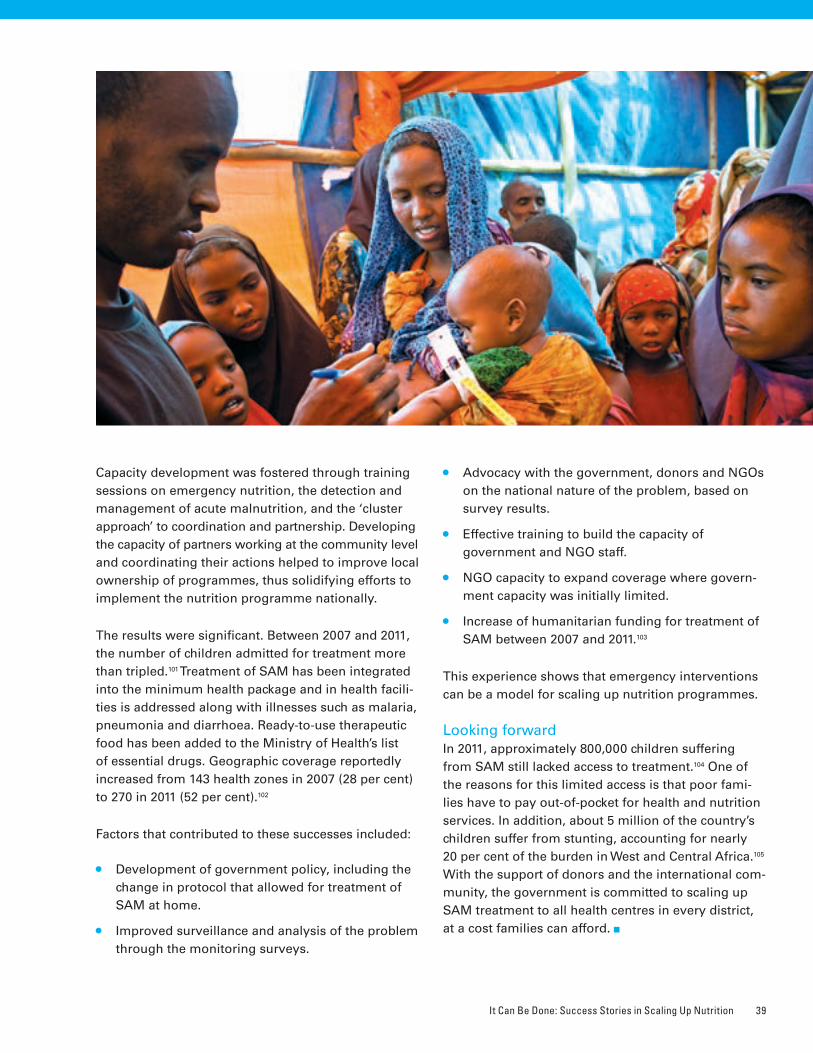
It Can Be Done: Success Stories in Scaling Up Nutrition 39
Capacity development was fostered through training sessions on emergency nutrition, the detection and management of acute malnutrition, and the ‘cluster approach’ to coordination and partnership. Developing the capacity of partners working at the community level and coordinating their actions helped to improve local ownership of programmes, thus solidifying efforts to implement the nutrition programme nationally.
The results were significant. Between 2007 and 2011, the number of children admitted for treatment more than tripled.101 Treatment of SAM has been integrated into the minimum health package and in health facili-ties is addressed along with illnesses such as malaria, pneumonia and diarrhoea. Ready-to-use therapeutic food has been added to the Ministry of Health’s list of essential drugs. Geographic coverage reportedly increased from 143 health zones in 2007 (28 per cent) to 270 in 2011 (52 per cent).102
Factors that contributed to these successes included:
• Development of government policy, including the change in protocol that allowed for treatment of SAM at home.
• Improved surveillance and analysis of the problem through the monitoring surveys.
• Advocacy with the government, donors and NGOs on the national nature of the problem, based on survey results.
• Effective training to build the capacity of government and NGO staff.
• NGO capacity to expand coverage where govern-ment capacity was initially limited.
• Increase of humanitarian funding for treatment of SAM between 2007 and 2011.103
This experience shows that emergency interventions can be a model for scaling up nutrition programmes.
Looking forwardIn 2011, approximately 800,000 children suffering from SAM still lacked access to treatment.104 One of the reasons for this limited access is that poor fami-lies have to pay out-of-pocket for health and nutrition services. In addition, about 5 million of the country’s children suffer from stunting, accounting for nearly 20 per cent of the burden in West and Central Africa.105 With the support of donors and the international com-munity, the government is committed to scaling up SAM treatment to all health centres in every district, at a cost families can afford.
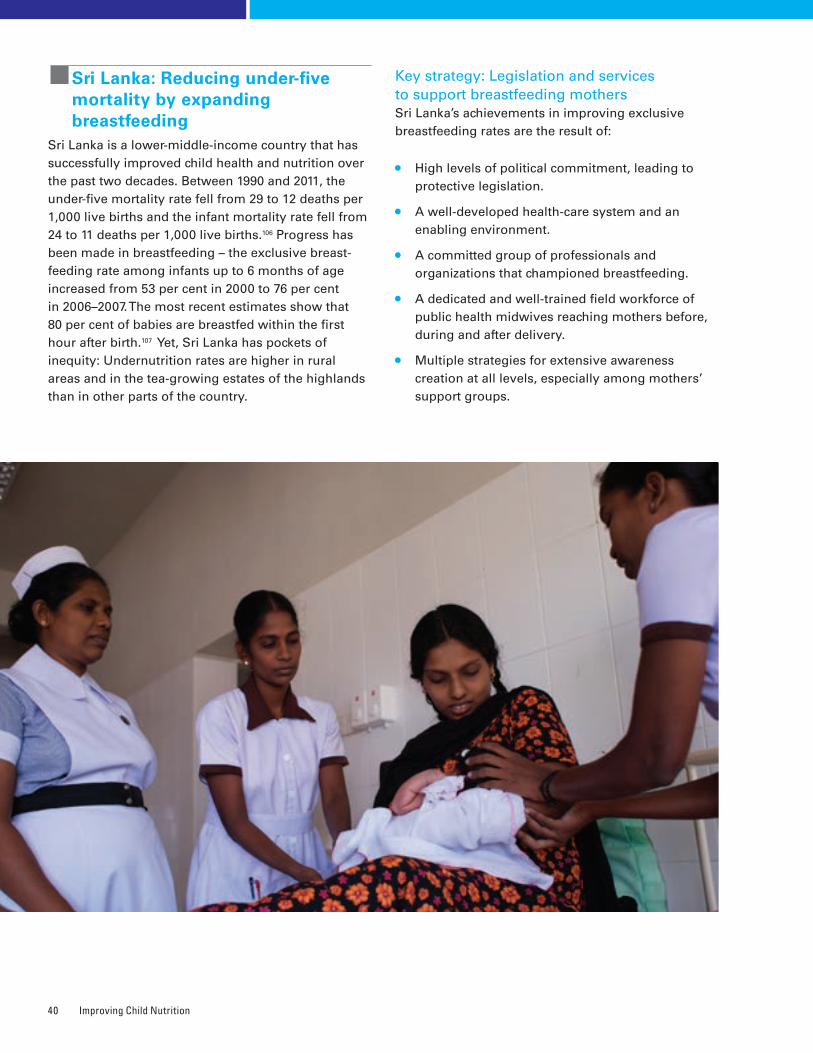
Improving Child Nutrition40
�Sri Lanka: Reducing under-five mortality by expanding breastfeeding
Sri Lanka is a lower-middle-income country that has successfully improved child health and nutrition over the past two decades. Between 1990 and 2011, the under-five mortality rate fell from 29 to 12 deaths per 1,000 live births and the infant mortality rate fell from 24 to 11 deaths per 1,000 live births.106 Progress has been made in breastfeeding – the exclusive breast-feeding rate among infants up to 6 months of age increased from 53 per cent in 2000 to 76 per cent in 2006–2007. The most recent estimates show that 80 per cent of babies are breastfed within the first hour after birth.107 Yet, Sri Lanka has pockets of inequity: Undernutrition rates are higher in rural areas and in the tea-growing estates of the highlands than in other parts of the country.
Key strategy: Legislation and services to support breastfeeding mothersSri Lanka’s achievements in improving exclusive breastfeeding rates are the result of:
• High levels of political commitment, leading to protective legislation.
• A well-developed health-care system and an enabling environment.
• A committed group of professionals and organizations that championed breastfeeding.
• A dedicated and well-trained field workforce of public health midwives reaching mothers before, during and after delivery.
• Multiple strategies for extensive awareness creation at all levels, especially among mothers’ support groups.
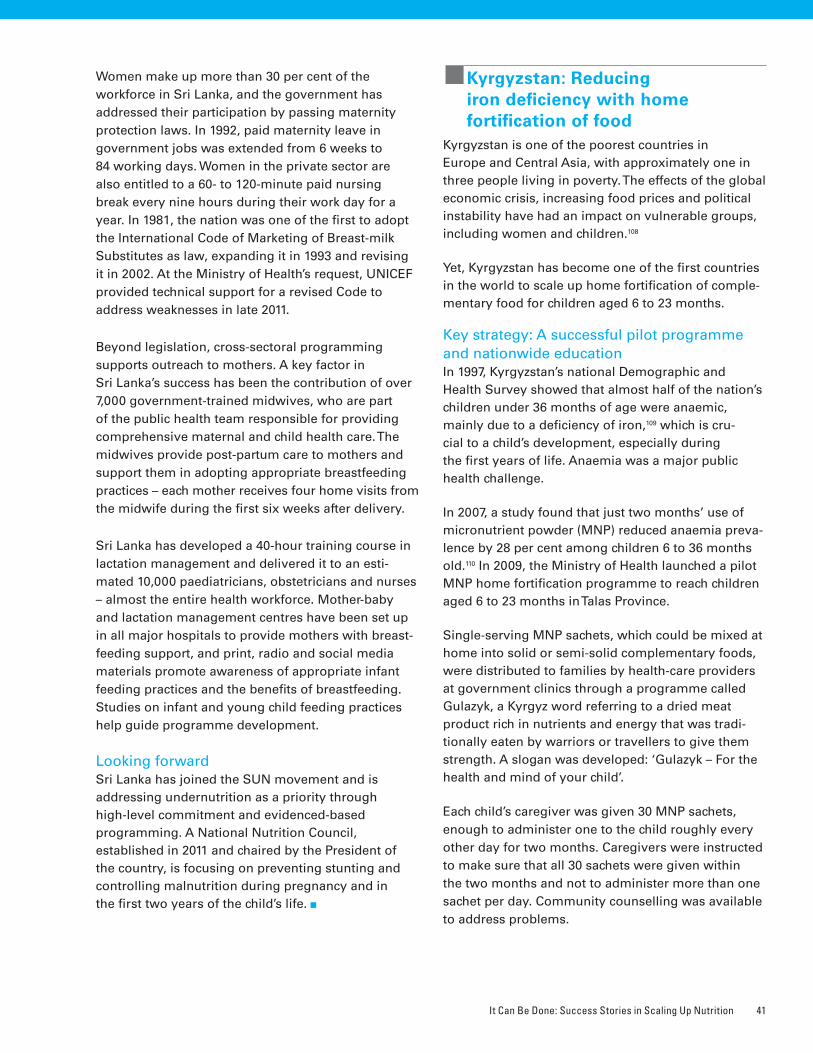
It Can Be Done: Success Stories in Scaling Up Nutrition 41
Women make up more than 30 per cent of the workforce in Sri Lanka, and the government has addressed their participation by passing maternity protection laws. In 1992, paid maternity leave in government jobs was extended from 6 weeks to 84 working days. Women in the private sector are also entitled to a 60- to 120-minute paid nursing break every nine hours during their work day for a year. In 1981, the nation was one of the first to adopt the International Code of Marketing of Breast-milk Substitutes as law, expanding it in 1993 and revising it in 2002. At the Ministry of Health’s request, UNICEF provided technical support for a revised Code to address weaknesses in late 2011.
Beyond legislation, cross-sectoral programming supports outreach to mothers. A key factor in Sri Lanka’s success has been the contribution of over 7,000 government-trained midwives, who are part of the public health team responsible for providing comprehensive maternal and child health care. The midwives provide post-partum care to mothers and support them in adopting appropriate breastfeeding practices – each mother receives four home visits from the midwife during the first six weeks after delivery.
Sri Lanka has developed a 40-hour training course in lactation management and delivered it to an esti-mated 10,000 paediatricians, obstetricians and nurses – almost the entire health workforce. Mother-baby and lactation management centres have been set up in all major hospitals to provide mothers with breast-feeding support, and print, radio and social media materials promote awareness of appropriate infant feeding practices and the benefits of breastfeeding. Studies on infant and young child feeding practices help guide programme development.
Looking forwardSri Lanka has joined the SUN movement and is addressing undernutrition as a priority through high-level commitment and evidenced-based programming. A National Nutrition Council, established in 2011 and chaired by the President of the country, is focusing on preventing stunting and controlling malnutrition during pregnancy and in the first two years of the child’s life.
�Kyrgyzstan: Reducing iron deficiency with home fortification of food
Kyrgyzstan is one of the poorest countries in Europe and Central Asia, with approximately one in three people living in poverty. The effects of the global economic crisis, increasing food prices and political instability have had an impact on vulnerable groups, including women and children.108
Yet, Kyrgyzstan has become one of the first countries in the world to scale up home fortification of comple-mentary food for children aged 6 to 23 months.
Key strategy: A successful pilot programme and nationwide educationIn 1997, Kyrgyzstan’s national Demographic and Health Survey showed that almost half of the nation’s children under 36 months of age were anaemic, mainly due to a deficiency of iron,109 which is cru-cial to a child’s development, especially during the first years of life. Anaemia was a major public health challenge.
In 2007, a study found that just two months’ use of micronutrient powder (MNP) reduced anaemia preva-lence by 28 per cent among children 6 to 36 months old.110 In 2009, the Ministry of Health launched a pilot MNP home fortification programme to reach children aged 6 to 23 months in Talas Province.
Single-serving MNP sachets, which could be mixed at home into solid or semi-solid complementary foods, were distributed to families by health-care providers at government clinics through a programme called Gulazyk, a Kyrgyz word referring to a dried meat product rich in nutrients and energy that was tradi-tionally eaten by warriors or travellers to give them strength. A slogan was developed: ‘Gulazyk – For the health and mind of your child’.
Each child’s caregiver was given 30 MNP sachets, enough to administer one to the child roughly every other day for two months. Caregivers were instructed to make sure that all 30 sachets were given within the two months and not to administer more than one sachet per day. Community counselling was available to address problems.
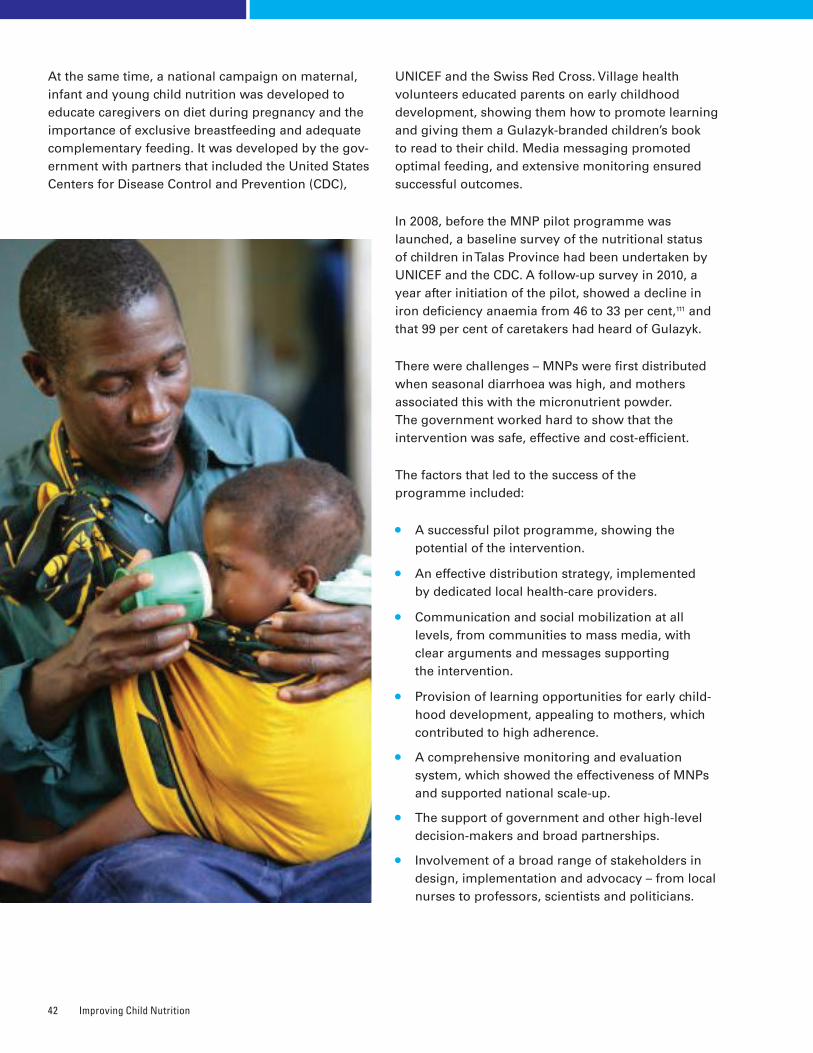
Improving Child Nutrition42
At the same time, a national campaign on maternal, infant and young child nutrition was developed to educate caregivers on diet during pregnancy and the importance of exclusive breastfeeding and adequate complementary feeding. It was developed by the gov-ernment with partners that included the United States Centers for Disease Control and Prevention (CDC),
UNICEF and the Swiss Red Cross. Village health volunteers educated parents on early childhood development, showing them how to promote learning and giving them a Gulazyk-branded children’s book to read to their child. Media messaging promoted optimal feeding, and extensive monitoring ensured successful outcomes.
In 2008, before the MNP pilot programme was launched, a baseline survey of the nutritional status of children in Talas Province had been undertaken by UNICEF and the CDC. A follow-up survey in 2010, a year after initiation of the pilot, showed a decline in iron deficiency anaemia from 46 to 33 per cent,111 and that 99 per cent of caretakers had heard of Gulazyk.
There were challenges – MNPs were first distributed when seasonal diarrhoea was high, and mothers associated this with the micronutrient powder. The government worked hard to show that the intervention was safe, effective and cost-efficient.
The factors that led to the success of the programme included:
• A successful pilot programme, showing the potential of the intervention.
• An effective distribution strategy, implemented by dedicated local health-care providers.
• Communication and social mobilization at all levels, from communities to mass media, with clear arguments and messages supporting the intervention.
• Provision of learning opportunities for early child-hood development, appealing to mothers, which contributed to high adherence.
• A comprehensive monitoring and evaluation system, which showed the effectiveness of MNPs and supported national scale-up.
• The support of government and other high-level decision-makers and broad partnerships.
• Involvement of a broad range of stakeholders in design, implementation and advocacy – from local nurses to professors, scientists and politicians.
It Can Be Done: Success Stories in Scaling Up Nutrition 43
Looking forwardAs part of its national nutrition programme, Kyrgyzstan is now reaching 250,000 children with Gulazyk. Local production of MNPs is under consider-ation, and the government is working to evaluate the programme’s performance and impact. The initiative has clearly shown that iron deficiency anaemia can be reduced in children aged 6 to 23 months. As the programme is scaled up nationwide, careful and con-tinuous monitoring and evaluation are expected to ensure quality and reach, show results and maintain the support of all stakeholders. The country has joined the SUN movement and is committed to scaling up nutrition programming to benefit all of its children.
�United Republic of Tanzania: Institutionalizing vitamin A supplementation
The United Republic of Tanzania has maintained high coverage of vitamin A supplementation (VAS) among children aged 6–59 months since twice-yearly supple-mentation events were introduced in 2001.112 Between 2005 and 2011, national coverage of vitamin A supple-mentation has consistently exceeded 90 per cent.113 High coverage is one of the key factors in the country’s declining rate of child mortality,114 from 126 deaths per 1,000 live births in 2000 to 68 per 1,000 in 2011.115
The country has maintained this coverage and in recent years has been working to strengthen national and district ownership by empowering local govern-ment authorities to take responsibility for planning and budgeting the vitamin A programme. The United Republic of Tanzania is among a group of countries taking the initiative to build national and local ownership of vitamin A programming.
Key strategy: Using Health Basket Funds to maintain coverageVitamin A supplements are delivered to children aged 6 to 59 months through twice-yearly events and routine health services. Until 2006, operational costs to support supplementation in each of the country’s districts were funded directly by UNICEF; a more sus-tainable, government-led solution was thus needed. For the 2007–2008 fiscal year, funds contributed by
the Canadian International Development Agency to UNICEF for the operational costs of VAS (US$ 500,000) were channelled to districts through the Health Basket Fund of the Ministry of Health and Social Welfare. This arrangement continued until fiscal year 2010–2011.
Health Basket Funds are not earmarked for specific interventions, so it was essential to ensure that dis-tricts allocated adequate resources for VAS in their annual budgets. Helen Keller International helped strengthen district capacity to plan and budget for the operational costs of distributing supplements, working through A2Z, the USAID Micronutrient and Child Blindness Project, in collaboration with the government’s Tanzania Food and Nutrition Centre and UNICEF. Advocacy and capacity development events are organized during the annual planning and budgeting cycle to inform district health departments about the benefits of VAS and to strengthen planning and budgeting capacity.
A VAS sustainability assessment in 2007 had led to the creation of a simple, spreadsheet-based planning and budgeting tool, which was introduced in 2008 to help districts determine financial, human resource and supply needs. District health management teams were equipped with information, evidence and skills to defend VAS budgets to local government authori-ties. Advocacy was focused on district executive directors and councillors involved in decision-making. District financial allocations and VAS coverage rates were closely monitored to track the impact of all these efforts and ensure there were no negative conse-quences of transferring responsibility for planning and budgeting to the districts. Districts that budgeted insufficient funds or that had low VAS coverage were targeted for more intensive advocacy, including sustainability assessments and additional training.
Several factors supported the institutionalization of VAS:
• Strong partnerships were fostered among international agencies, NGOs, donors and the national government. Partners sought to find feasible solutions to promote VAS, building on knowledge generated from earlier studies.
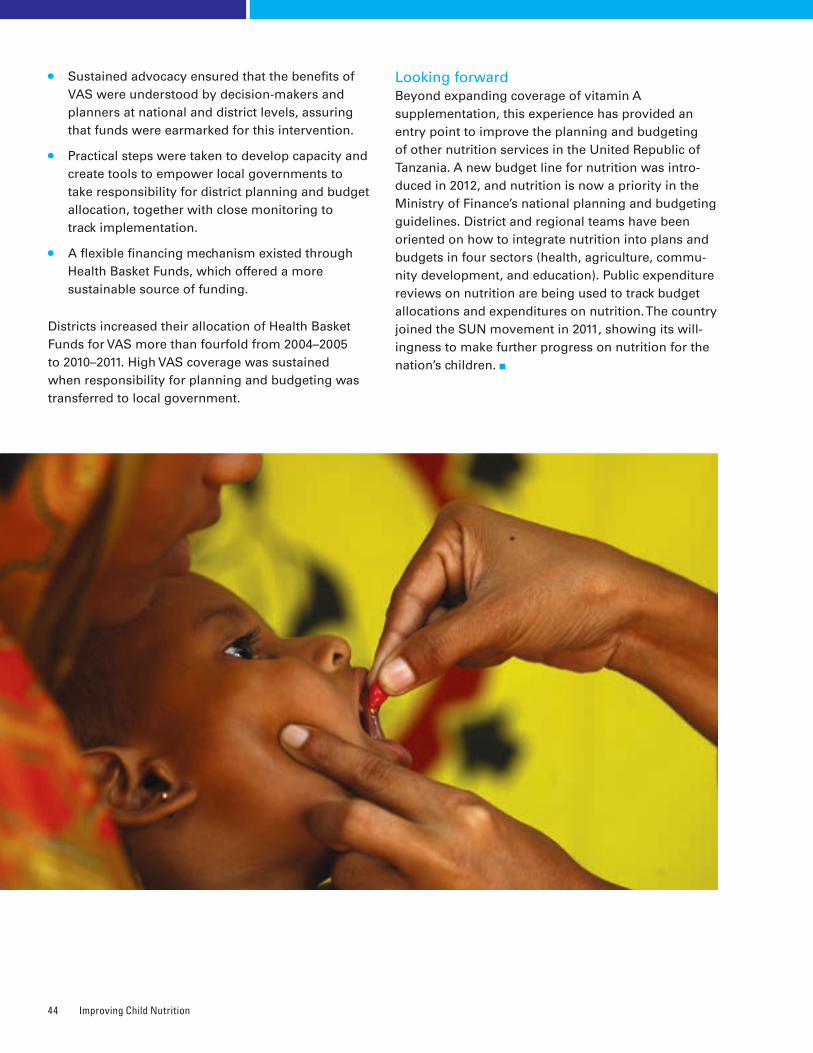
Improving Child Nutrition44
• Sustained advocacy ensured that the benefits of VAS were understood by decision-makers and planners at national and district levels, assuring that funds were earmarked for this intervention.
• Practical steps were taken to develop capacity and create tools to empower local governments to take responsibility for district planning and budget allocation, together with close monitoring to track implementation.
• A flexible financing mechanism existed through Health Basket Funds, which offered a more sustainable source of funding.
Districts increased their allocation of Health Basket Funds for VAS more than fourfold from 2004–2005 to 2010–2011. High VAS coverage was sustained when responsibility for planning and budgeting was transferred to local government.
Looking forwardBeyond expanding coverage of vitamin A supplementation, this experience has provided an entry point to improve the planning and budgeting of other nutrition services in the United Republic of Tanzania. A new budget line for nutrition was intro-duced in 2012, and nutrition is now a priority in the Ministry of Finance’s national planning and budgeting guidelines. District and regional teams have been oriented on how to integrate nutrition into plans and budgets in four sectors (health, agriculture, commu-nity development, and education). Public expenditure reviews on nutrition are being used to track budget allocations and expenditures on nutrition. The country joined the SUN movement in 2011, showing its will-ingness to make further progress on nutrition for the nation’s children.
It Can Be Done: Success Stories in Scaling Up Nutrition 45
�Viet Nam: Protecting breastfeeding through legislation
Viet Nam’s exclusive breastfeeding rates, at about 17 per cent, have not improved since 1997;116 they have been hindered by inadequate provisions of maternity leave and aggressive promotion of breast-milk substitutes. A 2011 study by Alive & Thrive, an initiative promoting good infant and young child feeding practices, cited returning to work as one of the main reasons mothers stopped exclusive breastfeeding. At the same time, poor regulation of marketing of breastmilk substitutes had made artificial feeding extremely popular in the Asia-Pacific region. The region accounts for 31 per cent of global retail value of baby food sales, compared with 24 per cent in Western Europe and 22 per cent in North America.117 In response, Viet Nam’s National Assembly recently enacted legislation that extends paid maternity leave and bans advertising of breastmilk substitutes for infants up to 24 months.
Key strategy: Joint advocacy by diverse partners to persuade lawmakersThe new legislation is the result of an advocacy strategy implemented by a group of partners that included the Vietnamese National Assembly’s Institute of Legislative Studies, the Ministry of Health, UNICEF, the World Health Organization, Alive & Thrive and other organizations. The partners drew legislators’ attention to the 1981 International Code of Marketing of Breast-milk Substitutes and subsequent World Health Assembly resolutions and the 2000 International Labour Organization Maternity Protection Convention and Recommendation. These interna-tional regulatory frameworks were used to persuade legislators of the need to protect the nutritional and breastfeeding rights of mothers and their babies. Also highlighted were the government’s obligations under the Convention on the Rights of the Child, which addresses breastfeeding specifically in article 24.
Information on the proposed legislation was provided to the 200 members of the National Assembly and to policy advisers from Provincial Parliament Offices during consultative meetings held at regional and
provincial levels. Participants discussed the scientific evidence on breastfeeding, international standards and the socio-economic challenges to meeting the standards.
They learned that breastmilk substitutes are vulnerable to mixing mistakes, manufacturing errors and contamination, which contribute to increases in disease and child death.
Advocacy efforts paid off. On 21 June 2012, the National Assembly passed a Law on Advertisement banning promotion of breastmilk substitutes for children up to the age of 24 months. A provision in the Labour Code extending paid maternity leave from four to six months also passed by an overwhelming majority. Both these provisions were passed with more than 90 per cent of the votes.
The combination of strategies that helped Viet Nam achieve these results included:
• Identification of key operational partners and of their comparative advantage in influencing policy dialogue and evidence generation.
• Use of stakeholder mapping to identify key coun-terparts: the Ministry of Health; the Ministry of Labour, Invalids and Social Affairs; the Women’s Union; the General Confederation of Labour; and the Institute of Legislative Studies.
• Monitoring of progress and updates from counter-parts, including daily updates prior to approval of the law, which helped spur timely action.
• Careful preparation of evidence-based advocacy materials illustrating the problem; explaining the harmful health, social and economic impact for individuals, families, communities and the nation as a whole; and providing information on regula-tory solutions within the context of internationally agreed instruments.
• Face-to-face advocacy with counterparts, providing consistent messages, evidence, facts and statistics to support the course of action being recommended.
Improving Child Nutrition46
The process was arduous at times. Some National Assembly members and other stakeholders became hesitant to expand the advertising ban when interest groups raised concerns about violation of interna-tional trade laws. The partners responded with proof that the measures were perfectly compatible with world trade rules. They also maintained that adop-tion of the proposed measures would improve the country’s efforts to fulfil its obligations under the Convention on the Rights of the Child. In addition, they provided evidence from a monitoring exercise that revealed the harmful marketing practices that were taking place, the impact on child development and the extent to which the country was lagging behind the rest of the world in terms of protection, promotion and support of breastfeeding.
Another barrier was the assumption that employers and even female workers themselves did not want extended maternity leave. This was addressed through a survey by the General Confederation of Labour, which found that 80 per cent of employers
and nearly 90 per cent of female workers supported
six months of paid maternity leave. The government
confirmed that funds were sufficient to cover the cost.
As an added persuasion, estimates were presented
suggesting that the effect of improved breastfeeding
practices on children’s health in later life could
help Viet Nam save millions of dollars in long-term
health-care costs.
Looking forwardThe next steps include monitoring enforcement of
this new legislation and educating mothers and
communities on the importance of breastfeeding
their babies, particularly exclusive breastfeeding for
the first six months. The partners will support the
Government of Viet Nam in disseminating informa-
tion, developing the capacities of key stakeholders
such as health workers and ensuring that all primary-
health-care facilities provide skilled counselling and
support for breastfeeding so that all mothers have
access to these services close to their homes.
New Developments in Global Partnerships 47
Chapter 6NEW DEVELOPMENTS IN GLOBAL PARTNERSHIPS
Improving nutrition, particularly of children and women, is increasingly recognized as
imperative for reducing poverty, promoting sustainable social and economic development
and narrowing inequities� The existence of solutions and the formation of new partnerships
committed to taking action have created an unprecedented opportunity to address child under-
nutrition through country-led, cross-sectoral actions based on evidence� This report does not
review all of these partnerships, but rather highlights two initiatives in which UNICEF plays a
major role�
Scaling Up Nutrition Launched in 2010, the SUN movement is catalysing action to build national commitment to accelerate progress in reducing undernutrition and stunting. It works through implementation of evidence-based nutrition interventions and integration of nutrition goals across diverse sectors – health, social protec-tion, poverty alleviation, national development and agriculture – focusing on the window of opportunity of the 1,000 days covering pregnancy and the child’s first two years.
Globally, more than 30 countries have joined the SUN movement and are working with multiple stakeholders to scale up their nutrition programmes, supported by donor countries, United Nations orga-nizations, civil society and the private sector. Working together, these stakeholders support country-led efforts to scale up nutrition, increasing access to resources, both financial and technical, to improve coordination of nutrition-specific interventions and
nutrition-sensitive approaches. SUN focuses on both the short term (recognizing nutrition’s crucial role in improving maternal and child health) and the long term (building the foundation for a healthy, more prosperous future and resilience in times of crisis).
The SUN movement Lead Group was established in 2012 by the United Nations Secretary-General to improve coherence, provide strategic oversight, improve resource mobilization and ensure collec-tive accountability. Members of the Lead Group are high-level leaders who represent the array of partners engaged in SUN, including heads of state, donors, civil society, business and the United Nations system. In September 2012, the Lead Group agreed to a new strategy with specific, measurable targets for the next two to three years. More work is needed to encourage countries to join SUN – just 5 of the 10 countries with the highest burden of stunting have joined the movement.
Improving Child Nutrition48
REACHA key partner in SUN is REACH – Renewed Efforts Against Child Hunger and Undernutrition – under which the World Food Programme, UNICEF, the Food and Agriculture Organization of the United Nations and the World Health Organization have made com-mitments. REACH helps to coordinate multiple agencies and governments, including ministries of health, agriculture, education and finance, as they design and implement national child undernutrition policies and programmes.
REACH is increasing the emphasis on strengthening nutrition management and governance while also supporting multi-sectoral nutrition actions, including nutrition-sensitive programmatic approaches. This
shift aligns with the SUN movement, which has stressed the need for nutrition-sensitive development. Donors and other partners consider REACH a valuable capacity-development and coordination mechanism for mainstreaming nutrition management and gov-ernance, as well as a key vehicle for supporting SUN in countries.
REACH is currently operational in 13 countries: Bangladesh, Ethiopia, Ghana, the Lao People’s Democratic Republic, Mali, Mauritania, Mozambique, Nepal, Niger, Rwanda, Sierra Leone, Uganda and the United Republic of Tanzania. REACH is working in synergy with SUN, helping to plan implementation of Sierra Leone’s food and nutrition policy, for example, and acting as a catalyst in establishing a civil society alliance for SUN in Bangladesh.
The MDG Achievement Fund (MDG-F or MDG-Fund) was established in 2007 following an agreement between the Government of Spain and the United Nations system. The aim was to accelerate progress towards achievement of the MDGs, primarily by supporting 130 joint programmes in 50 countries in thematic areas corre-sponding to the goals. A central tenet of the MDG-Fund’s programmes is their ‘jointness’– bringing together multiple United Nations agencies to ‘deliver as one’ at the country level, in keeping with the common United Nations Development Assistance Framework.
UNICEF is the lead convenor agency for the Children, Food Security and Nutrition thematic area, covering 24 joint programmes. Each of these has tried to spur innovation by capitalizing on the strengths and expertise of the individual partners and encouraging all to focus on achieving strong and equitable results.
For example, in Timor-Leste, multiple United Nations agencies and national partners are working to improve comple-mentary feeding practices through numerous activities. These include cultivating home gardens and aquacul-ture to improve access to diverse, locally available foods and generate income; holding cooking demonstrations to educate mothers about how to prepare safe, nutritious foods; and working with mother support groups to improve knowledge of safe infant and young child feeding practices.
The joint programme in Mauritania is working to strengthen the capacity of government officials and other stake-holders to coordinate implementation of multi-sectoral nutrition and food security policies. The programme was designed following a joint analysis conducted by REACH and its partners, benefiting from the country’s previous experience in joint programming. An innovative aspect
of this programme is the establishment of flexible operational coordination mechanisms at national, regional and local levels. At the local level, decentral-ized implementation has allowed for experimentation with different coordi-nation mechanisms. Nutrition and food security task teams collaborate with communities to coordinate a community-owned response to undernutrition. Early results suggest that these mechanisms have improved the effectiveness of the joint programmes and encour-aged local ownership. They have also provided a platform to respond flexibly to local conditions.
The work of all joint programmes is aligned with national priorities and supported by inclusive partnerships, helping to ensure programme relevance and sustainability.
BOX 5 Millennium Development Goals Achievement Fund – Joint programming for children, food security and nutrition
The Way Forward 49
Chapter 7THE WAY FORWARD
Over the past few years, national and global interest in nutrition has increased dramatically�
There are a number of reasons for this new interest�
Recurrent food shortages, rising food prices and humanitarian crises in some regions have garnered global attention. The debate on climate change and the focus on building resilience in communities under stress have also focused attention on nutrition. At the other end of the spectrum, the rising numbers of people who struggle with overweight and obesity have become more glaring.
More persuasive evidence has become available on the harmful consequences of micronutrient deficiencies and the positive impact of exclusive breastfeeding and adequate complementary feeding for adult life and the next generation. At the same time, evidence has improved on the effectiveness of programme approaches to treat conditions such as severe acute malnutrition using ready-to-use thera-peutic foods and iron and folic acid deficiency using wheat flour fortification – as well as on the feasibility of implementing these programmes at scale.
Scientific knowledge and understanding have also improved regarding the linkages between stunting and rapid and disproportionate weight gain in early childhood. This has resulted in a shift in response. Previously the focus was on efforts to reduce the prevalence of underweight among children under the age of 5, an indicator of MDG 1. Now it is shifting towards prevention of stunting during the period from pregnancy up to 2 years of age.
The improved scientific evidence on the impact of interventions has enhanced advocacy to position nutrition as a sound investment for poverty reduction and social and economic development.
A unified international nutrition community has been using the Scaling Up Nutrition movement to suc-cessfully advocate for reduction of stunting, acute malnutrition and micronutrient deficiencies. This mes-sage has been heard and echoed by other initiatives and channels, including the Secretary-General’s Zero Hunger Challenge, the 1,000 Days initiative and the Copenhagen Consensus 2012 Expert Panel’s findings that malnourishment should be the top priority for policymakers and philanthropists. The G8 has also included action to address stunting and other forms of undernutrition in its agenda.
As of the end of 2012, the SUN message had led more than 30 countries in Africa, Asia and Latin America to scale up their nutrition programmes, supported by a wide range of organizations and, in many cases, by the donor community. This is probably the clearest indication of the growing interest in tackling stunting and other forms of undernutrition. It is crucial to maintain this momentum and to further increase the level of interest and motivation.
Improving Child Nutrition50
How can this be done? By showing that success in the foreseeable future is not only possible, but realisti-cally achievable. The 2009 Tracking Progress on Child and Maternal Nutrition report showed that there was scientific evidence supporting a set of interventions to improve nutritional status. This report goes a step further, showing that programmatic approaches and the experience necessary to implement these inter-ventions at scale exist, and that the nutritional status of populations can improve significantly as a result.
A number of common determinants are at the basis of the successful implementation of the examples described in Chapter 5. These include the political commitment to reduce stunting and other forms of undernutrition; the design and implementation of comprehensive and effective national policy and programmes based on sound situation analysis; the presence of trained and skilled community workers collaborating with communities; effective commu-nication and advocacy; and multi-sectoral delivery of services.
These and other positive experiences must be consistently and constantly used to advocate with policymakers and decision-makers, especially those who are not familiar with nutrition and its impor-tance for health and development. Advocacy efforts have proved effective in recent years, but more work is needed to sustain the interest and motivation of governments, particularly to maintain budgetary commitments and expansion of programmes. Global initiatives should play a major role in this effort to keep nutrition in the spotlight.
An expanded range of interventions is needed in many countries to address stunting and other nutri-tion indicators. Maternal nutrition has a large impact on infant nutritional status, and not enough inter-ventions to improve maternal nutrition are being implemented at scale across countries. Many coun-tries have an official iron-folic acid supplementation programme for pregnant women, but in most cases its implementation is not optimal. Other proven options are not being used to the fullest extent, such as multi-micronutrient supplements, improving nutrient intake using locally available foods, pro-viding food supplements where appropriate, and deworming.
Programmes to improve complementary feeding for children aged 6 to 24 months also require expansion. The same is true of efforts to improve nutritional status among adolescent girls. Adolescence presents an opportune and receptive time to promote healthy nutrition behaviours, and this opportunity must be harnessed.
Continued research is needed to strengthen the knowl-edge of the causes and consequences of stunting and other forms of undernutrition. The intergenerational impact of undernutrition, and the relationship between the timing of deficiencies during pregnancy and developmental impact after birth, and between early growth retardation and overweight, are only beginning to be understood. Applied research is also required to improve an understanding of effective programme approaches and strategies to improve caring practices, reduce child overweight through stunting prevention and improve both distribution and use of food and micronutrient supplements. Lipid-based supplements have been shown to reduce stunting and improve child development, but more evidence would strengthen understanding of their impact and possible use in var-ious target groups, such as pregnant women, and help in the design of programme strategies to reach them.
Stunting and other forms of undernutrition are also linked to health, food availability, water and sanita-tion, cultural practices and social and political factors. But evidence on how improving these factors affects nutritional status is still limited. Few programmes aiming to improve these factors have the co-objective of improving nutrition of women and children, so nutritional status is rarely used as an indicator to gauge their success. As a result, information on cost-effectiveness is lacking.
This report notes the need for household food security to attain optimal nutrition, but the limited evi-dence base on the impact of agricultural interventions on child nutrition highlights the need for more work in this area. Similarly, the impact of social safety net programmes needs further documentation to improve the effectiveness of this intervention. These issues are of special importance in countries that experience regular food shortages and need to build resilience to such shocks to prevent the tragedies that require large numbers of children to be treated for severe acute malnutrition.
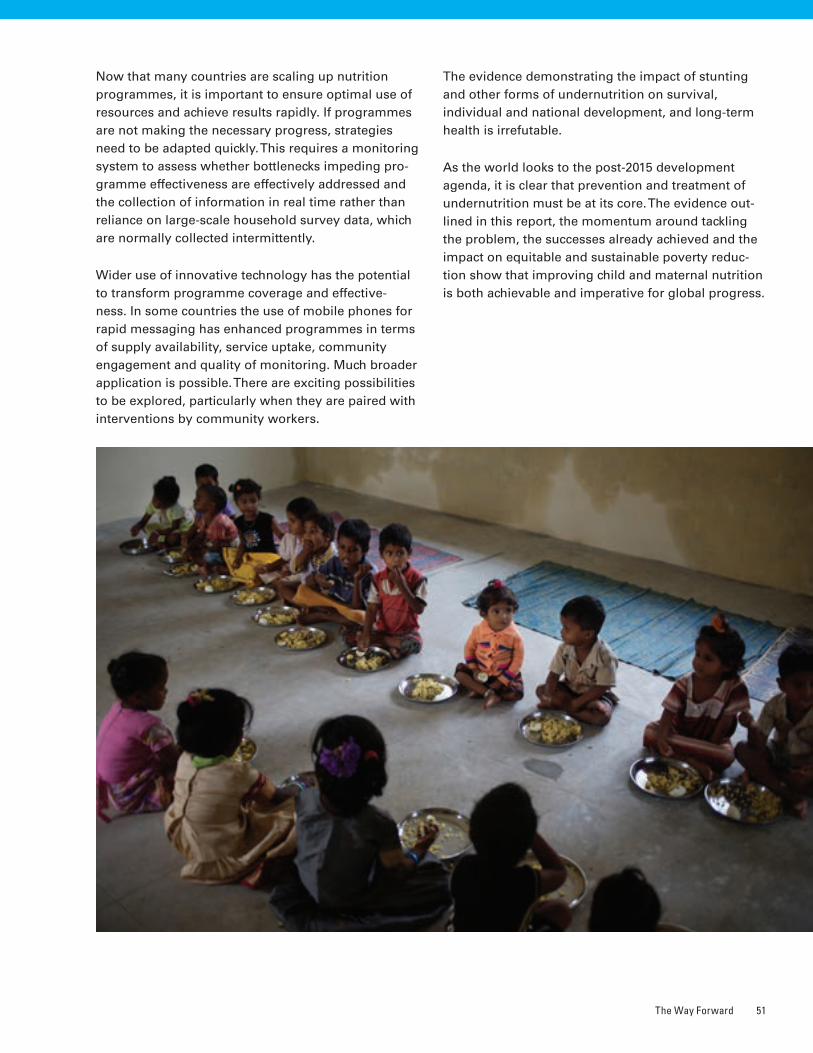
The Way Forward 51
Now that many countries are scaling up nutrition programmes, it is important to ensure optimal use of resources and achieve results rapidly. If programmes are not making the necessary progress, strategies need to be adapted quickly. This requires a monitoring system to assess whether bottlenecks impeding pro-gramme effectiveness are effectively addressed and the collection of information in real time rather than reliance on large-scale household survey data, which are normally collected intermittently.
Wider use of innovative technology has the potential to transform programme coverage and effective-ness. In some countries the use of mobile phones for rapid messaging has enhanced programmes in terms of supply availability, service uptake, community engagement and quality of monitoring. Much broader application is possible. There are exciting possibilities to be explored, particularly when they are paired with interventions by community workers.
The evidence demonstrating the impact of stunting and other forms of undernutrition on survival, individual and national development, and long-term health is irrefutable.
As the world looks to the post-2015 development agenda, it is clear that prevention and treatment of undernutrition must be at its core. The evidence out-lined in this report, the momentum around tackling the problem, the successes already achieved and the impact on equitable and sustainable poverty reduc-tion show that improving child and maternal nutrition is both achievable and imperative for global progress.
Improving Child Nutrition52
REFERENCES
CHAPTER 21 Biological programming refers to the process by which exposure
to a stimulus or insult during a critical period of development can change the predisposition to developing disease, with long-term consequences.
2 Victora, Cesar G., et al., ‘Worldwide Timing of Growth Faltering: Revisiting implications for interventions’, Pediatrics, vol. 125, no. 3, 1 February 2010, p. e473.
3 Walker, Susan P., et al., ‘Inequality in Early Childhood: Risk and protective factors for early child development’, Lancet, vol. 378, no. 9799, 8 October 2011, pp. 1328, 1334.
4 Özaltin, Emre, Kenneth Hill and S. V. Subramanian, ‘Association of maternal stature with offspring mortality, underweight, and stunting in low- to middle-income countries’. JAMA, vol. 303, no. 15, 21 April 2010, pp. 1507–1516.
5 Lawn, Joy E., Simon Cousens and Jelka Zupan, ‘4 Million Neonatal Deaths: When? Where? Why?’, Lancet, vol. 365, no. 9462, 5 March 2005, p. 347.
6 UNICEF Global Databases, 2012.
7 Black, Robert E., et al., ‘Maternal and Child Undernutrition: Global and regional exposures and health consequences’, Lancet, vol. 371, no. 9608, 19 January 2008, pp. 243–260. See especially Table 2.
8 Victora, Cesar G., et al., ‘Maternal and Child Undernutrition: Consequences for adult health and human capital’, Lancet, vol. 371, no. 9609, 26 January 2008, p. 340; Almond, Douglas, and Janet Currie, ‘Human Capital Development before Age Five’, Handbook of Labor Economics, vol. 4B, 2011, pp. 1315–1486; Martorell, Reynaldo, et al., ‘The Nutrition Intervention Improved Adult Human Capital and Economic Productivity’, Journal of Nutrition, vol. 140, no. 2, February 2010, pp. 411–414.
9 Dewey, Kathryn G., and K. Begum, ‘Long-term Consequences of Stunting in Early Life’, Maternal and Child Nutrition, vol. 7, October 2011, pp. 5–18; Grantham-McGregor, S., et al., ‘Developmental Potential in the First 5 Years for Children in Developing Countries’, Lancet, vol. 369, no. 9555, 6 January 2007, p. 65.
10 Martorell, Reynaldo, et al., ‘Weight Gain in the First Two Years of Life Is an Important Predictor of Schooling Outcomes in Pooled Analyses from Five Birth Cohorts from Low- and Middle-Income Countries’, Journal of Nutrition, vol. 140, no. 2, February 2010, pp. 348–354.
11 Grantham-McGregor, S., et al., ‘Developmental Potential in the First 5 Years for Children in Developing Countries’, Lancet, vol. 369, no. 9555, 6 January 2007, p. 67.
12 Cusick, Sarah E., and Michael K. Georgieff, ‘Nutrient Supplementation and Neurodevelopment: Timing Is the Key’, Archives of Pediatrics and Adolescent Medicine, vol. 166, no. 5, May 2012, pp. 481–482.
13 Martorell, Reynaldo, et al., ‘Weight Gain in the First Two Years of Life Is an Important Predictor of Schooling Outcomes in Pooled Analyses from Five Birth Cohorts from Low- and Middle-Income Countries’, pp. 348–354.
14 Lien, Nguyen M., Knarig K. Meyer and Myron Winick, ‘Early Malnutrition and “Late” Adoption: A study of their effects on the development of Korean orphans adopted into American families’, American Journal of Clinical Nutrition, vol. 30, no. 10, October 1977, pp. 1738–1739.
15 Stoch, Mavis B., and P. M. Smythe, ‘15-year Developmental Study on Effects of Severe Undernutrition During Infancy on Subsequent Physical Growth and Intellectual Functioning’, Archives of Disease in Childhood, vol. 51, no. 327, 1976, pp. 332–333.
16 Uauy, Ricardo, Juliana Kain and Camila Corvalan, ‘How Can the Developmental Origin of Health and Disease [DOHaD] Hypothesis Contribute to Improving Health in Developing Countries?’ American Journal of Clinical Nutrition, vol. 94, no. 6 (Suppl.), 4 May 2011, p. 1759S; Norris, Shane, et al., ‘Size at Birth, Weight Gain in Infancy and Childhood, and Adult Diabetes Risk in Five Low and Middle Income Country Birth Cohorts’, Diabetes Care, vol. 35, no. 1,
18 November 2011, pp. 72–79; Barker, David J. P., ‘Maternal Nutrition, Fetal Nutrition, and Disease in Later Life’, Nutrition, vol. 13, no. 9, September 1997, pp. 807–813.
17 Wells, Jonathan C. K., et al., ‘Associations of Intrauterine and Postnatal Weight and Length Gains with Adolescent Body Composition: Prospective birth cohort study from Brazil’, Journal of Adolescent Health, vol. 51, no. 6, December 2012, pp. S58–S64; Kuzawa, Christopher W., et al., ‘Birth Weight, Postnatal Weight Gain, and Adult Body Composition in Five Low and Middle Income Countries’, American Journal of Human Biology, vol. 24, no. 1, January–February 2012, p. S62.
18 Black et al., ‘Maternal and Child Undernutrition’, pp. 243–260.
CHAPTER 319 The values of the anthropometric indicators were calculated using the
WHO standard growth reference. The sources of the data are nationally representative household surveys, such as UNICEF-supported Multiple Indicator Cluster Surveys (MICS), USAID-supported Demographic and Health Surveys (DHS) and other national surveys.
20 Global and regional estimates in this chapter reflect those consistent with the UNICEF, WHO, World Bank Joint Child Malnutrition Estimates from analysis of the Joint Global Nutrition database from 1990 to 2011. The data presented here supersede relevant historical data published by UNICEF and WHO. Further details of the harmonized methodology are available at <www.childinfo.org/malnutrition.html>.
21 UNICEF Global Nutrition Database, 2012.
CHAPTER 422 Walker, Susan P., et al., ‘Inequality in Early Childhood: Risk and
protective factors for early child development’, Lancet, vol. 378, no. 9799, 8 October 2011, pp. 1325–1338.
23 Fall, Caroline H. D., et al., ‘Multiple Micronutrient Supplementation During Pregnancy in Low-income Countries: A meta-analysis of effects on birth size and length of gestation’, supplement, Food and Nutrition Bulletin, vol. 30, no. S 4, 2009, pp. 533–546.
24 Imdad, Aamer, and Zulfiqar A. Bhutta, ‘Maternal Nutrition and Birth Outcomes: Effect of balanced protein–energy supplementation’, Paediatric and Perinatal Epidemiology, vol. 26, no. s1, July 2012, pp. 178–190.
25 Chaparro, Camila M., and Kathryn G. Dewey, ‘Use of Lipid-based Nutrient Supplements (LNS) to Improve the Nutrient Adequacy of General Food Distribution Rations for Vulnerable Sub-groups in Emergency Settings’, Maternal and Child Nutrition, vol. 6, January 2010, pp. 1–69.
26 UNICEF Global Databases, 2012.
27 Jones, Gareth, et al., ‘How Many Child Deaths Can We Prevent This Year?’, Lancet, vol. 362, no. 9377, 5 July 2003, pp. 65–71.
28 Kramer, Michael S., et al. ‘Breastfeeding and Child Cognitive Development: New evidence from a large randomized trial’, Archives of General Psychiatry, vol. 65, no. 5, May 2008, p. 578.
29 Fall, Caroline H. D., et al., ‘Infant-feeding Patterns and Cardiovascular Risk Factors in Young Adulthood: Data from five cohorts in low- and middle-income countries’, International Journal of Epidemiology, vol. 40, no. 1, February 2011, pp. 47–62.
30 United Nations Children’s Fund, Infant and Young Child Feeding Programming Status: Results of 2010–2011 assessment of key actions for comprehensive infant and young child feeding programmes in 65 countries, UNICEF, New York, April 2012.
31 Mullany, Luke., et al., ‘Breastfeeding Patterns, Time to Initiation and Mortality Risk among Newborns in Southern Nepal’, Journal of Nutrition, vol. 138, no. 3, March 2008, pp. 599–603; Edmond, Karen M., et al., ‘Delayed Breastfeeding Initiation Increases Risk of Neonatal Mortality, Pediatrics, vol. 117, no. 3, 1 March 2006, pp. e380–e386.
32 UNICEF Global Nutrition Database, 2012.
References 53
33 Black et al., ‘Maternal and Child Undernutrition’, pp. 243–260.
34 Ibid.
35 Dewey, Kathryn G., et al., ‘Effects of Age of Introduction of Complementary Foods on Iron Status of Breast-fed Infants in Honduras’, American Journal of Clinical Nutrition, vol. 67, no. 5, May 1998, pp. 878–884; Arpadi, Stephen, et al., ‘Growth Faltering due to Breastfeeding Cessation in Uninfected Children Born to HIV-infected Mothers in Zambia’, August 2009, pp. 344–353.
36 UNICEF Global Nutrition Database, 2012.
37 UNICEF Global Nutrition Database, 2012, subset analysis of 50 countries with available trend data.
38 Bhutta Zulfiqar A., et al., ‘What Works? Interventions for maternal and child undernutrition and survival’, Lancet, vol. 371, no. 9610, 2 February 2008, pp. 417–440.
39 Dewey, Kathryn G., and Seth Adu-Afarwuah, ‘Systematic Review of the Efficacy and Effectiveness of Complementary Feeding Interventions in Developing Countries’, Maternal and Child Nutrition, vol. 4, 14 February 2008, pp. 24–85; Avula, Rasmi, et al., ‘Enhancements to Nutrition Program in Indian Integrated Child Development Services Increased Growth and Energy Intake of Children’, Journal of Nutrition, vol.141, no. 4, 1 April 2011, pp. 680–684.
40 United Nations Children’s Fund, Programming Guide, Infant and Young Child Feeding, UNICEF, New York, June 2012.
41 Dewey, Kathryn G., ‘Complementary Feeding’, in Encyclopedia of Human Nutrition, edited by B. Caballero, L. Allen and A. Prentice, Elsevier Ltd., Amsterdam, 2005, pp. 465–470.
42 Pan American Health Organization/World Health Organization, ‘Guiding Principles for Complementary Feeding of the Breastfed Child’, PAHO/WHO, Washington, D.C., 2003; United Nations Children’s Fund, ‘Programming Guide, Infant and Young Child Feeding’, UNICEF, New York, June 2012.
43 World Health Organization, ‘Global Prevalence of Vitamin A Deficiency in Populations at Risk: WHO global database on vitamin A deficiency’, WHO, Geneva, 2009.
44 Benoist, Bruno de, et al., ‘Worldwide Prevalence of Anaemia 1993–2005: WHO global database on anaemia’, WHO, Geneva, 2008.
45 Of the 18 profiled countries with available data since 2005, the percentage of women reporting using iron-folic acid for more than 90 days was less than 50 per cent in 17 countries.
46 UNICEF Global Databases, 2012, based on 54 countries reporting national estimates of household salt iodization of at least 15ppm, 2007 – 2011.
47 Dewey, Kathryn G., Zhenyu Yang and Erick Boy, ‘Systematic Review and Meta-analysis of Home Fortification of Complementary Foods’, Maternal and Child Nutrition, vol. 5, no. 4, October 2009, pp. 283–321.
48 United Nations Children’s Fund and U.S. Centers for Disease Control and Prevention, Global Assessment of Home Fortification Interventions, 2011, Home Fortification Technical Advisory Group, Geneva, 2012.
49 Flour Fortification Initiative, <www.ffinetwork.org/global_progress/index.php>, accessed 8 January 2012.
50 Black et al., ‘Maternal and Child Undernutrition’, pp. 243–260.
51 Richard, Stephanie A., et al., ‘Wasting Is Associated with Stunting in Early Childhood’, Journal of Nutrition, vol. 142, no. 7, 1 July 2012, pp. 1291–1296.
52 World Health Organization/World Food Programme/United Nations System Standing Committee on Nutrition/United Nations Children’s Fund, Community-Based Management of Severe Acute Malnutrition: A joint statement by the World Health Organization, the World Food Programme, the United Nations System Standing Committee on Nutrition and the United Nations Children’s Fund, May 2007.
53 The Sphere Project, Humanitarian Charter and Minimum Standards in Humanitarian Response, Belmont Press, Northampton, UK, 2011.
54 UNICEF Nutrition Section, Global Severe Acute Malnutrition Update, 2012.
55 Humphrey, Jean H., ‘Child Undernutrition, Tropical Enteropathy, Toilets, and Handwashing, Lancet, vol. 374, 19 September 2009, pp. 1032–1035; Dangour, A. D., et al., Interventions to Improve Water Quality and Supply, Sanitation and Hygiene Practices, and Their Effects on the Nutritional Status of Children (Protocol), The Cochrane Library 2011, Issue 10.
56 Guerrant, Richard L., et al., ‘Malnutrition as an Enteric Infectious Disease with Long-term Effects on Child Development’, Article first published online: 22 August 2008. DOI: 10.1111/j.1753-4887.2008.00082.x.
57 International Food Policy Research Institute, ‘Leveraging Agriculture for Improving Nutrition and Health’, IFPRI, New Delhi, 2011; Herforth, Anna, ‘Synthesis of Guiding Principles on Agriculture Programming for Nutrition’, Draft, September 2012, Food and Agriculture Organization of the United Nations, Rome; Hoddinott, John, ‘Agriculture, Health, and Nutrition: Toward conceptualizing the linkages,’ paper presented at the 2020 Conference, New Delhi, India, 10–12 February 2011; Hawkes, Corrina, R. Turner and J. Waage, ‘Current and Planned Research on Agriculture for Improved Nutrition: A mapping and a gap analysis’, Department for International Development, London, August 2012.
58 Girard, Amy Webb, et al., ‘The Effects of Household Food Production Strategies on the Health and Nutrition Outcomes of Women and Young Children: A systematic review’, Paediatric and Perinatal Epidemiology, vol. 26, no. s1, July 2012, pp. 205–222.
59 Independent Evaluation Group (IEG), ‘What Can We Learn from Nutrition Impact Evaluations?: Lessons from a review of interventions to reduce child malnutrition in developing countries’, World Bank Publications, Washington, D.C., July 2010.
60 Independent Evaluation Group, ibid.
CHAPTER 561 These success stories draw on internal documents, government
documents and expert opinion provided by UNICEF Country Offices. Additional sources include:
Ethiopia: Rajkumar, Andrew S., Christopher Gaukler and Jessica Tilahun, ‘Combating Malnutrition in Ethiopia: An evidence-based approach for sustained results’, Africa Human Development Series, World Bank, Washington, D.C., 2012; and Gilligan, Daniel O., et al., ‘The Impact of Ethiopia Productive Safety Net Programme and its Linkages’, Mimeo, International Food Policy Research Institute, Washington, D.C., December 2008.
Nepal: United States Agency for International Development and Government of Nepal, ‘An Analytical Report on National Survey of Female Community Health Volunteers of Nepal’, USAID and Government of Nepal, Kathmandu, 2007; United States Agency for International Development, ‘Vitamin A Supplements for Children’, Nepal Family Health Program, Technical Brief no. 2, USAID, Washington, D.C., 2007; and Thapa, Shyam, Minja Kim Choe and Robert D. Retherford, ‘Effects of Vitamin A Supplementation on Child Mortality: Evidence from Nepal’s 2001 Demographic and Health Survey’, Tropical Medicine & International Health, vol. 10, no. 8, August 2005, pp. 782–789.
Peru: Acosta, Andrés Mejía, ‘Analysing Success in the Fight against Malnutrition in Peru’, IDS Working Papers, vol. 2011, no. 367, May 2011, pp. 2–49; and Garret, James, Lucy Basset and Alessandra Marini, ‘Designing CCT Programs to Improve Nutrition Impact: Principles, Evidences and Examples’, Hunger-Free Latin America and the Caribbean Initiative Working Paper, Food and Agriculture Organization, Santiago, Chile, 2009.
Sri Lanka: United Nations Children’s Fund, Infant and Young Child Feeding Programme Review, UNICEF, New York, June 2009.
Krygyzstan: Ministry of Health of the Kyrgyz Republic, U.S. Centers for Disease Control and Prevention and United Nations Children’s Fund, ‘Assessment of the Nutritional Status of Children 6–24 Months of Age and Their Mothers: Rural Talas Oblast, Kyrgyzstan, 2008’, UNICEF, Bishkek, 2010; and World Bank, ‘Kyrgyz Republic Partnership: Program snapshot’, World Bank, Washington, D.C., October 2012.
Improving Child Nutrition54
The United Republic of Tanzania: A2Z Project and United States Agency for International Development, ‘Assessment of the Sustainability of the Tanzania National Vitamin A Supplementation Program’, A2Z, Washington, D.C., 2008; and Helen Keller International and CIDA Vitamin A Program, ‘A Review of Comprehensive Council Health Plans 2010/2011’, 2012.
Viet Nam: Alive & Thrive, ‘Maternity Leave Policy in Viet Nam: Summary report’, Alive & Thrive, Ha Noi, Viet Nam, July 2012.
62 United Nations Inter-agency Group for Child Mortality Estimation, 2012.
63 Demographic and Health Surveys, 2000 and 2011.
64 UNICEF Global Databases, 2012.
65 World Bank data, 2012.
66 Rajkumar, Andrew S., Christopher Gaukler and Jessica Tilahun, ‘Combating Malnutrition in Ethiopia: An evidence-based approach for sustained results’, Africa Human Development Series, World Bank, Washington, D.C., 2012.
67 Berhane, Guush, et al., ‘The Impact of Ethiopia’s Productive Safety Nets and Household Asset Building Programme: 2006–2010’, International Food Policy Research Institute, Washington, D.C., December 2011; and Gilligan, Daniel O., et al., ‘The Impact of Ethiopia Productive Safety Net Programme and Its Linkages’, Mimeo, International Food Policy Research Institute, Washington, D.C., December 2008.
68 Data provided by UNICEF Ethiopia, 2012.
69 The Last Ten Kilometres Project, ‘Changes in Maternal, Newborn and Child Health in 115 Rural Woredas of Amhara, Oromia, SNNP, and Tigray Regions of Ethiopia: 2008–2010 – Findings from the L10K baseline and midterm surveys’, JSI Research & Training Institute, Inc., Addis Ababa, July 2012.
70 Coordination Nationale de la Sécurité Alimentaire, ‘Rapid Post-Earthquake Emergency Food Security Assessment’, CNSA, Port-au-Prince, March 2010.
71 Ministère de la Santé Publique et de la Population ‘Enquête nutritionelle anthropométrique et de mortalité retrospective chez les enfants de 6 à 59 mois dans les zones affectées par le seisme du 12 janvier 2010’, Ministère de la Santé Publique et de la Population, Port-au-Prince, 2010.
72 World Food Programme, ‘Haiti: One year after the 12 January earthquake’ (communication fact sheet), 2011; and Family Early Warning Systems Network, ‘Haiti Food Security Outlook’, United States Agency for International Development, Washington, D.C., January 2011.
73 CNSA/MARNDR Haiti, ‘Résultats de l’enquête la sécurité alimentaire EFSA II1’, Famine and Early Warning Systems Network, September 2010.
74 Data provided by UNICEF Haiti, 2013.
75 Cayemittes, Michel, et al., ‘Enquête mortalité, morbidité et utilisation des services EMMUS-IV: Haïti – 2005–2006’, Ministère de la Santé Publique et de la Population, Institut Haïtien de l’Enfance and Macro International, Calverton, MD, January 2007.
76 Ministère de la Santé Publique et de la Population, UNICEF and World Food Programme, Rapport de l’enquête nutritionnelle nationale avec la méthodologie Smart, Ministère de la Santé Publique et de la Population, UNICEF and WFP, Port-au-Prince, 2012.
77 Data provided by UNICEF Haiti, 2013.
78 United Nations Children’s Fund, Global SAM Management Update, database accessed 1 October 2012.
79 Ayoya, Mohamed Ag, Kate Golden, Ismael Ngnie Teta, et al., ‘Protecting and Improving Breastfeeding Practices during a Major Emergency: Lessons learnt from the baby tents in Haiti’(unpublished paper).
80 National Family Health Survey, 2005–2006, and UNICEF Global Databases.
81 Based on re-analysis of the National Family Health Survey, 2005–2006, and results of the Comprehensive Nutrition Survey in Maharashtra, 2012.
82 Comprehensive Nutrition Survey in Maharashtra, 2012.
83 Based on reanalysis of the National Family Health Survey, 2005–2006 and Comprehensive Nutrition Survey in Maharashtra, 2012.
84 World Bank, World Development Indicators, 2012.
85 United Nations Inter-agency Group for Child Mortality Estimation, 2012.
86 Demographic and Health Surveys, 2001 and 2011.
87 Demographic and Health Survey, 2011.
88 Ibid.
89 Ibid.
90 Ibid.
91 Demographic and Health Surveys, 1996, 2000, 2004–2006 and 2011.
92 Ibid.
93 Lechtig, Aaron, et al., ‘Decreasing Stunting, Anemia, and Vitamin A Deficiency in Peru: Results of the Good Start in Life Program’, Food & Nutrition Bulletin, vol. 30, no. 1, 2009, pp. 36–48.
94 Flores, Rosa, and Carlos Rojas, ‘Impact of an Intervention on Food Security: REDESA program final evaluation’, CARE Peru, Lima, 2007.
95 Demographic and Health Surveys, 1992 (reanalysed by UNICEF) and 2011.
96 United Nations Population Division 2010 data (reanalysed by UNICEF).
97 UNICEF Global Databases, 2012.
98 Demographic and Health Surveys, 2005 and 2010.
99 United Nations Children’s Fund, ‘UNICEF Humanitarian Action Update: Democratic Republic of the Congo’, UNICEF, New York, 4 August 2012.
100 ‘Addressing a Silent and Unknown Crisis: Success in the treatment of severe acute malnutrition in the Democratic Republic of the Congo (DRC)’ (internal document provided by UNICEF Democratic Republic of the Congo).
101 Ibid.
102 Ibid.
103 Ibid.
104 United Nations Children’s Fund, Global SAM Management Update, database accessed 1 October 2012; United Nations Children’s Fund, UNICEF Humanitarian Action Update: Democratic Republic of the Congo, UNICEF, New York, 4 August 2012, p. 7.
105 UNICEF Global Databases, 2012.
106 United Nations Inter-agency Group for Child Mortality Estimation, 2012.
107 Demographic and Health Survey, 2006–2007.
108 World Bank, ‘Kyrgyz Republic Partnership: Program snapshot’, World Bank, Washington, D.C., October 2012.
109 Research Institute of Obstetrics and Pediatrics (Kyrgyz Republic) and Macro International Inc., Kyrgyz Republic Demographic and Health Survey, 1997, Calverton, MD, 1998, pp. 128 and 132.
110 Lundeen, Elizabeth, et al., ‘Daily Use of Sprinkles Micronutrient Powder for 2 Months Reduces Anemia among Children 6 to 36 Months of Age in the Kyrgyz Republic: A cluster-randomized trial’, Food & Nutrition Bulletin, vol. 31, no. 3, September 2010, pp. 446–460.
111 Ministry of Health of Kyrgyz Republic, Follow-up Survey of Nutritional Status in Children 6–24 Months of Age, Talas Oblast, Kyrgyz Republic 2010, Ministry of Health of Kyrgyz Republic, Bishkek, 2011, p. 11.
112 United States Agency for International Development, ‘Assessment of the Sustainability of the Tanzania National Vitamin A Supplementation Program: Results of a sustainability analysis’, USAID, Washington, D.C., 2008, p. 5.
113 UNICEF Global Databases, 2012.
114 Masanja, Honorati, et al., ‘Child Survival Gains in Tanzania: Analysis of data from demographic and health surveys’, Lancet, vol. 371, no. 9620, 12 April 2008, pp. 1276–1283.
115 United Nations Inter-agency Group on Child Mortality Estimation, 2012.
116 UNICEF Global Databases, 2012.
117 Euromonitor International, ‘Global Packaged Food: Market Opportunities for Baby Food to 2013’, September 2008.
NUTRITION PROFILES24 countries with the largest burden
and highest prevalence of stunting
Bangladesh Burundi Central African Republic China Democratic Republic of the Congo Ethiopia Guatemala Guinea India Indonesia Liberia Madagascar Malawi Mozambique Nepal Niger Nigeria Pakistan Philippines Rwanda Sierra Leone United Republic of Tanzania Timor-Leste Zambia
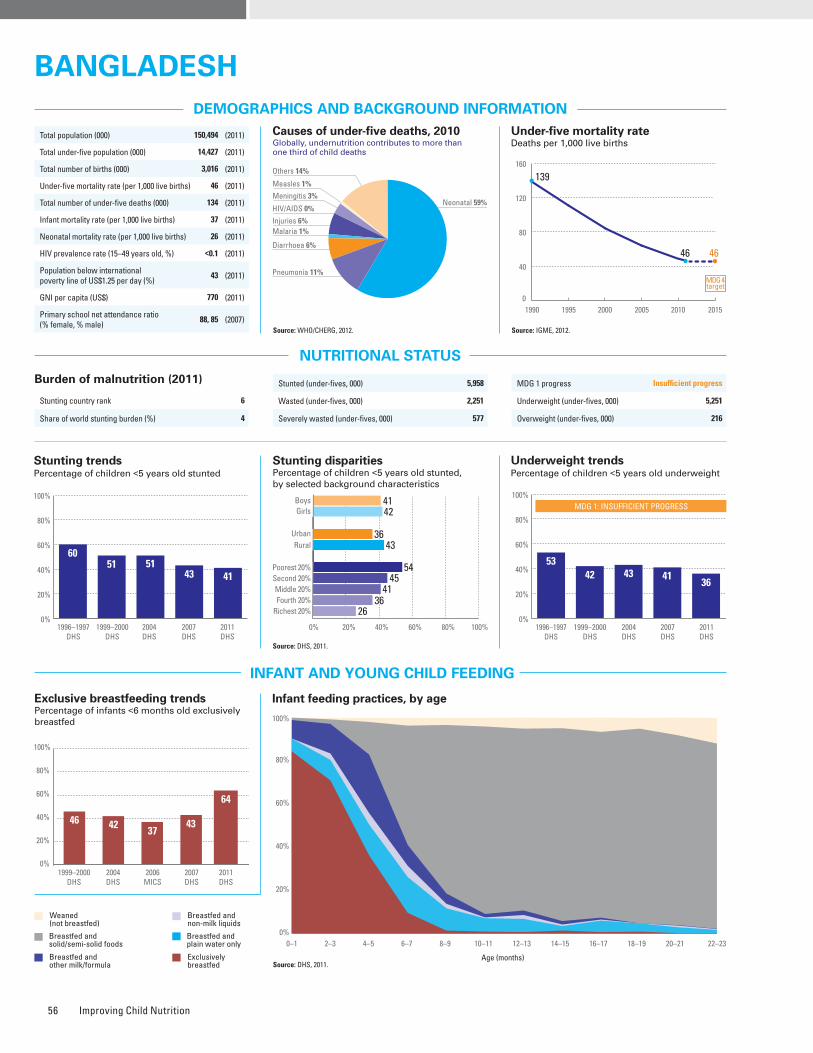
Improving Child Nutrition56
ESSENTIAL NUTRITION PRACTICES AND INTERVENTIONS DURING THE LIFE CYCLE
MICRONUTRIENTS
WATER AND SANITATION
Improved drinking water coveragePercentage of population, by type of drinking water source, 1990–2010
Source: WHO/UNICEF JMP, 2012.
Improved sanitation coveragePercentage of population, by type of sanitation facility, 1990–2010
Source: WHO/UNICEF JMP, 2012.
Vitamin A supplementationPercentage of children 6–59 months old receiving two doses of vitamin A during calendar year (full coverage)
* Estimates may not be comparable. Source: UNICEF, 2012.
MATERNAL NUTRITION AND HEALTH
DISPARITIES IN NUTRITION
Causes of under-five deaths, 2010Globally, undernutrition contributes to more than one third of child deaths
NUTRITIONAL STATUS
Stunting disparitiesPercentage of children <5 years old stunted, by selected background characteristics
DEMOGRAPHICS AND BACKGROUND INFORMATION
INFANT AND YOUNG CHILD FEEDING
Source: WHO/CHERG, 2012.
Under-five mortality rateDeaths per 1,000 live births
Source: IGME, 2012.AnaemiaPrevalence of anaemia among selected populations
Infant feeding practices, by ageExclusive breastfeeding trends Percentage of infants <6 months old exclusively breastfed
Breastfed and non-milk liquids
Breastfed and solid/semi-solid foods
Breastfed and plain water only
Breastfed and other milk/formula
Exclusively breastfed
Weaned (not breastfed)
Stunting trendsPercentage of children <5 years old stunted
Underweight trendsPercentage of children <5 years old underweight
To increase child survival, promote child development and prevent stunting, nutrition interventions need to be delivered during pregnancy and the first two years of life.
PREGNANCY BIRTH 0–5 MONTHS 6–23 MONTHS 24–59 MONTHS
Use of iron-folic acid supplements
Early initiation of breastfeeding(within 1 hour of birth)
International Code of Marketing of Breast-milk Substitutes
Maternity protection in accordance with ILO Convention 183
Minimum dietary diversity
Minimum acceptable diet
Full coverage of vitamin A supplementation
Treatment of severe acute malnutrition included in national health plans
Introduction to solid, semi-solid or soft foods (6–8 months)
Continued breastfeeding at 1 year old
Infants not weighed at birthHouseholds with adequately iodized salt
Exclusive breastfeeding(<6 months)
95%
62%
No
Partial
25%
21%
94%
Yes
64%85%
47%
82%
–
Burden of malnutrition (2011)
Stunting country rank 6
Share of world stunting burden (%) 4
0%
20%
40%
60%
80%
100%
Non-pregnant women
Pregnant women
4050 51
Public health problemsevere
moderate
Preschool- aged children
Source: DHS, 2011.
Source: DHS, 2011.
Source: DHS, 2011.
0–1 2–3 4–5 6–7 8–9 10–11 12–13 14–15 16–17 18–19 20–21 22–23
Age (months)
0%
20%
40%
60%
80%
100%
46 42 37
64
1999–2000DHS
2004DHS
2006MICS
2007DHS
0%
20%
40%
60%
80%
100%
43
2011DHS
Iodized salt trends*
Percentage of households with adequately iodized salt534,000 newborns are unprotected against iodine deficiency disorders (2011)
1990 1995 2000 2005 2010 2015
139
46 46
0
40
80
120
160
MDG 4target
0%
20%
40%
60%
80%
100%
2005 2006 2007 2008 2009 2010 2011
82 89 94 941009197
0%
20%
40%
60%
80%
100%
6051 51
43 41
1996–1997DHS
1999–2000DHS
2004DHS
2007DHS
2011DHS
Indicator
Gender Residence Wealth quintile
SourceMale Female
Ratio of male to female
Urban RuralRatio of urban to
ruralPoorest Second Middle Fourth Richest
Ratio of richest to poorest
Equity chart
Stunting prevalence (%) 41 42 1.0 36 43 0.8 54 45 41 36 26 0.5 DHS, 2011
Underweight prevalence (%) 34 39 0.9 28 39 0.7 50 42 36 28 21 0.4 DHS, 2011
Wasting prevalence (%) 16 15 1.1 14 16 0.9 18 16 18 14 12 0.7 DHS, 2011
Women with low BMI (<18.5 kg/m2, %) – 24 – 14 28 0.5 40 30 26 20 8 0.2 DHS, 2011
Women with high BMI (≥25 kg/m2, %) – 17 – 29 12 2.4 5 7 11 20 37 7.3 DHS, 2011
MDG 1 progress Insufficient progress
Underweight (under-fives, 000) 5,251
Overweight (under-fives, 000) 216
Stunted (under-fives, 000) 5,958
Wasted (under-fives, 000) 2,251
Severely wasted (under-fives, 000) 577
Improved facilities Shared facilitiesUnimproved facilities Open defecation
39
10
18
33
56
15
25
4
58
8
27
7
57
15
26
2
34
11
16
39
55
15
25
5
0%
20%
40%
60%
80%
100%
1990 2010Total Urban Rural
1990 2010 1990 2010
Piped on premises Other improvedUnimproved Surface water
0%
20%
40%
60%
80%
100%
5
20
72
3
6
18
75
1
26
13
61
0
20
15
65
0
0
21
75
4
1
18
79
2
1990 2010Total Urban Rural
1990 2010 1990 2010
0% 20% 40% 60% 80% 100%
Poorest 20%
RuralUrban
GirlsBoys
Second 20%Middle 20%Fourth 20%
Richest 20%
4142
3643
54
26
4541
36
0%
20%
40%
60%
80%
100%
52
1996–1997DHS
1999–2000DHS
2004DHS
2007DHS
2011DHS
MDG 1: INSUFFICIENT PROGRESS
5342 43 41
36
Total population (000) 150,494 (2011)
Total under-five population (000) 14,427 (2011)
Total number of births (000) 3,016 (2011)
Under-five mortality rate (per 1,000 live births) 46 (2011)
Total number of under-five deaths (000) 134 (2011)
Infant mortality rate (per 1,000 live births) 37 (2011)
Neonatal mortality rate (per 1,000 live births) 26 (2011)
HIV prevalence rate (15–49 years old, %) <0.1 (2011)
Population below international poverty line of US$1.25 per day (%)
43 (2011)
GNI per capita (US$) 770 (2011)
Primary school net attendance ratio (% female, % male)
88, 85 (2007)
Neonatal 59%HIV/AIDS 0%
Diarrhoea 6%
Measles 1%
Injuries 6%
Pneumonia 11%
Malaria 1%
Others 14%
Meningitis 3%
BANGLADESHBANGLADESH
To increase child survival, promote child development and prevent stunting, nutrition interventions need to be delivered during pregnancy and the first two years of life.
PREGNANCY BIRTH 0–5 MONTHS 6–23 MONTHS 24–59 MONTHS
Use of iron-folic acid supplements
Early initiation of breastfeeding(within 1 hour of birth)
International Code of Marketing of Breast-milk Substitutes
Maternity protection in accordance with ILO Convention 183
Minimum dietary diversity
Minimum acceptable diet
Full coverage of vitamin A supplementation
Treatment of severe acute malnutrition included in national health plans
Introduction to solid, semi-solid or soft foods (6–8 months)
Continued breastfeeding at 1 year old
Infants not weighed at birthHouseholds with adequately iodized salt
Exclusive breastfeeding(<6 months)
95%
62%
No
Partial
25%
21%
94%
Yes
64%85%
47%
82%
–
Maternal mortality ratio, adjusted (per 100,000 live births)
240 (2010)
Maternal mortality ratio, reported(per 100,000 live births)
220 (2010)
Total number of maternal deaths 7,200 (2010)
Lifetime risk of maternal death (1 in : ) 170 (2010)
Women with low BMI (<18.5 kg/m2, %) 24 (2011)
Anaemia, non-pregnant women (<120g/l, %) 40 (2011)
Antenatal care (at least one visit, %) 55 (2011)
Antenatal care (at least four visits, %) 26 (2011)
Skilled attendant at birth (%) 32 (2011)
Low birthweight (<2,500 grams, %) 22 (2006)
Women 20–24 years old who gave birth before age 18 (%)
40 (2007)
0%
20%
40%
60%
80%
100%
1999Other NS
2000MICS
2003MICS
2006MICS
5570 70
84
2011DHS
82
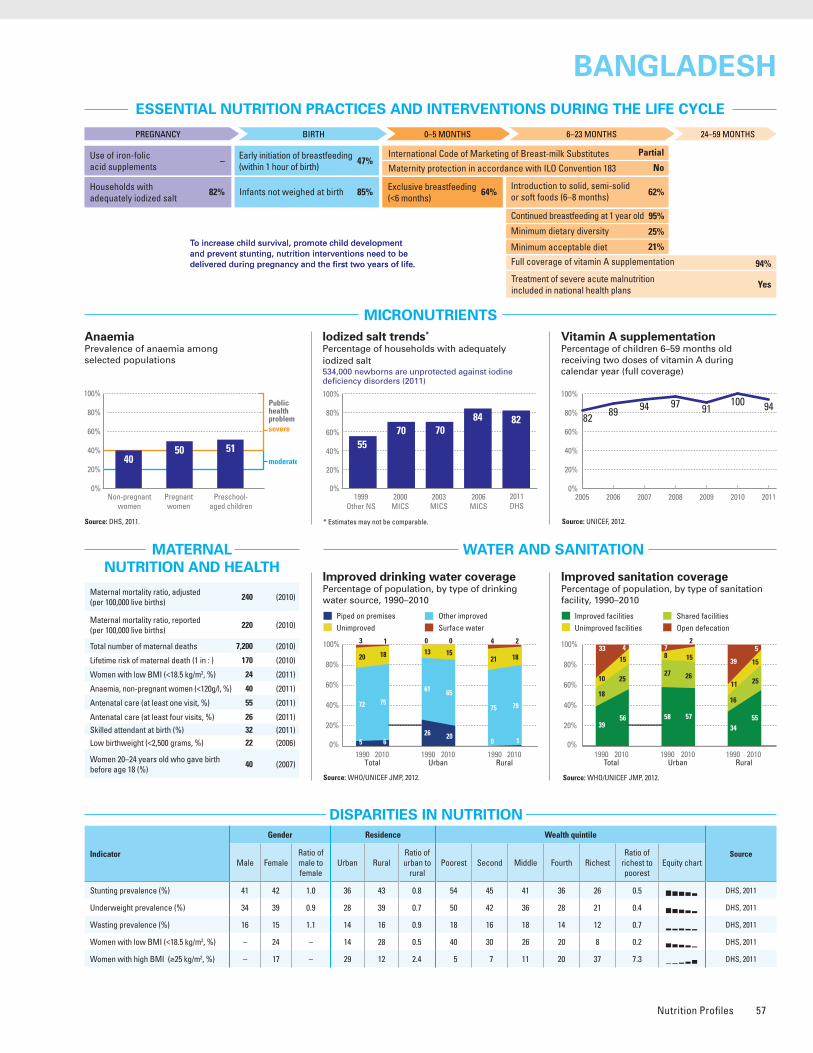
Nutrition Profiles 57
ESSENTIAL NUTRITION PRACTICES AND INTERVENTIONS DURING THE LIFE CYCLE
MICRONUTRIENTS
WATER AND SANITATION
Improved drinking water coveragePercentage of population, by type of drinking water source, 1990–2010
Source: WHO/UNICEF JMP, 2012.
Improved sanitation coveragePercentage of population, by type of sanitation facility, 1990–2010
Source: WHO/UNICEF JMP, 2012.
Vitamin A supplementationPercentage of children 6–59 months old receiving two doses of vitamin A during calendar year (full coverage)
* Estimates may not be comparable. Source: UNICEF, 2012.
MATERNAL NUTRITION AND HEALTH
DISPARITIES IN NUTRITION
Causes of under-five deaths, 2010Globally, undernutrition contributes to more than one third of child deaths
NUTRITIONAL STATUS
Stunting disparitiesPercentage of children <5 years old stunted, by selected background characteristics
DEMOGRAPHICS AND BACKGROUND INFORMATION
INFANT AND YOUNG CHILD FEEDING
Source: WHO/CHERG, 2012.
Under-five mortality rateDeaths per 1,000 live births
Source: IGME, 2012.AnaemiaPrevalence of anaemia among selected populations
Infant feeding practices, by ageExclusive breastfeeding trends Percentage of infants <6 months old exclusively breastfed
Breastfed and non-milk liquids
Breastfed and solid/semi-solid foods
Breastfed and plain water only
Breastfed and other milk/formula
Exclusively breastfed
Weaned (not breastfed)
Stunting trendsPercentage of children <5 years old stunted
Underweight trendsPercentage of children <5 years old underweight
To increase child survival, promote child development and prevent stunting, nutrition interventions need to be delivered during pregnancy and the first two years of life.
PREGNANCY BIRTH 0–5 MONTHS 6–23 MONTHS 24–59 MONTHS
Use of iron-folic acid supplements
Early initiation of breastfeeding(within 1 hour of birth)
International Code of Marketing of Breast-milk Substitutes
Maternity protection in accordance with ILO Convention 183
Minimum dietary diversity
Minimum acceptable diet
Full coverage of vitamin A supplementation
Treatment of severe acute malnutrition included in national health plans
Introduction to solid, semi-solid or soft foods (6–8 months)
Continued breastfeeding at 1 year old
Infants not weighed at birthHouseholds with adequately iodized salt
Exclusive breastfeeding(<6 months)
95%
62%
No
Partial
25%
21%
94%
Yes
64%85%
47%
82%
–
Burden of malnutrition (2011)
Stunting country rank 6
Share of world stunting burden (%) 4
0%
20%
40%
60%
80%
100%
Non-pregnant women
Pregnant women
4050 51
Public health problemsevere
moderate
Preschool- aged children
Source: DHS, 2011.
Source: DHS, 2011.
Source: DHS, 2011.
0–1 2–3 4–5 6–7 8–9 10–11 12–13 14–15 16–17 18–19 20–21 22–23
Age (months)
0%
20%
40%
60%
80%
100%
46 42 37
64
1999–2000DHS
2004DHS
2006MICS
2007DHS
0%
20%
40%
60%
80%
100%
43
2011DHS
Iodized salt trends*
Percentage of households with adequately iodized salt534,000 newborns are unprotected against iodine deficiency disorders (2011)
1990 1995 2000 2005 2010 2015
139
46 46
0
40
80
120
160
MDG 4target
0%
20%
40%
60%
80%
100%
2005 2006 2007 2008 2009 2010 2011
82 89 94 941009197
0%
20%
40%
60%
80%
100%
6051 51
43 41
1996–1997DHS
1999–2000DHS
2004DHS
2007DHS
2011DHS
Indicator
Gender Residence Wealth quintile
SourceMale Female
Ratio of male to female
Urban RuralRatio of urban to
ruralPoorest Second Middle Fourth Richest
Ratio of richest to poorest
Equity chart
Stunting prevalence (%) 41 42 1.0 36 43 0.8 54 45 41 36 26 0.5 DHS, 2011
Underweight prevalence (%) 34 39 0.9 28 39 0.7 50 42 36 28 21 0.4 DHS, 2011
Wasting prevalence (%) 16 15 1.1 14 16 0.9 18 16 18 14 12 0.7 DHS, 2011
Women with low BMI (<18.5 kg/m2, %) – 24 – 14 28 0.5 40 30 26 20 8 0.2 DHS, 2011
Women with high BMI (≥25 kg/m2, %) – 17 – 29 12 2.4 5 7 11 20 37 7.3 DHS, 2011
MDG 1 progress Insufficient progress
Underweight (under-fives, 000) 5,251
Overweight (under-fives, 000) 216
Stunted (under-fives, 000) 5,958
Wasted (under-fives, 000) 2,251
Severely wasted (under-fives, 000) 577
Improved facilities Shared facilitiesUnimproved facilities Open defecation
39
10
18
33
56
15
25
4
58
8
27
7
57
15
26
2
34
11
16
39
55
15
25
5
0%
20%
40%
60%
80%
100%
1990 2010Total Urban Rural
1990 2010 1990 2010
Piped on premises Other improvedUnimproved Surface water
0%
20%
40%
60%
80%
100%
5
20
72
3
6
18
75
1
26
13
61
0
20
15
65
0
0
21
75
4
1
18
79
2
1990 2010Total Urban Rural
1990 2010 1990 2010
0% 20% 40% 60% 80% 100%
Poorest 20%
RuralUrban
GirlsBoys
Second 20%Middle 20%Fourth 20%
Richest 20%
4142
3643
54
26
4541
36
0%
20%
40%
60%
80%
100%
52
1996–1997DHS
1999–2000DHS
2004DHS
2007DHS
2011DHS
MDG 1: INSUFFICIENT PROGRESS
5342 43 41
36
Total population (000) 150,494 (2011)
Total under-five population (000) 14,427 (2011)
Total number of births (000) 3,016 (2011)
Under-five mortality rate (per 1,000 live births) 46 (2011)
Total number of under-five deaths (000) 134 (2011)
Infant mortality rate (per 1,000 live births) 37 (2011)
Neonatal mortality rate (per 1,000 live births) 26 (2011)
HIV prevalence rate (15–49 years old, %) <0.1 (2011)
Population below international poverty line of US$1.25 per day (%)
43 (2011)
GNI per capita (US$) 770 (2011)
Primary school net attendance ratio (% female, % male)
88, 85 (2007)
Neonatal 59%HIV/AIDS 0%
Diarrhoea 6%
Measles 1%
Injuries 6%
Pneumonia 11%
Malaria 1%
Others 14%
Meningitis 3%
BANGLADESHBANGLADESH
To increase child survival, promote child development and prevent stunting, nutrition interventions need to be delivered during pregnancy and the first two years of life.
PREGNANCY BIRTH 0–5 MONTHS 6–23 MONTHS 24–59 MONTHS
Use of iron-folic acid supplements
Early initiation of breastfeeding(within 1 hour of birth)
International Code of Marketing of Breast-milk Substitutes
Maternity protection in accordance with ILO Convention 183
Minimum dietary diversity
Minimum acceptable diet
Full coverage of vitamin A supplementation
Treatment of severe acute malnutrition included in national health plans
Introduction to solid, semi-solid or soft foods (6–8 months)
Continued breastfeeding at 1 year old
Infants not weighed at birthHouseholds with adequately iodized salt
Exclusive breastfeeding(<6 months)
95%
62%
No
Partial
25%
21%
94%
Yes
64%85%
47%
82%
–
Maternal mortality ratio, adjusted (per 100,000 live births)
240 (2010)
Maternal mortality ratio, reported(per 100,000 live births)
220 (2010)
Total number of maternal deaths 7,200 (2010)
Lifetime risk of maternal death (1 in : ) 170 (2010)
Women with low BMI (<18.5 kg/m2, %) 24 (2011)
Anaemia, non-pregnant women (<120g/l, %) 40 (2011)
Antenatal care (at least one visit, %) 55 (2011)
Antenatal care (at least four visits, %) 26 (2011)
Skilled attendant at birth (%) 32 (2011)
Low birthweight (<2,500 grams, %) 22 (2006)
Women 20–24 years old who gave birth before age 18 (%)
40 (2007)
0%
20%
40%
60%
80%
100%
1999Other NS
2000MICS
2003MICS
2006MICS
5570 70
84
2011DHS
82
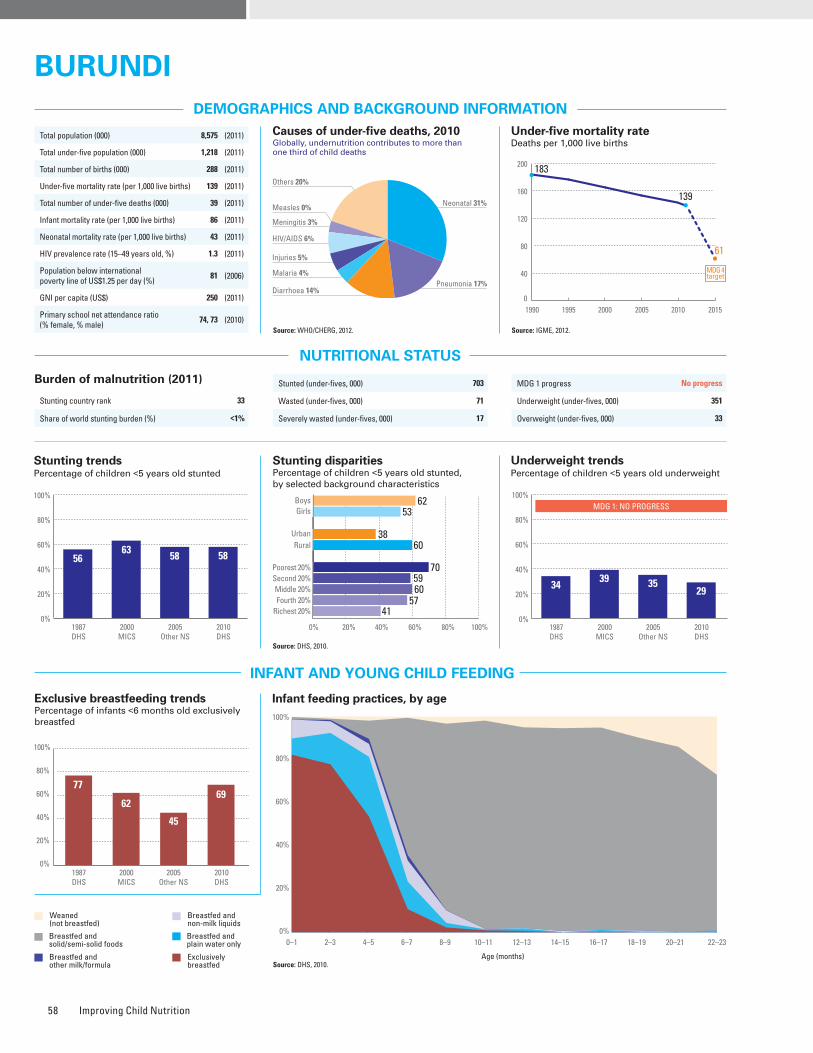
Improving Child Nutrition58
ESSENTIAL NUTRITION PRACTICES AND INTERVENTIONS DURING THE LIFE CYCLE
MICRONUTRIENTS
WATER AND SANITATION
Improved drinking water coveragePercentage of population, by type of drinking water source, 1990–2010
Source: WHO/UNICEF JMP, 2012.
Improved sanitation coveragePercentage of population, by type of sanitation facility, 1990–2010
Source: WHO/UNICEF JMP, 2012.
Vitamin A supplementationPercentage of children 6–59 months old receiving two doses of vitamin A during calendar year (full coverage)
* Estimates may not be comparable. Source: UNICEF, 2012.
MATERNAL NUTRITION AND HEALTH
DISPARITIES IN NUTRITION
Causes of under-five deaths, 2010Globally, undernutrition contributes to more than one third of child deaths
NUTRITIONAL STATUS
Stunting disparitiesPercentage of children <5 years old stunted, by selected background characteristics
DEMOGRAPHICS AND BACKGROUND INFORMATION
INFANT AND YOUNG CHILD FEEDING
Source: DHS, 2010.
Source: WHO/CHERG, 2012.
Under-five mortality rateDeaths per 1,000 live births
Source: IGME, 2012.AnaemiaPrevalence of anaemia among selected populations
Source: DHS, 2010.
Infant feeding practices, by ageExclusive breastfeeding trends Percentage of infants <6 months old exclusively breastfed
Breastfed and non-milk liquids
Breastfed and solid/semi-solid foods
Breastfed and plain water only
Breastfed and other milk/formula
Exclusively breastfed
Weaned (not breastfed)
Stunting trendsPercentage of children <5 years old stunted
Underweight trendsPercentage of children <5 years old underweight
Burden of malnutrition (2011)
Stunting country rank 33
Share of world stunting burden (%) <1%
Source: DHS, 2010.
0–1 2–3 4–5 6–7 8–9 10–11 12–13 14–15 16–17 18–19 20–21 22–23
Age (months)
0%
20%
40%
60%
80%
100%
77
62
45
69
1987DHS
2000MICS
2005Other NS
2010DHS
0%
20%
40%
60%
80%
100%
To increase child survival, promote child development and prevent stunting, nutrition interventions need to be delivered during pregnancy and the first two years of life.
PREGNANCY BIRTH 0–5 MONTHS 6–23 MONTHS 24–59 MONTHS
Use of iron-folic acid supplements
Early initiation of breastfeeding(within 1 hour of birth)
International Code of Marketing of Breast-milk Substitutes
Maternity protection in accordance with ILO Convention 183
Minimum dietary diversity
Minimum acceptable diet
Full coverage of vitamin A supplementation
Treatment of severe acute malnutrition included in national health plans
Introduction to solid, semi-solid or soft foods (6–8 months)
Continued breastfeeding at 1 year old
Infants not weighed at birthHouseholds with adequately iodized salt
Exclusive breastfeeding(<6 months)
94%
70%
No
No
19%
9%
83%
Yes
69%48%
–
98%
7%
Indicator
Gender Residence Wealth quintile
SourceMale Female
Ratio of male to female
Urban RuralRatio of urban to
ruralPoorest Second Middle Fourth Richest
Ratio of richest to poorest
Equity chart
Stunting prevalence (%) 62 53 1.2 38 60 0.6 70 59 60 57 41 0.6 DHS, 2010
Underweight prevalence (%) 32 26 1.2 18 30 0.6 41 30 30 25 17 0.4 DHS, 2010
Wasting prevalence (%) 6 6 1.1 5 6 0.8 7 6 5 5 5 0.8 DHS, 2010
Women with low BMI (<18.5 kg/m2, %) – 16 – 10 17 0.6 22 15 17 15 12 0.5 DHS, 2010
Women with high BMI (≥25 kg/m2, %) – 8 – 27 5 5.3 4 3 6 6 19 5.4 DHS, 2010
0%
20%
40%
60%
80%
100%
2005 2006 2007 2008 2009 2010 2011
7
83 83 8373
9080
Iodized salt trends*
Percentage of households with adequately iodized salt6,000 newborns are unprotected against iodine deficiency disorders (2011)
0%
20%
40%
60%
80%
100%
Non-pregnant women
Pregnant women
1626
45
Public health problemsevere
moderate
Preschool- aged children
1990 1995 2000 2005 2010 2015
183
139
61
0
40
80
120
160
200
MDG 4target
Stunted (under-fives, 000) 703
Wasted (under-fives, 000) 71
Severely wasted (under-fives, 000) 17
MDG 1 progress No progress
Underweight (under-fives, 000) 351
Overweight (under-fives, 000) 33
Total population (000) 8,575 (2011)
Total under-five population (000) 1,218 (2011)
Total number of births (000) 288 (2011)
Under-five mortality rate (per 1,000 live births) 139 (2011)
Total number of under-five deaths (000) 39 (2011)
Infant mortality rate (per 1,000 live births) 86 (2011)
Neonatal mortality rate (per 1,000 live births) 43 (2011)
HIV prevalence rate (15–49 years old, %) 1.3 (2011)
Population below international poverty line of US$1.25 per day (%)
81 (2006)
GNI per capita (US$) 250 (2011)
Primary school net attendance ratio (% female, % male)
74, 73 (2010)
Improved facilities Shared facilitiesUnimproved facilities Open defecation
44
48
5
3
46
47
6
1
41
40
18
1
49
27
22
2
44
49
4
3
46
49
4
1
0%
20%
40%
60%
80%
100%
1990 2010Total Urban Rural
1990 2010 1990 2010
Piped on premises Other improvedUnimproved Surface water
3
23
67
7
6
10
66
18
32
3
65
0
47
9
36
8
1
25
67
7
1
10
70
19
0%
20%
40%
60%
80%
100%
1990 2010Total Urban Rural
1990 2010 1990 2010
0%
20%
40%
60%
80%
100%
5663 58 58
1987DHS
2000MICS
2005Other NS
2010DHS
0% 20% 40% 60% 80% 100%
Poorest 20%
RuralUrban
GirlsBoys
Second 20%Middle 20%Fourth 20%
Richest 20%
6253
3860
70
41
5960
57
Neonatal 31%
HIV/AIDS 6%
Diarrhoea 14%
Measles 0%
Injuries 5%
Pneumonia 17%Malaria 4%
Others 20%
Meningitis 3%
BURUNDIBURUNDI
0%
20%
40%
60%
80%
100%
1987DHS
2000MICS
2005Other NS
2010DHS
MDG 1: NO PROGRESS
3439 35
3529 Maternal mortality ratio, adjusted
(per 100,000 live births)800 (2010)
Maternal mortality ratio, reported(per 100,000 live births)
500 (2010)
Total number of maternal deaths 2,200 (2010)
Lifetime risk of maternal death (1 in : ) 31 (2010)
Women with low BMI (<18.5 kg/m2, %) 16 (2010)
Anaemia, non-pregnant women (<120g/l, %) 16 (2010)
Antenatal care (at least one visit, %) 99 (2010)
Antenatal care (at least four visits, %) 33 (2010)
Skilled attendant at birth (%) 60 (2010)
Low birthweight (<2,500 grams, %) 11 (2005)
Women 20–24 years old who gave birth before age 18 (%)
11 (2010)
0%
20%
40%
60%
80%
100%
1993UNICEF
2000MICS
2005Other NS
80
9896
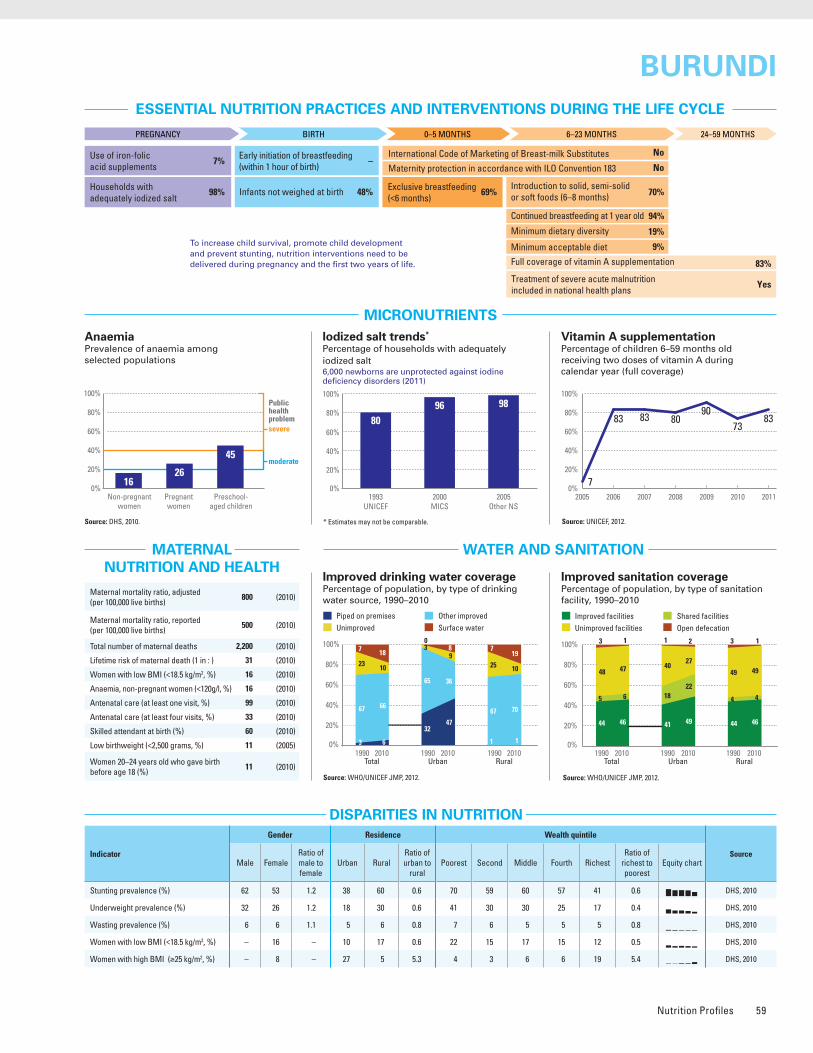
Nutrition Profiles 59
ESSENTIAL NUTRITION PRACTICES AND INTERVENTIONS DURING THE LIFE CYCLE
MICRONUTRIENTS
WATER AND SANITATION
Improved drinking water coveragePercentage of population, by type of drinking water source, 1990–2010
Source: WHO/UNICEF JMP, 2012.
Improved sanitation coveragePercentage of population, by type of sanitation facility, 1990–2010
Source: WHO/UNICEF JMP, 2012.
Vitamin A supplementationPercentage of children 6–59 months old receiving two doses of vitamin A during calendar year (full coverage)
* Estimates may not be comparable. Source: UNICEF, 2012.
MATERNAL NUTRITION AND HEALTH
DISPARITIES IN NUTRITION
Causes of under-five deaths, 2010Globally, undernutrition contributes to more than one third of child deaths
NUTRITIONAL STATUS
Stunting disparitiesPercentage of children <5 years old stunted, by selected background characteristics
DEMOGRAPHICS AND BACKGROUND INFORMATION
INFANT AND YOUNG CHILD FEEDING
Source: DHS, 2010.
Source: WHO/CHERG, 2012.
Under-five mortality rateDeaths per 1,000 live births
Source: IGME, 2012.AnaemiaPrevalence of anaemia among selected populations
Source: DHS, 2010.
Infant feeding practices, by ageExclusive breastfeeding trends Percentage of infants <6 months old exclusively breastfed
Breastfed and non-milk liquids
Breastfed and solid/semi-solid foods
Breastfed and plain water only
Breastfed and other milk/formula
Exclusively breastfed
Weaned (not breastfed)
Stunting trendsPercentage of children <5 years old stunted
Underweight trendsPercentage of children <5 years old underweight
Burden of malnutrition (2011)
Stunting country rank 33
Share of world stunting burden (%) <1%
Source: DHS, 2010.
0–1 2–3 4–5 6–7 8–9 10–11 12–13 14–15 16–17 18–19 20–21 22–23
Age (months)
0%
20%
40%
60%
80%
100%
77
62
45
69
1987DHS
2000MICS
2005Other NS
2010DHS
0%
20%
40%
60%
80%
100%
To increase child survival, promote child development and prevent stunting, nutrition interventions need to be delivered during pregnancy and the first two years of life.
PREGNANCY BIRTH 0–5 MONTHS 6–23 MONTHS 24–59 MONTHS
Use of iron-folic acid supplements
Early initiation of breastfeeding(within 1 hour of birth)
International Code of Marketing of Breast-milk Substitutes
Maternity protection in accordance with ILO Convention 183
Minimum dietary diversity
Minimum acceptable diet
Full coverage of vitamin A supplementation
Treatment of severe acute malnutrition included in national health plans
Introduction to solid, semi-solid or soft foods (6–8 months)
Continued breastfeeding at 1 year old
Infants not weighed at birthHouseholds with adequately iodized salt
Exclusive breastfeeding(<6 months)
94%
70%
No
No
19%
9%
83%
Yes
69%48%
–
98%
7%
Indicator
Gender Residence Wealth quintile
SourceMale Female
Ratio of male to female
Urban RuralRatio of urban to
ruralPoorest Second Middle Fourth Richest
Ratio of richest to poorest
Equity chart
Stunting prevalence (%) 62 53 1.2 38 60 0.6 70 59 60 57 41 0.6 DHS, 2010
Underweight prevalence (%) 32 26 1.2 18 30 0.6 41 30 30 25 17 0.4 DHS, 2010
Wasting prevalence (%) 6 6 1.1 5 6 0.8 7 6 5 5 5 0.8 DHS, 2010
Women with low BMI (<18.5 kg/m2, %) – 16 – 10 17 0.6 22 15 17 15 12 0.5 DHS, 2010
Women with high BMI (≥25 kg/m2, %) – 8 – 27 5 5.3 4 3 6 6 19 5.4 DHS, 2010
0%
20%
40%
60%
80%
100%
2005 2006 2007 2008 2009 2010 2011
7
83 83 8373
9080
Iodized salt trends*
Percentage of households with adequately iodized salt6,000 newborns are unprotected against iodine deficiency disorders (2011)
0%
20%
40%
60%
80%
100%
Non-pregnant women
Pregnant women
1626
45
Public health problemsevere
moderate
Preschool- aged children
1990 1995 2000 2005 2010 2015
183
139
61
0
40
80
120
160
200
MDG 4target
Stunted (under-fives, 000) 703
Wasted (under-fives, 000) 71
Severely wasted (under-fives, 000) 17
MDG 1 progress No progress
Underweight (under-fives, 000) 351
Overweight (under-fives, 000) 33
Total population (000) 8,575 (2011)
Total under-five population (000) 1,218 (2011)
Total number of births (000) 288 (2011)
Under-five mortality rate (per 1,000 live births) 139 (2011)
Total number of under-five deaths (000) 39 (2011)
Infant mortality rate (per 1,000 live births) 86 (2011)
Neonatal mortality rate (per 1,000 live births) 43 (2011)
HIV prevalence rate (15–49 years old, %) 1.3 (2011)
Population below international poverty line of US$1.25 per day (%)
81 (2006)
GNI per capita (US$) 250 (2011)
Primary school net attendance ratio (% female, % male)
74, 73 (2010)
Improved facilities Shared facilitiesUnimproved facilities Open defecation
44
48
5
3
46
47
6
1
41
40
18
1
49
27
22
2
44
49
4
3
46
49
4
1
0%
20%
40%
60%
80%
100%
1990 2010Total Urban Rural
1990 2010 1990 2010
Piped on premises Other improvedUnimproved Surface water
3
23
67
7
6
10
66
18
32
3
65
0
47
9
36
8
1
25
67
7
1
10
70
19
0%
20%
40%
60%
80%
100%
1990 2010Total Urban Rural
1990 2010 1990 2010
0%
20%
40%
60%
80%
100%
5663 58 58
1987DHS
2000MICS
2005Other NS
2010DHS
0% 20% 40% 60% 80% 100%
Poorest 20%
RuralUrban
GirlsBoys
Second 20%Middle 20%Fourth 20%
Richest 20%
6253
3860
70
41
5960
57
Neonatal 31%
HIV/AIDS 6%
Diarrhoea 14%
Measles 0%
Injuries 5%
Pneumonia 17%Malaria 4%
Others 20%
Meningitis 3%
BURUNDIBURUNDI
0%
20%
40%
60%
80%
100%
1987DHS
2000MICS
2005Other NS
2010DHS
MDG 1: NO PROGRESS
3439 35
3529 Maternal mortality ratio, adjusted
(per 100,000 live births)800 (2010)
Maternal mortality ratio, reported(per 100,000 live births)
500 (2010)
Total number of maternal deaths 2,200 (2010)
Lifetime risk of maternal death (1 in : ) 31 (2010)
Women with low BMI (<18.5 kg/m2, %) 16 (2010)
Anaemia, non-pregnant women (<120g/l, %) 16 (2010)
Antenatal care (at least one visit, %) 99 (2010)
Antenatal care (at least four visits, %) 33 (2010)
Skilled attendant at birth (%) 60 (2010)
Low birthweight (<2,500 grams, %) 11 (2005)
Women 20–24 years old who gave birth before age 18 (%)
11 (2010)
0%
20%
40%
60%
80%
100%
1993UNICEF
2000MICS
2005Other NS
80
9896
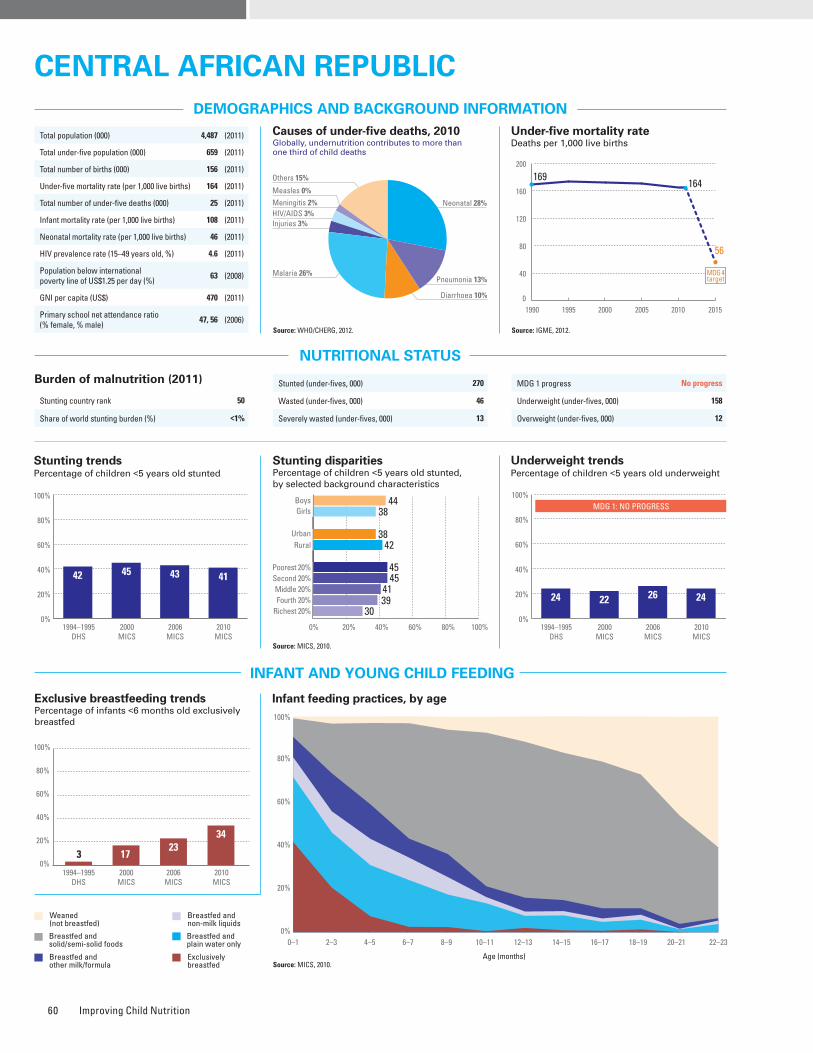
Improving Child Nutrition60
ESSENTIAL NUTRITION PRACTICES AND INTERVENTIONS DURING THE LIFE CYCLE
MICRONUTRIENTS
WATER AND SANITATION
Improved drinking water coveragePercentage of population, by type of drinking water source, 1990–2010
Source: WHO/UNICEF JMP, 2012.
Improved sanitation coveragePercentage of population, by type of sanitation facility, 1990–2010
Source: WHO/UNICEF JMP, 2012.
Vitamin A supplementationPercentage of children 6–59 months old receiving two doses of vitamin A during calendar year (full coverage)
* Estimates may not be comparable. Source: UNICEF, 2012.
MATERNAL NUTRITION AND HEALTH
DISPARITIES IN NUTRITION
Causes of under-five deaths, 2010Globally, undernutrition contributes to more than one third of child deaths
NUTRITIONAL STATUS
Stunting disparitiesPercentage of children <5 years old stunted, by selected background characteristics
DEMOGRAPHICS AND BACKGROUND INFORMATION
INFANT AND YOUNG CHILD FEEDING
Source: WHO/CHERG, 2012.
Under-five mortality rateDeaths per 1,000 live births
Source: IGME, 2012.AnaemiaPrevalence of anaemia among selected populations
Infant feeding practices, by ageExclusive breastfeeding trends Percentage of infants <6 months old exclusively breastfed
Breastfed and non-milk liquids
Breastfed and solid/semi-solid foods
Breastfed and plain water only
Breastfed and other milk/formula
Exclusively breastfed
Weaned (not breastfed)
Stunting trendsPercentage of children <5 years old stunted
Underweight trendsPercentage of children <5 years old underweight
Source: MICS, 2010.
Source: MICS, 2010.
Burden of malnutrition (2011)
Stunting country rank 50
Share of world stunting burden (%) <1%
0–1 2–3 4–5 6–7 8–9 10–11 12–13 14–15 16–17 18–19 20–21 22–23
Age (months)
0%
20%
40%
60%
80%
100%
Iodized salt trends*
Percentage of households with adequately iodized salt55,000 newborns are unprotected against iodine deficiency disorders (2011)
3 1723
34
1994–1995DHS
2000MICS
2006MICS
2010MICS
0%
20%
40%
60%
80%
100%
0%
20%
40%
60%
80%
100%
2005 2006 2007 2008 2009 2010 2011
76
8
78
0
8768
0
To increase child survival, promote child development and prevent stunting, nutrition interventions need to be delivered during pregnancy and the first two years of life.
PREGNANCY BIRTH 0–5 MONTHS 6–23 MONTHS 24–59 MONTHS
Use of iron-folic acid supplements
Early initiation of breastfeeding(within 1 hour of birth)
International Code of Marketing of Breast-milk Substitutes
Maternity protection in accordance with ILO Convention 183
Minimum dietary diversity
Minimum acceptable diet
Full coverage of vitamin A supplementation
Treatment of severe acute malnutrition included in national health plans
Introduction to solid, semi-solid or soft foods (6–8 months)
Continued breastfeeding at 1 year old
Infants not weighed at birthHouseholds with adequately iodized salt
Exclusive breastfeeding(<6 months)
86%
56%
Partial
No
–
–
0%
Yes
34%39%
43%
65%
–
Stunted (under-fives, 000) 270
Wasted (under-fives, 000) 46
Severely wasted (under-fives, 000) 13
MDG 1 progress No progress
Underweight (under-fives, 000) 158
Overweight (under-fives, 000) 12
1990 1995 2000 2005 2010 2015
169164
56
0
40
80
120
160
200
MDG 4target
Total population (000) 4,487 (2011)
Total under-five population (000) 659 (2011)
Total number of births (000) 156 (2011)
Under-five mortality rate (per 1,000 live births) 164 (2011)
Total number of under-five deaths (000) 25 (2011)
Infant mortality rate (per 1,000 live births) 108 (2011)
Neonatal mortality rate (per 1,000 live births) 46 (2011)
HIV prevalence rate (15–49 years old, %) 4.6 (2011)
Population below international poverty line of US$1.25 per day (%)
63 (2008)
GNI per capita (US$) 470 (2011)
Primary school net attendance ratio (% female, % male)
47, 56 (2006)
Indicator
Gender Residence Wealth quintile
SourceMale Female
Ratio of male to female
Urban RuralRatio of urban to
ruralPoorest Second Middle Fourth Richest
Ratio of richest to poorest
Equity chart
Stunting prevalence (%) 44 38 1.2 38 42 0.9 45 45 41 39 30 0.7 MICS, 2010
Underweight prevalence (%) 26 21 1.2 23 24 1.0 26 25 22 24 19 0.7 MICS, 2010
Wasting prevalence (%) 9 6 1.5 8 7 1.1 8 7 6 8 9 1.1 MICS, 2010
Women with low BMI (<18.5 kg/m2, %) – – – – – – – – – – – – –
Women with high BMI (≥25 kg/m2, %) – – – – – – – – – – – – _
Improved facilities Shared facilitiesUnimproved facilities Open defecation
11
48
6
35
34
28
18
20
21
57
12
10
43
30
24
3
5
44
2
49
28
27
14
31
0%
20%
40%
60%
80%
100%
1990 2010Total Urban Rural
1990 2010 1990 2010
Piped on premises Other improvedUnimproved Surface water
3
29
55
13
2
29
65
4
8
20
70
2
6
7
86
1
0
34
47
19
0
43
51
6
0%
20%
40%
60%
80%
100%
1990 2010Total Urban Rural
1990 2010 1990 2010
0%
20%
40%
60%
80%
100%
42 45 43 41
1994–1995DHS
2000MICS
2006MICS
2010MICS
0% 20% 40% 60% 80% 100%
Poorest 20%
RuralUrban
GirlsBoys
Second 20%Middle 20%Fourth 20%
Richest 20%
4438
3842
45
30
454139
0%
20%
40%
60%
80%
100%
1994–1995DHS
2000MICS
2006MICS
2010MICS
MDG 1: NO PROGRESS
24 22 26 24
Neonatal 28%HIV/AIDS 3%
Diarrhoea 10%
Measles 0%
Injuries 3%
Pneumonia 13%Malaria 26%
Others 15%
Meningitis 2%
Central afrICan repuBlICCentral afrICan repuBlIC
nO Data
Maternal mortality ratio, adjusted (per 100,000 live births)
890 (2010)
Maternal mortality ratio, reported(per 100,000 live births)
540 (2006)
Total number of maternal deaths 1,400 (2010)
Lifetime risk of maternal death (1 in : ) 26 (2010)
Women with low BMI (<18.5 kg/m2, %) – –
Anaemia, non-pregnant women (<120g/l, %) – –
Antenatal care (at least one visit, %) 68 (2010)
Antenatal care (at least four visits, %) 38 (2010)
Skilled attendant at birth (%) 54 (2010)
Low birthweight (<2,500 grams, %) 14 (2010)
Women 20–24 years old who gave birth before age 18 (%)
45 (2010)
0%
20%
40%
60%
80%
100%
1998Other NS
2000MICS
2006MICS
2010MICS
87 86
62 65
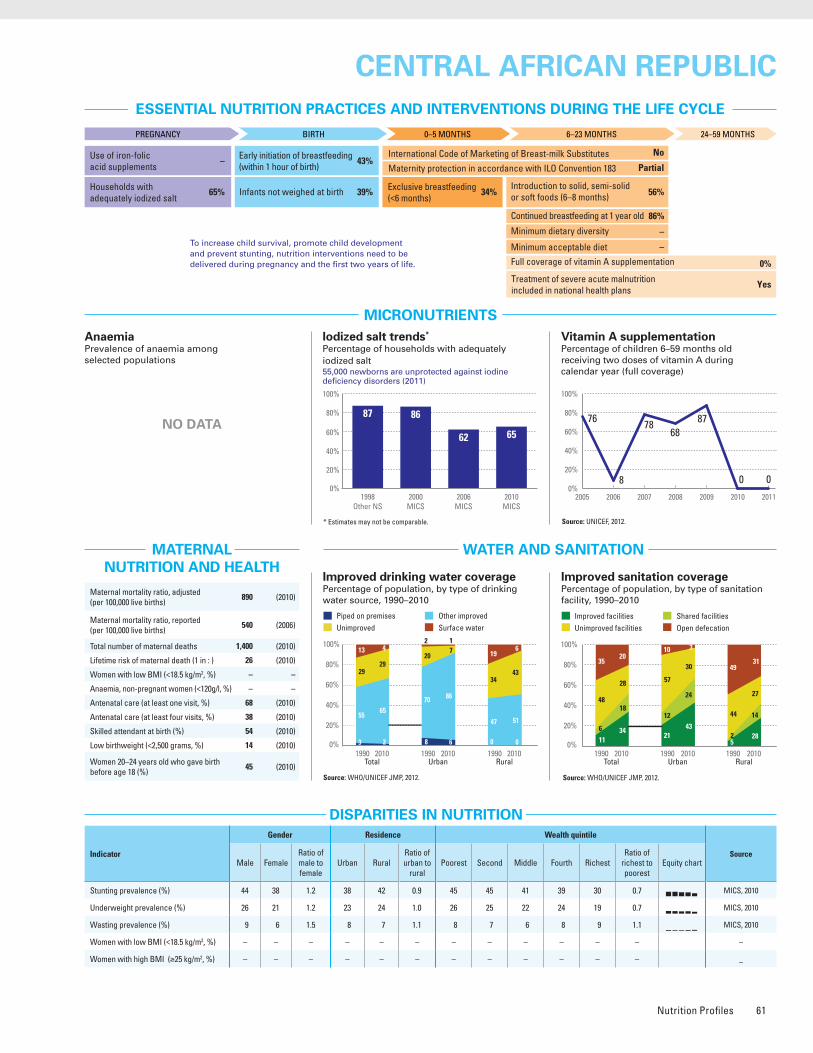
Nutrition Profiles 61
ESSENTIAL NUTRITION PRACTICES AND INTERVENTIONS DURING THE LIFE CYCLE
MICRONUTRIENTS
WATER AND SANITATION
Improved drinking water coveragePercentage of population, by type of drinking water source, 1990–2010
Source: WHO/UNICEF JMP, 2012.
Improved sanitation coveragePercentage of population, by type of sanitation facility, 1990–2010
Source: WHO/UNICEF JMP, 2012.
Vitamin A supplementationPercentage of children 6–59 months old receiving two doses of vitamin A during calendar year (full coverage)
* Estimates may not be comparable. Source: UNICEF, 2012.
MATERNAL NUTRITION AND HEALTH
DISPARITIES IN NUTRITION
Causes of under-five deaths, 2010Globally, undernutrition contributes to more than one third of child deaths
NUTRITIONAL STATUS
Stunting disparitiesPercentage of children <5 years old stunted, by selected background characteristics
DEMOGRAPHICS AND BACKGROUND INFORMATION
INFANT AND YOUNG CHILD FEEDING
Source: WHO/CHERG, 2012.
Under-five mortality rateDeaths per 1,000 live births
Source: IGME, 2012.AnaemiaPrevalence of anaemia among selected populations
Infant feeding practices, by ageExclusive breastfeeding trends Percentage of infants <6 months old exclusively breastfed
Breastfed and non-milk liquids
Breastfed and solid/semi-solid foods
Breastfed and plain water only
Breastfed and other milk/formula
Exclusively breastfed
Weaned (not breastfed)
Stunting trendsPercentage of children <5 years old stunted
Underweight trendsPercentage of children <5 years old underweight
Source: MICS, 2010.
Source: MICS, 2010.
Burden of malnutrition (2011)
Stunting country rank 50
Share of world stunting burden (%) <1%
0–1 2–3 4–5 6–7 8–9 10–11 12–13 14–15 16–17 18–19 20–21 22–23
Age (months)
0%
20%
40%
60%
80%
100%
Iodized salt trends*
Percentage of households with adequately iodized salt55,000 newborns are unprotected against iodine deficiency disorders (2011)
3 1723
34
1994–1995DHS
2000MICS
2006MICS
2010MICS
0%
20%
40%
60%
80%
100%
0%
20%
40%
60%
80%
100%
2005 2006 2007 2008 2009 2010 2011
76
8
78
0
8768
0
To increase child survival, promote child development and prevent stunting, nutrition interventions need to be delivered during pregnancy and the first two years of life.
PREGNANCY BIRTH 0–5 MONTHS 6–23 MONTHS 24–59 MONTHS
Use of iron-folic acid supplements
Early initiation of breastfeeding(within 1 hour of birth)
International Code of Marketing of Breast-milk Substitutes
Maternity protection in accordance with ILO Convention 183
Minimum dietary diversity
Minimum acceptable diet
Full coverage of vitamin A supplementation
Treatment of severe acute malnutrition included in national health plans
Introduction to solid, semi-solid or soft foods (6–8 months)
Continued breastfeeding at 1 year old
Infants not weighed at birthHouseholds with adequately iodized salt
Exclusive breastfeeding(<6 months)
86%
56%
Partial
No
–
–
0%
Yes
34%39%
43%
65%
–
Stunted (under-fives, 000) 270
Wasted (under-fives, 000) 46
Severely wasted (under-fives, 000) 13
MDG 1 progress No progress
Underweight (under-fives, 000) 158
Overweight (under-fives, 000) 12
1990 1995 2000 2005 2010 2015
169164
56
0
40
80
120
160
200
MDG 4target
Total population (000) 4,487 (2011)
Total under-five population (000) 659 (2011)
Total number of births (000) 156 (2011)
Under-five mortality rate (per 1,000 live births) 164 (2011)
Total number of under-five deaths (000) 25 (2011)
Infant mortality rate (per 1,000 live births) 108 (2011)
Neonatal mortality rate (per 1,000 live births) 46 (2011)
HIV prevalence rate (15–49 years old, %) 4.6 (2011)
Population below international poverty line of US$1.25 per day (%)
63 (2008)
GNI per capita (US$) 470 (2011)
Primary school net attendance ratio (% female, % male)
47, 56 (2006)
Indicator
Gender Residence Wealth quintile
SourceMale Female
Ratio of male to female
Urban RuralRatio of urban to
ruralPoorest Second Middle Fourth Richest
Ratio of richest to poorest
Equity chart
Stunting prevalence (%) 44 38 1.2 38 42 0.9 45 45 41 39 30 0.7 MICS, 2010
Underweight prevalence (%) 26 21 1.2 23 24 1.0 26 25 22 24 19 0.7 MICS, 2010
Wasting prevalence (%) 9 6 1.5 8 7 1.1 8 7 6 8 9 1.1 MICS, 2010
Women with low BMI (<18.5 kg/m2, %) – – – – – – – – – – – – –
Women with high BMI (≥25 kg/m2, %) – – – – – – – – – – – – _
Improved facilities Shared facilitiesUnimproved facilities Open defecation
11
48
6
35
34
28
18
20
21
57
12
10
43
30
24
3
5
44
2
49
28
27
14
31
0%
20%
40%
60%
80%
100%
1990 2010Total Urban Rural
1990 2010 1990 2010
Piped on premises Other improvedUnimproved Surface water
3
29
55
13
2
29
65
4
8
20
70
2
6
7
86
1
0
34
47
19
0
43
51
6
0%
20%
40%
60%
80%
100%
1990 2010Total Urban Rural
1990 2010 1990 2010
0%
20%
40%
60%
80%
100%
42 45 43 41
1994–1995DHS
2000MICS
2006MICS
2010MICS
0% 20% 40% 60% 80% 100%
Poorest 20%
RuralUrban
GirlsBoys
Second 20%Middle 20%Fourth 20%
Richest 20%
4438
3842
45
30
454139
0%
20%
40%
60%
80%
100%
1994–1995DHS
2000MICS
2006MICS
2010MICS
MDG 1: NO PROGRESS
24 22 26 24
Neonatal 28%HIV/AIDS 3%
Diarrhoea 10%
Measles 0%
Injuries 3%
Pneumonia 13%Malaria 26%
Others 15%
Meningitis 2%
Central afrICan repuBlICCentral afrICan repuBlIC
nO Data
Maternal mortality ratio, adjusted (per 100,000 live births)
890 (2010)
Maternal mortality ratio, reported(per 100,000 live births)
540 (2006)
Total number of maternal deaths 1,400 (2010)
Lifetime risk of maternal death (1 in : ) 26 (2010)
Women with low BMI (<18.5 kg/m2, %) – –
Anaemia, non-pregnant women (<120g/l, %) – –
Antenatal care (at least one visit, %) 68 (2010)
Antenatal care (at least four visits, %) 38 (2010)
Skilled attendant at birth (%) 54 (2010)
Low birthweight (<2,500 grams, %) 14 (2010)
Women 20–24 years old who gave birth before age 18 (%)
45 (2010)
0%
20%
40%
60%
80%
100%
1998Other NS
2000MICS
2006MICS
2010MICS
87 86
62 65
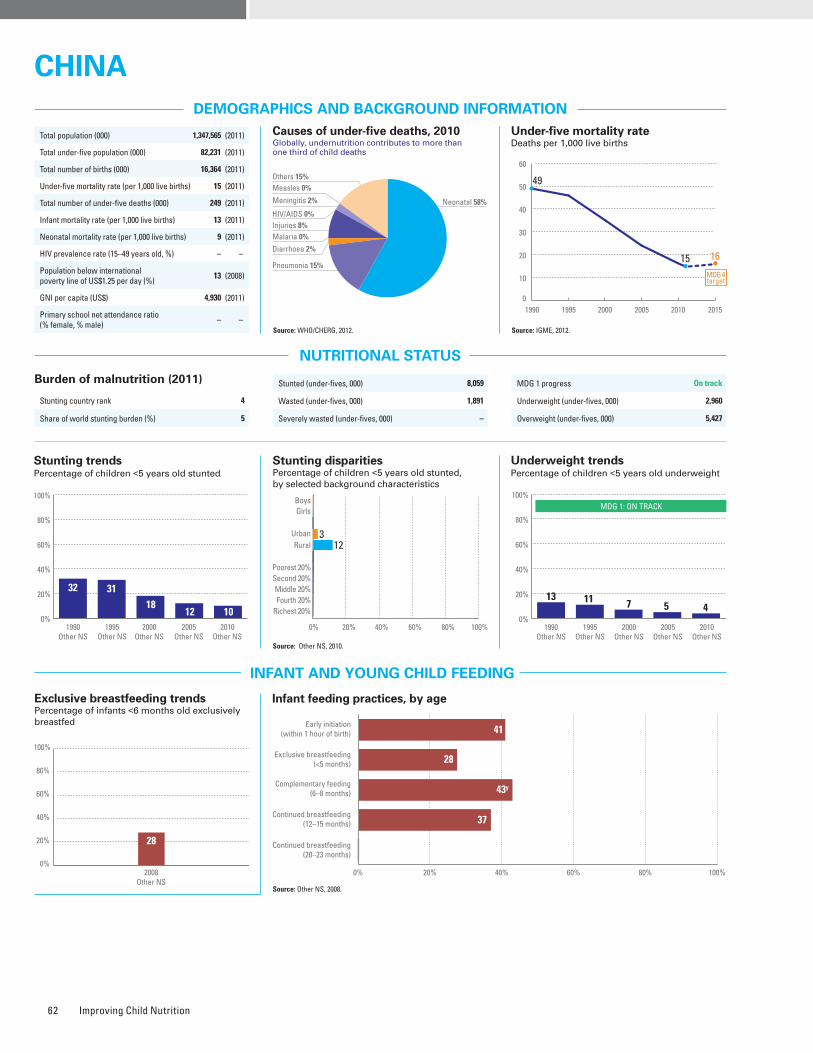
Improving Child Nutrition62
ESSENTIAL NUTRITION PRACTICES AND INTERVENTIONS DURING THE LIFE CYCLE
MICRONUTRIENTS
WATER AND SANITATION
Improved drinking water coveragePercentage of population, by type of drinking water source, 1990–2010
Source: WHO/UNICEF JMP, 2012.
Improved sanitation coveragePercentage of population, by type of sanitation facility, 1990–2010
Source: WHO/UNICEF JMP, 2012.
Vitamin A supplementationPercentage of children 6–59 months old receiving two doses of vitamin A during calendar year (full coverage)
* Estimates may not be comparable.
MATERNAL NUTRITION AND HEALTH
DISPARITIES IN NUTRITION
Causes of under-five deaths, 2010Globally, undernutrition contributes to more than one third of child deaths
NUTRITIONAL STATUS
Stunting disparitiesPercentage of children <5 years old stunted, by selected background characteristics
DEMOGRAPHICS AND BACKGROUND INFORMATION
INFANT AND YOUNG CHILD FEEDING
Source: WHO/CHERG, 2012.
Under-five mortality rateDeaths per 1,000 live births
Source: IGME, 2012.AnaemiaPrevalence of anaemia among selected populations
Infant feeding practices, by ageExclusive breastfeeding trends Percentage of infants <6 months old exclusively breastfed
Stunting trendsPercentage of children <5 years old stunted
Underweight trendsPercentage of children <5 years old underweight
Burden of malnutrition (2011)
Stunting country rank 4
Share of world stunting burden (%) 5
28
2008Other NS
0%
20%
40%
60%
80%
100%
Source: Other NS, 2010.
Source: Other NS, 2008.
1990 1995 2000 2005 2010 2015
49
15 16
0
10
20
30
40
50
60
MDG 4target
Indicator
Gender Residence Wealth quintile
SourceMale Female
Ratio of male to female
Urban RuralRatio of urban to
ruralPoorest Second Middle Fourth Richest
Ratio of richest to poorest
Equity chart
Stunting prevalence (%) – – – 3 12 0.3 – – – – – – Other NS, 2010
Underweight prevalence (%) – – – 1 4 0.3 – – – – – – Other NS, 2010
Wasting prevalence (%) – – – – – – – – – – – – –
Women with low BMI (<18.5 kg/m2, %) – – – – – – – – – – – – –
Women with high BMI (≥25 kg/m2, %) – – – – – – – – – – – – –
Iodized salt trends*
Percentage of households with adequately iodized salt524,000 newborns are unprotected against iodine deficiency disorders (2011)
To increase child survival, promote child development and prevent stunting, nutrition interventions need to be delivered during pregnancy and the first two years of life.
PREGNANCY BIRTH 0–5 MONTHS 6–23 MONTHS 24–59 MONTHS
Use of iron-folic acid supplements
Early initiation of breastfeeding(within 1 hour of birth)
International Code of Marketing of Breast-milk Substitutes
Maternity protection in accordance with ILO Convention 183
Minimum dietary diversity
Minimum acceptable diet
Full coverage of vitamin A supplementation
Treatment of severe acute malnutrition included in national health plans
Introduction to solid, semi-solid or soft foods (6–8 months)
Continued breastfeeding at 1 year old
Infants not weighed at birthHouseholds with adequately iodized salt
Exclusive breastfeeding(<6 months)
37%
43%
No
Partial
–
–
–
–
28%–
41%
97%
–
Stunted (under-fives, 000) 8,059
Wasted (under-fives, 000) 1,891
Severely wasted (under-fives, 000) –
MDG 1 progress On track
Underweight (under-fives, 000) 2,960
Overweight (under-fives, 000) 5,427
Total population (000) 1,347,565 (2011)
Total under-five population (000) 82,231 (2011)
Total number of births (000) 16,364 (2011)
Under-five mortality rate (per 1,000 live births) 15 (2011)
Total number of under-five deaths (000) 249 (2011)
Infant mortality rate (per 1,000 live births) 13 (2011)
Neonatal mortality rate (per 1,000 live births) 9 (2011)
HIV prevalence rate (15–49 years old, %) – –
Population below international poverty line of US$1.25 per day (%)
13 (2008)
GNI per capita (US$) 4,930 (2011)
Primary school net attendance ratio (% female, % male)
– –
Improved facilities Shared facilitiesUnimproved facilities Open defecation
24
62
7
7
64
16
19
1
48
34
15
3
74
2
24
0
15
72
4
9
56
28
14
2
0%
20%
40%
60%
80%
100%
1990 2010Total Urban Rural
1990 2010 1990 2010
Piped on premises Other improvedUnimproved Surface water
33
25
34
8
68
8
23
1
92
25
1
95
23
0
12
34
44
10
45
13
40
2
0%
20%
40%
60%
80%
100%
1990 2010Total Urban Rural
1990 2010 1990 2010
0%
20%
40%
60%
80%
100%
12
32 3118
101990
Other NS1995
Other NS2000
Other NS2005
Other NS2010
Other NS
Poorest 20%
RuralUrban
GirlsBoys
Second 20%Middle 20%Fourth 20%
Richest 20%
312
0% 20% 40% 60% 80% 100%0%
20%
40%
60%
80%
100%
52
1990Other NS
1995Other NS
2000Other NS
2005Other NS
2010Other NS
MDG 1: ON TRACK
11 7 5 413
Neonatal 58%HIV/AIDS 0%
Diarrhoea 2%
Measles 0%
Injuries 8%
Pneumonia 15%
Malaria 0%
Others 15%
Meningitis 2%
CHINACHINA
NO DATA NO DATA
Early initiation (within 1 hour of birth)
Exclusive breastfeeding (<5 months)
Complementary feeding (6–8 months)
Continued breastfeeding (12–15 months)
Continued breastfeeding (20–23 months)
0% 20% 40% 60% 80% 100%
0% 20% 40% 60% 80% 100%
41
28
37
43y
41
27
37
43y
Early Initiation (within 1 hour of birth)
Exclusive breastfeeding (<5 months)
Complementary feeding (6-8 months)
Continued breastfeeding (12-15 months)
Continued breastfeeding (20-23 months)
Maternal mortality ratio, adjusted (per 100,000 live births)
37 (2010)
Maternal mortality ratio, reported(per 100,000 live births)
30 (2010)
Total number of maternal deaths 6,000 (2010)
Lifetime risk of maternal death (1 in : ) 1,700 (2010)
Women with low BMI (<18.5 kg/m2, %) – –
Anaemia, non-pregnant women (<120g/l, %) – –
Antenatal care (at least one visit, %) 94 (2010)
Antenatal care (at least four visits, %) – –
Skilled attendant at birth (%) 100 (2010)
Low birthweight (<2,500 grams, %) 3 (2008)
Women 20–24 years old who gave birth before age 18 (%)
– –
0%
20%
40%
60%
80%
100%
1995Other NS
2002Other NS
2008Other NS
2011Other NS
60
93 95 97
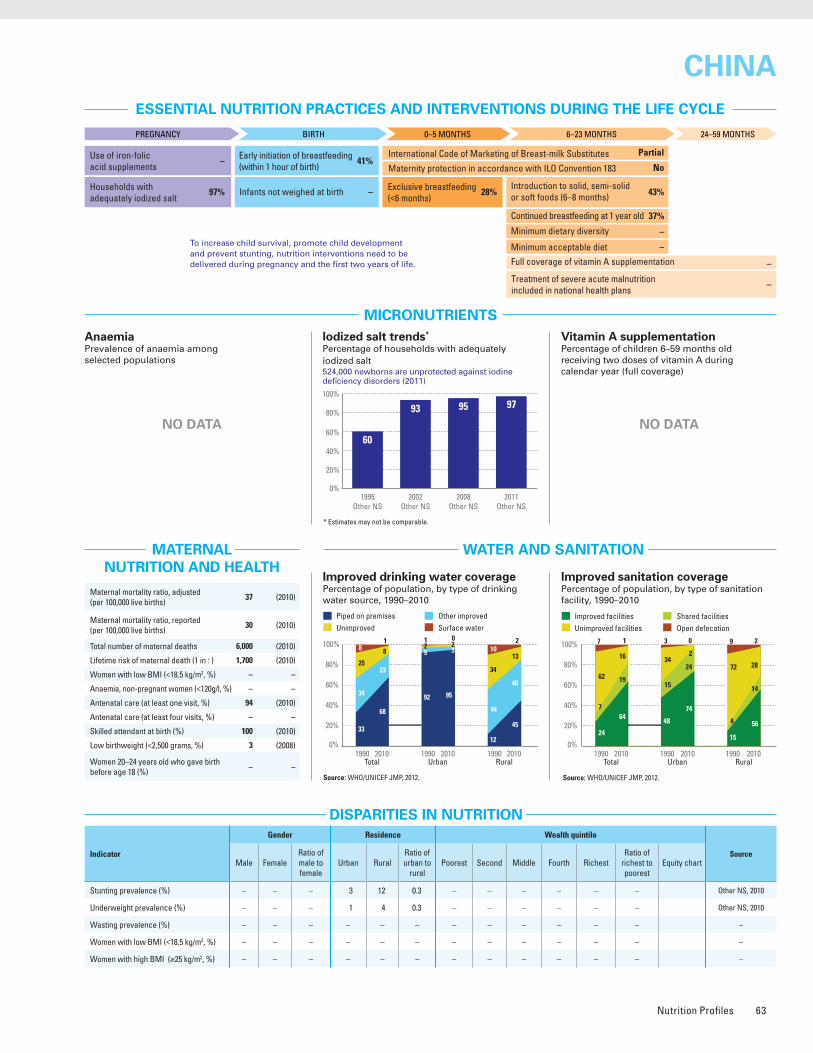
Nutrition Profiles 63
ESSENTIAL NUTRITION PRACTICES AND INTERVENTIONS DURING THE LIFE CYCLE
MICRONUTRIENTS
WATER AND SANITATION
Improved drinking water coveragePercentage of population, by type of drinking water source, 1990–2010
Source: WHO/UNICEF JMP, 2012.
Improved sanitation coveragePercentage of population, by type of sanitation facility, 1990–2010
Source: WHO/UNICEF JMP, 2012.
Vitamin A supplementationPercentage of children 6–59 months old receiving two doses of vitamin A during calendar year (full coverage)
* Estimates may not be comparable.
MATERNAL NUTRITION AND HEALTH
DISPARITIES IN NUTRITION
Causes of under-five deaths, 2010Globally, undernutrition contributes to more than one third of child deaths
NUTRITIONAL STATUS
Stunting disparitiesPercentage of children <5 years old stunted, by selected background characteristics
DEMOGRAPHICS AND BACKGROUND INFORMATION
INFANT AND YOUNG CHILD FEEDING
Source: WHO/CHERG, 2012.
Under-five mortality rateDeaths per 1,000 live births
Source: IGME, 2012.AnaemiaPrevalence of anaemia among selected populations
Infant feeding practices, by ageExclusive breastfeeding trends Percentage of infants <6 months old exclusively breastfed
Stunting trendsPercentage of children <5 years old stunted
Underweight trendsPercentage of children <5 years old underweight
Burden of malnutrition (2011)
Stunting country rank 4
Share of world stunting burden (%) 5
28
2008Other NS
0%
20%
40%
60%
80%
100%
Source: Other NS, 2010.
Source: Other NS, 2008.
1990 1995 2000 2005 2010 2015
49
15 16
0
10
20
30
40
50
60
MDG 4target
Indicator
Gender Residence Wealth quintile
SourceMale Female
Ratio of male to female
Urban RuralRatio of urban to
ruralPoorest Second Middle Fourth Richest
Ratio of richest to poorest
Equity chart
Stunting prevalence (%) – – – 3 12 0.3 – – – – – – Other NS, 2010
Underweight prevalence (%) – – – 1 4 0.3 – – – – – – Other NS, 2010
Wasting prevalence (%) – – – – – – – – – – – – –
Women with low BMI (<18.5 kg/m2, %) – – – – – – – – – – – – –
Women with high BMI (≥25 kg/m2, %) – – – – – – – – – – – – –
Iodized salt trends*
Percentage of households with adequately iodized salt524,000 newborns are unprotected against iodine deficiency disorders (2011)
To increase child survival, promote child development and prevent stunting, nutrition interventions need to be delivered during pregnancy and the first two years of life.
PREGNANCY BIRTH 0–5 MONTHS 6–23 MONTHS 24–59 MONTHS
Use of iron-folic acid supplements
Early initiation of breastfeeding(within 1 hour of birth)
International Code of Marketing of Breast-milk Substitutes
Maternity protection in accordance with ILO Convention 183
Minimum dietary diversity
Minimum acceptable diet
Full coverage of vitamin A supplementation
Treatment of severe acute malnutrition included in national health plans
Introduction to solid, semi-solid or soft foods (6–8 months)
Continued breastfeeding at 1 year old
Infants not weighed at birthHouseholds with adequately iodized salt
Exclusive breastfeeding(<6 months)
37%
43%
No
Partial
–
–
–
–
28%–
41%
97%
–
Stunted (under-fives, 000) 8,059
Wasted (under-fives, 000) 1,891
Severely wasted (under-fives, 000) –
MDG 1 progress On track
Underweight (under-fives, 000) 2,960
Overweight (under-fives, 000) 5,427
Total population (000) 1,347,565 (2011)
Total under-five population (000) 82,231 (2011)
Total number of births (000) 16,364 (2011)
Under-five mortality rate (per 1,000 live births) 15 (2011)
Total number of under-five deaths (000) 249 (2011)
Infant mortality rate (per 1,000 live births) 13 (2011)
Neonatal mortality rate (per 1,000 live births) 9 (2011)
HIV prevalence rate (15–49 years old, %) – –
Population below international poverty line of US$1.25 per day (%)
13 (2008)
GNI per capita (US$) 4,930 (2011)
Primary school net attendance ratio (% female, % male)
– –
Improved facilities Shared facilitiesUnimproved facilities Open defecation
24
62
7
7
64
16
19
1
48
34
15
3
74
2
24
0
15
72
4
9
56
28
14
2
0%
20%
40%
60%
80%
100%
1990 2010Total Urban Rural
1990 2010 1990 2010
Piped on premises Other improvedUnimproved Surface water
33
25
34
8
68
8
23
1
92
25
1
95
23
0
12
34
44
10
45
13
40
2
0%
20%
40%
60%
80%
100%
1990 2010Total Urban Rural
1990 2010 1990 2010
0%
20%
40%
60%
80%
100%
12
32 3118
101990
Other NS1995
Other NS2000
Other NS2005
Other NS2010
Other NS
Poorest 20%
RuralUrban
GirlsBoys
Second 20%Middle 20%Fourth 20%
Richest 20%
312
0% 20% 40% 60% 80% 100%0%
20%
40%
60%
80%
100%
52
1990Other NS
1995Other NS
2000Other NS
2005Other NS
2010Other NS
MDG 1: ON TRACK
11 7 5 413
Neonatal 58%HIV/AIDS 0%
Diarrhoea 2%
Measles 0%
Injuries 8%
Pneumonia 15%
Malaria 0%
Others 15%
Meningitis 2%
CHINACHINA
NO DATA NO DATA
Early initiation (within 1 hour of birth)
Exclusive breastfeeding (<5 months)
Complementary feeding (6–8 months)
Continued breastfeeding (12–15 months)
Continued breastfeeding (20–23 months)
0% 20% 40% 60% 80% 100%
0% 20% 40% 60% 80% 100%
41
28
37
43y
41
27
37
43y
Early Initiation (within 1 hour of birth)
Exclusive breastfeeding (<5 months)
Complementary feeding (6-8 months)
Continued breastfeeding (12-15 months)
Continued breastfeeding (20-23 months)
Maternal mortality ratio, adjusted (per 100,000 live births)
37 (2010)
Maternal mortality ratio, reported(per 100,000 live births)
30 (2010)
Total number of maternal deaths 6,000 (2010)
Lifetime risk of maternal death (1 in : ) 1,700 (2010)
Women with low BMI (<18.5 kg/m2, %) – –
Anaemia, non-pregnant women (<120g/l, %) – –
Antenatal care (at least one visit, %) 94 (2010)
Antenatal care (at least four visits, %) – –
Skilled attendant at birth (%) 100 (2010)
Low birthweight (<2,500 grams, %) 3 (2008)
Women 20–24 years old who gave birth before age 18 (%)
– –
0%
20%
40%
60%
80%
100%
1995Other NS
2002Other NS
2008Other NS
2011Other NS
60
93 95 97
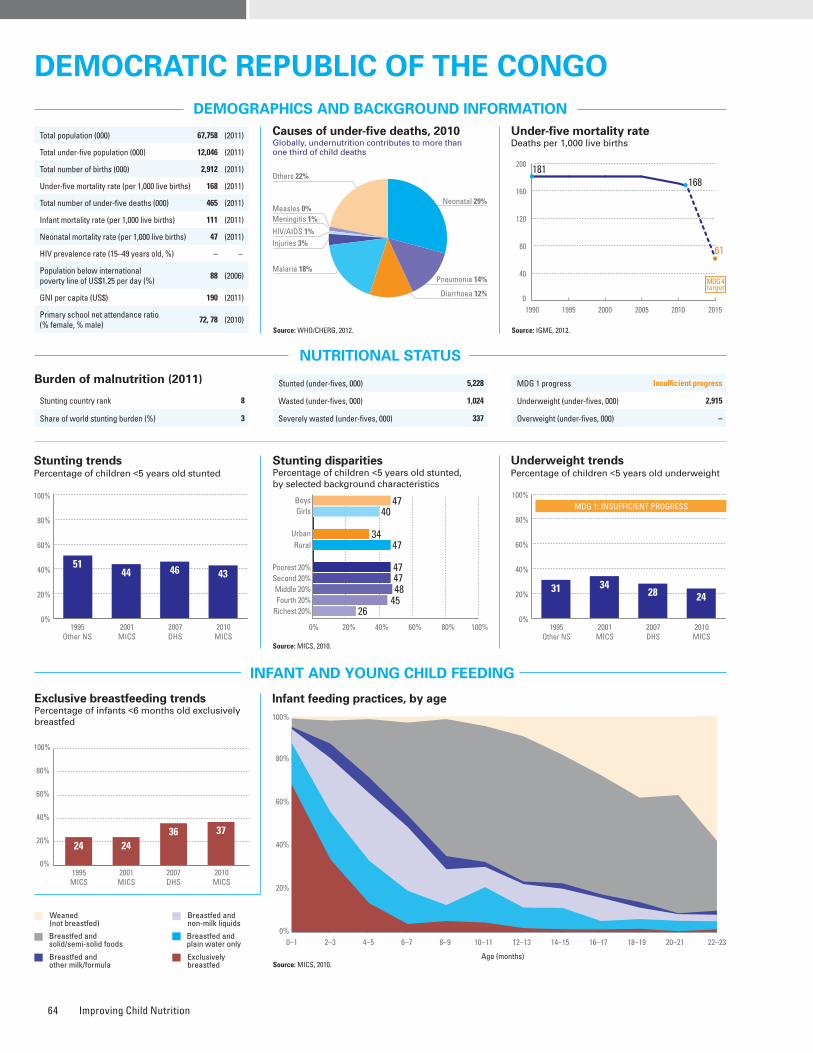
Improving Child Nutrition64
ESSENTIAL NUTRITION PRACTICES AND INTERVENTIONS DURING THE LIFE CYCLE
MICRONUTRIENTS
WATER AND SANITATION
Improved drinking water coveragePercentage of population, by type of drinking water source, 1990–2010
Source: WHO/UNICEF JMP, 2012.
Improved sanitation coveragePercentage of population, by type of sanitation facility, 1990–2010
Source: WHO/UNICEF JMP, 2012.
Vitamin A supplementationPercentage of children 6–59 months old receiving two doses of vitamin A during calendar year (full coverage)
* Estimates may not be comparable. Source: UNICEF, 2012.
MATERNAL NUTRITION AND HEALTH
DISPARITIES IN NUTRITION
Causes of under-five deaths, 2010Globally, undernutrition contributes to more than one third of child deaths
NUTRITIONAL STATUS
Stunting disparitiesPercentage of children <5 years old stunted, by selected background characteristics
DEMOGRAPHICS AND BACKGROUND INFORMATION
INFANT AND YOUNG CHILD FEEDING
Source: WHO/CHERG, 2012.
Under-five mortality rateDeaths per 1,000 live births
Source: IGME, 2012.AnaemiaPrevalence of anaemia among selected populations
Infant feeding practices, by ageExclusive breastfeeding trends Percentage of infants <6 months old exclusively breastfed
Breastfed and non-milk liquids
Breastfed and solid/semi-solid foods
Breastfed and plain water only
Breastfed and other milk/formula
Exclusively breastfed
Weaned (not breastfed)
Stunting trendsPercentage of children <5 years old stunted
Underweight trendsPercentage of children <5 years old underweight
Source: DHS, 2007.
Burden of malnutrition (2011)
Stunting country rank 8
Share of world stunting burden (%) 3
Source: MICS, 2010.
Source: MICS, 2010.
Indicator
Gender Residence Wealth quintile
SourceMale Female
Ratio of male to female
Urban RuralRatio of urban to
ruralPoorest Second Middle Fourth Richest
Ratio of richest to poorest
Equity chart
Stunting prevalence (%) 47 40 1.2 34 47 0.7 47 47 48 45 26 0.6 MICS, 2010
Underweight prevalence (%) 27 21 1.3 17 27 0.6 29 28 27 21 12 0.4 MICS, 2010
Wasting prevalence (%) 10 8 1.3 7 9 0.8 10 9 10 6 7 0.7 MICS, 2010
Women with low BMI (<18.5 kg/m2, %) – 19 – 16 21 0.8 23 20 21 15 15 0.7 DHS, 2007
Women with high BMI (≥25 kg/m2, %) – 11 – 18 6 2.9 6 6 7 13 23 3.8 DHS, 2007
Improved facilities Shared facilitiesUnimproved facilities Open defecation
9
61
12
18
24
40
27
9
23
40
32
5
24
42
33
1
4
69
4
23
24
40
23
13
0%
20%
40%
60%
80%
100%
1990 2010Total Urban Rural
1990 2010 1990 2010
0%
20%
40%
60%
80%
100%
2005 2006 2007 2008 2009 2010 2011
87 9179
98838985
1990 1995 2000 2005 2010 2015
181168
61
0
40
80
120
160
200
MDG 4target
0–1 2–3 4–5 6–7 8–9 10–11 12–13 14–15 16–17 18–19 20–21 22–23
Age (months)
0%
20%
40%
60%
80%
100%
0%
20%
40%
60%
80%
100%
Non-pregnant women
Pregnant women
5260
71
Public health problemsevere
moderate
Preschool- aged children
Stunted (under-fives, 000) 5,228
Wasted (under-fives, 000) 1,024
Severely wasted (under-fives, 000) 337
MDG 1 progress Insufficient progress
Underweight (under-fives, 000) 2,915
Overweight (under-fives, 000) –
Total population (000) 67,758 (2011)
Total under-five population (000) 12,046 (2011)
Total number of births (000) 2,912 (2011)
Under-five mortality rate (per 1,000 live births) 168 (2011)
Total number of under-five deaths (000) 465 (2011)
Infant mortality rate (per 1,000 live births) 111 (2011)
Neonatal mortality rate (per 1,000 live births) 47 (2011)
HIV prevalence rate (15–49 years old, %) – –
Population below international poverty line of US$1.25 per day (%)
88 (2006)
GNI per capita (US$) 190 (2011)
Primary school net attendance ratio (% female, % male)
72, 78 (2010)
Iodized salt trends*
Percentage of households with adequately iodized salt1,206,000 newborns are unprotected against iodine deficiency disorders (2011)
Piped on premises Other improvedUnimproved Surface water
14
31
31
24
9
37
36
18
51
10
39
0
21
17
58
4
0
40
27
33
2
47
25
26
0%
20%
40%
60%
80%
100%
1990 2010Total Urban Rural
1990 2010 1990 2010
0%
20%
40%
60%
80%
100%
5144 46 43
1995Other NS
2001MICS
2007DHS
2010MICS
Poorest 20%
RuralUrban
GirlsBoys
Second 20%Middle 20%Fourth 20%
Richest 20%
4740
3447
47
26
4748
45
0% 20% 40% 60% 80% 100%0%
20%
40%
60%
80%
100%
1995Other NS
2001MICS
2007DHS
2010MICS
MDG 1: INSUFFICIENT PROGRESS
31 3428 24
Neonatal 29%
HIV/AIDS 1%
Diarrhoea 12%
Measles 0%
Injuries 3%
Pneumonia 14%Malaria 18%
Others 22%
Meningitis 1%
DemocratIc repuBlIc of the congoDemocratIc repuBlIc of the congo
24 2436 37
1995MICS
2001MICS
2007DHS
2010MICS
0%
20%
40%
60%
80%
100%
To increase child survival, promote child development and prevent stunting, nutrition interventions need to be delivered during pregnancy and the first two years of life.
PREGNANCY BIRTH 0–5 MONTHS 6–23 MONTHS 24–59 MONTHS
Use of iron-folic acid supplements
Early initiation of breastfeeding(within 1 hour of birth)
International Code of Marketing of Breast-milk Substitutes
Maternity protection in accordance with ILO Convention 183
Minimum dietary diversity
Minimum acceptable diet
Full coverage of vitamin A supplementation
Treatment of severe acute malnutrition included in national health plans
Introduction to solid, semi-solid or soft foods (6–8 months)
Continued breastfeeding at 1 year old
Infants not weighed at birthHouseholds with adequately iodized salt
Exclusive breastfeeding(<6 months)
87%
52%
No
Partial
–
–
98%
Yes
37%30%
43%
59%
2%
Maternal mortality ratio, adjusted (per 100,000 live births)
540 (2010)
Maternal mortality ratio, reported(per 100,000 live births)
550 (2007)
Total number of maternal deaths 15,000 (2010)
Lifetime risk of maternal death (1 in : ) 30 (2010)
Women with low BMI (<18.5 kg/m2, %) 19 (2007)
Anaemia, non-pregnant women (<120g/l, %) 52 (2007)
Antenatal care (at least one visit, %) 89 (2010)
Antenatal care (at least four visits, %) 45 (2010)
Skilled attendant at birth (%) 80 (2010)
Low birthweight (<2,500 grams, %) 10 (2010)
Women 20–24 years old who gave birth before age 18 (%)
25 (2010)
0%
20%
40%
60%
80%
100%
1995MICS
1997Other NS
2001MICS
2007DHS
2010MICS
12
90
7279
59
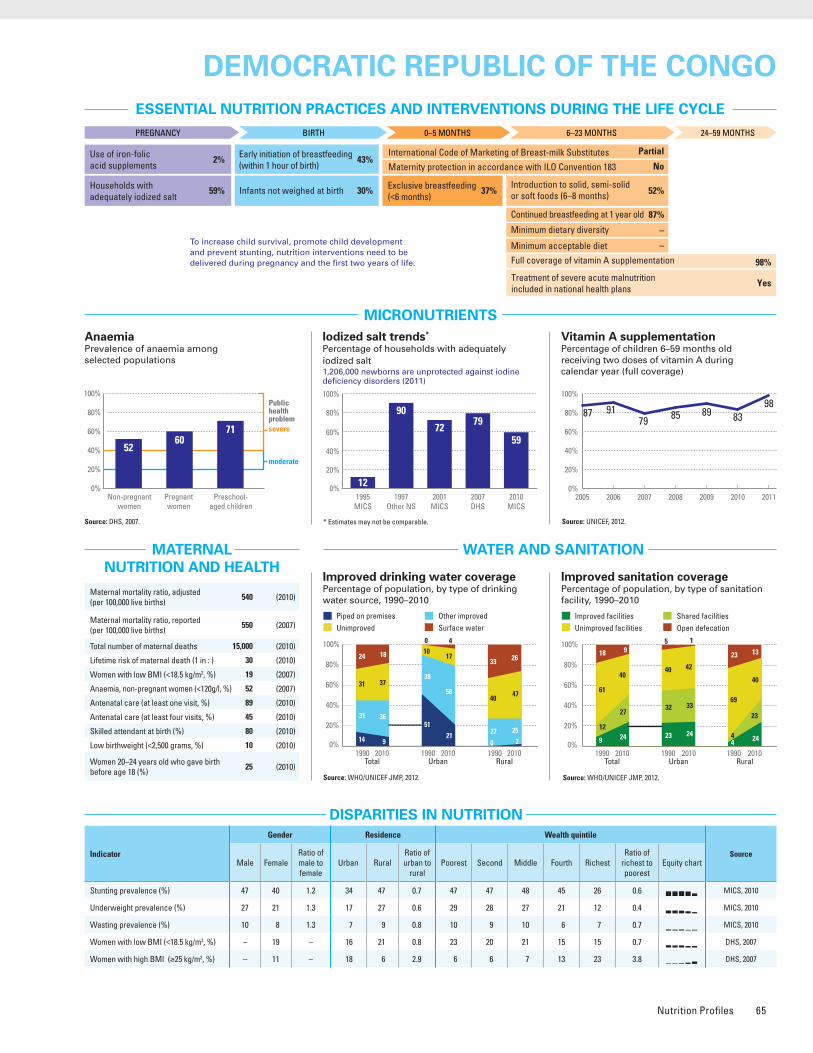
Nutrition Profiles 65
ESSENTIAL NUTRITION PRACTICES AND INTERVENTIONS DURING THE LIFE CYCLE
MICRONUTRIENTS
WATER AND SANITATION
Improved drinking water coveragePercentage of population, by type of drinking water source, 1990–2010
Source: WHO/UNICEF JMP, 2012.
Improved sanitation coveragePercentage of population, by type of sanitation facility, 1990–2010
Source: WHO/UNICEF JMP, 2012.
Vitamin A supplementationPercentage of children 6–59 months old receiving two doses of vitamin A during calendar year (full coverage)
* Estimates may not be comparable. Source: UNICEF, 2012.
MATERNAL NUTRITION AND HEALTH
DISPARITIES IN NUTRITION
Causes of under-five deaths, 2010Globally, undernutrition contributes to more than one third of child deaths
NUTRITIONAL STATUS
Stunting disparitiesPercentage of children <5 years old stunted, by selected background characteristics
DEMOGRAPHICS AND BACKGROUND INFORMATION
INFANT AND YOUNG CHILD FEEDING
Source: WHO/CHERG, 2012.
Under-five mortality rateDeaths per 1,000 live births
Source: IGME, 2012.AnaemiaPrevalence of anaemia among selected populations
Infant feeding practices, by ageExclusive breastfeeding trends Percentage of infants <6 months old exclusively breastfed
Breastfed and non-milk liquids
Breastfed and solid/semi-solid foods
Breastfed and plain water only
Breastfed and other milk/formula
Exclusively breastfed
Weaned (not breastfed)
Stunting trendsPercentage of children <5 years old stunted
Underweight trendsPercentage of children <5 years old underweight
Source: DHS, 2007.
Burden of malnutrition (2011)
Stunting country rank 8
Share of world stunting burden (%) 3
Source: MICS, 2010.
Source: MICS, 2010.
Indicator
Gender Residence Wealth quintile
SourceMale Female
Ratio of male to female
Urban RuralRatio of urban to
ruralPoorest Second Middle Fourth Richest
Ratio of richest to poorest
Equity chart
Stunting prevalence (%) 47 40 1.2 34 47 0.7 47 47 48 45 26 0.6 MICS, 2010
Underweight prevalence (%) 27 21 1.3 17 27 0.6 29 28 27 21 12 0.4 MICS, 2010
Wasting prevalence (%) 10 8 1.3 7 9 0.8 10 9 10 6 7 0.7 MICS, 2010
Women with low BMI (<18.5 kg/m2, %) – 19 – 16 21 0.8 23 20 21 15 15 0.7 DHS, 2007
Women with high BMI (≥25 kg/m2, %) – 11 – 18 6 2.9 6 6 7 13 23 3.8 DHS, 2007
Improved facilities Shared facilitiesUnimproved facilities Open defecation
9
61
12
18
24
40
27
9
23
40
32
5
24
42
33
1
4
69
4
23
24
40
23
13
0%
20%
40%
60%
80%
100%
1990 2010Total Urban Rural
1990 2010 1990 2010
0%
20%
40%
60%
80%
100%
2005 2006 2007 2008 2009 2010 2011
87 9179
98838985
1990 1995 2000 2005 2010 2015
181168
61
0
40
80
120
160
200
MDG 4target
0–1 2–3 4–5 6–7 8–9 10–11 12–13 14–15 16–17 18–19 20–21 22–23
Age (months)
0%
20%
40%
60%
80%
100%
0%
20%
40%
60%
80%
100%
Non-pregnant women
Pregnant women
5260
71
Public health problemsevere
moderate
Preschool- aged children
Stunted (under-fives, 000) 5,228
Wasted (under-fives, 000) 1,024
Severely wasted (under-fives, 000) 337
MDG 1 progress Insufficient progress
Underweight (under-fives, 000) 2,915
Overweight (under-fives, 000) –
Total population (000) 67,758 (2011)
Total under-five population (000) 12,046 (2011)
Total number of births (000) 2,912 (2011)
Under-five mortality rate (per 1,000 live births) 168 (2011)
Total number of under-five deaths (000) 465 (2011)
Infant mortality rate (per 1,000 live births) 111 (2011)
Neonatal mortality rate (per 1,000 live births) 47 (2011)
HIV prevalence rate (15–49 years old, %) – –
Population below international poverty line of US$1.25 per day (%)
88 (2006)
GNI per capita (US$) 190 (2011)
Primary school net attendance ratio (% female, % male)
72, 78 (2010)
Iodized salt trends*
Percentage of households with adequately iodized salt1,206,000 newborns are unprotected against iodine deficiency disorders (2011)
Piped on premises Other improvedUnimproved Surface water
14
31
31
24
9
37
36
18
51
10
39
0
21
17
58
4
0
40
27
33
2
47
25
26
0%
20%
40%
60%
80%
100%
1990 2010Total Urban Rural
1990 2010 1990 2010
0%
20%
40%
60%
80%
100%
5144 46 43
1995Other NS
2001MICS
2007DHS
2010MICS
Poorest 20%
RuralUrban
GirlsBoys
Second 20%Middle 20%Fourth 20%
Richest 20%
4740
3447
47
26
4748
45
0% 20% 40% 60% 80% 100%0%
20%
40%
60%
80%
100%
1995Other NS
2001MICS
2007DHS
2010MICS
MDG 1: INSUFFICIENT PROGRESS
31 3428 24
Neonatal 29%
HIV/AIDS 1%
Diarrhoea 12%
Measles 0%
Injuries 3%
Pneumonia 14%Malaria 18%
Others 22%
Meningitis 1%
DemocratIc repuBlIc of the congoDemocratIc repuBlIc of the congo
24 2436 37
1995MICS
2001MICS
2007DHS
2010MICS
0%
20%
40%
60%
80%
100%
To increase child survival, promote child development and prevent stunting, nutrition interventions need to be delivered during pregnancy and the first two years of life.
PREGNANCY BIRTH 0–5 MONTHS 6–23 MONTHS 24–59 MONTHS
Use of iron-folic acid supplements
Early initiation of breastfeeding(within 1 hour of birth)
International Code of Marketing of Breast-milk Substitutes
Maternity protection in accordance with ILO Convention 183
Minimum dietary diversity
Minimum acceptable diet
Full coverage of vitamin A supplementation
Treatment of severe acute malnutrition included in national health plans
Introduction to solid, semi-solid or soft foods (6–8 months)
Continued breastfeeding at 1 year old
Infants not weighed at birthHouseholds with adequately iodized salt
Exclusive breastfeeding(<6 months)
87%
52%
No
Partial
–
–
98%
Yes
37%30%
43%
59%
2%
Maternal mortality ratio, adjusted (per 100,000 live births)
540 (2010)
Maternal mortality ratio, reported(per 100,000 live births)
550 (2007)
Total number of maternal deaths 15,000 (2010)
Lifetime risk of maternal death (1 in : ) 30 (2010)
Women with low BMI (<18.5 kg/m2, %) 19 (2007)
Anaemia, non-pregnant women (<120g/l, %) 52 (2007)
Antenatal care (at least one visit, %) 89 (2010)
Antenatal care (at least four visits, %) 45 (2010)
Skilled attendant at birth (%) 80 (2010)
Low birthweight (<2,500 grams, %) 10 (2010)
Women 20–24 years old who gave birth before age 18 (%)
25 (2010)
0%
20%
40%
60%
80%
100%
1995MICS
1997Other NS
2001MICS
2007DHS
2010MICS
12
90
7279
59
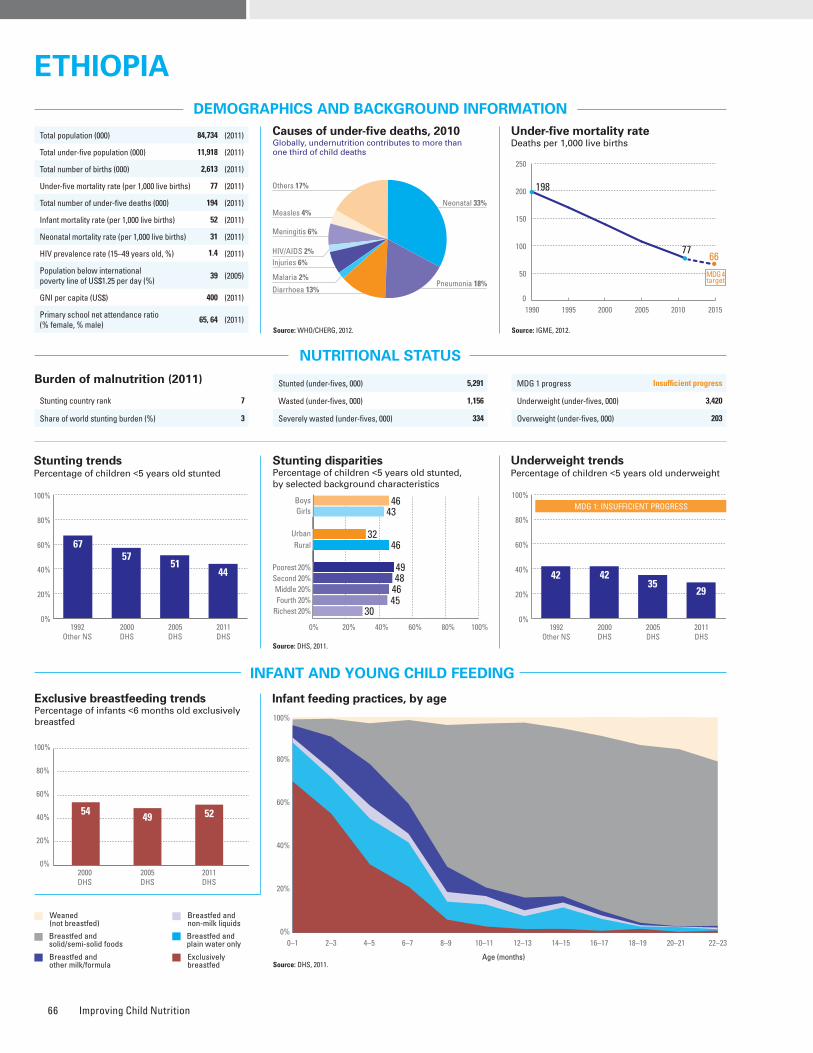
Improving Child Nutrition66
ESSENTIAL NUTRITION PRACTICES AND INTERVENTIONS DURING THE LIFE CYCLE
MICRONUTRIENTS
WATER AND SANITATION
Improved drinking water coveragePercentage of population, by type of drinking water source, 1990–2010
Source: WHO/UNICEF JMP, 2012.
Improved sanitation coveragePercentage of population, by type of sanitation facility, 1990–2010
Source: WHO/UNICEF JMP, 2012.
Vitamin A supplementationPercentage of children 6–59 months old receiving two doses of vitamin A during calendar year (full coverage)
* Estimates may not be comparable. Source: UNICEF, 2012.
MATERNAL NUTRITION AND HEALTH
DISPARITIES IN NUTRITION
Source: DHS, 2011.
Causes of under-five deaths, 2010Globally, undernutrition contributes to more than one third of child deaths
NUTRITIONAL STATUS
Stunting disparitiesPercentage of children <5 years old stunted, by selected background characteristics
DEMOGRAPHICS AND BACKGROUND INFORMATION
INFANT AND YOUNG CHILD FEEDING
Source: WHO/CHERG, 2012.
Under-five mortality rateDeaths per 1,000 live births
Source: IGME, 2012.AnaemiaPrevalence of anaemia among selected populations
Infant feeding practices, by ageExclusive breastfeeding trends Percentage of infants <6 months old exclusively breastfed
Breastfed and non-milk liquids
Breastfed and solid/semi-solid foods
Breastfed and plain water only
Breastfed and other milk/formula
Exclusively breastfed
Weaned (not breastfed)
Stunting trendsPercentage of children <5 years old stunted
Underweight trendsPercentage of children <5 years old underweight
Burden of malnutrition (2011)
Stunting country rank 7
Share of world stunting burden (%) 3
Iodized salt trends*
Percentage of households with adequately iodized salt2,211,000 newborns are unprotected against iodine deficiency disorders (2011)
Improved facilities Shared facilitiesUnimproved facilities Open defecation
31
3
93
21
21
12
46
20
11
27
42
29
22
40
9
00
99
19
226
53
0%
20%
40%
60%
80%
100%
1990 2010Total Urban Rural
1990 2010 1990 20101
Indicator
Gender Residence Wealth quintile
SourceMale Female
Ratio of male to female
Urban RuralRatio of urban to
ruralPoorest Second Middle Fourth Richest
Ratio of richest to poorest
Equity chart
Stunting prevalence (%) 46 43 1.1 32 46 0.7 49 48 46 45 30 0.6 DHS, 2011
Underweight prevalence (%) 31 27 1.1 16 30 0.5 36 33 29 26 15 0.4 DHS, 2011
Wasting prevalence (%) 11 8 1.4 6 10 0.6 12 12 9 8 5 0.4 DHS, 2011
Women with low BMI (<18.5 kg/m2, %) – 27 – 20 29 0.7 32 31 27 29 19 0.6 DHS, 2011
Women with high BMI (≥25 kg/m2, %) – 6 – 15 3 5.7 2 2 2 3 16 8.6 DHS, 2011
2005 2006 2007 2008 2009 2010 2011
59
8086
71848488
0%
20%
40%
60%
80%
100%
0%
20%
40%
60%
80%
100%
Non-pregnant women
Pregnant women
Preschool- aged children
15 22
44
Public health problemsevere
moderate
To increase child survival, promote child development and prevent stunting, nutrition interventions need to be delivered during pregnancy and the first two years of life.
PREGNANCY BIRTH 0–5 MONTHS 6–23 MONTHS 24–59 MONTHS
Use of iron-folic acid supplements
Early initiation of breastfeeding(within 1 hour of birth)
International Code of Marketing of Breast-milk Substitutes
Maternity protection in accordance with ILO Convention 183
Minimum dietary diversity
Minimum acceptable diet
Full coverage of vitamin A supplementation
Treatment of severe acute malnutrition included in national health plans
Introduction to solid, semi-solid or soft foods (6–8 months)
Continued breastfeeding at 1 year old
Infants not weighed at birthHouseholds with adequately iodized salt
Exclusive breastfeeding(<6 months)
96%
55%
No
Partial
5%
4%
71%
Yes
52%97%
52%
15%
0%
Source: DHS, 2011.
Source: DHS, 2011.
0–1 2–3 4–5 6–7 8–9 10–11 12–13 14–15 16–17 18–19 20–21 22–23
Age (months)
0%
20%
40%
60%
80%
100%
54 49 52
2000DHS
2005DHS
2011DHS
0%
20%
40%
60%
80%
100%
Stunted (under-fives, 000) 5,291
Wasted (under-fives, 000) 1,156
Severely wasted (under-fives, 000) 334
MDG 1 progress Insufficient progress
Underweight (under-fives, 000) 3,420
Overweight (under-fives, 000) 203
Total population (000) 84,734 (2011)
Total under-five population (000) 11,918 (2011)
Total number of births (000) 2,613 (2011)
Under-five mortality rate (per 1,000 live births) 77 (2011)
Total number of under-five deaths (000) 194 (2011)
Infant mortality rate (per 1,000 live births) 52 (2011)
Neonatal mortality rate (per 1,000 live births) 31 (2011)
HIV prevalence rate (15–49 years old, %) 1.4 (2011)
Population below international poverty line of US$1.25 per day (%)
39 (2005)
GNI per capita (US$) 400 (2011)
Primary school net attendance ratio (% female, % male)
65, 64 (2011)
Piped on premises Other improvedUnimproved Surface water
1
36
13
50
8
37
36
19
9
11
70
10
46
3
51
0
0
39
5
56
1
43
33
23
0%
20%
40%
60%
80%
100%
1990 2010Total Urban Rural
1990 2010 1990 2010
0%
20%
40%
60%
80%
100%
6757
5144
1992Other NS
2000DHS
2005DHS
2011DHS
0% 20% 40% 60% 80% 100%
Poorest 20%
RuralUrban
GirlsBoys
Second 20%Middle 20%Fourth 20%
Richest 20%
4643
3246
49
30
484645
0%
20%
40%
60%
80%
100%
1992Other NS
2000DHS
2005DHS
2011DHS
MDG 1: INSUFFICIENT PROGRESS
42 4235
29
EthIopIaEthIopIa
Neonatal 33%
HIV/AIDS 2%
Diarrhoea 13%
Measles 4%
Injuries 6%
Pneumonia 18%Malaria 2%
Others 17%
Meningitis 6%
1990 1995 2000 2005 2010 2015
198
7766
0
50
100
150
200
250
MDG 4target
Maternal mortality ratio, adjusted (per 100,000 live births)
350 (2010)
Maternal mortality ratio, reported(per 100,000 live births)
680 (2011)
Total number of maternal deaths 9,000 (2010)
Lifetime risk of maternal death (1 in : ) 67 (2010)
Women with low BMI (<18.5 kg/m2, %) 27 (2011)
Anaemia, non-pregnant women (<120g/l, %) 15 (2011)
Antenatal care (at least one visit, %) 43 (2011)
Antenatal care (at least four visits, %) 19 (2011)
Skilled attendant at birth (%) 10 (2011)
Low birthweight (<2,500 grams, %) 20 (2005)
Women 20–24 years old who gave birth before age 18 (%)
22 (2011)
0%
20%
40%
60%
80%
100%
1995MICS
2000DHS
2005DHS
2011DHS
028
20 15
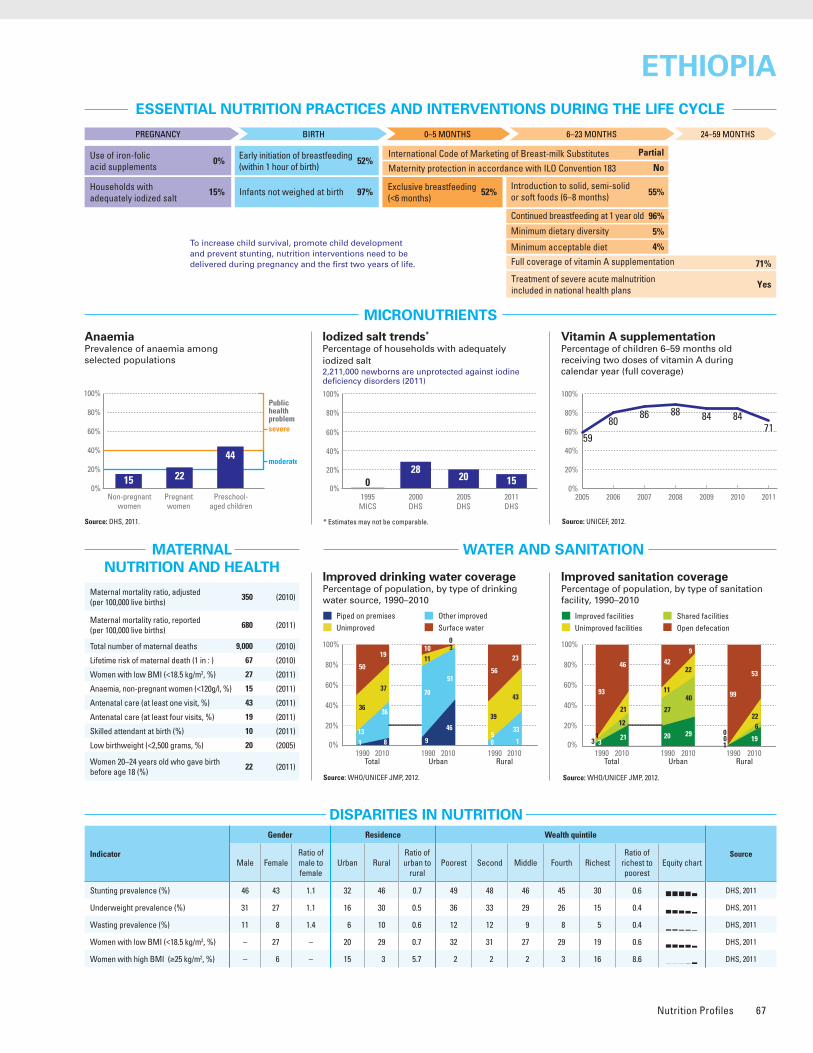
Nutrition Profiles 67
ESSENTIAL NUTRITION PRACTICES AND INTERVENTIONS DURING THE LIFE CYCLE
MICRONUTRIENTS
WATER AND SANITATION
Improved drinking water coveragePercentage of population, by type of drinking water source, 1990–2010
Source: WHO/UNICEF JMP, 2012.
Improved sanitation coveragePercentage of population, by type of sanitation facility, 1990–2010
Source: WHO/UNICEF JMP, 2012.
Vitamin A supplementationPercentage of children 6–59 months old receiving two doses of vitamin A during calendar year (full coverage)
* Estimates may not be comparable. Source: UNICEF, 2012.
MATERNAL NUTRITION AND HEALTH
DISPARITIES IN NUTRITION
Source: DHS, 2011.
Causes of under-five deaths, 2010Globally, undernutrition contributes to more than one third of child deaths
NUTRITIONAL STATUS
Stunting disparitiesPercentage of children <5 years old stunted, by selected background characteristics
DEMOGRAPHICS AND BACKGROUND INFORMATION
INFANT AND YOUNG CHILD FEEDING
Source: WHO/CHERG, 2012.
Under-five mortality rateDeaths per 1,000 live births
Source: IGME, 2012.AnaemiaPrevalence of anaemia among selected populations
Infant feeding practices, by ageExclusive breastfeeding trends Percentage of infants <6 months old exclusively breastfed
Breastfed and non-milk liquids
Breastfed and solid/semi-solid foods
Breastfed and plain water only
Breastfed and other milk/formula
Exclusively breastfed
Weaned (not breastfed)
Stunting trendsPercentage of children <5 years old stunted
Underweight trendsPercentage of children <5 years old underweight
Burden of malnutrition (2011)
Stunting country rank 7
Share of world stunting burden (%) 3
Iodized salt trends*
Percentage of households with adequately iodized salt2,211,000 newborns are unprotected against iodine deficiency disorders (2011)
Improved facilities Shared facilitiesUnimproved facilities Open defecation
31
3
93
21
21
12
46
20
11
27
42
29
22
40
9
00
99
19
226
53
0%
20%
40%
60%
80%
100%
1990 2010Total Urban Rural
1990 2010 1990 20101
Indicator
Gender Residence Wealth quintile
SourceMale Female
Ratio of male to female
Urban RuralRatio of urban to
ruralPoorest Second Middle Fourth Richest
Ratio of richest to poorest
Equity chart
Stunting prevalence (%) 46 43 1.1 32 46 0.7 49 48 46 45 30 0.6 DHS, 2011
Underweight prevalence (%) 31 27 1.1 16 30 0.5 36 33 29 26 15 0.4 DHS, 2011
Wasting prevalence (%) 11 8 1.4 6 10 0.6 12 12 9 8 5 0.4 DHS, 2011
Women with low BMI (<18.5 kg/m2, %) – 27 – 20 29 0.7 32 31 27 29 19 0.6 DHS, 2011
Women with high BMI (≥25 kg/m2, %) – 6 – 15 3 5.7 2 2 2 3 16 8.6 DHS, 2011
2005 2006 2007 2008 2009 2010 2011
59
8086
71848488
0%
20%
40%
60%
80%
100%
0%
20%
40%
60%
80%
100%
Non-pregnant women
Pregnant women
Preschool- aged children
15 22
44
Public health problemsevere
moderate
To increase child survival, promote child development and prevent stunting, nutrition interventions need to be delivered during pregnancy and the first two years of life.
PREGNANCY BIRTH 0–5 MONTHS 6–23 MONTHS 24–59 MONTHS
Use of iron-folic acid supplements
Early initiation of breastfeeding(within 1 hour of birth)
International Code of Marketing of Breast-milk Substitutes
Maternity protection in accordance with ILO Convention 183
Minimum dietary diversity
Minimum acceptable diet
Full coverage of vitamin A supplementation
Treatment of severe acute malnutrition included in national health plans
Introduction to solid, semi-solid or soft foods (6–8 months)
Continued breastfeeding at 1 year old
Infants not weighed at birthHouseholds with adequately iodized salt
Exclusive breastfeeding(<6 months)
96%
55%
No
Partial
5%
4%
71%
Yes
52%97%
52%
15%
0%
Source: DHS, 2011.
Source: DHS, 2011.
0–1 2–3 4–5 6–7 8–9 10–11 12–13 14–15 16–17 18–19 20–21 22–23
Age (months)
0%
20%
40%
60%
80%
100%
54 49 52
2000DHS
2005DHS
2011DHS
0%
20%
40%
60%
80%
100%
Stunted (under-fives, 000) 5,291
Wasted (under-fives, 000) 1,156
Severely wasted (under-fives, 000) 334
MDG 1 progress Insufficient progress
Underweight (under-fives, 000) 3,420
Overweight (under-fives, 000) 203
Total population (000) 84,734 (2011)
Total under-five population (000) 11,918 (2011)
Total number of births (000) 2,613 (2011)
Under-five mortality rate (per 1,000 live births) 77 (2011)
Total number of under-five deaths (000) 194 (2011)
Infant mortality rate (per 1,000 live births) 52 (2011)
Neonatal mortality rate (per 1,000 live births) 31 (2011)
HIV prevalence rate (15–49 years old, %) 1.4 (2011)
Population below international poverty line of US$1.25 per day (%)
39 (2005)
GNI per capita (US$) 400 (2011)
Primary school net attendance ratio (% female, % male)
65, 64 (2011)
Piped on premises Other improvedUnimproved Surface water
1
36
13
50
8
37
36
19
9
11
70
10
46
3
51
0
0
39
5
56
1
43
33
23
0%
20%
40%
60%
80%
100%
1990 2010Total Urban Rural
1990 2010 1990 2010
0%
20%
40%
60%
80%
100%
6757
5144
1992Other NS
2000DHS
2005DHS
2011DHS
0% 20% 40% 60% 80% 100%
Poorest 20%
RuralUrban
GirlsBoys
Second 20%Middle 20%Fourth 20%
Richest 20%
4643
3246
49
30
484645
0%
20%
40%
60%
80%
100%
1992Other NS
2000DHS
2005DHS
2011DHS
MDG 1: INSUFFICIENT PROGRESS
42 4235
29
EthIopIaEthIopIa
Neonatal 33%
HIV/AIDS 2%
Diarrhoea 13%
Measles 4%
Injuries 6%
Pneumonia 18%Malaria 2%
Others 17%
Meningitis 6%
1990 1995 2000 2005 2010 2015
198
7766
0
50
100
150
200
250
MDG 4target
Maternal mortality ratio, adjusted (per 100,000 live births)
350 (2010)
Maternal mortality ratio, reported(per 100,000 live births)
680 (2011)
Total number of maternal deaths 9,000 (2010)
Lifetime risk of maternal death (1 in : ) 67 (2010)
Women with low BMI (<18.5 kg/m2, %) 27 (2011)
Anaemia, non-pregnant women (<120g/l, %) 15 (2011)
Antenatal care (at least one visit, %) 43 (2011)
Antenatal care (at least four visits, %) 19 (2011)
Skilled attendant at birth (%) 10 (2011)
Low birthweight (<2,500 grams, %) 20 (2005)
Women 20–24 years old who gave birth before age 18 (%)
22 (2011)
0%
20%
40%
60%
80%
100%
1995MICS
2000DHS
2005DHS
2011DHS
028
20 15
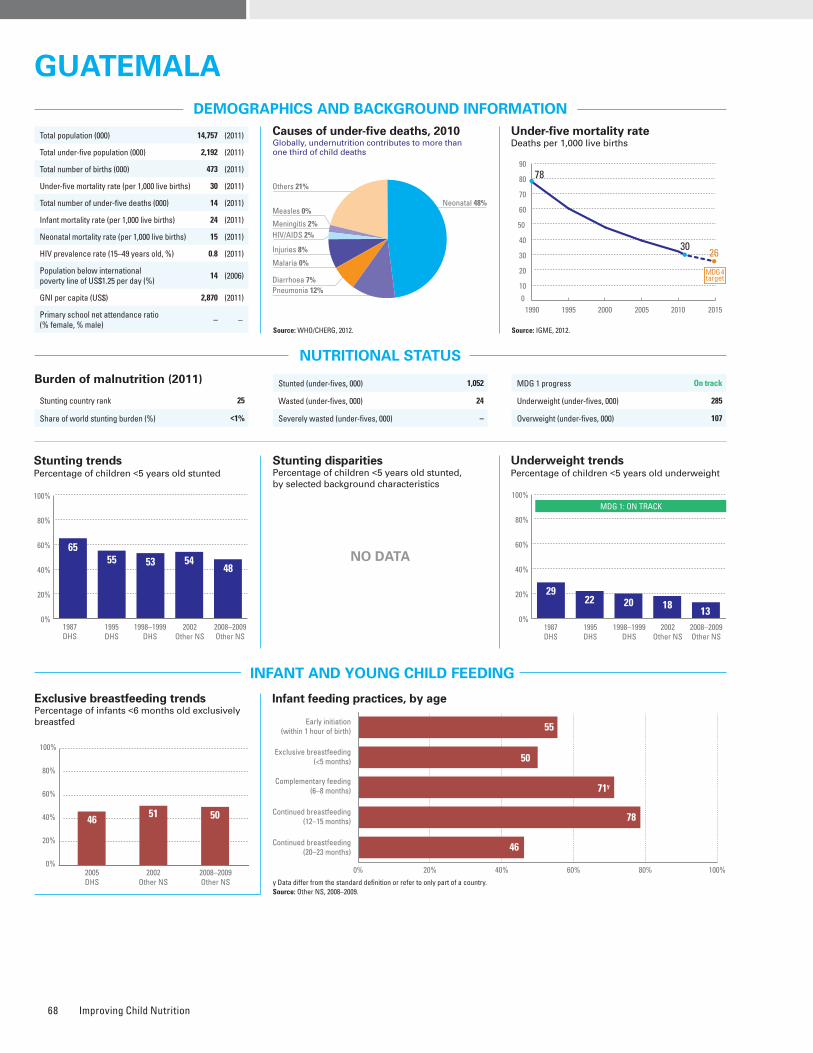
Improving Child Nutrition68
ESSENTIAL NUTRITION PRACTICES AND INTERVENTIONS DURING THE LIFE CYCLE
MICRONUTRIENTS
WATER AND SANITATION
Improved drinking water coveragePercentage of population, by type of drinking water source, 1990–2010
Source: WHO/UNICEF JMP, 2012.
Improved sanitation coveragePercentage of population, by type of sanitation facility, 1990–2010
Source: WHO/UNICEF JMP, 2012.
Vitamin A supplementationPercentage of children 6–59 months old receiving two doses of vitamin A during calendar year (full coverage)
* Estimates may not be comparable. Source: UNICEF, 2012.
MATERNAL NUTRITION AND HEALTH
DISPARITIES IN NUTRITION
Causes of under-five deaths, 2010Globally, undernutrition contributes to more than one third of child deaths
NUTRITIONAL STATUS
Stunting disparitiesPercentage of children <5 years old stunted, by selected background characteristics
DEMOGRAPHICS AND BACKGROUND INFORMATION
INFANT AND YOUNG CHILD FEEDING
Source: WHO/CHERG, 2012.
Under-five mortality rateDeaths per 1,000 live births
Source: IGME, 2012.AnaemiaPrevalence of anaemia among selected populations
Infant feeding practices, by ageExclusive breastfeeding trends Percentage of infants <6 months old exclusively breastfed
Stunting trendsPercentage of children <5 years old stunted
Underweight trendsPercentage of children <5 years old underweight
Burden of malnutrition (2011)
Stunting country rank 25
Share of world stunting burden (%) <1%
2005 2006 2007 2008 2009 2010 2011
3649
29 283643
200%
20%
40%
60%
80%
100%
Improved facilities Shared facilitiesUnimproved facilities Open defecation
62
96
23
78
88
6
81
59
5
87
110
2
48
13
4
35
70
146
10
0%
20%
40%
60%
80%
100%
1990 2010Total Urban Rural
1990 2010 1990 2010
1990 1995 2000 2005 2010 2015
3026
0
10
20
30
40
50
60
70
80
90
MDG 4target
78
Indicator
Gender Residence Wealth quintile
SourceMale Female
Ratio of male to female
Urban RuralRatio of urban to
ruralPoorest Second Middle Fourth Richest
Ratio of richest to poorest
Equity chart
Stunting prevalence (%) – – – – – – – – – – – – Other NS, 2008–2009
Underweight prevalence (%) 14 12 1.1 8 16 0.5 21 14 11 5 3 0.2 Other NS, 2008–2009
Wasting prevalence (%) 1 1 1.0 1 2 0.6 1 1 2 1 1 0.5 Other NS, 2008–2009
Women with low BMI (<18.5 kg/m2, %) – 2 – 2 2 1.2 1 1 1 1 3 2.1 Other NS, 2008–2009
Women with high BMI (≥25 kg/m2, %) – 51 – 58 46 1.3 37 48 55 61 61 1.7 Other NS, 2008–2009
Iodized salt trends*
Percentage of households with adequately iodized salt114,000 newborns are unprotected against iodine deficiency disorders (2011)
To increase child survival, promote child development and prevent stunting, nutrition interventions need to be delivered during pregnancy and the first two years of life.
PREGNANCY BIRTH 0–5 MONTHS 6–23 MONTHS 24–59 MONTHS
Use of iron-folic acid supplements
Early initiation of breastfeeding(within 1 hour of birth)
International Code of Marketing of Breast-milk Substitutes
Maternity protection in accordance with ILO Convention 183
Minimum dietary diversity
Minimum acceptable diet
Full coverage of vitamin A supplementation
Treatment of severe acute malnutrition included in national health plans
Introduction to solid, semi-solid or soft foods (6–8 months)
Continued breastfeeding at 1 year old
Infants not weighed at birthHouseholds with adequately iodized salt
Exclusive breastfeeding(<6 months)
79%
71%
No
Yes
–
–
28%
Yes
50%–
56%
76%
–
46 51 50
2005DHS
2002Other NS
2008–2009Other NS
0%
20%
40%
60%
80%
100%
MDG 1 progress On track
Underweight (under-fives, 000) 285
Overweight (under-fives, 000) 107
Stunted (under-fives, 000) 1,052
Wasted (under-fives, 000) 24
Severely wasted (under-fives, 000) –
Total population (000) 14,757 (2011)
Total under-five population (000) 2,192 (2011)
Total number of births (000) 473 (2011)
Under-five mortality rate (per 1,000 live births) 30 (2011)
Total number of under-five deaths (000) 14 (2011)
Infant mortality rate (per 1,000 live births) 24 (2011)
Neonatal mortality rate (per 1,000 live births) 15 (2011)
HIV prevalence rate (15–49 years old, %) 0.8 (2011)
Population below international poverty line of US$1.25 per day (%)
14 (2006)
GNI per capita (US$) 2,870 (2011)
Primary school net attendance ratio (% female, % male)
– –
Piped on premises Other improvedUnimproved Surface water
48
7
33
12
82
510
3
68
7
23
2
96
20
34
7
40
19
69
7
18
6
0%
20%
40%
60%
80%
100% 2
1990 2010Total Urban Rural
1990 2010 1990 2010
2
0%
20%
40%
60%
80%
100%
1995DHS
1998–1999DHS
2002Other NS
2008–2009Other NS
1987DHS
55 53 5448
65
0%
20%
40%
60%
80%
100%
52
1995DHS
1998–1999DHS
2002Other NS
2008–2009Other NS
MDG 1: ON TRACK
22 20 18 131987DHS
29
Neonatal 48%
HIV/AIDS 2%
Diarrhoea 7%
Measles 0%
Injuries 8%
Pneumonia 12%
Malaria 0%
Others 21%
Meningitis 2%
GuatemalaGuatemala
NO Data
Maternal mortality ratio, adjusted (per 100,000 live births)
120 (2010)
Maternal mortality ratio, reported(per 100,000 live births)
140 (2007)
Total number of maternal deaths 550 (2010)
Lifetime risk of maternal death (1 in : ) 190 (2010)
Women with low BMI (<18.5 kg/m2, %) 2 (2008–2009)
Anaemia, non-pregnant women (<120g/l, %) 21 (2008–2009)
Antenatal care (at least one visit, %) 93 (2009)
Antenatal care (at least four visits, %) – –
Skilled attendant at birth (%) 52 (2009)
Low birthweight (<2,500 grams, %) 11 (2008–2009)
Women 20–24 years old who gave birth before age 18 (%)
22 (2009)
0%
20%
40%
60%
80%
100%
1997Other NS
1998–1999DHS
2002Other NS
2007Other NS
6449
40
76
Early initiation (within 1 hour of birth)
Exclusive breastfeeding (<5 months)
Complementary feeding (6–8 months)
Continued breastfeeding (12–15 months)
Continued breastfeeding (20–23 months)
0% 20% 40% 60% 80% 100%
55
50
78
71y
46
y Data differ from the standard definition or refer to only part of a country.Source: Other NS, 2008–2009.
0%
20%
40%
60%
80%
100%
Non-pregnant women
Pregnant women
Preschool- aged children
2129
48
Public health problemsevere
moderate
Source: Other NS, 2008–2009.
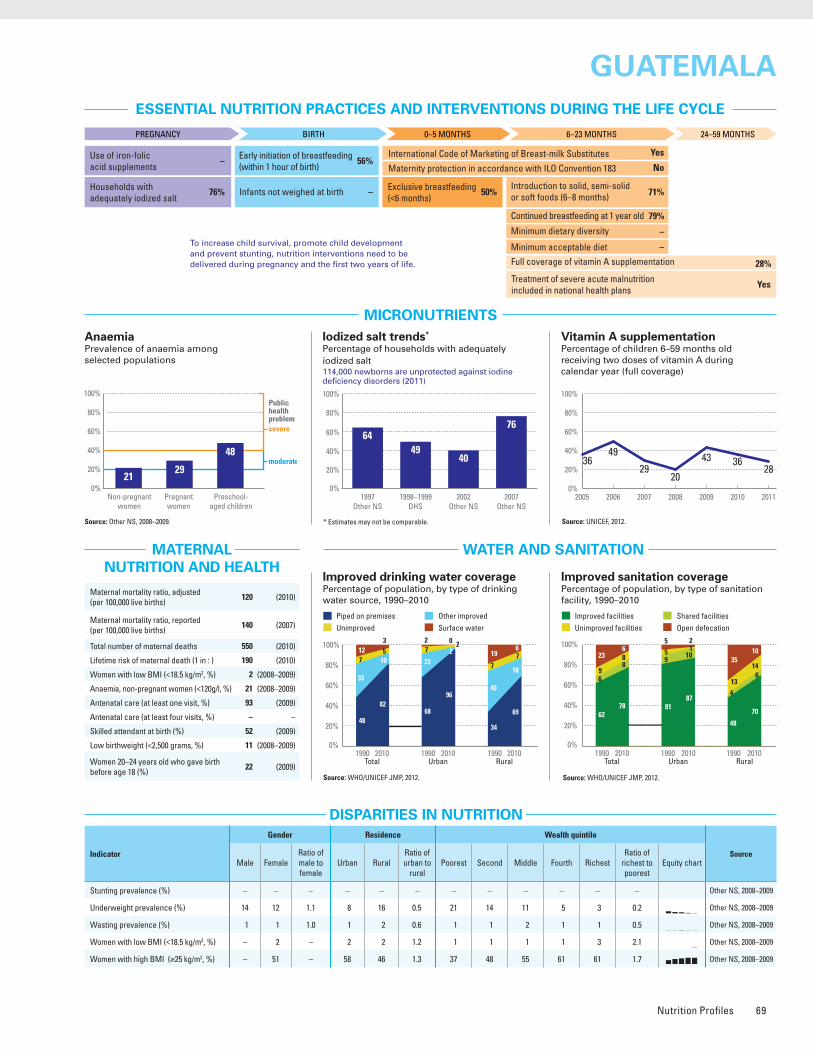
Nutrition Profiles 69
ESSENTIAL NUTRITION PRACTICES AND INTERVENTIONS DURING THE LIFE CYCLE
MICRONUTRIENTS
WATER AND SANITATION
Improved drinking water coveragePercentage of population, by type of drinking water source, 1990–2010
Source: WHO/UNICEF JMP, 2012.
Improved sanitation coveragePercentage of population, by type of sanitation facility, 1990–2010
Source: WHO/UNICEF JMP, 2012.
Vitamin A supplementationPercentage of children 6–59 months old receiving two doses of vitamin A during calendar year (full coverage)
* Estimates may not be comparable. Source: UNICEF, 2012.
MATERNAL NUTRITION AND HEALTH
DISPARITIES IN NUTRITION
Causes of under-five deaths, 2010Globally, undernutrition contributes to more than one third of child deaths
NUTRITIONAL STATUS
Stunting disparitiesPercentage of children <5 years old stunted, by selected background characteristics
DEMOGRAPHICS AND BACKGROUND INFORMATION
INFANT AND YOUNG CHILD FEEDING
Source: WHO/CHERG, 2012.
Under-five mortality rateDeaths per 1,000 live births
Source: IGME, 2012.AnaemiaPrevalence of anaemia among selected populations
Infant feeding practices, by ageExclusive breastfeeding trends Percentage of infants <6 months old exclusively breastfed
Stunting trendsPercentage of children <5 years old stunted
Underweight trendsPercentage of children <5 years old underweight
Burden of malnutrition (2011)
Stunting country rank 25
Share of world stunting burden (%) <1%
2005 2006 2007 2008 2009 2010 2011
3649
29 283643
200%
20%
40%
60%
80%
100%
Improved facilities Shared facilitiesUnimproved facilities Open defecation
62
96
23
78
88
6
81
59
5
87
110
2
48
13
4
35
70
146
10
0%
20%
40%
60%
80%
100%
1990 2010Total Urban Rural
1990 2010 1990 2010
1990 1995 2000 2005 2010 2015
3026
0
10
20
30
40
50
60
70
80
90
MDG 4target
78
Indicator
Gender Residence Wealth quintile
SourceMale Female
Ratio of male to female
Urban RuralRatio of urban to
ruralPoorest Second Middle Fourth Richest
Ratio of richest to poorest
Equity chart
Stunting prevalence (%) – – – – – – – – – – – – Other NS, 2008–2009
Underweight prevalence (%) 14 12 1.1 8 16 0.5 21 14 11 5 3 0.2 Other NS, 2008–2009
Wasting prevalence (%) 1 1 1.0 1 2 0.6 1 1 2 1 1 0.5 Other NS, 2008–2009
Women with low BMI (<18.5 kg/m2, %) – 2 – 2 2 1.2 1 1 1 1 3 2.1 Other NS, 2008–2009
Women with high BMI (≥25 kg/m2, %) – 51 – 58 46 1.3 37 48 55 61 61 1.7 Other NS, 2008–2009
Iodized salt trends*
Percentage of households with adequately iodized salt114,000 newborns are unprotected against iodine deficiency disorders (2011)
To increase child survival, promote child development and prevent stunting, nutrition interventions need to be delivered during pregnancy and the first two years of life.
PREGNANCY BIRTH 0–5 MONTHS 6–23 MONTHS 24–59 MONTHS
Use of iron-folic acid supplements
Early initiation of breastfeeding(within 1 hour of birth)
International Code of Marketing of Breast-milk Substitutes
Maternity protection in accordance with ILO Convention 183
Minimum dietary diversity
Minimum acceptable diet
Full coverage of vitamin A supplementation
Treatment of severe acute malnutrition included in national health plans
Introduction to solid, semi-solid or soft foods (6–8 months)
Continued breastfeeding at 1 year old
Infants not weighed at birthHouseholds with adequately iodized salt
Exclusive breastfeeding(<6 months)
79%
71%
No
Yes
–
–
28%
Yes
50%–
56%
76%
–
46 51 50
2005DHS
2002Other NS
2008–2009Other NS
0%
20%
40%
60%
80%
100%
MDG 1 progress On track
Underweight (under-fives, 000) 285
Overweight (under-fives, 000) 107
Stunted (under-fives, 000) 1,052
Wasted (under-fives, 000) 24
Severely wasted (under-fives, 000) –
Total population (000) 14,757 (2011)
Total under-five population (000) 2,192 (2011)
Total number of births (000) 473 (2011)
Under-five mortality rate (per 1,000 live births) 30 (2011)
Total number of under-five deaths (000) 14 (2011)
Infant mortality rate (per 1,000 live births) 24 (2011)
Neonatal mortality rate (per 1,000 live births) 15 (2011)
HIV prevalence rate (15–49 years old, %) 0.8 (2011)
Population below international poverty line of US$1.25 per day (%)
14 (2006)
GNI per capita (US$) 2,870 (2011)
Primary school net attendance ratio (% female, % male)
– –
Piped on premises Other improvedUnimproved Surface water
48
7
33
12
82
510
3
68
7
23
2
96
20
34
7
40
19
69
7
18
6
0%
20%
40%
60%
80%
100% 2
1990 2010Total Urban Rural
1990 2010 1990 2010
2
0%
20%
40%
60%
80%
100%
1995DHS
1998–1999DHS
2002Other NS
2008–2009Other NS
1987DHS
55 53 5448
65
0%
20%
40%
60%
80%
100%
52
1995DHS
1998–1999DHS
2002Other NS
2008–2009Other NS
MDG 1: ON TRACK
22 20 18 131987DHS
29
Neonatal 48%
HIV/AIDS 2%
Diarrhoea 7%
Measles 0%
Injuries 8%
Pneumonia 12%
Malaria 0%
Others 21%
Meningitis 2%
GuatemalaGuatemala
NO Data
Maternal mortality ratio, adjusted (per 100,000 live births)
120 (2010)
Maternal mortality ratio, reported(per 100,000 live births)
140 (2007)
Total number of maternal deaths 550 (2010)
Lifetime risk of maternal death (1 in : ) 190 (2010)
Women with low BMI (<18.5 kg/m2, %) 2 (2008–2009)
Anaemia, non-pregnant women (<120g/l, %) 21 (2008–2009)
Antenatal care (at least one visit, %) 93 (2009)
Antenatal care (at least four visits, %) – –
Skilled attendant at birth (%) 52 (2009)
Low birthweight (<2,500 grams, %) 11 (2008–2009)
Women 20–24 years old who gave birth before age 18 (%)
22 (2009)
0%
20%
40%
60%
80%
100%
1997Other NS
1998–1999DHS
2002Other NS
2007Other NS
6449
40
76
Early initiation (within 1 hour of birth)
Exclusive breastfeeding (<5 months)
Complementary feeding (6–8 months)
Continued breastfeeding (12–15 months)
Continued breastfeeding (20–23 months)
0% 20% 40% 60% 80% 100%
55
50
78
71y
46
y Data differ from the standard definition or refer to only part of a country.Source: Other NS, 2008–2009.
0%
20%
40%
60%
80%
100%
Non-pregnant women
Pregnant women
Preschool- aged children
2129
48
Public health problemsevere
moderate
Source: Other NS, 2008–2009.
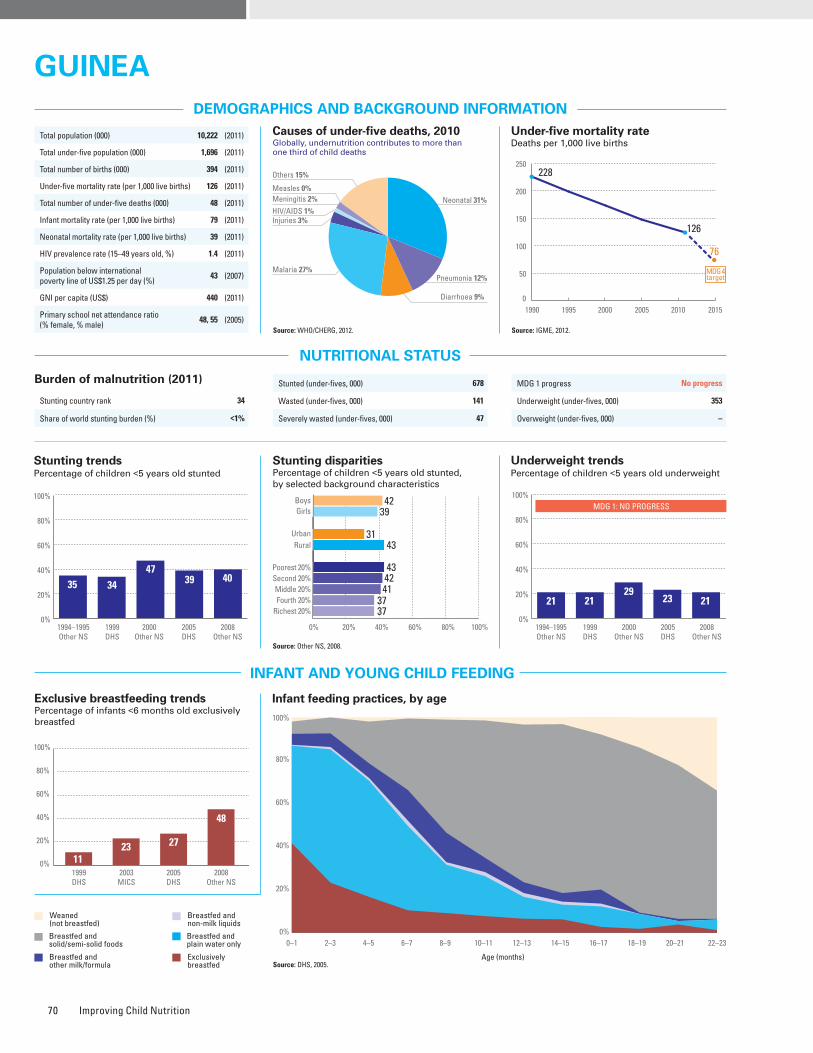
Improving Child Nutrition70
ESSENTIAL NUTRITION PRACTICES AND INTERVENTIONS DURING THE LIFE CYCLE
MICRONUTRIENTS
WATER AND SANITATION
Improved drinking water coveragePercentage of population, by type of drinking water source, 1990–2010
Source: WHO/UNICEF JMP, 2012.
Improved sanitation coveragePercentage of population, by type of sanitation facility, 1990–2010
Source: WHO/UNICEF JMP, 2012.
Vitamin A supplementationPercentage of children 6–59 months old receiving two doses of vitamin A during calendar year (full coverage)
* Estimates may not be comparable. Source: UNICEF, 2012.
MATERNAL NUTRITION AND HEALTH
DISPARITIES IN NUTRITION
Causes of under-five deaths, 2010Globally, undernutrition contributes to more than one third of child deaths
NUTRITIONAL STATUS
Stunting disparitiesPercentage of children <5 years old stunted, by selected background characteristics
DEMOGRAPHICS AND BACKGROUND INFORMATION
INFANT AND YOUNG CHILD FEEDING
Source: WHO/CHERG, 2012.
Under-five mortality rateDeaths per 1,000 live births
Source: IGME, 2012.AnaemiaPrevalence of anaemia among selected populations
Infant feeding practices, by ageExclusive breastfeeding trends Percentage of infants <6 months old exclusively breastfed
Breastfed and non-milk liquids
Breastfed and solid/semi-solid foods
Breastfed and plain water only
Breastfed and other milk/formula
Exclusively breastfed
Weaned (not breastfed)
Stunting trendsPercentage of children <5 years old stunted
Underweight trendsPercentage of children <5 years old underweight
Burden of malnutrition (2011)
Stunting country rank 34
Share of world stunting burden (%) <1%
Iodized salt trends*
Percentage of households with adequately iodized salt232,000 newborns are unprotected against iodine deficiency disorders (2011)
Source: Other NS, 2008.
2005 2006 2007 2008 2009 2010 2011
100 93 94 889794
0%
20%
40%
60%
80%
100%
Source: DHS, 2005.
Indicator
Gender Residence Wealth quintile
SourceMale Female
Ratio of male to female
Urban RuralRatio of urban to
ruralPoorest Second Middle Fourth Richest
Ratio of richest to poorest
Equity chart
Stunting prevalence (%) 42 39 1.1 31 43 0.7 43 42 41 37 37 0.9 Other NS, 2008
Underweight prevalence (%) 22 20 1.1 15 23 0.7 24 22 21 19 19 0.8 Other NS, 2008
Wasting prevalence (%) 9 8 1.1 8 9 0.9 – – – – – – Other NS, 2008
Women with low BMI (<18.5 kg/m2, %) – – – – – – – – – – – – –
Women with high BMI (≥25 kg/m2, %) – – – – – – – – – – – – –
Improved facilities Shared facilitiesUnimproved facilities Open defecation
10
40
9
41
18
44
18
20
19
52
23
6
32
27
40
1
6
35
4
55
11
53
6
30
0%
20%
40%
60%
80%
100%
1990 2010Total Urban Rural
1990 2010 1990 2010
To increase child survival, promote child development and prevent stunting, nutrition interventions need to be delivered during pregnancy and the first two years of life.
PREGNANCY BIRTH 0–5 MONTHS 6–23 MONTHS 24–59 MONTHS
Use of iron-folic acid supplements
Early initiation of breastfeeding(within 1 hour of birth)
International Code of Marketing of Breast-milk Substitutes
Maternity protection in accordance with ILO Convention 183
Minimum dietary diversity
Minimum acceptable diet
Full coverage of vitamin A supplementation
Treatment of severe acute malnutrition included in national health plans
Introduction to solid, semi-solid or soft foods (6–8 months)
Continued breastfeeding at 1 year old
Infants not weighed at birthHouseholds with adequately iodized salt
Exclusive breastfeeding(<6 months)
100%
32%
Partial
Partial
16%
7%
88%
–
48%59%
40%
41%
33%
1123 27
48
1999DHS
2003MICS
2005DHS
2008Other NS
0%
20%
40%
60%
80%
100%
0–1 2–3 4–5 6–7 8–9 10–11 12–13 14–15 16–17 18–19 20–21 22–23
Age (months)
0%
20%
40%
60%
80%
100%
MDG 1 progress No progress
Underweight (under-fives, 000) 353
Overweight (under-fives, 000) –
Stunted (under-fives, 000) 678
Wasted (under-fives, 000) 141
Severely wasted (under-fives, 000) 47
Total population (000) 10,222 (2011)
Total under-five population (000) 1,696 (2011)
Total number of births (000) 394 (2011)
Under-five mortality rate (per 1,000 live births) 126 (2011)
Total number of under-five deaths (000) 48 (2011)
Infant mortality rate (per 1,000 live births) 79 (2011)
Neonatal mortality rate (per 1,000 live births) 39 (2011)
HIV prevalence rate (15–49 years old, %) 1.4 (2011)
Population below international poverty line of US$1.25 per day (%)
43 (2007)
GNI per capita (US$) 440 (2011)
Primary school net attendance ratio (% female, % male)
48, 55 (2005)
Piped on premises Other improvedUnimproved Surface water
6
8
45
41
11
17
63
9
21
5
66
8
29
10
61
0
0
9
37
54
1
21
64
14
0%
20%
40%
60%
80%
100%
1990 2010Total Urban Rural
1990 2010 1990 2010
0%
20%
40%
60%
80%
100%
35 34
4739 40
1994–1995Other NS
1999DHS
2000Other NS
2005DHS
2008Other NS
Poorest 20%
RuralUrban
GirlsBoys
Second 20%Middle 20%Fourth 20%
Richest 20%
4239
3143
43
37
4241
37
0% 20% 40% 60% 80% 100%0%
20%
40%
60%
80%
100%
52
1994–1995Other NS
1999DHS
2000Other NS
2005DHS
2008Other NS
21 2129
23 21
MDG 1: NO PROGRESS
Neonatal 31%HIV/AIDS 1%
Diarrhoea 9%
Measles 0%
Injuries 3%
Pneumonia 12%Malaria 27%
Others 15%
Meningitis 2%
GuIneaGuInea
1990 1995 2000 2005 2010 2015
228
126
76
0
50
100
150
200
250
MDG 4target
Maternal mortality ratio, adjusted (per 100,000 live births)
610 (2010)
Maternal mortality ratio, reported(per 100,000 live births)
980 (2005)
Total number of maternal deaths 2,400 (2010)
Lifetime risk of maternal death (1 in : ) 30 (2010)
Women with low BMI (<18.5 kg/m2, %) – –
Anaemia, non-pregnant women (<120g/l, %) 50 (2005)
Antenatal care (at least one visit, %) 88 (2007)
Antenatal care (at least four visits, %) 50 (2007)
Skilled attendant at birth (%) 46 (2007)
Low birthweight (<2,500 grams, %) 12 (2005)
Women 20–24 years old who gave birth before age 18 (%)
44 (2005)
0%
20%
40%
60%
80%
100%
1999DHS
2003Other NS
2005DHS
2008Other NS
12
68
5141
0%
20%
40%
60%
80%
100%
Non-pregnant women
Pregnant women
Preschool- aged children
50
69 76
Public health problemsevere
moderate
Source: DHS, 2005.
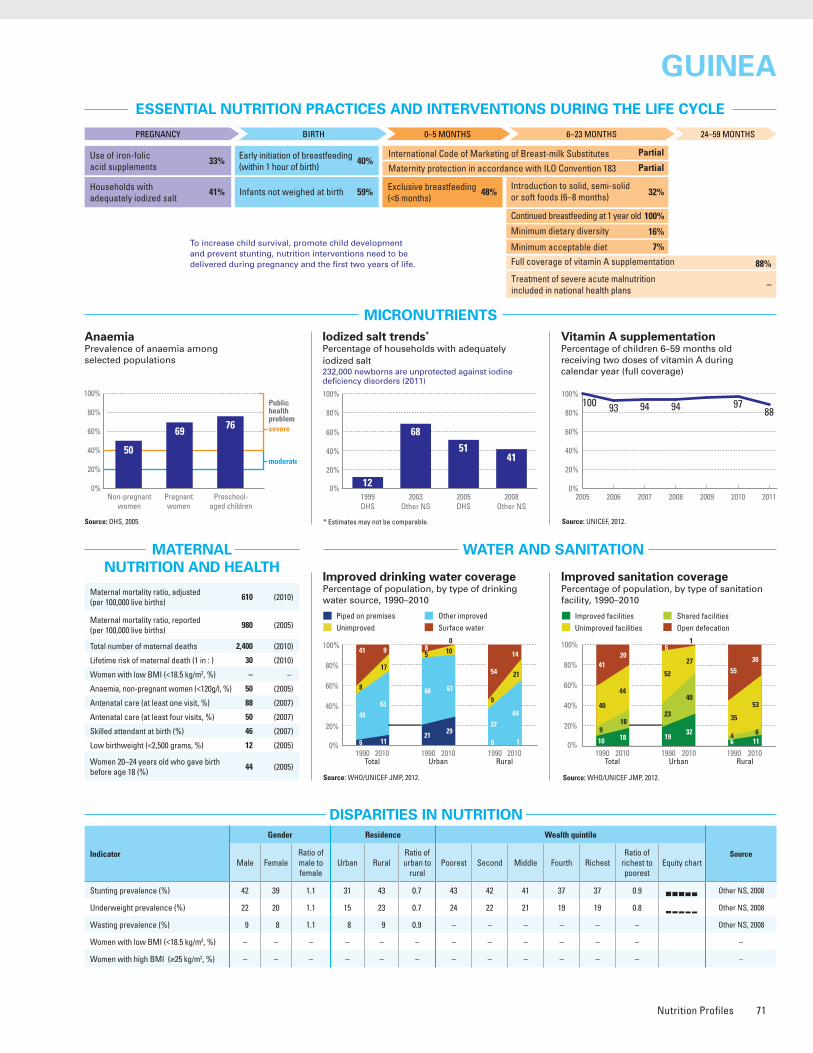
Nutrition Profiles 71
ESSENTIAL NUTRITION PRACTICES AND INTERVENTIONS DURING THE LIFE CYCLE
MICRONUTRIENTS
WATER AND SANITATION
Improved drinking water coveragePercentage of population, by type of drinking water source, 1990–2010
Source: WHO/UNICEF JMP, 2012.
Improved sanitation coveragePercentage of population, by type of sanitation facility, 1990–2010
Source: WHO/UNICEF JMP, 2012.
Vitamin A supplementationPercentage of children 6–59 months old receiving two doses of vitamin A during calendar year (full coverage)
* Estimates may not be comparable. Source: UNICEF, 2012.
MATERNAL NUTRITION AND HEALTH
DISPARITIES IN NUTRITION
Causes of under-five deaths, 2010Globally, undernutrition contributes to more than one third of child deaths
NUTRITIONAL STATUS
Stunting disparitiesPercentage of children <5 years old stunted, by selected background characteristics
DEMOGRAPHICS AND BACKGROUND INFORMATION
INFANT AND YOUNG CHILD FEEDING
Source: WHO/CHERG, 2012.
Under-five mortality rateDeaths per 1,000 live births
Source: IGME, 2012.AnaemiaPrevalence of anaemia among selected populations
Infant feeding practices, by ageExclusive breastfeeding trends Percentage of infants <6 months old exclusively breastfed
Breastfed and non-milk liquids
Breastfed and solid/semi-solid foods
Breastfed and plain water only
Breastfed and other milk/formula
Exclusively breastfed
Weaned (not breastfed)
Stunting trendsPercentage of children <5 years old stunted
Underweight trendsPercentage of children <5 years old underweight
Burden of malnutrition (2011)
Stunting country rank 34
Share of world stunting burden (%) <1%
Iodized salt trends*
Percentage of households with adequately iodized salt232,000 newborns are unprotected against iodine deficiency disorders (2011)
Source: Other NS, 2008.
2005 2006 2007 2008 2009 2010 2011
100 93 94 889794
0%
20%
40%
60%
80%
100%
Source: DHS, 2005.
Indicator
Gender Residence Wealth quintile
SourceMale Female
Ratio of male to female
Urban RuralRatio of urban to
ruralPoorest Second Middle Fourth Richest
Ratio of richest to poorest
Equity chart
Stunting prevalence (%) 42 39 1.1 31 43 0.7 43 42 41 37 37 0.9 Other NS, 2008
Underweight prevalence (%) 22 20 1.1 15 23 0.7 24 22 21 19 19 0.8 Other NS, 2008
Wasting prevalence (%) 9 8 1.1 8 9 0.9 – – – – – – Other NS, 2008
Women with low BMI (<18.5 kg/m2, %) – – – – – – – – – – – – –
Women with high BMI (≥25 kg/m2, %) – – – – – – – – – – – – –
Improved facilities Shared facilitiesUnimproved facilities Open defecation
10
40
9
41
18
44
18
20
19
52
23
6
32
27
40
1
6
35
4
55
11
53
6
30
0%
20%
40%
60%
80%
100%
1990 2010Total Urban Rural
1990 2010 1990 2010
To increase child survival, promote child development and prevent stunting, nutrition interventions need to be delivered during pregnancy and the first two years of life.
PREGNANCY BIRTH 0–5 MONTHS 6–23 MONTHS 24–59 MONTHS
Use of iron-folic acid supplements
Early initiation of breastfeeding(within 1 hour of birth)
International Code of Marketing of Breast-milk Substitutes
Maternity protection in accordance with ILO Convention 183
Minimum dietary diversity
Minimum acceptable diet
Full coverage of vitamin A supplementation
Treatment of severe acute malnutrition included in national health plans
Introduction to solid, semi-solid or soft foods (6–8 months)
Continued breastfeeding at 1 year old
Infants not weighed at birthHouseholds with adequately iodized salt
Exclusive breastfeeding(<6 months)
100%
32%
Partial
Partial
16%
7%
88%
–
48%59%
40%
41%
33%
1123 27
48
1999DHS
2003MICS
2005DHS
2008Other NS
0%
20%
40%
60%
80%
100%
0–1 2–3 4–5 6–7 8–9 10–11 12–13 14–15 16–17 18–19 20–21 22–23
Age (months)
0%
20%
40%
60%
80%
100%
MDG 1 progress No progress
Underweight (under-fives, 000) 353
Overweight (under-fives, 000) –
Stunted (under-fives, 000) 678
Wasted (under-fives, 000) 141
Severely wasted (under-fives, 000) 47
Total population (000) 10,222 (2011)
Total under-five population (000) 1,696 (2011)
Total number of births (000) 394 (2011)
Under-five mortality rate (per 1,000 live births) 126 (2011)
Total number of under-five deaths (000) 48 (2011)
Infant mortality rate (per 1,000 live births) 79 (2011)
Neonatal mortality rate (per 1,000 live births) 39 (2011)
HIV prevalence rate (15–49 years old, %) 1.4 (2011)
Population below international poverty line of US$1.25 per day (%)
43 (2007)
GNI per capita (US$) 440 (2011)
Primary school net attendance ratio (% female, % male)
48, 55 (2005)
Piped on premises Other improvedUnimproved Surface water
6
8
45
41
11
17
63
9
21
5
66
8
29
10
61
0
0
9
37
54
1
21
64
14
0%
20%
40%
60%
80%
100%
1990 2010Total Urban Rural
1990 2010 1990 2010
0%
20%
40%
60%
80%
100%
35 34
4739 40
1994–1995Other NS
1999DHS
2000Other NS
2005DHS
2008Other NS
Poorest 20%
RuralUrban
GirlsBoys
Second 20%Middle 20%Fourth 20%
Richest 20%
4239
3143
43
37
4241
37
0% 20% 40% 60% 80% 100%0%
20%
40%
60%
80%
100%
52
1994–1995Other NS
1999DHS
2000Other NS
2005DHS
2008Other NS
21 2129
23 21
MDG 1: NO PROGRESS
Neonatal 31%HIV/AIDS 1%
Diarrhoea 9%
Measles 0%
Injuries 3%
Pneumonia 12%Malaria 27%
Others 15%
Meningitis 2%
GuIneaGuInea
1990 1995 2000 2005 2010 2015
228
126
76
0
50
100
150
200
250
MDG 4target
Maternal mortality ratio, adjusted (per 100,000 live births)
610 (2010)
Maternal mortality ratio, reported(per 100,000 live births)
980 (2005)
Total number of maternal deaths 2,400 (2010)
Lifetime risk of maternal death (1 in : ) 30 (2010)
Women with low BMI (<18.5 kg/m2, %) – –
Anaemia, non-pregnant women (<120g/l, %) 50 (2005)
Antenatal care (at least one visit, %) 88 (2007)
Antenatal care (at least four visits, %) 50 (2007)
Skilled attendant at birth (%) 46 (2007)
Low birthweight (<2,500 grams, %) 12 (2005)
Women 20–24 years old who gave birth before age 18 (%)
44 (2005)
0%
20%
40%
60%
80%
100%
1999DHS
2003Other NS
2005DHS
2008Other NS
12
68
5141
0%
20%
40%
60%
80%
100%
Non-pregnant women
Pregnant women
Preschool- aged children
50
69 76
Public health problemsevere
moderate
Source: DHS, 2005.
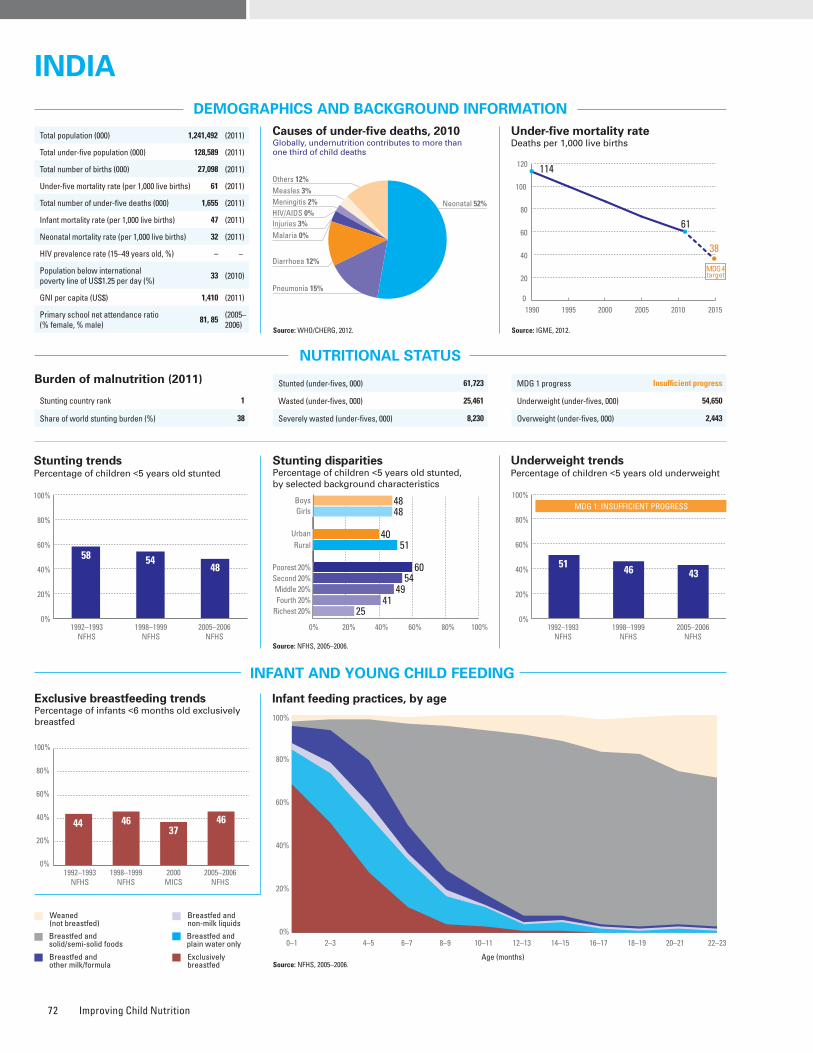
Improving Child Nutrition72
ESSENTIAL NUTRITION PRACTICES AND INTERVENTIONS DURING THE LIFE CYCLE
MICRONUTRIENTS
WATER AND SANITATION
Improved drinking water coveragePercentage of population, by type of drinking water source, 1990–2010
Source: WHO/UNICEF JMP, 2012.
Improved sanitation coveragePercentage of population, by type of sanitation facility, 1990–2010
Source: WHO/UNICEF JMP, 2012.
Vitamin A supplementationPercentage of children 6–59 months old receiving two doses of vitamin A during calendar year (full coverage)
* Estimates may not be comparable. Source: UNICEF, 2012.
MATERNAL NUTRITION AND HEALTH
DISPARITIES IN NUTRITION
Causes of under-five deaths, 2010Globally, undernutrition contributes to more than one third of child deaths
NUTRITIONAL STATUS
Stunting disparitiesPercentage of children <5 years old stunted, by selected background characteristics
DEMOGRAPHICS AND BACKGROUND INFORMATION
INFANT AND YOUNG CHILD FEEDING
Source: WHO/CHERG, 2012.
Under-five mortality rateDeaths per 1,000 live births
Source: IGME, 2012.AnaemiaPrevalence of anaemia among selected populations
Infant feeding practices, by ageExclusive breastfeeding trends Percentage of infants <6 months old exclusively breastfed
Breastfed and non-milk liquids
Breastfed and solid/semi-solid foods
Breastfed and plain water only
Breastfed and other milk/formula
Exclusively breastfed
Weaned (not breastfed)
Stunting trendsPercentage of children <5 years old stunted
Underweight trendsPercentage of children <5 years old underweight
Burden of malnutrition (2011)
Stunting country rank 1
Share of world stunting burden (%) 38
Source: NFHS, 2005–2006.
2005 2006 2007 2008 2009 2010 2011
6445
33
66
34
6653
0%
20%
40%
60%
80%
100%
Indicator
Gender Residence Wealth quintile
SourceMale Female
Ratio of male to female
Urban RuralRatio of urban to
ruralPoorest Second Middle Fourth Richest
Ratio of richest to poorest
Equity chart
Stunting prevalence (%) 48 48 1.0 40 51 0.8 60 54 49 41 25 0.4 NFHS, 2005–2006
Underweight prevalence (%) 42 43 1.0 33 46 0.7 57 49 41 34 20 0.3 NFHS, 2005–2006
Wasting prevalence (%) 21 19 1.1 17 21 0.8 25 22 19 17 13 0.5 NFHS, 2005–2006
Women with low BMI (<18.5 kg/m2, %) – 36 – 25 41 0.6 52 46 38 29 18 0.4 NFHS, 2005–2006
Women with high BMI (≥25 kg/m2, %) – 13 – 24 7 3.2 2 4 7 15 31 16.9 NFHS, 2005–2006
Improved facilities Shared facilitiesUnimproved facilities Open defecation
18
25
75
34
69
51
51
4
17
28
58
9
19
14
711
91
23
64
67
0%
20%
40%
60%
80%
100%
1990 2010Total Urban Rural
1990 2010 1990 2010
Iodized salt trends*
Percentage of households with adequately iodized salt7,831,000 newborns are unprotected against iodine deficiency disorders (2011)
Source: NFHS, 2005–2006.
To increase child survival, promote child development and prevent stunting, nutrition interventions need to be delivered during pregnancy and the first two years of life.
PREGNANCY BIRTH 0–5 MONTHS 6–23 MONTHS 24–59 MONTHS
Use of iron-folic acid supplements
Early initiation of breastfeeding(within 1 hour of birth)
International Code of Marketing of Breast-milk Substitutes
Maternity protection in accordance with ILO Convention 183
Minimum dietary diversity
Minimum acceptable diet
Full coverage of vitamin A supplementation
Treatment of severe acute malnutrition included in national health plans
Introduction to solid, semi-solid or soft foods (6–8 months)
Continued breastfeeding at 1 year old
Infants not weighed at birthHouseholds with adequately iodized salt
Exclusive breastfeeding(<6 months)
88%
56%
No
Yes
–
–
66%
–
46%66%
41%
71%
–
Source: NFHS, 2005–2006.
0–1 2–3 4–5 6–7 8–9 10–11 12–13 14–15 16–17 18–19 20–21 22–23
Age (months)
0%
20%
40%
60%
80%
100%
44 4637
46
1992–1993NFHS
1998–1999NFHS
2000MICS
2005–2006NFHS
0%
20%
40%
60%
80%
100%
MDG 1 progress Insufficient progress
Underweight (under-fives, 000) 54,650
Overweight (under-fives, 000) 2,443
Stunted (under-fives, 000) 61,723
Wasted (under-fives, 000) 25,461
Severely wasted (under-fives, 000) 8,230
1990 1995 2000 2005 2010 2015
114
61
38
0
20
40
60
80
100
120
MDG 4target
Total population (000) (2011)
Total under-five population (000) 128,589 (2011)
Total number of births (000) 27,098 (2011)
Under-five mortality rate (per 1,000 live births) 61 (2011)
Total number of under-five deaths (000) 1,655 (2011)
Infant mortality rate (per 1,000 live births) 47 (2011)
Neonatal mortality rate (per 1,000 live births) 32 (2011)
HIV prevalence rate (15–49 years old, %) – –
Population below international poverty line of US$1.25 per day (%)
33 (2010)
GNI per capita (US$) 1,410 (2011)
Primary school net attendance ratio (% female, % male)
81, 85 (2005–2006)
Piped on premises Other improvedUnimproved Surface water
18
28
51
3
23
7
69
1
49
11
39
1
48
3
49
0
7
33
56
4
12
9
78
1
0%
20%
40%
60%
80%
100%
1990 2010Total Urban Rural
1990 2010 1990 2010
0%
20%
40%
60%
80%
100%
58 5448
1992–1993NFHS
1998–1999NFHS
2005–2006NFHS
0% 20% 40% 60% 80% 100%
Poorest 20%
RuralUrban
GirlsBoys
Second 20%Middle 20%Fourth 20%
Richest 20%
4848
4051
60
25
5449
41
0%
20%
40%
60%
80%
100%
1992–1993NFHS
1998–1999NFHS
2005–2006NFHS
MDG 1: INSUFFICIENT PROGRESS
51 46 43
Neonatal 52%HIV/AIDS 0%
Diarrhoea 12%
Measles 3%
Injuries 3%
Pneumonia 15%
Malaria 0%
Others 12%
Meningitis 2%
INDIAINDIA
1,241,492
0%
20%
40%
60%
80%
100%
Non-pregnant women
Pregnant women
53 5970
Public health problemsevere
moderate
Preschool- aged children
Maternal mortality ratio, adjusted (per 100,000 live births)
200 (2010)
Maternal mortality ratio, reported(per 100,000 live births)
210 (2009)
Total number of maternal deaths 56,000 (2010)
Lifetime risk of maternal death (1 in : ) 170 (2010)
Women with low BMI (<18.5 kg/m2, %) 36 (2005–2006)
Anaemia, non-pregnant women (<120g/l, %) 53 (2005–2006)
Antenatal care (at least one visit, %) 74 (2006)
Antenatal care (at least four visits, %) 37 (2006)
Skilled attendant at birth (%) 52 (2008)
Low birthweight (<2,500 grams, %) 28 (2005–2006)
Women 20–24 years old who gave birth before age 18 (%)
22 (2006)
0%
20%
40%
60%
80%
100%
1998–1999NFHS
2000MICS
2005–2006NFHS
2009Other NS
49 50 51
71
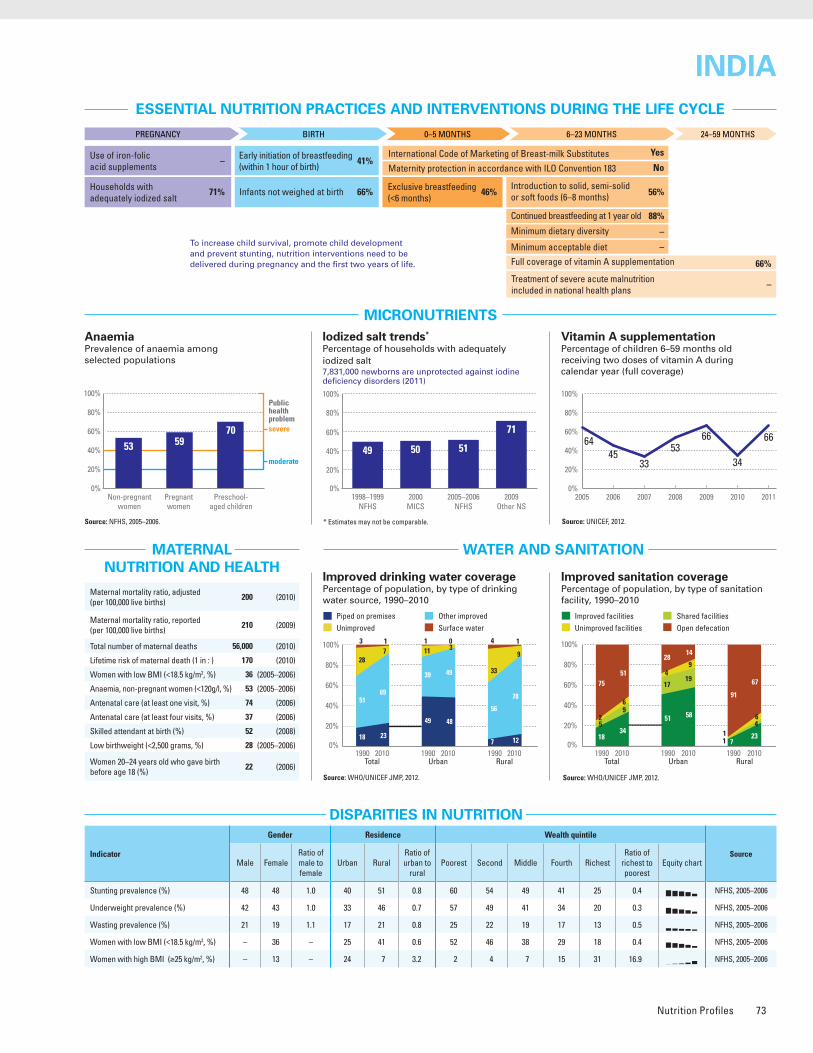
Nutrition Profiles 73
ESSENTIAL NUTRITION PRACTICES AND INTERVENTIONS DURING THE LIFE CYCLE
MICRONUTRIENTS
WATER AND SANITATION
Improved drinking water coveragePercentage of population, by type of drinking water source, 1990–2010
Source: WHO/UNICEF JMP, 2012.
Improved sanitation coveragePercentage of population, by type of sanitation facility, 1990–2010
Source: WHO/UNICEF JMP, 2012.
Vitamin A supplementationPercentage of children 6–59 months old receiving two doses of vitamin A during calendar year (full coverage)
* Estimates may not be comparable. Source: UNICEF, 2012.
MATERNAL NUTRITION AND HEALTH
DISPARITIES IN NUTRITION
Causes of under-five deaths, 2010Globally, undernutrition contributes to more than one third of child deaths
NUTRITIONAL STATUS
Stunting disparitiesPercentage of children <5 years old stunted, by selected background characteristics
DEMOGRAPHICS AND BACKGROUND INFORMATION
INFANT AND YOUNG CHILD FEEDING
Source: WHO/CHERG, 2012.
Under-five mortality rateDeaths per 1,000 live births
Source: IGME, 2012.AnaemiaPrevalence of anaemia among selected populations
Infant feeding practices, by ageExclusive breastfeeding trends Percentage of infants <6 months old exclusively breastfed
Breastfed and non-milk liquids
Breastfed and solid/semi-solid foods
Breastfed and plain water only
Breastfed and other milk/formula
Exclusively breastfed
Weaned (not breastfed)
Stunting trendsPercentage of children <5 years old stunted
Underweight trendsPercentage of children <5 years old underweight
Burden of malnutrition (2011)
Stunting country rank 1
Share of world stunting burden (%) 38
Source: NFHS, 2005–2006.
2005 2006 2007 2008 2009 2010 2011
6445
33
66
34
6653
0%
20%
40%
60%
80%
100%
Indicator
Gender Residence Wealth quintile
SourceMale Female
Ratio of male to female
Urban RuralRatio of urban to
ruralPoorest Second Middle Fourth Richest
Ratio of richest to poorest
Equity chart
Stunting prevalence (%) 48 48 1.0 40 51 0.8 60 54 49 41 25 0.4 NFHS, 2005–2006
Underweight prevalence (%) 42 43 1.0 33 46 0.7 57 49 41 34 20 0.3 NFHS, 2005–2006
Wasting prevalence (%) 21 19 1.1 17 21 0.8 25 22 19 17 13 0.5 NFHS, 2005–2006
Women with low BMI (<18.5 kg/m2, %) – 36 – 25 41 0.6 52 46 38 29 18 0.4 NFHS, 2005–2006
Women with high BMI (≥25 kg/m2, %) – 13 – 24 7 3.2 2 4 7 15 31 16.9 NFHS, 2005–2006
Improved facilities Shared facilitiesUnimproved facilities Open defecation
18
25
75
34
69
51
51
4
17
28
58
9
19
14
711
91
23
64
67
0%
20%
40%
60%
80%
100%
1990 2010Total Urban Rural
1990 2010 1990 2010
Iodized salt trends*
Percentage of households with adequately iodized salt7,831,000 newborns are unprotected against iodine deficiency disorders (2011)
Source: NFHS, 2005–2006.
To increase child survival, promote child development and prevent stunting, nutrition interventions need to be delivered during pregnancy and the first two years of life.
PREGNANCY BIRTH 0–5 MONTHS 6–23 MONTHS 24–59 MONTHS
Use of iron-folic acid supplements
Early initiation of breastfeeding(within 1 hour of birth)
International Code of Marketing of Breast-milk Substitutes
Maternity protection in accordance with ILO Convention 183
Minimum dietary diversity
Minimum acceptable diet
Full coverage of vitamin A supplementation
Treatment of severe acute malnutrition included in national health plans
Introduction to solid, semi-solid or soft foods (6–8 months)
Continued breastfeeding at 1 year old
Infants not weighed at birthHouseholds with adequately iodized salt
Exclusive breastfeeding(<6 months)
88%
56%
No
Yes
–
–
66%
–
46%66%
41%
71%
–
Source: NFHS, 2005–2006.
0–1 2–3 4–5 6–7 8–9 10–11 12–13 14–15 16–17 18–19 20–21 22–23
Age (months)
0%
20%
40%
60%
80%
100%
44 4637
46
1992–1993NFHS
1998–1999NFHS
2000MICS
2005–2006NFHS
0%
20%
40%
60%
80%
100%
MDG 1 progress Insufficient progress
Underweight (under-fives, 000) 54,650
Overweight (under-fives, 000) 2,443
Stunted (under-fives, 000) 61,723
Wasted (under-fives, 000) 25,461
Severely wasted (under-fives, 000) 8,230
1990 1995 2000 2005 2010 2015
114
61
38
0
20
40
60
80
100
120
MDG 4target
Total population (000) (2011)
Total under-five population (000) 128,589 (2011)
Total number of births (000) 27,098 (2011)
Under-five mortality rate (per 1,000 live births) 61 (2011)
Total number of under-five deaths (000) 1,655 (2011)
Infant mortality rate (per 1,000 live births) 47 (2011)
Neonatal mortality rate (per 1,000 live births) 32 (2011)
HIV prevalence rate (15–49 years old, %) – –
Population below international poverty line of US$1.25 per day (%)
33 (2010)
GNI per capita (US$) 1,410 (2011)
Primary school net attendance ratio (% female, % male)
81, 85 (2005–2006)
Piped on premises Other improvedUnimproved Surface water
18
28
51
3
23
7
69
1
49
11
39
1
48
3
49
0
7
33
56
4
12
9
78
1
0%
20%
40%
60%
80%
100%
1990 2010Total Urban Rural
1990 2010 1990 2010
0%
20%
40%
60%
80%
100%
58 5448
1992–1993NFHS
1998–1999NFHS
2005–2006NFHS
0% 20% 40% 60% 80% 100%
Poorest 20%
RuralUrban
GirlsBoys
Second 20%Middle 20%Fourth 20%
Richest 20%
4848
4051
60
25
5449
41
0%
20%
40%
60%
80%
100%
1992–1993NFHS
1998–1999NFHS
2005–2006NFHS
MDG 1: INSUFFICIENT PROGRESS
51 46 43
Neonatal 52%HIV/AIDS 0%
Diarrhoea 12%
Measles 3%
Injuries 3%
Pneumonia 15%
Malaria 0%
Others 12%
Meningitis 2%
INDIAINDIA
1,241,492
0%
20%
40%
60%
80%
100%
Non-pregnant women
Pregnant women
53 5970
Public health problemsevere
moderate
Preschool- aged children
Maternal mortality ratio, adjusted (per 100,000 live births)
200 (2010)
Maternal mortality ratio, reported(per 100,000 live births)
210 (2009)
Total number of maternal deaths 56,000 (2010)
Lifetime risk of maternal death (1 in : ) 170 (2010)
Women with low BMI (<18.5 kg/m2, %) 36 (2005–2006)
Anaemia, non-pregnant women (<120g/l, %) 53 (2005–2006)
Antenatal care (at least one visit, %) 74 (2006)
Antenatal care (at least four visits, %) 37 (2006)
Skilled attendant at birth (%) 52 (2008)
Low birthweight (<2,500 grams, %) 28 (2005–2006)
Women 20–24 years old who gave birth before age 18 (%)
22 (2006)
0%
20%
40%
60%
80%
100%
1998–1999NFHS
2000MICS
2005–2006NFHS
2009Other NS
49 50 51
71
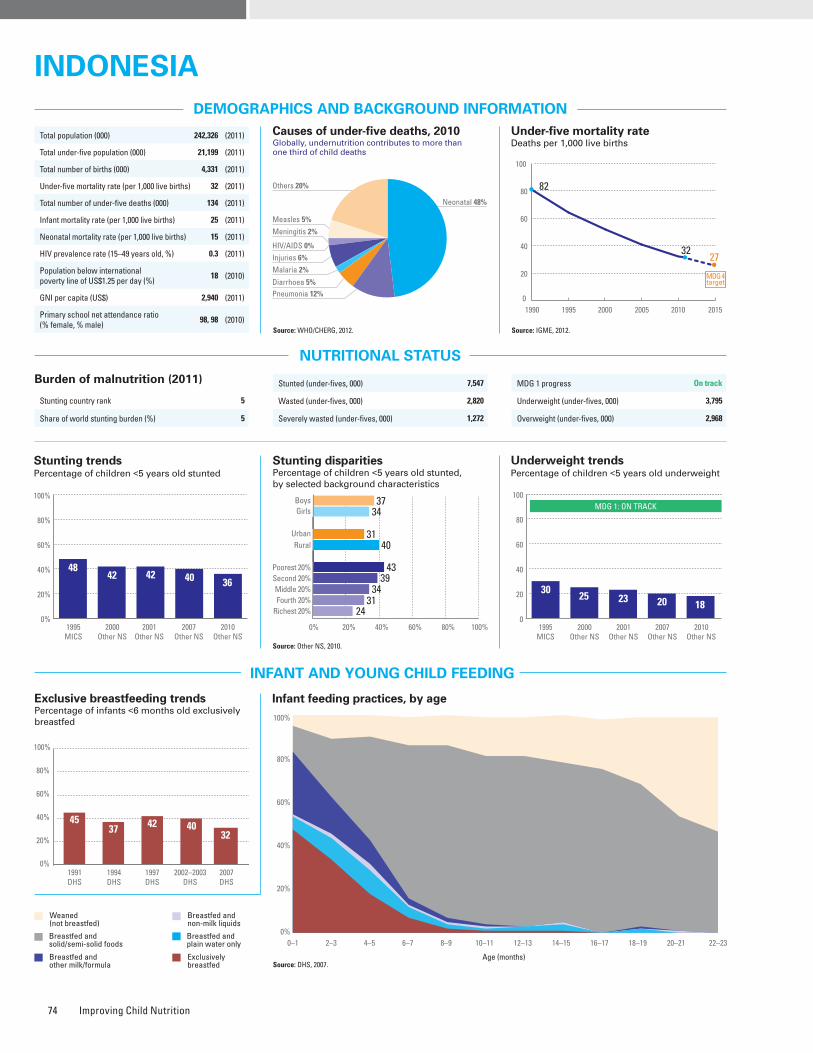
Improving Child Nutrition74
ESSENTIAL NUTRITION PRACTICES AND INTERVENTIONS DURING THE LIFE CYCLE
MICRONUTRIENTS
WATER AND SANITATION
Improved drinking water coveragePercentage of population, by type of drinking water source, 1990–2010
Source: WHO/UNICEF JMP, 2012.
Improved sanitation coveragePercentage of population, by type of sanitation facility, 1990–2010
Source: WHO/UNICEF JMP, 2012.
Vitamin A supplementationPercentage of children 6–59 months old receiving two doses of vitamin A during calendar year (full coverage)
* Estimates may not be comparable. Source: UNICEF, 2012.
MATERNAL NUTRITION AND HEALTH
DISPARITIES IN NUTRITION
Causes of under-five deaths, 2010Globally, undernutrition contributes to more than one third of child deaths
NUTRITIONAL STATUS
Stunting disparitiesPercentage of children <5 years old stunted, by selected background characteristics
DEMOGRAPHICS AND BACKGROUND INFORMATION
INFANT AND YOUNG CHILD FEEDING
Source: WHO/CHERG, 2012.
Under-five mortality rateDeaths per 1,000 live births
Source: IGME, 2012.AnaemiaPrevalence of anaemia among selected populations
Infant feeding practices, by ageExclusive breastfeeding trends Percentage of infants <6 months old exclusively breastfed
Breastfed and non-milk liquids
Breastfed and solid/semi-solid foods
Breastfed and plain water only
Breastfed and other milk/formula
Exclusively breastfed
Weaned (not breastfed)
Stunting trendsPercentage of children <5 years old stunted
Underweight trendsPercentage of children <5 years old underweight
Source: Other NS, 2010.
Burden of malnutrition (2011)
Stunting country rank 5
Share of world stunting burden (%) 5
Iodized salt trends*
Percentage of households with adequately iodized salt1,633,000 newborns are unprotected against iodine deficiency disorders (2011)
Improved facilities Shared facilitiesUnimproved facilities Open defecation
32
22
7
39
54
9
11
26
56
17
8
19
73
310
14
21
25
6
48
39
13
12
36
0%
20%
40%
60%
80%
100%
1990 2010Total Urban Rural
1990 2010 1990 2010
Indicator
Gender Residence Wealth quintile
SourceMale Female
Ratio of male to female
Urban RuralRatio of urban to
ruralPoorest Second Middle Fourth Richest
Ratio of richest to poorest
Equity chart
Stunting prevalence (%) 37 34 1.1 31 40 0.8 43 39 34 31 24 0.6 Other NS, 2010
Underweight prevalence (%) 19 17 1.1 15 21 0.7 23 19 18 15 10 0.5 Other NS, 2010
Wasting prevalence (%) 14 13 1.1 13 14 0.9 15 14 13 12 11 0.7 Other NS, 2010
Women with low BMI (<18.5 kg/m2, %) – – – – – – – – – – – – –
Women with high BMI (≥25 kg/m2, %) – – – – – – – – – – – – –
2005 2006 2007 2008 2009 2010 2011
76 82 8776808486
0%
20%
40%
60%
80%
100%
To increase child survival, promote child development and prevent stunting, nutrition interventions need to be delivered during pregnancy and the first two years of life.
PREGNANCY BIRTH 0–5 MONTHS 6–23 MONTHS 24–59 MONTHS
Use of iron-folic acid supplements
Early initiation of breastfeeding(within 1 hour of birth)
International Code of Marketing of Breast-milk Substitutes
Maternity protection in accordance with ILO Convention 183
Minimum dietary diversity
Minimum acceptable diet
Full coverage of vitamin A supplementation
Treatment of severe acute malnutrition included in national health plans
Introduction to solid, semi-solid or soft foods (6–8 months)
Continued breastfeeding at 1 year old
Infants not weighed at birthHouseholds with adequately iodized salt
Exclusive breastfeeding(<6 months)
80%
85%
No
Partial
–
–
76%
Yes
32%18%
29%
62%
29%
Source: DHS, 2007.
0–1 2–3 4–5 6–7 8–9 10–11 12–13 14–15 16–17 18–19 20–21 22–23
Age (months)
0%
20%
40%
60%
80%
100%
4537 4042
1991DHS
1994DHS
1997DHS
2007DHS
0%
20%
40%
60%
80%
100%
32
2002–2003DHS
Stunted (under-fives, 000) 7,547
Wasted (under-fives, 000) 2,820
Severely wasted (under-fives, 000) 1,272
MDG 1 progress On track
Underweight (under-fives, 000) 3,795
Overweight (under-fives, 000) 2,968
1990 1995 2000 2005 2010 2015
82
3227
0
20
40
60
80
100
MDG 4target
Total population (000) 242,326 (2011)
Total under-five population (000) 21,199 (2011)
Total number of births (000) 4,331 (2011)
Under-five mortality rate (per 1,000 live births) 32 (2011)
Total number of under-five deaths (000) 134 (2011)
Infant mortality rate (per 1,000 live births) 25 (2011)
Neonatal mortality rate (per 1,000 live births) 15 (2011)
HIV prevalence rate (15–49 years old, %) 0.3 (2011)
Population below international poverty line of US$1.25 per day (%)
18 (2010)
GNI per capita (US$) 2,940 (2011)
Primary school net attendance ratio (% female, % male)
98, 98 (2010)
Piped on premises Other improvedUnimproved Surface water
9
25
61
5
20
16
62
2
25
8
66
1
36
8
56
0
2
32
59
7
8
22
66
4
0%
20%
40%
60%
80%
100%
1990 2010Total Urban Rural
1990 2010 1990 2010
0%
20%
40%
60%
80%
100%
4842 42 40 36
1995MICS
2000Other NS
2001Other NS
2007Other NS
2010Other NS
0% 20% 40% 60% 80% 100%
Poorest 20%
RuralUrban
GirlsBoys
Second 20%Middle 20%Fourth 20%
Richest 20%
3734
3140
43
24
3934
31
0
20
40
60
80
100
52
1995MICS
2000Other NS
2001Other NS
2007Other NS
2010Other NS
MDG 1: ON TRACK
3025 23 20 18
Neonatal 48%
HIV/AIDS 0%
Diarrhoea 5%
Measles 5%
Injuries 6%
Pneumonia 12%
Malaria 2%
Others 20%
Meningitis 2%
IndonesIaIndonesIa
no daTa
Maternal mortality ratio, adjusted (per 100,000 live births)
220 (2010)
Maternal mortality ratio, reported(per 100,000 live births)
230 (2007)
Total number of maternal deaths 9,600 (2010)
Lifetime risk of maternal death (1 in : ) 210 (2010)
Women with low BMI (<18.5 kg/m2, %) – –
Anaemia, non-pregnant women (<120g/l, %) – –
Antenatal care (at least one visit, %) 93 (2010)
Antenatal care (at least four visits, %) 82 (2007)
Skilled attendant at birth (%) 79 (2007)
Low birthweight (<2,500 grams, %) 9 (2007)
Women 20–24 years old who gave birth before age 18 (%)
10 (2007)
0%
20%
40%
60%
80%
100%
2001Other NS
2002Other NS
2003Other NS
2007Other NS
65 69 7362
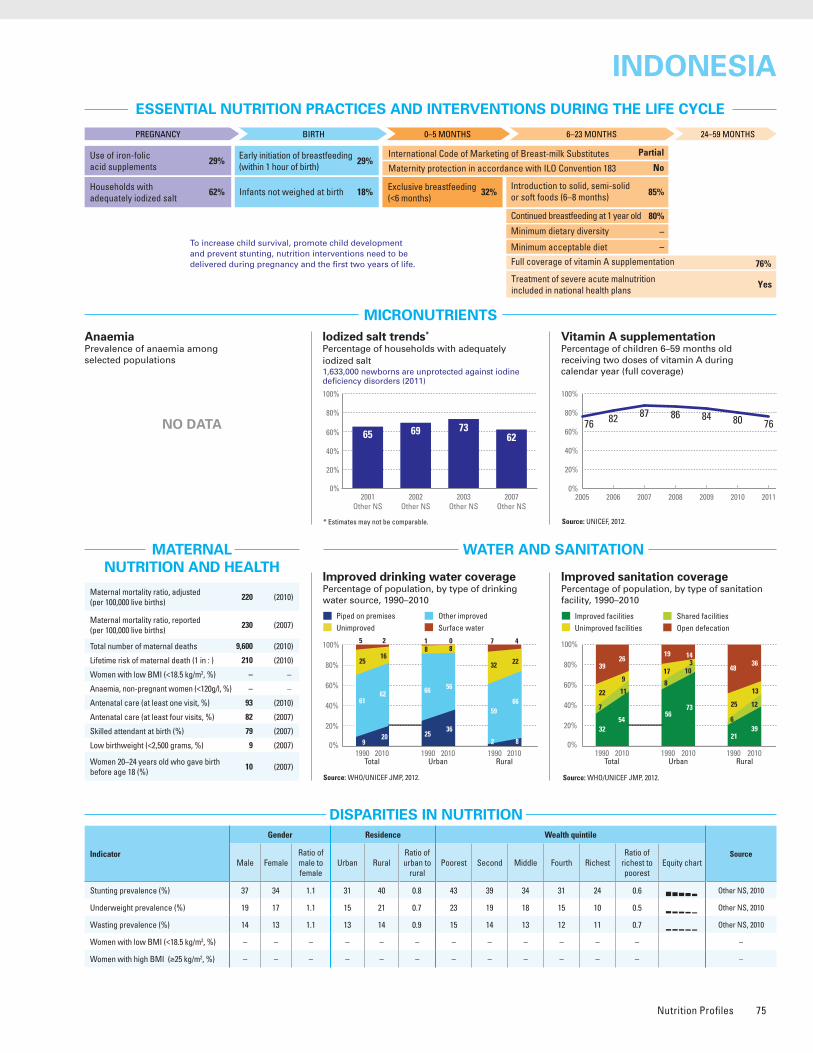
Nutrition Profiles 75
ESSENTIAL NUTRITION PRACTICES AND INTERVENTIONS DURING THE LIFE CYCLE
MICRONUTRIENTS
WATER AND SANITATION
Improved drinking water coveragePercentage of population, by type of drinking water source, 1990–2010
Source: WHO/UNICEF JMP, 2012.
Improved sanitation coveragePercentage of population, by type of sanitation facility, 1990–2010
Source: WHO/UNICEF JMP, 2012.
Vitamin A supplementationPercentage of children 6–59 months old receiving two doses of vitamin A during calendar year (full coverage)
* Estimates may not be comparable. Source: UNICEF, 2012.
MATERNAL NUTRITION AND HEALTH
DISPARITIES IN NUTRITION
Causes of under-five deaths, 2010Globally, undernutrition contributes to more than one third of child deaths
NUTRITIONAL STATUS
Stunting disparitiesPercentage of children <5 years old stunted, by selected background characteristics
DEMOGRAPHICS AND BACKGROUND INFORMATION
INFANT AND YOUNG CHILD FEEDING
Source: WHO/CHERG, 2012.
Under-five mortality rateDeaths per 1,000 live births
Source: IGME, 2012.AnaemiaPrevalence of anaemia among selected populations
Infant feeding practices, by ageExclusive breastfeeding trends Percentage of infants <6 months old exclusively breastfed
Breastfed and non-milk liquids
Breastfed and solid/semi-solid foods
Breastfed and plain water only
Breastfed and other milk/formula
Exclusively breastfed
Weaned (not breastfed)
Stunting trendsPercentage of children <5 years old stunted
Underweight trendsPercentage of children <5 years old underweight
Source: Other NS, 2010.
Burden of malnutrition (2011)
Stunting country rank 5
Share of world stunting burden (%) 5
Iodized salt trends*
Percentage of households with adequately iodized salt1,633,000 newborns are unprotected against iodine deficiency disorders (2011)
Improved facilities Shared facilitiesUnimproved facilities Open defecation
32
22
7
39
54
9
11
26
56
17
8
19
73
310
14
21
25
6
48
39
13
12
36
0%
20%
40%
60%
80%
100%
1990 2010Total Urban Rural
1990 2010 1990 2010
Indicator
Gender Residence Wealth quintile
SourceMale Female
Ratio of male to female
Urban RuralRatio of urban to
ruralPoorest Second Middle Fourth Richest
Ratio of richest to poorest
Equity chart
Stunting prevalence (%) 37 34 1.1 31 40 0.8 43 39 34 31 24 0.6 Other NS, 2010
Underweight prevalence (%) 19 17 1.1 15 21 0.7 23 19 18 15 10 0.5 Other NS, 2010
Wasting prevalence (%) 14 13 1.1 13 14 0.9 15 14 13 12 11 0.7 Other NS, 2010
Women with low BMI (<18.5 kg/m2, %) – – – – – – – – – – – – –
Women with high BMI (≥25 kg/m2, %) – – – – – – – – – – – – –
2005 2006 2007 2008 2009 2010 2011
76 82 8776808486
0%
20%
40%
60%
80%
100%
To increase child survival, promote child development and prevent stunting, nutrition interventions need to be delivered during pregnancy and the first two years of life.
PREGNANCY BIRTH 0–5 MONTHS 6–23 MONTHS 24–59 MONTHS
Use of iron-folic acid supplements
Early initiation of breastfeeding(within 1 hour of birth)
International Code of Marketing of Breast-milk Substitutes
Maternity protection in accordance with ILO Convention 183
Minimum dietary diversity
Minimum acceptable diet
Full coverage of vitamin A supplementation
Treatment of severe acute malnutrition included in national health plans
Introduction to solid, semi-solid or soft foods (6–8 months)
Continued breastfeeding at 1 year old
Infants not weighed at birthHouseholds with adequately iodized salt
Exclusive breastfeeding(<6 months)
80%
85%
No
Partial
–
–
76%
Yes
32%18%
29%
62%
29%
Source: DHS, 2007.
0–1 2–3 4–5 6–7 8–9 10–11 12–13 14–15 16–17 18–19 20–21 22–23
Age (months)
0%
20%
40%
60%
80%
100%
4537 4042
1991DHS
1994DHS
1997DHS
2007DHS
0%
20%
40%
60%
80%
100%
32
2002–2003DHS
Stunted (under-fives, 000) 7,547
Wasted (under-fives, 000) 2,820
Severely wasted (under-fives, 000) 1,272
MDG 1 progress On track
Underweight (under-fives, 000) 3,795
Overweight (under-fives, 000) 2,968
1990 1995 2000 2005 2010 2015
82
3227
0
20
40
60
80
100
MDG 4target
Total population (000) 242,326 (2011)
Total under-five population (000) 21,199 (2011)
Total number of births (000) 4,331 (2011)
Under-five mortality rate (per 1,000 live births) 32 (2011)
Total number of under-five deaths (000) 134 (2011)
Infant mortality rate (per 1,000 live births) 25 (2011)
Neonatal mortality rate (per 1,000 live births) 15 (2011)
HIV prevalence rate (15–49 years old, %) 0.3 (2011)
Population below international poverty line of US$1.25 per day (%)
18 (2010)
GNI per capita (US$) 2,940 (2011)
Primary school net attendance ratio (% female, % male)
98, 98 (2010)
Piped on premises Other improvedUnimproved Surface water
9
25
61
5
20
16
62
2
25
8
66
1
36
8
56
0
2
32
59
7
8
22
66
4
0%
20%
40%
60%
80%
100%
1990 2010Total Urban Rural
1990 2010 1990 2010
0%
20%
40%
60%
80%
100%
4842 42 40 36
1995MICS
2000Other NS
2001Other NS
2007Other NS
2010Other NS
0% 20% 40% 60% 80% 100%
Poorest 20%
RuralUrban
GirlsBoys
Second 20%Middle 20%Fourth 20%
Richest 20%
3734
3140
43
24
3934
31
0
20
40
60
80
100
52
1995MICS
2000Other NS
2001Other NS
2007Other NS
2010Other NS
MDG 1: ON TRACK
3025 23 20 18
Neonatal 48%
HIV/AIDS 0%
Diarrhoea 5%
Measles 5%
Injuries 6%
Pneumonia 12%
Malaria 2%
Others 20%
Meningitis 2%
IndonesIaIndonesIa
no daTa
Maternal mortality ratio, adjusted (per 100,000 live births)
220 (2010)
Maternal mortality ratio, reported(per 100,000 live births)
230 (2007)
Total number of maternal deaths 9,600 (2010)
Lifetime risk of maternal death (1 in : ) 210 (2010)
Women with low BMI (<18.5 kg/m2, %) – –
Anaemia, non-pregnant women (<120g/l, %) – –
Antenatal care (at least one visit, %) 93 (2010)
Antenatal care (at least four visits, %) 82 (2007)
Skilled attendant at birth (%) 79 (2007)
Low birthweight (<2,500 grams, %) 9 (2007)
Women 20–24 years old who gave birth before age 18 (%)
10 (2007)
0%
20%
40%
60%
80%
100%
2001Other NS
2002Other NS
2003Other NS
2007Other NS
65 69 7362
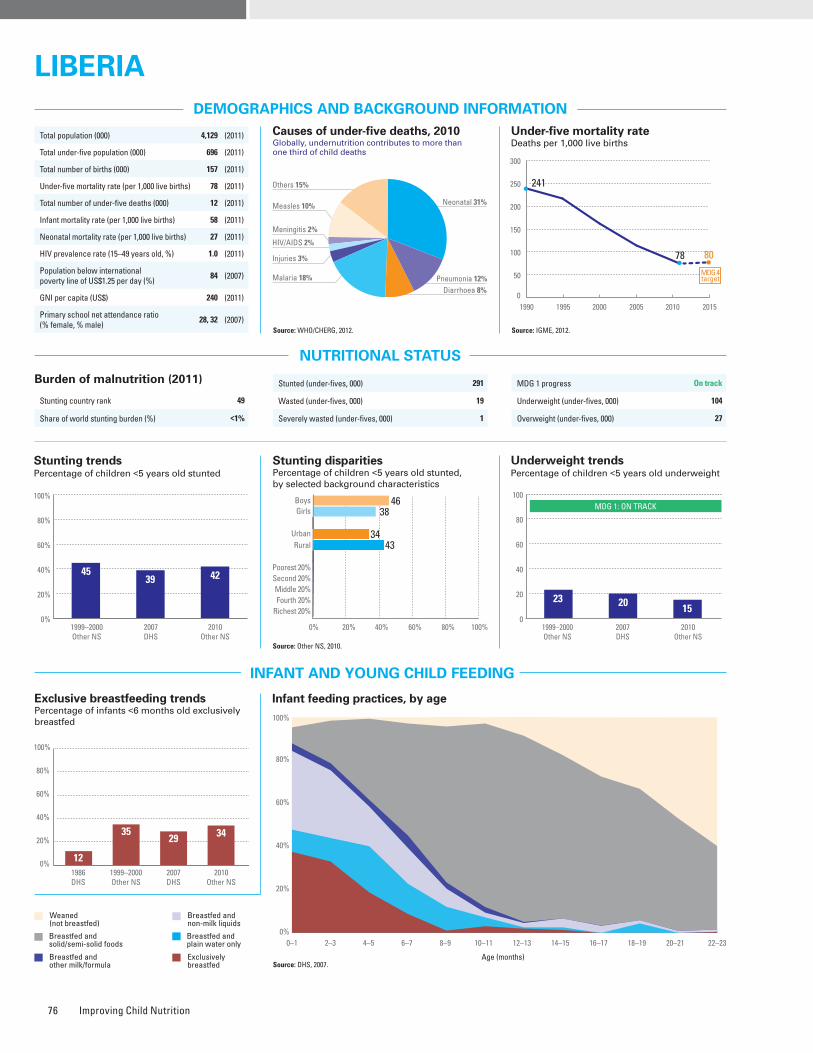
Improving Child Nutrition76
ESSENTIAL NUTRITION PRACTICES AND INTERVENTIONS DURING THE LIFE CYCLE
MICRONUTRIENTS
WATER AND SANITATION
Vitamin A supplementationPercentage of children 6–59 months old receiving two doses of vitamin A during calendar year (full coverage)
Source: UNICEF, 2012.
MATERNAL NUTRITION AND HEALTH
DISPARITIES IN NUTRITION
Causes of under-five deaths, 2010Globally, undernutrition contributes to more than one third of child deaths
NUTRITIONAL STATUS
Stunting disparitiesPercentage of children <5 years old stunted, by selected background characteristics
DEMOGRAPHICS AND BACKGROUND INFORMATION
INFANT AND YOUNG CHILD FEEDING
Source: WHO/CHERG, 2012.
Under-five mortality rateDeaths per 1,000 live births
Source: IGME, 2012.AnaemiaPrevalence of anaemia among selected populations
Infant feeding practices, by ageExclusive breastfeeding trends Percentage of infants <6 months old exclusively breastfed
Breastfed and non-milk liquids
Breastfed and solid/semi-solid foods
Breastfed and plain water only
Breastfed and other milk/formula
Exclusively breastfed
Weaned (not breastfed)
Stunting trendsPercentage of children <5 years old stunted
Underweight trendsPercentage of children <5 years old underweight
Burden of malnutrition (2011)
Stunting country rank 49
Share of world stunting burden (%) <1%
Source: WHO/UNICEF JMP, 2012.* Insufficient data for generating a trend graph.
Source: WHO/UNICEF JMP, 2012.* Insufficient data for generating a trend graph.
Improved sanitation coveragePercentage of population, by type of sanitation facility, 2010*
Improved drinking water coveragePercentage of population, by type of drinking water source, 2010*
Iodized salt trends*
Percentage of households with adequately iodized salt
Source: Other NS, 2010.
Indicator
Gender Residence Wealth quintile
SourceMale Female
Ratio of male to female
Urban RuralRatio of urban to
ruralPoorest Second Middle Fourth Richest
Ratio of richest to poorest
Equity chart
Stunting prevalence (%) 46 38 1.2 34 43 0.8 – – – – – – Other NS, 2010
Underweight prevalence (%) 17 13 1.3 – – – – – – – – – Other NS, 2 010
Wasting prevalence (%) 8 7 1.0 9 7 1.3 7 8 10 5 8 1.1 Other NS, 2010
Women with low BMI (<18.5 kg/m2, %) – 8 – – – – – – – – – – Other NS, 2010
Women with high BMI (≥25 kg/m2, %) – 20 – – – – – – – – – – Other NS, 2010
1990 1995 2000 2005 2010 2015
241
78 80
0
50
100
150
200
250
300
MDG 4target
12
3529 34
1986DHS
1999–2000Other NS
2007DHS
2010Other NS
0%
20%
40%
60%
80%
100%
Source: DHS, 2007.
0–1 2–3 4–5 6–7 8–9 10–11 12–13 14–15 16–17 18–19 20–21 22–23
Age (months)
0%
20%
40%
60%
80%
100%
Stunted (under-fives, 000) 291
Wasted (under-fives, 000) 19
Severely wasted (under-fives, 000) 1
MDG 1 progress On track
Underweight (under-fives, 000) 104
Overweight (under-fives, 000) 27
Total population (000) 4,129 (2011)
Total under-five population (000) 696 (2011)
Total number of births (000) 157 (2011)
Under-five mortality rate (per 1,000 live births) 78 (2011)
Total number of under-five deaths (000) 12 (2011)
Infant mortality rate (per 1,000 live births) 58 (2011)
Neonatal mortality rate (per 1,000 live births) 27 (2011)
HIV prevalence rate (15–49 years old, %) 1.0 (2011)
Population below international poverty line of US$1.25 per day (%)
84 (2007)
GNI per capita (US$) 240 (2011)
Primary school net attendance ratio (% female, % male)
28, 32 (2007)
Improved facilities Shared facilitiesUnimproved facilities Open defecation
18
12
25
45
29
16
30
25
7
8
21
64
0%
20%
40%
60%
80%
100%
Total Urban Rural2010 2010 2010
To increase child survival, promote child development and prevent stunting, nutrition interventions need to be delivered during pregnancy and the first two years of life.
PREGNANCY BIRTH 0–5 MONTHS 6–23 MONTHS 24–59 MONTHS
Use of iron-folic acid supplements
Early initiation of breastfeeding(within 1 hour of birth)
International Code of Marketing of Breast-milk Substitutes
Maternity protection in accordance with ILO Convention 183
Minimum dietary diversity
Minimum acceptable diet
Full coverage of vitamin A supplementation
Treatment of severe acute malnutrition included in national health plans
Introduction to solid, semi-solid or soft foods (6–8 months)
Continued breastfeeding at 1 year old
Infants not weighed at birthHouseholds with adequately iodized salt
Exclusive breastfeeding(<6 months)
89%
51%
No
Partial
–
–
96%
Yes
34%85%
44%
–
14%
Piped on premises Other improvedUnimproved Surface water
4
15
69
12
8
11
80
1
1
17
59
23
2010Total Urban Rural
2010 20100%
20%
40%
60%
80%
100%
0%
20%
40%
60%
80%
100%
4539 42
1999–2000Other NS
2007DHS
2010Other NS
0% 20% 40% 60% 80% 100%
Poorest 20%
RuralUrban
GirlsBoys
Second 20%Middle 20%Fourth 20%
Richest 20%
4638
3443
1999–2000Other NS
2007DHS
2010Other NS
MDG 1: ON TRACK
23 2015
0
20
40
60
80
100
57 52
23 20 15
Neonatal 31%
HIV/AIDS 2%
Diarrhoea 8%
Measles 10%
Injuries 3%
Pneumonia 12%Malaria 18%
Others 15%
Meningitis 2%
LIBERIALIBERIA
NO DATANO DATA
2005 2006 2007 2008 2009 2010 2011
79
3
85 969792
0%
20%
40%
60%
80%
100%
Maternal mortality ratio, adjusted (per 100,000 live births)
770 (2010)
Maternal mortality ratio, reported(per 100,000 live births)
990 (2007)
Total number of maternal deaths 1,200 (2010)
Lifetime risk of maternal death (1 in : ) 24 (2010)
Women with low BMI (<18.5 kg/m2, %) 8 (2010)
Anaemia, non-pregnant women (<120g/l, %) – –
Antenatal care (at least one visit, %) 79 (2007)
Antenatal care (at least four visits, %) 66 (2007)
Skilled attendant at birth (%) 46 (2007)
Low birthweight (<2,500 grams, %) 14 (2007)
Women 20–24 years old who gave birth before age 18 (%)
38 (2009)
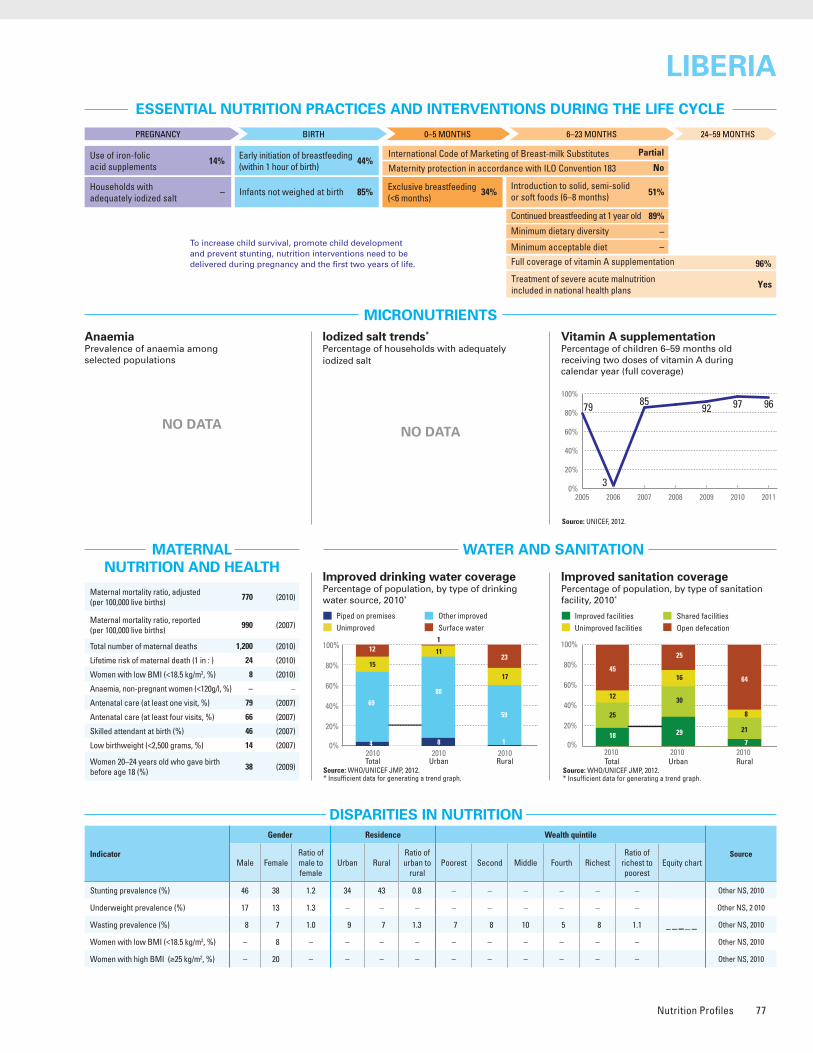
Nutrition Profiles 77
ESSENTIAL NUTRITION PRACTICES AND INTERVENTIONS DURING THE LIFE CYCLE
MICRONUTRIENTS
WATER AND SANITATION
Vitamin A supplementationPercentage of children 6–59 months old receiving two doses of vitamin A during calendar year (full coverage)
Source: UNICEF, 2012.
MATERNAL NUTRITION AND HEALTH
DISPARITIES IN NUTRITION
Causes of under-five deaths, 2010Globally, undernutrition contributes to more than one third of child deaths
NUTRITIONAL STATUS
Stunting disparitiesPercentage of children <5 years old stunted, by selected background characteristics
DEMOGRAPHICS AND BACKGROUND INFORMATION
INFANT AND YOUNG CHILD FEEDING
Source: WHO/CHERG, 2012.
Under-five mortality rateDeaths per 1,000 live births
Source: IGME, 2012.AnaemiaPrevalence of anaemia among selected populations
Infant feeding practices, by ageExclusive breastfeeding trends Percentage of infants <6 months old exclusively breastfed
Breastfed and non-milk liquids
Breastfed and solid/semi-solid foods
Breastfed and plain water only
Breastfed and other milk/formula
Exclusively breastfed
Weaned (not breastfed)
Stunting trendsPercentage of children <5 years old stunted
Underweight trendsPercentage of children <5 years old underweight
Burden of malnutrition (2011)
Stunting country rank 49
Share of world stunting burden (%) <1%
Source: WHO/UNICEF JMP, 2012.* Insufficient data for generating a trend graph.
Source: WHO/UNICEF JMP, 2012.* Insufficient data for generating a trend graph.
Improved sanitation coveragePercentage of population, by type of sanitation facility, 2010*
Improved drinking water coveragePercentage of population, by type of drinking water source, 2010*
Iodized salt trends*
Percentage of households with adequately iodized salt
Source: Other NS, 2010.
Indicator
Gender Residence Wealth quintile
SourceMale Female
Ratio of male to female
Urban RuralRatio of urban to
ruralPoorest Second Middle Fourth Richest
Ratio of richest to poorest
Equity chart
Stunting prevalence (%) 46 38 1.2 34 43 0.8 – – – – – – Other NS, 2010
Underweight prevalence (%) 17 13 1.3 – – – – – – – – – Other NS, 2 010
Wasting prevalence (%) 8 7 1.0 9 7 1.3 7 8 10 5 8 1.1 Other NS, 2010
Women with low BMI (<18.5 kg/m2, %) – 8 – – – – – – – – – – Other NS, 2010
Women with high BMI (≥25 kg/m2, %) – 20 – – – – – – – – – – Other NS, 2010
1990 1995 2000 2005 2010 2015
241
78 80
0
50
100
150
200
250
300
MDG 4target
12
3529 34
1986DHS
1999–2000Other NS
2007DHS
2010Other NS
0%
20%
40%
60%
80%
100%
Source: DHS, 2007.
0–1 2–3 4–5 6–7 8–9 10–11 12–13 14–15 16–17 18–19 20–21 22–23
Age (months)
0%
20%
40%
60%
80%
100%
Stunted (under-fives, 000) 291
Wasted (under-fives, 000) 19
Severely wasted (under-fives, 000) 1
MDG 1 progress On track
Underweight (under-fives, 000) 104
Overweight (under-fives, 000) 27
Total population (000) 4,129 (2011)
Total under-five population (000) 696 (2011)
Total number of births (000) 157 (2011)
Under-five mortality rate (per 1,000 live births) 78 (2011)
Total number of under-five deaths (000) 12 (2011)
Infant mortality rate (per 1,000 live births) 58 (2011)
Neonatal mortality rate (per 1,000 live births) 27 (2011)
HIV prevalence rate (15–49 years old, %) 1.0 (2011)
Population below international poverty line of US$1.25 per day (%)
84 (2007)
GNI per capita (US$) 240 (2011)
Primary school net attendance ratio (% female, % male)
28, 32 (2007)
Improved facilities Shared facilitiesUnimproved facilities Open defecation
18
12
25
45
29
16
30
25
7
8
21
64
0%
20%
40%
60%
80%
100%
Total Urban Rural2010 2010 2010
To increase child survival, promote child development and prevent stunting, nutrition interventions need to be delivered during pregnancy and the first two years of life.
PREGNANCY BIRTH 0–5 MONTHS 6–23 MONTHS 24–59 MONTHS
Use of iron-folic acid supplements
Early initiation of breastfeeding(within 1 hour of birth)
International Code of Marketing of Breast-milk Substitutes
Maternity protection in accordance with ILO Convention 183
Minimum dietary diversity
Minimum acceptable diet
Full coverage of vitamin A supplementation
Treatment of severe acute malnutrition included in national health plans
Introduction to solid, semi-solid or soft foods (6–8 months)
Continued breastfeeding at 1 year old
Infants not weighed at birthHouseholds with adequately iodized salt
Exclusive breastfeeding(<6 months)
89%
51%
No
Partial
–
–
96%
Yes
34%85%
44%
–
14%
Piped on premises Other improvedUnimproved Surface water
4
15
69
12
8
11
80
1
1
17
59
23
2010Total Urban Rural
2010 20100%
20%
40%
60%
80%
100%
0%
20%
40%
60%
80%
100%
4539 42
1999–2000Other NS
2007DHS
2010Other NS
0% 20% 40% 60% 80% 100%
Poorest 20%
RuralUrban
GirlsBoys
Second 20%Middle 20%Fourth 20%
Richest 20%
4638
3443
1999–2000Other NS
2007DHS
2010Other NS
MDG 1: ON TRACK
23 2015
0
20
40
60
80
100
57 52
23 20 15
Neonatal 31%
HIV/AIDS 2%
Diarrhoea 8%
Measles 10%
Injuries 3%
Pneumonia 12%Malaria 18%
Others 15%
Meningitis 2%
LIBERIALIBERIA
NO DATANO DATA
2005 2006 2007 2008 2009 2010 2011
79
3
85 969792
0%
20%
40%
60%
80%
100%
Maternal mortality ratio, adjusted (per 100,000 live births)
770 (2010)
Maternal mortality ratio, reported(per 100,000 live births)
990 (2007)
Total number of maternal deaths 1,200 (2010)
Lifetime risk of maternal death (1 in : ) 24 (2010)
Women with low BMI (<18.5 kg/m2, %) 8 (2010)
Anaemia, non-pregnant women (<120g/l, %) – –
Antenatal care (at least one visit, %) 79 (2007)
Antenatal care (at least four visits, %) 66 (2007)
Skilled attendant at birth (%) 46 (2007)
Low birthweight (<2,500 grams, %) 14 (2007)
Women 20–24 years old who gave birth before age 18 (%)
38 (2009)
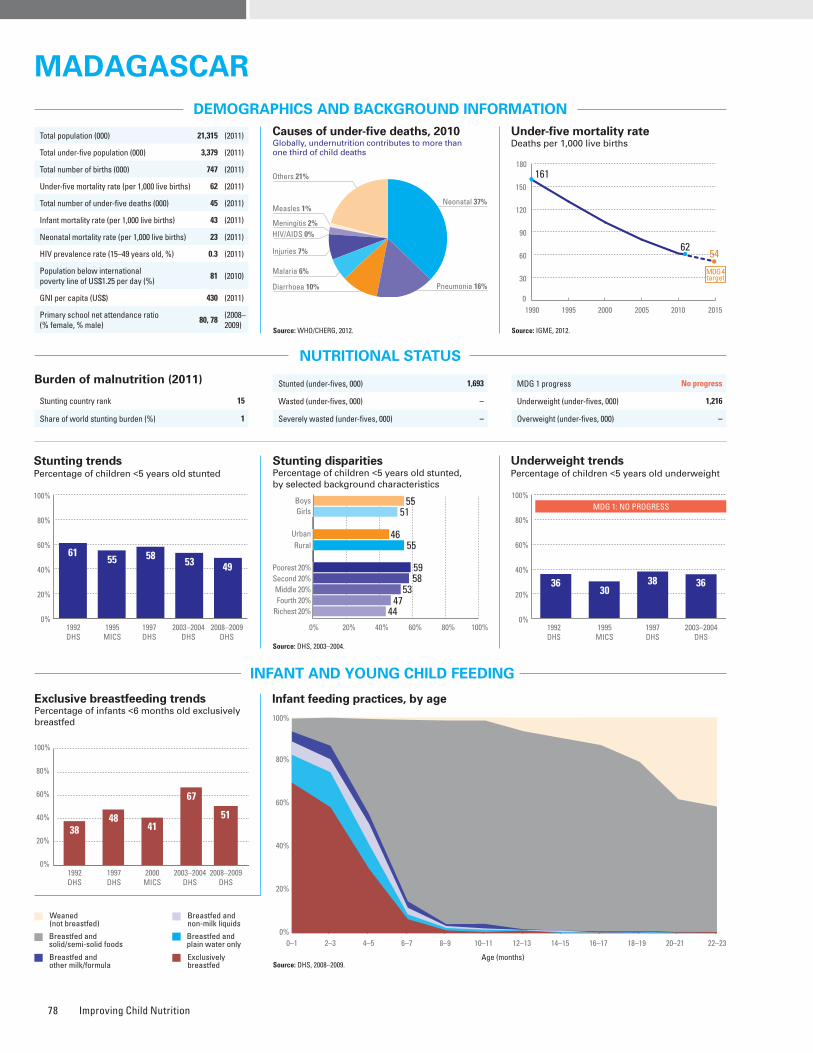
Improving Child Nutrition78
ESSENTIAL NUTRITION PRACTICES AND INTERVENTIONS DURING THE LIFE CYCLE
MICRONUTRIENTS
WATER AND SANITATION
Improved drinking water coveragePercentage of population, by type of drinking water source, 1990–2010
Source: WHO/UNICEF JMP, 2012.
Improved sanitation coveragePercentage of population, by type of sanitation facility, 1990–2010
Source: WHO/UNICEF JMP, 2012.
Vitamin A supplementationPercentage of children 6–59 months old receiving two doses of vitamin A during calendar year (full coverage)
* Estimates may not be comparable. Source: UNICEF, 2012.
MATERNAL NUTRITION AND HEALTH
DISPARITIES IN NUTRITION
Causes of under-five deaths, 2010Globally, undernutrition contributes to more than one third of child deaths
NUTRITIONAL STATUS
Stunting disparitiesPercentage of children <5 years old stunted, by selected background characteristics
DEMOGRAPHICS AND BACKGROUND INFORMATION
INFANT AND YOUNG CHILD FEEDING
Source: WHO/CHERG, 2012.
Under-five mortality rateDeaths per 1,000 live births
Source: IGME, 2012.AnaemiaPrevalence of anaemia among selected populations
Infant feeding practices, by ageExclusive breastfeeding trends Percentage of infants <6 months old exclusively breastfed
Breastfed and non-milk liquids
Breastfed and solid/semi-solid foods
Breastfed and plain water only
Breastfed and other milk/formula
Exclusively breastfed
Weaned (not breastfed)
Stunting trendsPercentage of children <5 years old stunted
Underweight trendsPercentage of children <5 years old underweight
Iodized salt trends*
Percentage of households with adequately iodized salt354,000 newborns are unprotected against iodine deficiency disorders (2011)
Source: DHS, 2003–2004.
Indicator
Gender Residence Wealth quintile
SourceMale Female
Ratio of male to female
Urban RuralRatio of urban to
ruralPoorest Second Middle Fourth Richest
Ratio of richest to poorest
Equity chart
Stunting prevalence (%) 55 51 1.1 46 55 0.8 59 58 53 47 44 0.7 DHS, 2003–2004
Underweight prevalence (%) 38 33 1.1 31 37 0.8 40 41 39 29 24 0.6 DHS, 2003–2004
Wasting prevalence (%) 18 12 1.5 14 15 0.9 16 15 15 15 13 0.8 DHS, 2003–2004
Women with low BMI (<18.5 kg/m2, %) – 27 – 21 28 0.8 33 34 28 24 19 0.6 DHS, 2008–2009
Women with high BMI (≥25 kg/m2, %) – 6 – 13 5 2.7 2 2 3 6 15 8.4 DHS, 2008–2009
Improved facilities Shared facilitiesUnimproved facilities Open defecation
9
23
12
56
15
30
18
37
15
41
21
23
21
32
28
19
7
18
9
66
12
29
14
45
0%
20%
40%
60%
80%
100%
1990 2010Total Urban Rural
1990 2010 1990 2010
Source: DHS, 2008–2009.
Source: DHS, 2008–2009.
0–1 2–3 4–5 6–7 8–9 10–11 12–13 14–15 16–17 18–19 20–21 22–23
Age (months)
0%
20%
40%
60%
80%
100%
3848
67
41
1992DHS
1997DHS
2000MICS
2008–2009DHS
0%
20%
40%
60%
80%
100%
51
2003–2004DHS
Stunted (under-fives, 000) 1,693
Wasted (under-fives, 000) –
Severely wasted (under-fives, 000) –
MDG 1 progress No progress
Underweight (under-fives, 000) 1,216
Overweight (under-fives, 000) –
Burden of malnutrition (2011)
Stunting country rank 15
Share of world stunting burden (%) 1
1990 1995 2000 2005 2010 2015
161
6254
0
30
60
90
120
150
180
MDG 4target
Total population (000) 21,315 (2011)
Total under-five population (000) 3,379 (2011)
Total number of births (000) 747 (2011)
Under-five mortality rate (per 1,000 live births) 62 (2011)
Total number of under-five deaths (000) 45 (2011)
Infant mortality rate (per 1,000 live births) 43 (2011)
Neonatal mortality rate (per 1,000 live births) 23 (2011)
HIV prevalence rate (15–49 years old, %) 0.3 (2011)
Population below international poverty line of US$1.25 per day (%)
81 (2010)
GNI per capita (US$) 430 (2011)
Primary school net attendance ratio (% female, % male)
80, 78 (2008–2009)
2005 2006 2007 2008 2009 2010 2011
97 100 10091959597
0%
20%
40%
60%
80%
100%
To increase child survival, promote child development and prevent stunting, nutrition interventions need to be delivered during pregnancy and the first two years of life.
PREGNANCY BIRTH 0–5 MONTHS 6–23 MONTHS 24–59 MONTHS
Use of iron-folic acid supplements
Early initiation of breastfeeding(within 1 hour of birth)
International Code of Marketing of Breast-milk Substitutes
Maternity protection in accordance with ILO Convention 183
Minimum dietary diversity
Minimum acceptable diet
Full coverage of vitamin A supplementation
Treatment of severe acute malnutrition included in national health plans
Introduction to solid, semi-solid or soft foods (6–8 months)
Continued breastfeeding at 1 year old
Infants not weighed at birthHouseholds with adequately iodized salt
Exclusive breastfeeding(<6 months)
92%
86%
No
Yes
–
–
91%
Yes
51%60%
72%
53%
8%
Piped on premises Other improvedUnimproved Surface water
6
31
23
40
6
21
40
33
24
16
51
9
14
11
60
15
1
36
14
49
3
25
31
41
0%
20%
40%
60%
80%
100%
1990 2010Total Urban Rural
1990 2010 1990 2010
0%
20%
40%
60%
80%
100%
6155 58 53 49
1992DHS
1995MICS
1997DHS
2003–2004DHS
2008–2009DHS
0% 20% 40% 60% 80% 100%
Poorest 20%
RuralUrban
GirlsBoys
Second 20%Middle 20%Fourth 20%
Richest 20%
5551
4655
59
44
5853
47
0%
20%
40%
60%
80%
100%
52
1992DHS
1995MICS
1997DHS
2003–2004DHS
MDG 1: NO PROGRESS
3630
38 36
Neonatal 37%
HIV/AIDS 0%
Diarrhoea 10%
Measles 1%
Injuries 7%
Pneumonia 16%
Malaria 6%
Others 21%
Meningitis 2%
MADAGASCARMADAGASCAR
0%
20%
40%
60%
80%
100%
Non-pregnant women
Pregnant women
33 3850
Public health problemsevere
moderate
Preschool- aged children
Maternal mortality ratio, adjusted (per 100,000 live births)
240 (2010)
Maternal mortality ratio, reported(per 100,000 live births)
500 (2009)
Total number of maternal deaths 1,800 (2010)
Lifetime risk of maternal death (1 in : ) 81 (2010)
Women with low BMI (<18.5 kg/m2, %) 27 (2008–2009)
Anaemia, non-pregnant women (<120g/l, %) 33 (2008–2009)
Antenatal care (at least one visit, %) 86 (2009)
Antenatal care (at least four visits, %) 49 (2009)
Skilled attendant at birth (%) 44 (2009)
Low birthweight (<2,500 grams, %) 16 (2008–2009)
Women 20–24 years old who gave birth before age 18 (%)
36 (2009)
0%
20%
40%
60%
80%
100%
1995MICS
1997DHS
2000MICS
2003–2004DHS
1
73
52
75
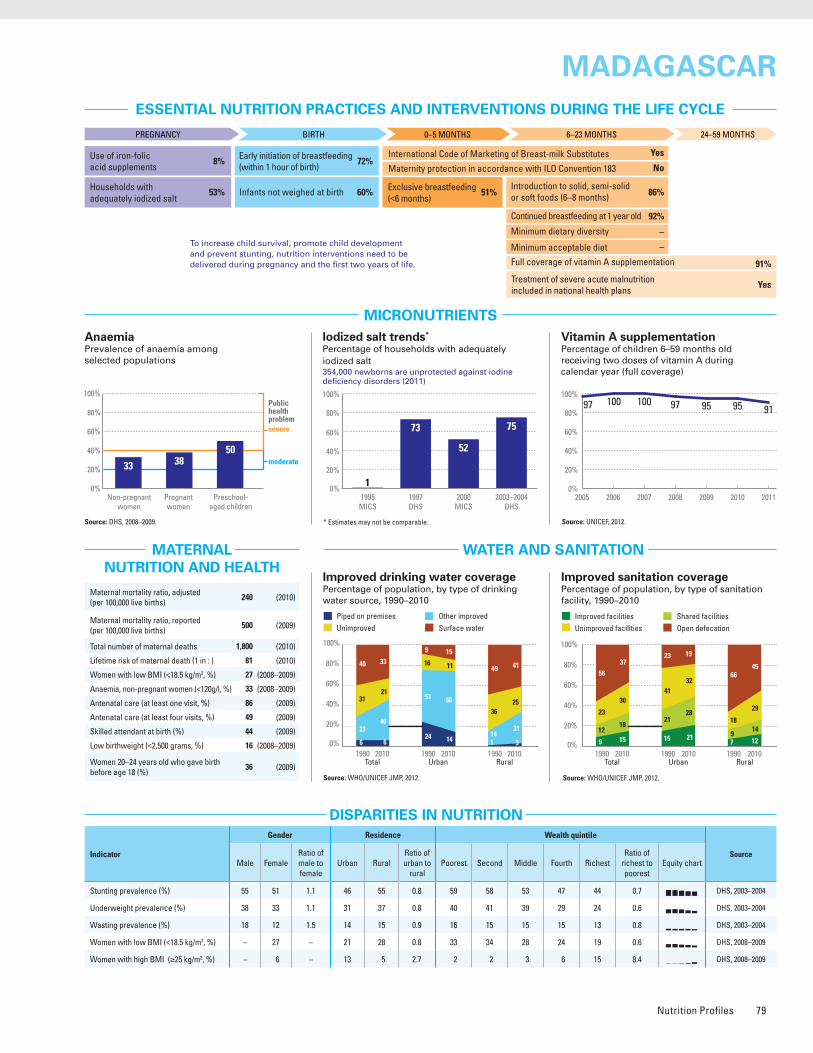
Nutrition Profiles 79
ESSENTIAL NUTRITION PRACTICES AND INTERVENTIONS DURING THE LIFE CYCLE
MICRONUTRIENTS
WATER AND SANITATION
Improved drinking water coveragePercentage of population, by type of drinking water source, 1990–2010
Source: WHO/UNICEF JMP, 2012.
Improved sanitation coveragePercentage of population, by type of sanitation facility, 1990–2010
Source: WHO/UNICEF JMP, 2012.
Vitamin A supplementationPercentage of children 6–59 months old receiving two doses of vitamin A during calendar year (full coverage)
* Estimates may not be comparable. Source: UNICEF, 2012.
MATERNAL NUTRITION AND HEALTH
DISPARITIES IN NUTRITION
Causes of under-five deaths, 2010Globally, undernutrition contributes to more than one third of child deaths
NUTRITIONAL STATUS
Stunting disparitiesPercentage of children <5 years old stunted, by selected background characteristics
DEMOGRAPHICS AND BACKGROUND INFORMATION
INFANT AND YOUNG CHILD FEEDING
Source: WHO/CHERG, 2012.
Under-five mortality rateDeaths per 1,000 live births
Source: IGME, 2012.AnaemiaPrevalence of anaemia among selected populations
Infant feeding practices, by ageExclusive breastfeeding trends Percentage of infants <6 months old exclusively breastfed
Breastfed and non-milk liquids
Breastfed and solid/semi-solid foods
Breastfed and plain water only
Breastfed and other milk/formula
Exclusively breastfed
Weaned (not breastfed)
Stunting trendsPercentage of children <5 years old stunted
Underweight trendsPercentage of children <5 years old underweight
Iodized salt trends*
Percentage of households with adequately iodized salt354,000 newborns are unprotected against iodine deficiency disorders (2011)
Source: DHS, 2003–2004.
Indicator
Gender Residence Wealth quintile
SourceMale Female
Ratio of male to female
Urban RuralRatio of urban to
ruralPoorest Second Middle Fourth Richest
Ratio of richest to poorest
Equity chart
Stunting prevalence (%) 55 51 1.1 46 55 0.8 59 58 53 47 44 0.7 DHS, 2003–2004
Underweight prevalence (%) 38 33 1.1 31 37 0.8 40 41 39 29 24 0.6 DHS, 2003–2004
Wasting prevalence (%) 18 12 1.5 14 15 0.9 16 15 15 15 13 0.8 DHS, 2003–2004
Women with low BMI (<18.5 kg/m2, %) – 27 – 21 28 0.8 33 34 28 24 19 0.6 DHS, 2008–2009
Women with high BMI (≥25 kg/m2, %) – 6 – 13 5 2.7 2 2 3 6 15 8.4 DHS, 2008–2009
Improved facilities Shared facilitiesUnimproved facilities Open defecation
9
23
12
56
15
30
18
37
15
41
21
23
21
32
28
19
7
18
9
66
12
29
14
45
0%
20%
40%
60%
80%
100%
1990 2010Total Urban Rural
1990 2010 1990 2010
Source: DHS, 2008–2009.
Source: DHS, 2008–2009.
0–1 2–3 4–5 6–7 8–9 10–11 12–13 14–15 16–17 18–19 20–21 22–23
Age (months)
0%
20%
40%
60%
80%
100%
3848
67
41
1992DHS
1997DHS
2000MICS
2008–2009DHS
0%
20%
40%
60%
80%
100%
51
2003–2004DHS
Stunted (under-fives, 000) 1,693
Wasted (under-fives, 000) –
Severely wasted (under-fives, 000) –
MDG 1 progress No progress
Underweight (under-fives, 000) 1,216
Overweight (under-fives, 000) –
Burden of malnutrition (2011)
Stunting country rank 15
Share of world stunting burden (%) 1
1990 1995 2000 2005 2010 2015
161
6254
0
30
60
90
120
150
180
MDG 4target
Total population (000) 21,315 (2011)
Total under-five population (000) 3,379 (2011)
Total number of births (000) 747 (2011)
Under-five mortality rate (per 1,000 live births) 62 (2011)
Total number of under-five deaths (000) 45 (2011)
Infant mortality rate (per 1,000 live births) 43 (2011)
Neonatal mortality rate (per 1,000 live births) 23 (2011)
HIV prevalence rate (15–49 years old, %) 0.3 (2011)
Population below international poverty line of US$1.25 per day (%)
81 (2010)
GNI per capita (US$) 430 (2011)
Primary school net attendance ratio (% female, % male)
80, 78 (2008–2009)
2005 2006 2007 2008 2009 2010 2011
97 100 10091959597
0%
20%
40%
60%
80%
100%
To increase child survival, promote child development and prevent stunting, nutrition interventions need to be delivered during pregnancy and the first two years of life.
PREGNANCY BIRTH 0–5 MONTHS 6–23 MONTHS 24–59 MONTHS
Use of iron-folic acid supplements
Early initiation of breastfeeding(within 1 hour of birth)
International Code of Marketing of Breast-milk Substitutes
Maternity protection in accordance with ILO Convention 183
Minimum dietary diversity
Minimum acceptable diet
Full coverage of vitamin A supplementation
Treatment of severe acute malnutrition included in national health plans
Introduction to solid, semi-solid or soft foods (6–8 months)
Continued breastfeeding at 1 year old
Infants not weighed at birthHouseholds with adequately iodized salt
Exclusive breastfeeding(<6 months)
92%
86%
No
Yes
–
–
91%
Yes
51%60%
72%
53%
8%
Piped on premises Other improvedUnimproved Surface water
6
31
23
40
6
21
40
33
24
16
51
9
14
11
60
15
1
36
14
49
3
25
31
41
0%
20%
40%
60%
80%
100%
1990 2010Total Urban Rural
1990 2010 1990 2010
0%
20%
40%
60%
80%
100%
6155 58 53 49
1992DHS
1995MICS
1997DHS
2003–2004DHS
2008–2009DHS
0% 20% 40% 60% 80% 100%
Poorest 20%
RuralUrban
GirlsBoys
Second 20%Middle 20%Fourth 20%
Richest 20%
5551
4655
59
44
5853
47
0%
20%
40%
60%
80%
100%
52
1992DHS
1995MICS
1997DHS
2003–2004DHS
MDG 1: NO PROGRESS
3630
38 36
Neonatal 37%
HIV/AIDS 0%
Diarrhoea 10%
Measles 1%
Injuries 7%
Pneumonia 16%
Malaria 6%
Others 21%
Meningitis 2%
MADAGASCARMADAGASCAR
0%
20%
40%
60%
80%
100%
Non-pregnant women
Pregnant women
33 3850
Public health problemsevere
moderate
Preschool- aged children
Maternal mortality ratio, adjusted (per 100,000 live births)
240 (2010)
Maternal mortality ratio, reported(per 100,000 live births)
500 (2009)
Total number of maternal deaths 1,800 (2010)
Lifetime risk of maternal death (1 in : ) 81 (2010)
Women with low BMI (<18.5 kg/m2, %) 27 (2008–2009)
Anaemia, non-pregnant women (<120g/l, %) 33 (2008–2009)
Antenatal care (at least one visit, %) 86 (2009)
Antenatal care (at least four visits, %) 49 (2009)
Skilled attendant at birth (%) 44 (2009)
Low birthweight (<2,500 grams, %) 16 (2008–2009)
Women 20–24 years old who gave birth before age 18 (%)
36 (2009)
0%
20%
40%
60%
80%
100%
1995MICS
1997DHS
2000MICS
2003–2004DHS
1
73
52
75
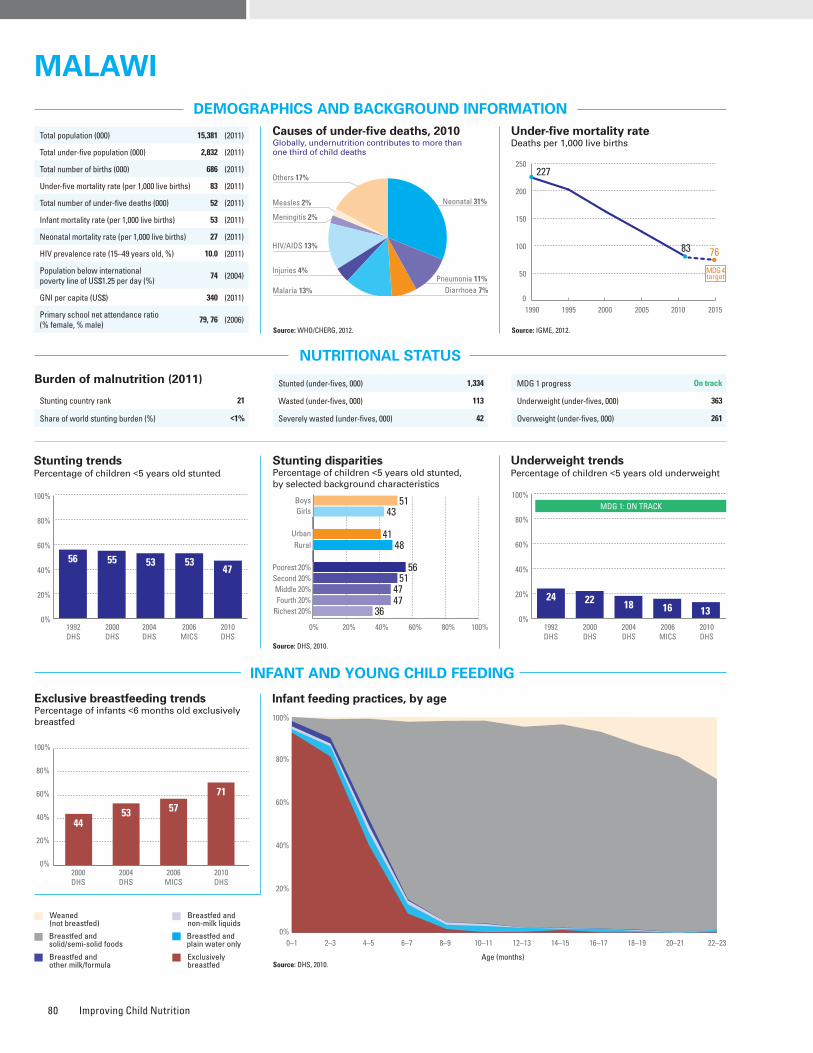
Improving Child Nutrition80
ESSENTIAL NUTRITION PRACTICES AND INTERVENTIONS DURING THE LIFE CYCLE
MICRONUTRIENTS
WATER AND SANITATION
Improved drinking water coveragePercentage of population, by type of drinking water source, 1990–2010
Source: WHO/UNICEF JMP, 2012.
Improved sanitation coveragePercentage of population, by type of sanitation facility, 1990–2010
Source: WHO/UNICEF JMP, 2012.
Vitamin A supplementationPercentage of children 6–59 months old receiving two doses of vitamin A during calendar year (full coverage)
* Estimates may not be comparable. Source: UNICEF, 2012.
MATERNAL NUTRITION AND HEALTH
DISPARITIES IN NUTRITION
Causes of under-five deaths, 2010Globally, undernutrition contributes to more than one third of child deaths
NUTRITIONAL STATUS
Stunting disparitiesPercentage of children <5 years old stunted, by selected background characteristics
DEMOGRAPHICS AND BACKGROUND INFORMATION
INFANT AND YOUNG CHILD FEEDING
Source: DHS, 2010.
Source: WHO/CHERG, 2012.
Under-five mortality rateDeaths per 1,000 live births
Source: IGME, 2012.AnaemiaPrevalence of anaemia among selected populations
Source: DHS, 2010.
Infant feeding practices, by ageExclusive breastfeeding trends Percentage of infants <6 months old exclusively breastfed
Breastfed and non-milk liquids
Breastfed and solid/semi-solid foods
Breastfed and plain water only
Breastfed and other milk/formula
Exclusively breastfed
Weaned (not breastfed)
Stunting trendsPercentage of children <5 years old stunted
Underweight trendsPercentage of children <5 years old underweight
Iodized salt trends*
Percentage of households with adequately iodized salt345,000 newborns are unprotected against iodine deficiency disorders (2011)
Indicator
Gender Residence Wealth quintile
SourceMale Female
Ratio of male to female
Urban RuralRatio of urban to
ruralPoorest Second Middle Fourth Richest
Ratio of richest to poorest
Equity chart
Stunting prevalence (%) 51 43 1.2 41 48 0.8 56 51 47 47 36 0.5 DHS, 2010
Underweight prevalence (%) 14 12 1.2 10 13 0.8 17 14 12 14 13 0.8 DHS, 2010
Wasting prevalence (%) 4 4 1.1 2 4 0.6 5 5 5 4 2 0.4 DHS, 2010
Women with low BMI (<18.5 kg/m2, %) – 9 – 7 9 0.8 10 10 9 8 7 0.7 DHS, 2010
Women with high BMI (≥25 kg/m2, %) – 17 – 28 14 2.0 9 13 13 16 29 3.2 DHS, 2010
Improved facilities Shared facilitiesUnimproved facilities Open defecation
39
6
24
31
51
8
33
8
48
5
43
4
49
5
44
2
38
6
22
34
51
9
30
10
0%
20%
40%
60%
80%
100%
1990 2010Total Urban Rural
1990 2010 1990 2010
2005 2006 2007 2008 2009 2010 2011
86 89 90 96969595
0%
20%
40%
60%
80%
100%
Source: DHS, 2010.
0–1 2–3 4–5 6–7 8–9 10–11 12–13 14–15 16–17 18–19 20–21 22–23
Age (months)
0%
20%
40%
60%
80%
100%
4453 57
71
2000DHS
2004DHS
2006MICS
2010DHS
0%
20%
40%
60%
80%
100%
Stunted (under-fives, 000) 1,334
Wasted (under-fives, 000) 113
Severely wasted (under-fives, 000) 42
MDG 1 progress On track
Underweight (under-fives, 000) 363
Overweight (under-fives, 000) 261
1990 1995 2000 2005 2010 2015
227
83 76
0
50
100
150
200
250
MDG 4target
Total population (000) 15,381 (2011)
Total under-five population (000) 2,832 (2011)
Total number of births (000) 686 (2011)
Under-five mortality rate (per 1,000 live births) 83 (2011)
Total number of under-five deaths (000) 52 (2011)
Infant mortality rate (per 1,000 live births) 53 (2011)
Neonatal mortality rate (per 1,000 live births) 27 (2011)
HIV prevalence rate (15–49 years old, %) 10.0 (2011)
Population below international poverty line of US$1.25 per day (%)
74 (2004)
GNI per capita (US$) 340 (2011)
Primary school net attendance ratio (% female, % male)
79, 76 (2006)
To increase child survival, promote child development and prevent stunting, nutrition interventions need to be delivered during pregnancy and the first two years of life.
PREGNANCY BIRTH 0–5 MONTHS 6–23 MONTHS 24–59 MONTHS
Use of iron-folic acid supplements
Early initiation of breastfeeding(within 1 hour of birth)
International Code of Marketing of Breast-milk Substitutes
Maternity protection in accordance with ILO Convention 183
Minimum dietary diversity
Minimum acceptable diet
Full coverage of vitamin A supplementation
Treatment of severe acute malnutrition included in national health plans
Introduction to solid, semi-solid or soft foods (6–8 months)
Continued breastfeeding at 1 year old
Infants not weighed at birthHouseholds with adequately iodized salt
Exclusive breastfeeding(<6 months)
96%
86%
No
Partial
29%
19%
96%
Yes
71%51%
58%
50%
32%
Piped on premises Other improvedUnimproved Surface water
7
41
34
18
7
14
76
3
42
5
49
4
28
5
67
0
2
45
33
20
2
16
78
4
0%
20%
40%
60%
80%
100%
1990 2010Total Urban Rural
1990 2010 1990 2010
0%
20%
40%
60%
80%
100%
56 55 53 5347
1992DHS
2000DHS
2004DHS
2006MICS
2010DHS
0% 20% 40% 60% 80% 100%
Poorest 20%
RuralUrban
GirlsBoys
Second 20%Middle 20%Fourth 20%
Richest 20%
5143
4148
56
36
514747
0%
20%
40%
60%
80%
100%
52
1992DHS
2000DHS
2004DHS
2006MICS
2010DHS
MDG 1: ON TRACK
24 22 18 16 13
Neonatal 31%
HIV/AIDS 13%
Diarrhoea 7%
Measles 2%
Injuries 4%Pneumonia 11%
Malaria 13%
Others 17%
Meningitis 2%
MALAWIMALAWI
0%
20%
40%
60%
80%
100%
Non-pregnant women
Pregnant women
2838
63
Public health problemsevere
moderate
Preschool- aged children
Maternal mortality ratio, adjusted (per 100,000 live births)
460 (2010)
Maternal mortality ratio, reported(per 100,000 live births)
680 (2010)
Total number of maternal deaths 3,000 (2010)
Lifetime risk of maternal death (1 in : ) 36 (2010)
Women with low BMI (<18.5 kg/m2, %) 9 (2010)
Anaemia, non-pregnant women (<120g/l, %) 28 (2010)
Antenatal care (at least one visit, %) 95 (2010)
Antenatal care (at least four visits, %) 46 (2010)
Skilled attendant at birth (%) 71 (2010)
Low birthweight (<2,500 grams, %) 13 (2006)
Women 20–24 years old who gave birth before age 18 (%)
35 (2010)
0%
20%
40%
60%
80%
100%
1995MICS
2000DHS
2006MICS
585049
Burden of malnutrition (2011)
Stunting country rank 21
Share of world stunting burden (%) <1%
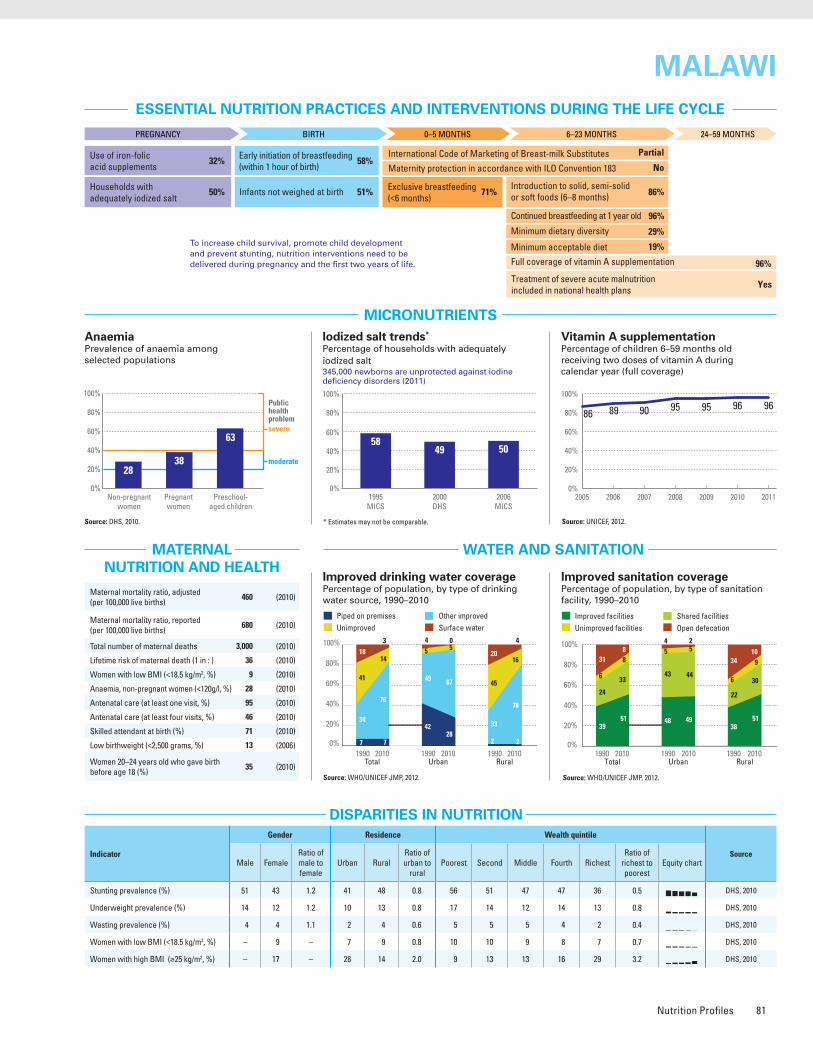
Nutrition Profiles 81
ESSENTIAL NUTRITION PRACTICES AND INTERVENTIONS DURING THE LIFE CYCLE
MICRONUTRIENTS
WATER AND SANITATION
Improved drinking water coveragePercentage of population, by type of drinking water source, 1990–2010
Source: WHO/UNICEF JMP, 2012.
Improved sanitation coveragePercentage of population, by type of sanitation facility, 1990–2010
Source: WHO/UNICEF JMP, 2012.
Vitamin A supplementationPercentage of children 6–59 months old receiving two doses of vitamin A during calendar year (full coverage)
* Estimates may not be comparable. Source: UNICEF, 2012.
MATERNAL NUTRITION AND HEALTH
DISPARITIES IN NUTRITION
Causes of under-five deaths, 2010Globally, undernutrition contributes to more than one third of child deaths
NUTRITIONAL STATUS
Stunting disparitiesPercentage of children <5 years old stunted, by selected background characteristics
DEMOGRAPHICS AND BACKGROUND INFORMATION
INFANT AND YOUNG CHILD FEEDING
Source: DHS, 2010.
Source: WHO/CHERG, 2012.
Under-five mortality rateDeaths per 1,000 live births
Source: IGME, 2012.AnaemiaPrevalence of anaemia among selected populations
Source: DHS, 2010.
Infant feeding practices, by ageExclusive breastfeeding trends Percentage of infants <6 months old exclusively breastfed
Breastfed and non-milk liquids
Breastfed and solid/semi-solid foods
Breastfed and plain water only
Breastfed and other milk/formula
Exclusively breastfed
Weaned (not breastfed)
Stunting trendsPercentage of children <5 years old stunted
Underweight trendsPercentage of children <5 years old underweight
Iodized salt trends*
Percentage of households with adequately iodized salt345,000 newborns are unprotected against iodine deficiency disorders (2011)
Indicator
Gender Residence Wealth quintile
SourceMale Female
Ratio of male to female
Urban RuralRatio of urban to
ruralPoorest Second Middle Fourth Richest
Ratio of richest to poorest
Equity chart
Stunting prevalence (%) 51 43 1.2 41 48 0.8 56 51 47 47 36 0.5 DHS, 2010
Underweight prevalence (%) 14 12 1.2 10 13 0.8 17 14 12 14 13 0.8 DHS, 2010
Wasting prevalence (%) 4 4 1.1 2 4 0.6 5 5 5 4 2 0.4 DHS, 2010
Women with low BMI (<18.5 kg/m2, %) – 9 – 7 9 0.8 10 10 9 8 7 0.7 DHS, 2010
Women with high BMI (≥25 kg/m2, %) – 17 – 28 14 2.0 9 13 13 16 29 3.2 DHS, 2010
Improved facilities Shared facilitiesUnimproved facilities Open defecation
39
6
24
31
51
8
33
8
48
5
43
4
49
5
44
2
38
6
22
34
51
9
30
10
0%
20%
40%
60%
80%
100%
1990 2010Total Urban Rural
1990 2010 1990 2010
2005 2006 2007 2008 2009 2010 2011
86 89 90 96969595
0%
20%
40%
60%
80%
100%
Source: DHS, 2010.
0–1 2–3 4–5 6–7 8–9 10–11 12–13 14–15 16–17 18–19 20–21 22–23
Age (months)
0%
20%
40%
60%
80%
100%
4453 57
71
2000DHS
2004DHS
2006MICS
2010DHS
0%
20%
40%
60%
80%
100%
Stunted (under-fives, 000) 1,334
Wasted (under-fives, 000) 113
Severely wasted (under-fives, 000) 42
MDG 1 progress On track
Underweight (under-fives, 000) 363
Overweight (under-fives, 000) 261
1990 1995 2000 2005 2010 2015
227
83 76
0
50
100
150
200
250
MDG 4target
Total population (000) 15,381 (2011)
Total under-five population (000) 2,832 (2011)
Total number of births (000) 686 (2011)
Under-five mortality rate (per 1,000 live births) 83 (2011)
Total number of under-five deaths (000) 52 (2011)
Infant mortality rate (per 1,000 live births) 53 (2011)
Neonatal mortality rate (per 1,000 live births) 27 (2011)
HIV prevalence rate (15–49 years old, %) 10.0 (2011)
Population below international poverty line of US$1.25 per day (%)
74 (2004)
GNI per capita (US$) 340 (2011)
Primary school net attendance ratio (% female, % male)
79, 76 (2006)
To increase child survival, promote child development and prevent stunting, nutrition interventions need to be delivered during pregnancy and the first two years of life.
PREGNANCY BIRTH 0–5 MONTHS 6–23 MONTHS 24–59 MONTHS
Use of iron-folic acid supplements
Early initiation of breastfeeding(within 1 hour of birth)
International Code of Marketing of Breast-milk Substitutes
Maternity protection in accordance with ILO Convention 183
Minimum dietary diversity
Minimum acceptable diet
Full coverage of vitamin A supplementation
Treatment of severe acute malnutrition included in national health plans
Introduction to solid, semi-solid or soft foods (6–8 months)
Continued breastfeeding at 1 year old
Infants not weighed at birthHouseholds with adequately iodized salt
Exclusive breastfeeding(<6 months)
96%
86%
No
Partial
29%
19%
96%
Yes
71%51%
58%
50%
32%
Piped on premises Other improvedUnimproved Surface water
7
41
34
18
7
14
76
3
42
5
49
4
28
5
67
0
2
45
33
20
2
16
78
4
0%
20%
40%
60%
80%
100%
1990 2010Total Urban Rural
1990 2010 1990 2010
0%
20%
40%
60%
80%
100%
56 55 53 5347
1992DHS
2000DHS
2004DHS
2006MICS
2010DHS
0% 20% 40% 60% 80% 100%
Poorest 20%
RuralUrban
GirlsBoys
Second 20%Middle 20%Fourth 20%
Richest 20%
5143
4148
56
36
514747
0%
20%
40%
60%
80%
100%
52
1992DHS
2000DHS
2004DHS
2006MICS
2010DHS
MDG 1: ON TRACK
24 22 18 16 13
Neonatal 31%
HIV/AIDS 13%
Diarrhoea 7%
Measles 2%
Injuries 4%Pneumonia 11%
Malaria 13%
Others 17%
Meningitis 2%
MALAWIMALAWI
0%
20%
40%
60%
80%
100%
Non-pregnant women
Pregnant women
2838
63
Public health problemsevere
moderate
Preschool- aged children
Maternal mortality ratio, adjusted (per 100,000 live births)
460 (2010)
Maternal mortality ratio, reported(per 100,000 live births)
680 (2010)
Total number of maternal deaths 3,000 (2010)
Lifetime risk of maternal death (1 in : ) 36 (2010)
Women with low BMI (<18.5 kg/m2, %) 9 (2010)
Anaemia, non-pregnant women (<120g/l, %) 28 (2010)
Antenatal care (at least one visit, %) 95 (2010)
Antenatal care (at least four visits, %) 46 (2010)
Skilled attendant at birth (%) 71 (2010)
Low birthweight (<2,500 grams, %) 13 (2006)
Women 20–24 years old who gave birth before age 18 (%)
35 (2010)
0%
20%
40%
60%
80%
100%
1995MICS
2000DHS
2006MICS
585049
Burden of malnutrition (2011)
Stunting country rank 21
Share of world stunting burden (%) <1%
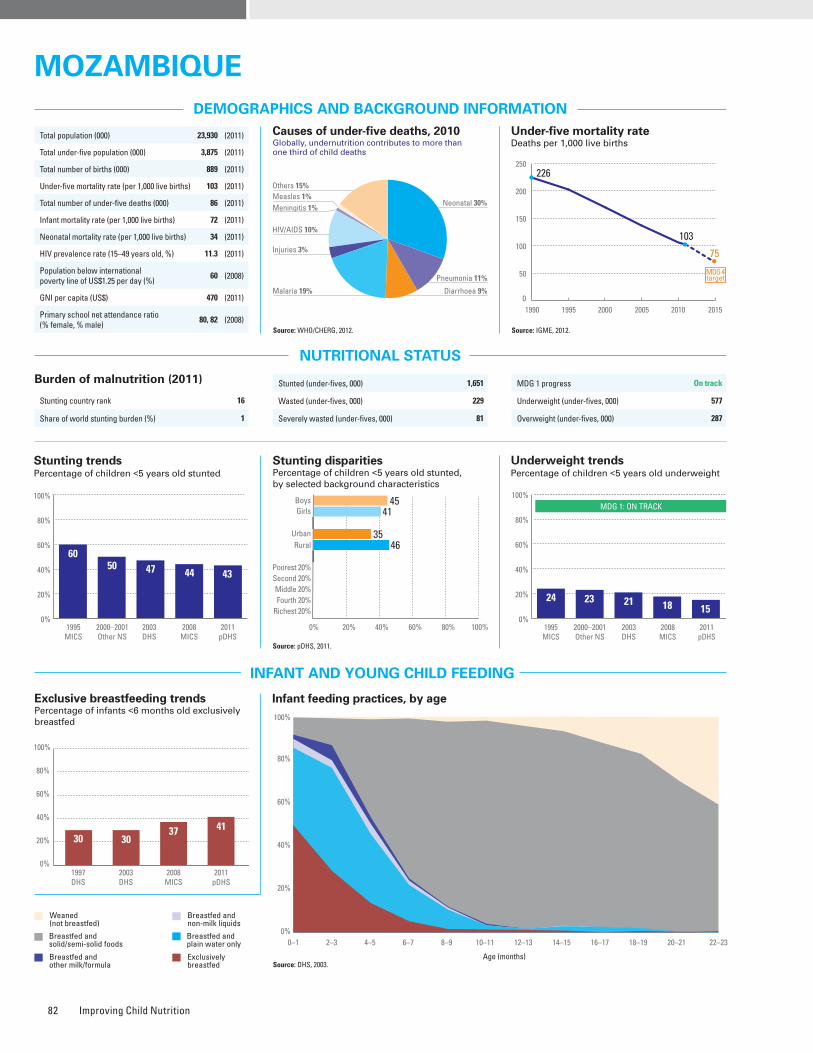
Improving Child Nutrition82
ESSENTIAL NUTRITION PRACTICES AND INTERVENTIONS DURING THE LIFE CYCLE
MICRONUTRIENTS
WATER AND SANITATION
Improved drinking water coveragePercentage of population, by type of drinking water source, 1990–2010
Source: WHO/UNICEF JMP, 2012.
Improved sanitation coveragePercentage of population, by type of sanitation facility, 1990–2010
Source: WHO/UNICEF JMP, 2012.
Vitamin A supplementationPercentage of children 6–59 months old receiving two doses of vitamin A during calendar year (full coverage)
* Estimates may not be comparable. Source: UNICEF, 2012.
MATERNAL NUTRITION AND HEALTH
DISPARITIES IN NUTRITION
Causes of under-five deaths, 2010Globally, undernutrition contributes to more than one third of child deaths
NUTRITIONAL STATUS
Stunting disparitiesPercentage of children <5 years old stunted, by selected background characteristics
DEMOGRAPHICS AND BACKGROUND INFORMATION
INFANT AND YOUNG CHILD FEEDING
Source: WHO/CHERG, 2012.
Under-five mortality rateDeaths per 1,000 live births
Source: IGME, 2012.AnaemiaPrevalence of anaemia among selected populations
Infant feeding practices, by ageExclusive breastfeeding trends Percentage of infants <6 months old exclusively breastfed
Breastfed and non-milk liquids
Breastfed and solid/semi-solid foods
Breastfed and plain water only
Breastfed and other milk/formula
Exclusively breastfed
Weaned (not breastfed)
Stunting trendsPercentage of children <5 years old stunted
Underweight trendsPercentage of children <5 years old underweight
Iodized salt trends*
Percentage of households with adequately iodized salt666,000 newborns are unprotected against iodine deficiency disorders (2011)
Source: pDHS, 2011.
Indicator
Gender Residence Wealth quintile
SourceMale Female
Ratio of male to female
Urban RuralRatio of urban to
ruralPoorest Second Middle Fourth Richest
Ratio of richest to poorest
Equity chart
Stunting prevalence (%) 45 41 1.1 35 46 0.8 – – – – – – pDHS, 2011
Underweight prevalence (%) 17 13 1.3 10 17 0.6 – – – – – – pDHS, 2011
Wasting prevalence (%) 6 5 1.2 4 7 0.6 – – – – – – pDHS, 2011
Women with low BMI (<18.5 kg/m2, %) – – – – – – – – – – – – –
Women with high BMI (≥25 kg/m2, %) – – – – – – – – – – – – –
Improved facilities Shared facilitiesUnimproved facilities Open defecation
11
22
2
65
18
37
4
41
36
26
7
31
38
41
8
13
4
21
1
74
5
36
1
58
0%
20%
40%
60%
80%
100%
1990 2010Total Urban Rural
1990 2010 1990 2010
2005 2006 2007 2008 2009 2010 2011
32 3342
10010097
83
0%
20%
40%
60%
80%
100%
Source: DHS, 2003.
0–1 2–3 4–5 6–7 8–9 10–11 12–13 14–15 16–17 18–19 20–21 22–23
Age (months)
0%
20%
40%
60%
80%
100%
30 3037 41
1997DHS
2003DHS
2008MICS
2011pDHS
0%
20%
40%
60%
80%
100%
Stunted (under-fives, 000) 1,651
Wasted (under-fives, 000) 229
Severely wasted (under-fives, 000) 81
MDG 1 progress On track
Underweight (under-fives, 000) 577
Overweight (under-fives, 000) 287
Total population (000) 23,930 (2011)
Total under-five population (000) 3,875 (2011)
Total number of births (000) 889 (2011)
Under-five mortality rate (per 1,000 live births) 103 (2011)
Total number of under-five deaths (000) 86 (2011)
Infant mortality rate (per 1,000 live births) 72 (2011)
Neonatal mortality rate (per 1,000 live births) 34 (2011)
HIV prevalence rate (15–49 years old, %) 11.3 (2011)
Population below international poverty line of US$1.25 per day (%)
60 (2008)
GNI per capita (US$) 470 (2011)
Primary school net attendance ratio (% female, % male)
80, 82 (2008)1990 1995 2000 2005 2010 2015
226
103
75
0
50
100
150
200
250
MDG 4target
To increase child survival, promote child development and prevent stunting, nutrition interventions need to be delivered during pregnancy and the first two years of life.
PREGNANCY BIRTH 0–5 MONTHS 6–23 MONTHS 24–59 MONTHS
Use of iron-folic acid supplements
Early initiation of breastfeeding(within 1 hour of birth)
International Code of Marketing of Breast-milk Substitutes
Maternity protection in accordance with ILO Convention 183
Minimum dietary diversity
Minimum acceptable diet
Full coverage of vitamin A supplementation
Treatment of severe acute malnutrition included in national health plans
Introduction to solid, semi-solid or soft foods (6–8 months)
Continued breastfeeding at 1 year old
Infants not weighed at birthHouseholds with adequately iodized salt
Exclusive breastfeeding(<6 months)
91%
86%
No
Yes
–
–
100%
Yes
41%42%
63%
25%
–
Piped on premises Other improvedUnimproved Surface water
5
37
31
27
8
42
39
11
22
24
51
3
19
19
58
4
1
41
25
33
1
55
28
16
0%
20%
40%
60%
80%
100%
1990 2010Total Urban Rural
1990 2010 1990 2010
0%
20%
40%
60%
80%
100%
6050 47 44 43
1995MICS
2000–2001Other NS
2003DHS
2008MICS
2011pDHS
0% 20% 40% 60% 80% 100%
Poorest 20%
RuralUrban
GirlsBoys
Second 20%Middle 20%Fourth 20%
Richest 20%
4541
3546
0%
20%
40%
60%
80%
100%
52
1995MICS
2000–2001Other NS
2003DHS
2008MICS
2011pDHS
MDG 1: ON TRACK
24 23 21 18 15
Neonatal 30%
HIV/AIDS 10%
Diarrhoea 9%
Measles 1%
Injuries 3%
Pneumonia 11%
Malaria 19%
Others 15%
Meningitis 1%
MozaMbIqueMozaMbIque
No DaTa
Maternal mortality ratio, adjusted (per 100,000 live births)
490 (2010)
Maternal mortality ratio, reported(per 100,000 live births)
500 (2008)
Total number of maternal deaths 4,300 (2010)
Lifetime risk of maternal death (1 in : ) 43 (2010)
Women with low BMI (<18.5 kg/m2, %) – –
Anaemia, non-pregnant women (<120g/l, %) – –
Antenatal care (at least one visit, %) 92 (2008)
Antenatal care (at least four visits, %) – –
Skilled attendant at birth (%) 55 (2008)
Low birthweight (<2,500 grams, %) 16 (2008)
Women 20–24 years old who gave birth before age 18 (%)
42 (2003)
0%
20%
40%
60%
80%
100%
1995MICS
2003DHS
2008MICS
62
25
54
burden of malnutrition (2011)
Stunting country rank 16
Share of world stunting burden (%) 1
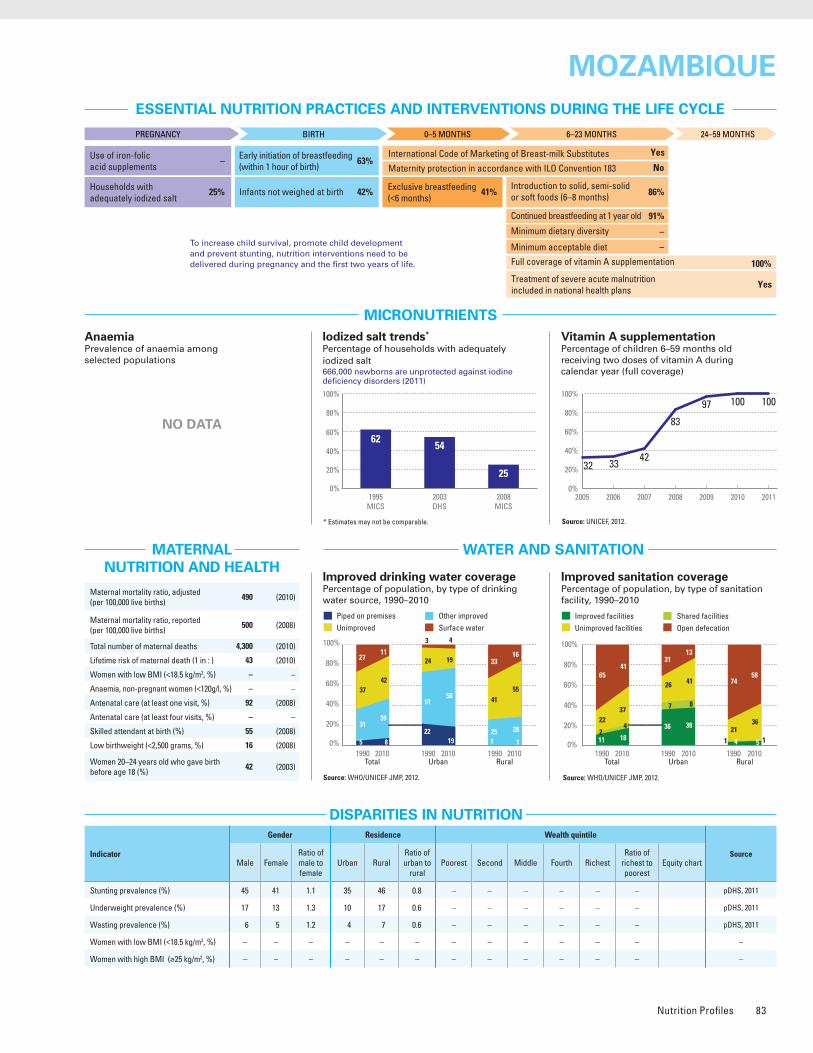
Nutrition Profiles 83
ESSENTIAL NUTRITION PRACTICES AND INTERVENTIONS DURING THE LIFE CYCLE
MICRONUTRIENTS
WATER AND SANITATION
Improved drinking water coveragePercentage of population, by type of drinking water source, 1990–2010
Source: WHO/UNICEF JMP, 2012.
Improved sanitation coveragePercentage of population, by type of sanitation facility, 1990–2010
Source: WHO/UNICEF JMP, 2012.
Vitamin A supplementationPercentage of children 6–59 months old receiving two doses of vitamin A during calendar year (full coverage)
* Estimates may not be comparable. Source: UNICEF, 2012.
MATERNAL NUTRITION AND HEALTH
DISPARITIES IN NUTRITION
Causes of under-five deaths, 2010Globally, undernutrition contributes to more than one third of child deaths
NUTRITIONAL STATUS
Stunting disparitiesPercentage of children <5 years old stunted, by selected background characteristics
DEMOGRAPHICS AND BACKGROUND INFORMATION
INFANT AND YOUNG CHILD FEEDING
Source: WHO/CHERG, 2012.
Under-five mortality rateDeaths per 1,000 live births
Source: IGME, 2012.AnaemiaPrevalence of anaemia among selected populations
Infant feeding practices, by ageExclusive breastfeeding trends Percentage of infants <6 months old exclusively breastfed
Breastfed and non-milk liquids
Breastfed and solid/semi-solid foods
Breastfed and plain water only
Breastfed and other milk/formula
Exclusively breastfed
Weaned (not breastfed)
Stunting trendsPercentage of children <5 years old stunted
Underweight trendsPercentage of children <5 years old underweight
Iodized salt trends*
Percentage of households with adequately iodized salt666,000 newborns are unprotected against iodine deficiency disorders (2011)
Source: pDHS, 2011.
Indicator
Gender Residence Wealth quintile
SourceMale Female
Ratio of male to female
Urban RuralRatio of urban to
ruralPoorest Second Middle Fourth Richest
Ratio of richest to poorest
Equity chart
Stunting prevalence (%) 45 41 1.1 35 46 0.8 – – – – – – pDHS, 2011
Underweight prevalence (%) 17 13 1.3 10 17 0.6 – – – – – – pDHS, 2011
Wasting prevalence (%) 6 5 1.2 4 7 0.6 – – – – – – pDHS, 2011
Women with low BMI (<18.5 kg/m2, %) – – – – – – – – – – – – –
Women with high BMI (≥25 kg/m2, %) – – – – – – – – – – – – –
Improved facilities Shared facilitiesUnimproved facilities Open defecation
11
22
2
65
18
37
4
41
36
26
7
31
38
41
8
13
4
21
1
74
5
36
1
58
0%
20%
40%
60%
80%
100%
1990 2010Total Urban Rural
1990 2010 1990 2010
2005 2006 2007 2008 2009 2010 2011
32 3342
10010097
83
0%
20%
40%
60%
80%
100%
Source: DHS, 2003.
0–1 2–3 4–5 6–7 8–9 10–11 12–13 14–15 16–17 18–19 20–21 22–23
Age (months)
0%
20%
40%
60%
80%
100%
30 3037 41
1997DHS
2003DHS
2008MICS
2011pDHS
0%
20%
40%
60%
80%
100%
Stunted (under-fives, 000) 1,651
Wasted (under-fives, 000) 229
Severely wasted (under-fives, 000) 81
MDG 1 progress On track
Underweight (under-fives, 000) 577
Overweight (under-fives, 000) 287
Total population (000) 23,930 (2011)
Total under-five population (000) 3,875 (2011)
Total number of births (000) 889 (2011)
Under-five mortality rate (per 1,000 live births) 103 (2011)
Total number of under-five deaths (000) 86 (2011)
Infant mortality rate (per 1,000 live births) 72 (2011)
Neonatal mortality rate (per 1,000 live births) 34 (2011)
HIV prevalence rate (15–49 years old, %) 11.3 (2011)
Population below international poverty line of US$1.25 per day (%)
60 (2008)
GNI per capita (US$) 470 (2011)
Primary school net attendance ratio (% female, % male)
80, 82 (2008)1990 1995 2000 2005 2010 2015
226
103
75
0
50
100
150
200
250
MDG 4target
To increase child survival, promote child development and prevent stunting, nutrition interventions need to be delivered during pregnancy and the first two years of life.
PREGNANCY BIRTH 0–5 MONTHS 6–23 MONTHS 24–59 MONTHS
Use of iron-folic acid supplements
Early initiation of breastfeeding(within 1 hour of birth)
International Code of Marketing of Breast-milk Substitutes
Maternity protection in accordance with ILO Convention 183
Minimum dietary diversity
Minimum acceptable diet
Full coverage of vitamin A supplementation
Treatment of severe acute malnutrition included in national health plans
Introduction to solid, semi-solid or soft foods (6–8 months)
Continued breastfeeding at 1 year old
Infants not weighed at birthHouseholds with adequately iodized salt
Exclusive breastfeeding(<6 months)
91%
86%
No
Yes
–
–
100%
Yes
41%42%
63%
25%
–
Piped on premises Other improvedUnimproved Surface water
5
37
31
27
8
42
39
11
22
24
51
3
19
19
58
4
1
41
25
33
1
55
28
16
0%
20%
40%
60%
80%
100%
1990 2010Total Urban Rural
1990 2010 1990 2010
0%
20%
40%
60%
80%
100%
6050 47 44 43
1995MICS
2000–2001Other NS
2003DHS
2008MICS
2011pDHS
0% 20% 40% 60% 80% 100%
Poorest 20%
RuralUrban
GirlsBoys
Second 20%Middle 20%Fourth 20%
Richest 20%
4541
3546
0%
20%
40%
60%
80%
100%
52
1995MICS
2000–2001Other NS
2003DHS
2008MICS
2011pDHS
MDG 1: ON TRACK
24 23 21 18 15
Neonatal 30%
HIV/AIDS 10%
Diarrhoea 9%
Measles 1%
Injuries 3%
Pneumonia 11%
Malaria 19%
Others 15%
Meningitis 1%
MozaMbIqueMozaMbIque
No DaTa
Maternal mortality ratio, adjusted (per 100,000 live births)
490 (2010)
Maternal mortality ratio, reported(per 100,000 live births)
500 (2008)
Total number of maternal deaths 4,300 (2010)
Lifetime risk of maternal death (1 in : ) 43 (2010)
Women with low BMI (<18.5 kg/m2, %) – –
Anaemia, non-pregnant women (<120g/l, %) – –
Antenatal care (at least one visit, %) 92 (2008)
Antenatal care (at least four visits, %) – –
Skilled attendant at birth (%) 55 (2008)
Low birthweight (<2,500 grams, %) 16 (2008)
Women 20–24 years old who gave birth before age 18 (%)
42 (2003)
0%
20%
40%
60%
80%
100%
1995MICS
2003DHS
2008MICS
62
25
54
burden of malnutrition (2011)
Stunting country rank 16
Share of world stunting burden (%) 1
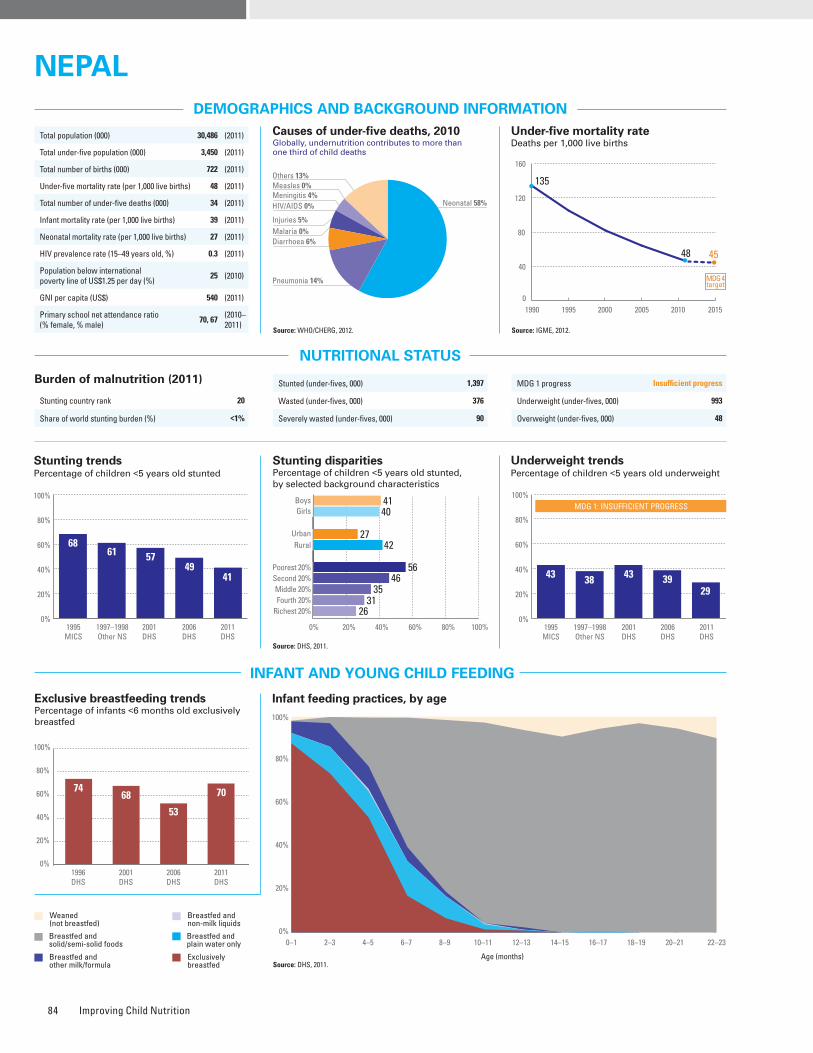
Improving Child Nutrition84
ESSENTIAL NUTRITION PRACTICES AND INTERVENTIONS DURING THE LIFE CYCLE
MICRONUTRIENTS
WATER AND SANITATION
Improved drinking water coveragePercentage of population, by type of drinking water source, 1990–2010
Source: WHO/UNICEF JMP, 2012.
Improved sanitation coveragePercentage of population, by type of sanitation facility, 1990–2010
Source: WHO/UNICEF JMP, 2012.
Vitamin A supplementationPercentage of children 6–59 months old receiving two doses of vitamin A during calendar year (full coverage)
* Estimates may not be comparable. Source: UNICEF, 2012.
MATERNAL NUTRITION AND HEALTH
DISPARITIES IN NUTRITION
Source: DHS, 2011.
Causes of under-five deaths, 2010Globally, undernutrition contributes to more than one third of child deaths
NUTRITIONAL STATUS
Stunting disparitiesPercentage of children <5 years old stunted, by selected background characteristics
DEMOGRAPHICS AND BACKGROUND INFORMATION
INFANT AND YOUNG CHILD FEEDING
Source: WHO/CHERG, 2012.
Under-five mortality rateDeaths per 1,000 live births
Source: IGME, 2012.AnaemiaPrevalence of anaemia among selected populations
Infant feeding practices, by ageExclusive breastfeeding trends Percentage of infants <6 months old exclusively breastfed
Breastfed and non-milk liquids
Breastfed and solid/semi-solid foods
Breastfed and plain water only
Breastfed and other milk/formula
Exclusively breastfed
Weaned (not breastfed)
Stunting trendsPercentage of children <5 years old stunted
Underweight trendsPercentage of children <5 years old underweight
Source: DHS, 2011.
Iodized salt trends*
Percentage of households with adequately iodized salt144,000 newborns are unprotected against iodine deficiency disorders (2011)
Indicator
Gender Residence Wealth quintile
SourceMale Female
Ratio of male to female
Urban RuralRatio of urban to
ruralPoorest Second Middle Fourth Richest
Ratio of richest to poorest
Equity chart
Stunting prevalence (%) 41 40 1.0 27 42 0.6 56 46 35 31 26 0.5 DHS, 2011
Underweight prevalence (%) 30 28 1.1 17 30 0.6 40 32 29 23 10 0.3 DHS, 2011
Wasting prevalence (%) 12 10 1.2 8 11 0.7 13 11 13 9 7 0.6 DHS, 2011
Women with low BMI (<18.5 kg/m2, %) – 18 – 14 19 0.8 22 21 22 17 12 0.6 DHS, 2011
Women with high BMI (≥25 kg/m2, %) – 14 – 26 11 2.3 3 6 9 15 30 9.8 DHS, 2011
Improved facilities Shared facilitiesUnimproved facilities Open defecation
10
64
80
31
6
14
49
37
5
28
30
48
3
36
13
7
62
85
27
79
57
0%
20%
40%
60%
80%
100%
1990 2010Total Urban Rural
1990 2010 1990 2010
2005 2006 2007 2008 2009 2010 2011
96 95 95 91919593
0%
20%
40%
60%
80%
100%
Source: DHS, 2011.
0–1 2–3 4–5 6–7 8–9 10–11 12–13 14–15 16–17 18–19 20–21 22–23
Age (months)
0%
20%
40%
60%
80%
100%
7468
53
70
1996DHS
2001DHS
2006DHS
2011DHS
0%
20%
40%
60%
80%
100%
Stunted (under-fives, 000) 1,397
Wasted (under-fives, 000) 376
Severely wasted (under-fives, 000) 90
MDG 1 progress Insufficient progress
Underweight (under-fives, 000) 993
Overweight (under-fives, 000) 48
1990 1995 2000 2005 2010 2015
135
48 45
0
40
80
120
160
MDG 4target
Total population (000) 30,486 (2011)
Total under-five population (000) 3,450 (2011)
Total number of births (000) 722 (2011)
Under-five mortality rate (per 1,000 live births) 48 (2011)
Total number of under-five deaths (000) 34 (2011)
Infant mortality rate (per 1,000 live births) 39 (2011)
Neonatal mortality rate (per 1,000 live births) 27 (2011)
HIV prevalence rate (15–49 years old, %) 0.3 (2011)
Population below international poverty line of US$1.25 per day (%)
25 (2010)
GNI per capita (US$) 540 (2011)
Primary school net attendance ratio (% female, % male)
70, 67 (2010–2011)
To increase child survival, promote child development and prevent stunting, nutrition interventions need to be delivered during pregnancy and the first two years of life.
PREGNANCY BIRTH 0–5 MONTHS 6–23 MONTHS 24–59 MONTHS
Use of iron-folic acid supplements
Early initiation of breastfeeding(within 1 hour of birth)
International Code of Marketing of Breast-milk Substitutes
Maternity protection in accordance with ILO Convention 183
Minimum dietary diversity
Minimum acceptable diet
Full coverage of vitamin A supplementation
Treatment of severe acute malnutrition included in national health plans
Introduction to solid, semi-solid or soft foods (6–8 months)
Continued breastfeeding at 1 year old
Infants not weighed at birthHouseholds with adequately iodized salt
Exclusive breastfeeding(<6 months)
93%
66%
No
Yes
29%
24%
91%
Yes
70%64%
45%
80%
56%
Piped on premises Other improvedUnimproved Surface water
8
12
68
12
18
6
71
5
43
2
53
2
53
4
40
3
5
13
69
13
10
6
78
6
0%
20%
40%
60%
80%
100%
1990 2010Total Urban Rural
1990 2010 1990 2010
0%
20%
40%
60%
80%
100%
6861 57
4941
1995MICS
1997–1998Other NS
2001DHS
2006DHS
2011DHS
0% 20% 40% 60% 80% 100%
Poorest 20%
RuralUrban
GirlsBoys
Second 20%Middle 20%Fourth 20%
Richest 20%
4140
2742
56
26
4635
31
0%
20%
40%
60%
80%
100%
52
1995MICS
1997–1998Other NS
2001DHS
2006DHS
2011DHS
MDG 1: INSUFFICIENT PROGRESS
43 38 43 3929
Neonatal 58%HIV/AIDS 0%
Diarrhoea 6%
Measles 0%
Injuries 5%
Pneumonia 14%
Malaria 0%
Others 13%
Meningitis 4%
NEPALNEPAL
0%
20%
40%
60%
80%
100%
Non-pregnant women
Pregnant women
48 46
Public health problemsevere
moderate
Preschool- aged children
33
Maternal mortality ratio, adjusted (per 100,000 live births)
170 (2010)
Maternal mortality ratio, reported(per 100,000 live births)
280 (2005)
Total number of maternal deaths 1,200 (2010)
Lifetime risk of maternal death (1 in : ) 190 (2010)
Women with low BMI (<18.5 kg/m2, %) 18 (2011)
Anaemia, non-pregnant women (<120g/l, %) 33 (2011)
Antenatal care (at least one visit, %) 58 (2011)
Antenatal care (at least four visits, %) 50 (2011)
Skilled attendant at birth (%) 36 (2011)
Low birthweight (<2,500 grams, %) 18 (2011)
Women 20–24 years old who gave birth before age 18 (%)
19 (2011)
0%
20%
40%
60%
80%
100%
1996DHS
1998Other NS
2000Other NS
2011DHS
93
5563
80
Burden of malnutrition (2011)
Stunting country rank 20
Share of world stunting burden (%) <1%
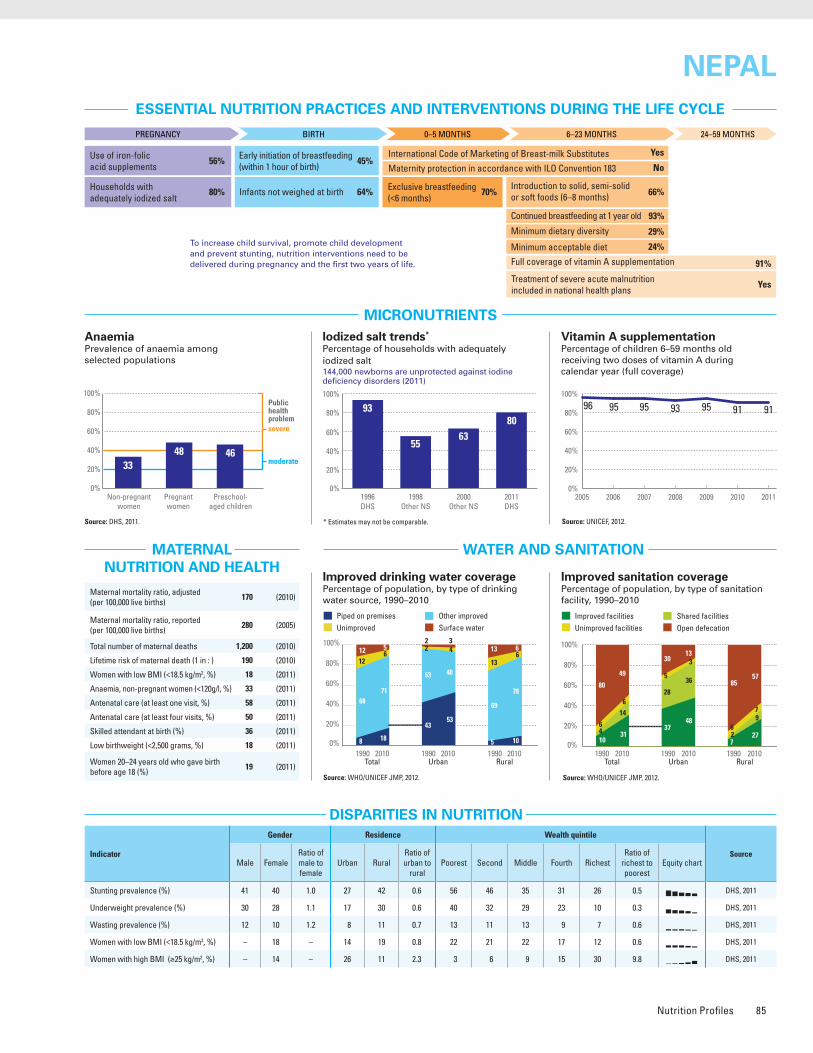
Nutrition Profiles 85
ESSENTIAL NUTRITION PRACTICES AND INTERVENTIONS DURING THE LIFE CYCLE
MICRONUTRIENTS
WATER AND SANITATION
Improved drinking water coveragePercentage of population, by type of drinking water source, 1990–2010
Source: WHO/UNICEF JMP, 2012.
Improved sanitation coveragePercentage of population, by type of sanitation facility, 1990–2010
Source: WHO/UNICEF JMP, 2012.
Vitamin A supplementationPercentage of children 6–59 months old receiving two doses of vitamin A during calendar year (full coverage)
* Estimates may not be comparable. Source: UNICEF, 2012.
MATERNAL NUTRITION AND HEALTH
DISPARITIES IN NUTRITION
Source: DHS, 2011.
Causes of under-five deaths, 2010Globally, undernutrition contributes to more than one third of child deaths
NUTRITIONAL STATUS
Stunting disparitiesPercentage of children <5 years old stunted, by selected background characteristics
DEMOGRAPHICS AND BACKGROUND INFORMATION
INFANT AND YOUNG CHILD FEEDING
Source: WHO/CHERG, 2012.
Under-five mortality rateDeaths per 1,000 live births
Source: IGME, 2012.AnaemiaPrevalence of anaemia among selected populations
Infant feeding practices, by ageExclusive breastfeeding trends Percentage of infants <6 months old exclusively breastfed
Breastfed and non-milk liquids
Breastfed and solid/semi-solid foods
Breastfed and plain water only
Breastfed and other milk/formula
Exclusively breastfed
Weaned (not breastfed)
Stunting trendsPercentage of children <5 years old stunted
Underweight trendsPercentage of children <5 years old underweight
Source: DHS, 2011.
Iodized salt trends*
Percentage of households with adequately iodized salt144,000 newborns are unprotected against iodine deficiency disorders (2011)
Indicator
Gender Residence Wealth quintile
SourceMale Female
Ratio of male to female
Urban RuralRatio of urban to
ruralPoorest Second Middle Fourth Richest
Ratio of richest to poorest
Equity chart
Stunting prevalence (%) 41 40 1.0 27 42 0.6 56 46 35 31 26 0.5 DHS, 2011
Underweight prevalence (%) 30 28 1.1 17 30 0.6 40 32 29 23 10 0.3 DHS, 2011
Wasting prevalence (%) 12 10 1.2 8 11 0.7 13 11 13 9 7 0.6 DHS, 2011
Women with low BMI (<18.5 kg/m2, %) – 18 – 14 19 0.8 22 21 22 17 12 0.6 DHS, 2011
Women with high BMI (≥25 kg/m2, %) – 14 – 26 11 2.3 3 6 9 15 30 9.8 DHS, 2011
Improved facilities Shared facilitiesUnimproved facilities Open defecation
10
64
80
31
6
14
49
37
5
28
30
48
3
36
13
7
62
85
27
79
57
0%
20%
40%
60%
80%
100%
1990 2010Total Urban Rural
1990 2010 1990 2010
2005 2006 2007 2008 2009 2010 2011
96 95 95 91919593
0%
20%
40%
60%
80%
100%
Source: DHS, 2011.
0–1 2–3 4–5 6–7 8–9 10–11 12–13 14–15 16–17 18–19 20–21 22–23
Age (months)
0%
20%
40%
60%
80%
100%
7468
53
70
1996DHS
2001DHS
2006DHS
2011DHS
0%
20%
40%
60%
80%
100%
Stunted (under-fives, 000) 1,397
Wasted (under-fives, 000) 376
Severely wasted (under-fives, 000) 90
MDG 1 progress Insufficient progress
Underweight (under-fives, 000) 993
Overweight (under-fives, 000) 48
1990 1995 2000 2005 2010 2015
135
48 45
0
40
80
120
160
MDG 4target
Total population (000) 30,486 (2011)
Total under-five population (000) 3,450 (2011)
Total number of births (000) 722 (2011)
Under-five mortality rate (per 1,000 live births) 48 (2011)
Total number of under-five deaths (000) 34 (2011)
Infant mortality rate (per 1,000 live births) 39 (2011)
Neonatal mortality rate (per 1,000 live births) 27 (2011)
HIV prevalence rate (15–49 years old, %) 0.3 (2011)
Population below international poverty line of US$1.25 per day (%)
25 (2010)
GNI per capita (US$) 540 (2011)
Primary school net attendance ratio (% female, % male)
70, 67 (2010–2011)
To increase child survival, promote child development and prevent stunting, nutrition interventions need to be delivered during pregnancy and the first two years of life.
PREGNANCY BIRTH 0–5 MONTHS 6–23 MONTHS 24–59 MONTHS
Use of iron-folic acid supplements
Early initiation of breastfeeding(within 1 hour of birth)
International Code of Marketing of Breast-milk Substitutes
Maternity protection in accordance with ILO Convention 183
Minimum dietary diversity
Minimum acceptable diet
Full coverage of vitamin A supplementation
Treatment of severe acute malnutrition included in national health plans
Introduction to solid, semi-solid or soft foods (6–8 months)
Continued breastfeeding at 1 year old
Infants not weighed at birthHouseholds with adequately iodized salt
Exclusive breastfeeding(<6 months)
93%
66%
No
Yes
29%
24%
91%
Yes
70%64%
45%
80%
56%
Piped on premises Other improvedUnimproved Surface water
8
12
68
12
18
6
71
5
43
2
53
2
53
4
40
3
5
13
69
13
10
6
78
6
0%
20%
40%
60%
80%
100%
1990 2010Total Urban Rural
1990 2010 1990 2010
0%
20%
40%
60%
80%
100%
6861 57
4941
1995MICS
1997–1998Other NS
2001DHS
2006DHS
2011DHS
0% 20% 40% 60% 80% 100%
Poorest 20%
RuralUrban
GirlsBoys
Second 20%Middle 20%Fourth 20%
Richest 20%
4140
2742
56
26
4635
31
0%
20%
40%
60%
80%
100%
52
1995MICS
1997–1998Other NS
2001DHS
2006DHS
2011DHS
MDG 1: INSUFFICIENT PROGRESS
43 38 43 3929
Neonatal 58%HIV/AIDS 0%
Diarrhoea 6%
Measles 0%
Injuries 5%
Pneumonia 14%
Malaria 0%
Others 13%
Meningitis 4%
NEPALNEPAL
0%
20%
40%
60%
80%
100%
Non-pregnant women
Pregnant women
48 46
Public health problemsevere
moderate
Preschool- aged children
33
Maternal mortality ratio, adjusted (per 100,000 live births)
170 (2010)
Maternal mortality ratio, reported(per 100,000 live births)
280 (2005)
Total number of maternal deaths 1,200 (2010)
Lifetime risk of maternal death (1 in : ) 190 (2010)
Women with low BMI (<18.5 kg/m2, %) 18 (2011)
Anaemia, non-pregnant women (<120g/l, %) 33 (2011)
Antenatal care (at least one visit, %) 58 (2011)
Antenatal care (at least four visits, %) 50 (2011)
Skilled attendant at birth (%) 36 (2011)
Low birthweight (<2,500 grams, %) 18 (2011)
Women 20–24 years old who gave birth before age 18 (%)
19 (2011)
0%
20%
40%
60%
80%
100%
1996DHS
1998Other NS
2000Other NS
2011DHS
93
5563
80
Burden of malnutrition (2011)
Stunting country rank 20
Share of world stunting burden (%) <1%
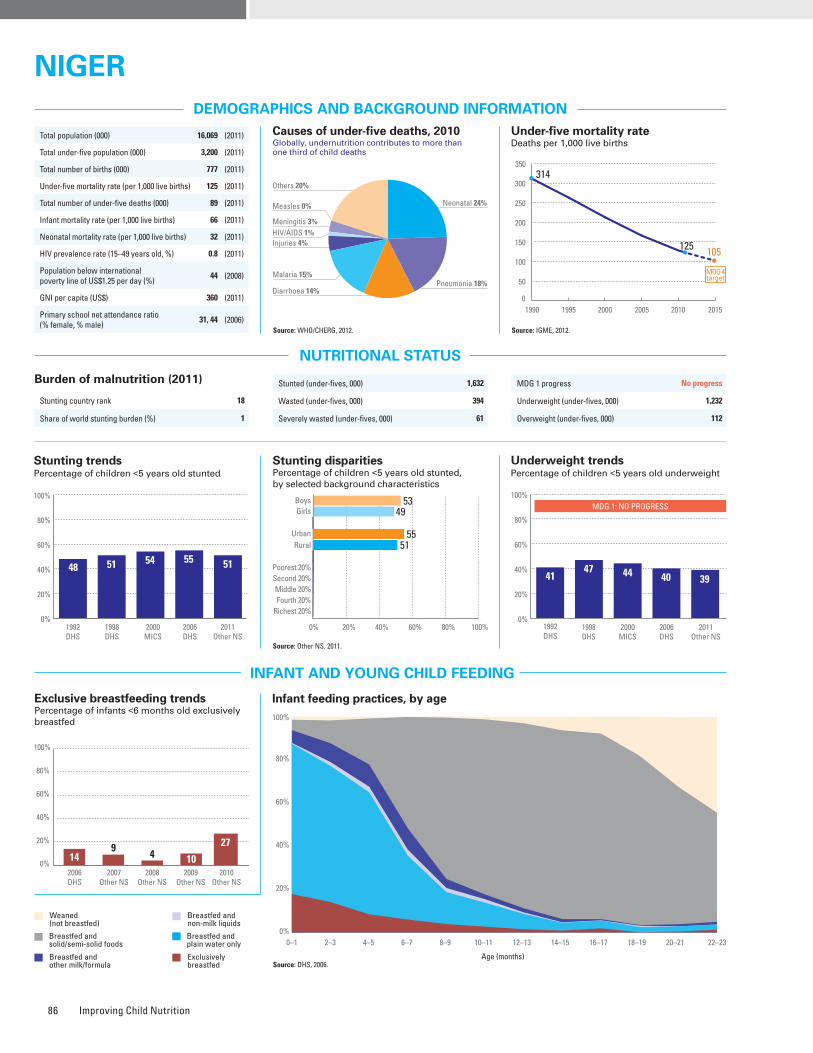
Improving Child Nutrition86
ESSENTIAL NUTRITION PRACTICES AND INTERVENTIONS DURING THE LIFE CYCLE
MICRONUTRIENTS
WATER AND SANITATION
Improved drinking water coveragePercentage of population, by type of drinking water source, 1990–2010
Source: WHO/UNICEF JMP, 2012.
Improved sanitation coveragePercentage of population, by type of sanitation facility, 1990–2010
Source: WHO/UNICEF JMP, 2012.
Vitamin A supplementationPercentage of children 6–59 months old receiving two doses of vitamin A during calendar year (full coverage)
* Estimates may not be comparable. Source: UNICEF, 2012.
MATERNAL NUTRITION AND HEALTH
DISPARITIES IN NUTRITION
Causes of under-five deaths, 2010Globally, undernutrition contributes to more than one third of child deaths
NUTRITIONAL STATUS
Stunting disparitiesPercentage of children <5 years old stunted, by selected background characteristics
DEMOGRAPHICS AND BACKGROUND INFORMATION
INFANT AND YOUNG CHILD FEEDING
Source: WHO/CHERG, 2012.
Under-five mortality rateDeaths per 1,000 live births
Source: IGME, 2012.AnaemiaPrevalence of anaemia among selected populations
Infant feeding practices, by ageExclusive breastfeeding trends Percentage of infants <6 months old exclusively breastfed
Breastfed and non-milk liquids
Breastfed and solid/semi-solid foods
Breastfed and plain water only
Breastfed and other milk/formula
Exclusively breastfed
Weaned (not breastfed)
Stunting trendsPercentage of children <5 years old stunted
Underweight trendsPercentage of children <5 years old underweight
Iodized salt trends*
Percentage of households with adequately iodized salt528,000 newborns are unprotected against iodine deficiency disorders (2011)
Source: Other NS, 2011.
Indicator
Gender Residence Wealth quintile
SourceMale Female
Ratio of male to female
Urban RuralRatio of urban to
ruralPoorest Second Middle Fourth Richest
Ratio of richest to poorest
Equity chart
Stunting prevalence (%) 53 49 1.1 55 51 1.1 – – – – – – Other NS, 2011
Underweight prevalence (%) 40 37 1.1 44 39 1.1 – – – – – – Other NS, 2011
Wasting prevalence (%) 14 11 1.3 12 12 1.0 – – – – – – Other NS, 2011
Women with low BMI (<18.5 kg/m2, %) – 19 – 13 21 0.6 19 20 24 21 13 0.7 DHS, 2006
Women with high BMI (≥25 kg/m2, %) – 13 – 35 7 4.9 4 5 7 11 33 7.8 DHS, 2006
Improved facilities Shared facilitiesUnimproved facilities Open defecation
5
83
84
9
66
79
19
41
14
26
34
21
25
20
2
21
95
4
32
91
0%
20%
40%
60%
80%
100%
1990 2010Total Urban Rural
1990 2010 1990 2010
2005 2006 2007 2008 2009 2010 2011
94 88100 95989592
0%
20%
40%
60%
80%
100%
Source: DHS, 2006.
Source: DHS, 2006.
0–1 2–3 4–5 6–7 8–9 10–11 12–13 14–15 16–17 18–19 20–21 22–23
Age (months)
0%
20%
40%
60%
80%
100%
149
104
2006DHS
2007Other NS
2008Other NS
2010Other NS
0%
20%
40%
60%
80%
100%
27
2009Other NS
Stunted (under-fives, 000) 1,632
Wasted (under-fives, 000) 394
Severely wasted (under-fives, 000) 61
Total population (000) 16,069 (2011)
Total under-five population (000) 3,200 (2011)
Total number of births (000) 777 (2011)
Under-five mortality rate (per 1,000 live births) 125 (2011)
Total number of under-five deaths (000) 89 (2011)
Infant mortality rate (per 1,000 live births) 66 (2011)
Neonatal mortality rate (per 1,000 live births) 32 (2011)
HIV prevalence rate (15–49 years old, %) 0.8 (2011)
Population below international poverty line of US$1.25 per day (%)
44 (2008)
GNI per capita (US$) 360 (2011)
Primary school net attendance ratio (% female, % male)
31, 44 (2006)1990 1995 2000 2005 2010 2015
314
125 105
0
50
100
150
200
250
300
350
MDG 4target
To increase child survival, promote child development and prevent stunting, nutrition interventions need to be delivered during pregnancy and the first two years of life.
PREGNANCY BIRTH 0–5 MONTHS 6–23 MONTHS 24–59 MONTHS
Use of iron-folic acid supplements
Early initiation of breastfeeding(within 1 hour of birth)
International Code of Marketing of Breast-milk Substitutes
Maternity protection in accordance with ILO Convention 183
Minimum dietary diversity
Minimum acceptable diet
Full coverage of vitamin A supplementation
Treatment of severe acute malnutrition included in national health plans
Introduction to solid, semi-solid or soft foods (6–8 months)
Continued breastfeeding at 1 year old
Infants not weighed at birthHouseholds with adequately iodized salt
Exclusive breastfeeding(<6 months)
95%
65%
No
Partial
–
–
95%
Yes
27%82%
42%
32%
14%
MDG 1 progress No progress
Underweight (under-fives, 000) 1,232
Overweight (under-fives, 000) 112
Piped on premises Other improvedUnimproved Surface water
3
62
32
3
8
49
41
2
21
42
36
1
39
0
61
0
0
66
31
3
2
58
37
3
0%
20%
40%
60%
80%
100%
1990 2010Total Urban Rural
1990 2010 1990 2010
0%
20%
40%
60%
80%
100%
51 54 55 51
1998DHS
2000MICS
2006DHS
2011Other NS
1992DHS
48
0% 20% 40% 60% 80% 100%
Poorest 20%
RuralUrban
GirlsBoys
Second 20%Middle 20%Fourth 20%
Richest 20%
5349
5551
Neonatal 24%
HIV/AIDS 1%
Diarrhoea 14%
Measles 0%
Injuries 4%
Pneumonia 18%Malaria 15%
Others 20%
Meningitis 3%
NIGERNIGER
0%
20%
40%
60%
80%
100%
52
1998DHS
2000MICS
2006DHS
2011Other NS
MDG 1: NO PROGRESS
47 44 40 3941
1992DHS
0%
20%
40%
60%
80%
100%
Non-pregnant women
Pregnant women
61
84Public health problemsevere
moderate
Preschool- aged children
43
Maternal mortality ratio, adjusted (per 100,000 live births)
590 (2010)
Maternal mortality ratio, reported(per 100,000 live births)
650 (2006)
Total number of maternal deaths 4,500 (2010)
Lifetime risk of maternal death (1 in : ) 23 (2010)
Women with low BMI (<18.5 kg/m2, %) 19 (2006)
Anaemia, non-pregnant women (<120g/l, %) 43 (2006)
Antenatal care (at least one visit, %) 46 (2006)
Antenatal care (at least four visits, %) 15 (2006)
Skilled attendant at birth (%) 18 (2006)
Low birthweight (<2,500 grams, %) 27 (2006)
Women 20–24 years old who gave birth before age 18 (%)
51 (2006)
0%
20%
40%
60%
80%
100%
1996MICS
1998DHS
2000MICS
2006DHS
2010Other NS
7
64
15
4632
Burden of malnutrition (2011)
Stunting country rank 18
Share of world stunting burden (%) 1
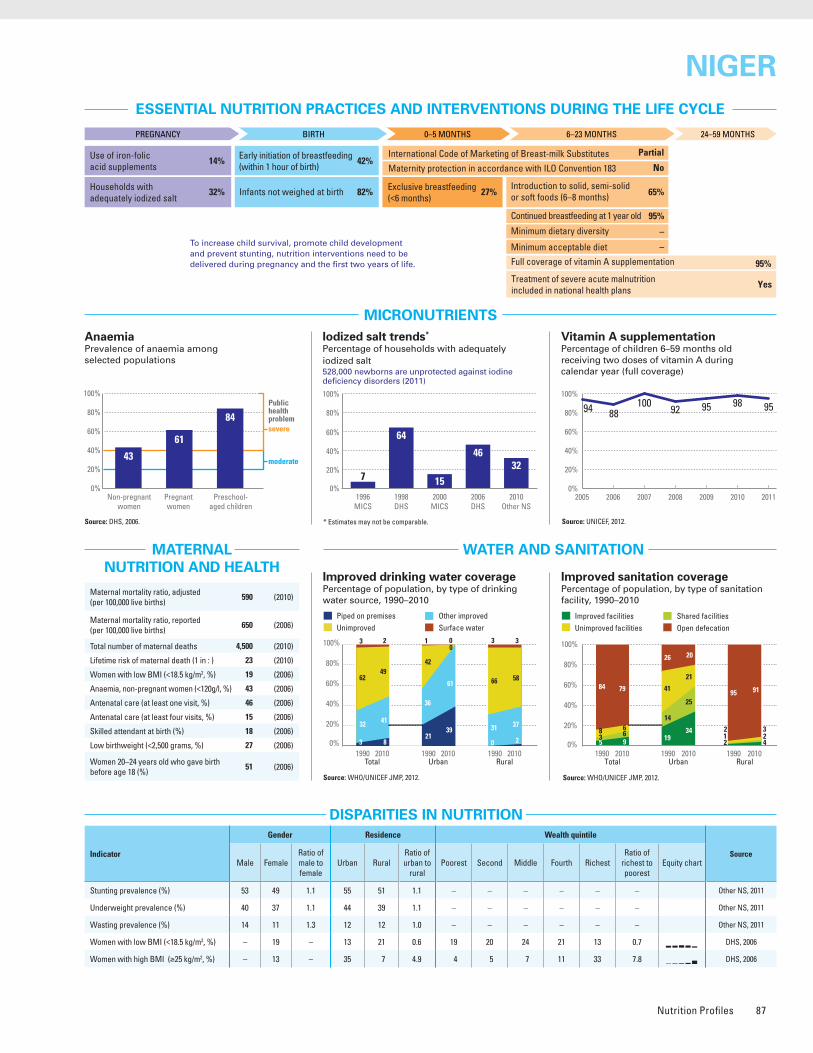
Nutrition Profiles 87
ESSENTIAL NUTRITION PRACTICES AND INTERVENTIONS DURING THE LIFE CYCLE
MICRONUTRIENTS
WATER AND SANITATION
Improved drinking water coveragePercentage of population, by type of drinking water source, 1990–2010
Source: WHO/UNICEF JMP, 2012.
Improved sanitation coveragePercentage of population, by type of sanitation facility, 1990–2010
Source: WHO/UNICEF JMP, 2012.
Vitamin A supplementationPercentage of children 6–59 months old receiving two doses of vitamin A during calendar year (full coverage)
* Estimates may not be comparable. Source: UNICEF, 2012.
MATERNAL NUTRITION AND HEALTH
DISPARITIES IN NUTRITION
Causes of under-five deaths, 2010Globally, undernutrition contributes to more than one third of child deaths
NUTRITIONAL STATUS
Stunting disparitiesPercentage of children <5 years old stunted, by selected background characteristics
DEMOGRAPHICS AND BACKGROUND INFORMATION
INFANT AND YOUNG CHILD FEEDING
Source: WHO/CHERG, 2012.
Under-five mortality rateDeaths per 1,000 live births
Source: IGME, 2012.AnaemiaPrevalence of anaemia among selected populations
Infant feeding practices, by ageExclusive breastfeeding trends Percentage of infants <6 months old exclusively breastfed
Breastfed and non-milk liquids
Breastfed and solid/semi-solid foods
Breastfed and plain water only
Breastfed and other milk/formula
Exclusively breastfed
Weaned (not breastfed)
Stunting trendsPercentage of children <5 years old stunted
Underweight trendsPercentage of children <5 years old underweight
Iodized salt trends*
Percentage of households with adequately iodized salt528,000 newborns are unprotected against iodine deficiency disorders (2011)
Source: Other NS, 2011.
Indicator
Gender Residence Wealth quintile
SourceMale Female
Ratio of male to female
Urban RuralRatio of urban to
ruralPoorest Second Middle Fourth Richest
Ratio of richest to poorest
Equity chart
Stunting prevalence (%) 53 49 1.1 55 51 1.1 – – – – – – Other NS, 2011
Underweight prevalence (%) 40 37 1.1 44 39 1.1 – – – – – – Other NS, 2011
Wasting prevalence (%) 14 11 1.3 12 12 1.0 – – – – – – Other NS, 2011
Women with low BMI (<18.5 kg/m2, %) – 19 – 13 21 0.6 19 20 24 21 13 0.7 DHS, 2006
Women with high BMI (≥25 kg/m2, %) – 13 – 35 7 4.9 4 5 7 11 33 7.8 DHS, 2006
Improved facilities Shared facilitiesUnimproved facilities Open defecation
5
83
84
9
66
79
19
41
14
26
34
21
25
20
2
21
95
4
32
91
0%
20%
40%
60%
80%
100%
1990 2010Total Urban Rural
1990 2010 1990 2010
2005 2006 2007 2008 2009 2010 2011
94 88100 95989592
0%
20%
40%
60%
80%
100%
Source: DHS, 2006.
Source: DHS, 2006.
0–1 2–3 4–5 6–7 8–9 10–11 12–13 14–15 16–17 18–19 20–21 22–23
Age (months)
0%
20%
40%
60%
80%
100%
149
104
2006DHS
2007Other NS
2008Other NS
2010Other NS
0%
20%
40%
60%
80%
100%
27
2009Other NS
Stunted (under-fives, 000) 1,632
Wasted (under-fives, 000) 394
Severely wasted (under-fives, 000) 61
Total population (000) 16,069 (2011)
Total under-five population (000) 3,200 (2011)
Total number of births (000) 777 (2011)
Under-five mortality rate (per 1,000 live births) 125 (2011)
Total number of under-five deaths (000) 89 (2011)
Infant mortality rate (per 1,000 live births) 66 (2011)
Neonatal mortality rate (per 1,000 live births) 32 (2011)
HIV prevalence rate (15–49 years old, %) 0.8 (2011)
Population below international poverty line of US$1.25 per day (%)
44 (2008)
GNI per capita (US$) 360 (2011)
Primary school net attendance ratio (% female, % male)
31, 44 (2006)1990 1995 2000 2005 2010 2015
314
125 105
0
50
100
150
200
250
300
350
MDG 4target
To increase child survival, promote child development and prevent stunting, nutrition interventions need to be delivered during pregnancy and the first two years of life.
PREGNANCY BIRTH 0–5 MONTHS 6–23 MONTHS 24–59 MONTHS
Use of iron-folic acid supplements
Early initiation of breastfeeding(within 1 hour of birth)
International Code of Marketing of Breast-milk Substitutes
Maternity protection in accordance with ILO Convention 183
Minimum dietary diversity
Minimum acceptable diet
Full coverage of vitamin A supplementation
Treatment of severe acute malnutrition included in national health plans
Introduction to solid, semi-solid or soft foods (6–8 months)
Continued breastfeeding at 1 year old
Infants not weighed at birthHouseholds with adequately iodized salt
Exclusive breastfeeding(<6 months)
95%
65%
No
Partial
–
–
95%
Yes
27%82%
42%
32%
14%
MDG 1 progress No progress
Underweight (under-fives, 000) 1,232
Overweight (under-fives, 000) 112
Piped on premises Other improvedUnimproved Surface water
3
62
32
3
8
49
41
2
21
42
36
1
39
0
61
0
0
66
31
3
2
58
37
3
0%
20%
40%
60%
80%
100%
1990 2010Total Urban Rural
1990 2010 1990 2010
0%
20%
40%
60%
80%
100%
51 54 55 51
1998DHS
2000MICS
2006DHS
2011Other NS
1992DHS
48
0% 20% 40% 60% 80% 100%
Poorest 20%
RuralUrban
GirlsBoys
Second 20%Middle 20%Fourth 20%
Richest 20%
5349
5551
Neonatal 24%
HIV/AIDS 1%
Diarrhoea 14%
Measles 0%
Injuries 4%
Pneumonia 18%Malaria 15%
Others 20%
Meningitis 3%
NIGERNIGER
0%
20%
40%
60%
80%
100%
52
1998DHS
2000MICS
2006DHS
2011Other NS
MDG 1: NO PROGRESS
47 44 40 3941
1992DHS
0%
20%
40%
60%
80%
100%
Non-pregnant women
Pregnant women
61
84Public health problemsevere
moderate
Preschool- aged children
43
Maternal mortality ratio, adjusted (per 100,000 live births)
590 (2010)
Maternal mortality ratio, reported(per 100,000 live births)
650 (2006)
Total number of maternal deaths 4,500 (2010)
Lifetime risk of maternal death (1 in : ) 23 (2010)
Women with low BMI (<18.5 kg/m2, %) 19 (2006)
Anaemia, non-pregnant women (<120g/l, %) 43 (2006)
Antenatal care (at least one visit, %) 46 (2006)
Antenatal care (at least four visits, %) 15 (2006)
Skilled attendant at birth (%) 18 (2006)
Low birthweight (<2,500 grams, %) 27 (2006)
Women 20–24 years old who gave birth before age 18 (%)
51 (2006)
0%
20%
40%
60%
80%
100%
1996MICS
1998DHS
2000MICS
2006DHS
2010Other NS
7
64
15
4632
Burden of malnutrition (2011)
Stunting country rank 18
Share of world stunting burden (%) 1
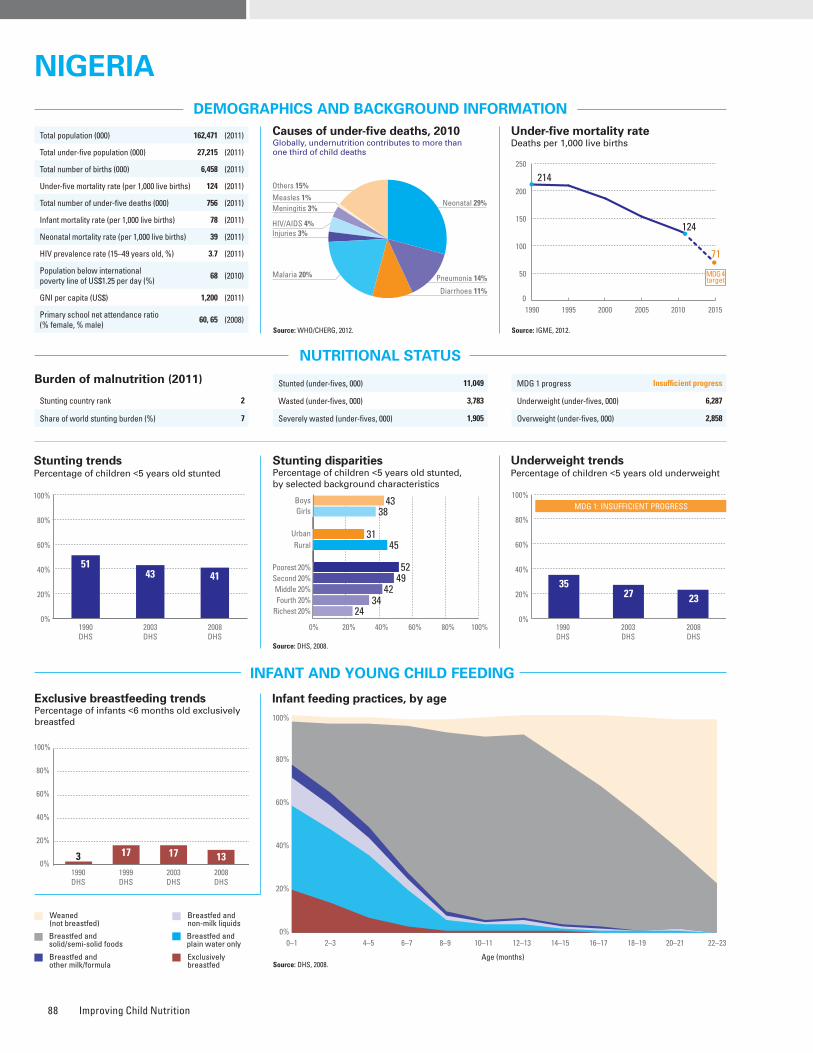
Improving Child Nutrition88
ESSENTIAL NUTRITION PRACTICES AND INTERVENTIONS DURING THE LIFE CYCLE
MICRONUTRIENTS
WATER AND SANITATION
Improved drinking water coveragePercentage of population, by type of drinking water source, 1990–2010
Source: WHO/UNICEF JMP, 2012.
Improved sanitation coveragePercentage of population, by type of sanitation facility, 1990–2010
Source: WHO/UNICEF JMP, 2012.
Vitamin A supplementationPercentage of children 6–59 months old receiving two doses of vitamin A during calendar year (full coverage)
* Estimates may not be comparable. Source: UNICEF, 2012.
MATERNAL NUTRITION AND HEALTH
DISPARITIES IN NUTRITION
Causes of under-five deaths, 2010Globally, undernutrition contributes to more than one third of child deaths
NUTRITIONAL STATUS
Stunting disparitiesPercentage of children <5 years old stunted, by selected background characteristics
DEMOGRAPHICS AND BACKGROUND INFORMATION
INFANT AND YOUNG CHILD FEEDING
Source: WHO/CHERG, 2012.
Under-five mortality rateDeaths per 1,000 live births
Source: IGME, 2012.AnaemiaPrevalence of anaemia among selected populations
Infant feeding practices, by ageExclusive breastfeeding trends Percentage of infants <6 months old exclusively breastfed
Breastfed and non-milk liquids
Breastfed and solid/semi-solid foods
Breastfed and plain water only
Breastfed and other milk/formula
Exclusively breastfed
Weaned (not breastfed)
Stunting trendsPercentage of children <5 years old stunted
Underweight trendsPercentage of children <5 years old underweight
Source: DHS, 2008.
Indicator
Gender Residence Wealth quintile
SourceMale Female
Ratio of male to female
Urban RuralRatio of urban to
ruralPoorest Second Middle Fourth Richest
Ratio of richest to poorest
Equity chart
Stunting prevalence (%) 43 38 1.1 31 45 0.7 52 49 42 34 24 0.5 DHS, 2008
Underweight prevalence (%) 25 22 1.1 16 27 0.6 35 29 22 17 10 0.3 DHS, 2008
Wasting prevalence (%) 14 13 1.1 11 15 0.7 21 17 12 10 9 0.5 DHS, 2008
Women with low BMI (<18.5 kg/m2, %) – 12 – 9 14 0.7 21 15 11 10 7 0.3 DHS, 2008
Women with high BMI (≥25 kg/m2, %) – 22 – 31 17 1.8 9 13 19 25 38 4.1 DHS, 2008
Improved facilities Shared facilitiesUnimproved facilities Open defecation
37
12
26
25
31
22
25
22
39
11
42
8
35
15
38
12
36
12
18
34
27
29
13
31
0%
20%
40%
60%
80%
100%
1990 2010Total Urban Rural
1990 2010 1990 2010
2005 2006 2007 2008 2009 2010 2011
73 70
38
7391
7874
0%
20%
40%
60%
80%
100%
Iodized salt trends*
Percentage of households with adequately iodized salt3,132,000 newborns are unprotected against iodine deficiency disorders (2011)
0–1 2–3 4–5 6–7 8–9 10–11 12–13 14–15 16–17 18–19 20–21 22–23
Age (months)
0%
20%
40%
60%
80%
100%
Source: DHS, 2008.
3 17 17 131990DHS
1999DHS
2003DHS
2008DHS
0%
20%
40%
60%
80%
100%
Stunted (under-fives, 000) 11,049
Wasted (under-fives, 000) 3,783
Severely wasted (under-fives, 000) 1,905
MDG 1 progress Insufficient progress
Underweight (under-fives, 000) 6,287
Overweight (under-fives, 000) 2,858
Total population (000) 162,471 (2011)
Total under-five population (000) 27,215 (2011)
Total number of births (000) 6,458 (2011)
Under-five mortality rate (per 1,000 live births) 124 (2011)
Total number of under-five deaths (000) 756 (2011)
Infant mortality rate (per 1,000 live births) 78 (2011)
Neonatal mortality rate (per 1,000 live births) 39 (2011)
HIV prevalence rate (15–49 years old, %) 3.7 (2011)
Population below international poverty line of US$1.25 per day (%)
68 (2010)
GNI per capita (US$) 1,200 (2011)
Primary school net attendance ratio (% female, % male)
60, 65 (2008)1990 1995 2000 2005 2010 2015
214
124
71
0
50
100
150
200
250
MDG 4target
To increase child survival, promote child development and prevent stunting, nutrition interventions need to be delivered during pregnancy and the first two years of life.
PREGNANCY BIRTH 0–5 MONTHS 6–23 MONTHS 24–59 MONTHS
Use of iron-folic acid supplements
Early initiation of breastfeeding(within 1 hour of birth)
International Code of Marketing of Breast-milk Substitutes
Maternity protection in accordance with ILO Convention 183
Minimum dietary diversity
Minimum acceptable diet
Full coverage of vitamin A supplementation
Treatment of severe acute malnutrition included in national health plans
Introduction to solid, semi-solid or soft foods (6–8 months)
Continued breastfeeding at 1 year old
Infants not weighed at birthHouseholds with adequately iodized salt
Exclusive breastfeeding(<6 months)
85%
76%
No
Partial
–
–
73%
Yes
13%82%
38%
52%
15%
Piped on premises Other improvedUnimproved Surface water
14
25
33
28
4
28
54
14
32
17
47
4
8
21
66
5
4
29
26
41
1
35
42
22
0%
20%
40%
60%
80%
100%
1990 2010Total Urban Rural
1990 2010 1990 2010
0%
20%
40%
60%
80%
100%
5143 41
1990DHS
2003DHS
2008DHS
Poorest 20%
RuralUrban
GirlsBoys
Second 20%Middle 20%Fourth 20%
Richest 20%
4338
3145
52
24
4942
34
0% 20% 40% 60% 80% 100%0%
20%
40%
60%
80%
100%
1990DHS
2003DHS
2008DHS
MDG 1: INSUFFICIENT PROGRESS
3527 23
Neonatal 29%
HIV/AIDS 4%
Diarrhoea 11%
Measles 1%
Injuries 3%
Pneumonia 14%Malaria 20%
Others 15%
Meningitis 3%
NIGERIANIGERIA
NO DATA
Maternal mortality ratio, adjusted (per 100,000 live births)
630 (2010)
Maternal mortality ratio, reported(per 100,000 live births)
550 (2008)
Total number of maternal deaths 40,000 (2010)
Lifetime risk of maternal death (1 in : ) 29 (2010)
Women with low BMI (<18.5 kg/m2, %) 12 (2008)
Anaemia, non-pregnant women (<120g/l, %) – –
Antenatal care (at least one visit, %) 58 (2008)
Antenatal care (at least four visits, %) 45 (2008)
Skilled attendant at birth (%) 39 (2008)
Low birthweight (<2,500 grams, %) 12 (2008)
Women 20–24 years old who gave birth before age 18 (%)
28 (2008)
0%
20%
40%
60%
80%
100%
1998UNICEF
1999MICS
2003DHS
2008DHS
98 98 97
52
Burden of malnutrition (2011)
Stunting country rank 2
Share of world stunting burden (%) 7
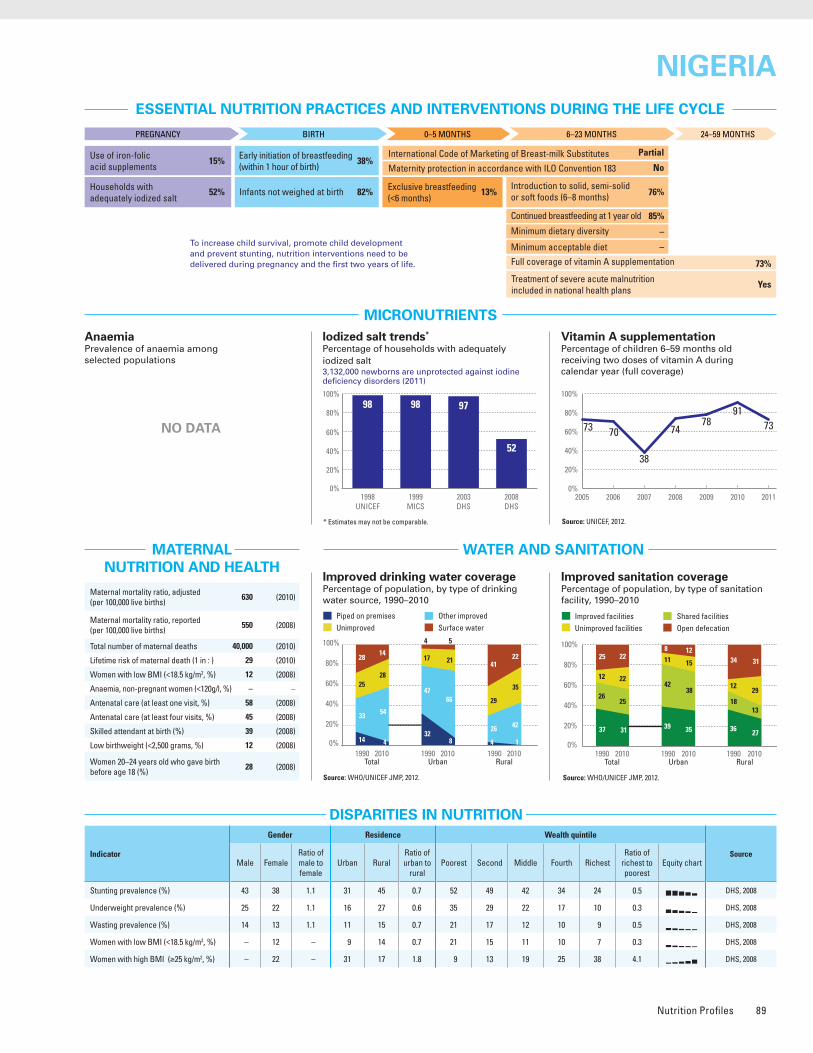
Nutrition Profiles 89
ESSENTIAL NUTRITION PRACTICES AND INTERVENTIONS DURING THE LIFE CYCLE
MICRONUTRIENTS
WATER AND SANITATION
Improved drinking water coveragePercentage of population, by type of drinking water source, 1990–2010
Source: WHO/UNICEF JMP, 2012.
Improved sanitation coveragePercentage of population, by type of sanitation facility, 1990–2010
Source: WHO/UNICEF JMP, 2012.
Vitamin A supplementationPercentage of children 6–59 months old receiving two doses of vitamin A during calendar year (full coverage)
* Estimates may not be comparable. Source: UNICEF, 2012.
MATERNAL NUTRITION AND HEALTH
DISPARITIES IN NUTRITION
Causes of under-five deaths, 2010Globally, undernutrition contributes to more than one third of child deaths
NUTRITIONAL STATUS
Stunting disparitiesPercentage of children <5 years old stunted, by selected background characteristics
DEMOGRAPHICS AND BACKGROUND INFORMATION
INFANT AND YOUNG CHILD FEEDING
Source: WHO/CHERG, 2012.
Under-five mortality rateDeaths per 1,000 live births
Source: IGME, 2012.AnaemiaPrevalence of anaemia among selected populations
Infant feeding practices, by ageExclusive breastfeeding trends Percentage of infants <6 months old exclusively breastfed
Breastfed and non-milk liquids
Breastfed and solid/semi-solid foods
Breastfed and plain water only
Breastfed and other milk/formula
Exclusively breastfed
Weaned (not breastfed)
Stunting trendsPercentage of children <5 years old stunted
Underweight trendsPercentage of children <5 years old underweight
Source: DHS, 2008.
Indicator
Gender Residence Wealth quintile
SourceMale Female
Ratio of male to female
Urban RuralRatio of urban to
ruralPoorest Second Middle Fourth Richest
Ratio of richest to poorest
Equity chart
Stunting prevalence (%) 43 38 1.1 31 45 0.7 52 49 42 34 24 0.5 DHS, 2008
Underweight prevalence (%) 25 22 1.1 16 27 0.6 35 29 22 17 10 0.3 DHS, 2008
Wasting prevalence (%) 14 13 1.1 11 15 0.7 21 17 12 10 9 0.5 DHS, 2008
Women with low BMI (<18.5 kg/m2, %) – 12 – 9 14 0.7 21 15 11 10 7 0.3 DHS, 2008
Women with high BMI (≥25 kg/m2, %) – 22 – 31 17 1.8 9 13 19 25 38 4.1 DHS, 2008
Improved facilities Shared facilitiesUnimproved facilities Open defecation
37
12
26
25
31
22
25
22
39
11
42
8
35
15
38
12
36
12
18
34
27
29
13
31
0%
20%
40%
60%
80%
100%
1990 2010Total Urban Rural
1990 2010 1990 2010
2005 2006 2007 2008 2009 2010 2011
73 70
38
7391
7874
0%
20%
40%
60%
80%
100%
Iodized salt trends*
Percentage of households with adequately iodized salt3,132,000 newborns are unprotected against iodine deficiency disorders (2011)
0–1 2–3 4–5 6–7 8–9 10–11 12–13 14–15 16–17 18–19 20–21 22–23
Age (months)
0%
20%
40%
60%
80%
100%
Source: DHS, 2008.
3 17 17 131990DHS
1999DHS
2003DHS
2008DHS
0%
20%
40%
60%
80%
100%
Stunted (under-fives, 000) 11,049
Wasted (under-fives, 000) 3,783
Severely wasted (under-fives, 000) 1,905
MDG 1 progress Insufficient progress
Underweight (under-fives, 000) 6,287
Overweight (under-fives, 000) 2,858
Total population (000) 162,471 (2011)
Total under-five population (000) 27,215 (2011)
Total number of births (000) 6,458 (2011)
Under-five mortality rate (per 1,000 live births) 124 (2011)
Total number of under-five deaths (000) 756 (2011)
Infant mortality rate (per 1,000 live births) 78 (2011)
Neonatal mortality rate (per 1,000 live births) 39 (2011)
HIV prevalence rate (15–49 years old, %) 3.7 (2011)
Population below international poverty line of US$1.25 per day (%)
68 (2010)
GNI per capita (US$) 1,200 (2011)
Primary school net attendance ratio (% female, % male)
60, 65 (2008)1990 1995 2000 2005 2010 2015
214
124
71
0
50
100
150
200
250
MDG 4target
To increase child survival, promote child development and prevent stunting, nutrition interventions need to be delivered during pregnancy and the first two years of life.
PREGNANCY BIRTH 0–5 MONTHS 6–23 MONTHS 24–59 MONTHS
Use of iron-folic acid supplements
Early initiation of breastfeeding(within 1 hour of birth)
International Code of Marketing of Breast-milk Substitutes
Maternity protection in accordance with ILO Convention 183
Minimum dietary diversity
Minimum acceptable diet
Full coverage of vitamin A supplementation
Treatment of severe acute malnutrition included in national health plans
Introduction to solid, semi-solid or soft foods (6–8 months)
Continued breastfeeding at 1 year old
Infants not weighed at birthHouseholds with adequately iodized salt
Exclusive breastfeeding(<6 months)
85%
76%
No
Partial
–
–
73%
Yes
13%82%
38%
52%
15%
Piped on premises Other improvedUnimproved Surface water
14
25
33
28
4
28
54
14
32
17
47
4
8
21
66
5
4
29
26
41
1
35
42
22
0%
20%
40%
60%
80%
100%
1990 2010Total Urban Rural
1990 2010 1990 2010
0%
20%
40%
60%
80%
100%
5143 41
1990DHS
2003DHS
2008DHS
Poorest 20%
RuralUrban
GirlsBoys
Second 20%Middle 20%Fourth 20%
Richest 20%
4338
3145
52
24
4942
34
0% 20% 40% 60% 80% 100%0%
20%
40%
60%
80%
100%
1990DHS
2003DHS
2008DHS
MDG 1: INSUFFICIENT PROGRESS
3527 23
Neonatal 29%
HIV/AIDS 4%
Diarrhoea 11%
Measles 1%
Injuries 3%
Pneumonia 14%Malaria 20%
Others 15%
Meningitis 3%
NIGERIANIGERIA
NO DATA
Maternal mortality ratio, adjusted (per 100,000 live births)
630 (2010)
Maternal mortality ratio, reported(per 100,000 live births)
550 (2008)
Total number of maternal deaths 40,000 (2010)
Lifetime risk of maternal death (1 in : ) 29 (2010)
Women with low BMI (<18.5 kg/m2, %) 12 (2008)
Anaemia, non-pregnant women (<120g/l, %) – –
Antenatal care (at least one visit, %) 58 (2008)
Antenatal care (at least four visits, %) 45 (2008)
Skilled attendant at birth (%) 39 (2008)
Low birthweight (<2,500 grams, %) 12 (2008)
Women 20–24 years old who gave birth before age 18 (%)
28 (2008)
0%
20%
40%
60%
80%
100%
1998UNICEF
1999MICS
2003DHS
2008DHS
98 98 97
52
Burden of malnutrition (2011)
Stunting country rank 2
Share of world stunting burden (%) 7
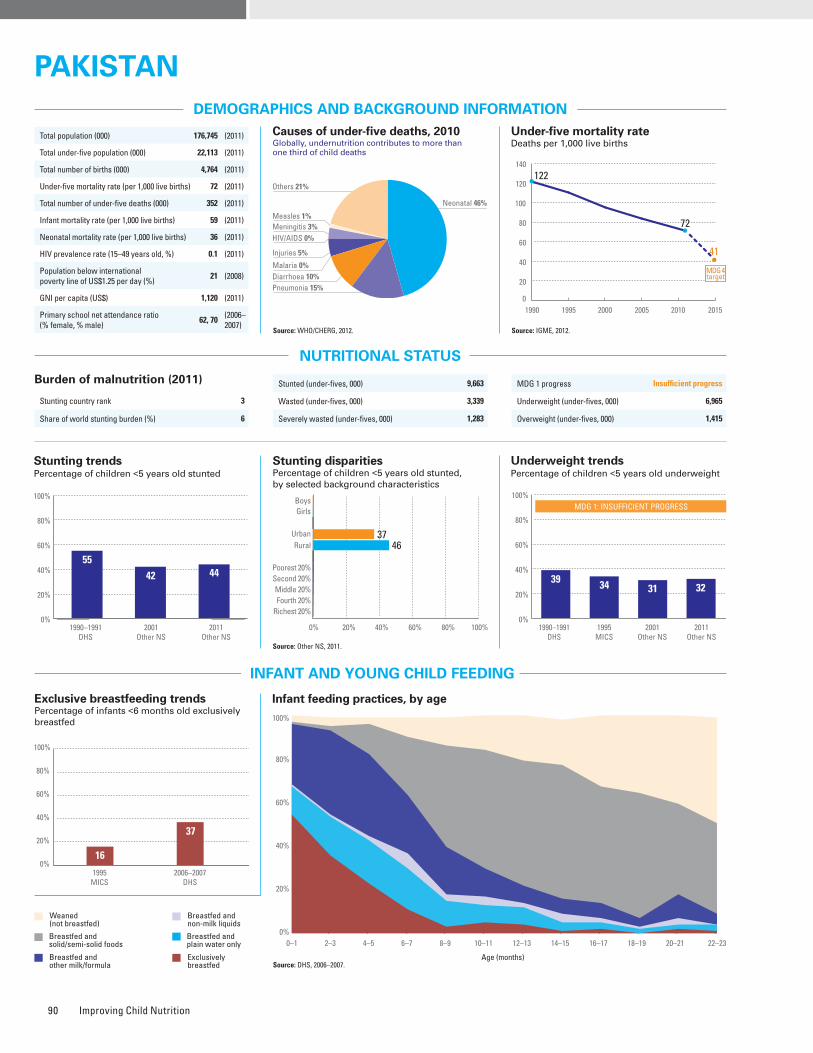
Improving Child Nutrition90
ESSENTIAL NUTRITION PRACTICES AND INTERVENTIONS DURING THE LIFE CYCLE
MICRONUTRIENTS
WATER AND SANITATION
Improved drinking water coveragePercentage of population, by type of drinking water source, 1990–2010
Source: WHO/UNICEF JMP, 2012.
Improved sanitation coveragePercentage of population, by type of sanitation facility, 1990–2010
Source: WHO/UNICEF JMP, 2012.
Vitamin A supplementationPercentage of children 6–59 months old receiving two doses of vitamin A during calendar year (full coverage)
* Estimates may not be comparable. Source: UNICEF, 2012.
MATERNAL NUTRITION AND HEALTH
DISPARITIES IN NUTRITION
Causes of under-five deaths, 2010Globally, undernutrition contributes to more than one third of child deaths
NUTRITIONAL STATUS
Stunting disparitiesPercentage of children <5 years old stunted, by selected background characteristics
DEMOGRAPHICS AND BACKGROUND INFORMATION
INFANT AND YOUNG CHILD FEEDING
Source: WHO/CHERG, 2012.
Under-five mortality rateDeaths per 1,000 live births
Source: IGME, 2012.AnaemiaPrevalence of anaemia among selected populations
Infant feeding practices, by ageExclusive breastfeeding trends Percentage of infants <6 months old exclusively breastfed
Breastfed and non-milk liquids
Breastfed and solid/semi-solid foods
Breastfed and plain water only
Breastfed and other milk/formula
Exclusively breastfed
Weaned (not breastfed)
Stunting trendsPercentage of children <5 years old stunted
Underweight trendsPercentage of children <5 years old underweight
Source: Other NS, 2011.
Indicator
Gender Residence Wealth quintile
SourceMale Female
Ratio of male to female
Urban RuralRatio of urban to
ruralPoorest Second Middle Fourth Richest
Ratio of richest to poorest
Equity chart
Stunting prevalence (%) – – – 37 46 0.8 – – – – – – Other NS, 2011
Underweight prevalence (%) – – – 27 33 0.8 – – – – – – Other NS, 2011
Wasting prevalence (%) – – – 13 16 0.8 – – – – – – Other NS, 2011
Women with low BMI (<18.5 kg/m2, %) – 18 – 14 20 0.7 – – – – – – Other NS, 2011
Women with high BMI (≥25 kg/m2, %) – 29 – 40 24 1.7 – – – – – – Other NS, 2011
Improved facilities Shared facilitiesUnimproved facilities Open defecation
27
18
3
52
48
23
6
23
72
146
8
72
18
6
4
7
20
1
72
34
26
6
34
0%
20%
40%
60%
80%
100%
1990 2010Total Urban Rural
1990 2010 1990 2010
2005 2006 2007 2008 2009 2010 2011
100 100 10090879197
0%
20%
40%
60%
80%
100%
Iodized salt trends*
Percentage of households with adequately iodized salt1,467,000 newborns are unprotected against iodine deficiency disorders (2011)
Source: DHS, 2006–2007.
0–1 2–3 4–5 6–7 8–9 10–11 12–13 14–15 16–17 18–19 20–21 22–23
Age (months)
0%
20%
40%
60%
80%
100%
16
37
1995MICS
2006–2007DHS
0%
20%
40%
60%
80%
100%
MDG 1 progress Insufficient progress
Underweight (under-fives, 000) 6,965
Overweight (under-fives, 000) 1,415
Stunted (under-fives, 000) 9,663
Wasted (under-fives, 000) 3,339
Severely wasted (under-fives, 000) 1,283
Total population (000) 176,745 (2011)
Total under-five population (000) 22,113 (2011)
Total number of births (000) 4,764 (2011)
Under-five mortality rate (per 1,000 live births) 72 (2011)
Total number of under-five deaths (000) 352 (2011)
Infant mortality rate (per 1,000 live births) 59 (2011)
Neonatal mortality rate (per 1,000 live births) 36 (2011)
HIV prevalence rate (15–49 years old, %) 0.1 (2011)
Population below international poverty line of US$1.25 per day (%)
21 (2008)
GNI per capita (US$) 1,120 (2011)
Primary school net attendance ratio (% female, % male)
62, 70 (2006–2007)
1990 1995 2000 2005 2010 2015
122
72
41
0
20
40
60
80
100
120
140
MDG 4target
Piped on premises Other improvedUnimproved Surface water
23
7
62
8
36
5
56
3
56
4
39
1
58
4
38
0
8
8
73
11
23
6
66
5
0%
20%
40%
60%
80%
100%
1990 2010Total Urban Rural
1990 2010 1990 2010
0%
20%
40%
60%
80%
100%
55
42 44
1990–1991DHS
2001Other NS
2011Other NS
0% 20% 40% 60% 80% 100%
Poorest 20%
RuralUrban
GirlsBoys
Second 20%Middle 20%Fourth 20%
Richest 20%
3746
0%
20%
40%
60%
80%
100%MDG 1: NO PROGRESSMDG 1: INSUFFICIENT PROGRESS
1990–1991DHS
1995MICS
2001Other NS
2011Other NS
39 34 31 32
Neonatal 46%
HIV/AIDS 0%
Diarrhoea 10%
Measles 1%
Injuries 5%
Pneumonia 15%
Malaria 0%
Others 21%
Meningitis 3%
PAKISTANPAKISTAN
NO DATA
To increase child survival, promote child development and prevent stunting, nutrition interventions need to be delivered during pregnancy and the first two years of life.
PREGNANCY BIRTH 0–5 MONTHS 6–23 MONTHS 24–59 MONTHS
Use of iron-folic acid supplements
Early initiation of breastfeeding(within 1 hour of birth)
International Code of Marketing of Breast-milk Substitutes
Maternity protection in accordance with ILO Convention 183
Minimum dietary diversity
Minimum acceptable diet
Full coverage of vitamin A supplementation
Treatment of severe acute malnutrition included in national health plans
Introduction to solid, semi-solid or soft foods (6–8 months)
Continued breastfeeding at 1 year old
Infants not weighed at birthHouseholds with adequately iodized salt
Exclusive breastfeeding(<6 months)
79%
36%
No
Yes
4%
8%
90%
No
37%90%
29%
69%
16%
Maternal mortality ratio, adjusted (per 100,000 live births)
260 (2010)
Maternal mortality ratio, reported(per 100,000 live births)
280 (2007)
Total number of maternal deaths 12,000 (2010)
Lifetime risk of maternal death (1 in : ) 110 (2010)
Women with low BMI (<18.5 kg/m2, %) 18 (2011)
Anaemia, non-pregnant women (<120g/l, %) – –
Antenatal care (at least one visit, %) 61 (2007)
Antenatal care (at least four visits, %) 28 (2007)
Skilled attendant at birth (%) 43 (2011)
Low birthweight (<2,500 grams, %) 32 (2006–2007)
Women 20–24 years old who gave birth before age 18 (%)
10 (2007)
0%
20%
40%
60%
80%
100%
1995MICS
2001–2002Other NS
2011Other NS
19 17
69
Burden of malnutrition (2011)
Stunting country rank 3
Share of world stunting burden (%) 6
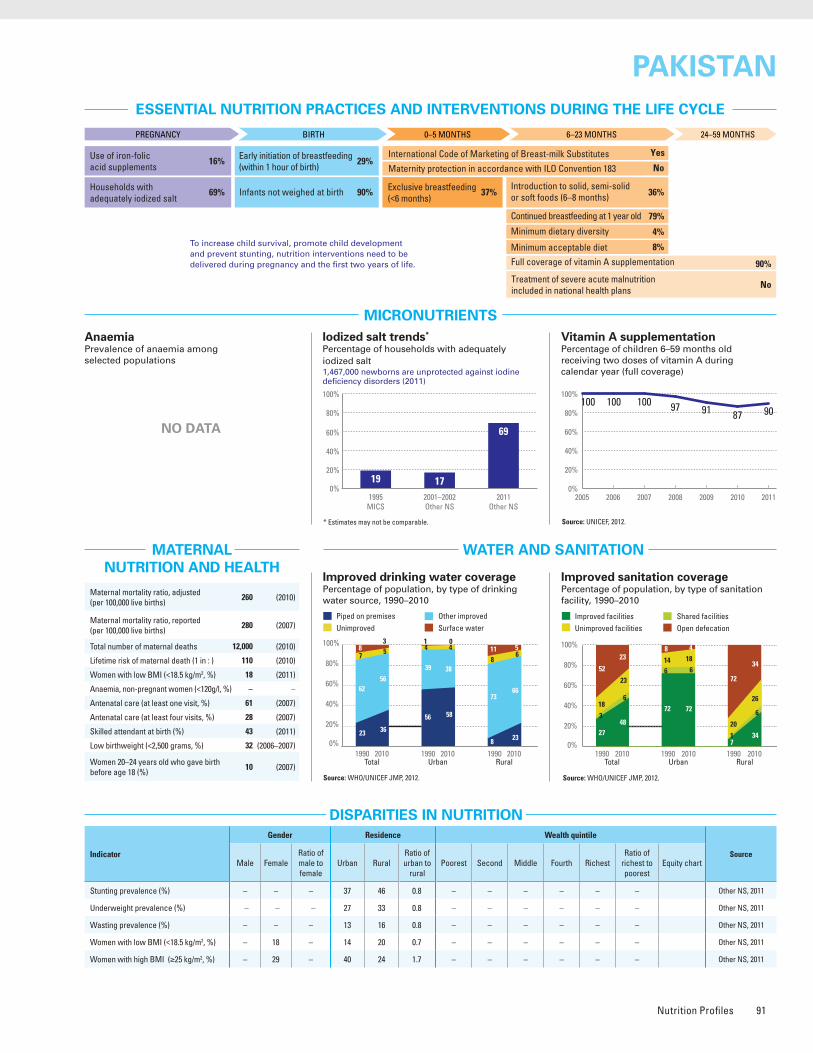
Nutrition Profiles 91
ESSENTIAL NUTRITION PRACTICES AND INTERVENTIONS DURING THE LIFE CYCLE
MICRONUTRIENTS
WATER AND SANITATION
Improved drinking water coveragePercentage of population, by type of drinking water source, 1990–2010
Source: WHO/UNICEF JMP, 2012.
Improved sanitation coveragePercentage of population, by type of sanitation facility, 1990–2010
Source: WHO/UNICEF JMP, 2012.
Vitamin A supplementationPercentage of children 6–59 months old receiving two doses of vitamin A during calendar year (full coverage)
* Estimates may not be comparable. Source: UNICEF, 2012.
MATERNAL NUTRITION AND HEALTH
DISPARITIES IN NUTRITION
Causes of under-five deaths, 2010Globally, undernutrition contributes to more than one third of child deaths
NUTRITIONAL STATUS
Stunting disparitiesPercentage of children <5 years old stunted, by selected background characteristics
DEMOGRAPHICS AND BACKGROUND INFORMATION
INFANT AND YOUNG CHILD FEEDING
Source: WHO/CHERG, 2012.
Under-five mortality rateDeaths per 1,000 live births
Source: IGME, 2012.AnaemiaPrevalence of anaemia among selected populations
Infant feeding practices, by ageExclusive breastfeeding trends Percentage of infants <6 months old exclusively breastfed
Breastfed and non-milk liquids
Breastfed and solid/semi-solid foods
Breastfed and plain water only
Breastfed and other milk/formula
Exclusively breastfed
Weaned (not breastfed)
Stunting trendsPercentage of children <5 years old stunted
Underweight trendsPercentage of children <5 years old underweight
Source: Other NS, 2011.
Indicator
Gender Residence Wealth quintile
SourceMale Female
Ratio of male to female
Urban RuralRatio of urban to
ruralPoorest Second Middle Fourth Richest
Ratio of richest to poorest
Equity chart
Stunting prevalence (%) – – – 37 46 0.8 – – – – – – Other NS, 2011
Underweight prevalence (%) – – – 27 33 0.8 – – – – – – Other NS, 2011
Wasting prevalence (%) – – – 13 16 0.8 – – – – – – Other NS, 2011
Women with low BMI (<18.5 kg/m2, %) – 18 – 14 20 0.7 – – – – – – Other NS, 2011
Women with high BMI (≥25 kg/m2, %) – 29 – 40 24 1.7 – – – – – – Other NS, 2011
Improved facilities Shared facilitiesUnimproved facilities Open defecation
27
18
3
52
48
23
6
23
72
146
8
72
18
6
4
7
20
1
72
34
26
6
34
0%
20%
40%
60%
80%
100%
1990 2010Total Urban Rural
1990 2010 1990 2010
2005 2006 2007 2008 2009 2010 2011
100 100 10090879197
0%
20%
40%
60%
80%
100%
Iodized salt trends*
Percentage of households with adequately iodized salt1,467,000 newborns are unprotected against iodine deficiency disorders (2011)
Source: DHS, 2006–2007.
0–1 2–3 4–5 6–7 8–9 10–11 12–13 14–15 16–17 18–19 20–21 22–23
Age (months)
0%
20%
40%
60%
80%
100%
16
37
1995MICS
2006–2007DHS
0%
20%
40%
60%
80%
100%
MDG 1 progress Insufficient progress
Underweight (under-fives, 000) 6,965
Overweight (under-fives, 000) 1,415
Stunted (under-fives, 000) 9,663
Wasted (under-fives, 000) 3,339
Severely wasted (under-fives, 000) 1,283
Total population (000) 176,745 (2011)
Total under-five population (000) 22,113 (2011)
Total number of births (000) 4,764 (2011)
Under-five mortality rate (per 1,000 live births) 72 (2011)
Total number of under-five deaths (000) 352 (2011)
Infant mortality rate (per 1,000 live births) 59 (2011)
Neonatal mortality rate (per 1,000 live births) 36 (2011)
HIV prevalence rate (15–49 years old, %) 0.1 (2011)
Population below international poverty line of US$1.25 per day (%)
21 (2008)
GNI per capita (US$) 1,120 (2011)
Primary school net attendance ratio (% female, % male)
62, 70 (2006–2007)
1990 1995 2000 2005 2010 2015
122
72
41
0
20
40
60
80
100
120
140
MDG 4target
Piped on premises Other improvedUnimproved Surface water
23
7
62
8
36
5
56
3
56
4
39
1
58
4
38
0
8
8
73
11
23
6
66
5
0%
20%
40%
60%
80%
100%
1990 2010Total Urban Rural
1990 2010 1990 2010
0%
20%
40%
60%
80%
100%
55
42 44
1990–1991DHS
2001Other NS
2011Other NS
0% 20% 40% 60% 80% 100%
Poorest 20%
RuralUrban
GirlsBoys
Second 20%Middle 20%Fourth 20%
Richest 20%
3746
0%
20%
40%
60%
80%
100%MDG 1: NO PROGRESSMDG 1: INSUFFICIENT PROGRESS
1990–1991DHS
1995MICS
2001Other NS
2011Other NS
39 34 31 32
Neonatal 46%
HIV/AIDS 0%
Diarrhoea 10%
Measles 1%
Injuries 5%
Pneumonia 15%
Malaria 0%
Others 21%
Meningitis 3%
PAKISTANPAKISTAN
NO DATA
To increase child survival, promote child development and prevent stunting, nutrition interventions need to be delivered during pregnancy and the first two years of life.
PREGNANCY BIRTH 0–5 MONTHS 6–23 MONTHS 24–59 MONTHS
Use of iron-folic acid supplements
Early initiation of breastfeeding(within 1 hour of birth)
International Code of Marketing of Breast-milk Substitutes
Maternity protection in accordance with ILO Convention 183
Minimum dietary diversity
Minimum acceptable diet
Full coverage of vitamin A supplementation
Treatment of severe acute malnutrition included in national health plans
Introduction to solid, semi-solid or soft foods (6–8 months)
Continued breastfeeding at 1 year old
Infants not weighed at birthHouseholds with adequately iodized salt
Exclusive breastfeeding(<6 months)
79%
36%
No
Yes
4%
8%
90%
No
37%90%
29%
69%
16%
Maternal mortality ratio, adjusted (per 100,000 live births)
260 (2010)
Maternal mortality ratio, reported(per 100,000 live births)
280 (2007)
Total number of maternal deaths 12,000 (2010)
Lifetime risk of maternal death (1 in : ) 110 (2010)
Women with low BMI (<18.5 kg/m2, %) 18 (2011)
Anaemia, non-pregnant women (<120g/l, %) – –
Antenatal care (at least one visit, %) 61 (2007)
Antenatal care (at least four visits, %) 28 (2007)
Skilled attendant at birth (%) 43 (2011)
Low birthweight (<2,500 grams, %) 32 (2006–2007)
Women 20–24 years old who gave birth before age 18 (%)
10 (2007)
0%
20%
40%
60%
80%
100%
1995MICS
2001–2002Other NS
2011Other NS
19 17
69
Burden of malnutrition (2011)
Stunting country rank 3
Share of world stunting burden (%) 6
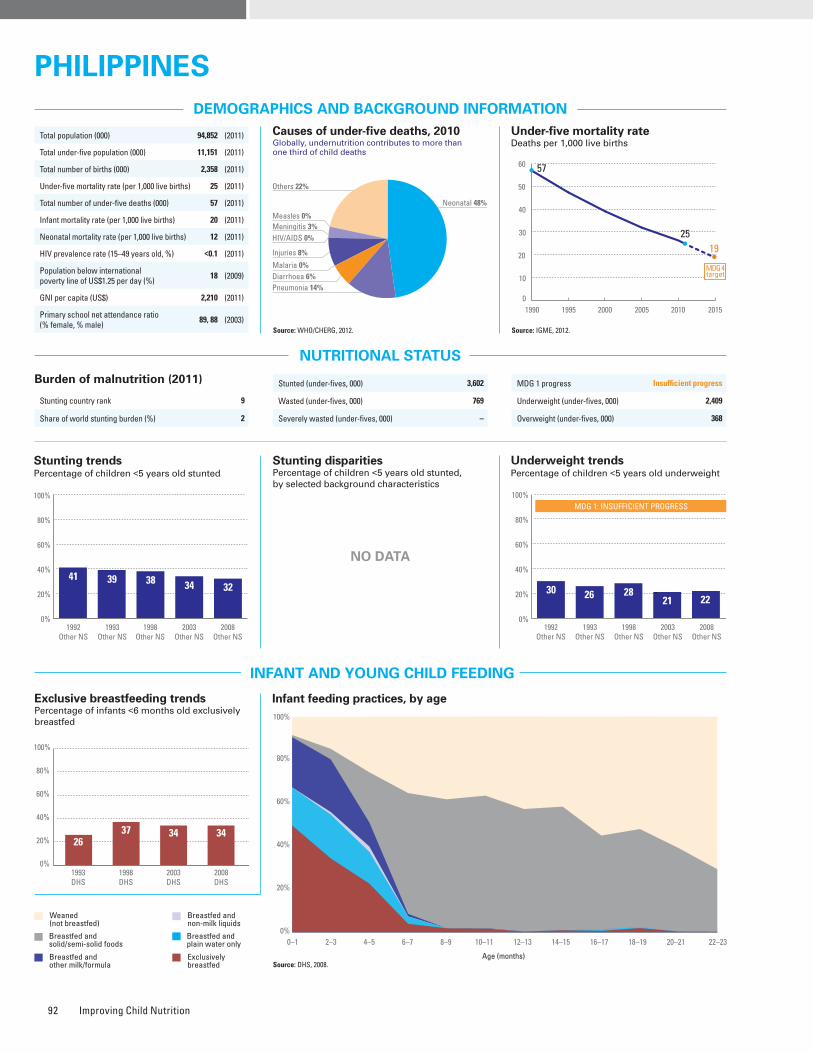
Improving Child Nutrition92
ESSENTIAL NUTRITION PRACTICES AND INTERVENTIONS DURING THE LIFE CYCLE
MICRONUTRIENTS
WATER AND SANITATION
Improved drinking water coveragePercentage of population, by type of drinking water source, 1990–2010
Source: WHO/UNICEF JMP, 2012.
Improved sanitation coveragePercentage of population, by type of sanitation facility, 1990–2010
Source: WHO/UNICEF JMP, 2012.
Vitamin A supplementationPercentage of children 6–59 months old receiving two doses of vitamin A during calendar year (full coverage)
* Estimates may not be comparable. Source: UNICEF, 2012.
MATERNAL NUTRITION AND HEALTH
DISPARITIES IN NUTRITION
Causes of under-five deaths, 2010Globally, undernutrition contributes to more than one third of child deaths
NUTRITIONAL STATUS
Stunting disparitiesPercentage of children <5 years old stunted, by selected background characteristics
DEMOGRAPHICS AND BACKGROUND INFORMATION
INFANT AND YOUNG CHILD FEEDING
Source: WHO/CHERG, 2012.
Under-five mortality rateDeaths per 1,000 live births
Source: IGME, 2012.AnaemiaPrevalence of anaemia among selected populations
Infant feeding practices, by ageExclusive breastfeeding trends Percentage of infants <6 months old exclusively breastfed
Breastfed and non-milk liquids
Breastfed and solid/semi-solid foods
Breastfed and plain water only
Breastfed and other milk/formula
Exclusively breastfed
Weaned (not breastfed)
Stunting trendsPercentage of children <5 years old stunted
Underweight trendsPercentage of children <5 years old underweight
Indicator
Gender Residence Wealth quintile
SourceMale Female
Ratio of male to female
Urban RuralRatio of urban to
ruralPoorest Second Middle Fourth Richest
Ratio of richest to poorest
Equity chart
Stunting prevalence (%) – – – – – – – – – – – – –
Underweight prevalence (%) – – – – – – – – – – – – –
Wasting prevalence (%) – – – – – – – – – – – – –
Women with low BMI (<18.5 kg/m2, %) – – – – – – – – – – – – –
Women with high BMI (≥25 kg/m2, %) – – – – – – – – – – – – –
Improved facilities Shared facilitiesUnimproved facilities Open defecation
57
15
12
16
74
216
8
69
815
8
79
117
3
45
22
10
23
69
3
16
12
0%
20%
40%
60%
80%
100%
1990 2010Total Urban Rural
1990 2010 1990 2010
2005 2006 2007 2008 2009 2010 2011
85 86 83919186
0%
20%
40%
60%
80%
100%
Iodized salt trends*
Percentage of households with adequately iodized salt1,308,000 newborns are unprotected against iodine deficiency disorders (2011)
Source: DHS, 2008.
0–1 2–3 4–5 6–7 8–9 10–11 12–13 14–15 16–17 18–19 20–21 22–23
Age (months)
0%
20%
40%
60%
80%
100%
2637 34 34
1993DHS
1998DHS
2003DHS
2008DHS
0%
20%
40%
60%
80%
100%
Stunted (under-fives, 000) 3,602
Wasted (under-fives, 000) 769
Severely wasted (under-fives, 000) –
MDG 1 progress Insufficient progress
Underweight (under-fives, 000) 2,409
Overweight (under-fives, 000) 368
Total population (000) 94,852 (2011)
Total under-five population (000) 11,151 (2011)
Total number of births (000) 2,358 (2011)
Under-five mortality rate (per 1,000 live births) 25 (2011)
Total number of under-five deaths (000) 57 (2011)
Infant mortality rate (per 1,000 live births) 20 (2011)
Neonatal mortality rate (per 1,000 live births) 12 (2011)
HIV prevalence rate (15–49 years old, %) <0.1 (2011)
Population below international poverty line of US$1.25 per day (%)
18 (2009)
GNI per capita (US$) 2,210 (2011)
Primary school net attendance ratio (% female, % male)
89, 88 (2003)1990 1995 2000 2005 2010 2015
57
2519
0
10
20
30
40
50
60
MDG 4target
To increase child survival, promote child development and prevent stunting, nutrition interventions need to be delivered during pregnancy and the first two years of life.
PREGNANCY BIRTH 0–5 MONTHS 6–23 MONTHS 24–59 MONTHS
Use of iron-folic acid supplements
Early initiation of breastfeeding(within 1 hour of birth)
International Code of Marketing of Breast-milk Substitutes
Maternity protection in accordance with ILO Convention 183
Minimum dietary diversity
Minimum acceptable diet
Full coverage of vitamin A supplementation
Treatment of severe acute malnutrition included in national health plans
Introduction to solid, semi-solid or soft foods (6–8 months)
Continued breastfeeding at 1 year old
Infants not weighed at birthHouseholds with adequately iodized salt
Exclusive breastfeeding(<6 months)
58%
90%
No
Yes
–
–
91%
No
34%�28%
54%
45%
34%
Piped on premises Other improvedUnimproved Surface water
24
13
61
2
43
7
49
1
40
6
53
1
61
7
32
0
9
21
68
2
25
7
67
1
0%
20%
40%
60%
80%
100%
1990 2010Total Urban Rural
1990 2010 1990 2010
0%
20%
40%
60%
80%
100%
41 39 38 34 32
1992Other NS
1993Other NS
1998Other NS
2003Other NS
2008Other NS
0%
20%
40%
60%
80%
100%
52
1992Other NS
1993Other NS
1998Other NS
2003Other NS
2008Other NS
MDG 1: INSUFFICIENT PROGRESS
30 26 2821 22
Neonatal 48%
HIV/AIDS 0%
Diarrhoea 6%
Measles 0%
Injuries 8%
Pneumonia 14%
Malaria 0%
Others 22%
Meningitis 3%
PHILIPPINESPHILIPPINES
NO DATA
NO DATA
Maternal mortality ratio, adjusted (per 100,000 live births)
99 (2010)
Maternal mortality ratio, reported(per 100,000 live births)
160 (2006)
Total number of maternal deaths 2,300 (2010)
Lifetime risk of maternal death (1 in : ) 300 (2010)
Women with low BMI (<18.5 kg/m2, %) – –
Anaemia, non-pregnant women (<120g/l, %) – –
Antenatal care (at least one visit, %) 91 (2008)
Antenatal care (at least four visits, %) 78 (2008)
Skilled attendant at birth (%) 62 (2008)
Low birthweight (<2,500 grams, %) 21 (2008)
Women 20–24 years old who gave birth before age 18 (%)
7 (2008)
0%
20%
40%
60%
80%
100%
1996MICS
2000MICS
2003Other NS
2005Other NS
1524
5645
Burden of malnutrition (2011)
Stunting country rank 9
Share of world stunting burden (%) 2
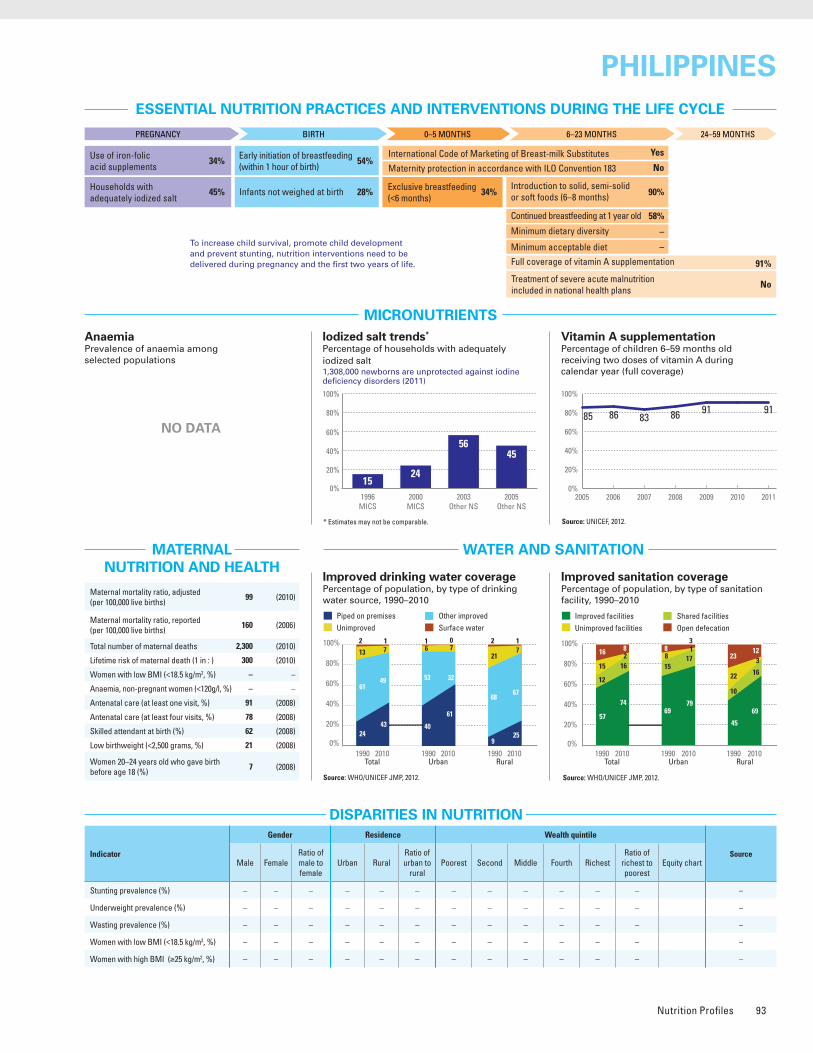
Nutrition Profiles 93
ESSENTIAL NUTRITION PRACTICES AND INTERVENTIONS DURING THE LIFE CYCLE
MICRONUTRIENTS
WATER AND SANITATION
Improved drinking water coveragePercentage of population, by type of drinking water source, 1990–2010
Source: WHO/UNICEF JMP, 2012.
Improved sanitation coveragePercentage of population, by type of sanitation facility, 1990–2010
Source: WHO/UNICEF JMP, 2012.
Vitamin A supplementationPercentage of children 6–59 months old receiving two doses of vitamin A during calendar year (full coverage)
* Estimates may not be comparable. Source: UNICEF, 2012.
MATERNAL NUTRITION AND HEALTH
DISPARITIES IN NUTRITION
Causes of under-five deaths, 2010Globally, undernutrition contributes to more than one third of child deaths
NUTRITIONAL STATUS
Stunting disparitiesPercentage of children <5 years old stunted, by selected background characteristics
DEMOGRAPHICS AND BACKGROUND INFORMATION
INFANT AND YOUNG CHILD FEEDING
Source: WHO/CHERG, 2012.
Under-five mortality rateDeaths per 1,000 live births
Source: IGME, 2012.AnaemiaPrevalence of anaemia among selected populations
Infant feeding practices, by ageExclusive breastfeeding trends Percentage of infants <6 months old exclusively breastfed
Breastfed and non-milk liquids
Breastfed and solid/semi-solid foods
Breastfed and plain water only
Breastfed and other milk/formula
Exclusively breastfed
Weaned (not breastfed)
Stunting trendsPercentage of children <5 years old stunted
Underweight trendsPercentage of children <5 years old underweight
Indicator
Gender Residence Wealth quintile
SourceMale Female
Ratio of male to female
Urban RuralRatio of urban to
ruralPoorest Second Middle Fourth Richest
Ratio of richest to poorest
Equity chart
Stunting prevalence (%) – – – – – – – – – – – – –
Underweight prevalence (%) – – – – – – – – – – – – –
Wasting prevalence (%) – – – – – – – – – – – – –
Women with low BMI (<18.5 kg/m2, %) – – – – – – – – – – – – –
Women with high BMI (≥25 kg/m2, %) – – – – – – – – – – – – –
Improved facilities Shared facilitiesUnimproved facilities Open defecation
57
15
12
16
74
216
8
69
815
8
79
117
3
45
22
10
23
69
3
16
12
0%
20%
40%
60%
80%
100%
1990 2010Total Urban Rural
1990 2010 1990 2010
2005 2006 2007 2008 2009 2010 2011
85 86 83919186
0%
20%
40%
60%
80%
100%
Iodized salt trends*
Percentage of households with adequately iodized salt1,308,000 newborns are unprotected against iodine deficiency disorders (2011)
Source: DHS, 2008.
0–1 2–3 4–5 6–7 8–9 10–11 12–13 14–15 16–17 18–19 20–21 22–23
Age (months)
0%
20%
40%
60%
80%
100%
2637 34 34
1993DHS
1998DHS
2003DHS
2008DHS
0%
20%
40%
60%
80%
100%
Stunted (under-fives, 000) 3,602
Wasted (under-fives, 000) 769
Severely wasted (under-fives, 000) –
MDG 1 progress Insufficient progress
Underweight (under-fives, 000) 2,409
Overweight (under-fives, 000) 368
Total population (000) 94,852 (2011)
Total under-five population (000) 11,151 (2011)
Total number of births (000) 2,358 (2011)
Under-five mortality rate (per 1,000 live births) 25 (2011)
Total number of under-five deaths (000) 57 (2011)
Infant mortality rate (per 1,000 live births) 20 (2011)
Neonatal mortality rate (per 1,000 live births) 12 (2011)
HIV prevalence rate (15–49 years old, %) <0.1 (2011)
Population below international poverty line of US$1.25 per day (%)
18 (2009)
GNI per capita (US$) 2,210 (2011)
Primary school net attendance ratio (% female, % male)
89, 88 (2003)1990 1995 2000 2005 2010 2015
57
2519
0
10
20
30
40
50
60
MDG 4target
To increase child survival, promote child development and prevent stunting, nutrition interventions need to be delivered during pregnancy and the first two years of life.
PREGNANCY BIRTH 0–5 MONTHS 6–23 MONTHS 24–59 MONTHS
Use of iron-folic acid supplements
Early initiation of breastfeeding(within 1 hour of birth)
International Code of Marketing of Breast-milk Substitutes
Maternity protection in accordance with ILO Convention 183
Minimum dietary diversity
Minimum acceptable diet
Full coverage of vitamin A supplementation
Treatment of severe acute malnutrition included in national health plans
Introduction to solid, semi-solid or soft foods (6–8 months)
Continued breastfeeding at 1 year old
Infants not weighed at birthHouseholds with adequately iodized salt
Exclusive breastfeeding(<6 months)
58%
90%
No
Yes
–
–
91%
No
34%�28%
54%
45%
34%
Piped on premises Other improvedUnimproved Surface water
24
13
61
2
43
7
49
1
40
6
53
1
61
7
32
0
9
21
68
2
25
7
67
1
0%
20%
40%
60%
80%
100%
1990 2010Total Urban Rural
1990 2010 1990 2010
0%
20%
40%
60%
80%
100%
41 39 38 34 32
1992Other NS
1993Other NS
1998Other NS
2003Other NS
2008Other NS
0%
20%
40%
60%
80%
100%
52
1992Other NS
1993Other NS
1998Other NS
2003Other NS
2008Other NS
MDG 1: INSUFFICIENT PROGRESS
30 26 2821 22
Neonatal 48%
HIV/AIDS 0%
Diarrhoea 6%
Measles 0%
Injuries 8%
Pneumonia 14%
Malaria 0%
Others 22%
Meningitis 3%
PHILIPPINESPHILIPPINES
NO DATA
NO DATA
Maternal mortality ratio, adjusted (per 100,000 live births)
99 (2010)
Maternal mortality ratio, reported(per 100,000 live births)
160 (2006)
Total number of maternal deaths 2,300 (2010)
Lifetime risk of maternal death (1 in : ) 300 (2010)
Women with low BMI (<18.5 kg/m2, %) – –
Anaemia, non-pregnant women (<120g/l, %) – –
Antenatal care (at least one visit, %) 91 (2008)
Antenatal care (at least four visits, %) 78 (2008)
Skilled attendant at birth (%) 62 (2008)
Low birthweight (<2,500 grams, %) 21 (2008)
Women 20–24 years old who gave birth before age 18 (%)
7 (2008)
0%
20%
40%
60%
80%
100%
1996MICS
2000MICS
2003Other NS
2005Other NS
1524
5645
Burden of malnutrition (2011)
Stunting country rank 9
Share of world stunting burden (%) 2
Improving Child Nutrition94
ESSENTIAL NUTRITION PRACTICES AND INTERVENTIONS DURING THE LIFE CYCLE
MICRONUTRIENTS
WATER AND SANITATION
Improved drinking water coveragePercentage of population, by type of drinking water source, 1990–2010
Source: WHO/UNICEF JMP, 2012.
Improved sanitation coveragePercentage of population, by type of sanitation facility, 1990–2010
Source: WHO/UNICEF JMP, 2012.
Vitamin A supplementationPercentage of children 6–59 months old receiving two doses of vitamin A during calendar year (full coverage)
* Estimates may not be comparable. Source: UNICEF, 2012.
MATERNAL NUTRITION AND HEALTH
DISPARITIES IN NUTRITION
Causes of under-five deaths, 2010Globally, undernutrition contributes to more than one third of child deaths
NUTRITIONAL STATUS
Stunted (under-fives, 000) 845
Wasted (under-fives, 000) 54
Severely wasted (under-fives, 000) 15
MDG 1 progress On track
Underweight (under-fives, 000) 218
Overweight (under-fives, 000) 128
Stunting disparitiesPercentage of children <5 years old stunted, by selected background characteristics
DEMOGRAPHICS AND BACKGROUND INFORMATION
INFANT AND YOUNG CHILD FEEDING
Source: DHS, 2010.
Source: WHO/CHERG, 2012.
Under-five mortality rateDeaths per 1,000 live births
Source: IGME, 2012.AnaemiaPrevalence of anaemia among selected populations
Iodized salt trends*
Percentage of households with adequately iodized salt3,000 newborns are unprotected against iodine deficiency disorders (2011)
Source: DHS, 2010.
0%
20%
40%
60%
80%
100%
0–1 2–3 4–5 6–7 8–9 10–11 12–13 14–15 16–17 18–19 20–21 22–23
Age (months)
Infant feeding practices, by ageExclusive breastfeeding trends Percentage of infants <6 months old exclusively breastfed
Breastfed and non-milk liquids
Breastfed and solid/semi-solid foods
Breastfed and plain water only
Breastfed and other milk/formula
Exclusively breastfed
Weaned (not breastfed)
Stunting trendsPercentage of children <5 years old stunted
Underweight trendsPercentage of children <5 years old underweight
Burden of malnutrition (2011)
Stunting country rank 29
Share of world stunting burden (%) <1%
Source: DHS, 2010.
Indicator
Gender Residence Wealth quintile
SourceMale Female
Ratio of male to female
Urban RuralRatio of urban to
ruralPoorest Second Middle Fourth Richest
Ratio of richest to poorest
Equity chart
Stunting prevalence (%) 47 41 1.2 27 47 0.6 54 51 46 39 26 0.5 DHS, 2010
Underweight prevalence (%) 13 10 1.3 6 12 0.5 16 14 11 9 5 0.3 DHS, 2010
Wasting prevalence (%) 3 2 1.4 4 3 1.3 4 3 2 2 3 0.8 DHS, 2010
Women with low BMI (<18.5 kg/m2, %) – 7 – 7 7 0.9 10 9 7 7 5 0.5 DHS, 2010
Women with high BMI (≥25 kg/m2, %) – 16 – 25 15 1.7 11 10 14 18 28 2.6 DHS, 2010
0%
20%
40%
60%
80%
100%
83 83 88 85
1992DHS
2000DHS
2005DHS
2010DHS
0%
20%
40%
60%
80%
100%
2005 2006 2007 2008 2009 2010 2011
9978 76 76
9294
0%
20%
40%
60%
80%
100%
9582 88
99
1996Other NS
2000DHS
2005DHS
2010DHS
1990 1995 2000 2005 2010 2015
156
54 52
0
50
100
150
200
250
300
MDG 4target
0%
20%
40%
60%
80%
100%
Non-pregnant women
Pregnant women
Preschool-aged children
17 20
38
Public health problemsevere
moderate
Improved facilities Shared facilitiesUnimproved facilities Open defecation
0%
20%
40%
60%
80%
100%
36
52
5
7
55
34
8
3
69
4
24
3
52
29
18
1
34
55
4
7
56
35
6
3
1990 2010Total Urban Rural
1990 2010 1990 2010
To increase child survival, promote child development and prevent stunting, nutrition interventions need to be delivered during pregnancy and the first two years of life.
PREGNANCY BIRTH 0–5 MONTHS 6–23 MONTHS 24–59 MONTHS
Use of iron-folic acid supplements
Early initiation of breastfeeding(within 1 hour of birth)
International Code of Marketing of Breast-milk Substitutes
Maternity protection in accordance with ILO Convention 183
Minimum dietary diversity
Minimum acceptable diet
Full coverage of vitamin A supplementation
Treatment of severe acute malnutrition included in national health plans
Introduction to solid, semi-solid or soft foods (6–8 months)
Continued breastfeeding at 1 year old
Infants not weighed at birthHouseholds with adequately iodized salt
Exclusive breastfeeding(<6 months)
95%
79%
No
No
26%
17%
76%
Yes
85%32%
71%
99%
1%
Piped on premises Other improvedUnimproved Surface water
2
11
64
23
3
20
62
15
33
1
62
4
13
14
63
10
0
12
64
24
1
21
62
16
0%
20%
40%
60%
80%
100%
1990 2010Total Urban Rural
1990 2010 1990 2010
0%
20%
40%
60%
80%
100%
5745 48 52
44
1992DHS
1996Other NS
2000DHS
2005DHS
2010DHS
0% 20% 40% 60% 80% 100%
Poorest 20%
RuralUrban
GirlsBoys
Second 20%Middle 20%Fourth 20%
Richest 20%
4741
2747
54
26
5146
39
0%
20%
40%
60%
80%
100%
57 52
1992DHS
1996Other NS
2000DHS
2005DHS
2010DHS
MDG 1: ON TRACK
24 23 20 1811
Neonatal 34%
HIV/AIDS 2%
Diarrhoea 12%
Measles 0%
Injuries 6%
Pneumonia 17%Malaria 2%
Others 25%
Meningitis 2%
RWANDARWANDA
Total population (000) 10,943 (2011)
Total under-five population (000) 1,912 (2011)
Total number of births (000) 449 (2011)
Under-five mortality rate (per 1,000 live births) 54 (2011)
Total number of under-five deaths (000) 23 (2011)
Infant mortality rate (per 1,000 live births) 38 (2011)
Neonatal mortality rate (per 1,000 live births) 21 (2011)
HIV prevalence rate (15–49 years old, %) 2.9 (2011)
Population below international poverty line of US$1.25 per day (%)
63 (2011)
GNI per capita (US$) 570 (2011)
Primary school net attendance ratio (% female, % male)
89, 86 (2010)
Maternal mortality ratio, adjusted (per 100,000 live births)
340 (2010)
Maternal mortality ratio, reported(per 100,000 live births)
480 (2010)
Total number of maternal deaths 1,500 (2010)
Lifetime risk of maternal death (1 in : ) 54 (2010)
Women with low BMI (<18.5 kg/m2, %) 7 (2010)
Anaemia, non-pregnant women (<120g/l, %) 17 (2010)
Antenatal care (at least one visit, %) 98 (2010)
Antenatal care (at least four visits, %) 35 (2010)
Skilled attendant at birth (%) 69 (2010)
Low birthweight (<2,500 grams, %) 7 (2010)
Women 20–24 years old who gave birth before age 18 (%)
5 (2010)
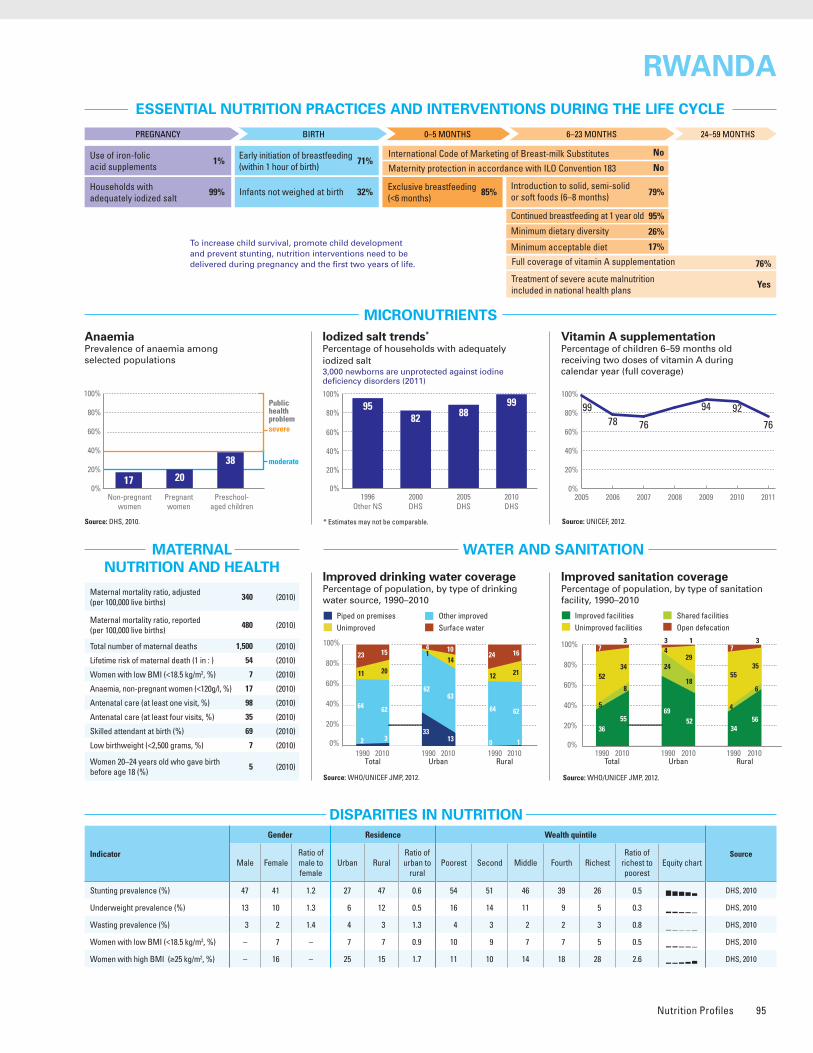
Nutrition Profiles 95
ESSENTIAL NUTRITION PRACTICES AND INTERVENTIONS DURING THE LIFE CYCLE
MICRONUTRIENTS
WATER AND SANITATION
Improved drinking water coveragePercentage of population, by type of drinking water source, 1990–2010
Source: WHO/UNICEF JMP, 2012.
Improved sanitation coveragePercentage of population, by type of sanitation facility, 1990–2010
Source: WHO/UNICEF JMP, 2012.
Vitamin A supplementationPercentage of children 6–59 months old receiving two doses of vitamin A during calendar year (full coverage)
* Estimates may not be comparable. Source: UNICEF, 2012.
MATERNAL NUTRITION AND HEALTH
DISPARITIES IN NUTRITION
Causes of under-five deaths, 2010Globally, undernutrition contributes to more than one third of child deaths
NUTRITIONAL STATUS
Stunted (under-fives, 000) 845
Wasted (under-fives, 000) 54
Severely wasted (under-fives, 000) 15
MDG 1 progress On track
Underweight (under-fives, 000) 218
Overweight (under-fives, 000) 128
Stunting disparitiesPercentage of children <5 years old stunted, by selected background characteristics
DEMOGRAPHICS AND BACKGROUND INFORMATION
INFANT AND YOUNG CHILD FEEDING
Source: DHS, 2010.
Source: WHO/CHERG, 2012.
Under-five mortality rateDeaths per 1,000 live births
Source: IGME, 2012.AnaemiaPrevalence of anaemia among selected populations
Iodized salt trends*
Percentage of households with adequately iodized salt3,000 newborns are unprotected against iodine deficiency disorders (2011)
Source: DHS, 2010.
0%
20%
40%
60%
80%
100%
0–1 2–3 4–5 6–7 8–9 10–11 12–13 14–15 16–17 18–19 20–21 22–23
Age (months)
Infant feeding practices, by ageExclusive breastfeeding trends Percentage of infants <6 months old exclusively breastfed
Breastfed and non-milk liquids
Breastfed and solid/semi-solid foods
Breastfed and plain water only
Breastfed and other milk/formula
Exclusively breastfed
Weaned (not breastfed)
Stunting trendsPercentage of children <5 years old stunted
Underweight trendsPercentage of children <5 years old underweight
Burden of malnutrition (2011)
Stunting country rank 29
Share of world stunting burden (%) <1%
Source: DHS, 2010.
Indicator
Gender Residence Wealth quintile
SourceMale Female
Ratio of male to female
Urban RuralRatio of urban to
ruralPoorest Second Middle Fourth Richest
Ratio of richest to poorest
Equity chart
Stunting prevalence (%) 47 41 1.2 27 47 0.6 54 51 46 39 26 0.5 DHS, 2010
Underweight prevalence (%) 13 10 1.3 6 12 0.5 16 14 11 9 5 0.3 DHS, 2010
Wasting prevalence (%) 3 2 1.4 4 3 1.3 4 3 2 2 3 0.8 DHS, 2010
Women with low BMI (<18.5 kg/m2, %) – 7 – 7 7 0.9 10 9 7 7 5 0.5 DHS, 2010
Women with high BMI (≥25 kg/m2, %) – 16 – 25 15 1.7 11 10 14 18 28 2.6 DHS, 2010
0%
20%
40%
60%
80%
100%
83 83 88 85
1992DHS
2000DHS
2005DHS
2010DHS
0%
20%
40%
60%
80%
100%
2005 2006 2007 2008 2009 2010 2011
9978 76 76
9294
0%
20%
40%
60%
80%
100%
9582 88
99
1996Other NS
2000DHS
2005DHS
2010DHS
1990 1995 2000 2005 2010 2015
156
54 52
0
50
100
150
200
250
300
MDG 4target
0%
20%
40%
60%
80%
100%
Non-pregnant women
Pregnant women
Preschool-aged children
17 20
38
Public health problemsevere
moderate
Improved facilities Shared facilitiesUnimproved facilities Open defecation
0%
20%
40%
60%
80%
100%
36
52
5
7
55
34
8
3
69
4
24
3
52
29
18
1
34
55
4
7
56
35
6
3
1990 2010Total Urban Rural
1990 2010 1990 2010
To increase child survival, promote child development and prevent stunting, nutrition interventions need to be delivered during pregnancy and the first two years of life.
PREGNANCY BIRTH 0–5 MONTHS 6–23 MONTHS 24–59 MONTHS
Use of iron-folic acid supplements
Early initiation of breastfeeding(within 1 hour of birth)
International Code of Marketing of Breast-milk Substitutes
Maternity protection in accordance with ILO Convention 183
Minimum dietary diversity
Minimum acceptable diet
Full coverage of vitamin A supplementation
Treatment of severe acute malnutrition included in national health plans
Introduction to solid, semi-solid or soft foods (6–8 months)
Continued breastfeeding at 1 year old
Infants not weighed at birthHouseholds with adequately iodized salt
Exclusive breastfeeding(<6 months)
95%
79%
No
No
26%
17%
76%
Yes
85%32%
71%
99%
1%
Piped on premises Other improvedUnimproved Surface water
2
11
64
23
3
20
62
15
33
1
62
4
13
14
63
10
0
12
64
24
1
21
62
16
0%
20%
40%
60%
80%
100%
1990 2010Total Urban Rural
1990 2010 1990 2010
0%
20%
40%
60%
80%
100%
5745 48 52
44
1992DHS
1996Other NS
2000DHS
2005DHS
2010DHS
0% 20% 40% 60% 80% 100%
Poorest 20%
RuralUrban
GirlsBoys
Second 20%Middle 20%Fourth 20%
Richest 20%
4741
2747
54
26
5146
39
0%
20%
40%
60%
80%
100%
57 52
1992DHS
1996Other NS
2000DHS
2005DHS
2010DHS
MDG 1: ON TRACK
24 23 20 1811
Neonatal 34%
HIV/AIDS 2%
Diarrhoea 12%
Measles 0%
Injuries 6%
Pneumonia 17%Malaria 2%
Others 25%
Meningitis 2%
RWANDARWANDA
Total population (000) 10,943 (2011)
Total under-five population (000) 1,912 (2011)
Total number of births (000) 449 (2011)
Under-five mortality rate (per 1,000 live births) 54 (2011)
Total number of under-five deaths (000) 23 (2011)
Infant mortality rate (per 1,000 live births) 38 (2011)
Neonatal mortality rate (per 1,000 live births) 21 (2011)
HIV prevalence rate (15–49 years old, %) 2.9 (2011)
Population below international poverty line of US$1.25 per day (%)
63 (2011)
GNI per capita (US$) 570 (2011)
Primary school net attendance ratio (% female, % male)
89, 86 (2010)
Maternal mortality ratio, adjusted (per 100,000 live births)
340 (2010)
Maternal mortality ratio, reported(per 100,000 live births)
480 (2010)
Total number of maternal deaths 1,500 (2010)
Lifetime risk of maternal death (1 in : ) 54 (2010)
Women with low BMI (<18.5 kg/m2, %) 7 (2010)
Anaemia, non-pregnant women (<120g/l, %) 17 (2010)
Antenatal care (at least one visit, %) 98 (2010)
Antenatal care (at least four visits, %) 35 (2010)
Skilled attendant at birth (%) 69 (2010)
Low birthweight (<2,500 grams, %) 7 (2010)
Women 20–24 years old who gave birth before age 18 (%)
5 (2010)
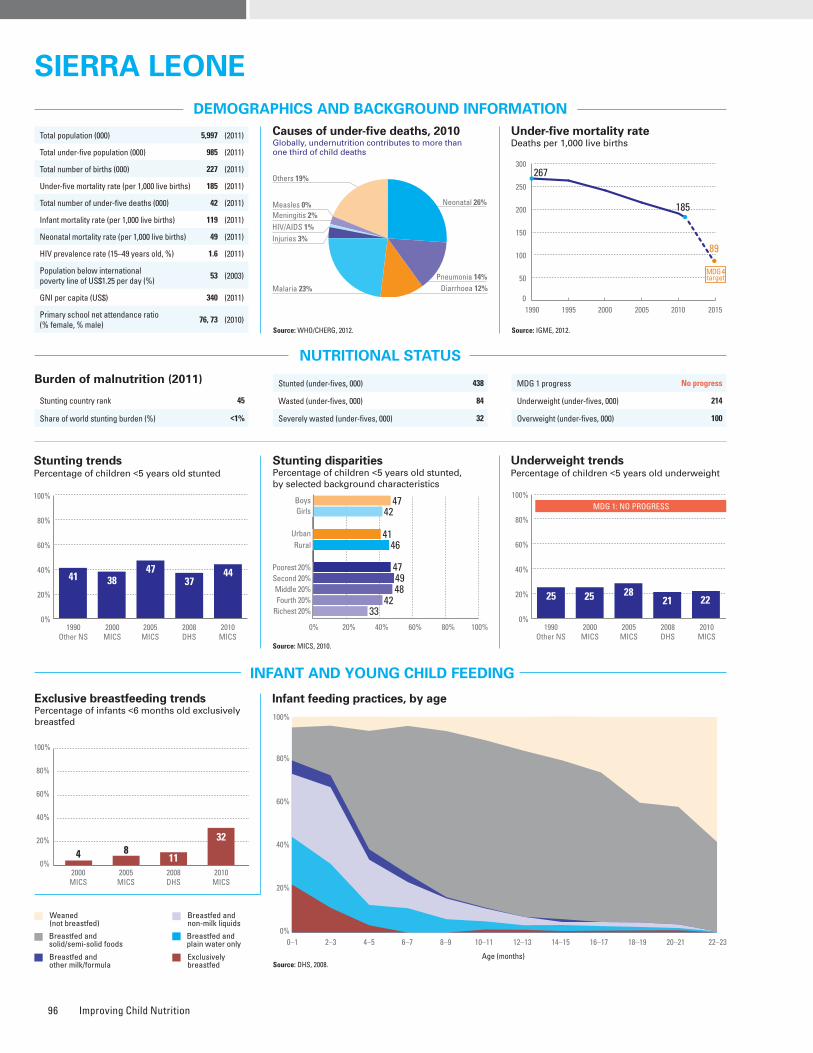
Improving Child Nutrition96
ESSENTIAL NUTRITION PRACTICES AND INTERVENTIONS DURING THE LIFE CYCLE
MICRONUTRIENTS
WATER AND SANITATION
Improved drinking water coveragePercentage of population, by type of drinking water source, 1990–2010
Source: WHO/UNICEF JMP, 2012.
Improved sanitation coveragePercentage of population, by type of sanitation facility, 1990–2010
Source: WHO/UNICEF JMP, 2012.
Vitamin A supplementationPercentage of children 6–59 months old receiving two doses of vitamin A during calendar year (full coverage)
* Estimates may not be comparable. Source: UNICEF, 2012.
MATERNAL NUTRITION AND HEALTH
DISPARITIES IN NUTRITION
Causes of under-five deaths, 2010Globally, undernutrition contributes to more than one third of child deaths
NUTRITIONAL STATUS
Stunting disparitiesPercentage of children <5 years old stunted, by selected background characteristics
DEMOGRAPHICS AND BACKGROUND INFORMATION
INFANT AND YOUNG CHILD FEEDING
Source: WHO/CHERG, 2012.
Under-five mortality rateDeaths per 1,000 live births
Source: IGME, 2012.AnaemiaPrevalence of anaemia among selected populations
Infant feeding practices, by ageExclusive breastfeeding trends Percentage of infants <6 months old exclusively breastfed
Breastfed and non-milk liquids
Breastfed and solid/semi-solid foods
Breastfed and plain water only
Breastfed and other milk/formula
Exclusively breastfed
Weaned (not breastfed)
Stunting trendsPercentage of children <5 years old stunted
Underweight trendsPercentage of children <5 years old underweight
Burden of malnutrition (2011)
Stunting country rank 45
Share of world stunting burden (%) <1%
Maternal mortality ratio, adjusted (per 100,000 live births)
890 (2010)
Maternal mortality ratio, reported(per 100,000 live births)
860 (2008)
Total number of maternal deaths 2,000 (2010)
Lifetime risk of maternal death (1 in : ) 23 (2010)
Women with low BMI (<18.5 kg/m2, %) 11 (2008)
Anaemia, non-pregnant women (<120g/l, %) 43 (2008)
Antenatal care (at least one visit, %) 93 (2010)
Antenatal care (at least four visits, %) 75 (2010)
Skilled attendant at birth (%) 63 (2010)
Low birthweight (<2,500 grams, %) 11 (2010)
Women 20–24 years old who gave birth before age 18 (%)
38 (2010)
Iodized salt trends*
Percentage of households with adequately iodized salt85,000 newborns are unprotected against iodine deficiency disorders (2011)
Source: MICS, 2010.
Indicator
Gender Residence Wealth quintile
SourceMale Female
Ratio of male to female
Urban RuralRatio of urban to
ruralPoorest Second Middle Fourth Richest
Ratio of richest to poorest
Equity chart
Stunting prevalence (%) 47 42 1.1 41 46 0.9 47 49 48 42 33 0.7 MICS, 2010
Underweight prevalence (%) 24 20 1.2 20 22 0.9 22 25 24 20 15 0.7 MICS, 2010
Wasting prevalence (%) 10 7 1.3 10 8 1.2 8 8 9 8 9 1.1 MICS, 2010
Women with low BMI (<18.5 kg/m2, %) – 11 – 8 13 0.6 14 14 11 9 9 0.6 DHS, 2008
Women with high BMI (≥25 kg/m2, %) – 30 – 42 23 1.8 26 20 26 32 42 1.6 DHS, 2008
Improved facilities Shared facilitiesUnimproved facilities Open defecation
11
48
24
17
13
32
27
28
22
35
42
1
23
25
45
7
5
55
15
25
6
37
16
41
0%
20%
40%
60%
80%
100%
1990 2010Total Urban Rural
1990 2010 1990 2010
2005 2006 2007 2008 2009 2010 2011
10082 86
9910099
120%
20%
40%
60%
80%
100%
Source: DHS, 2008.
Source: DHS, 2008.
0–1 2–3 4–5 6–7 8–9 10–11 12–13 14–15 16–17 18–19 20–21 22–23
Age (months)
0%
20%
40%
60%
80%
100%
4 811
32
2000MICS
2005MICS
2008DHS
2010MICS
0%
20%
40%
60%
80%
100%
MDG 1 progress No progress
Underweight (under-fives, 000) 214
Overweight (under-fives, 000) 100
Stunted (under-fives, 000) 438
Wasted (under-fives, 000) 84
Severely wasted (under-fives, 000) 32
Total population (000) 5,997 (2011)
Total under-five population (000) 985 (2011)
Total number of births (000) 227 (2011)
Under-five mortality rate (per 1,000 live births) 185 (2011)
Total number of under-five deaths (000) 42 (2011)
Infant mortality rate (per 1,000 live births) 119 (2011)
Neonatal mortality rate (per 1,000 live births) 49 (2011)
HIV prevalence rate (15–49 years old, %) 1.6 (2011)
Population below international poverty line of US$1.25 per day (%)
53 (2003)
GNI per capita (US$) 340 (2011)
Primary school net attendance ratio (% female, % male)
76, 73 (2010)1990 1995 2000 2005 2010 2015
267
185
89
0
50
100
150
200
250
300
MDG 4target
To increase child survival, promote child development and prevent stunting, nutrition interventions need to be delivered during pregnancy and the first two years of life.
PREGNANCY BIRTH 0–5 MONTHS 6–23 MONTHS 24–59 MONTHS
Use of iron-folic acid supplements
Early initiation of breastfeeding(within 1 hour of birth)
International Code of Marketing of Breast-milk Substitutes
Maternity protection in accordance with ILO Convention 183
Minimum dietary diversity
Minimum acceptable diet
Full coverage of vitamin A supplementation
Treatment of severe acute malnutrition included in national health plans
Introduction to solid, semi-solid or soft foods (6–8 months)
Continued breastfeeding at 1 year old
Infants not weighed at birthHouseholds with adequately iodized salt
Exclusive breastfeeding(<6 months)
84%
25%
No
No
–
–
99%
Yes
32%�60%
45%
63%
17%
Piped on premises Other improvedUnimproved Surface water
8
29
30
33
8
13
47
32
19
29
44
8
19
7
68
6
2
29
24
45
1
16
34
49
0%
20%
40%
60%
80%
100%
1990 2010Total Urban Rural
1990 2010 1990 2010
0%
20%
40%
60%
80%
100%
41 3847
3744
1990Other NS
2000MICS
2005MICS
2008DHS
2010MICS
0% 20% 40% 60% 80% 100%
Poorest 20%
RuralUrban
GirlsBoys
Second 20%Middle 20%Fourth 20%
Richest 20%
4742
4146
47
33
4948
42
0%
20%
40%
60%
80%
100%
52
1990Other NS
2000MICS
2005MICS
2008DHS
2010MICS
MDG 1: NO PROGRESS
25 25 2821 22
Neonatal 26%
HIV/AIDS 1%
Diarrhoea 12%
Measles 0%
Injuries 3%
Pneumonia 14%Malaria 23%
Others 19%
Meningitis 2%
SIERRA LEONESIERRA LEONE
0%
20%
40%
60%
80%
100%
Non-pregnant women
Pregnant women
43
6276
Public health problemsevere
moderate
Preschool- aged children
0%
20%
40%
60%
80%
100%
2000MICS
2005MICS
2008DHS
2010MICS
23
4558 63
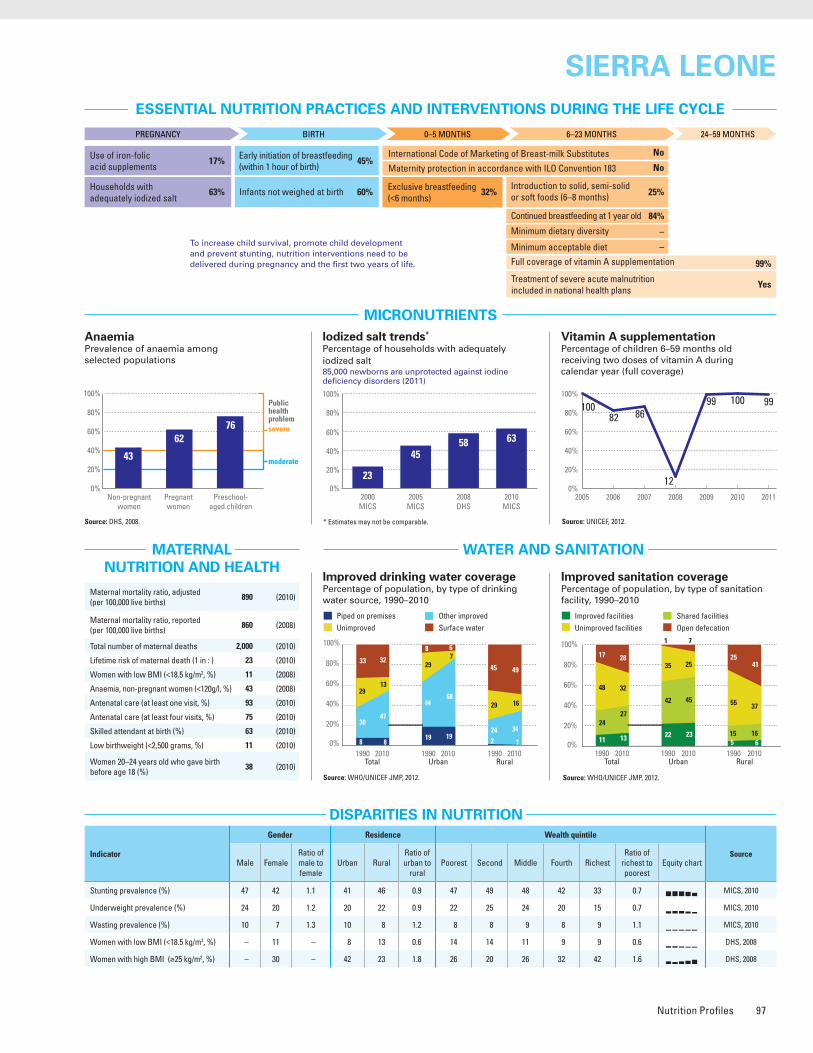
Nutrition Profiles 97
ESSENTIAL NUTRITION PRACTICES AND INTERVENTIONS DURING THE LIFE CYCLE
MICRONUTRIENTS
WATER AND SANITATION
Improved drinking water coveragePercentage of population, by type of drinking water source, 1990–2010
Source: WHO/UNICEF JMP, 2012.
Improved sanitation coveragePercentage of population, by type of sanitation facility, 1990–2010
Source: WHO/UNICEF JMP, 2012.
Vitamin A supplementationPercentage of children 6–59 months old receiving two doses of vitamin A during calendar year (full coverage)
* Estimates may not be comparable. Source: UNICEF, 2012.
MATERNAL NUTRITION AND HEALTH
DISPARITIES IN NUTRITION
Causes of under-five deaths, 2010Globally, undernutrition contributes to more than one third of child deaths
NUTRITIONAL STATUS
Stunting disparitiesPercentage of children <5 years old stunted, by selected background characteristics
DEMOGRAPHICS AND BACKGROUND INFORMATION
INFANT AND YOUNG CHILD FEEDING
Source: WHO/CHERG, 2012.
Under-five mortality rateDeaths per 1,000 live births
Source: IGME, 2012.AnaemiaPrevalence of anaemia among selected populations
Infant feeding practices, by ageExclusive breastfeeding trends Percentage of infants <6 months old exclusively breastfed
Breastfed and non-milk liquids
Breastfed and solid/semi-solid foods
Breastfed and plain water only
Breastfed and other milk/formula
Exclusively breastfed
Weaned (not breastfed)
Stunting trendsPercentage of children <5 years old stunted
Underweight trendsPercentage of children <5 years old underweight
Burden of malnutrition (2011)
Stunting country rank 45
Share of world stunting burden (%) <1%
Maternal mortality ratio, adjusted (per 100,000 live births)
890 (2010)
Maternal mortality ratio, reported(per 100,000 live births)
860 (2008)
Total number of maternal deaths 2,000 (2010)
Lifetime risk of maternal death (1 in : ) 23 (2010)
Women with low BMI (<18.5 kg/m2, %) 11 (2008)
Anaemia, non-pregnant women (<120g/l, %) 43 (2008)
Antenatal care (at least one visit, %) 93 (2010)
Antenatal care (at least four visits, %) 75 (2010)
Skilled attendant at birth (%) 63 (2010)
Low birthweight (<2,500 grams, %) 11 (2010)
Women 20–24 years old who gave birth before age 18 (%)
38 (2010)
Iodized salt trends*
Percentage of households with adequately iodized salt85,000 newborns are unprotected against iodine deficiency disorders (2011)
Source: MICS, 2010.
Indicator
Gender Residence Wealth quintile
SourceMale Female
Ratio of male to female
Urban RuralRatio of urban to
ruralPoorest Second Middle Fourth Richest
Ratio of richest to poorest
Equity chart
Stunting prevalence (%) 47 42 1.1 41 46 0.9 47 49 48 42 33 0.7 MICS, 2010
Underweight prevalence (%) 24 20 1.2 20 22 0.9 22 25 24 20 15 0.7 MICS, 2010
Wasting prevalence (%) 10 7 1.3 10 8 1.2 8 8 9 8 9 1.1 MICS, 2010
Women with low BMI (<18.5 kg/m2, %) – 11 – 8 13 0.6 14 14 11 9 9 0.6 DHS, 2008
Women with high BMI (≥25 kg/m2, %) – 30 – 42 23 1.8 26 20 26 32 42 1.6 DHS, 2008
Improved facilities Shared facilitiesUnimproved facilities Open defecation
11
48
24
17
13
32
27
28
22
35
42
1
23
25
45
7
5
55
15
25
6
37
16
41
0%
20%
40%
60%
80%
100%
1990 2010Total Urban Rural
1990 2010 1990 2010
2005 2006 2007 2008 2009 2010 2011
10082 86
9910099
120%
20%
40%
60%
80%
100%
Source: DHS, 2008.
Source: DHS, 2008.
0–1 2–3 4–5 6–7 8–9 10–11 12–13 14–15 16–17 18–19 20–21 22–23
Age (months)
0%
20%
40%
60%
80%
100%
4 811
32
2000MICS
2005MICS
2008DHS
2010MICS
0%
20%
40%
60%
80%
100%
MDG 1 progress No progress
Underweight (under-fives, 000) 214
Overweight (under-fives, 000) 100
Stunted (under-fives, 000) 438
Wasted (under-fives, 000) 84
Severely wasted (under-fives, 000) 32
Total population (000) 5,997 (2011)
Total under-five population (000) 985 (2011)
Total number of births (000) 227 (2011)
Under-five mortality rate (per 1,000 live births) 185 (2011)
Total number of under-five deaths (000) 42 (2011)
Infant mortality rate (per 1,000 live births) 119 (2011)
Neonatal mortality rate (per 1,000 live births) 49 (2011)
HIV prevalence rate (15–49 years old, %) 1.6 (2011)
Population below international poverty line of US$1.25 per day (%)
53 (2003)
GNI per capita (US$) 340 (2011)
Primary school net attendance ratio (% female, % male)
76, 73 (2010)1990 1995 2000 2005 2010 2015
267
185
89
0
50
100
150
200
250
300
MDG 4target
To increase child survival, promote child development and prevent stunting, nutrition interventions need to be delivered during pregnancy and the first two years of life.
PREGNANCY BIRTH 0–5 MONTHS 6–23 MONTHS 24–59 MONTHS
Use of iron-folic acid supplements
Early initiation of breastfeeding(within 1 hour of birth)
International Code of Marketing of Breast-milk Substitutes
Maternity protection in accordance with ILO Convention 183
Minimum dietary diversity
Minimum acceptable diet
Full coverage of vitamin A supplementation
Treatment of severe acute malnutrition included in national health plans
Introduction to solid, semi-solid or soft foods (6–8 months)
Continued breastfeeding at 1 year old
Infants not weighed at birthHouseholds with adequately iodized salt
Exclusive breastfeeding(<6 months)
84%
25%
No
No
–
–
99%
Yes
32%�60%
45%
63%
17%
Piped on premises Other improvedUnimproved Surface water
8
29
30
33
8
13
47
32
19
29
44
8
19
7
68
6
2
29
24
45
1
16
34
49
0%
20%
40%
60%
80%
100%
1990 2010Total Urban Rural
1990 2010 1990 2010
0%
20%
40%
60%
80%
100%
41 3847
3744
1990Other NS
2000MICS
2005MICS
2008DHS
2010MICS
0% 20% 40% 60% 80% 100%
Poorest 20%
RuralUrban
GirlsBoys
Second 20%Middle 20%Fourth 20%
Richest 20%
4742
4146
47
33
4948
42
0%
20%
40%
60%
80%
100%
52
1990Other NS
2000MICS
2005MICS
2008DHS
2010MICS
MDG 1: NO PROGRESS
25 25 2821 22
Neonatal 26%
HIV/AIDS 1%
Diarrhoea 12%
Measles 0%
Injuries 3%
Pneumonia 14%Malaria 23%
Others 19%
Meningitis 2%
SIERRA LEONESIERRA LEONE
0%
20%
40%
60%
80%
100%
Non-pregnant women
Pregnant women
43
6276
Public health problemsevere
moderate
Preschool- aged children
0%
20%
40%
60%
80%
100%
2000MICS
2005MICS
2008DHS
2010MICS
23
4558 63
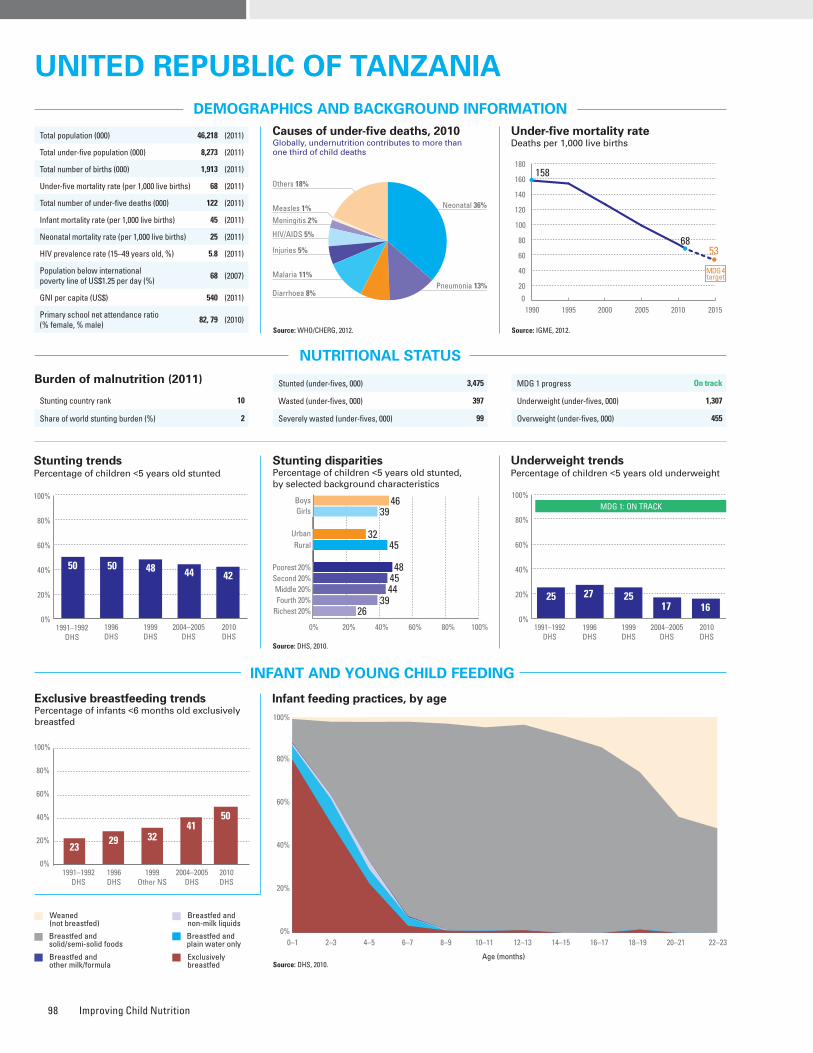
Improving Child Nutrition98
ESSENTIAL NUTRITION PRACTICES AND INTERVENTIONS DURING THE LIFE CYCLE
MICRONUTRIENTS
WATER AND SANITATION
Improved drinking water coveragePercentage of population, by type of drinking water source, 1990–2010
Source: WHO/UNICEF JMP, 2012.
Improved sanitation coveragePercentage of population, by type of sanitation facility, 1990–2010
Source: WHO/UNICEF JMP, 2012.
Vitamin A supplementationPercentage of children 6–59 months old receiving two doses of vitamin A during calendar year (full coverage)
* Estimates may not be comparable. Source: UNICEF, 2012.
MATERNAL NUTRITION AND HEALTH
DISPARITIES IN NUTRITION
Causes of under-five deaths, 2010Globally, undernutrition contributes to more than one third of child deaths
NUTRITIONAL STATUS
Stunting disparitiesPercentage of children <5 years old stunted, by selected background characteristics
DEMOGRAPHICS AND BACKGROUND INFORMATION
INFANT AND YOUNG CHILD FEEDING
Source: DHS, 2010.
Source: WHO/CHERG, 2012.
Under-five mortality rateDeaths per 1,000 live births
Source: IGME, 2012.AnaemiaPrevalence of anaemia among selected populations
Infant feeding practices, by ageExclusive breastfeeding trends Percentage of infants <6 months old exclusively breastfed
Breastfed and non-milk liquids
Breastfed and solid/semi-solid foods
Breastfed and plain water only
Breastfed and other milk/formula
Exclusively breastfed
Weaned (not breastfed)
Stunting trendsPercentage of children <5 years old stunted
Underweight trendsPercentage of children <5 years old underweight
Burden of malnutrition (2011)
Stunting country rank 10
Share of world stunting burden (%) 2
Maternal mortality ratio, adjusted (per 100,000 live births)
460 (2010)
Maternal mortality ratio, reported(per 100,000 live births)
450 (2010)
Total number of maternal deaths 8,500 (2010)
Lifetime risk of maternal death (1 in : ) 38 (2010)
Women with low BMI (<18.5 kg/m2, %) 11 (2010)
Anaemia, non-pregnant women (<120g/l, %) 39 (2010)
Antenatal care (at least one visit, %) 88 (2010)
Antenatal care (at least four visits, %) 43 (2010)
Skilled attendant at birth (%) 49 (2010)
Low birthweight (<2,500 grams, %) 8 (2010)
Women 20–24 years old who gave birth before age 18 (%)
28 (2010)
Indicator
Gender Residence Wealth quintile
SourceMale Female
Ratio of male to female
Urban RuralRatio of urban to
ruralPoorest Second Middle Fourth Richest
Ratio of richest to poorest
Equity chart
Stunting prevalence (%) 46 39 1.2 32 45 0.7 48 45 44 39 26 0.5 DHS, 2010
Underweight prevalence (%) 17 14 1.2 11 17 0.7 22 18 14 13 9 0.4 DHS, 2010
Wasting prevalence (%) 6 4 1.4 5 5 1.0 7 4 4 4 5 0.7 DHS, 2010
Women with low BMI (<18.5 kg/m2, %) – 11 – 8 13 0.6 18 13 13 9 7 0.4 DHS, 2010
Women with high BMI (≥25 kg/m2, %) – 22 – 36 15 2.4 8 11 14 25 41 5.0 DHS, 2010
Improved facilities Shared facilitiesUnimproved facilities Open defecation
7
80
5
8
10
70
8
12
10
78
10
2
20
58
20
2
6
80
4
10
7
73
4
16
0%
20%
40%
60%
80%
100%
1990 2010Total Urban Rural
1990 2010 1990 2010
2005 2006 2007 2008 2009 2010 2011
95 94 93 97999493
0%
20%
40%
60%
80%
100%
Iodized salt trends*
Percentage of households with adequately iodized salt794,000 newborns are unprotected against iodine deficiency disorders (2011)
Source: DHS, 2010.
Source: DHS, 2010.
0–1 2–3 4–5 6–7 8–9 10–11 12–13 14–15 16–17 18–19 20–21 22–23
Age (months)
0%
20%
40%
60%
80%
100%
Total population (000) 46,218 (2011)
Total under-five population (000) 8,273 (2011)
Total number of births (000) 1,913 (2011)
Under-five mortality rate (per 1,000 live births) 68 (2011)
Total number of under-five deaths (000) 122 (2011)
Infant mortality rate (per 1,000 live births) 45 (2011)
Neonatal mortality rate (per 1,000 live births) 25 (2011)
HIV prevalence rate (15–49 years old, %) 5.8 (2011)
Population below international poverty line of US$1.25 per day (%)
68 (2007)
GNI per capita (US$) 540 (2011)
Primary school net attendance ratio (% female, % male)
82, 79 (2010)
Stunted (under-fives, 000) 3,475
Wasted (under-fives, 000) 397
Severely wasted (under-fives, 000) 99
MDG 1 progress On track
Underweight (under-fives, 000) 1,307
Overweight (under-fives, 000) 455
1990 1995 2000 2005 2010 2015
158
6853
0
20
40
60
80
100
120
140
160
180
MDG 4target
To increase child survival, promote child development and prevent stunting, nutrition interventions need to be delivered during pregnancy and the first two years of life.
PREGNANCY BIRTH 0–5 MONTHS 6–23 MONTHS 24–59 MONTHS
Use of iron-folic acid supplements
Early initiation of breastfeeding(within 1 hour of birth)
International Code of Marketing of Breast-milk Substitutes
Maternity protection in accordance with ILO Convention 183
Minimum dietary diversity
Minimum acceptable diet
Full coverage of vitamin A supplementation
Treatment of severe acute malnutrition included in national health plans
Introduction to solid, semi-solid or soft foods (6–8 months)
Continued breastfeeding at 1 year old
Infants not weighed at birthHouseholds with adequately iodized salt
Exclusive breastfeeding(<6 months)
94%
92%
No
Yes
–
–
97%
Yes
50%�47%
49%
59%
4%
Piped on premises Other improvedUnimproved Surface water
7
24
48
21
8
31
45
16
35
3
59
3
22
18
57
3
1
29
45
25
3
36
41
20
0%
20%
40%
60%
80%
100%
1990 2010Total Urban Rural
1990 2010 1990 2010
0%
20%
40%
60%
80%
100%
50 50 48 44
1991–1992DHS
1996DHS
1999DHS
2004–2005DHS
42
2010DHS
0% 20% 40% 60% 80% 100%
Poorest 20%
RuralUrban
GirlsBoys
Second 20%Middle 20%Fourth 20%
Richest 20%
4639
3245
48
26
4544
39
0%
20%
40%
60%
80%
100%
57 52
1991–1992DHS
1996DHS
1999DHS
2004–2005DHS
2010DHS
MDG 1: ON TRACK
25 27 2517 16
Neonatal 36%
HIV/AIDS 5%
Diarrhoea 8%
Measles 1%
Injuries 5%
Pneumonia 13%Malaria 11%
Others 18%
Meningitis 2%
UnIted RepUBlIc of tanzanIaUnIted RepUBlIc of tanzanIa
2329
4132
1991–1992DHS
1996DHS
1999Other NS
2010DHS
0%
20%
40%
60%
80%
100%
50
2004–2005DHS
0%
20%
40%
60%
80%
100%
Non-pregnant women
Pregnant women
3953
Public health problemsevere
moderate
Preschool- aged children
59
0%
20%
40%
60%
80%
100%
1995MICS
1999DHS
2004–2005DHS
2010DHS
7467
4359
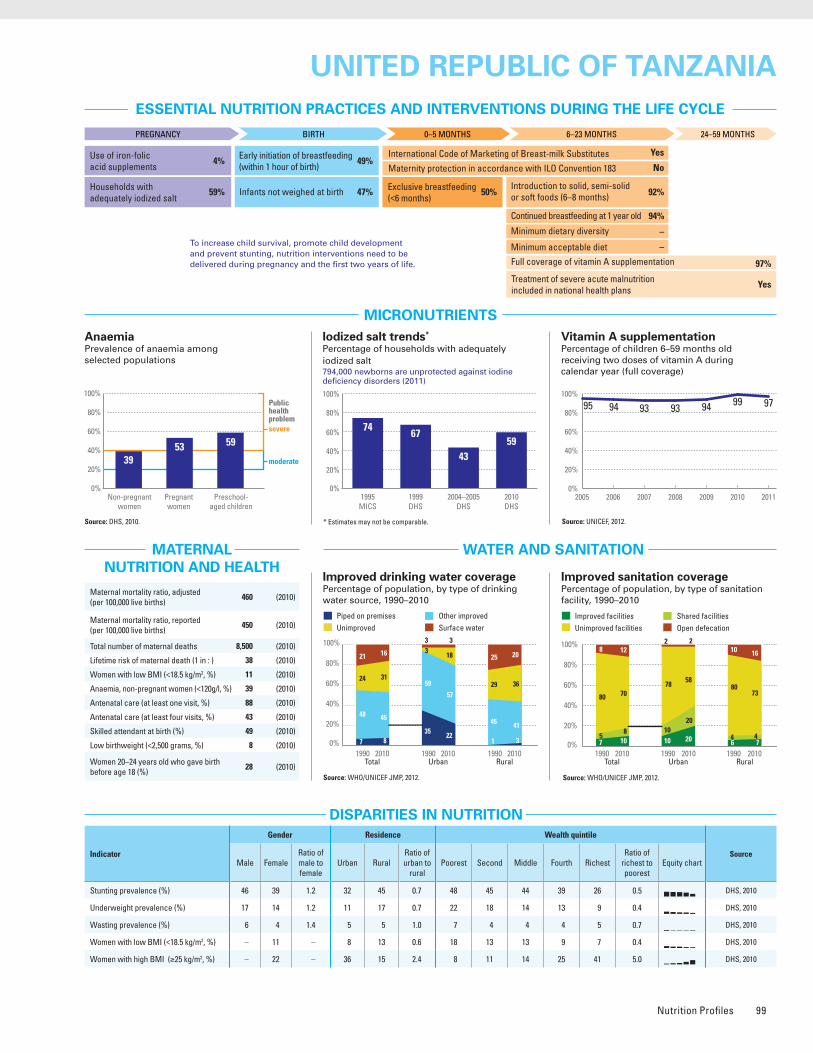
Nutrition Profiles 99
ESSENTIAL NUTRITION PRACTICES AND INTERVENTIONS DURING THE LIFE CYCLE
MICRONUTRIENTS
WATER AND SANITATION
Improved drinking water coveragePercentage of population, by type of drinking water source, 1990–2010
Source: WHO/UNICEF JMP, 2012.
Improved sanitation coveragePercentage of population, by type of sanitation facility, 1990–2010
Source: WHO/UNICEF JMP, 2012.
Vitamin A supplementationPercentage of children 6–59 months old receiving two doses of vitamin A during calendar year (full coverage)
* Estimates may not be comparable. Source: UNICEF, 2012.
MATERNAL NUTRITION AND HEALTH
DISPARITIES IN NUTRITION
Causes of under-five deaths, 2010Globally, undernutrition contributes to more than one third of child deaths
NUTRITIONAL STATUS
Stunting disparitiesPercentage of children <5 years old stunted, by selected background characteristics
DEMOGRAPHICS AND BACKGROUND INFORMATION
INFANT AND YOUNG CHILD FEEDING
Source: DHS, 2010.
Source: WHO/CHERG, 2012.
Under-five mortality rateDeaths per 1,000 live births
Source: IGME, 2012.AnaemiaPrevalence of anaemia among selected populations
Infant feeding practices, by ageExclusive breastfeeding trends Percentage of infants <6 months old exclusively breastfed
Breastfed and non-milk liquids
Breastfed and solid/semi-solid foods
Breastfed and plain water only
Breastfed and other milk/formula
Exclusively breastfed
Weaned (not breastfed)
Stunting trendsPercentage of children <5 years old stunted
Underweight trendsPercentage of children <5 years old underweight
Burden of malnutrition (2011)
Stunting country rank 10
Share of world stunting burden (%) 2
Maternal mortality ratio, adjusted (per 100,000 live births)
460 (2010)
Maternal mortality ratio, reported(per 100,000 live births)
450 (2010)
Total number of maternal deaths 8,500 (2010)
Lifetime risk of maternal death (1 in : ) 38 (2010)
Women with low BMI (<18.5 kg/m2, %) 11 (2010)
Anaemia, non-pregnant women (<120g/l, %) 39 (2010)
Antenatal care (at least one visit, %) 88 (2010)
Antenatal care (at least four visits, %) 43 (2010)
Skilled attendant at birth (%) 49 (2010)
Low birthweight (<2,500 grams, %) 8 (2010)
Women 20–24 years old who gave birth before age 18 (%)
28 (2010)
Indicator
Gender Residence Wealth quintile
SourceMale Female
Ratio of male to female
Urban RuralRatio of urban to
ruralPoorest Second Middle Fourth Richest
Ratio of richest to poorest
Equity chart
Stunting prevalence (%) 46 39 1.2 32 45 0.7 48 45 44 39 26 0.5 DHS, 2010
Underweight prevalence (%) 17 14 1.2 11 17 0.7 22 18 14 13 9 0.4 DHS, 2010
Wasting prevalence (%) 6 4 1.4 5 5 1.0 7 4 4 4 5 0.7 DHS, 2010
Women with low BMI (<18.5 kg/m2, %) – 11 – 8 13 0.6 18 13 13 9 7 0.4 DHS, 2010
Women with high BMI (≥25 kg/m2, %) – 22 – 36 15 2.4 8 11 14 25 41 5.0 DHS, 2010
Improved facilities Shared facilitiesUnimproved facilities Open defecation
7
80
5
8
10
70
8
12
10
78
10
2
20
58
20
2
6
80
4
10
7
73
4
16
0%
20%
40%
60%
80%
100%
1990 2010Total Urban Rural
1990 2010 1990 2010
2005 2006 2007 2008 2009 2010 2011
95 94 93 97999493
0%
20%
40%
60%
80%
100%
Iodized salt trends*
Percentage of households with adequately iodized salt794,000 newborns are unprotected against iodine deficiency disorders (2011)
Source: DHS, 2010.
Source: DHS, 2010.
0–1 2–3 4–5 6–7 8–9 10–11 12–13 14–15 16–17 18–19 20–21 22–23
Age (months)
0%
20%
40%
60%
80%
100%
Total population (000) 46,218 (2011)
Total under-five population (000) 8,273 (2011)
Total number of births (000) 1,913 (2011)
Under-five mortality rate (per 1,000 live births) 68 (2011)
Total number of under-five deaths (000) 122 (2011)
Infant mortality rate (per 1,000 live births) 45 (2011)
Neonatal mortality rate (per 1,000 live births) 25 (2011)
HIV prevalence rate (15–49 years old, %) 5.8 (2011)
Population below international poverty line of US$1.25 per day (%)
68 (2007)
GNI per capita (US$) 540 (2011)
Primary school net attendance ratio (% female, % male)
82, 79 (2010)
Stunted (under-fives, 000) 3,475
Wasted (under-fives, 000) 397
Severely wasted (under-fives, 000) 99
MDG 1 progress On track
Underweight (under-fives, 000) 1,307
Overweight (under-fives, 000) 455
1990 1995 2000 2005 2010 2015
158
6853
0
20
40
60
80
100
120
140
160
180
MDG 4target
To increase child survival, promote child development and prevent stunting, nutrition interventions need to be delivered during pregnancy and the first two years of life.
PREGNANCY BIRTH 0–5 MONTHS 6–23 MONTHS 24–59 MONTHS
Use of iron-folic acid supplements
Early initiation of breastfeeding(within 1 hour of birth)
International Code of Marketing of Breast-milk Substitutes
Maternity protection in accordance with ILO Convention 183
Minimum dietary diversity
Minimum acceptable diet
Full coverage of vitamin A supplementation
Treatment of severe acute malnutrition included in national health plans
Introduction to solid, semi-solid or soft foods (6–8 months)
Continued breastfeeding at 1 year old
Infants not weighed at birthHouseholds with adequately iodized salt
Exclusive breastfeeding(<6 months)
94%
92%
No
Yes
–
–
97%
Yes
50%�47%
49%
59%
4%
Piped on premises Other improvedUnimproved Surface water
7
24
48
21
8
31
45
16
35
3
59
3
22
18
57
3
1
29
45
25
3
36
41
20
0%
20%
40%
60%
80%
100%
1990 2010Total Urban Rural
1990 2010 1990 2010
0%
20%
40%
60%
80%
100%
50 50 48 44
1991–1992DHS
1996DHS
1999DHS
2004–2005DHS
42
2010DHS
0% 20% 40% 60% 80% 100%
Poorest 20%
RuralUrban
GirlsBoys
Second 20%Middle 20%Fourth 20%
Richest 20%
4639
3245
48
26
4544
39
0%
20%
40%
60%
80%
100%
57 52
1991–1992DHS
1996DHS
1999DHS
2004–2005DHS
2010DHS
MDG 1: ON TRACK
25 27 2517 16
Neonatal 36%
HIV/AIDS 5%
Diarrhoea 8%
Measles 1%
Injuries 5%
Pneumonia 13%Malaria 11%
Others 18%
Meningitis 2%
UnIted RepUBlIc of tanzanIaUnIted RepUBlIc of tanzanIa
2329
4132
1991–1992DHS
1996DHS
1999Other NS
2010DHS
0%
20%
40%
60%
80%
100%
50
2004–2005DHS
0%
20%
40%
60%
80%
100%
Non-pregnant women
Pregnant women
3953
Public health problemsevere
moderate
Preschool- aged children
59
0%
20%
40%
60%
80%
100%
1995MICS
1999DHS
2004–2005DHS
2010DHS
7467
4359
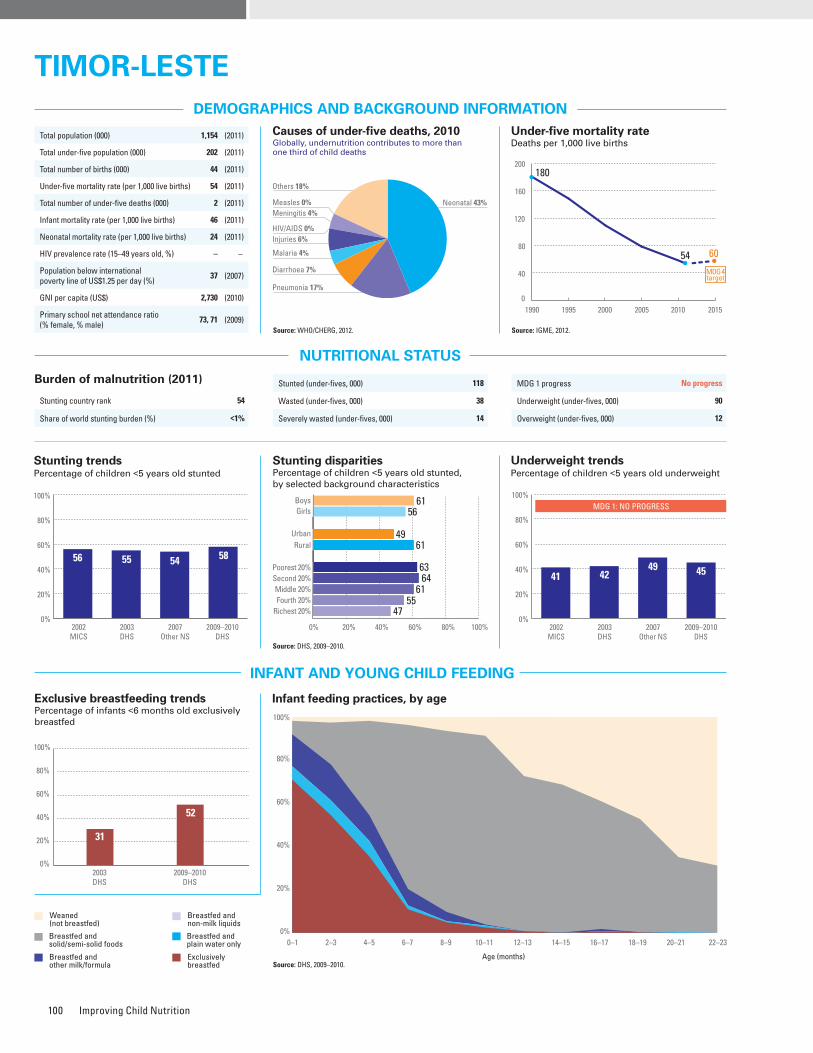
Improving Child Nutrition100
ESSENTIAL NUTRITION PRACTICES AND INTERVENTIONS DURING THE LIFE CYCLE
MICRONUTRIENTS
WATER AND SANITATION
Vitamin A supplementationPercentage of children 6–59 months old receiving two doses of vitamin A during calendar year (full coverage)
* Estimates may not be comparable. Source: UNICEF, 2012.
MATERNAL NUTRITION AND HEALTH
DISPARITIES IN NUTRITION
Causes of under-five deaths, 2010Globally, undernutrition contributes to more than one third of child deaths
NUTRITIONAL STATUS
Stunting disparitiesPercentage of children <5 years old stunted, by selected background characteristics
DEMOGRAPHICS AND BACKGROUND INFORMATION
INFANT AND YOUNG CHILD FEEDING
Source: WHO/CHERG, 2012.
Under-five mortality rateDeaths per 1,000 live births
Source: IGME, 2012.AnaemiaPrevalence of anaemia among selected populations
Infant feeding practices, by ageExclusive breastfeeding trends Percentage of infants <6 months old exclusively breastfed
Breastfed and non-milk liquids
Breastfed and solid/semi-solid foods
Breastfed and plain water only
Breastfed and other milk/formula
Exclusively breastfed
Weaned (not breastfed)
Stunting trendsPercentage of children <5 years old stunted
Underweight trendsPercentage of children <5 years old underweight
Burden of malnutrition (2011)
Stunting country rank 54
Share of world stunting burden (%) <1%
Maternal mortality ratio, adjusted (per 100,000 live births)
300 (2010)
Maternal mortality ratio, reported(per 100,000 live births)
560 (2009)
Total number of maternal deaths 130 (2010)
Lifetime risk of maternal death (1 in : ) 55 (2010)
Women with low BMI (<18.5 kg/m2, %) 27 (2009–2010)
Anaemia, non-pregnant women (<120g/l, %) 19 (2009–2010)
Antenatal care (at least one visit, %) 84 (2009–2010)
Antenatal care (at least four visits, %) 55 (2009–2010)
Skilled attendant at birth (%) 29 (2009–2010)
Low birthweight (<2,500 grams, %) 12 (2003)
Women 20–24 years old who gave birth before age 18 (%)
9 (2009–2010)
Source: DHS, 2009–2010.
Improved sanitation coveragePercentage of population, by type of sanitation facility, 2010*
Improved drinking water coveragePercentage of population, by type of drinking water source, 2010*
Indicator
Gender Residence Wealth quintile
SourceMale Female
Ratio of male to female
Urban RuralRatio of urban to
ruralPoorest Second Middle Fourth Richest
Ratio of richest to poorest
Equity chart
Stunting prevalence (%) 61 56 1.1 49 61 0.8 63 64 61 55 47 0.7 DHS, 2009–2010
Underweight prevalence (%) 46 44 1.0 35 47 0.7 49 48 48 41 35 0.7 DHS, 2009–2010
Wasting prevalence (%) 20 17 1.2 15 20 0.8 21 19 20 18 16 0.8 DHS, 2009–2010
Women with low BMI (<18.5 kg/m2, %) – 27 – 24 28 0.9 30 29 29 28 22 0.7 DHS, 2009–2010
Women with high BMI (≥25 kg/m2, %) – 5 – 9 4 2.5 2 3 3 6 10 4.5 DHS, 2009–2010
Improved facilities Shared facilitiesUnimproved facilities Open defecation
47
126
35
73
311
13
37
164
43
0%
20%
40%
60%
80%
100%
Total Urban Rural2010 2010 2010
2005 2006 2007 2008 2009 2010 2011
3523
5059
4846
0%
20%
40%
60%
80%
100%
Source: DHS, 2009–2010.
Iodized salt trends*
Percentage of households with adequately iodized salt18,000 newborns are unprotected against iodine deficiency disorders (2011)
0–1 2–3 4–5 6–7 8–9 10–11 12–13 14–15 16–17 18–19 20–21 22–23
Age (months)
0%
20%
40%
60%
80%
100%
Source: DHS, 2009–2010.
31
52
2003DHS
2009–2010DHS
0%
20%
40%
60%
80%
100%
Stunted (under-fives, 000) 118
Wasted (under-fives, 000) 38
Severely wasted (under-fives, 000) 14
MDG 1 progress No progress
Underweight (under-fives, 000) 90
Overweight (under-fives, 000) 12
Total population (000) 1,154 (2011)
Total under-five population (000) 202 (2011)
Total number of births (000) 44 (2011)
Under-five mortality rate (per 1,000 live births) 54 (2011)
Total number of under-five deaths (000) 2 (2011)
Infant mortality rate (per 1,000 live births) 46 (2011)
Neonatal mortality rate (per 1,000 live births) 24 (2011)
HIV prevalence rate (15–49 years old, %) – –
Population below international poverty line of US$1.25 per day (%)
37 (2007)
GNI per capita (US$) 2,730 (2010)
Primary school net attendance ratio (% female, % male)
73, 71 (2009)1990 1995 2000 2005 2010 2015
180
54 60
0
40
80
120
160
200
MDG 4target
To increase child survival, promote child development and prevent stunting, nutrition interventions need to be delivered during pregnancy and the first two years of life.
PREGNANCY BIRTH 0–5 MONTHS 6–23 MONTHS 24–59 MONTHS
Use of iron-folic acid supplements
Early initiation of breastfeeding(within 1 hour of birth)
International Code of Marketing of Breast-milk Substitutes
Maternity protection in accordance with ILO Convention 183
Minimum dietary diversity
Minimum acceptable diet
Full coverage of vitamin A supplementation
Treatment of severe acute malnutrition included in national health plans
Introduction to solid, semi-solid or soft foods (6–8 months)
Continued breastfeeding at 1 year old
Infants not weighed at birthHouseholds with adequately iodized salt
Exclusive breastfeeding(<6 months)
71%
82%
No
No
–
–
59%
Yes
52%�87%
82%
60%
16%
Piped on premises Other improvedUnimproved Surface water
21
30
48
1
45
46
9
12
38
48
2
2010Total Urban Rural
2010 20100%
20%
40%
60%
80%
100% 0
0%
20%
40%
60%
80%
100%
56 55 54 58
2002MICS
2003DHS
2007Other NS
2009–2010DHS
0% 20% 40% 60% 80% 100%
Poorest 20%
RuralUrban
GirlsBoys
Second 20%Middle 20%Fourth 20%
Richest 20%
6156
4961
63
47
6461
55
0%
20%
40%
60%
80%
100%
2002MICS
2003DHS
2007Other NS
2009–2010DHS
MDG 1: NO PROGRESS
41 4249 45
Neonatal 43%
HIV/AIDS 0%
Diarrhoea 7%
Measles 0%
Injuries 6%
Pneumonia 17%
Malaria 4%
Others 18%
Meningitis 4%
TIMOR-LESTETIMOR-LESTE
0%
20%
40%
60%
80%
100%
Non-pregnant women
Pregnant women
1928
Public health problemsevere
moderate
Preschool- aged children
38
Source: WHO/UNICEF JMP, 2012.* Insufficient data for generating a trend graph.
Source: WHO/UNICEF JMP, 2012.* Insufficient data for generating a trend graph.
0%
20%
40%
60%
80%
100%
2000MICS
2007Other NS
7260
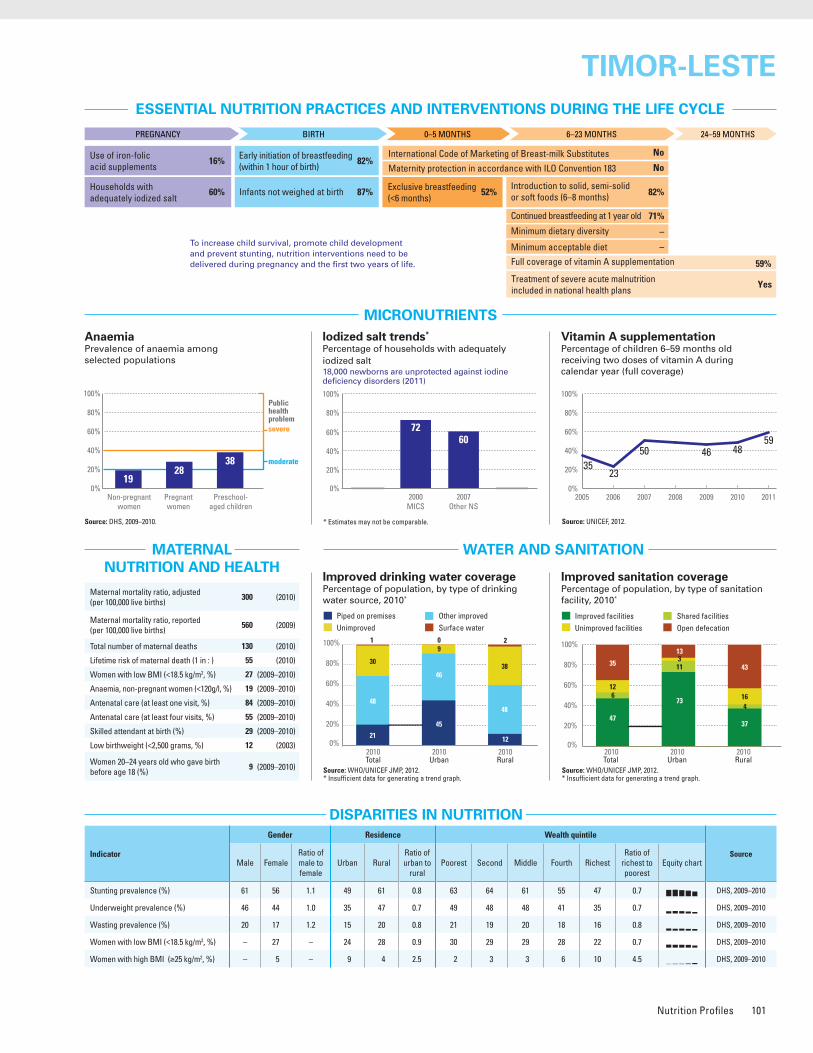
Nutrition Profiles 101
ESSENTIAL NUTRITION PRACTICES AND INTERVENTIONS DURING THE LIFE CYCLE
MICRONUTRIENTS
WATER AND SANITATION
Vitamin A supplementationPercentage of children 6–59 months old receiving two doses of vitamin A during calendar year (full coverage)
* Estimates may not be comparable. Source: UNICEF, 2012.
MATERNAL NUTRITION AND HEALTH
DISPARITIES IN NUTRITION
Causes of under-five deaths, 2010Globally, undernutrition contributes to more than one third of child deaths
NUTRITIONAL STATUS
Stunting disparitiesPercentage of children <5 years old stunted, by selected background characteristics
DEMOGRAPHICS AND BACKGROUND INFORMATION
INFANT AND YOUNG CHILD FEEDING
Source: WHO/CHERG, 2012.
Under-five mortality rateDeaths per 1,000 live births
Source: IGME, 2012.AnaemiaPrevalence of anaemia among selected populations
Infant feeding practices, by ageExclusive breastfeeding trends Percentage of infants <6 months old exclusively breastfed
Breastfed and non-milk liquids
Breastfed and solid/semi-solid foods
Breastfed and plain water only
Breastfed and other milk/formula
Exclusively breastfed
Weaned (not breastfed)
Stunting trendsPercentage of children <5 years old stunted
Underweight trendsPercentage of children <5 years old underweight
Burden of malnutrition (2011)
Stunting country rank 54
Share of world stunting burden (%) <1%
Maternal mortality ratio, adjusted (per 100,000 live births)
300 (2010)
Maternal mortality ratio, reported(per 100,000 live births)
560 (2009)
Total number of maternal deaths 130 (2010)
Lifetime risk of maternal death (1 in : ) 55 (2010)
Women with low BMI (<18.5 kg/m2, %) 27 (2009–2010)
Anaemia, non-pregnant women (<120g/l, %) 19 (2009–2010)
Antenatal care (at least one visit, %) 84 (2009–2010)
Antenatal care (at least four visits, %) 55 (2009–2010)
Skilled attendant at birth (%) 29 (2009–2010)
Low birthweight (<2,500 grams, %) 12 (2003)
Women 20–24 years old who gave birth before age 18 (%)
9 (2009–2010)
Source: DHS, 2009–2010.
Improved sanitation coveragePercentage of population, by type of sanitation facility, 2010*
Improved drinking water coveragePercentage of population, by type of drinking water source, 2010*
Indicator
Gender Residence Wealth quintile
SourceMale Female
Ratio of male to female
Urban RuralRatio of urban to
ruralPoorest Second Middle Fourth Richest
Ratio of richest to poorest
Equity chart
Stunting prevalence (%) 61 56 1.1 49 61 0.8 63 64 61 55 47 0.7 DHS, 2009–2010
Underweight prevalence (%) 46 44 1.0 35 47 0.7 49 48 48 41 35 0.7 DHS, 2009–2010
Wasting prevalence (%) 20 17 1.2 15 20 0.8 21 19 20 18 16 0.8 DHS, 2009–2010
Women with low BMI (<18.5 kg/m2, %) – 27 – 24 28 0.9 30 29 29 28 22 0.7 DHS, 2009–2010
Women with high BMI (≥25 kg/m2, %) – 5 – 9 4 2.5 2 3 3 6 10 4.5 DHS, 2009–2010
Improved facilities Shared facilitiesUnimproved facilities Open defecation
47
126
35
73
311
13
37
164
43
0%
20%
40%
60%
80%
100%
Total Urban Rural2010 2010 2010
2005 2006 2007 2008 2009 2010 2011
3523
5059
4846
0%
20%
40%
60%
80%
100%
Source: DHS, 2009–2010.
Iodized salt trends*
Percentage of households with adequately iodized salt18,000 newborns are unprotected against iodine deficiency disorders (2011)
0–1 2–3 4–5 6–7 8–9 10–11 12–13 14–15 16–17 18–19 20–21 22–23
Age (months)
0%
20%
40%
60%
80%
100%
Source: DHS, 2009–2010.
31
52
2003DHS
2009–2010DHS
0%
20%
40%
60%
80%
100%
Stunted (under-fives, 000) 118
Wasted (under-fives, 000) 38
Severely wasted (under-fives, 000) 14
MDG 1 progress No progress
Underweight (under-fives, 000) 90
Overweight (under-fives, 000) 12
Total population (000) 1,154 (2011)
Total under-five population (000) 202 (2011)
Total number of births (000) 44 (2011)
Under-five mortality rate (per 1,000 live births) 54 (2011)
Total number of under-five deaths (000) 2 (2011)
Infant mortality rate (per 1,000 live births) 46 (2011)
Neonatal mortality rate (per 1,000 live births) 24 (2011)
HIV prevalence rate (15–49 years old, %) – –
Population below international poverty line of US$1.25 per day (%)
37 (2007)
GNI per capita (US$) 2,730 (2010)
Primary school net attendance ratio (% female, % male)
73, 71 (2009)1990 1995 2000 2005 2010 2015
180
54 60
0
40
80
120
160
200
MDG 4target
To increase child survival, promote child development and prevent stunting, nutrition interventions need to be delivered during pregnancy and the first two years of life.
PREGNANCY BIRTH 0–5 MONTHS 6–23 MONTHS 24–59 MONTHS
Use of iron-folic acid supplements
Early initiation of breastfeeding(within 1 hour of birth)
International Code of Marketing of Breast-milk Substitutes
Maternity protection in accordance with ILO Convention 183
Minimum dietary diversity
Minimum acceptable diet
Full coverage of vitamin A supplementation
Treatment of severe acute malnutrition included in national health plans
Introduction to solid, semi-solid or soft foods (6–8 months)
Continued breastfeeding at 1 year old
Infants not weighed at birthHouseholds with adequately iodized salt
Exclusive breastfeeding(<6 months)
71%
82%
No
No
–
–
59%
Yes
52%�87%
82%
60%
16%
Piped on premises Other improvedUnimproved Surface water
21
30
48
1
45
46
9
12
38
48
2
2010Total Urban Rural
2010 20100%
20%
40%
60%
80%
100% 0
0%
20%
40%
60%
80%
100%
56 55 54 58
2002MICS
2003DHS
2007Other NS
2009–2010DHS
0% 20% 40% 60% 80% 100%
Poorest 20%
RuralUrban
GirlsBoys
Second 20%Middle 20%Fourth 20%
Richest 20%
6156
4961
63
47
6461
55
0%
20%
40%
60%
80%
100%
2002MICS
2003DHS
2007Other NS
2009–2010DHS
MDG 1: NO PROGRESS
41 4249 45
Neonatal 43%
HIV/AIDS 0%
Diarrhoea 7%
Measles 0%
Injuries 6%
Pneumonia 17%
Malaria 4%
Others 18%
Meningitis 4%
TIMOR-LESTETIMOR-LESTE
0%
20%
40%
60%
80%
100%
Non-pregnant women
Pregnant women
1928
Public health problemsevere
moderate
Preschool- aged children
38
Source: WHO/UNICEF JMP, 2012.* Insufficient data for generating a trend graph.
Source: WHO/UNICEF JMP, 2012.* Insufficient data for generating a trend graph.
0%
20%
40%
60%
80%
100%
2000MICS
2007Other NS
7260
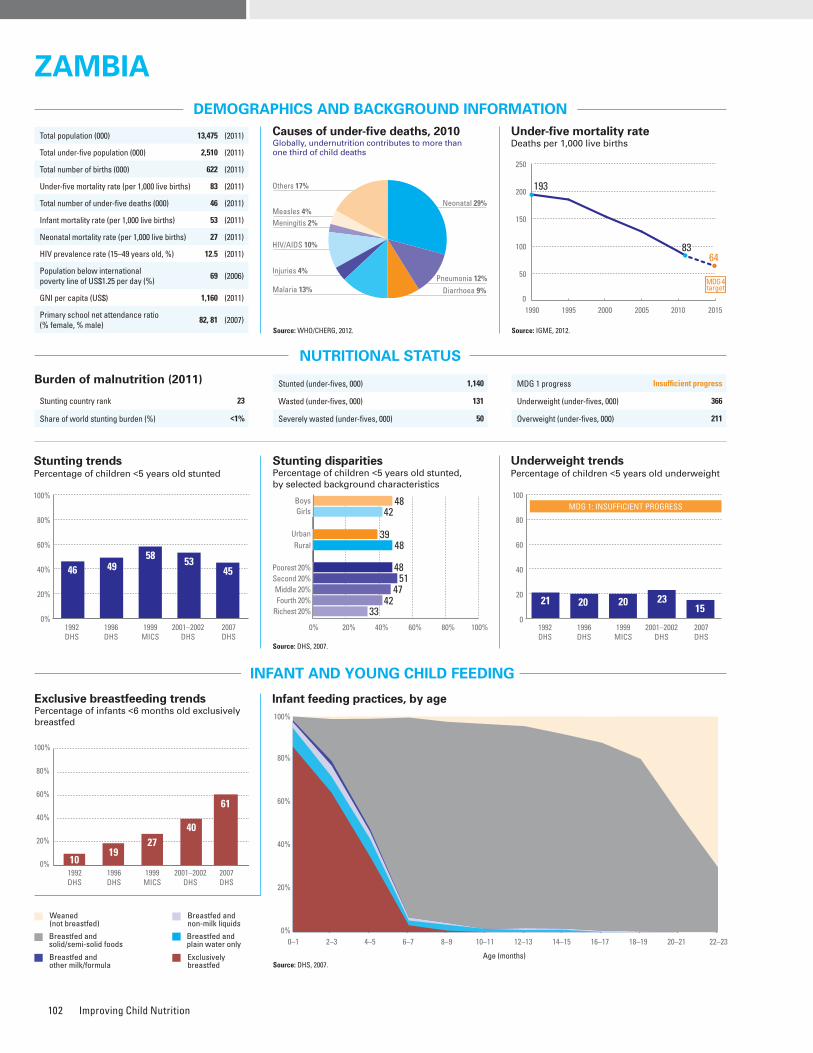
Improving Child Nutrition102
ESSENTIAL NUTRITION PRACTICES AND INTERVENTIONS DURING THE LIFE CYCLE
MICRONUTRIENTS
WATER AND SANITATION
Improved drinking water coveragePercentage of population, by type of drinking water source, 1990–2010
Improved sanitation coveragePercentage of population, by type of sanitation facility, 1990–2010
Vitamin A supplementationPercentage of children 6–59 months old receiving two doses of vitamin A during calendar year (full coverage)
* Estimates may not be comparable. Source: UNICEF, 2012.
MATERNAL NUTRITION AND HEALTH
DISPARITIES IN NUTRITION
Causes of under-five deaths, 2010Globally, undernutrition contributes to more than one third of child deaths
NUTRITIONAL STATUS
Stunting disparitiesPercentage of children <5 years old stunted, by selected background characteristics
DEMOGRAPHICS AND BACKGROUND INFORMATION
INFANT AND YOUNG CHILD FEEDING
Source: WHO/CHERG, 2012.
Under-five mortality rateDeaths per 1,000 live births
Source: IGME, 2012.AnaemiaPrevalence of anaemia among selected populations
Infant feeding practices, by ageExclusive breastfeeding trends Percentage of infants <6 months old exclusively breastfed
Breastfed and non-milk liquids
Breastfed and solid/semi-solid foods
Breastfed and plain water only
Breastfed and other milk/formula
Exclusively breastfed
Weaned (not breastfed)
Stunting trendsPercentage of children <5 years old stunted
Underweight trendsPercentage of children <5 years old underweight
Burden of malnutrition (2011)
Stunting country rank 23
Share of world stunting burden (%) <1%
Maternal mortality ratio, adjusted (per 100,000 live births)
440 (2010)
Maternal mortality ratio, reported(per 100,000 live births)
590 (2007)
Total number of maternal deaths 2,600 (2010)
Lifetime risk of maternal death (1 in : ) 37 (2010)
Women with low BMI (<18.5 kg/m2, %) 10 (2007)
Anaemia, non-pregnant women (<120g/l, %) – –
Antenatal care (at least one visit, %) 94 (2007)
Antenatal care (at least four visits, %) 60 (2007)
Skilled attendant at birth (%) 47 (2007)
Low birthweight (<2,500 grams, %) 11 (2007)
Women 20–24 years old who gave birth before age 18 (%)
34 (2007)
Source: DHS, 2007.
Indicator
Gender Residence Wealth quintile
SourceMale Female
Ratio of male to female
Urban RuralRatio of urban to
ruralPoorest Second Middle Fourth Richest
Ratio of richest to poorest
Equity chart
Stunting prevalence (%) 48 42 1.1 39 48 0.8 48 51 47 42 33 0.7 DHS, 2007
Underweight prevalence (%) 17 13 1.3 13 15 0.8 16 16 16 13 11 0.7 DHS, 2007
Wasting prevalence (%) 6 5 1.2 4 6 0.8 6 6 5 4 4 0.6 DHS, 2007
Women with low BMI (<18.5 kg/m2, %) – 10 – 8 11 0.7 11 13 12 8 7 0.6 DHS, 2007
Women with high BMI (≥25 kg/m2, %) – 19 – 30 11 2.7 8 9 11 23 35 4.6 DHS, 2007
2005 2006 2007 2008 2009 2010 2011
66 71
95
72
929196
0%
20%
40%
60%
80%
100%
Iodized salt trends*
Percentage of households with adequately iodized salt141,000 newborns are unprotected against iodine deficiency disorders (2011)
Source: DHS, 2007.
1019
4027
1992DHS
1996DHS
1999MICS
2007DHS
0%
20%
40%
60%
80%
100%
61
2001–2002DHS
Stunted (under-fives, 000) 1,140
Wasted (under-fives, 000) 131
Severely wasted (under-fives, 000) 50
Total population (000) 13,475 (2011)
Total under-five population (000) 2,510 (2011)
Total number of births (000) 622 (2011)
Under-five mortality rate (per 1,000 live births) 83 (2011)
Total number of under-five deaths (000) 46 (2011)
Infant mortality rate (per 1,000 live births) 53 (2011)
Neonatal mortality rate (per 1,000 live births) 27 (2011)
HIV prevalence rate (15–49 years old, %) 12.5 (2011)
Population below international poverty line of US$1.25 per day (%)
69 (2006)
GNI per capita (US$) 1,160 (2011)
Primary school net attendance ratio (% female, % male)
82, 81 (2007)
0–1 2–3 4–5 6–7 8–9 10–11 12–13 14–15 16–17 18–19 20–21 22–23
Age (months)
0%
20%
40%
60%
80%
100%
1990 1995 2000 2005 2010 2015
193
8364
0
50
100
150
200
250
MDG 4target
To increase child survival, promote child development and prevent stunting, nutrition interventions need to be delivered during pregnancy and the first two years of life.
PREGNANCY BIRTH 0–5 MONTHS 6–23 MONTHS 24–59 MONTHS
Use of iron-folic acid supplements
Early initiation of breastfeeding(within 1 hour of birth)
International Code of Marketing of Breast-milk Substitutes
Maternity protection in accordance with ILO Convention 183
Minimum dietary diversity
Minimum acceptable diet
Full coverage of vitamin A supplementation
Treatment of severe acute malnutrition included in national health plans
Introduction to solid, semi-solid or soft foods (6–8 months)
Continued breastfeeding at 1 year old
Infants not weighed at birthHouseholds with adequately iodized salt
Exclusive breastfeeding(<6 months)
94%
94%
Partial
Partial
–
–
72%
Yes
61%�52%
57%
77%
44%
MDG 1 progress Insufficient progress
Underweight (under-fives, 000) 366
Overweight (under-fives, 000) 211
Improved facilities Shared facilitiesUnimproved facilities Open defecation
46
15
14
25
48
20
14
18
61
12
25
2
57
17
24
2
37
16
7
40
43
22
8
27
0%
20%
40%
60%
80%
100%
1990 2010Total Urban Rural
1990 2010 1990 2010
Piped on premises Other improvedUnimproved Surface water
20
31
29
20
13
24
48
15
49
10
40
1
36
11
51
2
1
45
22
32
1
32
45
22
0%
20%
40%
60%
80%
100%
1990 2010Total Urban Rural
1990 2010 1990 2010
0%
20%
40%
60%
80%
100%
46 4958 53
1992DHS
1996DHS
1999MICS
2001–2002DHS
45
2007DHS
0% 20% 40% 60% 80% 100%
Poorest 20%
RuralUrban
GirlsBoys
Second 20%Middle 20%Fourth 20%
Richest 20%
4842
3948
48
33
5147
42
0
20
40
60
80
100
57 52
1992DHS
1996DHS
1999MICS
2001–2002DHS
2007DHS
MDG 1: INSUFFICIENT PROGRESS
21 20 20 2315
Neonatal 29%
HIV/AIDS 10%
Diarrhoea 9%
Measles 4%
Injuries 4%Pneumonia 12%
Malaria 13%
Others 17%
Meningitis 2%
ZAMBIAZAMBIA
NO DATA
Source: WHO/UNICEF JMP, 2012. Source: WHO/UNICEF JMP, 2012.
0%
20%
40%
60%
80%
100%
1995Other NS
1996DHS
2000MICS
2001–2002DHS
9078
6877
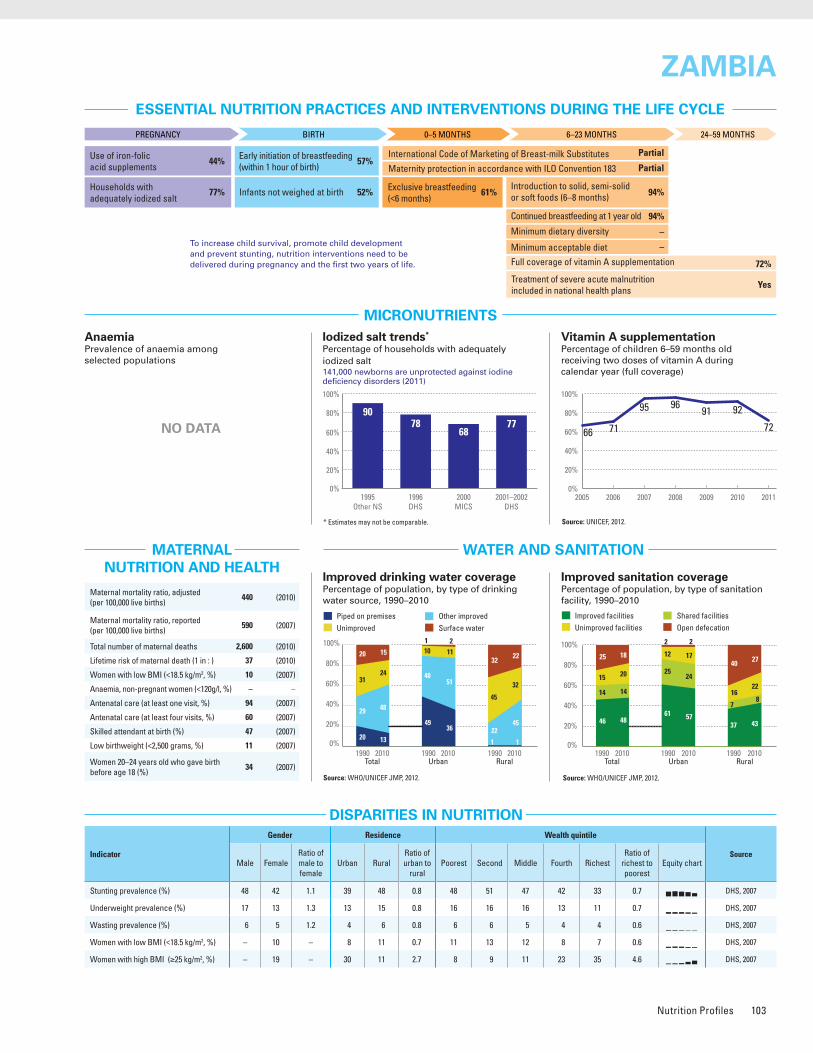
Nutrition Profiles 103
ESSENTIAL NUTRITION PRACTICES AND INTERVENTIONS DURING THE LIFE CYCLE
MICRONUTRIENTS
WATER AND SANITATION
Improved drinking water coveragePercentage of population, by type of drinking water source, 1990–2010
Improved sanitation coveragePercentage of population, by type of sanitation facility, 1990–2010
Vitamin A supplementationPercentage of children 6–59 months old receiving two doses of vitamin A during calendar year (full coverage)
* Estimates may not be comparable. Source: UNICEF, 2012.
MATERNAL NUTRITION AND HEALTH
DISPARITIES IN NUTRITION
Causes of under-five deaths, 2010Globally, undernutrition contributes to more than one third of child deaths
NUTRITIONAL STATUS
Stunting disparitiesPercentage of children <5 years old stunted, by selected background characteristics
DEMOGRAPHICS AND BACKGROUND INFORMATION
INFANT AND YOUNG CHILD FEEDING
Source: WHO/CHERG, 2012.
Under-five mortality rateDeaths per 1,000 live births
Source: IGME, 2012.AnaemiaPrevalence of anaemia among selected populations
Infant feeding practices, by ageExclusive breastfeeding trends Percentage of infants <6 months old exclusively breastfed
Breastfed and non-milk liquids
Breastfed and solid/semi-solid foods
Breastfed and plain water only
Breastfed and other milk/formula
Exclusively breastfed
Weaned (not breastfed)
Stunting trendsPercentage of children <5 years old stunted
Underweight trendsPercentage of children <5 years old underweight
Burden of malnutrition (2011)
Stunting country rank 23
Share of world stunting burden (%) <1%
Maternal mortality ratio, adjusted (per 100,000 live births)
440 (2010)
Maternal mortality ratio, reported(per 100,000 live births)
590 (2007)
Total number of maternal deaths 2,600 (2010)
Lifetime risk of maternal death (1 in : ) 37 (2010)
Women with low BMI (<18.5 kg/m2, %) 10 (2007)
Anaemia, non-pregnant women (<120g/l, %) – –
Antenatal care (at least one visit, %) 94 (2007)
Antenatal care (at least four visits, %) 60 (2007)
Skilled attendant at birth (%) 47 (2007)
Low birthweight (<2,500 grams, %) 11 (2007)
Women 20–24 years old who gave birth before age 18 (%)
34 (2007)
Source: DHS, 2007.
Indicator
Gender Residence Wealth quintile
SourceMale Female
Ratio of male to female
Urban RuralRatio of urban to
ruralPoorest Second Middle Fourth Richest
Ratio of richest to poorest
Equity chart
Stunting prevalence (%) 48 42 1.1 39 48 0.8 48 51 47 42 33 0.7 DHS, 2007
Underweight prevalence (%) 17 13 1.3 13 15 0.8 16 16 16 13 11 0.7 DHS, 2007
Wasting prevalence (%) 6 5 1.2 4 6 0.8 6 6 5 4 4 0.6 DHS, 2007
Women with low BMI (<18.5 kg/m2, %) – 10 – 8 11 0.7 11 13 12 8 7 0.6 DHS, 2007
Women with high BMI (≥25 kg/m2, %) – 19 – 30 11 2.7 8 9 11 23 35 4.6 DHS, 2007
2005 2006 2007 2008 2009 2010 2011
66 71
95
72
929196
0%
20%
40%
60%
80%
100%
Iodized salt trends*
Percentage of households with adequately iodized salt141,000 newborns are unprotected against iodine deficiency disorders (2011)
Source: DHS, 2007.
1019
4027
1992DHS
1996DHS
1999MICS
2007DHS
0%
20%
40%
60%
80%
100%
61
2001–2002DHS
Stunted (under-fives, 000) 1,140
Wasted (under-fives, 000) 131
Severely wasted (under-fives, 000) 50
Total population (000) 13,475 (2011)
Total under-five population (000) 2,510 (2011)
Total number of births (000) 622 (2011)
Under-five mortality rate (per 1,000 live births) 83 (2011)
Total number of under-five deaths (000) 46 (2011)
Infant mortality rate (per 1,000 live births) 53 (2011)
Neonatal mortality rate (per 1,000 live births) 27 (2011)
HIV prevalence rate (15–49 years old, %) 12.5 (2011)
Population below international poverty line of US$1.25 per day (%)
69 (2006)
GNI per capita (US$) 1,160 (2011)
Primary school net attendance ratio (% female, % male)
82, 81 (2007)
0–1 2–3 4–5 6–7 8–9 10–11 12–13 14–15 16–17 18–19 20–21 22–23
Age (months)
0%
20%
40%
60%
80%
100%
1990 1995 2000 2005 2010 2015
193
8364
0
50
100
150
200
250
MDG 4target
To increase child survival, promote child development and prevent stunting, nutrition interventions need to be delivered during pregnancy and the first two years of life.
PREGNANCY BIRTH 0–5 MONTHS 6–23 MONTHS 24–59 MONTHS
Use of iron-folic acid supplements
Early initiation of breastfeeding(within 1 hour of birth)
International Code of Marketing of Breast-milk Substitutes
Maternity protection in accordance with ILO Convention 183
Minimum dietary diversity
Minimum acceptable diet
Full coverage of vitamin A supplementation
Treatment of severe acute malnutrition included in national health plans
Introduction to solid, semi-solid or soft foods (6–8 months)
Continued breastfeeding at 1 year old
Infants not weighed at birthHouseholds with adequately iodized salt
Exclusive breastfeeding(<6 months)
94%
94%
Partial
Partial
–
–
72%
Yes
61%�52%
57%
77%
44%
MDG 1 progress Insufficient progress
Underweight (under-fives, 000) 366
Overweight (under-fives, 000) 211
Improved facilities Shared facilitiesUnimproved facilities Open defecation
46
15
14
25
48
20
14
18
61
12
25
2
57
17
24
2
37
16
7
40
43
22
8
27
0%
20%
40%
60%
80%
100%
1990 2010Total Urban Rural
1990 2010 1990 2010
Piped on premises Other improvedUnimproved Surface water
20
31
29
20
13
24
48
15
49
10
40
1
36
11
51
2
1
45
22
32
1
32
45
22
0%
20%
40%
60%
80%
100%
1990 2010Total Urban Rural
1990 2010 1990 2010
0%
20%
40%
60%
80%
100%
46 4958 53
1992DHS
1996DHS
1999MICS
2001–2002DHS
45
2007DHS
0% 20% 40% 60% 80% 100%
Poorest 20%
RuralUrban
GirlsBoys
Second 20%Middle 20%Fourth 20%
Richest 20%
4842
3948
48
33
5147
42
0
20
40
60
80
100
57 52
1992DHS
1996DHS
1999MICS
2001–2002DHS
2007DHS
MDG 1: INSUFFICIENT PROGRESS
21 20 20 2315
Neonatal 29%
HIV/AIDS 10%
Diarrhoea 9%
Measles 4%
Injuries 4%Pneumonia 12%
Malaria 13%
Others 17%
Meningitis 2%
ZAMBIAZAMBIA
NO DATA
Source: WHO/UNICEF JMP, 2012. Source: WHO/UNICEF JMP, 2012.
0%
20%
40%
60%
80%
100%
1995Other NS
1996DHS
2000MICS
2001–2002DHS
9078
6877
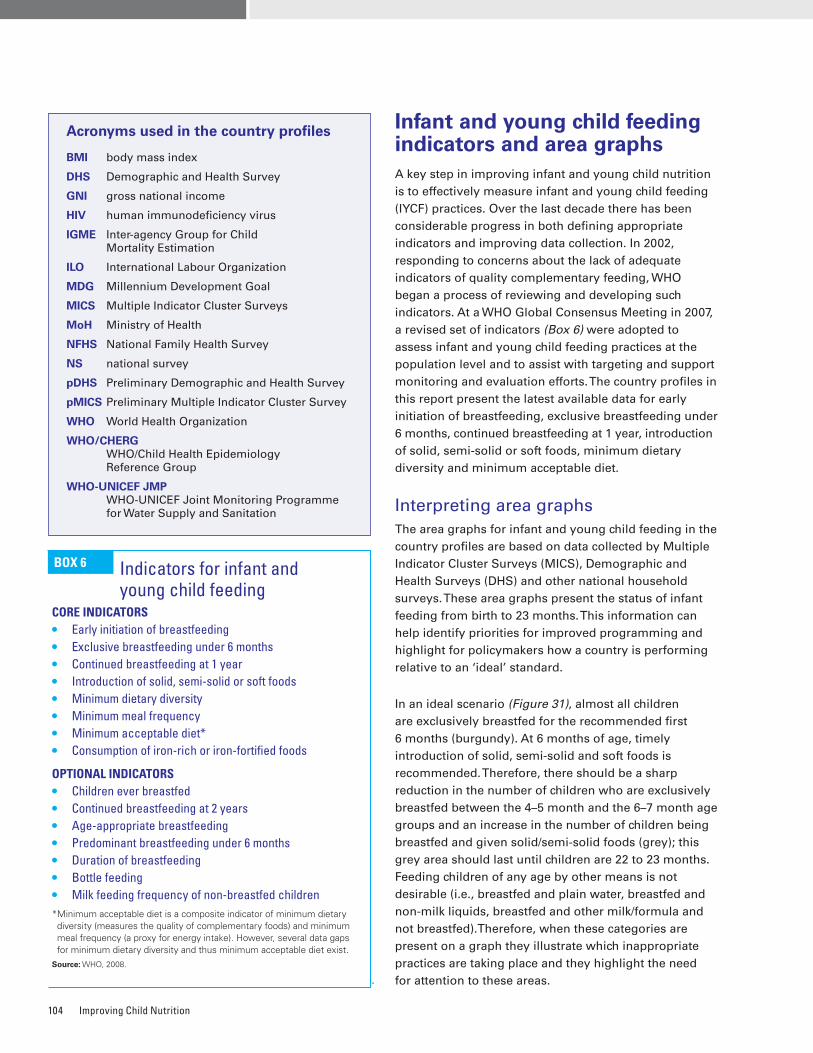
Improving Child Nutrition104
Infant and young child feeding indicators and area graphs A key step in improving infant and young child nutrition is to effectively measure infant and young child feeding (IYCF) practices. Over the last decade there has been considerable progress in both defining appropriate indicators and improving data collection. In 2002, responding to concerns about the lack of adequate indicators of quality complementary feeding, WHO began a process of reviewing and developing such indicators. At a WHO Global Consensus Meeting in 2007, a revised set of indicators (Box 6) were adopted to assess infant and young child feeding practices at the population level and to assist with targeting and support monitoring and evaluation efforts. The country profiles in this report present the latest available data for early initiation of breastfeeding, exclusive breastfeeding under 6 months, continued breastfeeding at 1 year, introduction of solid, semi-solid or soft foods, minimum dietary diversity and minimum acceptable diet.
Interpreting area graphs The area graphs for infant and young child feeding in the country profiles are based on data collected by Multiple Indicator Cluster Surveys (MICS), Demographic and Health Surveys (DHS) and other national household surveys. These area graphs present the status of infant feeding from birth to 23 months. This information can help identify priorities for improved programming and highlight for policymakers how a country is performing relative to an ‘ideal’ standard.
In an ideal scenario (Figure 31), almost all children are exclusively breastfed for the recommended first 6 months (burgundy). At 6 months of age, timely introduction of solid, semi-solid and soft foods is recommended. Therefore, there should be a sharp reduction in the number of children who are exclusively breastfed between the 4–5 month and the 6–7 month age groups and an increase in the number of children being breastfed and given solid/semi-solid foods (grey); this grey area should last until children are 22 to 23 months. Feeding children of any age by other means is not desirable (i.e., breastfed and plain water, breastfed and non-milk liquids, breastfed and other milk/formula and not breastfed).Therefore, when these categories are present on a graph they illustrate which inappropriate practices are taking place and they highlight the need for attention to these areas.
Acronyms used in the country profiles
BMI body mass index
DHS Demographic and Health Survey
GNI gross national income
HIV human immunodeficiency virus
IGME Inter-agency Group for Child Mortality Estimation
ILO International Labour Organization
MDG Millennium Development Goal
MICS Multiple Indicator Cluster Surveys
MoH Ministry of Health
NFHS National Family Health Survey
NS national survey
pDHS Preliminary Demographic and Health Survey
pMICS Preliminary Multiple Indicator Cluster Survey
WHO World Health Organization
WHO/CHERG WHO/Child Health Epidemiology
Reference Group
WHO-UNICEF JMP WHO-UNICEF Joint Monitoring Programme
for Water Supply and Sanitation
CORE INDICATORS• Early initiation of breastfeeding• Exclusive breastfeeding under 6 months• Continued breastfeeding at 1 year • Introduction of solid, semi-solid or soft foods• Minimum dietary diversity• Minimum meal frequency• Minimum acceptable diet* • Consumption of iron-rich or iron-fortified foods
OPTIONAL INDICATORS• Children ever breastfed • Continued breastfeeding at 2 years• Age-appropriate breastfeeding• Predominant breastfeeding under 6 months• Duration of breastfeeding• Bottle feeding• Milk feeding frequency of non-breastfed children* Minimum acceptable diet is a composite indicator of minimum dietary diversity (measures the quality of complementary foods) and minimum meal frequency (a proxy for energy intake)� However, several data gaps for minimum dietary diversity and thus minimum acceptable diet exist�
Source: WHO, 2008�
BOX 6 Indicators for infant and young child feeding
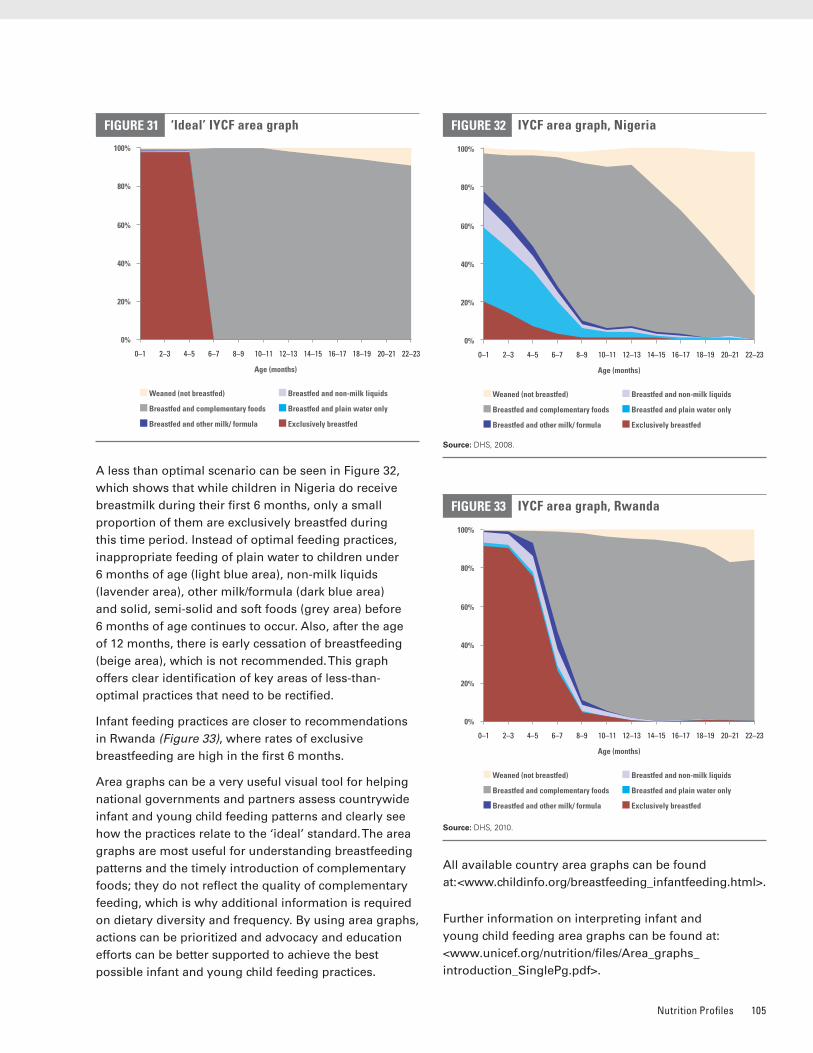
Nutrition Profiles 105
A less than optimal scenario can be seen in Figure 32, which shows that while children in Nigeria do receive breastmilk during their first 6 months, only a small proportion of them are exclusively breastfed during this time period. Instead of optimal feeding practices, inappropriate feeding of plain water to children under 6 months of age (light blue area), non-milk liquids (lavender area), other milk/formula (dark blue area) and solid, semi-solid and soft foods (grey area) before 6 months of age continues to occur. Also, after the age of 12 months, there is early cessation of breastfeeding (beige area), which is not recommended. This graph offers clear identification of key areas of less-than-optimal practices that need to be rectified.
Infant feeding practices are closer to recommendations in Rwanda (Figure 33), where rates of exclusive breastfeeding are high in the first 6 months.
Area graphs can be a very useful visual tool for helping national governments and partners assess countrywide infant and young child feeding patterns and clearly see how the practices relate to the ‘ideal’ standard. The area graphs are most useful for understanding breastfeeding patterns and the timely introduction of complementary foods; they do not reflect the quality of complementary feeding, which is why additional information is required on dietary diversity and frequency. By using area graphs, actions can be prioritized and advocacy and education efforts can be better supported to achieve the best possible infant and young child feeding practices.
All available country area graphs can be found at: <www.childinfo.org/breastfeeding_infantfeeding.html>.
Further information on interpreting infant and young child feeding area graphs can be found at: <www.unicef.org/nutrition/files/Area_graphs_introduction_SinglePg.pdf>.
‘Ideal’ IYCF area graphFIGURE 31
0%
100%
80%
60%
40%
20%
0–1 2–3 22–2318–1916–1714–1512–1310–118–96–74–5 20–21
Age (months)
Weaned (not breastfed)
Breastfed and complementary foods
Breastfed and other milk/ formula
Breastfed and non-milk liquids
Breastfed and plain water only
Exclusively breastfed
IYCF area graph, RwandaFIGURE 33
0%
100%
80%
60%
40%
20%
0–1 2–3 22–2318–1916–1714–1512–1310–118–96–74–5 20–21
Age (months)
Weaned (not breastfed)
Breastfed and complementary foods
Breastfed and other milk/ formula
Breastfed and non-milk liquids
Breastfed and plain water only
Exclusively breastfed
IYCF area graph, NigeriaFIGURE 32
0%
100%
80%
60%
40%
20%
0–1 2–3 22–2318–1916–1714–1512–1310–118–96–74–5 20–21
Age (months)
Weaned (not breastfed)
Breastfed and complementary foods
Breastfed and other milk/ formula
Breastfed and non-milk liquids
Breastfed and plain water only
Exclusively breastfed
Source: DHS, 2008�
Source: DHS, 2010�
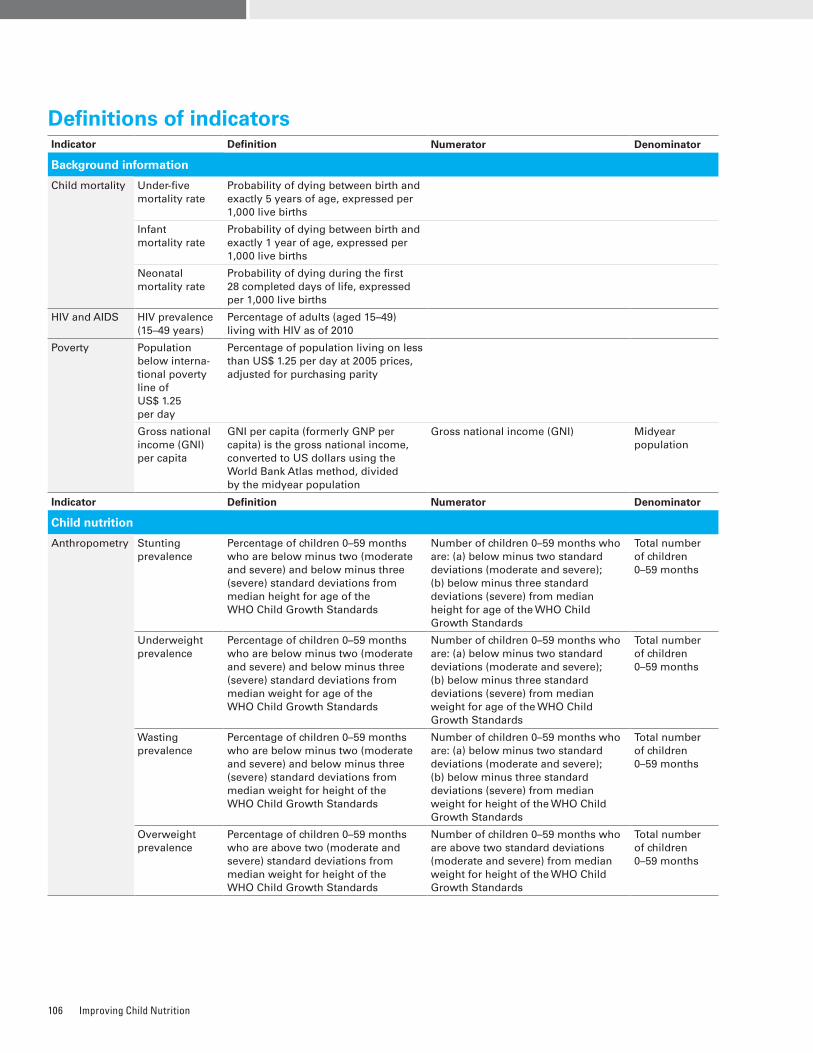
Improving Child Nutrition106
Definitions of indicatorsIndicator Definition Numerator Denominator
Background information
Child mortality Under-five mortality rate
Probability of dying between birth and exactly 5 years of age, expressed per 1,000 live births
Infant mortality rate
Probability of dying between birth and exactly 1 year of age, expressed per 1,000 live births
Neonatal mortality rate
Probability of dying during the first 28 completed days of life, expressed per 1,000 live births
HIV and AIDS HIV prevalence (15–49 years)
Percentage of adults (aged 15–49) living with HIV as of 2010
Poverty Population below interna-tional poverty line of US$ 1.25 per day
Percentage of population living on less than US$ 1.25 per day at 2005 prices, adjusted for purchasing parity
Gross national income (GNI) per capita
GNI per capita (formerly GNP per capita) is the gross national income, converted to US dollars using the World Bank Atlas method, divided by the midyear population
Gross national income (GNI) Midyear population
Indicator Definition Numerator Denominator
Child nutrition
Anthropometry Stunting prevalence
Percentage of children 0–59 months who are below minus two (moderate and severe) and below minus three (severe) standard deviations from median height for age of the WHO Child Growth Standards
Number of children 0–59 months who are: (a) below minus two standard deviations (moderate and severe); (b) below minus three standard deviations (severe) from median height for age of the WHO Child Growth Standards
Total number of children 0–59 months
Underweight prevalence
Percentage of children 0–59 months who are below minus two (moderate and severe) and below minus three (severe) standard deviations from median weight for age of the WHO Child Growth Standards
Number of children 0–59 months who are: (a) below minus two standard deviations (moderate and severe); (b) below minus three standard deviations (severe) from median weight for age of the WHO Child Growth Standards
Total number of children 0–59 months
Wasting prevalence
Percentage of children 0–59 months who are below minus two (moderate and severe) and below minus three (severe) standard deviations from median weight for height of the WHO Child Growth Standards
Number of children 0–59 months who are: (a) below minus two standard deviations (moderate and severe); (b) below minus three standard deviations (severe) from median weight for height of the WHO Child Growth Standards
Total number of children 0–59 months
Overweight prevalence
Percentage of children 0–59 months who are above two (moderate and severe) standard deviations from median weight for height of the WHO Child Growth Standards
Number of children 0–59 months who are above two standard deviations (moderate and severe) from median weight for height of the WHO Child Growth Standards
Total number of children 0–59 months
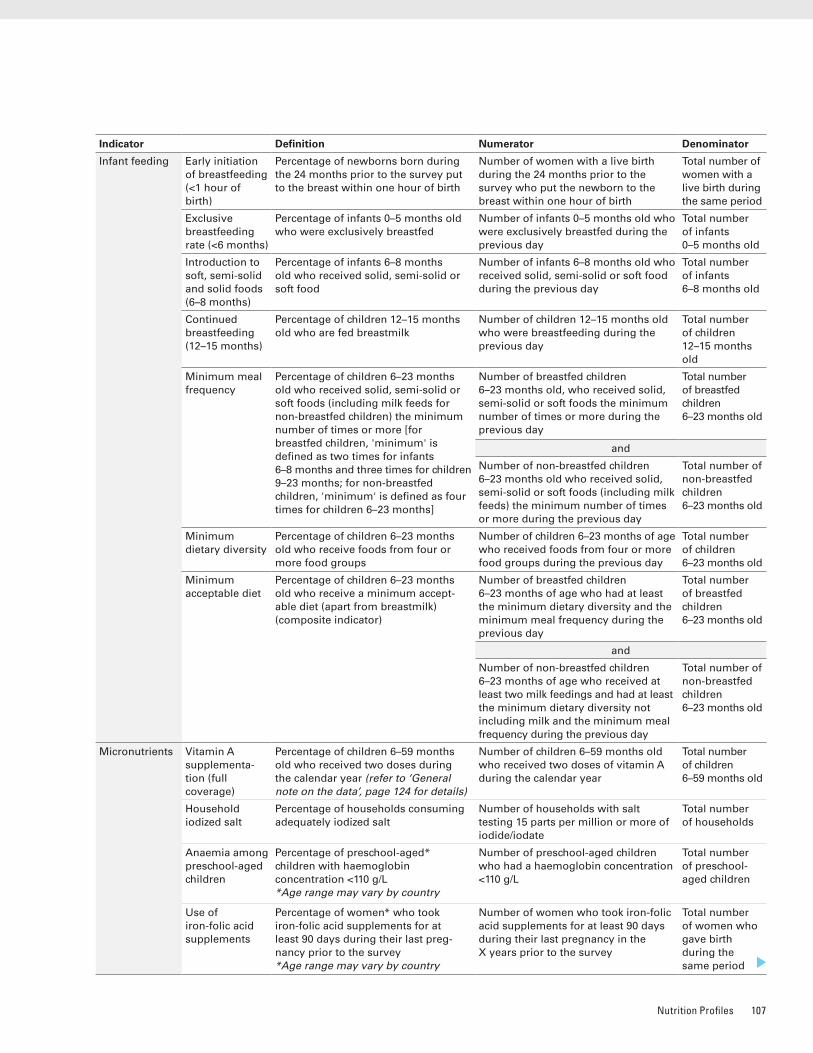
Nutrition Profiles 107
Indicator Definition Numerator Denominator
Infant feeding Early initiation of breastfeeding (<1 hour of birth)
Percentage of newborns born during the 24 months prior to the survey put to the breast within one hour of birth
Number of women with a live birth during the 24 months prior to the survey who put the newborn to the breast within one hour of birth
Total number of women with a live birth during the same period
Exclusive breastfeeding rate (<6 months)
Percentage of infants 0–5 months old who were exclusively breastfed
Number of infants 0–5 months old who were exclusively breastfed during the previous day
Total number of infants 0–5 months old
Introduction to soft, semi-solid and solid foods (6–8 months)
Percentage of infants 6–8 months old who received solid, semi-solid or soft food
Number of infants 6–8 months old who received solid, semi-solid or soft food during the previous day
Total number of infants 6–8 months old
Continued breastfeeding (12–15 months)
Percentage of children 12–15 months old who are fed breastmilk
Number of children 12–15 months old who were breastfeeding during the previous day
Total number of children 12–15 months old
Minimum meal frequency
Percentage of children 6–23 months old who received solid, semi-solid or soft foods (including milk feeds for non-breastfed children) the minimum number of times or more [for breastfed children, 'minimum' is defined as two times for infants 6–8 months and three times for children 9–23 months; for non-breastfed children, 'minimum' is defined as four times for children 6–23 months]
Number of breastfed children 6–23 months old, who received solid, semi-solid or soft foods the minimum number of times or more during the previous day
Total number of breastfed children 6–23 months old
and
Number of non-breastfed children 6–23 months old who received solid, semi-solid or soft foods (including milk feeds) the minimum number of times or more during the previous day
Total number of non-breastfed children 6–23 months old
Minimum dietary diversity
Percentage of children 6–23 months old who receive foods from four or more food groups
Number of children 6–23 months of age who received foods from four or more food groups during the previous day
Total number of children 6–23 months old
Minimum acceptable diet
Percentage of children 6–23 months old who receive a minimum accept-able diet (apart from breastmilk) (composite indicator)
Number of breastfed children 6–23 months of age who had at least the minimum dietary diversity and the minimum meal frequency during the previous day
Total number of breastfed children 6–23 months old
and
Number of non-breastfed children 6–23 months of age who received at least two milk feedings and had at least the minimum dietary diversity not including milk and the minimum meal frequency during the previous day
Total number of non-breastfed children 6–23 months old
Micronutrients Vitamin A supplementa-tion (full coverage)
Percentage of children 6–59 months old who received two doses during the calendar year (refer to ‘General note on the data’, page 124 for details)
Number of children 6–59 months old who received two doses of vitamin A during the calendar year
Total number of children 6–59 months old
Household iodized salt
Percentage of households consuming adequately iodized salt
Number of households with salt testing 15 parts per million or more of iodide/iodate
Total number of households
Anaemia among preschool-aged children
Percentage of preschool-aged* children with haemoglobin concentration <110 g/L *Age range may vary by country
Number of preschool-aged children who had a haemoglobin concentration <110 g/L
Total number of preschool-aged children
Use of iron-folic acid supplements
Percentage of women* who took iron-folic acid supplements for at least 90 days during their last preg-nancy prior to the survey *Age range may vary by country
Number of women who took iron-folic acid supplements for at least 90 days during their last pregnancy in the X years prior to the survey
Total number of women who gave birth during the same period
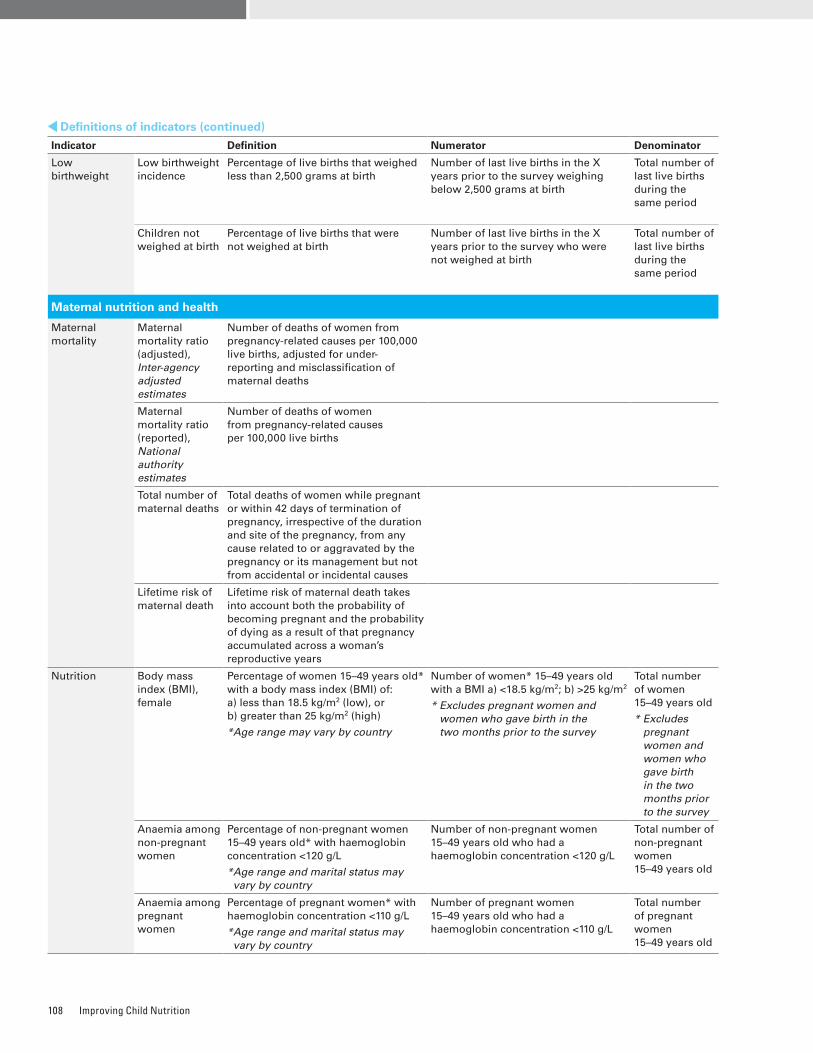
Improving Child Nutrition108
Indicator Definition Numerator Denominator
Low birthweight
Low birthweight incidence
Percentage of live births that weighed less than 2,500 grams at birth
Number of last live births in the X years prior to the survey weighing below 2,500 grams at birth
Total number of last live births during the same period
Children not weighed at birth
Percentage of live births that were not weighed at birth
Number of last live births in the X years prior to the survey who were not weighed at birth
Total number of last live births during the same period
Maternal nutrition and health
Maternal mortality
Maternal mortality ratio (adjusted), Inter-agency adjusted estimates
Number of deaths of women from pregnancy-related causes per 100,000 live births, adjusted for under-reporting and misclassification of maternal deaths
Maternal mortality ratio (reported), National authority estimates
Number of deaths of women from pregnancy-related causes per 100,000 live births
Total number of maternal deaths
Total deaths of women while pregnant or within 42 days of termination of pregnancy, irrespective of the duration and site of the pregnancy, from any cause related to or aggravated by the pregnancy or its management but not from accidental or incidental causes
Lifetime risk of maternal death
Lifetime risk of maternal death takes into account both the probability of becoming pregnant and the probability of dying as a result of that pregnancy accumulated across a woman’s reproductive years
Nutrition Body mass index (BMI), female
Percentage of women 15–49 years old* with a body mass index (BMI) of: a) less than 18.5 kg/m2 (low), or b) greater than 25 kg/m2 (high)
*Age range may vary by country
Number of women* 15–49 years old with a BMI a) <18.5 kg/m2; b) >25 kg/m2
* Excludes pregnant women and women who gave birth in the two months prior to the survey
Total number of women 15–49 years old
* Excludes pregnant women and women who gave birth in the two months prior to the survey
Anaemia among non-pregnant women
Percentage of non-pregnant women 15–49 years old* with haemoglobin concentration <120 g/L
* Age range and marital status may vary by country
Number of non-pregnant women 15–49 years old who had a haemoglobin concentration <120 g/L
Total number of non-pregnant women 15–49 years old
Anaemia among pregnant women
Percentage of pregnant women* with haemoglobin concentration <110 g/L
* Age range and marital status may vary by country
Number of pregnant women 15–49 years old who had a haemoglobin concentration <110 g/L
Total number of pregnant women 15–49 years old
Definitions of indicators (continued)
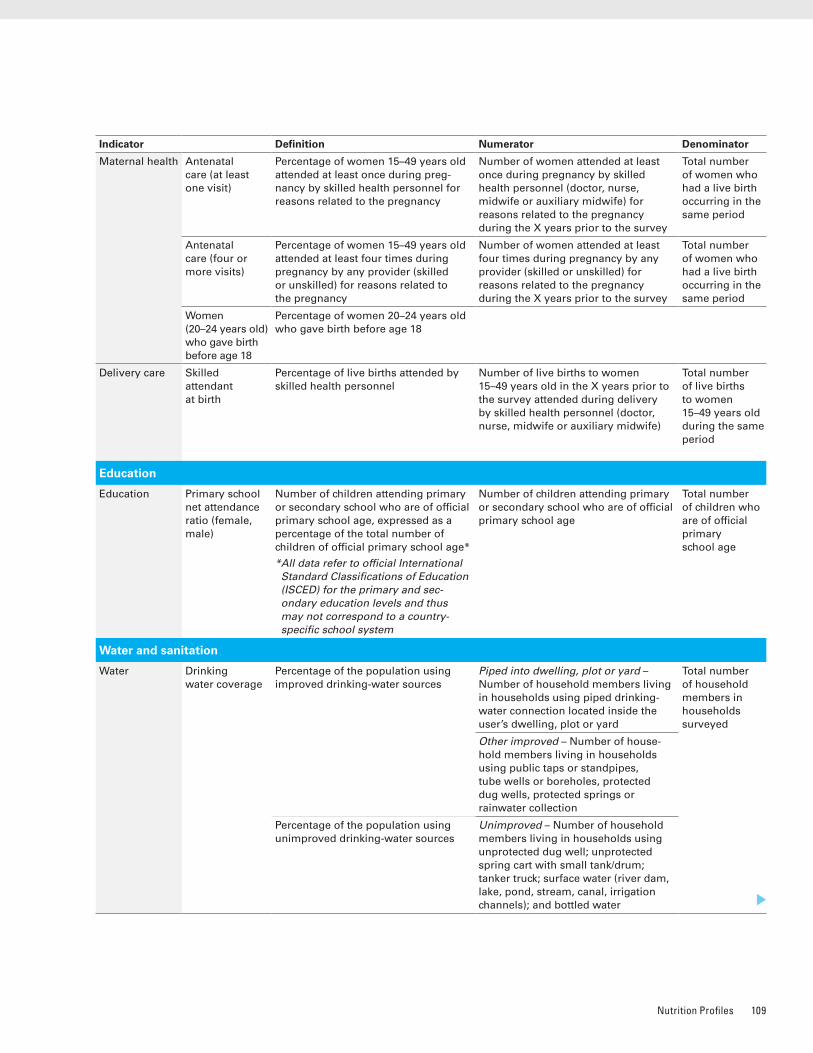
Nutrition Profiles 109
Indicator Definition Numerator Denominator
Maternal health Antenatal care (at least one visit)
Percentage of women 15–49 years old attended at least once during preg-nancy by skilled health personnel for reasons related to the pregnancy
Number of women attended at least once during pregnancy by skilled health personnel (doctor, nurse, midwife or auxiliary midwife) for reasons related to the pregnancy during the X years prior to the survey
Total number of women who had a live birth occurring in the same period
Antenatal care (four or more visits)
Percentage of women 15–49 years old attended at least four times during pregnancy by any provider (skilled or unskilled) for reasons related to the pregnancy
Number of women attended at least four times during pregnancy by any provider (skilled or unskilled) for reasons related to the pregnancy during the X years prior to the survey
Total number of women who had a live birth occurring in the same period
Women (20–24 years old) who gave birth before age 18
Percentage of women 20–24 years old who gave birth before age 18
Delivery care Skilled attendant at birth
Percentage of live births attended by skilled health personnel
Number of live births to women 15–49 years old in the X years prior to the survey attended during delivery by skilled health personnel (doctor, nurse, midwife or auxiliary midwife)
Total number of live births to women 15–49 years old during the same period
Education
Education Primary school net attendance ratio (female, male)
Number of children attending primary or secondary school who are of official primary school age, expressed as a percentage of the total number of children of official primary school age*
* All data refer to official International Standard Classifications of Education (ISCED) for the primary and sec-ondary education levels and thus may not correspond to a country-specific school system
Number of children attending primary or secondary school who are of official primary school age
Total number of children who are of official primary school age
Water and sanitation
Water Drinking water coverage
Percentage of the population using improved drinking-water sources
Piped into dwelling, plot or yard – Number of household members living in households using piped drinking-water connection located inside the user’s dwelling, plot or yard
Total number of household members in households surveyed
Other improved – Number of house-hold members living in households using public taps or standpipes, tube wells or boreholes, protected dug wells, protected springs or rainwater collection
Percentage of the population using unimproved drinking-water sources
Unimproved – Number of household members living in households using unprotected dug well; unprotected spring cart with small tank/drum; tanker truck; surface water (river dam, lake, pond, stream, canal, irrigation channels); and bottled water
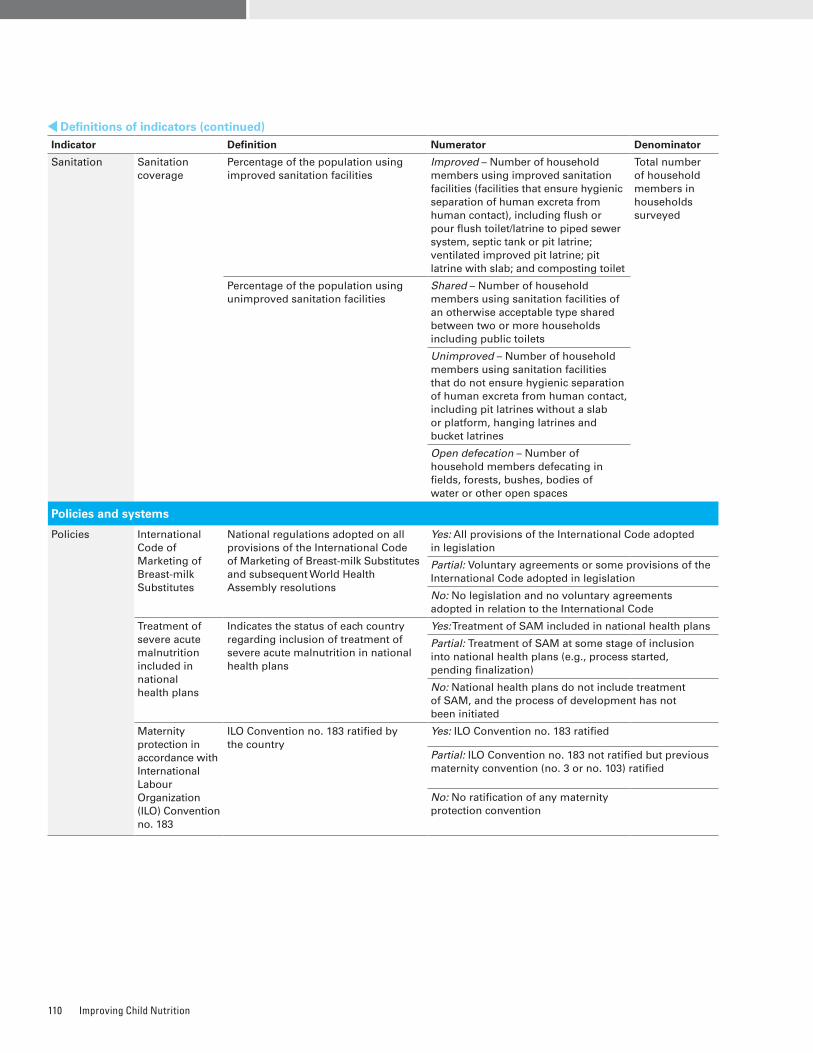
Improving Child Nutrition110
Indicator Definition Numerator Denominator
Sanitation Sanitation coverage
Percentage of the population using improved sanitation facilities
Improved – Number of household members using improved sanitation facilities (facilities that ensure hygienic separation of human excreta from human contact), including flush or pour flush toilet/latrine to piped sewer system, septic tank or pit latrine; ventilated improved pit latrine; pit latrine with slab; and composting toilet
Total number of household members in households surveyed
Percentage of the population using unimproved sanitation facilities
Shared – Number of household members using sanitation facilities of an otherwise acceptable type shared between two or more households including public toilets
Unimproved – Number of household members using sanitation facilities that do not ensure hygienic separation of human excreta from human contact, including pit latrines without a slab or platform, hanging latrines and bucket latrines
Open defecation – Number of household members defecating in fields, forests, bushes, bodies of water or other open spaces
Policies and systems
Policies International Code of Marketing of Breast-milk Substitutes
National regulations adopted on all provisions of the International Code of Marketing of Breast-milk Substitutes and subsequent World Health Assembly resolutions
Yes: All provisions of the International Code adopted in legislation
Partial: Voluntary agreements or some provisions of the International Code adopted in legislation
No: No legislation and no voluntary agreements adopted in relation to the International Code
Treatment of severe acute malnutrition included in national health plans
Indicates the status of each country regarding inclusion of treatment of severe acute malnutrition in national health plans
Yes: Treatment of SAM included in national health plans
Partial: Treatment of SAM at some stage of inclusion into national health plans (e.g., process started, pending finalization)
No: National health plans do not include treatment of SAM, and the process of development has not been initiated
Maternity protection in accordance with International Labour Organization (ILO) Convention no. 183
ILO Convention no. 183 ratified by the country
Yes: ILO Convention no. 183 ratified
Partial: ILO Convention no. 183 not ratified but previous maternity convention (no. 3 or no. 103) ratified
No: No ratification of any maternity protection convention
Definitions of indicators (continued)
Nutrition Profiles 111
Data sourcesDemographics and background indicators Total population, total under-five population, total number of births – United Nations, Department of Economic and Social Affairs, Population Division. World Population Prospects: The 2010 revision, CD-ROM Edition, <http://esa.un.org/unpd/wpp/index.htm>.
Under-five mortality rate, infant mortality rate, total number of under-five deaths – United Nations Inter-agency Group for Child Mortality Estimation (IGME). UNICEF/WHO/World Bank/United Nations Population Division, 2012.
Causes of under-five deaths – World Health Organization. Child Health Epidemiology Reference Group (CHERG), 2012.
Neonatal mortality rate – World Health Organization. Civil registrations, surveillance systems and household surveys.
HIV prevalence (15–49 years) – Joint United Nations Programme on HIV/AIDS (UNAIDS). Report on the Global AIDS Epidemic 2012.
Population below international poverty line of US $1.25 per day, gross national income (GNI) per capita – World Bank.
Primary school net attendance rate (female, male) – United Nations Children’s Fund, based on Demographic and Health Surveys, Multiple Indicator Cluster Surveys, other national household surveys.
Child nutritionStunting prevalence, underweight prevalence, wasting prevalence, overweight prevalence – United Nations Children’s Fund, based on Demographic and Health Surveys, Multiple Indicator Cluster Surveys, other national household surveys.
Early initiation of breastfeeding (<1 hour of birth), exclusive breastfeeding rate (<6 months), introduction to soft, semi-soft and solid foods (6–8 months), continued breast-feeding (12–15 months) – United Nations Children’s Fund, based on Demographic and Health Surveys, Multiple Indicator Cluster Surveys, other national household surveys.
Minimum meal frequency, dietary diversity, minimum acceptable diet – United Nations Children’s Fund, special data compilation by Nutrition Section, based on Demographic and Health Surveys, Multiple Indicator Cluster Surveys, other national household surveys.
Vitamin A supplementation (full coverage) – United Nations Children’s Fund, based on National Immunization Days and routine reporting, Demographic and Health Surveys, Multiple Indicator Cluster Surveys.
Household iodized salt – United Nations Children’s Fund, based on Demographic and Health Surveys (DHS), Multiple Indicator Cluster Surveys (MICS), other national household surveys.
Anaemia among preschool-aged children, use of iron-folic acid supplements – United Nations Children’s Fund, special data compilation by Nutrition Section, based on DHS, MICS and other national household surveys.
Low birthweight incidence, children not weighed at birth – United Nations Children’s Fund, based on Demographic and Health Surveys, Multiple Indicator Cluster Surveys, other national household surveys.
Maternal nutrition and healthMaternal mortality ratio (adjusted), total number of maternal deaths, lifetime risk of maternal death – Maternal Mortality Estimation Inter-agency Group (MMEIG). WHO/UNICEF/United Nations Population Fund/World Bank, 2012.
Maternal mortality ratio (reported) – United Nations Children’s Fund, based on vital registration systems, routine reporting, Demographic and Health Surveys, Multiple Indicator Cluster Surveys, and other national household surveys.
Body mass index (BMI), female, anaemia among non-pregnant women, anaemia among pregnant women – United Nations Children’s Fund, special data compilation by Nutrition Section, based on Demographic and Health Surveys, Multiple Indicator Cluster Surveys, other national household surveys.
Antenatal care (at least one visit), antenatal care (four or more visits), women 20–24 years old who gave birth before age 18, skilled attendant at birth – United Nations Children’s Fund, based on Demographic and Health Surveys, Multiple Indicator Cluster Surveys, other national household surveys.
Water and sanitationDrinking water coverage, sanitation coverage – World Health Organization/United Nations Children’s Fund, Joint Monitoring Programme (JMP) for Water Supply and Sanitation, 2012.
Policies and systemsInternational Code of Marketing of Breast-milk Substitutes – United Nations Children’s Fund, special data compilation by Nutrition Section in October 2012.
Treatment of severe acute malnutrition included in national health plans – United Nations Children’s Fund, special data compilation by Nutrition Section for global SAM update in December 2011.
Maternity protection in accordance with International Labour Organization – International Labour Organization. NORMLEX (Information System on International Labour Standards), accessed October 2012.

Improving Child Nutrition112
Nutrition Profiles 113
STATISTICAL TABLES
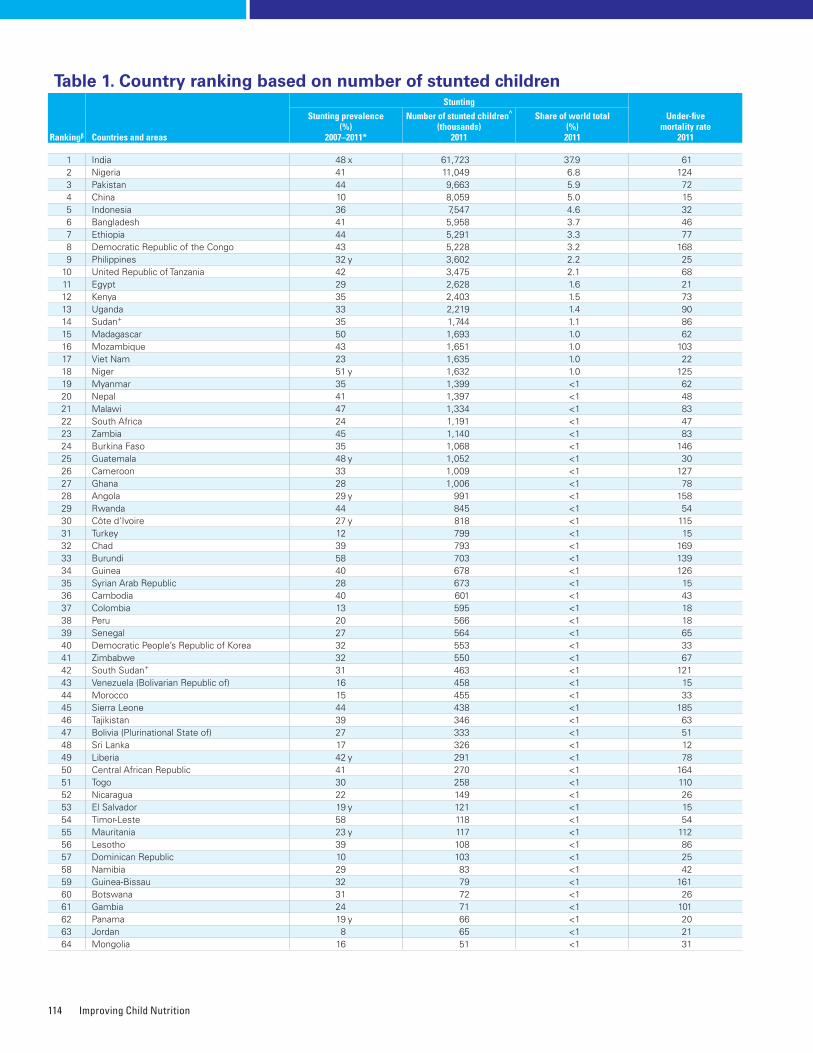
Improving Child Nutrition114
Rankingβ Countries and areas
StuntingUnder-five
mortality rate2011
Stunting prevalence (%)
2007–2011*
Number of stunted children^ (thousands)
2011
Share of world total (%)2011
1 India 48 x 61,723 37�9 612 Nigeria 41 11,049 6�8 1243 Pakistan 44 9,663 5�9 724 China 10 8,059 5�0 155 Indonesia 36 7,547 4�6 326 Bangladesh 41 5,958 3�7 467 Ethiopia 44 5,291 3�3 778 Democratic Republic of the Congo 43 5,228 3�2 1689 Philippines 32 y 3,602 2�2 25
10 United Republic of Tanzania 42 3,475 2�1 6811 Egypt 29 2,628 1�6 2112 Kenya 35 2,403 1�5 7313 Uganda 33 2,219 1�4 9014 Sudan+ 35 1,744 1�1 8615 Madagascar 50 1,693 1�0 6216 Mozambique 43 1,651 1�0 10317 Viet Nam 23 1,635 1�0 2218 Niger 51 y 1,632 1�0 12519 Myanmar 35 1,399 <1 6220 Nepal 41 1,397 <1 4821 Malawi 47 1,334 <1 8322 South Africa 24 1,191 <1 4723 Zambia 45 1,140 <1 8324 Burkina Faso 35 1,068 <1 14625 Guatemala 48 y 1,052 <1 3026 Cameroon 33 1,009 <1 12727 Ghana 28 1,006 <1 7828 Angola 29 y 991 <1 15829 Rwanda 44 845 <1 5430 Côte d’Ivoire 27 y 818 <1 11531 Turkey 12 799 <1 1532 Chad 39 793 <1 16933 Burundi 58 703 <1 13934 Guinea 40 678 <1 12635 Syrian Arab Republic 28 673 <1 1536 Cambodia 40 601 <1 4337 Colombia 13 595 <1 1838 Peru 20 566 <1 1839 Senegal 27 564 <1 6540 Democratic People’s Republic of Korea 32 553 <1 3341 Zimbabwe 32 550 <1 6742 South Sudan+ 31 463 <1 12143 Venezuela (Bolivarian Republic of) 16 458 <1 1544 Morocco 15 455 <1 3345 Sierra Leone 44 438 <1 18546 Tajikistan 39 346 <1 6347 Bolivia (Plurinational State of) 27 333 <1 5148 Sri Lanka 17 326 <1 1249 Liberia 42 y 291 <1 7850 Central African Republic 41 270 <1 16451 Togo 30 258 <1 11052 Nicaragua 22 149 <1 2653 El Salvador 19 y 121 <1 1554 Timor-Leste 58 118 <1 5455 Mauritania 23 y 117 <1 11256 Lesotho 39 108 <1 8657 Dominican Republic 10 103 <1 2558 Namibia 29 83 <1 4259 Guinea-Bissau 32 79 <1 16160 Botswana 31 72 <1 2661 Gambia 24 71 <1 10162 Panama 19 y 66 <1 2063 Jordan 8 65 <1 2164 Mongolia 16 51 <1 31
Table 1. Country ranking based on number of stunted children
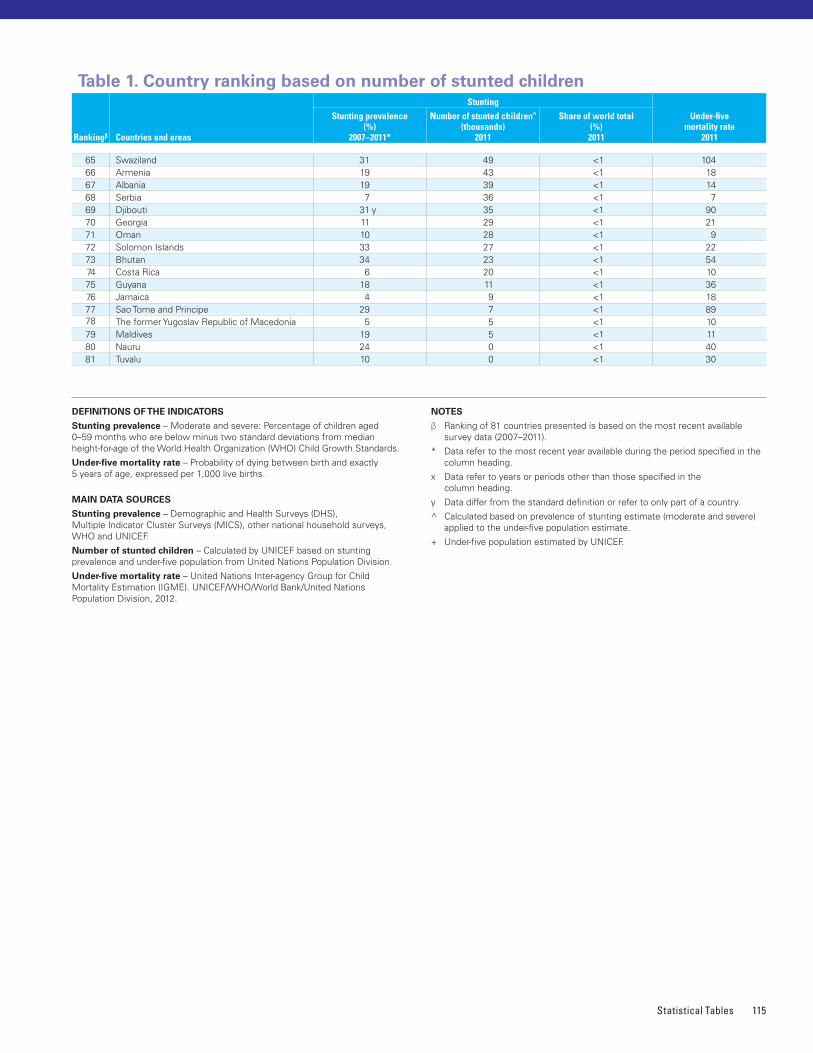
Statistical Tables 115
65 Swaziland 31 49 <1 10466 Armenia 19 43 <1 1867 Albania 19 39 <1 1468 Serbia 7 36 <1 769 Djibouti 31 y 35 <1 9070 Georgia 11 29 <1 2171 Oman 10 28 <1 972 Solomon Islands 33 27 <1 2273 Bhutan 34 23 <1 5474 Costa Rica 6 20 <1 1075 Guyana 18 11 <1 3676 Jamaica 4 9 <1 1877 Sao Tome and Principe 29 7 <1 8978 The former Yugoslav Republic of Macedonia 5 5 <1 1079 Maldives 19 5 <1 1180 Nauru 24 0 <1 4081 Tuvalu 10 0 <1 30
DEFINITIONS OF THE INDICATORS
Stunting prevalence – Moderate and severe: Percentage of children aged 0–59 months who are below minus two standard deviations from median height-for-age of the World Health Organization (WHO) Child Growth Standards�
Under-five mortality rate – Probability of dying between birth and exactly 5 years of age, expressed per 1,000 live births�
MAIN DATA SOURCES
Stunting prevalence – Demographic and Health Surveys (DHS), Multiple Indicator Cluster Surveys (MICS), other national household surveys, WHO and UNICEF�
Number of stunted children – Calculated by UNICEF based on stunting prevalence and under-five population from United Nations Population Division�
Under-five mortality rate – United Nations Inter-agency Group for Child Mortality Estimation (IGME)� UNICEF/WHO/World Bank/United Nations Population Division, 2012�
NOTES
β Ranking of 81 countries presented is based on the most recent available survey data (2007–2011)�
* Data refer to the most recent year available during the period specified in the column heading�
x Data refer to years or periods other than those specified in the column heading�
y Data differ from the standard definition or refer to only part of a country�
^ Calculated based on prevalence of stunting estimate (moderate and severe) applied to the under-five population estimate�
+ Under-five population estimated by UNICEF�
Rankingβ Countries and areas
StuntingUnder-five
mortality rate2011
Stunting prevalence (%)
2007–2011*
Number of stunted children^ (thousands)
2011
Share of world total (%)2011
Table 1. Country ranking based on number of stunted children
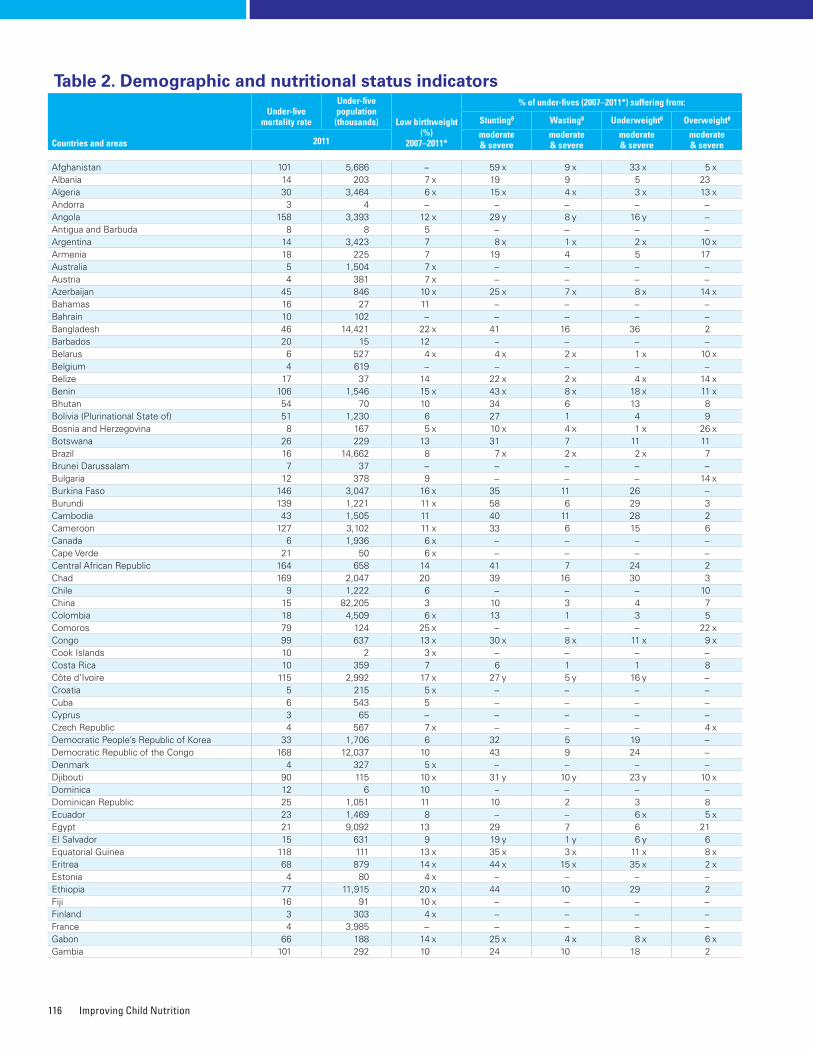
Improving Child Nutrition116
Countries and areas
Under-five mortality rate
Under-five population (thousands) Low birthweight
(%)2007–2011*
% of under-fives (2007–2011*) suffering from:
Stuntingθ Wastingθ Underweightθ Overweightθ
2011moderate & severe
moderate & severe
moderate & severe
moderate & severe
Afghanistan 101 5,686 − 59 x 9 x 33 x 5 xAlbania 14 203 7 x 19 9 5 23Algeria 30 3,464 6 x 15 x 4 x 3 x 13 xAndorra 3 4 − − − − −Angola 158 3,393 12 x 29 y 8 y 16 y −Antigua and Barbuda 8 8 5 − − − −Argentina 14 3,423 7 8 x 1 x 2 x 10 xArmenia 18 225 7 19 4 5 17Australia 5 1,504 7 x − − − −Austria 4 381 7 x − − − −Azerbaijan 45 846 10 x 25 x 7 x 8 x 14 xBahamas 16 27 11 − − − −Bahrain 10 102 − − − − −Bangladesh 46 14,421 22 x 41 16 36 2Barbados 20 15 12 − − − −Belarus 6 527 4 x 4 x 2 x 1 x 10 xBelgium 4 619 − − − − −Belize 17 37 14 22 x 2 x 4 x 14 xBenin 106 1,546 15 x 43 x 8 x 18 x 11 xBhutan 54 70 10 34 6 13 8Bolivia (Plurinational State of) 51 1,230 6 27 1 4 9Bosnia and Herzegovina 8 167 5 x 10 x 4 x 1 x 26 xBotswana 26 229 13 31 7 11 11Brazil 16 14,662 8 7 x 2 x 2 x 7Brunei Darussalam 7 37 − − − − −Bulgaria 12 378 9 − − − 14 xBurkina Faso 146 3,047 16 x 35 11 26 −Burundi 139 1,221 11 x 58 6 29 3Cambodia 43 1,505 11 40 11 28 2Cameroon 127 3,102 11 x 33 6 15 6Canada 6 1,936 6 x − − − −Cape Verde 21 50 6 x − − − −Central African Republic 164 658 14 41 7 24 2Chad 169 2,047 20 39 16 30 3Chile 9 1,222 6 − − − 10China 15 82,205 3 10 3 4 7Colombia 18 4,509 6 x 13 1 3 5Comoros 79 124 25 x − − − 22 xCongo 99 637 13 x 30 x 8 x 11 x 9 xCook Islands 10 2 3 x − − − −Costa Rica 10 359 7 6 1 1 8Côte d’Ivoire 115 2,992 17 x 27 y 5 y 16 y −Croatia 5 215 5 x − − − −Cuba 6 543 5 − − − −Cyprus 3 65 − − − − −Czech Republic 4 567 7 x − − − 4 xDemocratic People’s Republic of Korea 33 1,706 6 32 5 19 −Democratic Republic of the Congo 168 12,037 10 43 9 24 −Denmark 4 327 5 x − − − −Djibouti 90 115 10 x 31 y 10 y 23 y 10 xDominica 12 6 10 − − − −Dominican Republic 25 1,051 11 10 2 3 8Ecuador 23 1,469 8 − − 6 x 5 xEgypt 21 9,092 13 29 7 6 21El Salvador 15 631 9 19 y 1 y 6 y 6Equatorial Guinea 118 111 13 x 35 x 3 x 11 x 8 xEritrea 68 879 14 x 44 x 15 x 35 x 2 xEstonia 4 80 4 x − − − −Ethiopia 77 11,915 20 x 44 10 29 2Fiji 16 91 10 x − − − −Finland 3 303 4 x − − − −France 4 3,985 − − − − −Gabon 66 188 14 x 25 x 4 x 8 x 6 xGambia 101 292 10 24 10 18 2
Table 2. Demographic and nutritional status indicators
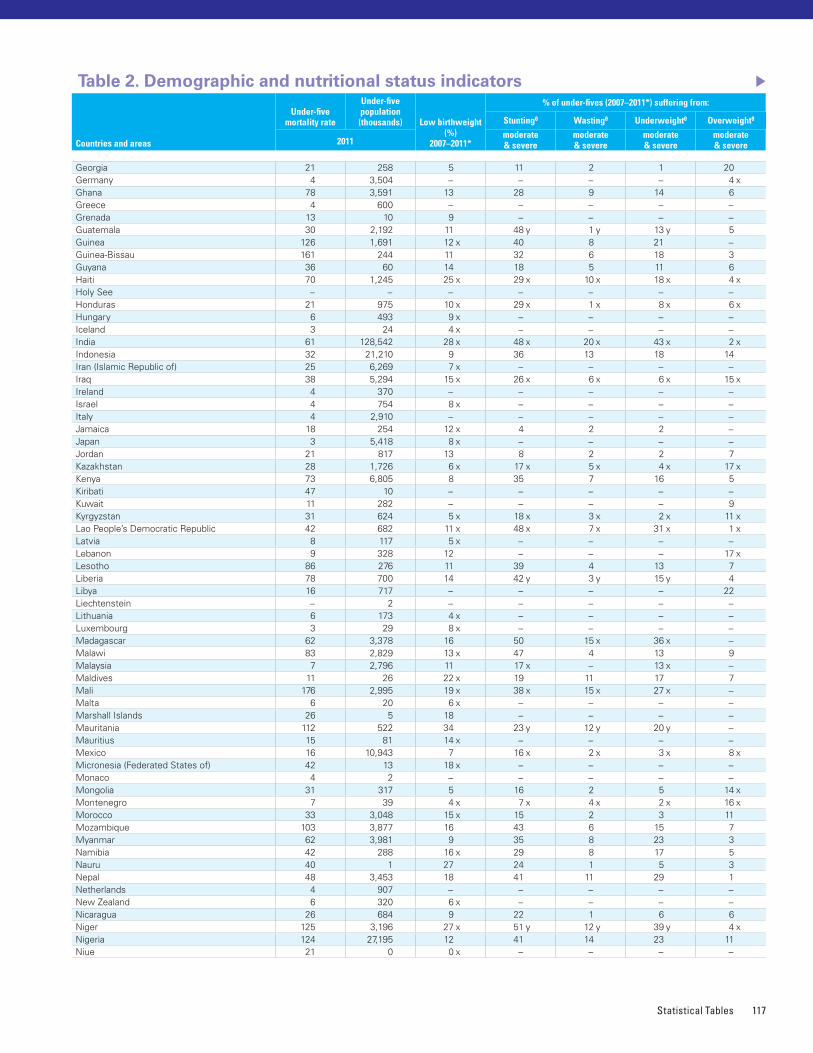
Statistical Tables 117
Georgia 21 258 5 11 2 1 20Germany 4 3,504 − − − − 4 xGhana 78 3,591 13 28 9 14 6Greece 4 600 − − − − −Grenada 13 10 9 − − − −Guatemala 30 2,192 11 48 y 1 y 13 y 5Guinea 126 1,691 12 x 40 8 21 −Guinea-Bissau 161 244 11 32 6 18 3Guyana 36 60 14 18 5 11 6Haiti 70 1,245 25 x 29 x 10 x 18 x 4 xHoly See − − − − − − −Honduras 21 975 10 x 29 x 1 x 8 x 6 xHungary 6 493 9 x − − − −Iceland 3 24 4 x − − − −India 61 128,542 28 x 48 x 20 x 43 x 2 xIndonesia 32 21,210 9 36 13 18 14Iran (Islamic Republic of) 25 6,269 7 x − − − −Iraq 38 5,294 15 x 26 x 6 x 6 x 15 xIreland 4 370 − − − − −Israel 4 754 8 x − − − −Italy 4 2,910 − − − − −Jamaica 18 254 12 x 4 2 2 −Japan 3 5,418 8 x − − − −Jordan 21 817 13 8 2 2 7Kazakhstan 28 1,726 6 x 17 x 5 x 4 x 17 xKenya 73 6,805 8 35 7 16 5Kiribati 47 10 − − − − −Kuwait 11 282 − − − − 9Kyrgyzstan 31 624 5 x 18 x 3 x 2 x 11 xLao People’s Democratic Republic 42 682 11 x 48 x 7 x 31 x 1 xLatvia 8 117 5 x − − − −Lebanon 9 328 12 − − − 17 xLesotho 86 276 11 39 4 13 7Liberia 78 700 14 42 y 3 y 15 y 4Libya 16 717 − − − − 22Liechtenstein − 2 − − − − −Lithuania 6 173 4 x − − − −Luxembourg 3 29 8 x − − − −Madagascar 62 3,378 16 50 15 x 36 x −Malawi 83 2,829 13 x 47 4 13 9Malaysia 7 2,796 11 17 x − 13 x −Maldives 11 26 22 x 19 11 17 7Mali 176 2,995 19 x 38 x 15 x 27 x −Malta 6 20 6 x − − − −Marshall Islands 26 5 18 − − − −Mauritania 112 522 34 23 y 12 y 20 y −Mauritius 15 81 14 x − − − −Mexico 16 10,943 7 16 x 2 x 3 x 8 xMicronesia (Federated States of) 42 13 18 x − − − −Monaco 4 2 − − − − −Mongolia 31 317 5 16 2 5 14 xMontenegro 7 39 4 x 7 x 4 x 2 x 16 xMorocco 33 3,048 15 x 15 2 3 11Mozambique 103 3,877 16 43 6 15 7Myanmar 62 3,981 9 35 8 23 3Namibia 42 288 16 x 29 8 17 5Nauru 40 1 27 24 1 5 3Nepal 48 3,453 18 41 11 29 1Netherlands 4 907 − − − − −New Zealand 6 320 6 x − − − −Nicaragua 26 684 9 22 1 6 6Niger 125 3,196 27 x 51 y 12 y 39 y 4 xNigeria 124 27,195 12 41 14 23 11Niue 21 0 0 x − − − −
Countries and areas
Under-five mortality rate
Under-five population (thousands) Low birthweight
(%)2007–2011*
% of under-fives (2007–2011*) suffering from:
Stuntingθ Wastingθ Underweightθ Overweightθ
2011moderate & severe
moderate & severe
moderate & severe
moderate & severe
Table 2. Demographic and nutritional status indicators
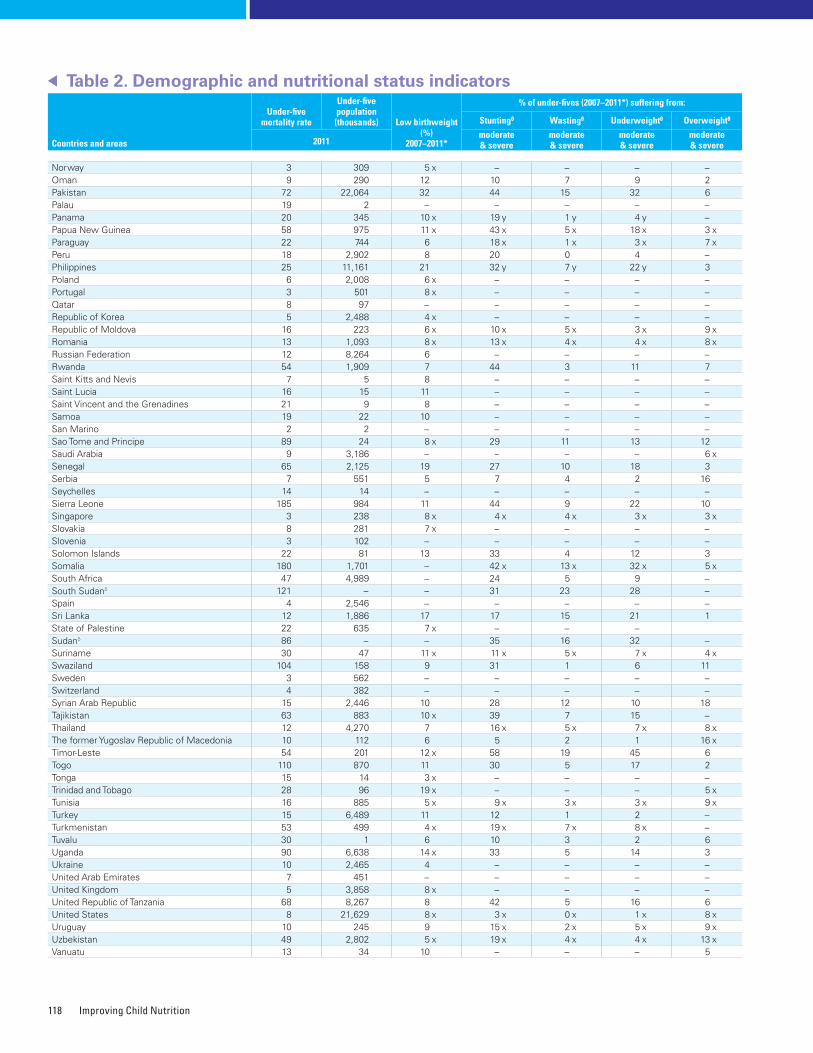
Improving Child Nutrition118
Norway 3 309 5 x − − − −Oman 9 290 12 10 7 9 2Pakistan 72 22,064 32 44 15 32 6Palau 19 2 − − − − −Panama 20 345 10 x 19 y 1 y 4 y −Papua New Guinea 58 975 11 x 43 x 5 x 18 x 3 xParaguay 22 744 6 18 x 1 x 3 x 7 xPeru 18 2,902 8 20 0 4 −Philippines 25 11,161 21 32 y 7 y 22 y 3Poland 6 2,008 6 x − − − −Portugal 3 501 8 x − − − −Qatar 8 97 − − − − −Republic of Korea 5 2,488 4 x − − − −Republic of Moldova 16 223 6 x 10 x 5 x 3 x 9 xRomania 13 1,093 8 x 13 x 4 x 4 x 8 xRussian Federation 12 8,264 6 − − − −Rwanda 54 1,909 7 44 3 11 7Saint Kitts and Nevis 7 5 8 − − − −Saint Lucia 16 15 11 − − − −Saint Vincent and the Grenadines 21 9 8 − − − −Samoa 19 22 10 − − − −San Marino 2 2 − − − − −Sao Tome and Principe 89 24 8 x 29 11 13 12Saudi Arabia 9 3,186 − − − − 6 xSenegal 65 2,125 19 27 10 18 3Serbia 7 551 5 7 4 2 16Seychelles 14 14 − − − − −Sierra Leone 185 984 11 44 9 22 10Singapore 3 238 8 x 4 x 4 x 3 x 3 xSlovakia 8 281 7 x − − − −Slovenia 3 102 − − − − −Solomon Islands 22 81 13 33 4 12 3Somalia 180 1,701 − 42 x 13 x 32 x 5 xSouth Africa 47 4,989 − 24 5 9 −South Sudanδ 121 − − 31 23 28 −Spain 4 2,546 − − − − −Sri Lanka 12 1,886 17 17 15 21 1State of Palestine 22 635 7 x − − −Sudanδ 86 − − 35 16 32 −Suriname 30 47 11 x 11 x 5 x 7 x 4 xSwaziland 104 158 9 31 1 6 11Sweden 3 562 − − − − −Switzerland 4 382 − − − − −Syrian Arab Republic 15 2,446 10 28 12 10 18Tajikistan 63 883 10 x 39 7 15 −Thailand 12 4,270 7 16 x 5 x 7 x 8 xThe former Yugoslav Republic of Macedonia 10 112 6 5 2 1 16 xTimor-Leste 54 201 12 x 58 19 45 6Togo 110 870 11 30 5 17 2Tonga 15 14 3 x − − − −Trinidad and Tobago 28 96 19 x − − − 5 xTunisia 16 885 5 x 9 x 3 x 3 x 9 xTurkey 15 6,489 11 12 1 2 −Turkmenistan 53 499 4 x 19 x 7 x 8 x −Tuvalu 30 1 6 10 3 2 6Uganda 90 6,638 14 x 33 5 14 3Ukraine 10 2,465 4 − − − −United Arab Emirates 7 451 − − − − −United Kingdom 5 3,858 8 x − − − −United Republic of Tanzania 68 8,267 8 42 5 16 6United States 8 21,629 8 x 3 x 0 x 1 x 8 xUruguay 10 245 9 15 x 2 x 5 x 9 xUzbekistan 49 2,802 5 x 19 x 4 x 4 x 13 xVanuatu 13 34 10 − − − 5
Table 2. Demographic and nutritional status indicators
Countries and areas
Under-five mortality rate
Under-five population (thousands) Low birthweight
(%)2007–2011*
% of under-fives (2007–2011*) suffering from:
Stuntingθ Wastingθ Underweightθ Overweightθ
2011moderate & severe
moderate & severe
moderate & severe
moderate & severe
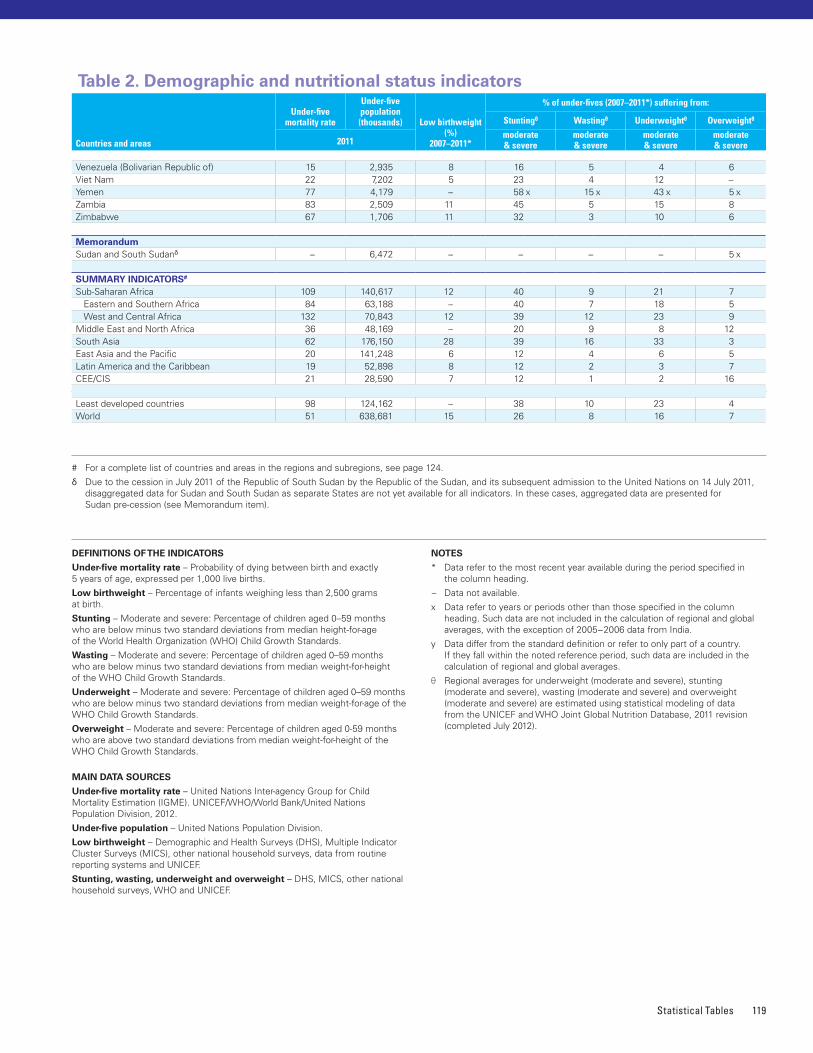
Statistical Tables 119
# For a complete list of countries and areas in the regions and subregions, see page 124�
δ Due to the cession in July 2011 of the Republic of South Sudan by the Republic of the Sudan, and its subsequent admission to the United Nations on 14 July 2011, disaggregated data for Sudan and South Sudan as separate States are not yet available for all indicators� In these cases, aggregated data are presented for Sudan pre-cession (see Memorandum item)�
DEFINITIONS OF THE INDICATORS
Under-five mortality rate – Probability of dying between birth and exactly 5 years of age, expressed per 1,000 live births�
Low birthweight – Percentage of infants weighing less than 2,500 grams at birth�
Stunting – Moderate and severe: Percentage of children aged 0–59 months who are below minus two standard deviations from median height-for-age of the World Health Organization (WHO) Child Growth Standards�
Wasting – Moderate and severe: Percentage of children aged 0–59 months who are below minus two standard deviations from median weight-for-height of the WHO Child Growth Standards�
Underweight – Moderate and severe: Percentage of children aged 0–59 months who are below minus two standard deviations from median weight-for-age of the WHO Child Growth Standards�
Overweight – Moderate and severe: Percentage of children aged 0-59 months who are above two standard deviations from median weight-for-height of the WHO Child Growth Standards�
MAIN DATA SOURCES
Under-five mortality rate – United Nations Inter-agency Group for Child Mortality Estimation (IGME)� UNICEF/WHO/World Bank/United Nations Population Division, 2012�
Under-five population – United Nations Population Division�
Low birthweight – Demographic and Health Surveys (DHS), Multiple Indicator Cluster Surveys (MICS), other national household surveys, data from routine reporting systems and UNICEF�
Stunting, wasting, underweight and overweight – DHS, MICS, other national household surveys, WHO and UNICEF�
NOTES
* Data refer to the most recent year available during the period specified in the column heading�
− Data not available�
x Data refer to years or periods other than those specified in the column heading� Such data are not included in the calculation of regional and global averages, with the exception of 2005−2006 data from India�
y Data differ from the standard definition or refer to only part of a country� If they fall within the noted reference period, such data are included in the calculation of regional and global averages�
θ Regional averages for underweight (moderate and severe), stunting (moderate and severe), wasting (moderate and severe) and overweight (moderate and severe) are estimated using statistical modeling of data from the UNICEF and WHO Joint Global Nutrition Database, 2011 revision (completed July 2012)�
Venezuela (Bolivarian Republic of) 15 2,935 8 16 5 4 6Viet Nam 22 7,202 5 23 4 12 −Yemen 77 4,179 − 58 x 15 x 43 x 5 xZambia 83 2,509 11 45 5 15 8Zimbabwe 67 1,706 11 32 3 10 6
MemorandumSudan and South Sudanδ − 6,472 − − − − 5 x
SUMMARY INDICATORS#
Sub-Saharan Africa 109 140,617 12 40 9 21 7 Eastern and Southern Africa 84 63,188 − 40 7 18 5 West and Central Africa 132 70,843 12 39 12 23 9Middle East and North Africa 36 48,169 − 20 9 8 12South Asia 62 176,150 28 39 16 33 3East Asia and the Pacific 20 141,248 6 12 4 6 5Latin America and the Caribbean 19 52,898 8 12 2 3 7CEE/CIS 21 28,590 7 12 1 2 16
Least developed countries 98 124,162 − 38 10 23 4World 51 638,681 15 26 8 16 7
Countries and areas
Under-five mortality rate
Under-five population (thousands) Low birthweight
(%)2007–2011*
% of under-fives (2007–2011*) suffering from:
Stuntingθ Wastingθ Underweightθ Overweightθ
2011moderate & severe
moderate & severe
moderate & severe
moderate & severe
Table 2. Demographic and nutritional status indicators
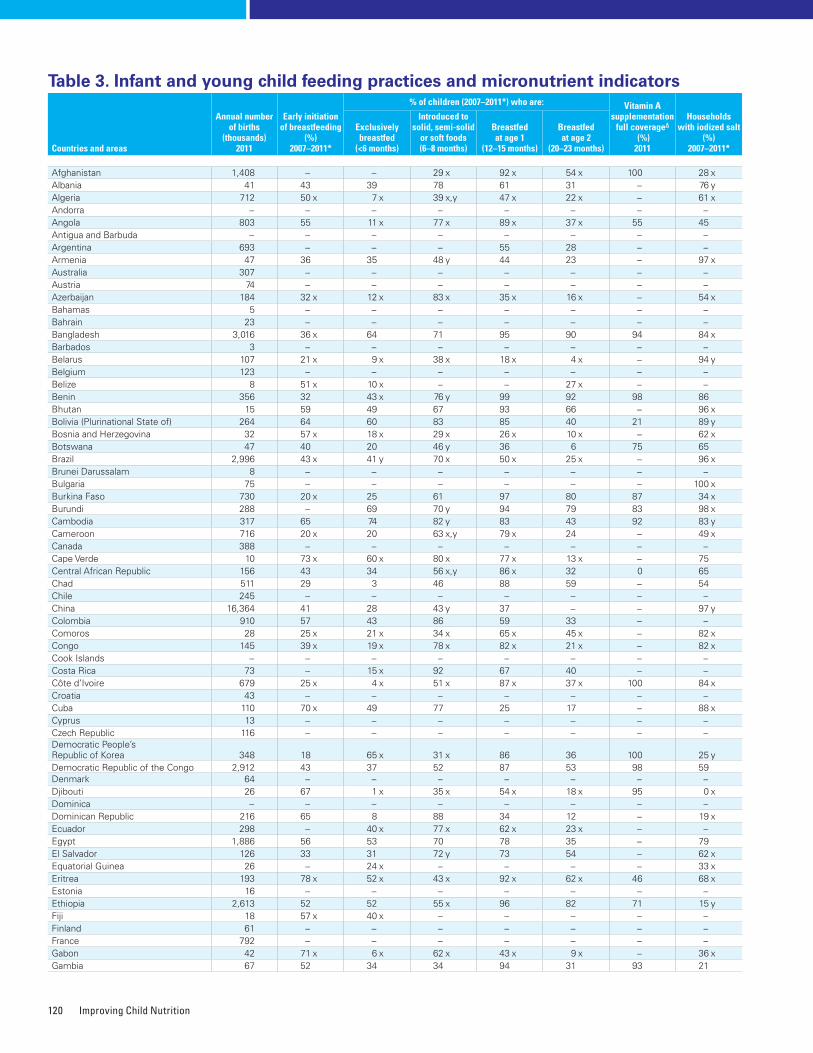
Improving Child Nutrition120
Countries and areas
Annual number of births
(thousands)2011
Early initiation of breastfeeding
(%)2007–2011*
% of children (2007–2011*) who are: Vitamin A supplementation
full coverageΔ
(%) 2011
Households with iodized salt
(%)2007–2011*
Exclusively breastfed
(<6 months)
Introduced to solid, semi-solid
or soft foods (6–8 months)
Breastfed at age 1
(12–15 months)
Breastfed at age 2
(20–23 months)
Afghanistan 1,408 − − 29 x 92 x 54 x 100 28 xAlbania 41 43 39 78 61 31 − 76 yAlgeria 712 50 x 7 x 39 x,y 47 x 22 x − 61 xAndorra − − − − − − − −Angola 803 55 11 x 77 x 89 x 37 x 55 45Antigua and Barbuda − − − − − − − −Argentina 693 − − − 55 28 − −Armenia 47 36 35 48 y 44 23 − 97 xAustralia 307 − − − − − − −Austria 74 − − − − − − −Azerbaijan 184 32 x 12 x 83 x 35 x 16 x − 54 xBahamas 5 − − − − − − −Bahrain 23 − − − − − − −Bangladesh 3,016 36 x 64 71 95 90 94 84 xBarbados 3 − − − − − − −Belarus 107 21 x 9 x 38 x 18 x 4 x − 94 yBelgium 123 − − − − − − −Belize 8 51 x 10 x − − 27 x − −Benin 356 32 43 x 76 y 99 92 98 86Bhutan 15 59 49 67 93 66 − 96 xBolivia (Plurinational State of) 264 64 60 83 85 40 21 89 yBosnia and Herzegovina 32 57 x 18 x 29 x 26 x 10 x − 62 xBotswana 47 40 20 46 y 36 6 75 65Brazil 2,996 43 x 41 y 70 x 50 x 25 x − 96 xBrunei Darussalam 8 − − − − − − −Bulgaria 75 − − − − − − 100 xBurkina Faso 730 20 x 25 61 97 80 87 34 xBurundi 288 − 69 70 y 94 79 83 98 xCambodia 317 65 74 82 y 83 43 92 83 yCameroon 716 20 x 20 63 x,y 79 x 24 − 49 xCanada 388 − − − − − − −Cape Verde 10 73 x 60 x 80 x 77 x 13 x − 75Central African Republic 156 43 34 56 x,y 86 x 32 0 65Chad 511 29 3 46 88 59 − 54Chile 245 − − − − − − −China 16,364 41 28 43 y 37 − − 97 yColombia 910 57 43 86 59 33 − −Comoros 28 25 x 21 x 34 x 65 x 45 x − 82 xCongo 145 39 x 19 x 78 x 82 x 21 x − 82 xCook Islands − − − − − − − −Costa Rica 73 − 15 x 92 67 40 − −Côte d’Ivoire 679 25 x 4 x 51 x 87 x 37 x 100 84 xCroatia 43 − − − − − − −Cuba 110 70 x 49 77 25 17 − 88 xCyprus 13 − − − − − − −Czech Republic 116 − − − − − − −Democratic People’s Republic of Korea 348 18 65 x 31 x 86 36 100 25 yDemocratic Republic of the Congo 2,912 43 37 52 87 53 98 59Denmark 64 − − − − − − −Djibouti 26 67 1 x 35 x 54 x 18 x 95 0 xDominica − − − − − − − −Dominican Republic 216 65 8 88 34 12 − 19 xEcuador 298 − 40 x 77 x 62 x 23 x − −Egypt 1,886 56 53 70 78 35 − 79El Salvador 126 33 31 72 y 73 54 − 62 xEquatorial Guinea 26 − 24 x − − − − 33 xEritrea 193 78 x 52 x 43 x 92 x 62 x 46 68 xEstonia 16 − − − − − − −Ethiopia 2,613 52 52 55 x 96 82 71 15 yFiji 18 57 x 40 x − − − − −Finland 61 − − − − − − −France 792 − − − − − − −Gabon 42 71 x 6 x 62 x 43 x 9 x − 36 xGambia 67 52 34 34 94 31 93 21
Table 3. Infant and young child feeding practices and micronutrient indicators
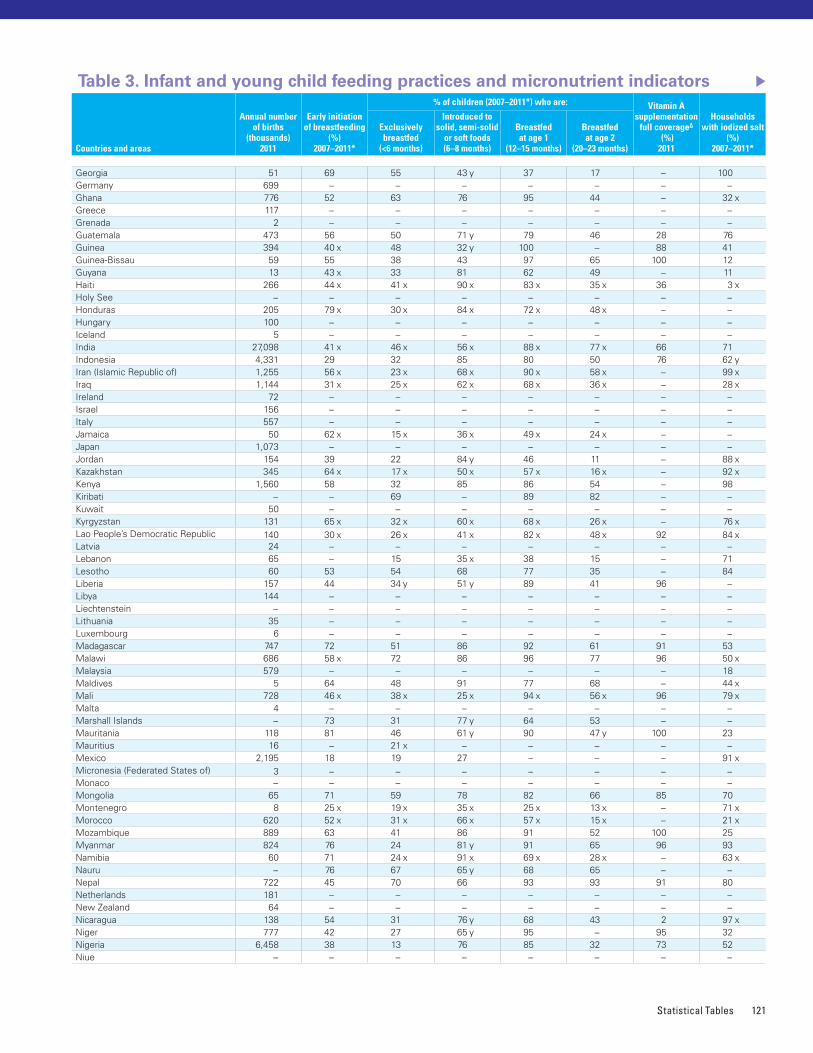
Statistical Tables 121
Georgia 51 69 55 43 y 37 17 − 100Germany 699 − − − − − − −Ghana 776 52 63 76 95 44 − 32 xGreece 117 − − − − − − −Grenada 2 − − − − − − −Guatemala 473 56 50 71 y 79 46 28 76Guinea 394 40 x 48 32 y 100 − 88 41Guinea-Bissau 59 55 38 43 97 65 100 12Guyana 13 43 x 33 81 62 49 − 11Haiti 266 44 x 41 x 90 x 83 x 35 x 36 3 xHoly See − − − − − − − −Honduras 205 79 x 30 x 84 x 72 x 48 x − −Hungary 100 − − − − − − −Iceland 5 − − − − − − −India 27,098 41 x 46 x 56 x 88 x 77 x 66 71Indonesia 4,331 29 32 85 80 50 76 62 yIran (Islamic Republic of) 1,255 56 x 23 x 68 x 90 x 58 x − 99 xIraq 1,144 31 x 25 x 62 x 68 x 36 x − 28 xIreland 72 − − − − − − −Israel 156 − − − − − − −Italy 557 − − − − − − −Jamaica 50 62 x 15 x 36 x 49 x 24 x − −Japan 1,073 − − − − − − −Jordan 154 39 22 84 y 46 11 − 88 xKazakhstan 345 64 x 17 x 50 x 57 x 16 x − 92 xKenya 1,560 58 32 85 86 54 − 98Kiribati − − 69 − 89 82 − −Kuwait 50 − − − − − − −Kyrgyzstan 131 65 x 32 x 60 x 68 x 26 x − 76 xLao People’s Democratic Republic 140 30 x 26 x 41 x 82 x 48 x 92 84 xLatvia 24 − − − − − − −Lebanon 65 − 15 35 x 38 15 − 71Lesotho 60 53 54 68 77 35 − 84Liberia 157 44 34 y 51 y 89 41 96 −Libya 144 − − − − − − −Liechtenstein − − − − − − − −Lithuania 35 − − − − − − −Luxembourg 6 − − − − − − −Madagascar 747 72 51 86 92 61 91 53Malawi 686 58 x 72 86 96 77 96 50 xMalaysia 579 − − − − − − 18Maldives 5 64 48 91 77 68 − 44 xMali 728 46 x 38 x 25 x 94 x 56 x 96 79 xMalta 4 − − − − − − −Marshall Islands − 73 31 77 y 64 53 − −Mauritania 118 81 46 61 y 90 47 y 100 23Mauritius 16 − 21 x − − − − −Mexico 2,195 18 19 27 − − − 91 xMicronesia (Federated States of) 3 − − − − − − −Monaco − − − − − − − −Mongolia 65 71 59 78 82 66 85 70Montenegro 8 25 x 19 x 35 x 25 x 13 x − 71 xMorocco 620 52 x 31 x 66 x 57 x 15 x − 21 xMozambique 889 63 41 86 91 52 100 25Myanmar 824 76 24 81 y 91 65 96 93Namibia 60 71 24 x 91 x 69 x 28 x − 63 xNauru − 76 67 65 y 68 65 − −Nepal 722 45 70 66 93 93 91 80Netherlands 181 − − − − − − −New Zealand 64 − − − − − − −Nicaragua 138 54 31 76 y 68 43 2 97 xNiger 777 42 27 65 y 95 − 95 32Nigeria 6,458 38 13 76 85 32 73 52Niue − − − − − − − −
Countries and areas
Annual number of births
(thousands)2011
Early initiation of breastfeeding
(%)2007–2011*
% of children (2007–2011*) who are: Vitamin A supplementation
full coverageΔ
(%) 2011
Households with iodized salt
(%)2007–2011*
Exclusively breastfed
(<6 months)
Introduced to solid, semi-solid
or soft foods (6–8 months)
Breastfed at age 1
(12–15 months)
Breastfed at age 2
(20–23 months)
Table 3. Infant and young child feeding practices and micronutrient indicators
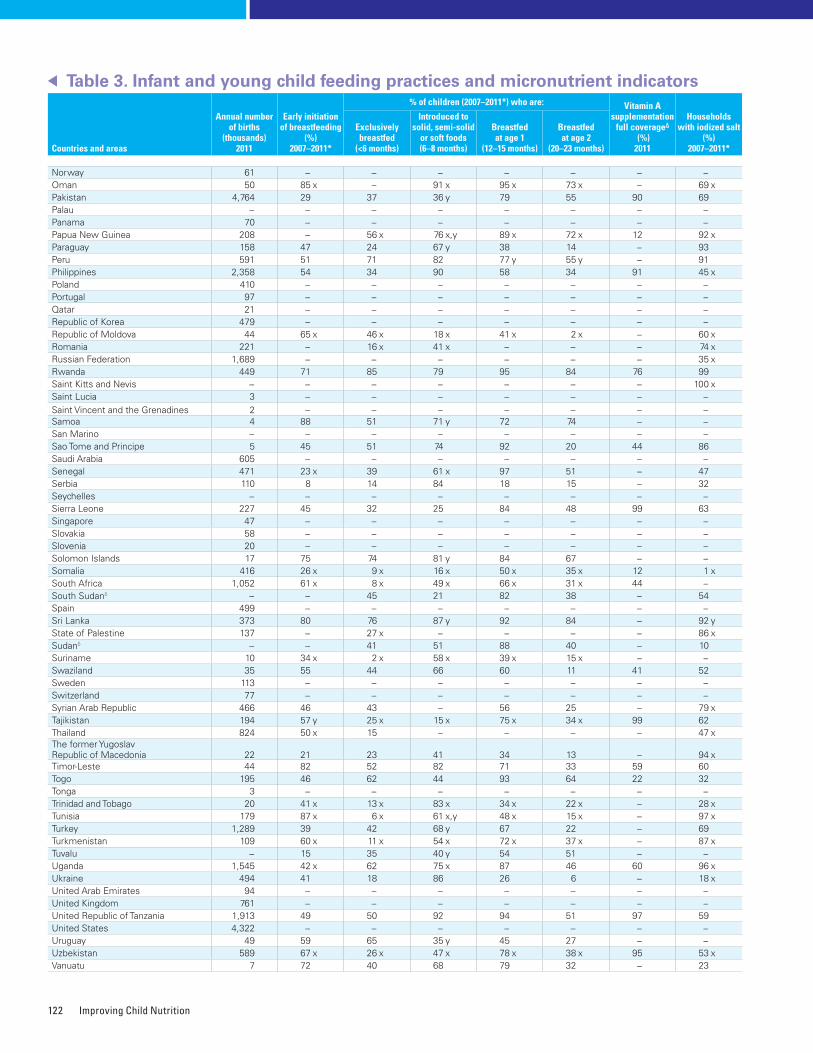
Improving Child Nutrition122
Norway 61 − − − − − − −Oman 50 85 x − 91 x 95 x 73 x − 69 xPakistan 4,764 29 37 36 y 79 55 90 69Palau − − − − − − − −Panama 70 − − − − − − −Papua New Guinea 208 − 56 x 76 x,y 89 x 72 x 12 92 xParaguay 158 47 24 67 y 38 14 − 93Peru 591 51 71 82 77 y 55 y − 91Philippines 2,358 54 34 90 58 34 91 45 xPoland 410 − − − − − − −Portugal 97 − − − − − − −Qatar 21 − − − − − − −Republic of Korea 479 − − − − − − −Republic of Moldova 44 65 x 46 x 18 x 41 x 2 x − 60 xRomania 221 − 16 x 41 x − − − 74 xRussian Federation 1,689 − − − − − − 35 xRwanda 449 71 85 79 95 84 76 99Saint Kitts and Nevis − − − − − − − 100 xSaint Lucia 3 − − − − − − −Saint Vincent and the Grenadines 2 − − − − − − −Samoa 4 88 51 71 y 72 74 − −San Marino − − − − − − − −Sao Tome and Principe 5 45 51 74 92 20 44 86Saudi Arabia 605 − − − − − − −Senegal 471 23 x 39 61 x 97 51 − 47Serbia 110 8 14 84 18 15 − 32Seychelles − − − − − − − −Sierra Leone 227 45 32 25 84 48 99 63Singapore 47 − − − − − − −Slovakia 58 − − − − − − −Slovenia 20 − − − − − − −Solomon Islands 17 75 74 81 y 84 67 − −Somalia 416 26 x 9 x 16 x 50 x 35 x 12 1 xSouth Africa 1,052 61 x 8 x 49 x 66 x 31 x 44 −South Sudanδ − − 45 21 82 38 − 54Spain 499 − − − − − − −Sri Lanka 373 80 76 87 y 92 84 − 92 yState of Palestine 137 − 27 x − − − − 86 xSudanδ − − 41 51 88 40 − 10Suriname 10 34 x 2 x 58 x 39 x 15 x − −Swaziland 35 55 44 66 60 11 41 52Sweden 113 − − − − − − −Switzerland 77 − − − − − − −Syrian Arab Republic 466 46 43 − 56 25 − 79 xTajikistan 194 57 y 25 x 15 x 75 x 34 x 99 62Thailand 824 50 x 15 − − − − 47 xThe former Yugoslav Republic of Macedonia 22 21 23 41 34 13 − 94 xTimor-Leste 44 82 52 82 71 33 59 60Togo 195 46 62 44 93 64 22 32Tonga 3 − − − − − − −Trinidad and Tobago 20 41 x 13 x 83 x 34 x 22 x − 28 xTunisia 179 87 x 6 x 61 x,y 48 x 15 x − 97 xTurkey 1,289 39 42 68 y 67 22 − 69Turkmenistan 109 60 x 11 x 54 x 72 x 37 x − 87 xTuvalu − 15 35 40 y 54 51 − −Uganda 1,545 42 x 62 75 x 87 46 60 96 xUkraine 494 41 18 86 26 6 − 18 xUnited Arab Emirates 94 − − − − − − −United Kingdom 761 − − − − − − −United Republic of Tanzania 1,913 49 50 92 94 51 97 59United States 4,322 − − − − − − −Uruguay 49 59 65 35 y 45 27 − −Uzbekistan 589 67 x 26 x 47 x 78 x 38 x 95 53 xVanuatu 7 72 40 68 79 32 − 23
Countries and areas
Annual number of births
(thousands)2011
Early initiation of breastfeeding
(%)2007–2011*
% of children (2007–2011*) who are: Vitamin A supplementation
full coverageΔ
(%) 2011
Households with iodized salt
(%)2007–2011*
Exclusively breastfed
(<6 months)
Introduced to solid, semi-solid
or soft foods (6–8 months)
Breastfed at age 1
(12–15 months)
Breastfed at age 2
(20–23 months)
Table 3. Infant and young child feeding practices and micronutrient indicators
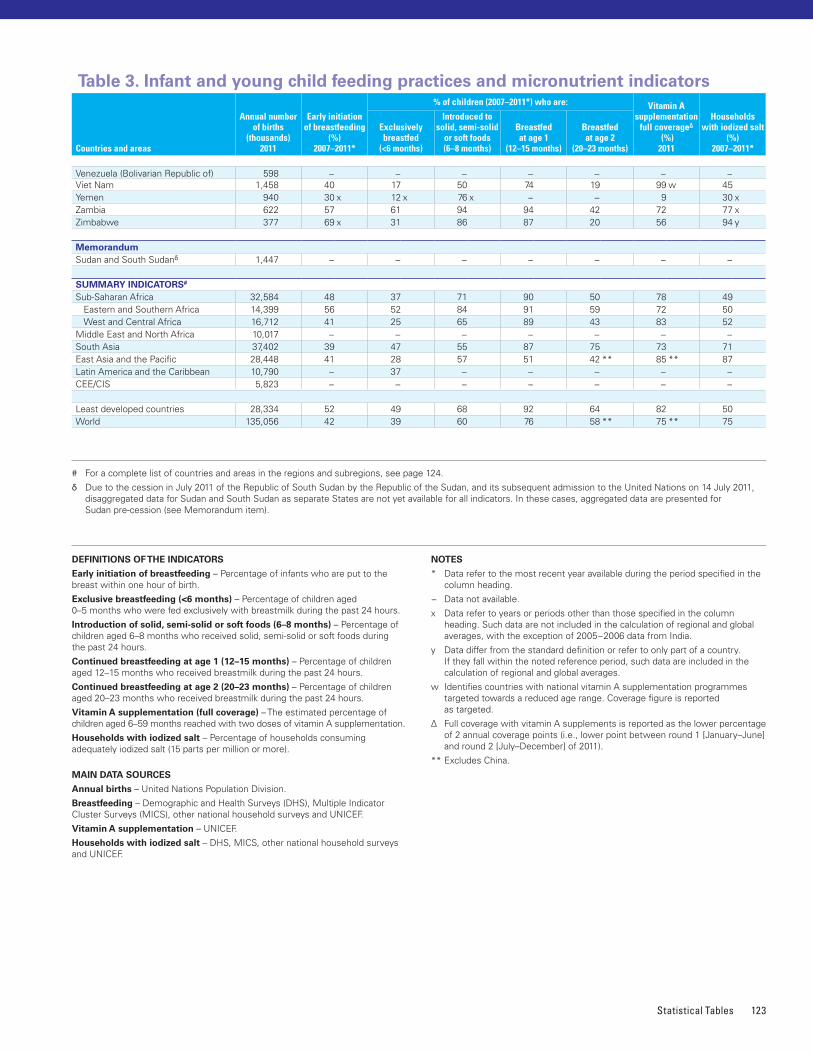
Statistical Tables 123
# For a complete list of countries and areas in the regions and subregions, see page 124�
δ Due to the cession in July 2011 of the Republic of South Sudan by the Republic of the Sudan, and its subsequent admission to the United Nations on 14 July 2011, disaggregated data for Sudan and South Sudan as separate States are not yet available for all indicators� In these cases, aggregated data are presented for Sudan pre-cession (see Memorandum item)�
DEFINITIONS OF THE INDICATORS
Early initiation of breastfeeding – Percentage of infants who are put to the breast within one hour of birth�
Exclusive breastfeeding (<6 months) – Percentage of children aged 0–5 months who were fed exclusively with breastmilk during the past 24 hours�
Introduction of solid, semi-solid or soft foods (6–8 months) – Percentage of children aged 6–8 months who received solid, semi-solid or soft foods during the past 24 hours�
Continued breastfeeding at age 1 (12–15 months) – Percentage of children aged 12–15 months who received breastmilk during the past 24 hours�
Continued breastfeeding at age 2 (20–23 months) – Percentage of children aged 20–23 months who received breastmilk during the past 24 hours�
Vitamin A supplementation (full coverage) – The estimated percentage of children aged 6–59 months reached with two doses of vitamin A supplementation�
Households with iodized salt – Percentage of households consuming adequately iodized salt (15 parts per million or more)�
MAIN DATA SOURCES
Annual births – United Nations Population Division�
Breastfeeding – Demographic and Health Surveys (DHS), Multiple Indicator Cluster Surveys (MICS), other national household surveys and UNICEF�
Vitamin A supplementation – UNICEF�
Households with iodized salt – DHS, MICS, other national household surveys and UNICEF�
NOTES
* Data refer to the most recent year available during the period specified in the column heading�
− Data not available�
x Data refer to years or periods other than those specified in the column heading� Such data are not included in the calculation of regional and global averages, with the exception of 2005−2006 data from India�
y Data differ from the standard definition or refer to only part of a country� If they fall within the noted reference period, such data are included in the calculation of regional and global averages�
w Identifies countries with national vitamin A supplementation programmes targeted towards a reduced age range� Coverage figure is reported as targeted�
Δ Full coverage with vitamin A supplements is reported as the lower percentage of 2 annual coverage points (i�e�, lower point between round 1 [January–June] and round 2 [July–December] of 2011)�
** Excludes China�
Venezuela (Bolivarian Republic of) 598 − − − − − − −Viet Nam 1,458 40 17 50 74 19 99 w 45Yemen 940 30 x 12 x 76 x − − 9 30 xZambia 622 57 61 94 94 42 72 77 xZimbabwe 377 69 x 31 86 87 20 56 94 y
MemorandumSudan and South Sudanδ 1,447 − − − − − − −
SUMMARY INDICATORS#
Sub-Saharan Africa 32,584 48 37 71 90 50 78 49 Eastern and Southern Africa 14,399 56 52 84 91 59 72 50 West and Central Africa 16,712 41 25 65 89 43 83 52Middle East and North Africa 10,017 − − − − − − −South Asia 37,402 39 47 55 87 75 73 71East Asia and the Pacific 28,448 41 28 57 51 42 ** 85 ** 87Latin America and the Caribbean 10,790 − 37 − − − − −CEE/CIS 5,823 − − − − − − −
Least developed countries 28,334 52 49 68 92 64 82 50World 135,056 42 39 60 76 58 ** 75 ** 75
Countries and areas
Annual number of births
(thousands)2011
Early initiation of breastfeeding
(%)2007–2011*
% of children (2007–2011*) who are: Vitamin A supplementation
full coverageΔ
(%) 2011
Households with iodized salt
(%)2007–2011*
Exclusively breastfed
(<6 months)
Introduced to solid, semi-solid
or soft foods (6–8 months)
Breastfed at age 1
(12–15 months)
Breastfed at age 2
(20–23 months)
Table 3. Infant and young child feeding practices and micronutrient indicators
Improving Child Nutrition124
Regional classificationSub-Saharan AfricaEastern and Southern Africa; West and Central Africa; Djibouti; Sudan1
Eastern and Southern AfricaAngola; Botswana; Burundi; Comoros; Eritrea; Ethiopia; Kenya; Lesotho; Madagascar; Malawi; Mauritius; Mozambique; Namibia; Rwanda; Seychelles; Somalia; South Africa; South Sudan;1 Swaziland; Uganda; United Republic of Tanzania; Zambia; Zimbabwe
West and Central AfricaBenin; Burkina Faso; Cameroon; Cape Verde; Central African Republic; Chad; Congo; Côte d’Ivoire; Democratic Republic of the Congo; Equatorial Guinea; Gabon; Gambia; Ghana; Guinea; Guinea-Bissau; Liberia; Mali; Mauritania; Niger; Nigeria; Sao Tome and Principe; Senegal; Sierra Leone; Togo
Middle East and North AfricaAlgeria; Bahrain; Djibouti; Egypt; Iran (Islamic Republic of); Iraq; Jordan; Kuwait; Lebanon; Libya; Morocco; Oman; Qatar; Saudi Arabia; State of Palestine; Sudan;1 Syrian Arab Republic; Tunisia; United Arab Emirates; Yemen
South AsiaAfghanistan; Bangladesh; Bhutan; India; Maldives; Nepal; Pakistan; Sri Lanka
East Asia and the PacificBrunei Darussalam; Cambodia; China; Cook Islands; Democratic People’s Republic of Korea; Fiji; Indonesia; Kiribati; Lao People’s Democratic Republic; Malaysia; Marshall Islands; Micronesia (Federated States of); Mongolia; Myanmar; Nauru; Niue; Palau; Papua New Guinea; Philippines; Republic of Korea; Samoa; Singapore; Solomon Islands; Thailand; Timor-Leste; Tonga; Tuvalu; Vanuatu; Viet Nam
Latin America and the CaribbeanAntigua and Barbuda; Argentina; Bahamas; Barbados; Belize; Bolivia (Plurinational State of); Brazil; Chile; Colombia; Costa Rica; Cuba; Dominica; Dominican Republic; Ecuador; El Salvador; Grenada; Guatemala; Guyana; Haiti; Honduras; Jamaica; Mexico; Nicaragua; Panama; Paraguay; Peru; Saint Kitts and Nevis; Saint Lucia; Saint Vincent and the Grenadines; Suriname; Trinidad and Tobago; Uruguay; Venezuela (Bolivarian Republic of)
Central and Eastern Europe and the Commonwealth of Independent States (CEE/CIS)Albania; Armenia; Azerbaijan; Belarus; Bosnia and Herzegovina; Bulgaria; Croatia; Georgia; Kazakhstan; Kyrgyzstan; Montenegro; Republic of Moldova; Romania; Russian Federation; Serbia; Tajikistan; the former Yugoslav Republic of Macedonia; Turkey; Turkmenistan; Ukraine; Uzbekistan
Least developed countries/areasClassified as such by the United Nations High Representative for the Least Developed Countries, Landlocked Developing Countries and Small Island Developing States (UN-OHRLLS). Afghanistan; Angola; Bangladesh; Benin; Bhutan; Burkina Faso; Burundi; Cambodia; Central African Republic; Chad; Comoros; Democratic Republic of the Congo; Djibouti; Equatorial Guinea; Eritrea; Ethiopia; Gambia; Guinea; Guinea-Bissau; Haiti; Kiribati; Lao People’s Democratic Republic; Lesotho; Liberia; Madagascar; Malawi; Mali; Mauritania; Mozambique; Myanmar; Nepal; Niger; Rwanda; Samoa; Sao Tome and Principe; Senegal; Sierra Leone; Solomon Islands; Somalia; South Sudan;1 Sudan;1 Timor-Leste; Togo; Tuvalu; Uganda; United Republic of Tanzania; Vanuatu; Yemen; Zambia
General note on the dataThe data presented in this report are derived from UNICEF global databases, which include only internationally comparable and statistically sound data. In addition, data from the responsible United Nations organization have been used wherever possible. In the absence of such internationally standardized estimates, the profiles draw on other sources, particularly data drawn from nationally representative household surveys such as Multiple Indicator Cluster Surveys (MICS) and Demographic and Health Surveys (DHS). Data presented reflect the latest available estimates as of late 2012. More detailed information on methodology and the data sources is available at <www.childinfo.org>.
Data cannot be compared across consecutive reports: Some of the data presented in this report are subject to evolving methodologies and revisions of time series data. For other indicators, comparable data are unavailable from one year to the next. It is therefore not advisable to compare data from consecutive reports.
1 Due to the cession in July 2011 of the Republic of South Sudan by the Republic of the Sudan, and its subsequent admission to the United Nations on 14 July 2011, disaggregated data for the Sudan and South Sudan as separate States are not yet available for all indicators� Aggregated data presented are for the Sudan pre-cession, and these data are included in the averages for the Middle East and North Africa, and sub-Saharan Africa regions as well as the least developed countries/areas category� For the purposes of this report, South Sudan is designated as a least developed country�

Scan this QR code to see the online version or go to
www.unicef.org/publications/index.html© United Nations Children’s Fund (UNICEF)April 2013
United Nations Children’s Fund3 United Nations PlazaNew York, NY 10017, USA
Email: [email protected] <http://www.unicef.org>
US$25.00ISBN: 978-92-806-4686-3eISBN: 978-92-806-4689-4United Nations publication sales no.: E.13.XX.4