improving conflict early warning systems for united ... programs... · early warning system are its...
TRANSCRIPT
08Fall
Improving Conflict Early Warning Systems for United Nations Peacekeeping
Christy Lazicky Second Year Policy Analysis
March 2017
Advisor: Professor Ryan Sheely Section Leader: Professor Rema Hanna
Written in fulfillment of the requirements for the degree of Master in Public Administration in International Development, John F. Kennedy School of Government, Harvard University.
Photo Credit: http://www.un.org/en/peacekeeping/operations

Table of Contents Executive Summary .......................................................................................................................1 Introduction ....................................................................................................................................2 The UN’s Status Quo System ........................................................................................................4 Methodology ...................................................................................................................................6
Case Countries ...........................................................................................................................................7 Data ............................................................................................................................................................8 Machine Learning Models .......................................................................................................................12 Spatial Analysis Models ..........................................................................................................................13 Assessment of Model Performance .........................................................................................................14
Effectiveness of the Three Systems .............................................................................................15 Assessment of Machine Learning & Spatial Models ..............................................................................15 Assessment of the Status Quo System .....................................................................................................19
Political Supportability ................................................................................................................22 Administrative Feasibility ...........................................................................................................26 Policy Recommendations & Implementation Plan ...................................................................29
Technical Implementation .......................................................................................................................32 Administrative Capacity Building ...........................................................................................................34 Political Stakeholder Sequencing ............................................................................................................36
Conclusion ....................................................................................................................................37 Appendices ....................................................................................................................................39
References ................................................................................................................................................39 Appendix A: Background Information on the Three Conflicts ...............................................................43 Appendix B: Conflict Severity Class Derivation .....................................................................................46 Appendix C: Explanatory Variable Literature Review ...........................................................................47 Appendix D: Model Specifications .........................................................................................................53 Appendix E: Additional Tables on Model Results ..................................................................................57
1
Executive Summary Out of several hundreds of thousands recorded conflict events in Africa in the last two decades,
40% were attacks specifically targeted at unarmed civilians. The United Nations, responsible for
deploying peacekeeping missions to protect civilians in conflict areas, is deeply invested in this
problem. However, the UN has cited that the lack of robust conflict early warning systems is a
constraint to effectively protecting civilians. Specifically, the weaknesses in the UN’s current
early warning system are its subjective and unsystematic nature and its inability to make conflict
predictions across the entire country.
This policy analysis explores alternative data-driven conflict early warning systems that can
address the weaknesses in the status quo system. I examine models that utilize machine learning
techniques and a forecasting model that employs spatial analysis. I assess these models’
performances by examining how well they predict violence against civilians events within three
case countries in Africa that currently host UN peacekeeping missions. Additionally, I examine
the political supportability and administrative feasibility of a new data-driven system in
comparison with the status quo system.
The analysis shows that the machine learning models have the potential to add considerable
value to the UN’s status quo system. In the best cases, machine learning models predict conflict
outbreak at an accuracy rate of 90%. Furthermore, there is support for data-driven early warning
within UN mission headquarters if a new system is user-friendly and can reduce administrative
strain within the mission. A new data-driven system using machine learning models would
require additional analytical capacity, but the data collection and processing capabilities are
already in place within UN peacekeeping missions.
I therefore propose: (1) the UN incorporate a hybrid of the lasso and logistic models in their
conflict forecasting; (2) keep the community-alert-network component of the status quo system
to add context to lasso/logistic model predictions; (3) program the models into a user-friendly
dashboard, and (4) pilot the new system first with more mature peacekeeping missions to address
the peacekeeping capacity drain.

2
I. Introduction Violence against civilians has been a
persistent and destructive trend in Africa. Out
of several hundreds of thousands recorded
conflict events on the continent in the last two
decades, approximately 40% of those have
been specifically targeted at unarmed civilians
(see Figure 1)1. In 2015 alone, there were
12,460 reported civilian deaths in Africa, but
the true figure is likely much higher given that
conflict in remote areas often goes unreported.
These types of events have negative impacts
on local development and well-being. In addition to killing civilians, armed groups employ
brutal physically and sexually violent tactics to torture and humiliate opponents, terrify
individuals, and destroy societies. The aims of these attacks are usually to incite flight from a
territory or reaffirm aggression and brutality through domination2.
The United Nations is deeply committed to protecting civilians in conflict. The UN Security
Council is entrusted with the responsibility of maintaining international peace and security and
deploys peacekeeping missions to countries in conflict for this purpose. According to the
mandates of the Security Council, civilian protection is the most important objective of the vast
majority of UN peacekeeping missions. Peacekeeping operations are required under the
Protection of Civilians (POC) mandate to protect civilians, particularly those under imminent
threat of physical violence. This mandate underscores the importance of proactive peacekeeping;
missions should not be deploying resources only in reaction to an attack. Department of
Peacekeeping Operations (DPKO) policy stipulates: “activities to protect civilians should be
planned, deliberate and on-going, and the mission should constantly work to prevent, pre-empt
and respond to violence against civilians. This includes presence in areas under greatest threat, a
1 “Trend 3: Violence Against Civilians in 2015.” ACLED (2015). 2 Ibid.
Figure 1: 40% of conflict events in Africa are attacks that are directed at civilians. Source: http://www.acleddata.com/rates-of-violence-in-2015/

3
credible deterrent posture and other activities in accordance with the mandate…3” One critical
component of a proactive peacekeeping strategy is an early warning system – a process for
monitoring and assessing conflict risk with the aim to anticipate and prevent violence before it
occurs (or at the very least mitigate its impact on civilians).
However, the UN has cited that their ability to effectively protect civilians is hindered by a lack
of robust conflict early warning systems. In 2009, an UN-commissioned evaluation of
peacekeeping operations highlighted this gap:
The United Nations has recognized the need for better information and intelligence,
specifically in relation to the protection of civilians, yet various and inconsistent models
exist in the field ... most missions do not have sufficient capacity to collect and analyze
the information needed to address day-to-day threats nor to predict potential crises that
could lead to rapid escalations of violence4.
UN peacekeeping missions use conflict risk mapping to determine their resource allocation and
where to deploy peacekeepers. Therefore both effective operational planning and crisis response
hinge on an accurate early warning system.
The UN’s current early warning system consists of various buckets of conflict monitoring and
analysis activities, and it is neither systematized nor robust. Despite the importance of the issue,
there is little clarity within the UN peacekeeping world of what an early warning system actually
looks like5. The UN mission headquarters has multiple streams of information flowing in each
day on incidences of violence from each of its various departments that it must sort through in
order to assess which areas are most at risk. The vast amount of information is overwhelming
and without a systematic way to analyze it, many reports often fall through the cracks6.
This policy analysis will explore the potential for two alternative early warning systems: a
conflict forecasting model that utilizes machine learning techniques and a forecasting model that
employs spatial analysis. To determine whether either of these alternative systems is feasible, the
3 United Nations Department of Peacekeeping Operations / Department of Field Support (2015). 4 Holt & Taylor (2009). 5 Mamiya & Willmot (2013).6 Conversation with R. Camp, MONUSCO, October 2016.

4
analysis will examine the effectiveness of both models at predicting conflict intensity as
compared to the UN’s current system. Furthermore, to assess whether the UN’s political
landscape and administrative capabilities are conducive to either of these new systems, I perform
a stakeholder analysis of the relevant actors within the UN peacekeeping context.
The analysis finds that an early warning system that utilizes machine learning models,
specifically the lasso and logistic models, can add significant value to the UN’s current system
with their ability to predict both conflict occurrence and severity across the entire country. In the
best cases, machine learning models predict conflict outbreak at an accuracy rate of 90%.
Furthermore, it finds the UN has both the supporting political coalition for a new data-driven
system if it is easy to understand and does not add administrative strain on UN peacekeeping
staff. Finally, it concludes that UN peacekeeping missions already have the data collection and
processing capacities in place but would need to enhance its analytical capacity to implement a
new data-driven system.
I recommend that the UN incorporates machine learning models into its existing early warning
system. The lasso model performs best in all cases on predicting conflict occurrence. If
predicting conflict severity is more important, the UN can make use of both the lasso and logistic
models. Finally, if the UN mission is located within a country with poor data availability, it
should consider using a spatial model to make predictions. This new data-driven method can be
implemented in addition to the UN’s status quo system, as there is considerable value in
information gathered through local communication channels. For example, the UN can use the
machine learning models to make predictions across the entire country and use local
communication to corroborate those predictions or to understand the context driving conflict
outbreak in different areas. To ease administrative strain, the data-driven system can be easily
nested within the status quo early warning system, making use of the current data collection
capacities and existing relationships with NGOs. The UN should also consider implementing any
new system incrementally, piloting first with missions that have more capacity.
The policy analysis is structured as follows: Section II provides an overview of the UN’s current
early warning system. Section III motivates the methodology for the selection of the two
5
alternative early warning systems. Section IV evaluates the prediction accuracy of the two
models in comparison with the status quo system. Section V discusses the political supportability
of each policy option and Section VI reviews their administrative feasibility. Finally, Section VII
concludes with a policy proposal and recommendations for implementation.
II. The UN’s Status Quo System
One of the systems that the UN has set up to monitor
conflict levels is its network of Community Liaison
Assistants (CLAs), locals that the UN recruits to serve as
its bridge to the local communities. CLAs collect
information on security threats and alert peacekeepers to
enable quick responses. The CLAs also help communities
establish Community Alert Networks (CANs). This
initiative involves outfitting a designated community
member with a mobile phone or radio so that he can warn
peacekeepers of imminent threats. While CLAs have been
invaluable in overcoming language and cultural barriers,
there are significant limitations to this system. CLAs for
the most part do not have the analytic capabilities needed
to weed out relevant information. There also is a tendency
to use emotional language that may depict events inaccurately, for �example “Three people
killed” can become three people ‘slaughtered’ or even a ‘massacre’7. As the success of this
system hinges on radios and mobile phones, poor infrastructure and network coverage in remote
areas limits the effectiveness of the CANs. However, the CLA’s most salient drawback is that it
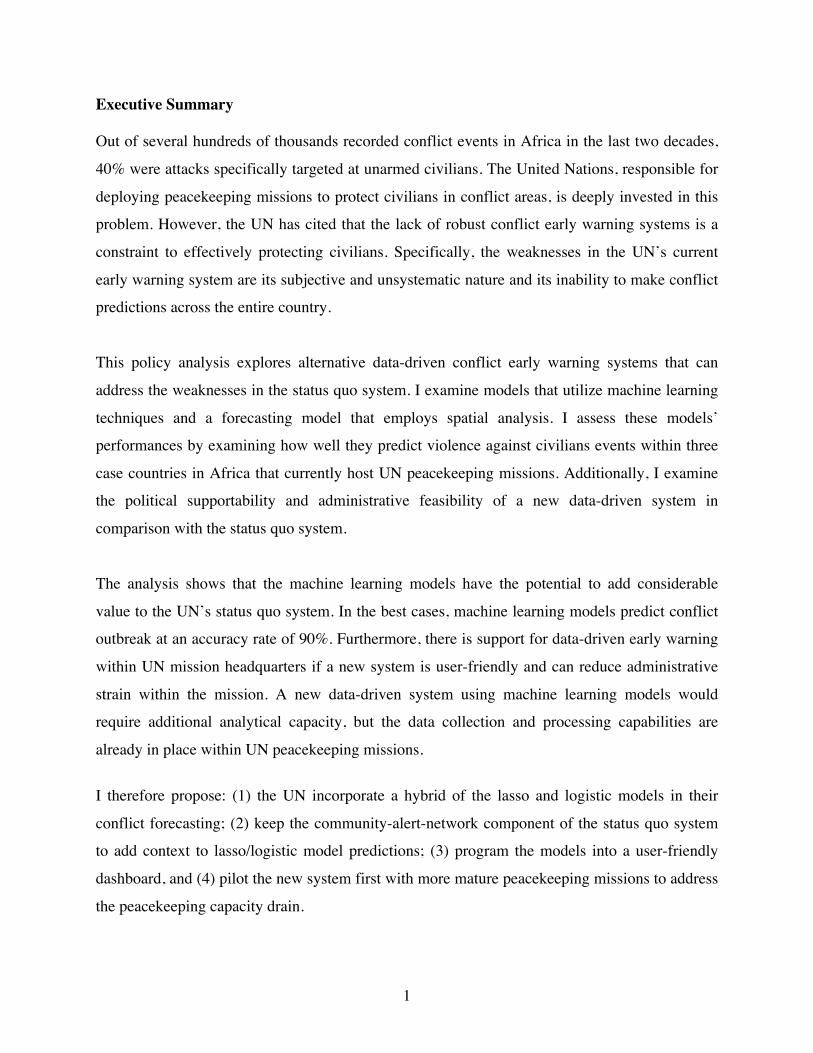
can only protect nearby communities and only from imminent threats. The largest UN
peacekeeping mission in the world in the Democratic Republic of Congo, MONUSCO, manages
just 202 CLAs across 70 different locations (see Figure 2); any community not included in this
group is not protected. Moreover, CANs have historically been reactive: “the majority of CANs
alerts is received after the incidents have taken place and perpetrators have fled (65% in 2013)8.”
7 MONUSCO Civil Affairs Section – Ops East (2014). 8 Ibid.
Figure 2: CLA deployment only covers small fraction of DRC Source: “CLA Best Practice Review.” MONUSCO Civil Affairs Section – Ops East. August 1, 2014.
6
This trend combined with the fact that many CANs communities are beyond a reasonable
reaction radius leaves peacekeeping forces with insufficient time to mobilize resources and
intervene. Human rights organizations have been highly critical of this limitation:
The world’s second largest peacekeeping mission is failing to protect civilians and
angering Congolese people on the ground. Because MONUSCO takes days to deploy to
villages that have been attacked, people are left vulnerable, and massacres such as the
May 13 killing of 37 people in Kamananga are the result9.
In order to process and analyze this barrage of information, UN missions rely on their Joint
Mission Analysis Centre (JMAC) and Joint Operations Centre (JOC). These hubs work to
translate the multitude of incident reports into actionable recommendations for peacekeeping
forces. As JMAC and JOC only have access to data on incidence of conflict, levels of impending
conflict risk are primarily determined by current levels of conflict. Moreover, there is no
systematic method for deducing conflict risk levels; a series of reports are reviewed and statuses
– usually green, yellow, red - are chosen rather haphazardly10.
III. Methodology There is a growing literature on attempts to model and predict conflict. Traditionally, authors
have used different measures of state capacity and vulnerability to build econometric models
with the aim of understanding their causal link to conflict. Recently, however, there has been a
shift to employing more machine learning techniques to enhance prediction11,12,13. This literature
9 Enough Project (2012). 10 Conversation with S. Rendtorff-Smith, Department of Peacekeeping Operations, United Nations, Nov. 2016.11 Ulfelder (2013). 12 Gleditsch & Ward (2013).
Box 1: Example Indicators currently used by UN for Early Warning • Number of security incidents affecting civilian populations • Number of civilians in areas affected by conflict, including the forcibly displaced • Number and type of violations to the physical integrity of civilians (number of killed,
wounded, raped, abducted, tortured, etc.) • Number of incidents of violence on civilians involving peacekeepers, including sexual
exploitation and abuse, harm caused by military or police operations and the use of force, etc. • Number of incidents of violence involving mines, ERW and remnant IEDs.
Source: The Protection of Civilians in United Nations Peacekeeping. United Nations Department of Peacekeeping Operations / Department of Field Support. Ref. 2015.07. April 2015.

7
has been finding that machine learning techniques, such as random forests, have much more
predictive power than classical regression models14. To date, the bulk of conflict prediction
literature has focused on forecasting conflict at a cross-national level (i.e. predicting which
countries are at risk). However, for peacekeeping missions that work within a specific country
and need to determine how to allocate resources within that country, conflict prediction at a
subnational level is of much more value. Therefore, the models I will use will predict conflict at
a subnational level.
The first early warning system will harness the predictive power of machine learning models for
predicting conflict. The second early warning system will utilize spatial analysis to make
forecasts of conflict risk. All spatial analytic techniques are underpinned by the assumption that
areas that are closer together are more similar than areas that are further apart. This analysis is
appropriate for analyzing conflict, as conflict has a strong spatial component – areas close to
violent areas are more likely to be violent. Moreover, indicators such as demographic or land
attributes are not spatially uniform; attributes such as land cover and population tend to cluster
together. The literature that applies spatial analysis to predict conflict is also quite small. The few
studies that utilize spatial models have encouragingly found strong spatial dimensions to conflict
outbreak and that spatial models outperform standard regression models15. Therefore, I will
consider a spatial predictive model as a possible early warning system.
Case Countries For the purpose of this policy analysis, I will be focusing on three case countries – the
Democratic Republic of Congo (DRC), the Central African Republic (CAR), and Somalia. Each
of these countries has been especially violent in the last several years and each is hosting a UN
mission. I chose to look at multiple cases to make better recommendations for the UN as each
peacekeeping mission’s culture and capacity is highly specific to the context they are working
in16. Therefore, I strategically chose peacekeeping missions of varying levels of maturity as well
as conflicts that are being driven by different dominant factors.
13 Perry (2013). 14 Muchlinski et al. (2016). 15 Weidmann & Ward (2010).16 Conversation with expert on Central African Republic peacekeeping, Jan. 2017.

8
MONUSCO, the most mature mission of the three, has been in the DRC since 2010. MONUSCO
evolved out of the original UN mission, MONUC, which launched following the Lusaka
Ceasefire Agreement signed in 199917. The DRC has been gripped by mass violence following
the 1994 Rwandan genocide when millions of Rwandan refugees and former genocidaires
flooded into Eastern Congo. In the past two years, there has been a surge in human rights
violations and violent crackdowns in response to opposition against President Joseph Kabila’s
efforts to extend his stay in power stay in power beyond the end of his constitutionally mandated
two-term limit on December 19, 201618. The violence against civilians that these models will
seek to predict have for the most part been driven by these violent crackdowns as well as non-
state rural militias mobilizing their areas in hopes to regain control during the elections19.
The Central African Republic has been roiled in civil war incited by multiple fighting political
factions for many decades. The most recent war has been ongoing since late December 2012
after the Séléka rebel coalition toppled the current president. The violence, often directed at
civilians, has killed thousands and displaced millions of people. The Security Council launched
the MINUSCA peacekeeping mission in 2014, with a mandate focusing on the protection of
civilians and delivery of humanitarian assistance20.
While the UN has deployed several peacekeeping missions to Somalia in the past, the current
mission, UNSOM, does not have a military peacekeeping component. UNSOM provides policy
advice to both the Somalia Federal Government and the African Union Mission in Somalia on
peace-building and capacity building within areas such as governance, security sector reform,
and justice institutions21. Therefore, while the UN mission is not directly responsible for
protection of civilians, it can advise the Somalia Federal Government and the African Union
Mission in Somalia on how to do so. The recent violence in Somalia has been primarily driven
by the Islamist armed group Al-Shabaab. “Al-Shabaab commits abuses in areas it controls while
17 "MONUSCO Background." United Nations Organization Stabilization Mission in the Democratic Republic of the Congo. 18 Sawyer (2017). 19 Conversation with expert on the Democratic Republic of Congo, Sep. 2016. 20 "MINUSCA Background." United Nations Multidimensional Integrated Stabilization Mission in the Central African Republic (MINUSCA).21 "Mandate." UNSOM | UNITED NATIONS ASSISTANCE MISSION IN SOMALIA.

9
targeting civilians in deadly attacks in government-controlled areas such as Mogadishu22.” For a
more detailed history of the three conflicts, see Appendix A.
Box 2: Snapshot of Three UN Missions
MONUSCO Country: Democratic Republic of Congo Mission start date: July 2010 Number of personnel: 22,016 Dominant conflict driver in recent years: Elections
MINUSCA
Country: Central African Republic Mission start date: April 2014 Number of personnel: 12,870 Dominant conflict driver in recent years: Warring political factions
UNSOM
Country: Somalia Mission start date: June 2013 Number of personnel: 1,800 Dominant conflict driver in recent years: Terrorist group
Data Unit of analysis. As the models will be predicting which areas within a country are at risk for
conflict, the level of analysis should be a geographic unit within the country. The level of
analysis chosen for these models is the PRIO-GRID cell. The PRIO-GRID dataset is a spatial
grid network covering all terrestrial areas of the world that was designed to standardize and
streamline the manipulation and analysis of high-resolution spatial data23. Each individual cell
measures roughly 50 x 50 kilometers. As such, every country is comprised of several hundreds
of these grid cells. For the purpose of this policy analysis, the grid cells of the three case
countries were selected. The number of cells that correspond to each country are listed in Table 1
below. Finally, a discussion on how these grid cells can be used operationally will be discussed
in Section VII.
22 "Somalia." Human Rights Watch 23 Tollefsen et al. (2012).
10
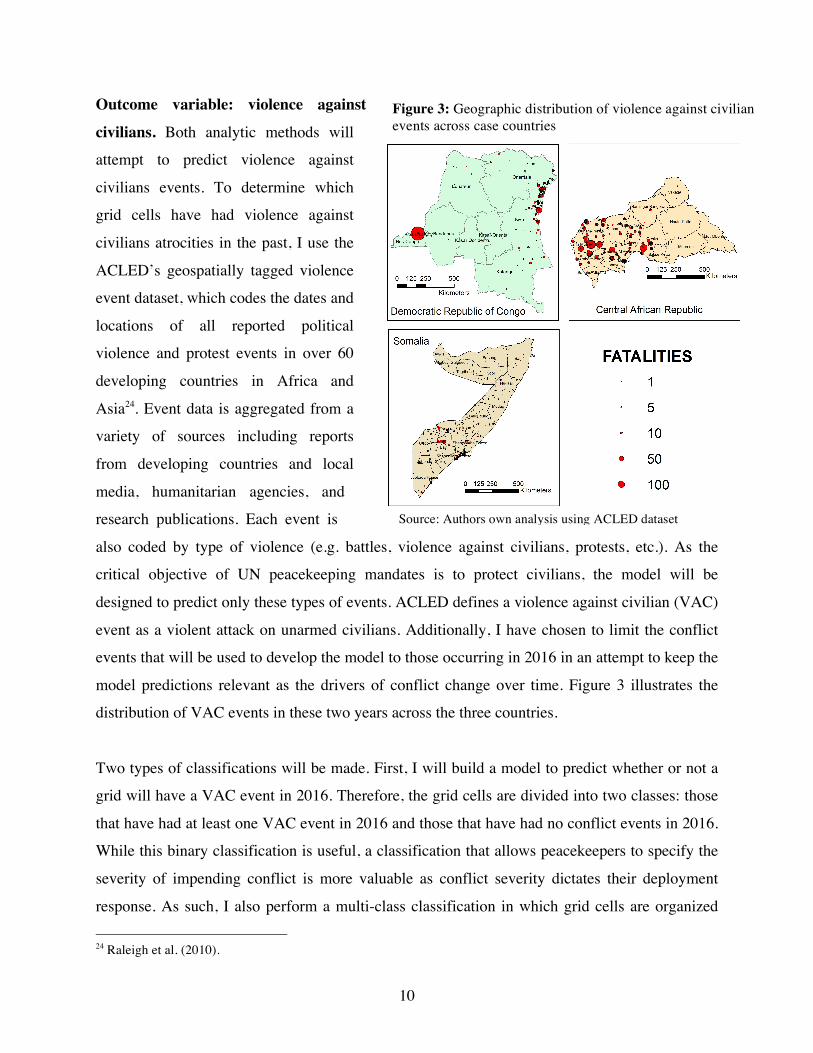
Outcome variable: violence against
civilians. Both analytic methods will
attempt to predict violence against
civilians events. To determine which
grid cells have had violence against
civilians atrocities in the past, I use the
ACLED’s geospatially tagged violence
event dataset, which codes the dates and
locations of all reported political
violence and protest events in over 60
developing countries in Africa and
Asia24. Event data is aggregated from a
variety of sources including reports
from developing countries and local
media, humanitarian agencies, and
research publications. Each event is
also coded by type of violence (e.g. battles, violence against civilians, protests, etc.). As the
critical objective of UN peacekeeping mandates is to protect civilians, the model will be
designed to predict only these types of events. ACLED defines a violence against civilian (VAC)
event as a violent attack on unarmed civilians. Additionally, I have chosen to limit the conflict
events that will be used to develop the model to those occurring in 2016 in an attempt to keep the
model predictions relevant as the drivers of conflict change over time. Figure 3 illustrates the
distribution of VAC events in these two years across the three countries.
Two types of classifications will be made. First, I will build a model to predict whether or not a
grid will have a VAC event in 2016. Therefore, the grid cells are divided into two classes: those
that have had at least one VAC event in 2016 and those that have had no conflict events in 2016.
While this binary classification is useful, a classification that allows peacekeepers to specify the
severity of impending conflict is more valuable as conflict severity dictates their deployment
response. As such, I also perform a multi-class classification in which grid cells are organized 24 Raleigh et al. (2010).
Figure 3: Geographic distribution of violence against civilian events across case countries
Source: Authors own analysis using ACLED dataset
11
into classes defined by conflict risk. Measures of conflict severity were determined by examining
both the number of conflict events that took place in each grid cell as well as the number of
fatalities that occurred across all those conflict events. Both fatalities and number of conflict
events are incorporated into a measure of conflict severity because peacekeeping missions are
concerned about both of these indicators of violence, and the two are not necessarily related. For
example, one area may have suffered many fatalities on the account of a single brutal massacre,
while other areas may have had only a few causalities (though possibly many injuries) but
numerous attacks on civilians. Both of these types of scenarios encapsulate a measure of conflict
severity so should both be accounted for. To determine each grid cell’s level of severity, I
created an index that incorporates both the number of conflict events and number of fatalities
that occurred in that cell, attaching equal weight to both indicator (see Appendix B for more
detailed explanation on the construction of the index and class assignment). The index value was
used to classify grid cells into one of three groups: low risk, moderate risk, or high risk. As the
majority of grid cells had no conflict events, these cells formed the low conflict risk group.
Those cells in the moderate risk group can be interpreted as having conflict severity that is below
average considering all the events of 2016. Finally, those in the high risk group experienced
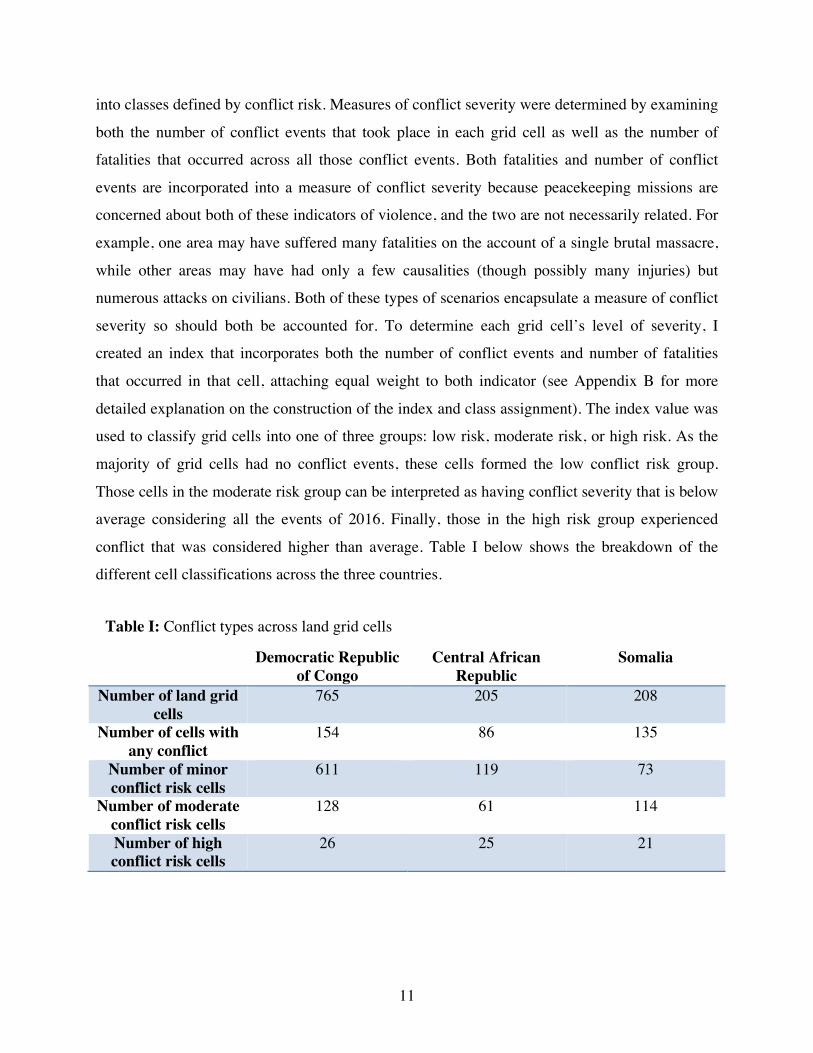
conflict that was considered higher than average. Table I below shows the breakdown of the
different cell classifications across the three countries.
Democratic Republic of Congo
Central African Republic
Somalia
Number of land grid cells
765 205 208
Number of cells with any conflict
154 86 135
Number of minor conflict risk cells
611 119 73
Number of moderate conflict risk cells
128 61 114
Number of high conflict risk cells
26 25 21
Table I: Conflict types across land grid cells

12
Explanatory variables. I will use a host of geographic and socioeconomic features about the
land grid cells to predict conflict. Table II provides an overview of these variables and their
descriptions. Appendix C discusses the literature motivating the explanatory variable selection.
Variable Description Neighboring conflict events The total number of conflict events occurring in
adjacent land cells Neighboring conflict fatalities The total number of fatalities occurring in adjacent
land cells Income per capita Regional equivalent of gross domestic product at a 50
x 50 kilometer resolution. Nightlight activity Average light emission at night within a given grid
cell Number of ethnic groups Number of politically relevant ethnic groups living
within cell Population Population within cell Proportion of male youth Ratio between 15–29 year old males and males of 30
years and above within cell Migration Number of people that have flowed through each grid
cell between 2010-2015 Infant mortality Rate of infant (one year or younger) mortality Employment Male and female employment rates Education Primary school attendance rates for boys and girls Food insecurity Classified as None/Minimal, Stressed, Crisis,
Emergency, Humanitarian Catastrophe/Famine Distance to precious commodities Distance to nearest diamond deposit and distance to
nearest mineral deposit Distance from state power Distance to international border, distance to capital,
and distance to nearest urban center Terrain type Type of land-cover, precipitation, and elevation
As discussed, I will be assessing a series of conflict prediction models. I will use three machine
learning models that attempt to model the probability that a land grid cell has a conflict event
using geographic and socioeconomic features about the area. I will also explore a model that
employs spatial analysis. While spatial analysis models also attempt to model the probability of
conflict, their defining feature is that they take into account the grid cell’s surrounding location
when making predictions.
Table II: Explanatory variables
13
Machine Learning Models
I will assess the following three machine learning models:
• Logistic regression model - Logistic regression models the probability that a grid cell
belongs to a particular class (e.g. conflict or no conflict; minor, moderate, or severe
conflict). It has the benefit that it is the most widely known outside of machine learning
circles, but it also will not work well in the condition where episodes of conflict are
sparse and there are lots of indicators being used to make a prediction.
• Lasso model - The lasso model is effectively a logistic model that includes a term to
penalize the number of variables in the model; as such it favors simple models with fewer
variables. The Lasso is very useful for trimming complex models to only a handful of
features without compromising too much on model performance25.
• Random forest - Random forests are collections of decision trees. Each decision tree will
sort the grid cells into groups or ‘leaves’ and makes the same prediction for all grid cells
in a leaf. While random forest models have been shown to have superior predictive
performance, they lack in interpretability, which is a significant drawback if
peacekeeping missions want to understand the underpinnings of the model26.
Each model was developed using approximately 70% of the grid cells for each country. The
remaining 30% of the data was omitted from the initial model development but later run through
the models to determine the final prediction scores. This out-of-sample prediction is important
for mimicking how we should expect the model to perform in the future, as any model will need
to make predictions on data that was not used to develop it. A more detailed explanation on the
models’ specifications can be found in Appendix D.
Spatial Analysis Models
I will also be employing a spatial analytic technique to create conflict forecasting models. The
models were created using the software ArcMap 10.4. The spatial analysis models will be
created using:
25 Tibshirani (1996). 26 Hastie et al. (2009).

14
• Geographically weighted regression (GWR) – The geographically weighted regression
tool creates standard statistical regressions that vary across space. In this example, each
grid cell will have its own prediction model, which allows for the various indicators to
have different levels of predictive power across the country. This flexibility
accommodates the spatial variation of conflict and the predictors across the country,
frequently improving model accuracy27.
The technical advantages and drawbacks of the proposed models are summarized in Table III:
Model Type Methodology Technical Advantages Technical Drawbacks
Logistic • Models the probability that a grid cell belongs to a particular class.
• Most widely known / understood of the proposed models.
• Not able to make specific predictions about conflict severity well.
Lasso • A logistic model that includes a term to penalize the number of variables in the model.
• Can predict conflict with much less data without compromising on prediction accuracy.
• Not able to make specific predictions about conflict severity well.
Random Forest • A collection of decision trees that sort the grid cells into groups or ‘leaves’ and makes the same prediction for all grid cells in a leaf.
• Historically superior predictive power.
• Not able to make specific predictions about conflict severity well.
• Model not easily interpretable.
Geographically Weighted Regression
• Generates a regression model for each grid cell, allowing predictor variables to have varying impact over the country.
• Accommodates the spatial variation of conflict and the predictors, usually improving model performance.
• Cannot perform classification well (gives predicted probabilities outside of 0 and 1).
• Can only use quantitative predictors.
• Variables that are even slightly spatially correlated will cause the model to fail so can only use a handful of predictors.
• Variable selection process is time-consuming and not straightforward.
27 Fotheringham et al. (1998).
Table III: Technical Advantages & Drawbacks of each Conflict Forecasting Model

15
Assessment of Model Performance
I will assess the models’ predictive performance using several measures. I will first examine the
model’s overall accuracy or the percentage of grid cells correctly classified. I will also look at
accuracy on only conflict cells and accuracy on only peaceful cells.
Other important measures of performance are the models’ sensitivity and specificity 28 .
Sensitivity tells us when a conflict cell is run through the model, how likely is it that it will be
classified with a conflict warning. Specificity is a measure of how likely the model will correctly
say that an area is not at risk of conflict. In the case of the UN forecasting conflict, the sensitivity
measure (how likely will conflict cells be correctly classified) is of more importance as the costs
of failing to predict where conflict will break out are steeper than failing to predict where there
will be no violence as civilian lives will most likely be lost if the UN fails deploy its troops to
conflict areas.
In any predictive analysis, there is an inherent trade-off between a model’s sensitivity and
specificity. This trade-off is determined by the threshold above which a predicted event is
expected to occur. In the accuracy results presented below, any cell that had above a 50%
predicted probability of conflict occurring was classified as a conflict cell. However, this
threshold can be adjusted, which will improve either the sensitivity or the specificity at the
expense of the other. The Receiver Operating Characteristic (ROC) curve illustrates this trade-
off across the entire range of possible thresholds29. The diagonal line represents what the curve
would look like if the conflict prediction model was no better than flipping a coin. The more
accurate the model, the more the ROC curve will bulge into the top left quadrant. Thus model
accuracy can be assessed by calculating the area under the curve (AUC) or the area between the
top curve to the diagonal line; the closer the AUC is to 1, the better the model.
28 Hastie et al. (2009). 29 Ibid.
16
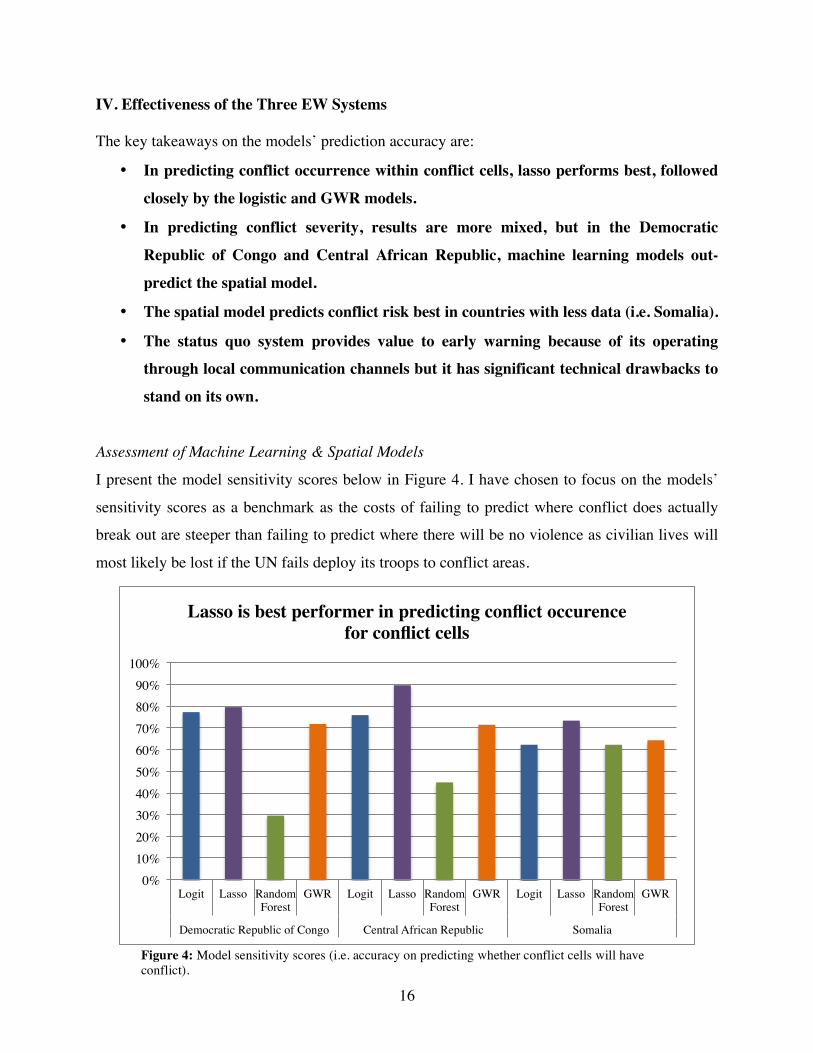
IV. Effectiveness of the Three EW Systems The key takeaways on the models’ prediction accuracy are:
• In predicting conflict occurrence within conflict cells, lasso performs best, followed
closely by the logistic and GWR models.
• In predicting conflict severity, results are more mixed, but in the Democratic
Republic of Congo and Central African Republic, machine learning models out-
predict the spatial model.
• The spatial model predicts conflict risk best in countries with less data (i.e. Somalia).
• The status quo system provides value to early warning because of its operating through local communication channels but it has significant technical drawbacks to
stand on its own.
Assessment of Machine Learning & Spatial Models
I present the model sensitivity scores below in Figure 4. I have chosen to focus on the models’
sensitivity scores as a benchmark as the costs of failing to predict where conflict does actually
break out are steeper than failing to predict where there will be no violence as civilian lives will
most likely be lost if the UN fails deploy its troops to conflict areas.
Figure 4: Model sensitivity scores (i.e. accuracy on predicting whether conflict cells will have conflict).
0%10%20%30%40%50%60%70%80%90%
100%
Logit Lasso Random Forest
GWR Logit Lasso Random Forest
GWR Logit Lasso Random Forest
GWR
Democratic Republic of Congo Central African Republic Somalia
Lasso is best performer in predicting conflict occurence for conflict cells

17
As can be observed, the lasso is the top performer for each of the three countries, reaching
sensitivity scores of between 73-90%. The logistic and geographically weighted regression
models also perform relatively well, particularly in the Democratic Republic of Congo and
Central African Republic.
The ROC curves, which assess how well the model does predicting conflict versus no conflict
are illustrated below in Figure 5. One can see that the lasso model dominates for each country
with AUC scores closest to 1.
How do these results compare to what is seen in the literature? Blair et al. perform subnational
prediction of local violence within Liberia and have models that achieve AUCs of 0.60 to 0.6730.
The classic Fearon and Laitin model obtains an AUC of 0.6531. Other more recent cross-national
models have obtained AUCs of between 0.80 and 0.9032,33. Thus these prediction models are on
par or better than other cross-national prediction models.
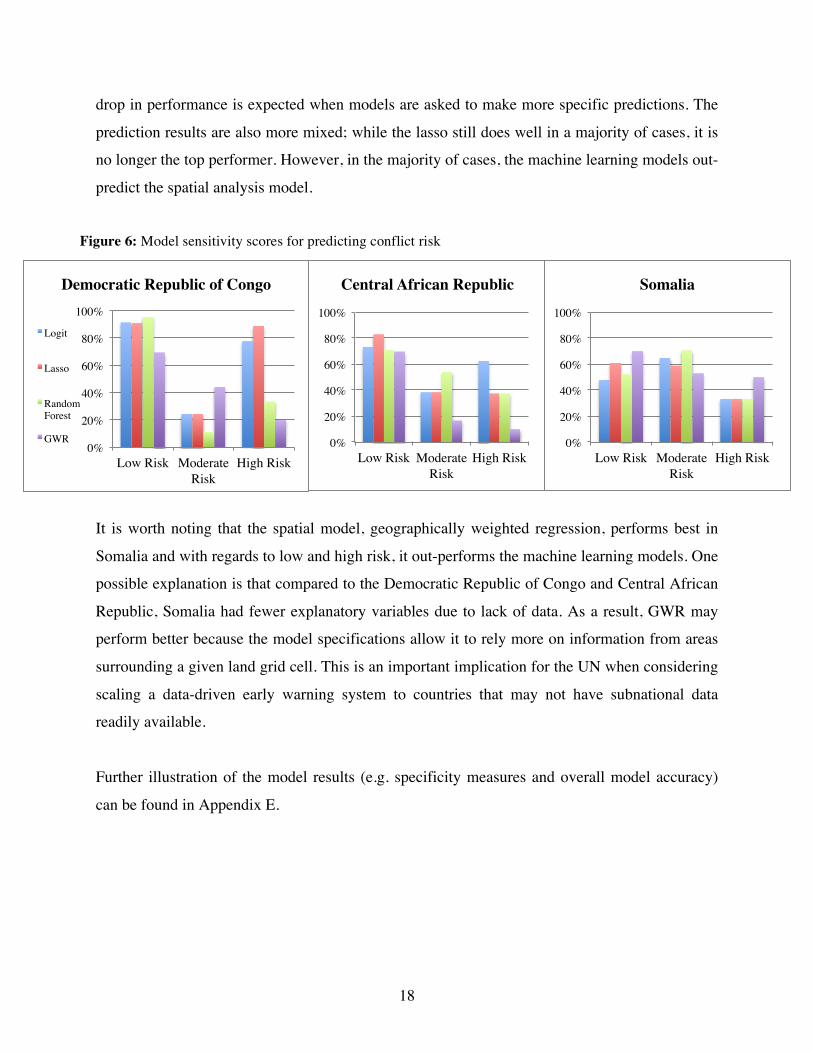
Next I assess the models’ sensitivity scores on predicting conflict risk, which are illustrated in
Figure 6. The performance of all four models decreases when predicting conflict risk, however, a
30 Blair et al. (2015). 31 Ibid. 32 Hegre et al. (2012).33 Ulfelder, J. (2013).
Figure 5: Receiver Operator Characteristic Curves
18
drop in performance is expected when models are asked to make more specific predictions. The
prediction results are also more mixed; while the lasso still does well in a majority of cases, it is
no longer the top performer. However, in the majority of cases, the machine learning models out-
predict the spatial analysis model.
It is worth noting that the spatial model, geographically weighted regression, performs best in
Somalia and with regards to low and high risk, it out-performs the machine learning models. One
possible explanation is that compared to the Democratic Republic of Congo and Central African
Republic, Somalia had fewer explanatory variables due to lack of data. As a result, GWR may
perform better because the model specifications allow it to rely more on information from areas
surrounding a given land grid cell. This is an important implication for the UN when considering
scaling a data-driven early warning system to countries that may not have subnational data
readily available.
Further illustration of the model results (e.g. specificity measures and overall model accuracy)
can be found in Appendix E.
0%
20%
40%
60%
80%
100%
Low Risk Moderate Risk
High Risk
Democratic Republic of Congo
Logit
Lasso
Random Forest
GWR 0%
20%
40%
60%
80%
100%
Low Risk Moderate Risk
High Risk
Central African Republic
0%
20%
40%
60%
80%
100%
Low Risk Moderate Risk
High Risk
Somalia
Figure 6: Model sensitivity scores for predicting conflict risk
19
Assessing the Status Quo System It is unfortunately impossible to assess the status quo early warning system using the same
classification benchmarks, as data on prediction accuracy for that system does not exist. One
possible assessment is to examine the prediction power of the indicators that the status quo
system is based on. While there is no systematic prediction algorithm, conflict risk assessment is
mostly driven by whether there is ongoing conflict in the region or in surrounding regions,
measures of social cohesion such as ethnic fractionalization and migration of people through the
areas34. One benefit of the lasso model is that it selects the most powerful predictors for the final
model. The final predictors are listed in more detail in Section VII. While neighboring conflict
and migration are final predictors, there are a host of other geographic and socioeconomic
indicators in the final model that are not currently considered in the status quo system. This
indicates that the status quo system could be missing important conflict warning signals.
34 Conversation with S. Rendtorff-Smith, Department of Peacekeeping Operations, United Nations, Feb. 2017
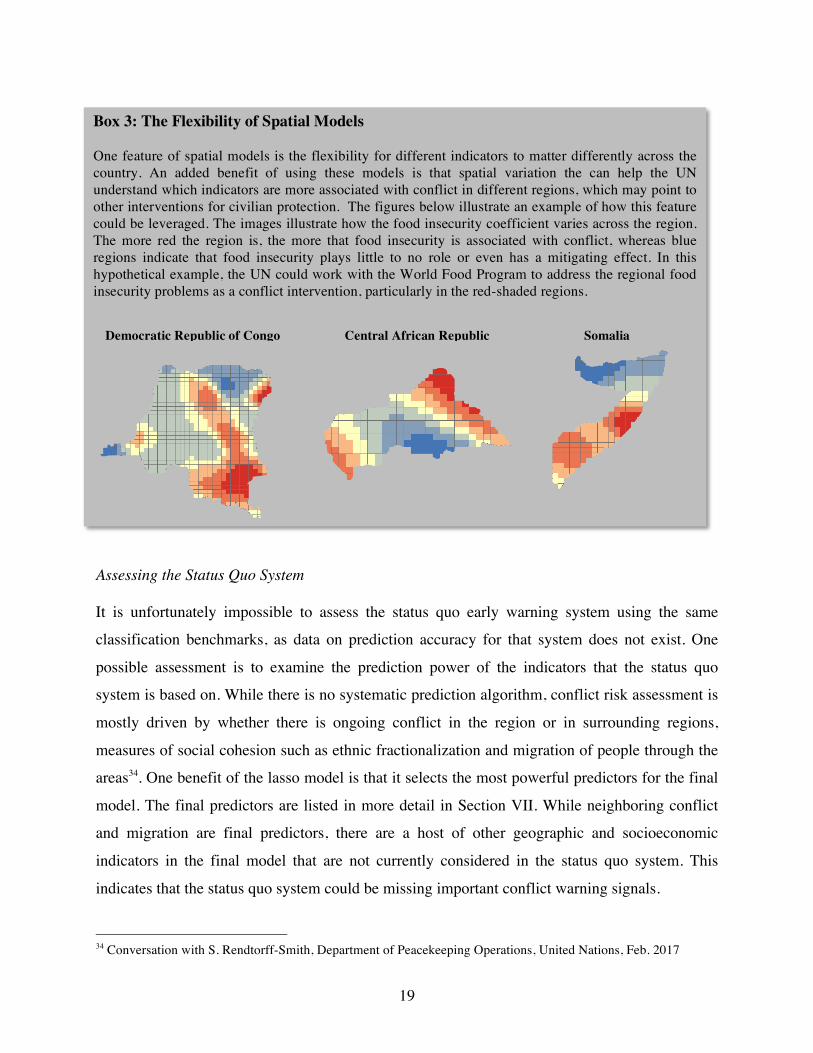
Box 3: The Flexibility of Spatial Models One feature of spatial models is the flexibility for different indicators to matter differently across the country. An added benefit of using these models is that spatial variation the can help the UN understand which indicators are more associated with conflict in different regions, which may point to other interventions for civilian protection. The figures below illustrate an example of how this feature could be leveraged. The images illustrate how the food insecurity coefficient varies across the region. The more red the region is, the more that food insecurity is associated with conflict, whereas blue regions indicate that food insecurity plays little to no role or even has a mitigating effect. In this hypothetical example, the UN could work with the World Food Program to address the regional food insecurity problems as a conflict intervention, particularly in the red-shaded regions.
Democratic Republic of Congo Central African Republic Somalia

20
To attempt to quantify the difference in prediction performance between the status quo system
and the machine learning model system, I perform a simulation of the status quo system.
Specifically, I build a basic prediction model that incorporates only the predictors used in the
status quo system (i.e. neighboring conflict, number of ethnic groups, and migration).
Admittedly, this is not how the status quo system operates, but it is an approximation that aims to
assess how much alternative indicators used in the machine learning and spatial models matter in
conflict prediction. In Figure 7, I provide the sensitivity results of the status quo simulation
compared to the lasso sensitivity measures for predicting conflict occurrence. The lasso model
out-performs the status quo simulation in each of the three country cases by between 20-35
percentage points. While this difference in performance should not be taken as exact, the large
magnitude of the difference indicates there is a considerable gap in the status quo system.
Figure 7: Sensitivity measures for Status Quo simulation versus the lasso model for predicting conflict occurrence.
0%10%20%30%40%50%60%70%80%90%
100%
Democratic Republic of Congo
Central African Republic
Somalia
Lasso out-performs Status Quo simulation
Lasso
Status Quo

21
This is not to say that there are no benefits of the
status quo system. Within the UN and across the
local population, the community alert networks are
viewed as indispensible and a “major innovation
that contributes considerably to the success of the
implementation of the Mission’s POC mandate35.”
There is also no shortage of anecdotal success
stories (see Box 4).
One major advantage that the UN’s current system
has over any model-based early warning system is
that a model can only explain the types of data points used in its development. The models
developed for this policy analysis were constrained by the type of conflict they could explain –
those violence against civilian events that are picked up by news sources. Therefore, it’s possible
that conflict occurring in areas outside of journalist jurisdiction will not be predicted by these
models. As the status quo system operates through local networks, it has the ability to alert UN
forces of conflict events in these remote areas.
However, as explained earlier, there are clear technical drawbacks in the current system. By
design, the community alert network can only cover communities which host a liaison. The small
number of liaisons in each mission implies minimal coverage of this early warning system.
Furthermore, the system can typically only predict imminent threats as it is based on
observations of violence near the communities. This reality renders communities located far
from peacekeeping bases vulnerable in the face of an attack.
A summary of the models’ technical performance is outlined in Table IV.
35 MONUSCO Civil Affairs Section – Ops East (2014).
Box 4: Community Alert Network Success Story On February 3rd, 2014, a joint protection team was sent to Kashebere (in the DRC) to assess the closure of the base. In the afternoon, the team suddenly heard gunshots on the West side of the base and found itself in the middle of an acute protection situation. Through the established contacts of the CLA, they quickly learned that FARDC had started an unexpected attack against the APCLS, an armed group they had previously cohabited with in the area. In consultation with the CLA, the TOB commander decided to send out a Quick Reaction Force (QRF) of about thirty men in armed vehicles. This calmed the situation immediately and the population stopped fleeing the area. Source: “CLA Best Practice Review.” MONUSCO Civil Affairs Section – Ops East. August 1, 2014.

22
Policy Option Assumptions
Status Quo (i.e. SMS alerts from community liaisons)
• Works best for imminent threats and local reach population. • Communities far from peacekeeping operations will be at
risk. • Subjective and not systematic. • Valuable and contextualized information comes through
local communication channels. • System can pick up impending conflict in areas outside of
local media coverage.
Machine Learning (i.e. techniques to predict conflict hot-spots using large datasets)
• Is able to make predictions across the entire country at a resolution of 50 x 50 km.
• Best performing models are able to predict whether cells will have conflict between 70-90% of the time depending on the country.
• Model performance drops when predicting conflict severity and can be as low as 25% sensitivity depending on conflict severity and country.
Spatial Analysis (i.e. techniques to predict conflict hot-spots using geographic data)
• Is able to make predictions across the entire country at a resolution of 50 x 50 km.
• Performs on par or worse than the average performing machine learning model, accurately predicting conflict occurrence 60-70% of the time.
• Model performance drops when predicting conflict severity and can be as low as 17% sensitivity depending on conflict severity and country.
• Predicts conflict risk best for countries with less data.
V. Political Supportability
In order to understand how any new data-driven early warning system would fare, one needs to
delve into the specific political institutions of UN peacekeeping missions that are based within
the countries in conflict. There are five primary stakeholders to consider in the adoption of a new
UN early warning system. These actors and their relevant roles are:
• UN Headquarters (HQ) – As the name implies, the UN HQ is the head governing body
within all UN peacekeeping field missions. It is responsible for setting the mission’s
overall strategy and all directives flow down from them. HQ’s strategic planning dictates
Table IV: Technical Correctness for EWS options

23
how and when peacekeeping forces will engage as well as which types of violence to
monitor. Each week, the various UN peacekeeping agents gather at HQ to assess
indicators of violence across the country and decide which indicators to investigate
further or to act on. As the head body who decides the mission’s strategy, the UN HQ
clearly retains significant power in this policy ecosystem. Fortunately, there is evidence
to show – both through anecdotes of UN peacekeeping staff and research on UN
peacekeeping – that there is a group within the top staff that acknowledges the current
early warning system is lacking and should be significantly more data-driven36 37.
However, there is an element of HQ’s culture that should be considered with the
introduction of any new system: in addition to a model that’s accurate, HQ wants a
system that they can understand the mechanics of. The lack of a more robust early
warning system becomes a pride and shame issue, which becomes a delicate political
issue38. As advocated by a former staff of the UN peacekeeping missing in CAR: “Keep it
simple! Simple is better!”39 Thus interpretability of the prediction model will be an
important consideration. Therefore, HQ will be supportive, provided they can understand
the backend of the model.
• Joint Mission Analysis Center (JMAC) – JMAC’s purpose is to provide the UN with
an intelligence collection capacity at its strategic and operational levels. Its function is
described as “to support mission planning and decision-making through the provision of
integrated analysis and predictive assessments.”40 It sends out requests to all the UN
mission’s appendages within country to collect information on certain incidences of
violence. In this sense JMAC has some degree of power, though its requests are largely
dictated by HQ’s mandate on which types of violence are worth monitoring.
Additionally, as the UN’s rigid bureaucratic system does not reward creativity or
exceptional effort, JMAC does not have incentive to take note of any additional indicator
that may also signal conflict is imminent41. As such, implementing a new early warning
system that requires JMAC to collect more data might increase administrative strain.
36 Abilova & Novosseloff (2016). 37 Conversation with S. Rendtorff-Smith, Department of Peacekeeping Operations, United Nations, Nov. 2016. 38 Conversation with former Deputy Military Advisor to the US Ambassador to the United Nations, Jan. 2017. 39 Conversation with S. Rendtorff-Smith, Department of Peacekeeping Operations, United Nations, Nov. 2016. 40 Abilova & Novosseloff (2016). 41 Conversation with S. Rendtorff-Smith, Department of Peacekeeping Operations, United Nations, Nov. 2016.

24
Currently, the analysts have about ninety minutes to review all the information coming in
from the field to prepare the brief that their military commanders will read that morning42.
In this sense, any new early warning system that involves significant more staff
bandwidth would be less supportable than the status quo. However, there is also a
recognized understanding within JMAC that they need to be better at early warning43.
Factoring together these two opposing influences, I hypothesize that JMAC would be
supportive of a new early warning system, although this support is on the lower side.
• Joint Operations Center (JOC) – JOC contributes to the mission through monitoring
and reporting of current conflict events. It is responsible for collating and synthesizing
information coming in from the field from the various UN peacekeeping units and
provides daily operational reports to UN Headquarters44. For similar reasons as outlined
above with JMAC, JOC would be supportive, albeit mildly, for a new system.
• Local NGOs – Local NGOs retain the least amount of power in this political ecosystem,
having no direct influence over the early warning system as they have no official
affiliation with the UN peacekeeping mission. However, they are relevant to this new
policy initiative as their collective ubiquitous and local presence could expand the UN’s
data collection capacity, particularly for indicators that the UN does not have an expertise
in measuring (e.g. food insecurity, infant mortality, etc.) and would be necessary for a
new early warning forecasting model that utilizes new indicators. Most of these NGOs
are humanitarian so would likely be supportive of a new EWS designed to improve
civilian protection. However, local NGOs are sensitive about sharing data as they fear
their independence, neutrality, or impartiality could be jeopardized if they are perceived
by the local population as cooperating too closely with a military component45. That
being said, informal NGO-UN information exchange happens constantly46. The UN also
has useful leverage in that NGOs completely rely on the UN for protection of their staff
as NGOs have zero capacity to do so. Secret quid pro quo exchanges of information for
protection is commonplace in peacekeeping missions. For example, if NGO staff are in
42 Conversation with former Deputy Military Advisor to the US Ambassador to the United Nations, Jan. 2017. 43 Conversation with anonymous expert on Central African Republic peacekeeping, Jan. 2017. 44 DPKO Policy Directive. (2006). 45 Abilova & Novosseloff (2016). 46 Conversation with former Deputy Military Advisor to the US Ambassador to the United Nations, Jan. 2017.

25
need of travel escorts, UN vehicles may coincidentally be traveling those roads at the
same time and NGO vehicles can just follow them47. NGOs should therefore be
supportive of the policy as long as their involvement remains covert.
• Host Country – UN peacekeeping missions are at the mercy of host country
governments. If the host country decides that they no longer want the UN peacekeeping
mission, the mission is over. Therefore, any new policy must not catch the attention of
the host country government at the expense of jeopardizing the mission. Host countries
can be particularly sensitive about their countries being labeled as red or high risk so this
is something HQ would need to be wary of.48 As long as a new early warning system
does not appear different than the status quo system to the host government, the UN
should be able to implement it without retribution.
In summary, there will be a supporting coalition for a new data-driven early warning system if:
• UN HQ is assured that the conflict predictions are accurate.
• The system is easy to understand and use, not adding (and ideally detracting) administrative strain on JMAC/JOC.
• Does not catch any negative publicity or upset the host country.
• Protects NGOs’ neutrality by providing channels for covert information sharing.
As such, the status quo system would have the most support because it does not require any
major overhaul that would add administrative burden. However, the current system does not
have complete universal support as there is a fraction of UN peacekeeping staff that has been
vocal about the need for better early warning systems. Both the machine learning and spatial
model systems would be less supportable in that they require an initial administrative strain as
the staff learns and adjusts to the new system. However, as will be described in the next section,
either system should reduce administrative strain over time. Finally, the spatial model is more
technically sophisticated because predictions are made not only from data on a given grid cell
but data from surrounding grid cells. Therefore it is likely that this system will be less
supportable both because it requires more data for any given prediction and because the model
47 Ibid. 48 Ibid.

26
mechanics are more difficult to understand. The level of political supportability for each EW
system can be summarized as follows:
Policy Option Assumptions
Status Quo (i.e. SMS alerts from community liaisons)
• Supportable because it involves no overhaul to the current system.
• Some UN staff who are pushing for more data-driven methods might be opposed to current system.
Machine Learning (i.e. techniques to predict conflict hot-spots using large datasets)
• Contingent in UN HQ and JMAC that want more data driven approaches would approve of this forecasting methodology.
• Requires initial administrative burden as staff adjusts to new system.
• UN HQ has the authority to make this change and enough power to ensure that the remaining actors in the chain (JMAC, JOC, PK forces) all fall in line given the militaristic culture of the UN.
Spatial Analysis (i.e. techniques to predict conflict hot-spots using geographic data)
• Contingent in UN HQ and JMAC that want more data driven approaches would approve of this forecasting methodology.
• Requires initial administrative burden as staff adjusts to new system.
• UN HQ has the authority to make this change and enough power to ensure that the remaining actors in the chain (JMAC, JOC, PK forces) all fall in line given the militaristic culture of the UN.
• Model has lower interpretability so not as user-friendly.
VI. Administrative Feasibility To understand the administrative capacity of UN peacekeeping missions, I examine first how
early warning currently functions within missions. Every week, UN Headquarters staff gathers to
assess that week’s batch of incidence reports that have been brought in from the field. The
internal discussion and analysis culminates in a risk mapping of different areas of the country,
Table V: Political Supportability for EWS options

27
usually designating areas by red (high risk), yellow (moderate risk), or green (low risk)49. This
conflict mapping determines how the UN will deploy its teams across the region. Additionally,
HQ will determine which types of violence to continue (or to begin) monitoring, particularly if
there is uncertainty around certain conflict hotspots or if a worrisome trend is observed that
needs to be tracked. These requests are sent to JMAC who sends requests to the various teams
out in the field across the country to report on. Data in the form of violence incidence reports
will accumulate and are collected and collated by JOC. In addition to reports from UN staff,
information can also be relayed, both formally or informally, by NGOs that also have a presence
on the ground, although this is not the dominant source of information. JOC attempts to
synthesize this mountain of reports in preparation for HQ’s next debrief meeting. Figure 8
illustrates this sequence of actions and the actors involved.
The operational procedure of the UN’s current early warning system highlights that through
JMAC and JOC, the UN already has the capacity to rapidly collect and process lots of data. As
evidenced in the Methodology section, both proposed early warning models hinge on the
availability of current subnational data. UN’s JOC and JMAC structures are encouraging signals
that the major pieces for a data-driven early warning system are already in place.
49 Conversation with S. Rendtorff-Smith, Department of Peacekeeping Operations, United Nations, Nov. 2016.
Figure 8: UN early warning actor mapping

28
While frequent and accurate data collection is important for any early warning system,
implementing a system that incorporates machine learning or spatial analysis techniques requires
the UN to enhance its analytical capacity, specifically to bring on either data scientists or GIS
specialists (with GIS specialists usually being harder to obtain). Unfortunately, improving the
analytical capacity of peacekeeping missions has proved challenging as trained analysts are both
expensive and scarce in many contributing countries. As a few JMAC leaders lament, “We have
access to all the information we need but lack the capacity to analyze it and transform it into
plans.50” However, it appears that the UN has been making strides to increase its analytical
capacity over time. The inception of JMAC in 2005 and its progression to become standard
across all peacekeeping missions is one such development. Additionally, the UN has
acknowledged the potential of big data in development and as such has launched the initiative
Global Pulse, which is working to promote awareness of the opportunities big data presents for
development and humanitarian action, generate high-impact analytical tools and approaches, and
drive broad adoption of useful innovations across the UN System51.
Another concern with implementing any new technology within a UN peacekeeping mission is
the sheer number of unanticipated and urgent issues that the staff must attend to day to day. This
unfortunately is the reality of working in a country that is gripped by conflict. One expert in UN
peacekeeping describes the dilemma: “You may have JMAC analysts who feel really passionate
about improving the early warning system and plan to work on it but then that morning they
unexpectedly get dragged into a crisis meeting all day to deal with conflict that just broke out
nearby”52. The capacity of UN peacekeeping mission staff is constantly drained by the situation
on the ground. Therefore it is critical to think through how to implement a new system without
requiring too much administrative burden on the staff.
While the UN already has a robust data collection apparatus in place, as of now, it has only been
collecting information on incidences of violence and conflict. However, in order to develop a
robust conflict forecasting model, it will be important to use other indicators, for example food
insecurity and infant mortality, that are strong predictors of conflict. While the UN currently
does not collect data on these alternative indicators, a host of UN staff and officials believe that 50 Abilova & Novosseloff (2016). 51 http://www.unglobalpulse.org/about-new 52 Conversation with anonymous expert on Central African Republic peacekeeping, Jan. 2017.

29
the information required for effective early warning already exists within the UN system, can be
provided by NGO or private sector sources or is freely available over the internet53. The number
of UN agencies, such as UNICEF and the World Food Programme, and other humanitarian
NGOs operating in country could exponentially expand the UN’s indicator measurement and
collection capacity. As described above, NGOs are protective of their neutrality but will easily
share information as long as it is in a covert manner.
The administrative capacity and gaps within UN peacekeeping missions for a new data-driven
early warning system can be summarized as:
ü Has capacity to rapidly collect and process large amounts of data. ü Has access to alternative indicator data (e.g. food security, income, etc.) as
humanitarian NGOs have historically shared information with UN covertly.
ü Has made strides to increase analytical capacity through creation of JMAC/JOC.
× Will need to hire technician that can transform the predictive model into a user-
friendly dashboard.
× Faces constant capacity drain from reality of living in a conflict zone so any new
system will need to be implemented incrementally.
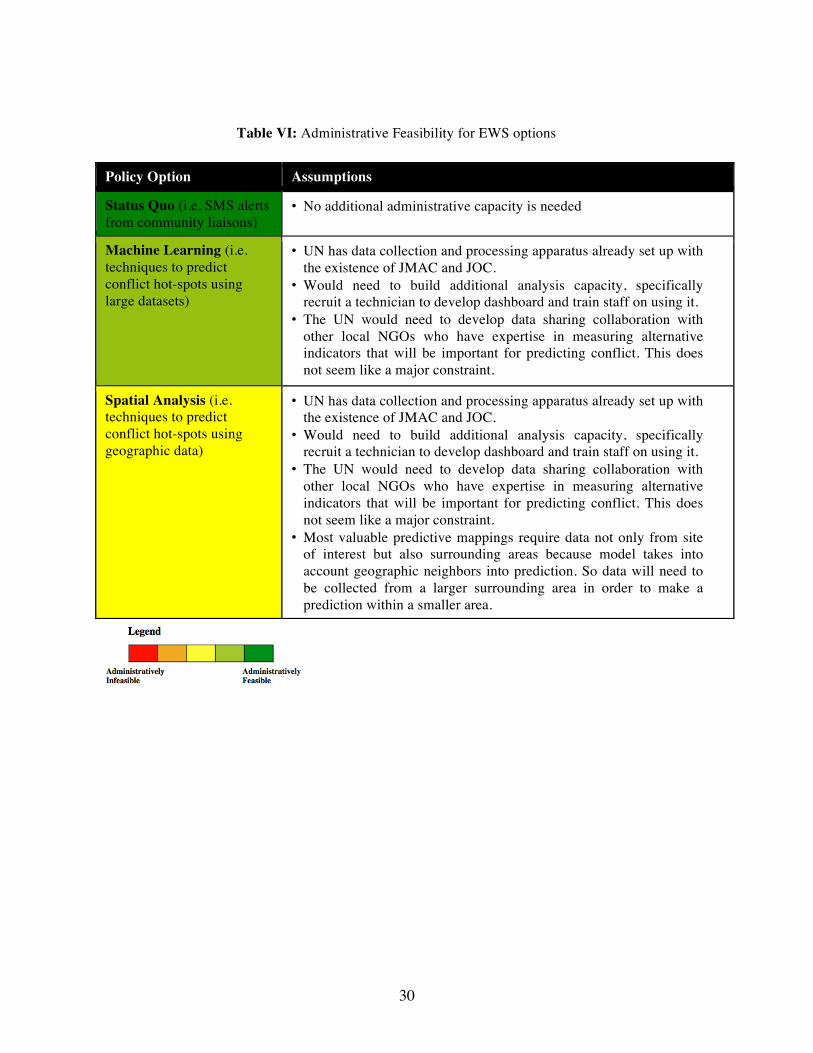
The status quo system is clearly feasible as it does not require any new capacity. Both the
machine learning and spatial model-based systems would require new analytical capacity,
particularly the hiring of a technician that could develop the system dashboard. Both systems
would also require information-sharing with NGOs as they use data that is not currently collected
by the UN. However, the spatial model-based system is more logistically intensive because to
make a prediction for a given land grid cell, one needs data both on that grid cell and on the
surrounding grid cells, whereas the machine learning models only require data on the grid cell of
interest. Table VI summarizes the administrative feasibility of the three early warning systems.
53 Zenko & Friedman (2011).
30
Policy Option Assumptions
Status Quo (i.e. SMS alerts from community liaisons)
• No additional administrative capacity is needed
Machine Learning (i.e. techniques to predict conflict hot-spots using large datasets)
• UN has data collection and processing apparatus already set up with the existence of JMAC and JOC.
• Would need to build additional analysis capacity, specifically recruit a technician to develop dashboard and train staff on using it.
• The UN would need to develop data sharing collaboration with other local NGOs who have expertise in measuring alternative indicators that will be important for predicting conflict. This does not seem like a major constraint.
Spatial Analysis (i.e. techniques to predict conflict hot-spots using geographic data)
• UN has data collection and processing apparatus already set up with the existence of JMAC and JOC.
• Would need to build additional analysis capacity, specifically recruit a technician to develop dashboard and train staff on using it.
• The UN would need to develop data sharing collaboration with other local NGOs who have expertise in measuring alternative indicators that will be important for predicting conflict. This does not seem like a major constraint.
• Most valuable predictive mappings require data not only from site of interest but also surrounding areas because model takes into account geographic neighbors into prediction. So data will need to be collected from a larger surrounding area in order to make a prediction within a smaller area.
Table VI: Administrative Feasibility for EWS options

31
VII. Policy Recommendations & Implementation Plan The key takeaways on the effectiveness, political supportability, and administrative feasibility
for each of the three systems are summarized in Table VII.
Policy Option • Effectiveness Political Supportability
Administrative Feasibility
Status Quo • Local communication channels provide valuable information.
• Subjective and not systematic.
• Only covers areas where there are peacekeeping staff based.
• Supportable because it involves no overhaul to the current system.
• Some UN staff who are pushing for more data-driven methods might be opposed to current system.
• No additional capacity needed.
Machine Learning
• Lasso & logistic models have sensitivity scores of 73-90% for predicting conflict occurrence.
• Model performance is worse on conflict severity predictions but out-perform spatial models
• Contingent in UN HQ and JMAC that want more data driven approaches would approve of this forecasting methodology.
• Requires initial administrative burden as staff adjusts to new system.
• Data collection & processing capacity
• Access to NGO information on prediction indicators.
Spatial Analysis • Sensitivity scores of 64-72% for predicting conflict occurrence.
• In most cases, is out-performed by machine learning models for predicting conflict severity.
• Predicts conflict risk best for countries with less data.
• Contingent in UN HQ and JMAC that want more data driven approaches would approve of this forecasting methodology.
• Requires initial administrative burden as staff adjusts to new system.
• Model has lower interpretability so not as user-friendly.
• Data collection & processing capacity
• Access to NGO information on prediction indicators.
• Each prediction requires additional data on surrounding grid cells.
Table VII: Summary of Early Warning System Options
32
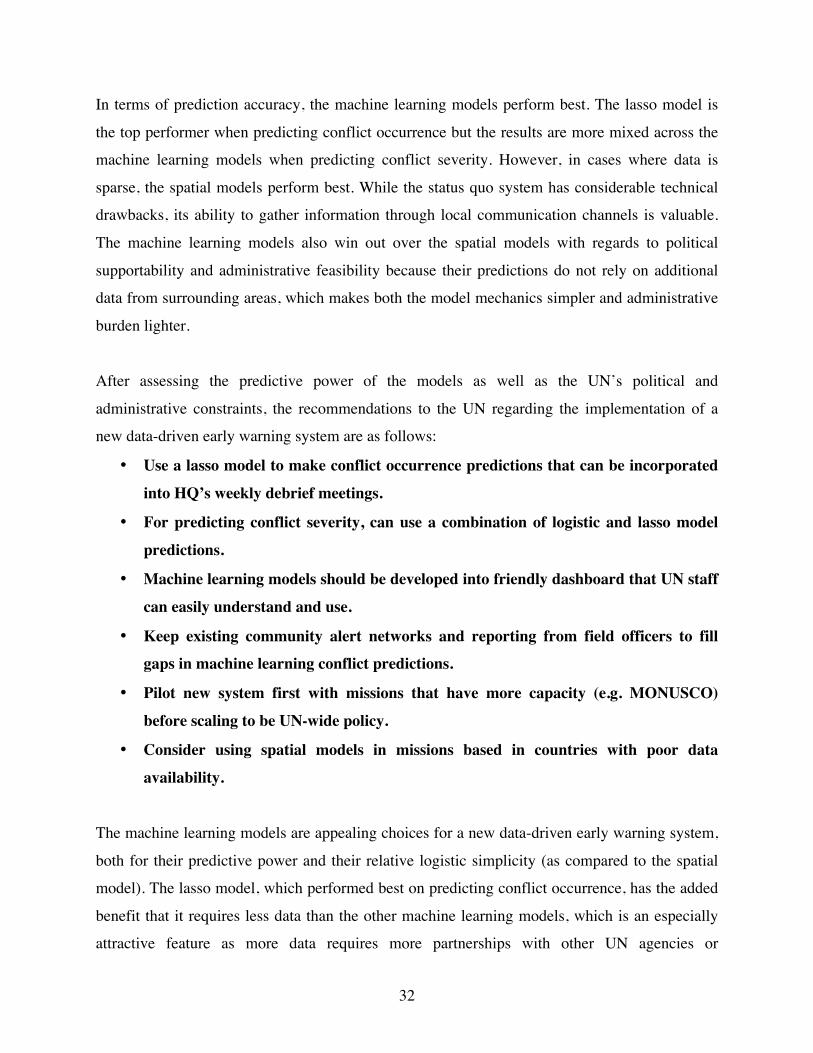
In terms of prediction accuracy, the machine learning models perform best. The lasso model is
the top performer when predicting conflict occurrence but the results are more mixed across the
machine learning models when predicting conflict severity. However, in cases where data is
sparse, the spatial models perform best. While the status quo system has considerable technical
drawbacks, its ability to gather information through local communication channels is valuable.
The machine learning models also win out over the spatial models with regards to political
supportability and administrative feasibility because their predictions do not rely on additional
data from surrounding areas, which makes both the model mechanics simpler and administrative
burden lighter.
After assessing the predictive power of the models as well as the UN’s political and
administrative constraints, the recommendations to the UN regarding the implementation of a
new data-driven early warning system are as follows:
• Use a lasso model to make conflict occurrence predictions that can be incorporated
into HQ’s weekly debrief meetings.
• For predicting conflict severity, can use a combination of logistic and lasso model
predictions.
• Machine learning models should be developed into friendly dashboard that UN staff
can easily understand and use.
• Keep existing community alert networks and reporting from field officers to fill gaps in machine learning conflict predictions.
• Pilot new system first with missions that have more capacity (e.g. MONUSCO)
before scaling to be UN-wide policy.
• Consider using spatial models in missions based in countries with poor data
availability.
The machine learning models are appealing choices for a new data-driven early warning system,
both for their predictive power and their relative logistic simplicity (as compared to the spatial
model). The lasso model, which performed best on predicting conflict occurrence, has the added
benefit that it requires less data than the other machine learning models, which is an especially
attractive feature as more data requires more partnerships with other UN agencies or
33
humanitarian NGOs. If interested in predicting conflict severity, the UN could incorporate a
combination of the lasso and logistic models as there was varying performance on predicting
different levels of risk. Finally, if and when the UN implements data driven early warning
systems in countries with poor data availability, it should consider implementing a spatial model
as it performed best in that context. However, as discussed previously, the UN’s current system
does have advantages over any model-based method in that it can capture types of conflict that
wouldn’t be picked up by the machine learning models, particularly conflict that is not reported
on by media outlets. In this way, the status quo system can corroborate and contextualize any
predictions made by these models. Additionally, the data coming in from the field can be used to
further refine and update the models as conflict trends inevitably change over time.
To minimize the administrative strain on staff as well as keep the system easy to understand and
use, the models should be developed into a dashboard. This structure will hopefully minimize the
additional administrative strain as the system can be designed so that staff can easily input data
on a set of key indicators and receive a conflict severity prediction (e.g. low, moderate, high) for
each area. This set-up is also politically palatable as the UN values the use of ‘dashboards’54. It is
also recommended that the UN implement this new system as a pilot, starting first with missions
with greater capacity, such as MONUSCO. MONUSCO is a multi-dimensional mission that has
various agencies already tracking socioeconomic indicators, so it is likely the there will be less
administrative strain to implement an early warning system that requires the tracking of these
indicators. Additionally, this allows a pilot mission to test the waters of whether host countries
will be amenable to the new system before scaling up any new policy UN-wide. In the remaining
sections, I sketch a rough implementation plan for the various technical, political, and
administrative components of integrating this new system into the UN’s current early warning
system.
Technical Implementation
As discussed above, one of the attractive features of the lasso model is its ability to achieve high
predictive accuracy using only a small subset of the original variables. Table VIII shows the
variables that were used in the final lasso models for each country. As discussed, many of these 54 Conversation with former Deputy Military Advisor to the US Ambassador to the United Nations, Jan. 2017.

34
indicators are not currently tracked by the UN so would require establishing data-sharing
procedures with other humanitarian organizations. Table VIII also includes a suggested NGO
partnership for each indicator. All suggested NGOs work in the country (except for DMSP and
NOAA which offer global measures of light activity and climate, respectively) and have
expertise in the corresponding domain.
Democratic Republic of Congo Central African Republic Somalia Indicator Agent Indicator NGO Indicator NGO
Elevation Fixed value – does not need to be regularly tracked
Distance to urban center
Fixed Elevation Fixed value – does not need to be regularly tracked
Distance from the capital
Fixed value – does not need to be regularly tracked
Light activity DMSP Precipitation National Oceanic and Atmospheric Administration
Neighboring conflict
UN field officers
Neighboring conflict
UN field officers
Temperature National Oceanic and Atmospheric Administration
Population Population Division of the Department of Economic and Social Affairs of the United Nations
Infant mortality
UNICEF Distance to urban center
Fixed value – does not need to be regularly tracked
Infant mortality
UNICEF Income UNDP Light activity DMSP
Land cover Income UNDP Food
insecurity Integrated Food Security Phase / FAO
Migration UNHCR
Migration UNHCR Land cover FAO Neighboring
conflict UN field officers
Food security Integrated Food Security Phase / FAO
The accuracy metrics used to score the models in this policy analysis placed equal weight on
misclassifying conflict cells versus misclassifying peaceful cells. As discussed, this may not be
an appropriate weighting system since the costs are steeper when the UN fails to predict an
Table VIII: Selected indicators and partner NGOs

35
outbreak of conflict. Fortunately, the UN has the ability to determine its prediction error rate. For
example, it can choose to correctly predict more conflict at the expense of falsely predicting
conflict in areas where it will not occur. The ROC curve (depicted in Section IV) graphs this
trade-off and the UN can use it to determine how sensitive to make their forecasting models. For
example, the UN could determine its cost of failing to predict conflict versus the cost of
deploying troops to an area where no conflict will occur and determine the optimal prediction
threshold that will minimize its expected costs.
Administrative Capacity Building
As discussed earlier, a data-driven early warning system can for the most part nest itself within
the existing early warning system as the UN already has most of the pieces in place to implement
this new system. For example, when JMAC puts out its requests to reporting officers for reports
on violence indicators, it can include requests for the indicators that will go into the lasso model.
Additionally, it will also send requests to NGO organizations for the indicators that the UN is not
able to collect. When the data comes to JOC from the field, JOC can then send the necessary
batch of indicators back to JMAC to feed into the lasso model dashboard. JMAC can then
organize the conflict predictions into a report that is prepared for the weekly conflict mapping
meeting at HQ. The UN can use the machine learning models to make predictions across the
entire country and use its local communication to corroborate those predictions or to understand
the context driving conflict outbreak in different areas. Figure 9 illustrates how the new system
can fit within the status quo system.
Figure 9: New EWS fitting within status quo EWS
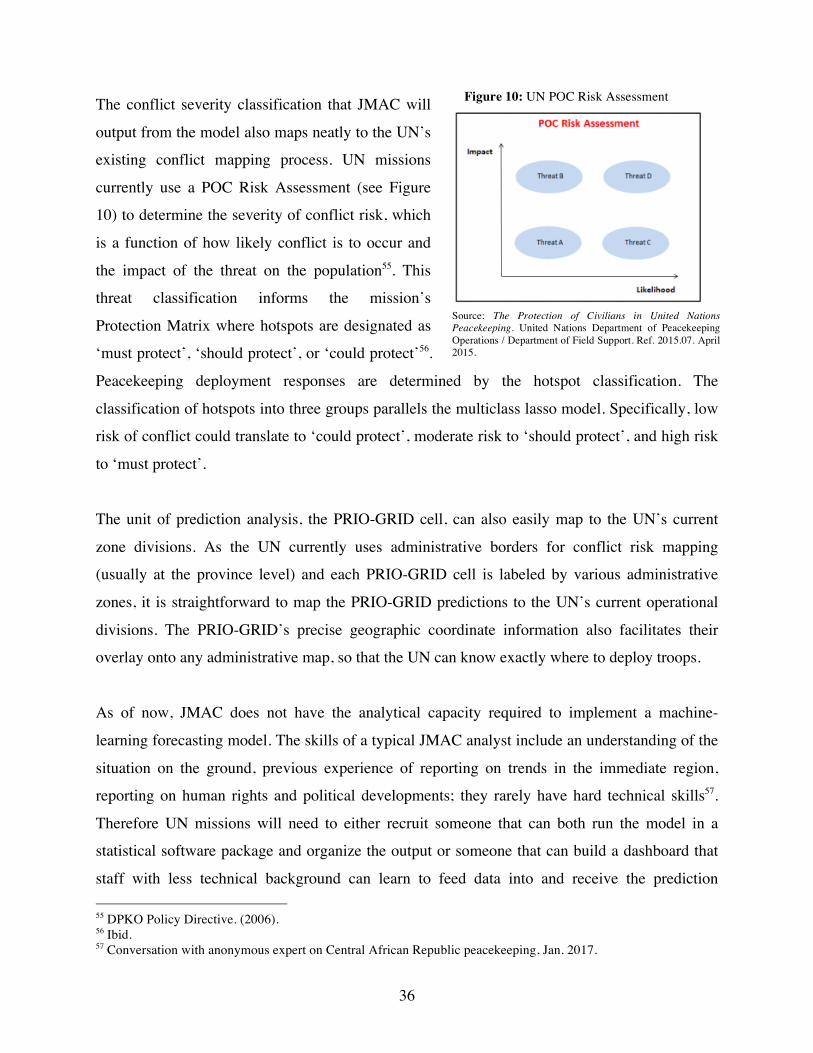
36
The conflict severity classification that JMAC will
output from the model also maps neatly to the UN’s
existing conflict mapping process. UN missions
currently use a POC Risk Assessment (see Figure
10) to determine the severity of conflict risk, which
is a function of how likely conflict is to occur and
the impact of the threat on the population55. This
threat classification informs the mission’s
Protection Matrix where hotspots are designated as
‘must protect’, ‘should protect’, or ‘could protect’56.
Peacekeeping deployment responses are determined by the hotspot classification. The
classification of hotspots into three groups parallels the multiclass lasso model. Specifically, low
risk of conflict could translate to ‘could protect’, moderate risk to ‘should protect’, and high risk
to ‘must protect’.
The unit of prediction analysis, the PRIO-GRID cell, can also easily map to the UN’s current
zone divisions. As the UN currently uses administrative borders for conflict risk mapping
(usually at the province level) and each PRIO-GRID cell is labeled by various administrative
zones, it is straightforward to map the PRIO-GRID predictions to the UN’s current operational
divisions. The PRIO-GRID’s precise geographic coordinate information also facilitates their
overlay onto any administrative map, so that the UN can know exactly where to deploy troops.
As of now, JMAC does not have the analytical capacity required to implement a machine-
learning forecasting model. The skills of a typical JMAC analyst include an understanding of the
situation on the ground, previous experience of reporting on trends in the immediate region,
reporting on human rights and political developments; they rarely have hard technical skills57.
Therefore UN missions will need to either recruit someone that can both run the model in a
statistical software package and organize the output or someone that can build a dashboard that
staff with less technical background can learn to feed data into and receive the prediction 55 DPKO Policy Directive. (2006). 56 Ibid. 57 Conversation with anonymous expert on Central African Republic peacekeeping, Jan. 2017.
Source: The Protection of Civilians in United Nations Peacekeeping. United Nations Department of Peacekeeping Operations / Department of Field Support. Ref. 2015.07. April 2015.
Figure 10: UN POC Risk Assessment
37
outputs. The dashboard option would be preferable considering the high turnover rate of UN
peacekeeping staff as well as the UN’s value of dashboards.
Political Stakeholder Sequencing
As implementing a new early warning system within a mission involves multiple stakeholders
with different levels of interest and power, the sequence of creating buy-in will be important for
building a coalition around this policy change. Once a mission is identified for implementing the
new early warning system, the suggested steps for approaching the necessary stakeholders are
the following:
1. Identify and convince data-enthused authorizers in HQ of model’s predictive power.
The first step to enacting change is mobilizing the members of HQ that is pushing for
more data-driven early warning systems within their missions. To do this, demonstrating
the lasso model’s predictive power is essential. A more compelling case can be made by
performing a cost-benefit analysis, comparing the status quo system and new system,
illustrating costs and lives saved to highlight value of the new system. This particular
point will be important for the non data-enthused HQ staff as there is a universal interest
in saving lives and cutting costs.
2. Demystify implementation. Once there is buy-in that the model works, the next logical
question is how do UN peacekeeping missions actually use this. The above section on
Building Administrative Capacity would be helpful in conveying this. Additionally, the
team could demonstrate a realistic simulation of how the model could work in reality,
walking through running data through the model, obtaining the prediction outputs, and
mapping those outputs to their corresponding region as well as an appropriate
peacekeeping response based on the predicted conflict severity. 3. Convince HQ authorizers of administrative feasibility. Throughout the
implementation demystifying step, it is critical to highlight that the UN currently has
many of the pieces in place to get this system off the ground, notably JMAC, JOC, and
existing formal or informal partnerships with many humanitarian agencies.
4. Bring on lower level staff. Once HQ is on board, the first three steps can be repeated
with the lower level staff. It is likely that their buy-in will be easier both because of UN

38
culture which emphasizes obedience as well the genuine interest that many of the staff
have in revitalizing their early warning system. 5. Make compelling case to NGOs. There must be enough buy-in within the UN before
one can approach the NGOs as they will be more reluctant to get onboard for impartiality
concerns. Fortunately, there is already strong precedence for NGOs publicizing and
sharing data for humanitarian purposes. The UN missions should identify NGOs that
have expertise in measuring and collecting the relevant indicators (several of these are
suggested above) and ideally have a history of sharing data with the UN. The UN can
convince NGOs that their neutrality will be protected by assuring them that data can be
shared machine to machine thus not risking NGOs be seen collaborating with the UN in
public.
VIII. Conclusion
The UN has acknowledged that the lack of robust early warning systems considerably hinders
their ability to protect civilians in the face of conflict. While the UN currently has an early
warning system, it is subjective, unsystematic, and does not provide coverage across the entire
country. This policy analysis explores two alternative data-driven early warning systems to fill
those gaps. It finds that an early warning system that utilizes machine learning models,
specifically the lasso and logistic models, can add significant value to the UN’s current system
with their ability to predict both conflict occurrence and severity across the entire country. For
example, the UN can use the machine learning models to make predictions across the entire
country and use local communication to corroborate those predictions or to understand the
context driving conflict outbreak in different areas. Furthermore, it finds the UN has both the
supporting political coalition and much of the relevant administrative and technical capacities
already in place for a new data-driven early warning system.
The recommendations following this analysis are that the UN incorporates machine learning
models into its existing early warning system. The lasso model performs best in all cases on
predicting conflict occurrence. If predicting conflict severity is more important, the UN can

39
make use of both the lasso and logistic models. Finally, if the UN mission is located within a
country with poor data availability, it should consider using a spatial model to make predictions.
This new data-driven method can be implemented in addition to the UN’s status quo system, as
there is considerable value in information gathered through local communication channels. To
ease administrative strain, the data-driven system can be easily nested within the status quo early
warning system, making use of the current data collection capacities and existing relationships
with NGOs. The UN should also consider implementing any new system incrementally, piloting
first with missions that have more capacity. These recommendations can hopefully offer the UN
an early warning system that is more systematic and comprehensive in its predictions, less
administratively taxing on its staff, and will ultimately save more lives.
40
References
Abilova, Olga and Alexandra Novosseloff. “Demystifying Intelligence in UN Peace Operations: Toward an Organizational Doctrine.” Peace Operations Review. July 2016.
“About.” United Nations Global Pulse. United Nations, n.d. Web. 29 Jan. 2017.
http://www.unglobalpulse.org/about-new Anonymous expert on peacekeeping in the Central African Republic. (2017, January 23). Phone
interview. “Background: The Varied Causes of Conflict in CAR.” State of Anarchy: Rebellion and Abuses against
Civilians: Background: The Varied Causes of Conflict in CAR. Human Rights Watch. https://www.hrw.org/reports/2007/car0907/4.htm
Blair, Robert A. and Blattman, Christopher and Hartman, Alexandra, Predicting Local Violence (April
15, 2015). Blattman, C, and Miguel, T 2010 Civil War. Journal of Economic Literature, 48(1): 3–57. Camp, Rebecca. (2016, October 22). Phone interview. “Central African Republic.” Enough Project. http://www.enoughproject.org/conflicts/car “CLA Best Practice Review.” MONUSCO Civil Affairs Section – Ops East. August 1, 2014. Collier, Paul and Anke Hoeffler. 2004. “Greed and Grievance in Civil War.” Oxford Economic Papers
56(4):563–595. “The Crisis in the Democratic Republic of Congo.” International Coalition for the Responsibility to
Protect. http://www.responsibilitytoprotect.org/index.php/crises/crisis-in-drc “The Democratic Republic of the Congo Roots of the Crisis.” The Enough Project.
http://www.enoughproject.org/conflict_areas/eastern_congo/roots-crisis DiMiceli, C.M., M.L. Carroll, R.A. Sohlberg, C. Huang, M.C. Hansen, and J.R.G. Townshend (2011),
Annual Global Automated MODIS Vegetation Continuous Fields (MOD44B) at 250 m Spatial Resolution for Data Years Beginning Day 65, 2000 – 2010, Collection 5 Percent Tree Cover, University of Maryland, College Park, MD, USA.
“The Economics of Violence.” The Economist. The Economist Newspaper, 16 Apr. 2011. Web. Enquête Démographique et de Santé en République Démocratique du Congo 2013-2014. Rockville,
Maryland, USA: MPSMRM, MSP, and ICF International. – See more at: http://dhsprogram.com/publications/publication-fr300-dhs-final-reports.cfm#sthash.wQqQ0pw3.dpuf
Esty, Daniel C., Jack A. Goldstone, Ted Robert Gurr, Barbara Harff, Marc Levy, Geoffrey D. Dabelko,
Pamela Surko and Alan N. Unger. 1998. State Failure Task Force Report: Phase II Findings. McLean, VA: Science Applications International, for State Failure Task Force.
41
Fearon, James D. and David D. Laitin. 2003. “Ethnicity, Insurgency, and Civil War.” American Political
Science Review 97(1):75–90. Former Deputy Military Advisor to the US Ambassador to the United Nations. (2017, January 26).
Personal interview. Fotheringham, A.S., M.E. Charlton, and C. Brunsdon. 1998. Geographically weighted regression: A
natural evolution of the expansion method for spatial data analysis. Environment and Planning A 30: 1905–1927.
Garcia, Andrew J., Andres J., Snow, Robert W., Noor, Abdisalan M., Gaughan, Andrea E.,Gilbert,
Marius and Linard, Catherine, 2013, Millennium development health metrics: where do Africa’s children and women of childbearing age live? Population Health Metrics, 11, (1), 11.
"Geographically Weighted Regression." GISPopSci. http://gispopsci.org/geographically-weighted-
regression/ Gilmore, Elisabeth, Päivi Lujala, Nils Petter Gleditsch, and Jan Ketil Rød. 2005. The diadata codebook.
Oslo, Norway: PRIO. www.prio.no/cscw/datasets. Gleditsch, Kristian Skrede. 2007. “Transnational Dimensions of Civil War.” Journal of Peace Research 44(3):293–309. Gleditsch, K. S. and M. D. Ward (2013). “Forecasting is difficult, especially about the future using contentious issues to forecast interstate disputes”. Journal of Peace Research 50(1), 17–31. Hastie, Trevor J., Robert John Tibshirani, and Jerome H. Friedman. The Elements of Statistical Learning: Data Mining, Inference, and Prediction. New York: Springer, 2009. Healy, Sally, and Mark Bradbury. "Endless War: A Brief History of the Somali Conflict."Conciliation Resources. 2010. Hegre, Håvard, Joakim Karlsen, Håvard Mokleiv Nygård, Håvard Strand, and Henrik Urdal. “Predicting Armed Conflict, 2010-2050.” International Studies Quarterly 57.2 (2012): 250-70. Henderson, Vernon, Adam Storeygard, and David N. Weil. “A Bright Idea for Measuring Economic Growth.” American Economic Review 101.3 (2011): 194-99. “History: Central African Republic Conflict.” Conciliation Resources. N.p., 21 June 2016. http://www.c-r.org/where-we-work/east-and-central-africa/history-central-african-republic-conflict-0 Holt, Victoria and Glyn Taylor. Protecting Civilians in the Context of UN Peacekeeping. United Nations.
2009. “Joint Operations Centres and Joint Mission Analysis Centres.” DPKO Policy Directive. United Nations
Department of Peacekeeping Operations. Ref: POL/2006/3000/04. 1 July 2006. Mamiya, Ralph & Haidi Willmot (2013) Early warning, the protection of civilians and United Nations
peacekeeping operations, African Security Review, 22:2, 68-77.
42
“Mandate.” UNSOM | UNITED NATIONS ASSISTANCE MISSION IN SOMALIA. United Nations, n.d. Web. 28 Jan. 2017.
Mesquida, Christian G. and Neil I. Wiener. 1996. “Human Collective Aggression: A Behavioral Ecology
Perspective.” Ethology and Sociobiology 17(.):247–262. “MINUSCA Background.” United Nations Multidimensional Integrated Stabilization Mission in the
Central African Republic (MINUSCA). United Nations, n.d. Web. 28 Jan. 2017. “MONUSCO Background.” United Nations Organization Stabilization Mission in the Democratic
Republic of the Congo. United Nations, n.d. Web. 28 Jan. 2017. Muchlinski, David, David Siroky, Jingrui Hei, Matthew Kocher. “Comparing Random Forest with Logistic Regression for Predicting Class-Imbalanced Civil War Onset Data”. Political Analysis (Winter 2016) 24 (1): 87-103 Murdoch, James C. and Todd Sandler. 2004. “Civil Wars and Economic Growth: Spatial Dispersion.” American Journal of Political Science 48(1):138–151. “New MONUSCO Mandate Must Expand Civilian Protection Strategy: Enough Project.” Enough Project.
June 12, 2012. NOAA (2010a). Electrification Rates Derived From Satellite
Data. http://www.ngdc.noaa.gov/dmsp/download_electrification.html Nordhaus, W.D., and X. Chen. 2016. Global Gridded Geographically Based Economic Data (G-Econ),
Version 4. Palisades, NY: NASA Socioeconomic Data and Applications Center (SEDAC) O’Bryan, T. (2016, September 27). Personal interview. Perry, C., (2013). Machine Learning and Conflict Prediction: A Use Case. Stability: International Journal of Security and Development. 2(3), p.Art. 56. The Protection of Civilians in United Nations Peacekeeping. United Nations Department of Peacekeeping
Operations / Department of Field Support. Ref. 2015.07. April 2015. Raleigh, Clionadh, Andrew Linke, Ha ̊vard Hegre and Joakim Karlsen. 2010. Introducing ACLED –
Armed Conflict Location and Event Data. Journal of Peace Research 47(5) 1-10. Raleigh, Clionadh. 2010. Seeing the Forest for the Trees: Does Physical Geography Affect a State’s
Conflict Risk?, International Interactions, 36:4, 384-410 Rendtorff-Smith, S. (2016, November 8). Personal interview. Rosen, Armin. “The Origins of War in the DRC.” The Atlantic. Atlantic Media Company, 26 June 2013. Salehyan, Idean and Kristian S. Gleditsch. 2006. “Refugees and the Spread of Civil War.” International
Organization 60(2):335–366.

43
Sawyer, Ida. “UN Reports Dramatic Increase in DR Congo Rights Violations in 2016.” Democratic Republic of Congo in Crisis. Human Rights Watch, 27 Jan. 2017. Web.
“Somalia.” Human Rights Watch, n.d. Web. 28 Jan. 2017. https://www.hrw.org/world-
report/2017/country-chapters/somalia#20ce6f Sorichetta, Alessandro, Tom J. Bird, Nick W. Ruktanonchai, Elisabeth zu Erbach-Schoenberg, Carla
Pezzulo, Natalia Tejedor, Ian C. Waldock, Jason D. Sadler, Andres J. Garcia, Luigi Sedda & Andrew J. Tatem. Mapping internal connectivity through human migration in malaria endemic countries Scientific Data 3, Article number: 160066 (2016). Doi:10.1038/sdata.2016.66
Stearns, Jason K. Dancing in the Glory of Monsters: The Collapse of the Congo and the Great War of
Africa. New York: Public Affairs, 2011. Thyne, Clayton. 2006. “ABC’s, 123’s, and the Golden Rule: The Pacifying Effect of Education on Civil
War, 1980–1999.” International Studies Quarterly 50(4):733–754. Tibshirani, R. (1996). Regression shrinkage and selection via the lasso. Journal of the Royal Statistical
Society. Series B (Methodological), 267–288. Tollefsen, Andreas Forø; Håvard Strand & Halvard Buhaug (2012) PRIO-GRID: A unified spatial data
structure. Journal of Peace Research 49(2): 363-374. Ulfelder, J. (2013). A multimodel ensemble for forecasting onsets of state-sponsored mass killing. Working paper. Urdal, Henrik. 2005. “People vs. Malthus: Population Pressure, Environmental Degradation and Armed Conflict Revisited.” Journal of Peace Research 42(4):417–434. U.S. Geological Survey, 2005, Mineral Resources Data System: U.S. Geological Survey, Reston,
Virginia. https://mrdata.usgs.gov/mrds/ USGS (2010a). GTOPO30. http://eros.usgs.gov/#/Find_Data/Products_and_Data_Available/gtopo30_info Vogt, Manuel, Nils-Christian Bormann, Seraina Rüegger, Lars-Erik Cederman, Philipp Hunziker, and
Luc Girardin. 2015. “Integrating Data on Ethnicity, Geography, and Conflict: The Ethnic Power Relations Dataset Family.” Journal of Conflict Resolution 59(7):1327-1342.
Weidmann, Neil and Michael Ward. “Predicting Conflict in Space and Time.” The Journal of Conflict Resolution, Vol. 54, No. 6 (December 2010), pp. 883-901 Wimmer, Andreas; Lars-Erik Cederman and Brian Min. “Ethnic politics and armed conflict. A
configurational analysis of a new global dataset”, in American Sociological Review 74(2):316-337, 2009.
Zenko, Micah and Friedman, Rebecca R.(2011) ‘UN Early Warning for Preventing Conflict’,
International Peacekeeping, 18: 1, 21 — 37 Zhang DD, Lee HF, Wang C, Li B, Pei Q, Zhang J, An Y. 2011. The causality analysis of climate change
and large-scale human crisis. Proceedings of the National Academy of Sciences of the USA 108(42): 17296–17301.

44
Appendix A – Background Information on the Three Conflicts
Democratic Republic of Congo The Democratic Republic of Congo has been gripped by mass violence following the 1994
Rwandan genocide when millions of Rwandan refugees and former genocidaires flooded into
Eastern Congo. In 1996, Rwanda and Uganda invaded eastern DRC to root out the remaining of
the genocidaires. Over 100,000 Rwandan refugees were massacred during this invasion58. The
war culminated in the ousting of Mobutu Sese Seko, followed by Laurent-Desire Kabila’s rise to
power.
War broke out again in August 1998 when President Kabila attempted to gain independence
from his regional backers and moved to purge Rwandan elements from his government59.
Rwanda and Uganda re-invaded the DRC and became increasingly interested in controlling
Congo’s mineral resources. Angola, Namibia, and Zimbabwe joined forces with the DRC, and
the resulting war became known as Africa’s World War60. “During this period, Congo was home
to military forces from across the continent, almost all of which brutalized civilians while using
their deployment as a pretext to loot vast natural resources and terrorize civilians61.” A ceasefire
agreement was finally signed by all the nations in 1999. In this year, the UN established the first
peacekeeping mission in the DRC, MONUC, to implement the ceasefire agreement. Despite its
efforts, continued violence in the DRC resulted in the Second Congo War, which waged until
the 2003 peace accords were signed between Uganda and the DRC62.
In 2006 power was transitioned to Joseph Kabila. Despite this democratic transition of power,
peace is still elusive in the DRC. Even now there have a surge in human rights violations and
violent crackdowns in response to opposition against President Joseph Kabila’s efforts to extend
his stay in power stay in power beyond the end of his two-term limit. It is estimated that the war
in the DRC has killed somewhere between 3.5 and 5.4 million people since 199663.
58 Rosen (2013). 59 http://www.enoughproject.org/conflict_areas/eastern_congo/roots-crisis 60 Stearns (2011). 61 http://www.enoughproject.org/conflict_areas/eastern_congo/roots-crisis 62 http://www.responsibilitytoprotect.org/index.php/crises/crisis-in-drc 63 Rosen (2013).

45
Central African Republic
The Central African Republic has been roiled in civil war incited by multiple fighting political
factions for many decades. The most recent war has been ongoing since late December 2012
after the Séléka rebel coalition toppled the current president, installing Michel Djotodia. The
Séléka rebels launched brutal attacks against civilians. In late 2013, France deployed an initial
force of 1,200 troops to CAR to stabilize the capital, Bangui. Violence intensified beyond
Bangui when Djotodia resigned in early January due to pressure from governments in the region,
and a transitional government took over64.
CAR’s neighbors—Chad, Sudan, the Democratic Republic of Congo, and Cameroon—have all
involved themselves in the political drama of the country. CAR has also been affected by
conflicts in neighboring Sudan, Chad, and the Democratic Republic of Congo, with rebel groups
and government forces from neighboring countries freely using remote rural areas as rear bases
or for military operations65. Conflict in its neighbors has also generated refugee flows into the
CAR, which is housing some 11,000 recognized refugees from Sudan, Chad, and the DRC66.
Since 2013, various troops have been sent in in an attempt to manage the situation. In July 2013,
the African Union authorized the deployment of the International Support Mission in the CAR
(MISCA). MISCA later transferred authority to the United Nations mission (MINUSCA)67. The
violence, often directed at civilians, has killed thousands and displaced millions of people.
Somalia
Over the past two decades, the nature of the Somali conflict has been constantly changing.
Somalia’s state collapse was hastened by the end of the Cold War, during which the country had
been used as a geopolitical prop. Foreign aid was withdrawn, and President Barre lost control of
the country and army. Following the collapse of the state, the country was torn apart by clan-
based warfare and famine, killing 25,000 people and leaving millions more displaced68. In late
64 http://www.enoughproject.org/conflicts/car 65 https://www.hrw.org/reports/2007/car0907/4.htm 66 Ibid. 67 http://www.c-r.org/where-we-work/east-and-central-africa/history-central-african-republic-conflict-0 68 Healy & Bradbury (2010).

46
1992, the UN authorized the deployment of the first peacekeeping mission to Somalia, however,
the mission failed to disarm hostilities and instead was criticized for fueling the war economy69.
A period of reconstruction took place between 2000-2006 with the rise of the Transitional
National Government. Also during this time, the Islamic Courts, a group of Sharia courts that
united themselves as an oppositional force, came to power. The December 2006 intervention
dispersed the courts but the militant wing al-Shabaab rose up in its place70.
Since its rise to power in 2006, Al-Shabaab continues to terrorize Somali civilians with suicide
bombings and improvised explosive devices (IEDs). Fighting, linked both to military operations
against Al-Shabab and clan fighting over resources and political power have resulted in mass
civilian displacement and casualties71.
69 Ibid. 70 Ibid. 71 “Somalia.” Human Rights Watch.
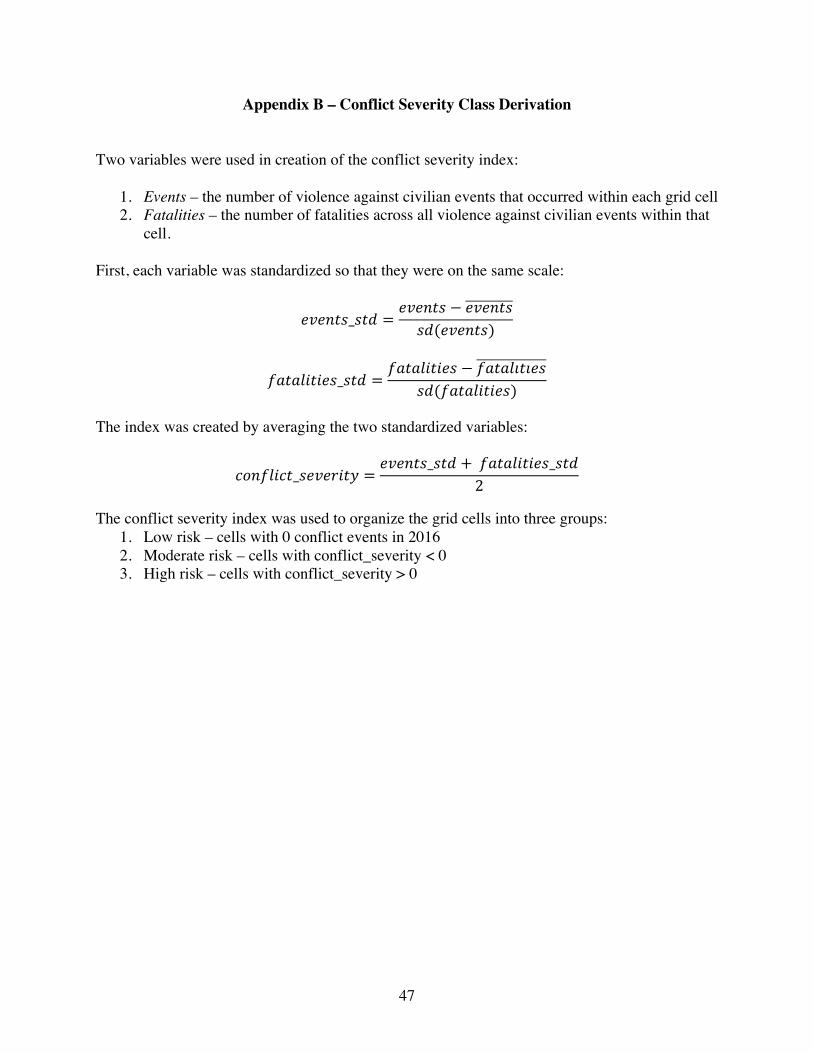
47
Appendix B – Conflict Severity Class Derivation
Two variables were used in creation of the conflict severity index:
1. Events – the number of violence against civilian events that occurred within each grid cell 2. Fatalities – the number of fatalities across all violence against civilian events within that
cell. First, each variable was standardized so that they were on the same scale:
𝑒𝑣𝑒𝑛𝑡𝑠_𝑠𝑡𝑑 =𝑒𝑣𝑒𝑛𝑡𝑠 − 𝑒𝑣𝑒𝑛𝑡𝑠𝑠𝑑(𝑒𝑣𝑒𝑛𝑡𝑠)
𝑓𝑎𝑡𝑎𝑙𝑖𝑡𝑖𝑒𝑠_𝑠𝑡𝑑 =𝑓𝑎𝑡𝑎𝑙𝑖𝑡𝑖𝑒𝑠 − 𝑓𝑎𝑡𝑎𝑙𝚤𝑡𝚤𝑒𝑠
𝑠𝑑(𝑓𝑎𝑡𝑎𝑙𝑖𝑡𝑖𝑒𝑠)
The index was created by averaging the two standardized variables:
𝑐𝑜𝑛𝑓𝑙𝑖𝑐𝑡_𝑠𝑒𝑣𝑒𝑟𝑖𝑡𝑦 =𝑒𝑣𝑒𝑛𝑡𝑠_𝑠𝑡𝑑 + 𝑓𝑎𝑡𝑎𝑙𝑖𝑡𝑖𝑒𝑠_𝑠𝑡𝑑
2
The conflict severity index was used to organize the grid cells into three groups: 1. Low risk – cells with 0 conflict events in 2016 2. Moderate risk – cells with conflict_severity < 0 3. High risk – cells with conflict_severity > 0

48
Appendix C – Explanatory Variable Literature Review
Neighboring conflict. Evidence shows that conflict tends to spill over into neighboring regions,
although the majority of these studies have examined conflict across national borders. Some
explanations provided for the tendency of conflict spillover are the detrimental economic effects
that can affect neighbors72, ethnic groups involved in the violence that have kin in neighboring
areas73, and that factors that can increase the risk of conflict, such as poverty, tend to also be
spatially clustered74. These factors are even more salient when considering subnational conflict
because both armed militias can travel and these second order effects can dissipate more quickly
across a given area. To capture the level of neighboring conflict, I include both a variable that
indicates the total number of conflict events in all adjacent land cells as well as a variable for the
total number of fatalities in all adjacent land cells.
Gross cell product per capita. Poverty has long been thought to be a driver of conflict. In fact,
the correlation between low per capita incomes and higher propensities for internal war is one of
the most robust empirical relationships in the literature75. Unequal distribution of resources can
generate incentives for a relatively poor group to seize control of the state76. Moreover, scarce
employment opportunities increase the incentive to join rebel groups. “As a rebel leader in South
Sudan once said, ‘life is so cheap it pays to rebel’77.” To determine gross cell product, I use the
G-Econ dataset78, which measures the regional equivalent of gross domestic product at a 50 x 50
kilometer resolution. However, the most recent measures of gross cell product are from 2005 for
the DRC and CAR and for Somalia, from 1990. Figure 11 illustrates the gross cell product
distribution across the three countries where red indicates relatively wealthy areas and blue,
relatively poor.
72 Murdoch & Sandler (2004). 73 Hegre et al. (2012). 74 Gleditsch (2007).75 Blattman & Miguel (2010). 76 Collier & Hoeffler (2004). 77 The Economist (2011). 78 Nordhaus & Chen (2016).
Figure 11: Distribution of wealth across the three countries
Democratic Republic of Congo Central African Republic Somalia Source: gecon.yale.edu
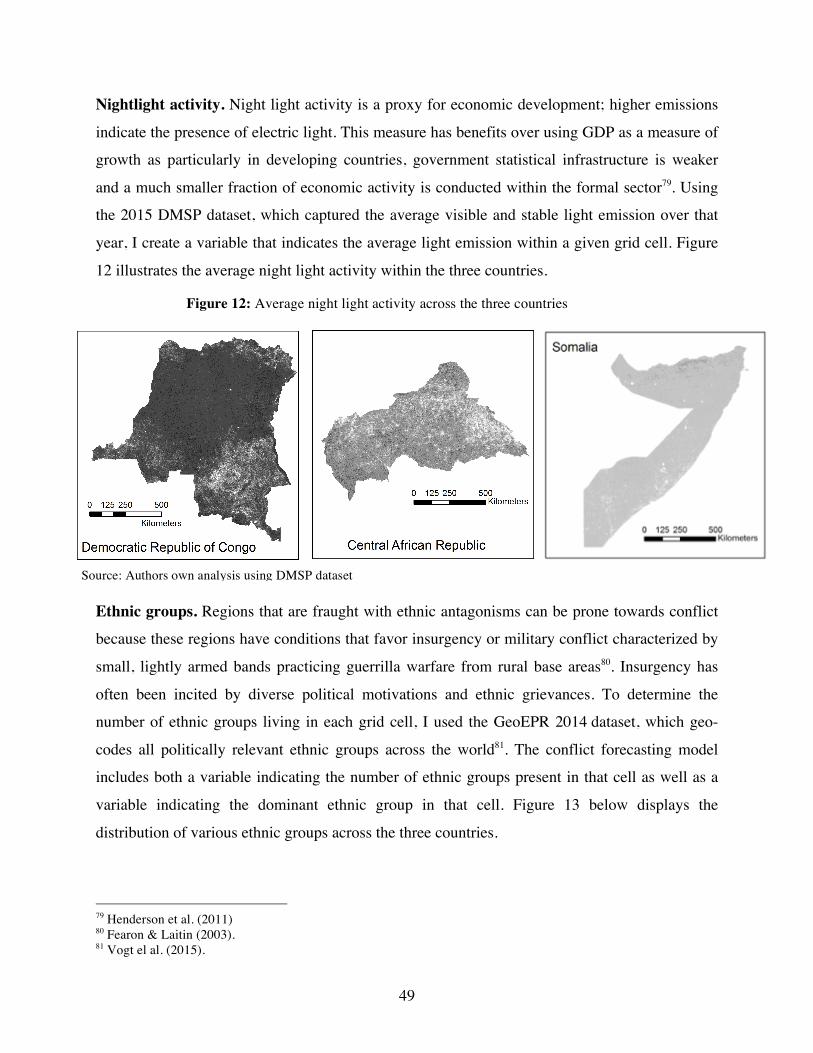
49
Nightlight activity. Night light activity is a proxy for economic development; higher emissions
indicate the presence of electric light. This measure has benefits over using GDP as a measure of
growth as particularly in developing countries, government statistical infrastructure is weaker
and a much smaller fraction of economic activity is conducted within the formal sector79. Using
the 2015 DMSP dataset, which captured the average visible and stable light emission over that
year, I create a variable that indicates the average light emission within a given grid cell. Figure
12 illustrates the average night light activity within the three countries.
Ethnic groups. Regions that are fraught with ethnic antagonisms can be prone towards conflict
because these regions have conditions that favor insurgency or military conflict characterized by
small, lightly armed bands practicing guerrilla warfare from rural base areas80. Insurgency has
often been incited by diverse political motivations and ethnic grievances. To determine the
number of ethnic groups living in each grid cell, I used the GeoEPR 2014 dataset, which geo-
codes all politically relevant ethnic groups across the world81. The conflict forecasting model
includes both a variable indicating the number of ethnic groups present in that cell as well as a
variable indicating the dominant ethnic group in that cell. Figure 13 below displays the
distribution of various ethnic groups across the three countries.
79 Henderson et al. (2011) 80 Fearon & Laitin (2003). 81 Vogt el al. (2015).
Figure 12: Average night light activity across the three countries
Source: Authors own analysis using DMSP dataset

50
Population. Almost all cross-national empirical studies have found that more populous countries
have more internal conflict than less populous countries82. A larger population can make it more
difficult for the center to keep close tabs on who is doing what at the local level, and also
increases the number of potential recruits to an insurgency for a given level of per capita
income83. The AfriPop dataset, which disaggregates the 2015 UN population figures within
countries across Africa, will be used to determine the number of people living within each grid
cell84. The population distribution across the three countries is illustrated in Figure 14 below. As
one can observe, the population density is mostly concentrated within the few urban centers and
is sparse across the rest of the country.
82 Hegre et al. (2012). 83 Fearon & Laitin (2003). 84 Sorichetta et al. (2016)
Figure 14: Population distribution across the three countries
Figure 13: Ethnic group distribution across the three countries
Source: Authors own analysis using GeoEPR dataset
Source: Authors own analysis using AfriPop dataset

51
Proportion of male youth. Several cross-national studies have examined the relationship
between male youth and conflict and have found that that large youth cohorts, measured as the
ratio between 15–29 year old males and males of 30 years and above, were associated with
higher conflict intensity levels85 86. The proportion of male youth is particularly relevant for
peacekeeping missions in Africa as many rebel groups make use of child soldiers. To determine
the ratio of 15-29 year old males to 30+ males across the land grid cells, I will also use the
AfriPop dataset.
Migration. Migration of large populations across regions can also increase risk of conflict.
Flows of displaced populations can “facilitate the transnational spread of arms, combatants, and
ideologies conducive to conflict, they alter the ethnic composition of the state, and they can also
exacerbate economic competition.87” To include this in the model, I make use of the WorldPop’s
migration dataset, which models internal human migration flows between 2010-15 in several
African countries88. The migration variable is defined as the number of people that have flowed
through each grid cell during this five-year time period.
Infant mortality. Infant mortality has been espoused as a proxy for economic development as it
captures a broader set of developmental factors than the standard measure of income levels (GDP
per capita)89. Several studies have found strong effects of infant mortality on state failure and
conflict90 91. Regional measures (at the province level) of infant mortality were taken from the
Demographic and Health Surveys (DHS) for both the Democratic Republic of Congo and the
Central African Republic92. Unfortunately, DHS does not collect data in Somalia so this indicator
is not included in Somalia’s conflict forecasting model.
Employment. As discussed above, high levels of unemployment can indicate that there are
stronger incentives for individuals to join rebel groups as an income-generating opportunity. I
include both male and female employment rate in the models. These indicators were also taken
from DHS so these indicators are not included in the Somalia model.
85 Mesquida & Wiener (1996). 86 Esty et al. (1998).87 Salehyan & Gleditsch (2006). 88 Sorichetta et al. (2016) 89 Hegre et al. (2012). 90 Urdal (2005). 91 Esty et al. (1998). 92 dhsprogram.com
52
Education. There is a consensus in the empirical literature that higher education levels reduce
conflict risks. These effects both seem to be explained by the fact that education is a proxy for
level of development93 and that education has a pacifying effect through giving people the tools
with which they can solve disputes peacefully94. To capture education levels, I use primary
school attendance rates for boys and girls as well as women’s literacy rates. These indicators
were also taken from DHS so these indicators are not included in the Somalia model.
Food insecurity. Food insecurity has been purported as a potential cause of conflict as access to
affordable food can spark social unrest95. To determine the food insecurity level at a subnational
level, I used Integrated Food Security Phase Classification’s (IPC) food insecurity maps from the
August-December 2016 time period for the three countries. IPC classifies food insecurity into
five phases: None/Minimal, Stressed, Crisis, Emergency, Humanitarian Catastrophe/Famine, and
IPC assigns these phases at the territory level.
Distance to precious commodities. Access to lootable natural resources can be a driver of
conflict. Armed groups are likely to assert control over precious commodity resources such as
minerals or diamonds to generate funding for their militias. Violence may also result over armed
groups competing for these resources. To capture distance to precious resources, I use
DIADATA96, which is a geocoded dataset of diamond deposits around the world and MRDS97 a
geocoded dataset of precious mineral deposits. These indicators are operationalized as distance
to nearest diamond deposit and distance to nearest mineral deposit (measured in meters).
Distance from state power. Distance has been purported to increase conflict through the
dissipation of state power over space. This is based on the assumption that “governments are less
able to maintain control of the hinterlands because of the distance from the center of state power,
inferior knowledge of local conditions, and the limited support from local populations98.” Three
distance from state power measures will be used in these conflict prediction models: distance to
the nearest international border, distance to the capital, and distance to the nearest urban center.
Terrain type. Terrain type can influence the movement and strength of rebel groups.
Mountainous regions or areas with dense tree cover can provide rebel groups places to hide out
93 Collier & Hoeffler (2004). 94 Thyne (2006). 95 Zhang et al. (2011). 96 Gilmore et al. (2005). 97 U.S. Geological Survey (2005). 98 Raleigh (2010).
53
in99. Several indicators of terrain type will be included in the models. To determine the type of
land cover (e.g. forest, grassland, croplands, etc.), I use the Modis Land Cover dataset,100 which
codes terrain into one of seventeen possible categories at a resolution of roughly 10 x 10
kilometers. Since the resolution of the land cover is more granular than the grid cells, to define
the terrain type of the grid cells, I took the majority terrain value that fell within each cell.
Another important indicator of terrain type is elevation, for which I use the U.S. Geological
Survey’s GTOPO30 dataset101, which captures elevation at a resolution of 1 kilometer. To define
elevation level for the entire gird cell, I took the average of all values falling within that cell as
well as the maximum and minimum values to capture areas that might be more mountainous.
Finally, the average precipitation and temperature level across 2015, taken from the PRIO-Grid
dataset, will be included.
99 Fearon & Laitin (2003). 100 DiMiceli et al. (2011). 101 USGS (2010a). GTOPO30.

54
Appendix D –Model Specifications102
Logistic Regression The logistic model is modeling the relationship between
𝑝 𝑋 = Pr 𝑌 = 1 𝑋
and X, where Y=0 is when a grid cell has no conflict and Y=1 is when a cell has conflict and X
represents the characteristics of that cell. The logistic model represents this relationship through
the logistic function:
𝑝 𝑋 =𝑒!!!!!!
1+ 𝑒!!!!!!
Lasso Regression The lasso has a similar structure to the logistic model but its coefficients are obtained instead by
minimizing the quantity
where the first term is the residual sum of squares from a standard regression model, and the
second term penalizes the model for model complexity.
The λ parameter for the lasso models was tuned using 5-folds cross validation. To do this, the
data was randomly partitioned into five equal sized subsets. The lasso model was then trained
using a given parameter value and four data subsets. Predictions were generated on the fifth
subset and the model accuracy score recorded. The subsets were then reshuffled until predictions
were obtained for every observation. The accuracy scores were averaged for the five subsets to
get the final cross-validation score (CV score). This process was continued for a wide range of
parameter values and the final parameter value determined by the highest CV score. Figure 15
illustrates an example of the cross-validation score plotted across different parameter values.
102 Hastie et al. (2009).
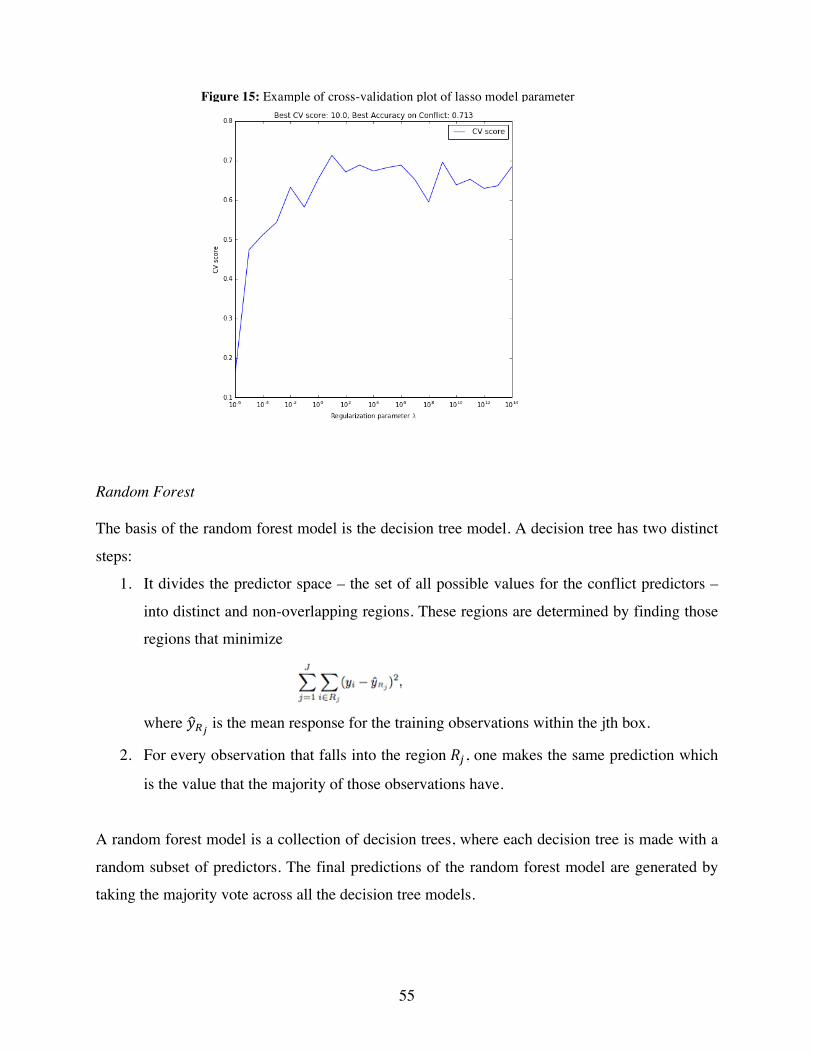
55
Random Forest The basis of the random forest model is the decision tree model. A decision tree has two distinct
steps:
1. It divides the predictor space – the set of all possible values for the conflict predictors –
into distinct and non-overlapping regions. These regions are determined by finding those
regions that minimize
where 𝑦!! is the mean response for the training observations within the jth box.
2. For every observation that falls into the region 𝑅!, one makes the same prediction which
is the value that the majority of those observations have.
A random forest model is a collection of decision trees, where each decision tree is made with a
random subset of predictors. The final predictions of the random forest model are generated by
taking the majority vote across all the decision tree models.
Figure 15: Example of cross-validation plot of lasso model parameter

56
Geographically Weighted Regression103 The geographically weighted regression model was developed to accommodate spatial
heterogeneity. It is a refinement to ordinary least squares regression. A standard GWR model can
be defined as:
where 𝛽(𝑢! , 𝑣!) indicates the vector of the location-specific parameter estimates and 𝑢! , 𝑣!
represents the geographic coordinates of location i in space. GWR uses kernel-based and
geographically weighted least squares on a point-wise basis to estimate these parameters. That is,
for a given location 𝑢!, 𝑣! , the 𝛽′𝑠 are locally computed by minimizing
where K is a kernel function, usually a symmetric probability density function and h is the
bandwidth which controls the smoothness of the estimates. K(di0/h) indicates the geographical
weight assigned locally to the values of (Xi, Yi) for location i, and depends on the
distance di0 between the given location (u0,v0) and the ith designed location (ui,vi). The weight is
determined by a kernel function that places more weight on observations closer to (u0,v0) than
those further away104.
Creating Geographically Weighted Regression (GWR) Classification Decision Boundary As GWR is not designed for classification, the predicted probability outputs are not always
interpretable, sometimes falling outside the range of 0 and 1. Furthermore, the conventional
probability threshold of 0.50. was not appropriate because for the majority of observations, the
predicted probability was lower than 0.50. Instead, I chose the decision boundary based on the
separation of the probability distributions for the different classes. The graph below illustrates
the plot of the distributions for the peaceful cells (in black) and conflict cells (in green). The
103 Fotheringham et al. (1998). 104 "Geographically Weighted Regression." GISPopSci.

57
decision (in red) was manually chosen to be the intersection between the two distributions. This
boundary was chosen to best minimize missclassification error. Admittedly, this threshold was
chosen giving equal weight to missclassification of conflict cells and missclassification of
peaceful cells.
The decision boundary selection for multiclass classification follows a similar process except
now there are three probability distributions to consider. The decision boundaries were placed at
the intersection of a distribution with its next adjacent distribution (see graph below).
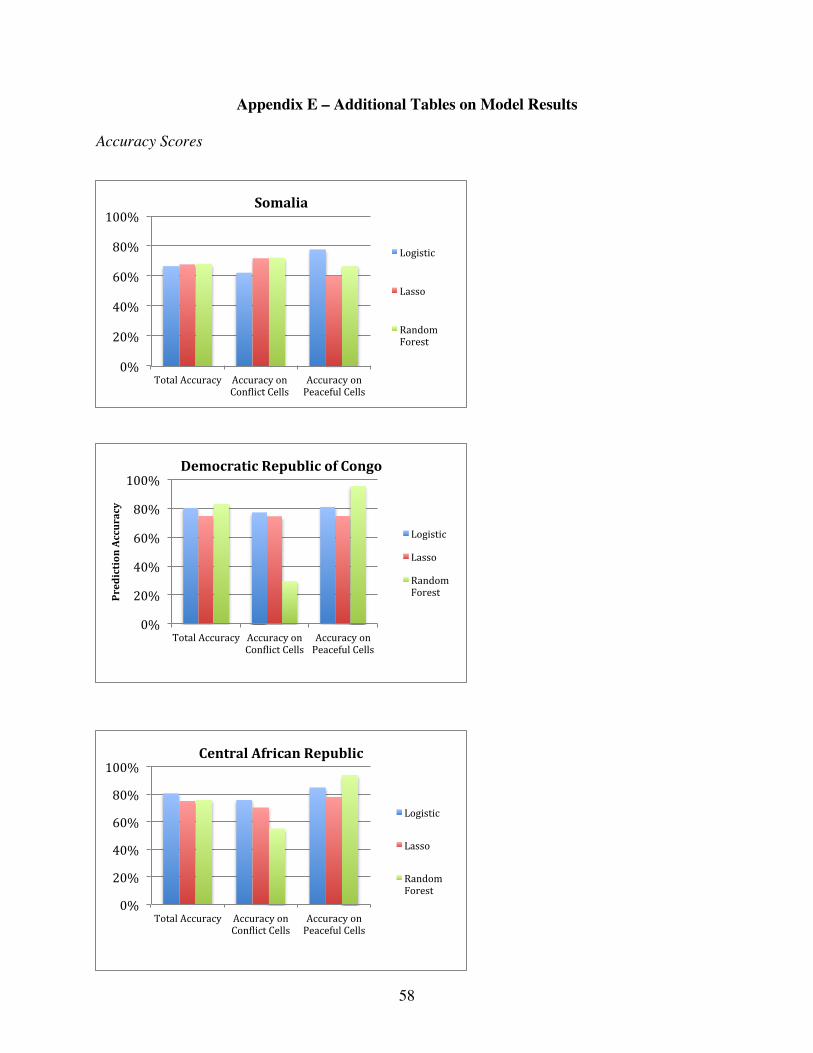
58
Appendix E – Additional Tables on Model Results Accuracy Scores
0%
20%
40%
60%
80%
100%
TotalAccuracy AccuracyonCon5lictCells
AccuracyonPeacefulCells
PredictionAccuracy
DemocraticRepublicofCongo
Logistic
Lasso
RandomForest
0%
20%
40%
60%
80%
100%
TotalAccuracy AccuracyonCon5lictCells
AccuracyonPeacefulCells
CentralAfricanRepublic
Logistic
Lasso
RandomForest
0%
20%
40%
60%
80%
100%
TotalAccuracy AccuracyonCon5lictCells
AccuracyonPeacefulCells
Somalia
Logistic
Lasso
RandomForest

59
Specificity Scores
0%
10%
20%
30%
40%
50%
60%
70%
80%
90%
100%
Logit Lasso Random Forest
GWR Logit Lasso Random Forest
GWR Logit Lasso Random Forest
GWR
Democratic Republic of Congo Central African Republic Somalia
Specificity Scores on Conflict Occurrence Prediction