improving customer service and access in a surgical … customer service and access in a surgical...
TRANSCRIPT

WORKING P A P E R
Improving Customer Service and Access in a Surgical Practice
A Case Study of a Successful Quality Improvement Intervention
Denise D. Quigley, Shelley H. Wiseman, and Donna O. Farley WR-848-AHRQ
August 2011
Prepared for the Agency for Healthcare Research and Quality
This product is part of the RAND Health working paper series. RAND working papers are intended to share researchers’ latest findings and to solicit informal peer review. They have been approved for circulation by RAND Health but have not been formally edited or peer reviewed. Unless otherwise indicated, working papers can be quoted and cited without permission of the author, provided the source is clearly referred to as a working paper. RAND’s publications do not necessarily reflect the opinions of its research clients and sponsors. RAND is a registered trademark.

i
TABLE OF CONTENTS
PAGE
FIGURES AND TABLES ii
THE CASE STUDY IN BRIEF Introduction 1
The Short Story 2
Steps 1-6 3
THE CASE STUDY IN MORE DETAIL Overview 16
The Performance Indicators 19
Structure and Staffing of the Specialty Practice 21
The Quality Improvement Process 23
Step 1: Confirm Suspected Problem by Gathering More Information 25
Step 2: Examine Data Gathered in Step 1 and Develop New Measures 29 if Needed
Step 3: Set Goals for Improvement 31
Step 4: Implement Actions for Improvement 35
Step 5: Assess Progress in Achieving Goals and Refine the Actions for 40 Improvement
Step 6: Monitor Improvements for Sustainability 45
LESSONS LEARNED THAT CAN BE APPLIED MORE BROADLY 49
APPENDIX: COURSE DESCRIPTIONS Customer Service Courses 50
Systems Training (Business Applications) Courses 53

ii
FIGURES AND TABLES
FIGURES Figure 1. Six Steps to Ongoing Quality Improvement 1
Figure 2. By End of 2010, Specialty Practice Met Two Performance Goals 15 for Operations Process Measures
Figure 3. By End of 2010, Specialty Practice Met Three Performance Goals 15 for CAHPS Patient Measures
Figure 4. Quality Improvement Timeline 24
TABLES Table 1. Measures Examined by Chief Administrative Officer and 27 Specialty Practice Manager for Quality Improvement
Table 2. Faculty Practice Group and Specialty Practice Baseline Performance 32 on Customer Service and Access Measures
Table 3. Targets and Faculty Practice Group Baseline Performance for the 34 Customer Service and Access Measures
Table 4. Summary of Patient-Communication Courses 38
Table 5. Performance on Customer Service and Access Measures (scores from 46 operations data)
Table 6. Performance on Customer Service and Access Measures (scores from 47 CAHPS data)
1
THE CASE STUDY IN BRIEF
INTRODUCTION
This report describes the efforts of one surgical specialty medical practice to improve customer service and access for its patients. The practice is affiliated with a large, urban, academic hospital and medical center. It specializes in liver disease and transplant surgery but, as a result of a merger with another specialty practice, it offers other types of surgery and care as well (for example, liver, pancreatic, and hepatobiliary surgery). Many of the patients who come to the specialty practice are quite ill and require extra patience and extra attention to ensure that their needs are met.
Complaints from patients to their doctors indicated that the specialty practice had problems with customer service and “access;” that is, the ease with which patients can contact the practice, gain entry, and use the practice’s services. The problems were confirmed by observations of patient-staff interactions, by performance data available from the medical center’s systems, and by data from the Consumer Assessment of Healthcare Providers and Systems (CAHPS®) survey.
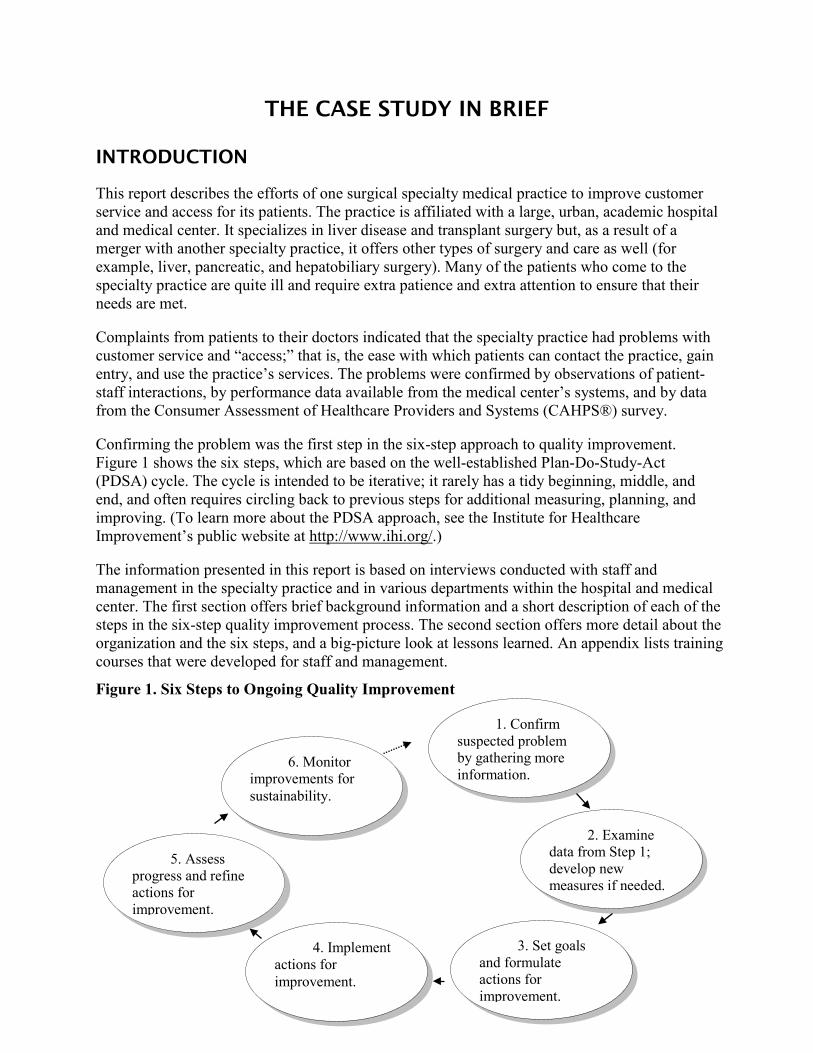
Confirming the problem was the first step in the six-step approach to quality improvement. Figure 1 shows the six steps, which are based on the well-established Plan-Do-Study-Act (PDSA) cycle. The cycle is intended to be iterative; it rarely has a tidy beginning, middle, and end, and often requires circling back to previous steps for additional measuring, planning, and improving. (To learn more about the PDSA approach, see the Institute for Healthcare Improvement’s public website at http://www.ihi.org/.)
The information presented in this report is based on interviews conducted with staff and management in the specialty practice and in various departments within the hospital and medical center. The first section offers brief background information and a short description of each of the steps in the six-step quality improvement process. The second section offers more detail about the organization and the six steps, and a big-picture look at lessons learned. An appendix lists training courses that were developed for staff and management.
Figure 1. Six Steps to Ongoing Quality Improvement
1. Confirm suspected problem by gathering more information.
2. Examine data from Step 1; develop new measures if needed.
3. Set goals and formulate actions for improvement.
4. Implement actions for improvement.
5. Assess progress and refine actions for improvement.
6. Monitor improvements for sustainability.
2
THE SHORT STORY
Who? A medical practice specializing in liver disease and general surgery and affiliated with a large, urban, academic hospital and medical center.
What? The specialty practice implemented a successful quality improvement intervention to improve customer service and make it easier for patients to access services. It worked closely with the “faculty practice group” (FPG), an association of physicians at the hospital and the administrative organization that has responsibility for all of the ambulatory practices including this specialty practice and several other hospital-based and outpatient specialty practices.
Why? Problems with customer service and access were revealed through complaints from patients to their doctors, observations of patient-staff interactions by the practice manager, operations data generated by medical center systems, and patient experience data from the Clinician Group Consumer Assessment of Healthcare Providers and Systems (CAHPS®) survey. These problems undermined the quality of patient care and the ability of the practice to remain competitive.
When? The specialty practice first recognized the need for improvement in 2006. An informal, multi-pronged quality improvement effort began in mid-2006 with FPG assistance; the hospital provided resources starting in 2007. The first performance improvements were in 2007; other improvements became evident in 2008-2010. Quality improvement activities are ongoing.
Where? The specialty practice focused on customer service and access within the specialty practice office, which houses several clinics all under one roof.
How? The specialty practice and FPG tackled the problems informally on several fronts over time, but they modeled their efforts on the six-step quality improvement process. Additional financial resources were obtained through hospital leadership since the specialty practice is a hospital-based practice.
So What? Customer service and access at the specialty practice improved slowly but steadily. Practice management learned the following lessons during the quality improvement effort:
• It is essential to use operations and customer experience data to identify problems, make a case to management for resources to support improvements, and monitor progress.
• Leaders and key decision makers can accelerate or stymie improvement efforts. • When implementing quality improvement actions, a variety of changes in management
structure and staffing may be required. • Organizations should expect to make periodic mid-course corrections to their quality
improvement goals and strategies as they learn from earlier strategies and as circumstances inside and outside the organization change.

3
1. Confirm problem
STEP 1: CONFIRM SUSPECTED PROBLEM BY GATHERING MORE INFORMATION
What Did the Specialty Practice Do? The specialty practice manager knew that the practice had problems with customer service and access, based on observations of staff behaviors, and patients’ complaints voiced to their doctors and to specialty practice staff. To confirm the problem, the manager queried the medical center’s systems for performance data. For example, the:
• Telephone system provided the call-abandonment rate; that is, the rate at which patients hung up before their calls could be answered
• Appointment scheduling system provided the physician “bump” rate; that is, the rate at which physicians canceled patient appointments and rescheduled, and patient cancellation and “no-show” rates; that is, the rates at which patients cancelled or didn’t show up for a scheduled appointment
The practice manager also voiced concern to his/her immediate boss about customer service in the practice. Together, they:
• Reviewed the operations data (described above) • Examined the first CAHPS patient experience survey results. • Confirmed that the problem was in two areas – customer service and access – and
decided that the practice should focus improvements on both. • Realized that they needed additional information to better evaluate the problem
and to develop a targeted quality improvement plan. • Called in a consultant from FPG to conduct an informal evaluation of the
specialty practice.
The practice manager also examined CAHPS patient experience data. However, in the early days, data were not yet available for multiple time periods or for other practices, so the manager could not assess baseline trends in the practice’s performance on customer service and access measures or comparisons benchmarked against the FPG average.
In the second iteration of this step in late 2008, when progress towards meeting the established performance goals was slow, the practice manager decided to collect additional data to understand better the reasons underlying the doctor and patient complaints. The practice manager recorded patient complaints and studied the flow of patients through the clinics within the practice to help determine how to intervene in ways that would produce better results.

4
What Did They Find Out?
In the early stages of this quality improvement effort, operations data and CAHPS patient experience data, as well as the FPG consultant’s informal observations confirmed that there were problems with customer service and access. Patients often abandoned phone calls. They had to wait a long time to get appointments and they waited a long time in the waiting room. Doctors frequently bumped patients. Office staff were observed being rude to patients and to each other. In some cases, patients had to wait too long for a doctor to call back with lab results or write a prescription. Some patients complained that, when they needed a formal referral to a doctor outside the specialty practice or authorization from an insurance company for a procedure or referral, they had to wait too long. The consultant also observed that the specialty practice was not structured properly—it did not have the support staff it needed to run a large, busy, and complicated specialty practice whose patients tended to be very ill.
The specialty practice was undergoing a merger with another practice and the consolidation of both practices into one office space. It is likely that some of the problems identified were effects of culture differences and process interruptions as staff learned new ways of doing things and how to work together.
Take-Away Lessons
• Gather and use operations data and CAHPS patient experience data to measure performance, identify problem areas, make a case for resources to support improvements, and monitor improvement. Each data source contributes unique information about access and customer service.
• Use all the data available (for example, operations data, CAHPS data, patient experience data, and audit data) to assess performance.
• Bring in a new pair of eyes or an entirely new set of people to examine problems and explore ways of fixing them.
• If performance does not improve, go back to the drawing board and gather more information about the processes relevant to the identified problems.
• Continue to gather and examine data to monitor issues and improvements.

5
2. Select measures.
STEP 2: EXAMINE DATA GATHERED IN STEP 1 AND DEVELOP NEW MEASURES AS NEEDED
What Did the Specialty Practice Do?
This data analysis step was repeated twice, at the start of the quality improvement work and again three years later. Performance data for 2007 and 2008 did not show any substantial improvements, so the specialty practice manager along with the FPG re-examined the data in 2009 for more information. In addition, the original practice manager accepted a new job during the first iteration of this step and a new manager took over the practice.
• Based on the initial examination of relevant operations data in 2005 and 2006, the specialty practice manager decided to track the following process measures on an ongoing basis:
o Call-abandonment rate
o Physician bump rate
o Patient cancellation and no-show rates
o New patient rate
• The specialty practice manager decided to track the following in the CAHPS survey data:
o Two items on courteousness and helpfulness of office staff
o Five items on ability of patients to get appointments and health care when needed
o An overall rating of the doctor with an item asking whether patients would recommend their doctors to family and friends
• The practice used the initial data to establish baseline performance on all metrics.
• The new specialty practice manager began recording patient complaints and writing detailed descriptions of the situations in which they arose. He/she categorized the complaints and studied how long it took for patients to be seen by a physician once they arrived at the practice. He/she shared these results with physicians and office staff.
6
What Were the Results?
The practice decided that the customer service and access issues were stemming from staffing and training. Those issues included not enough staff to receive patients at the front desk, and inadequate training related to handling difficult patients, etc. The practice obtained some additional resources from the hospital to hire more staff. In the second iteration of this step, the specialty practice manager and FPG requested more financial resources to add more staff. it also continued to monitor operations metrics and patient experience measures. The new specialty practice manager implemented procedures such as frequent observation of staff, immediate feedback and correction of observed problems, and monthly reporting to upper management.
Take-Away Lessons
• Gather and examine data as an ongoing assessment process.
• To be effective, an improvement strategy should be grounded in data that provide a full picture of which specific processes need to be improved and that implementers can use to assess how well their quality improvement interventions are achieving goals.
• Establish baseline performance for all metrics using data over at least two time periods.

7
3. Goals and actions.
STEP 3: SET GOALS AND FORMULATE ACTIONS FOR IMPROVEMENT
What Did the FPG Do?
The FPG developed a new tool for monitoring and reporting the performance of all ambulatory practices, including the specialty practice--a “scorecard” that reported scores for all the operations and CAHPS metrics for the practices, their departments, and the overall FPG.
• Compared each practice’s performance to that of its department—that is, to the department of surgery or department of medicine as a whole—and to the FPG average.
• Established performance goals for each of the metrics on the scorecard.
• Shared data with individuals in other organizations within the hospital and medical center and persuaded some of them to become involved in the quality improvement work.
What Did the Specialty Practice Do? To address the identified specialty practices issues, the specialty practice manager took the following actions in preparation for implementing improvements:
• Established a quality improvement team. The specialty practice manager and some individuals in FPG had been conducting quality improvement activities for awhile. Over time, other individuals, from other parts of the hospital and medical center, became involved.
• Reviewed and decided against using the training available to staff via the Human Resources department and instead participated in new effort to develop and test new training courses being offered by the FPG that were interactive and hands-on.
• In the first iteration, the action plan focused on:
o Hiring more staff using the additional resources provided by the hospital.
o Sending all staff through the new training courses developed by FPG. They included customer service training courses and the appointment scheduling and encounter registration courses.
o Implementing specialty-specific guidelines and protocols with regard to any contact with patients.
• In the second iteration, the action plan was modified to focus on a second round of hiring more staff, communicating expectations clearly to staff, holding staff accountable for their customer service behavior, and rewarding staff for their positive interactions with patients with pizza parties, etc.
8
What Were the Results?
With regularly available data, the quality improvement team was more informed and could more easily track problems. They had goals and targets to
meet and had a plan they felt would get them there.
The manager focused on structuring the work schedules so that all office staff could attend the training courses. He/she continued to observe staff daily and built in more rewards (such as the pizza parties mentioned earlier) and praise for good interactions. Meetings were filled with more conversation about appropriate staff-patient interaction.
Staff who attended the courses reported that the courses were very helpful and that the teaching scenarios were relevant to real situations in the practice. The courses taught staff how to say things differently and do things better to make patients more comfortable and they offered specific guidelines on how to solve problems.
The specialty practice manager noticed a reduction in patient complaints and problems sent to him/her from staff. The office staff, as observed by the specialty practice manager, had a better perspective on how to treat patients, better knowledge about the patients’ experience of care at the practice, and knowledge of options for communicating with patients. Anecdotally, the courses seemed to help build better relationships between the staff and patients.
Take-Away Lessons • Develop performance goals and targets for the metrics that are
established, designed to focus on what is important to the patient and to improve performance over baseline levels.
• Use metrics, including comparisons of performance to other practices within departments and the organization as a whole, to guide and inform decisions on priorities and allocation of resources.
• Plan organizational change carefully. Build in adequate resources and open communication with staff.

9
4. Implement actions.
STEP 4: IMPLEMENT ACTIONS FOR IMPROVEMENT
What Did the Specialty Practice Do?
In 2007, the specialty practice implemented the set of actions developed in Step 3.
• Trained staff to improve interactions with patients.
• Included training to help staff build skills on business administration functions. This training was designed to help staff learn the systems that connect to physician calendars and set appointments, generate needed insurance and billing paperwork, etc., for better response to patient needs.
• Motivated staff to attend training; eventually made it mandatory.
• Arranged work schedules so that staff could attend training.
• Offered rewards such as gold stars, gift cards, and pizza parties to staff who attended training.
• Used the training courses as a disciplinary tool for staff who needed particular help with their skills (either for the first time or as a refresher).
• Added additional courses after initial rollout.
• Worked with physicians to develop protocols for contacts with patients; for example, whether to report lab results in person or by phone or email, and scripts to guide staff through difficult communications.
• Added patient communication as a topic to every staff meeting.
• Implemented quick, daily, morning staff meetings.
• Became more systematic and consistent about responding to patient complaints.
What Were the Results?
Most staff welcomed the training and reported that it was very helpful to them. Management observed improvement in their interactions with
patients and with each other. Doctors reported fewer complaints from patients. The practice manager also noticed a reduction in patient complaints and problems sent to him/her from staff. The office staff, as observed by the specialty practice manager, had a better perspective on how to treat patients, better knowledge about the patients’ experience of care at the practice, and knowledge of options for communicating with
10
patients. Anecdotally, the courses were reported to help build better relationships between the staff and patients. However, the improvements did not become visible in the operations data or in the CAHPS patient experience data until 18 months to two years after these actions were implemented.
By the middle of 2008, the specialty practice manager had implemented the main components of the initial improvement strategy. The expectation was that the increased focus on customer service and staff communication would lead to more positive feedback from patients. There had been minor setbacks in the initial timeline due to the lack of resources to add additional staff. However, the continued emphasis on managing work flow processes and improving the interactions of staff with patients based on the tools from the training courses produced immediate results in that the number of patient complaints dropped as did complaints from physicians. However, there were still a substantial number of complaints from patients and physicians.
Take-Away Lessons
• Don’t assume that staff has the skills and knowledge necessary for improvement. Offer them training for what they need to know.
• Make training mandatory but reward staff for attendance and for integrating lessons of training into day-to-day work life.
• Communicate openly and often about expectations and progress.
• Attend to the mindset of the organization and staff. Getting all staff “on-board” is essential for changing performance.
• Persevere even when progress isn’t immediately apparent.
11
5. Assess and refine.
STEP 5: ASSESS PROGRESS AND REFINE ACTIONS FOR IMPROVEMENT
What Did the Specialty Practice Do? Based on more in-depth data analyses, the practice manager and other members of the quality improvement team realized that the poor customer service was a product of management and workflow problems and a few poor-performing individuals. The practice manager also found that current staff positions needed to be up-graded. The workforce was not at a high enough level of licensure and training to deal with the type of clinical care that the specialty practice required. This led to the hiring of a licensed RN to oversee day-to-day operations in the practice, and a new minimum requirement for LVN licensure for back-office staff positions.
Having achieved weak results from the first set of improvement actions, the quality improvement team created a new, multi-phase plan for improving staffing. In each phase of the “now, better, best” plan, they took steps to beef up training, model appropriate behaviors, hire and fire as needed, introduce new staff positions, improve supervision within the clinics, incentivize staff, and build in better manager-staff communication.
The “now” plan:
• Compared metrics on scorecard to targets; discussed scores with others in FPG, hospital, and medical center.
• Scrutinized patient complaints more closely. Wrote a report on each complaint and related situation. Evaluated complaints as a whole looking for patterns and opportunities for improvement.
• Shared findings with staff and others in upper management with an interest in the specialty practice.
• Discussed successes and offered praise in staff meetings.
• Asked the hospital for funds for the “better” plan.
The “better” plan:
• Gave staff authority to make decisions about scheduling appointments and responding to patient complaints with the guidance of protocols.
• Gave Holiday bonuses to all specialty practice staff, not just those affiliated with the department of surgery. (Some staff were affiliated with the department of medicine.)
• Provided a “service recovery toolkit” to staff to enable them to give parking validations, meal vouchers, and other perks to patients whose experience at the clinic was compromised by long wait times, early-morning appointments, the need to fast before certain procedures, etc.

12
• Introduced the position of “nurse manager” and asked the hospital for the funds for this key element of the “best” plan – that is, to hire an RN to fill the position and oversee the day-to-day operations of the specialty practice.
The “best” plan:
• Hired an RN to oversee the day-to-day operations of the specialty practice.
• Instituted a new minimum requirement for LVN licensure for back-office staff positions and hired a few new staff: two LVNs and one administrative assistant (level 3).
• Added more front desk staff to reduce the burden and provide consistency of service and information; there had been one person at the front doing the job of three with others pitching in when they could.
• Appointed a lead person in each of the main clinic areas to be responsible for the area, answer questions, and, when needed, bump questions and problems to the specialty practice manager. This gave staff a sense of ownership within their individual areas.
• Increased accountability by talking to the staff about the expectations that the specialty practice manager had for them in terms of patient care for each of their jobs. The specialty practice manager borrowed guidelines and scripts being used in the hospital related to patient introduction and patient interaction.
• Utilized newly available training for staff: o Sent all staff to encounter registration and appointment scheduling courses
taught by the FPG
o Sent select staff to the physician maintenance scheduling course (to enable these staff to access physician schedules and change them). These courses were taught by the FPG.
o Sent the five authorization staff to a class called Access Express which was offered by the medical center as part of its training on its financial systems, especially for working with HMO patients.
What Were the Results?
The data from the time study, the access metrics, the patient experience survey, and the tracking of patient and doctor complaints were the tools needed to document for upper management the problems that were already apparent to staff “on the ground” in the practice and to lay out the need for the “now,” “better,” and “best” plan. Overall, the hospital committed $1 million for hiring and upgrading staff.
With more staff and overt morale boosters, the flow of patients through the clinics within the practice improved, thus improving patient access to the practice’s services, and customer service. By October 2010, the practice had met four of its seven access and

13
customer service targets and made significant, incremental improvements in the other three measures.
Take-Away Lessons
• Be patient and remain persistent about focusing and refocusing efforts to eventually see widespread improvement.. Some actions may show positive results immediately; others may take months or years; and others may not work at all.
• Tackle problems on several fronts. Multiple data sources often are needed to tell the full story. Likewise, solutions can come from a combination of several large and small initiatives.
• Put extra effort into communication with all interested and affected parties. Communicate in a variety of settings and formats, and expect that communication on an ongoing basis will be important for success.
• Focus on getting the right staff for each position in terms of knowledge, skills, and training.
• Establish procedures for consistency in managing staff; consistency often is central to achieving sustainable performance improvements.
• Regularly report goals and progress to staff and leadership.

14
6. Monitor. STEP 6: MONITOR
IMPROVEMENTS FOR
SUSTAINABILITY
What Did the Specialty Practice Do? Continued to maintain newly established practices and to monitor CAHPS and other metrics using the scorecard.
• Maintained a commitment to reaching targets. Monitoring confirmed that they were on track for improvement and for reaching targets.
• Continued practices established in earlier steps to monitor and train staff as needed.
What Were the Results?
Interactions between staff and patients improved considerably over what they had been, and patient complaints decreased. The call abandonment rate
improved by 2009 and continued to improve through October 2011. Several operational measures did not improve: the rate at which physicians canceled and
rescheduled appointments, the percent of new patients being accepted by a doctor, and the rate at which patients did not show up for appointments. Note that for these operational measures, the lower numbers indicate better performance, except for new patient rate where higher numbers indicate better performance. However, the targets were reached for two of the three CAHPS patient experience measures - the overall patient access composite and the office staff composite – and incremental improvement was achieved in the overall CAHPS composite patient access score. Figures 2 and 3 on the next page illustrate the improvement trends as measured by operations data and CAHPS data, respectively. The “new patient rate” in Figure 2 is the percent of “new patients” being seen by the doctors in the practice. The “overall patient access” score in Figure 3 is 0-100 composite score of the five CAHPS access items. For the operations data, a lowering of the percentages is an improvement, except for new patient rate where higher numbers indicate better performance; for the CAHPS data, an increase in the 0-
100 possible score is an improvement.
Take-Away Lessons
• Continue new strategies for effecting change; for example, observing, training, and rewarding staff.
• Continuously monitor CAHPS scores and other performance indicators to make sure improved performance is maintained and any lapses are identified and managed early.
• Persevere with improvement strategies and adjustment to them—metrics may improve in small increments over time.

15
Figure 2. By End of 2010, Specialty Practice Met Two Performance Goals for Operations Process Measures
Note: For the operational measures, lower numbers indicate better performance, except for new patient rate where higher numbers indicate better performance
Figure 3. By End of 2010, Specialty Practice Met Three Performance Goals for CAHPS Patient Experience Measures

16
THE CASE STUDY IN MORE DETAIL
OVERVIEW
The specialty practice that is the subject of this case study is one of several specialty practices affiliated with a large, urban, acute-care, academic medical center. Other affiliates are a hospital and a “faculty practice group” (FPG); that is, a group of physicians who work as faculty at the university, practice medicine within the medical center’s clinics and practices, and belong to an administrative arm that has responsibility for multiple, hospital-based and outpatient specialty practices. The specialty practice operates an ambulatory clinic that specializes in liver disease and related conditions such as hepatitis and provides both treatment and liver transplant surgery. The specialty practice is also a general surgery clinic, and about 45 percent of the 23,000 patients who come to the practice each year come for other types of surgery.
Merger of Two Practices. The mix of services offered by the specialty practice—specialized treatment for liver disease and general surgery—is relatively new. In mid 2005, the specialty practice that was dedicated to the treatment of liver disease was joined in its space by another of the hospital’s specialty practices, General Surgery (reportedly to save the cost of leasing its own space). As a result, the two practices and their clinics were merged into one. At the same time, a few non-surgeon physicians and staff from the medical center’s department of medicine also began to work within the specialty practice. The practice manager from the former General Surgery practice did not come along with its physicians and staff to the new, merged specialty practice, so the practice manager of the liver specialty practice became responsible for all the doctors and staff now housed in one place.
The merging of the two practices and the addition of physicians and staff from the department of medicine had a big effect on the culture of the specialty practice, the morale of its staff, the nature of its customer service, and the ability of the specialty practice manager to manage the staff and practice effectively. It was evident to the practice manager before the merger that the specialty practice would need more staff to answer phones, work at the front desk, coordinate referrals, and other office functions.
The hospital provided the majority of the funding for the specialty practice and made the decision to merge the two practices. However, in the early life of the specialty practice (2005 and 2006), hospital management took a hands-off approach. The practice manager knew that it would be even more difficult to obtain additional resources after the merger was complete but did not have control over decisions about resources or staffing. The manager thought that time might help solve the problems as the staff merged and learned to work together to manage the larger practice.
Identification of Performance Problems. As early as 2005, the manager of the specialty practice knew that the practice had a problem with customer service--how courteously staff people interact with patients--and with access--whether patients have ready access to care through the practice. It was evident after the merger that the customer service problems were exacerbated by the merger.

17
Another factor that contributed to the customer service problems was that the practice serves many patients who are very ill and therefore need timely and sophisticated care as well as understanding from the staff. However, it was reported that the liver clinic was run as a sort of “cattle call.” Patients were asked to come in “at the crack of dawn” for lab work, having followed instructions to not eat or drink, then they “sat around for sometimes several hours” before they were called for their appointments. Their doctors were understandably concerned for their comfort and safety.
Most of the patient complaints came from liver patients rather than general surgery patients, and the volume of general surgery patients was increasing, which might indicate that there was not a problem on that side of the practice. However, general surgery patients have a choice of providers in the surrounding urban area and will potentially go elsewhere if the practice’s customer service is poor. For many reasons, then, the leadership of the specialty practice wanted to correct the problems with customer service.
Health care organizations are motivated to pay attention to customer service partly because of the potential for losing market share if patients are dissatisfied and take their business elsewhere. This concern is less of a factor for the specialty practice because its practice provides highly specialized, complex care that is not widely available and it has a reputation for being among the best in the world. Presumably, patients would come to the practice for its high quality medical care regardless of their experience with non-medical staff. However, improving customer service was important to the specialty practice’s leadership and physicians. Customer service problems such as long wait times to get an appointment or poor communication from staff could jeopardize patient comfort and safety, with potential effects on patient outcomes and the specialty practice’s reputation and liability, especially with those patients who needed or who had received liver transplants.
Documenting and Acting on the Problems. Knowledge of performance problems was based mostly on observations of staff behavior but the practice manager and other leaders also heard from physicians that patients complained about the practice. Operations data were available to the practice manager in 2005 and 2006, but the practice manager would have had to query the medical center operations systems and seek out the data; the practice did not have a culture that relied on data for measuring, tracking, benchmarking, and improving performance.
In January 2006, the FPG of which this practice is a member began to participate in the annual, nationwide Consumer Assessment of Healthcare Providers and Systems (CAHPS®) survey, specifically the Clinician and Group CAHPS survey. Its aim was to collect data from patients about their experiences with their doctors so it could compare data at several levels--doctor, practice, and overall practice group. In May 2006, FPG administered the first Clinician and Group CAHPS survey to patients of all of its primary care and specialty physicians with a reference period of 12 months, which referred to the patient visits from May 2005 through April 2006.
When FPG disseminated the CAHPS report in October 2006, the practice had the opportunity to compare its performance with that of other ambulatory practices within FPG. The first CAHPS data indicated a problem on the items related to customer service and access. For this case study, the CAHPS data from the first three survey

18
administrations are considered baseline, with visit dates of May 2005 to April 2006, October 2005 to August 2006 and March 2006 to February 2007.
Leaders at FPG mobilized in 2007 to fix the identified problems in the medical group and within the specialty practice, and to gain resource support from the hospital. The quality improvement efforts described in this case study began in February 2007. Implementation of intervention strategies took place beginning in July 2007.

19
THE PERFORMANCE INDICATORS
Several administrative data sources as well as the CAHPS survey were used to get patient-reported experience of care information. Several of the qualitative and quantitative measures documented that the specialty practice had a problem with customer service and access. For example, the specialty practice was able to track call abandonment rates through statistics collected by the telephone system and reported by FPG quarterly. A call is “abandoned” when a patient calls the practice and either hangs up before the call can be answered or is put in a queue and hangs up before a staff person answers the call. The specialty practice also knows the rates at which 1) patients are “bumped;” that is, appointments are canceled (and usually rescheduled) by physicians based on changes in the physicians’ schedules; and 2) patients cancel appointments or don’t show up for an existing appointment and don’t call to cancel. The CAHPS survey indicated, for example, whether patients felt that staff members were helpful or courteous, whether they got appointments as soon as they thought necessary, and whether they saw a doctor within 15 minutes of their appointment times.
The federal Agency for Healthcare Research and Quality (AHRQ) first launched the Consumer Assessment of Healthcare Providers and Systems Study (CAHPS) program in October. Over time, CAHPS has expanded to address a range of health care services and meet the various needs of health care consumers, purchasers, health plans, providers, and policymakers.
The Clinician and Group CAHPS survey includes items assessing access; doctor communication; courteousness and helpfulness of office staff; and coordination of care. For all of these items, the response scale is: Never; Sometimes; Usually; Always. The survey also contains three items on patient background that are used for case-mix adjustment (self-rated health status; self-rated mental health status; gender; education; and age) (O’Malley et al. 2005; Elliott and Zaslavsky, et al. 2009). This survey also included a “would recommend doctor to family and friends” item with a five-point scale (Definitely yes; Probably yes; Not sure; Probably not; Definitely not) in the first three administrations and a four-point scale (Definitely yes; Somewhat yes; Somewhat no; Definitely no) in the last two administrations.
FPG administered the Clinician and Group CAHPS survey for the first time in May 2006 and again in September 2006, March 2007, March 2008, February 2009, and May 2010. Patients in the survey sample are identified from the medical group’s professional billing system and asked about their experience of care with a specified doctor with whom they had at least one visit in the last 12 months. The survey instrument confirms a patient’s eligibility to participate by including the doctor’s name and asking the respondent to affirm that he or she had one or more visit with the doctor in the past year. If the patient does not confirm a visit with the doctor, the survey is excluded from the analysis.
FPG reports the CAHPS results for individual physicians, specialty practices, departments, and FPG as a whole. Specialty practice-level performance scores are made available within the FPG in an effort to support internal transparency and motivate

20
quality improvement efforts. Chief administrative officers and department chair persons receive specialty practice-level and department-level reports as well as individual physician-level reports. Specialty practice managers receive specialty practice-level reports.
Since 2006, the FPG has sent individual physicians a hard-copy report via regular mail that includes the individual physician’s scores compared to scores from the previous baseline period, practice-level averages, and overall FPG CAHPS scores. Each department receives scores for the department, practice, and individual physicians with comparisons to the previous baseline period. Since 2010, the FPG has had an on-line interactive tool that allows for “real time” reporting of scores for individual physicians, and for the departments and practices.
21
STRUCTURE AND STAFFING OF THE SPECIALTY PRACTICE
The details about the structure of the organization in this case study provide insight into
how the problems occurred and how they were finally recognized and addressed in the
quality improvement effort. The specialty practice in this case study sits within an
organizational structure known as the medical center that includes the hospital, FPG, and
18 departments and divisions. The FPG is an association of roughly 500 physicians that
have responsibility for the 73 ambulatory practices of which 54 are specialty practices
and 19 are primary care practices.
Within the FPG, the departments provide direct support and funding to the
specialty practices and therefore have influence over the practices. Both the department
of medicine and the department of surgery oversee the case study specialty practice, with
the specialty practice manager’s direct administrative superior being housed in the
department of surgery.
This specialty practice operates several clinics. Doctors who work within the
specialty practice are affiliated with the FPG and either the department of medicine or the
department of surgery. The original surgery practice and the new merged practice
maintained the same upper level management within the departments of medicine and
surgery and at the hospital before and after the merger. One practice manager became the
on-site manager for all of the staff from the two merged practices. The specialty practice
had three different managers during the period of interest for this case study. The last of
the three was still managing the specialty practice as of January 2011. Staff at the
specialty practice itself included:
Managers
Specialty practice manager
Nurse manager
Front office staff
Front desk staff
Call-center staff
Administrative staff
Back office staff
Transplant coordinators
Care coordinators
Licensed vocational nurses (LVNs)
Registered nurses (RNs)
Nurse practitioners
Medical assistants

22
Administrative staff
Approximately 20 physicians, who go in and out of the practice to treat
patients, but they are affiliated with the hospital, not the specialty
practice, and were largely uninvolved with the quality improvement
effort
After the merger of the two practices, all front desk staff supported everything; for
example, all of the front desk staff checked patients into the several clinics, now as one
practice. A separate call center of four or five people scheduled appointments. Liver
transplant coordinators took care of everything related to transplant surgery, including
scheduling appointments, helping patients obtain necessary medications, and advocating
on patients’ behalf for financial help. Changes in staffing occurred during the quality
improvement process and, in fact, helped facilitate the implementation of the quality
improvement strategies.

23
THE QUALITY IMPROVEMENT PROCESS
The overall quality improvement process used to address customer service and
access issues is summarized here. This summary provides a framework for the more
detailed description of actions taken in each of the six steps of the quality improvement
process.
Organizing for Quality Improvement
The people who led the quality improvement effort were in various positions at the
specialty practice and its clinics, the FPG, the department of medicine, the department of
surgery, and the hospital. They included:
Specialty practice manager
Specialty practice associate director of operations and clinical services
Liver clinic administrative nurse for transplant services
Faculty practice group chief administrative officer
Faculty practice group director of ambulatory services
Faculty practice group associate training director
Department of surgery chief administrative officer
Hospital director of administrative operations and professional services/director of
emergency and trauma services
Medical center chief operating officer
The timeline in Figure 4 illustrates how the specialty practice implemented the six
steps in the Plan-Do-Study-Act cycle over time.

24
Figure 4. Quality Improvement Timeline
25
STEP 1: CONFIRM SUSPECTED PROBLEM BY GATHERING
MORE INFORMATION
The specialty practice manager knew through his/her own observations that the
specialty practice had problems with customer service as early as 2006. He/she reported
that front desk staff and the staff who worked behind the scenes were “misbehaving.”
They were not helpful or courteous. They didn’t get along with each other or with the
doctors. The practice’s patients complained to their physicians and to office staff about
the practice’s customer service. Patients had to wait a long time to get an appointment at
the practice. They waited a long time in the waiting room once they arrived for their
appointments. Doctors frequently canceled and rescheduled appointments. Office staff
were hurried, brusque, rude, impatient, and unhelpful.
The merging of the two practices that had occurred in mid-2005 exacerbated these
issues. There wasn’t enough or the right kind of physical space in the merged location.
Staff were asked to do work they hadn’t done before and for which they had no training.
The merging specialty practice, general surgery, had its own group of doctors that came
in and out of the practice just as the liver doctors did. It was a challenge for specialty
practice staff to juggle the doctors’ schedules, communicate with patients as to when their
doctors were available, and make appointments.
General surgery staff were not happy about moving and especially about moving in
with another specialty practice. Staff who hadn’t previously worked at the front desk
complained about having to answer phones in the new, merged specialty practice. Staff
from the more specialized practice questioned why they had to care for general surgery
patients.
A contributing factor was that the liver clinic serves a population of patients who
are very ill and don’t feel well, and therefore need timely and sophisticated care as well
as help and understanding from staff. Many patients have some form of cancer and many
are understandably upset if, for example, there is a delay in their care. Some patients can
become abusive, and staff need tact in dealing with them.
Step 1 activities began in October 2006 when the specialty practice manager and
management from the FPG reviewed the first CAHPS report. They also had anecdotal
reports of problems, and decided to pull together other information on the performance of
the specialty practice.
Management gathered data for relevant metrics from as many sources as possible.
As shown in the top portion of Table 1, administrative data were available on:
New patient rate. The percentage of “new patients” (total new patients
divided by Total encounters) in a given practice; “new patient” is defined as
those that have not been seen at the specific practice in the last 3 years.
They may be established within the health system but the visit is billed
using a new visit or new consult E&M code. Encounters are defined as a
unique count based on a combination of patient id, provider id, place of
service, facility id, and date of service.
26
Call-abandonment rate. The call abandonment rate; that is, calls in which a
patient calls the practice and either hangs up before the call can be answered
or is put in a queue and hangs up before a staff person answers the call.
The physician “bump” rate; that is, patient appointments canceled (and
usually rescheduled) by physicians based on changes in the physicians’
schedules.
Patient cancellation rate or “no show” rate; that is, appointments for
which patients don’t show up without having called to cancel. The fact that
this rate is high may be a by-product of the high bump rate or lack of
access.
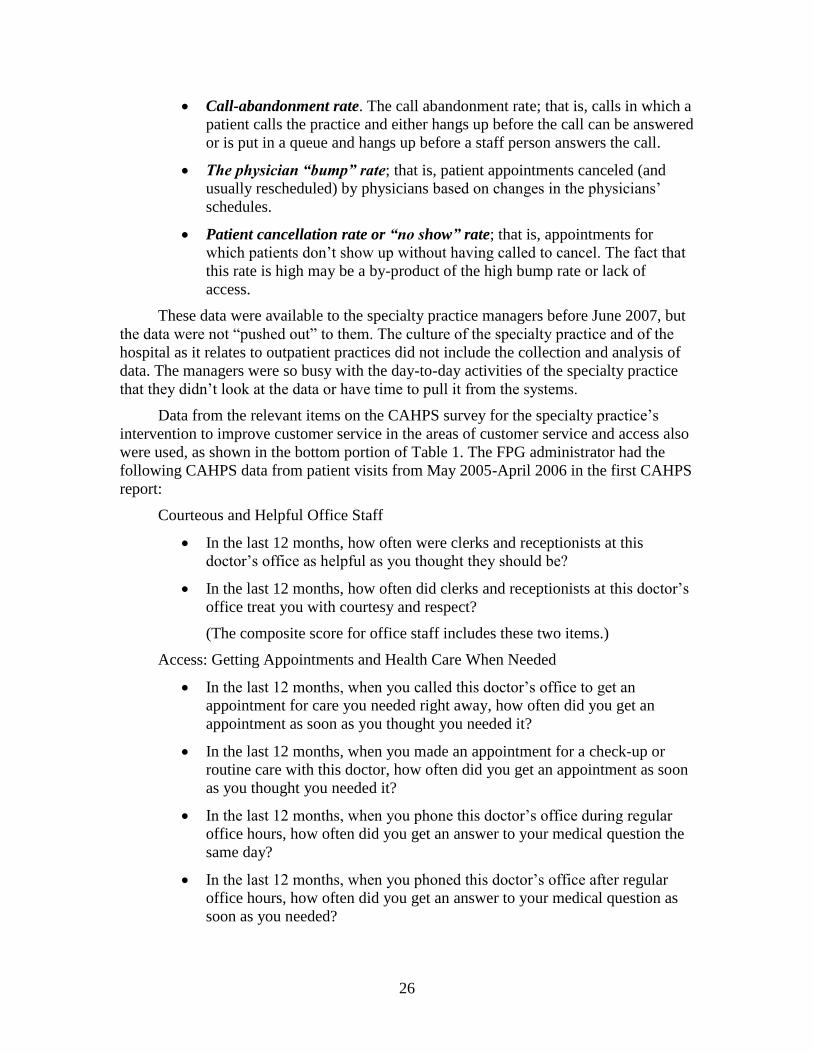
These data were available to the specialty practice managers before June 2007, but
the data were not “pushed out” to them. The culture of the specialty practice and of the
hospital as it relates to outpatient practices did not include the collection and analysis of
data. The managers were so busy with the day-to-day activities of the specialty practice
that they didn’t look at the data or have time to pull it from the systems.
Data from the relevant items on the CAHPS survey for the specialty practice’s
intervention to improve customer service in the areas of customer service and access also
were used, as shown in the bottom portion of Table 1. The FPG administrator had the
following CAHPS data from patient visits from May 2005-April 2006 in the first CAHPS
report:
Courteous and Helpful Office Staff
In the last 12 months, how often were clerks and receptionists at this
doctor’s office as helpful as you thought they should be?
In the last 12 months, how often did clerks and receptionists at this doctor’s
office treat you with courtesy and respect?
(The composite score for office staff includes these two items.)
Access: Getting Appointments and Health Care When Needed
In the last 12 months, when you called this doctor’s office to get an
appointment for care you needed right away, how often did you get an
appointment as soon as you thought you needed it?
In the last 12 months, when you made an appointment for a check-up or
routine care with this doctor, how often did you get an appointment as soon
as you thought you needed it?
In the last 12 months, when you phone this doctor’s office during regular
office hours, how often did you get an answer to your medical question the
same day?
In the last 12 months, when you phoned this doctor’s office after regular
office hours, how often did you get an answer to your medical question as
soon as you needed?

27
In the last 12 months, how often did you see this doctor within 15 minutes
of your appointment time?
(The composite score for access includes these five items.)
Overall Rating of the Doctor
Using any number from 0 to 10, where 0 is the worst doctor possible and 10
is the best doctor possible, what number would you use to rate this doctor?
Would you recommend this doctor to your family and friends?
In addition to the data that were collected on the specialty practice, management in
the department of surgery had began to hear feedback from the specialty practice
physicians, who heard complaints from their patients about customer service and access
at the clinics.
By mid-2006, when Step 1 quality improvement activities began, the FPG had
operations data, and one CAHPS report with the Consumer Assessment of Healthcare
Providers and Systems (CAHPS) survey data – the 2006 CAHPS report. With only that
one data point, however, the patient experience data were seen as informational and not
as instructive for performance improvement, and it was not clear whether they indicated
problems. So the chief administrative officer and FPG relied more on the operations data
to determine their first steps of action.
Table 1. Measures Examined by Chief Administrative Officer and Specialty Practice
Manager for Quality Improvement
Operational Measure
1. Patient complaints
2. Observations by manager
3. No show rate 5. Call abandonment
rate
6. MD bump rate
Type Anecdotal data Visual rounds Operational data Operational data Operational data
Population Patient panel Patients and staff
Patient panel Patient panel Patient panel
Mode Verbal Visual Via ATD phone system
Via appointment scheduling
system
Via appointment scheduling
system
Years 2003 - present 2007 - present 2006 - present 2006 - present 2006 - present
Frequency As they arise 2007 - 2008, occasional.
2009, monthly.
2007, in system, not reported.
2008 - present, reported monthly.
2007, in system, not reported.
2008 – present, reported monthly.
2007, in system, not reported.
2008 – present, reported monthly.
Benchmarking N/A N/A 2007, no. 2008 - present,
targets.
2007, no. 2008 - present,
targets.
2007, no. 2008 – present,
targets.

28
Table 1, continued. Measures Examined by Chief Administrative Officer and Specialty Practice Manager for Quality Improvement
Patient Experience
Measure
7. CAHPS – Patient Access composite
8. CAHPS – Office staff composite
9. CAHPS –Would recommend doctor
rating
10. CAHPS – Overall doctor
rating Type Survey Survey Survey Survey
Population 2006-2009: Most recent patient sample of doctors
who have more than 100 unique adult patients or 130
unique child patients; 2010 – present: Most recent patient sample
of all doctors in a practice with an
oversample of high-volume doctors.
2006-2009: Most recent patient sample of doctors
who have more than 100 unique adult
patients or 130 unique child patients;
2010 – present: Most recent patient sample
of all doctors in a practice with an
oversample of high-volume doctors.
2006-2009: Most recent patient sample of doctors
who have more than 100 unique adult patients or 130
unique child patients; 2010 – present: Most recent patient sample
of all doctors in a practice with an
oversample of high-volume doctors.
2006-2009: Most recent patient sample of doctors
who have more than 100 unique adult patients or 130
unique child patients; 2010 – present: Most recent patient sample
of all doctors in a practice with an
oversample of high-volume doctors.
Mode 2006-2009: Mail with phone
follow-up 2010-present: phone
only
2006-2009: Mail with phone
follow-up 2010-present: phone
only
2006-2009: Mail with phone
follow-up 2010-present: phone
only
2006-2009: Mail with phone
follow-up 2010-present: phone
only
Years 2006 – present 2006 – present 2006 – present 2006 – present
Dimension Access Office staff Overall Overall
Items Five items Two items One item One item
Frequency Five times from 2006-2009: April 2006;
August 2006; Feb 2007; Feb 2008;
Jan 2009; & 2010-Present: May-Oct 2010
Five times from 2006-2009: April 2006;
August 2006; Feb 2007; Feb 2008;
Jan 2009; & 2010-Present: May-Oct 2010
Five times from 2006-2009: April 2006;
August 2006; Feb 2007; Feb 2008;
Jan 2009; & 2010-Present: May-Oct 2010
Five times from 2006-2009: April 2006;
August 2006; Feb 2007; Feb 2008;
Jan 2009; & 2010-Present: May-Oct 2010
Benchmarking Department of surgery and FPG
total
Department of surgery and FPG
total
Department of surgery and FPG
total
Department of surgery and FPG
total

29
STEP 2: EXAMINE DATA GATHERED IN STEP 1 AND DEVELOP NEW MEASURES IF NEEDED
The next step was to examine all of the data to get an overall picture of the problem, identify baseline performance trends, prioritize improvement efforts, and select the best measures for motivating change and tracking progress.
In late 2006, the chief administrative officer, the FPG administrator, and the specialty practice manager took their first look at the operations data and the first CAHPS report. These data confirmed problems with customer service and access. A few months later, in early 2007, the second CAHPS report was available. It provided patient experience information for patient visits from October 2005 to August 2006 and confirmed the problems that had been identified in patient complaint and operations data.
As a result, in early 2007, the chief administrative officer of the department of surgery called in a consultant from the FPG to take a closer look at the specialty practice. The consultant visited the practice several times and studied records related to telephone activity, staffing, etc. that showed that the specialty practice had problems with appointment scheduling, cancellations, and patient no-shows. The evaluation wasn’t scientific; for example, it did not include a formal study of room utilization, but the evaluator did notice that the practice was busy on some days and used all of its space and on other days it did not. The consultant concluded that the specialty practice wasn’t structured properly--it didn’t have the support staff it needed to run a specialty practice that was as large, busy, and complicated, as was this specialty practice.
As a result of the findings of the consultant’s report, the FPG became more involved in trying to solve the identified problems. It was new for the FPG to be “sitting at the table,” providing management support and giving direction as to how it wanted the specialty practice to look and feel. Two upper-level managers within the department of surgery were involved at this time, but there was no formal quality improvement team.
Another part of Step 2 is to share the data and overall picture of the problem with leadership. The specialty practice manager and the chief administrative officer at the department of surgery shared these data with the FPG and hospital leadership to make them more aware of the issues within the specialty practice. The FPG recommended adding additional staff, and asked the department of surgery and hospital leadership for the resources and support to implement these changes.
At the same time and as an unrelated activity, the FPG was developing training courses related to customer service and business systems for all outpatient care practices, and the FPG was planning quality improvements for all of these same practices, which would include this specialty practice.
The specialty practice circled back and repeated Step 2 in late 2008 when it continued to hear complaints and see only small improvements in performance in both the operations data and CAHPS patient experience data. The specialty practice had not yet met is target goals despite the initial intervention actions taken. The quality improvement team reexamined the data to rethink how it might intervene in ways that would produce better and bigger results. In addition, the new specialty practice manager

30
(hired in January 2009) continued to track the same measures, but began observing staff in the call center and the front desk on a regular basis and reporting to upper management monthly. It was obvious that the lack of standardized processes was one of the main reasons for the problems. Many of the employees who had been around for a long time had only on-the-job-training; most of the staff needed more understanding about how to respond to difficult patients. The specialty practice manager could see that staff were overwhelmed. Many of the doctors and some of the consultant nurses approached the specialty practice manager and discussed the problems and the need for more staff. Under the new specialty practice manager, the chief administrative officer and FPG leaders approached hospital leadership and asked for the resources to add staff to the specialty practice.

31
STEP 3: SET GOALS AND PLAN FOR IMPROVEMENT
Many organizations achieve success in their quality improvement efforts without establishing a formal program or appointing a formal team. That was the case with this organization. It was during Steps 1 and 2 that a core of upper managers became involved with the specialty practice and its quality improvement efforts; they comprise the “quality improvement team.”
The specialty practice and its quality improvement team continued to monitor the operations measures collected by the telephone system and reported to them by the FPG quarterly, as well as the customer experience measures based on the CAHPS survey that were sent to them.
When the customer service and access issues within the specialty practice were first identified, there was no standardized system of reporting on operations and patient experience performance for each specialty practice. Practice managers themselves could query the administrative systems for information, but no reports were generated and distributed by the FPG. Because of this, there were no formal performance targets. However, during the initial phases of the quality improvement work in 2007, the FPG sent out the second CAHPS patient experience survey report to the individual specialty practices. In this second CAHPS report, the FPG compared a practice’s performance to the overall FPG mean and to their previous performance. The FPG at this time established that the FPG means (as of 6/30/2007) would be the performance targets for all individual practices across the operations and patient experience service and quality measures.
Table 2 below provides the baseline performance for all the specialty practices as of June 30, 2007 as collected and averaged by the FPG, and the baseline performance for the case study specialty practice. (The case study specialty practice being studied is a surgery practice.) For the CAHPS measures, the first three administrations of the CAHPS data--from April 2006, August 2006 and June 2007--are reported as baseline in Table 2.

32
Table 2. Faculty Practice Group and Specialty Practice Baseline Performance on Customer Service and Access Measures
Measure
Faculty practice group (FPG) baseline (6/30/2007)
performance
Specialty practice baseline (6/30/2007)
performance Operational measures
New patient rate 11.1 percent for all practices (FPG mean) 23.0 percent for only surgery
28 percent
No-show rate 6.6 percent Not available Call abandonment rate 10.6 percent Not available Bump rate 2.3 percent Not available
Customer experience measures Apr 06-Aug 06-June 07 Access composite (based on annual CAHPS survey; 0-100 mean score)
73 66 69 72
Helpful office staff composite (based on annual CAHPS survey; 0-100 mean score)
86 80 83 84
Patient recommends MD (based on annual CAHPS survey; 0-100 mean score)
90 NA 89 89
NOTE: For the operational data, lower numbers indicate better performance, except for new patient rate where higher numbers indicate better performance; Fro the CAHPS data, higher numbers indicate improvement.
The specialty practice operations data selected in Step 1 and the CAHPS patient experience data from the first three survey administrations indicated that there were definite problems in the specialty practice concerning customer service and access. Customer service and access were both seen as problems based on anecdotal data and because the specialty practice had not met the target goals over three points in time.
Using these data, the specialty practice and its quality improvement team developed a strategy for what areas needed to improve and what areas they needed to examine in more detail to fully understand the issues underlying the problems. The data was as a guide to what actions they should take for improvement.
33
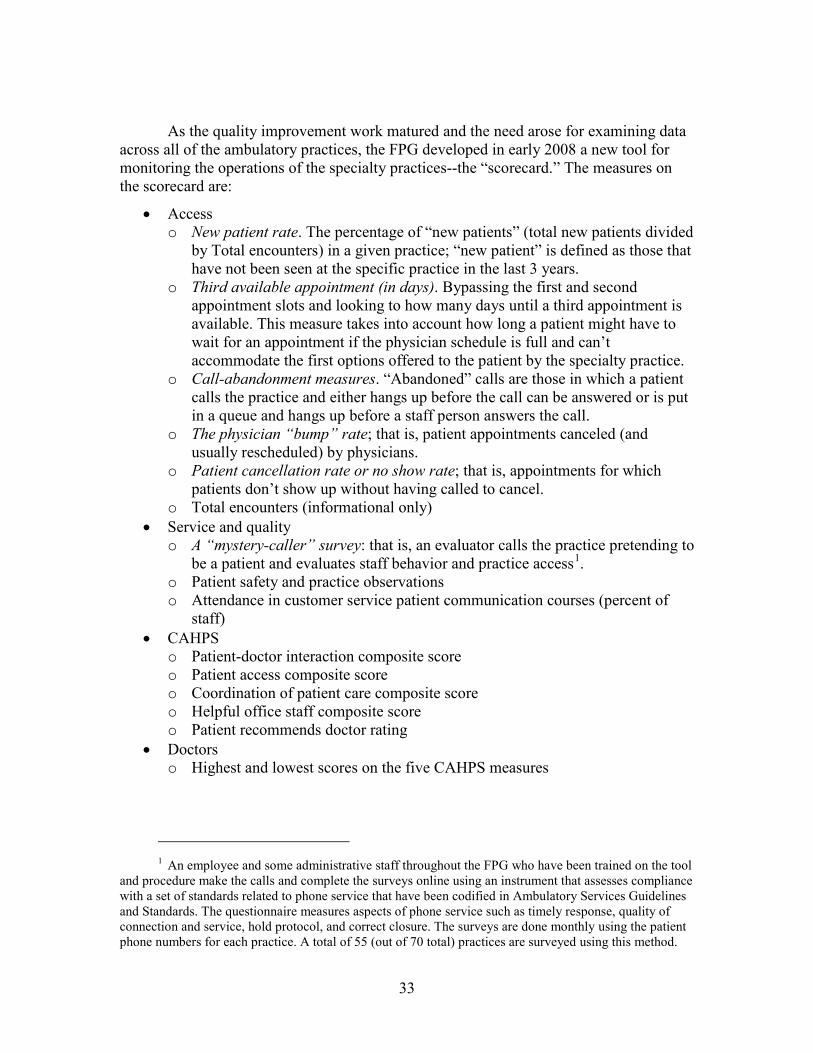
As the quality improvement work matured and the need arose for examining data across all of the ambulatory practices, the FPG developed in early 2008 a new tool for monitoring the operations of the specialty practices--the “scorecard.” The measures on the scorecard are:
• Access o New patient rate. The percentage of “new patients” (total new patients divided
by Total encounters) in a given practice; “new patient” is defined as those that have not been seen at the specific practice in the last 3 years.
o Third available appointment (in days). Bypassing the first and second appointment slots and looking to how many days until a third appointment is available. This measure takes into account how long a patient might have to wait for an appointment if the physician schedule is full and can’t accommodate the first options offered to the patient by the specialty practice.
o Call-abandonment measures. “Abandoned” calls are those in which a patient calls the practice and either hangs up before the call can be answered or is put in a queue and hangs up before a staff person answers the call.
o The physician “bump” rate; that is, patient appointments canceled (and usually rescheduled) by physicians.
o Patient cancellation rate or no show rate; that is, appointments for which patients don’t show up without having called to cancel.
o Total encounters (informational only) • Service and quality
o A “mystery-caller” survey: that is, an evaluator calls the practice pretending to be a patient and evaluates staff behavior and practice access1.
1 An employee and some administrative staff throughout the FPG who have been trained on the tool
and procedure make the calls and complete the surveys online using an instrument that assesses compliance with a set of standards related to phone service that have been codified in Ambulatory Services Guidelines and Standards. The questionnaire measures aspects of phone service such as timely response, quality of connection and service, hold protocol, and correct closure. The surveys are done monthly using the patient phone numbers for each practice. A total of 55 (out of 70 total) practices are surveyed using this method.
o Patient safety and practice observations o Attendance in customer service patient communication courses (percent of
staff) • CAHPS
o Patient-doctor interaction composite score o Patient access composite score o Coordination of patient care composite score o Helpful office staff composite score o Patient recommends doctor rating
• Doctors o Highest and lowest scores on the five CAHPS measures

34
During the development of the scorecard, the FPG also established targets for each of the metrics. The targets were intended to be stretch goals, but also attainable. The FPG chose goals that were slightly better or similar to the FPG average as of June 2007. Scorecards were created for the overall FPG, each department, and each specialty practice. The scorecards included the current and past performance for each month in the given fiscal year, the average year-to-date performance, as well as the targets for all metrics listed above. The monthly performance scores are colored-coded: red for “does not meet target,” yellow for “within 5 percent of the target,” and green for “meets or exceeds target.” Table 3 indicates the performance targets for the operations and CAHPS measures being tracked by the specialty practice in this quality improvement effort along with the FPG baseline performance. For the operations data, a lowering of the percents is an improvement; for the CAHPS data, an increase in the score from 0-100 is an improvement.
Table 3. Targets and Faculty Practice Group Baseline Performance for the Customer Service and Access Measures
Measure
Performance target
FPG baseline (6/30/2007) performance
Operational measures Faculty practice group (FPG) standard
New patient rate More than 11 percent overall More than 23 percent for department of surgery
11.1 percent overall 24 percent for department of surgery
No show rate Less than 5 percent 6.6 percent Call abandonment rate Less than 8 percent 10.6 percent Patient MD bump rate Less than 5 percent 2.3 percent
Customer experience measures Patient access composite (based on CAHPS survey; 0-100 mean score)
Greater than 75 73
Helpful office staff composite (based on CAHPS survey; 0-100 mean score)
Greater than 85 86
Patient recommends MD (based on CAHPS survey; 0-100 mean score)
Greater than 90 90
NOTE: For the operational data, lower numbers indicate better performance, except for new patient rate where higher numbers indicate better performance; Fro the CAHPS data, higher numbers indicate improvement.

35
STEP 4: IMPLEMENT ACTIONS FOR IMPROVEMENT
Development of Training Courses In early 2007, the FPG rolled out a series of training courses to help staff in the
outpatient specialty practices interact with patients in a more positive, helpful way. There had not been clear protocols on how to answer the phones, triage calls, and refer doctor calls. Many employees who had been around for a long time had only on-the-job training.
In February 2007, the specialty practice manager joined a small group of practice managers to help develop and test the courses. The effort was lead by a training director in the FPG who came from outside the medical center with the explicit purpose of developing customer service training targeted at the specialty practice groups within the medical center.
To obtain funding for the training, the FPG had to sell it to the medical center’s department chairs and to the hospital. The department chairs and the hospital had control over the department budgets and would therefore provide funding. Funding was for the expense of the courses, the trainers, and the facilities, but not for temporary staff so specialty practice staff could miss work to attend the training. Some of the courses were 2.5 days so staff were absent from their positions in the practice for more than two days. In the end, the department chairs and hospital leadership jointly funded the training.
Training courses were developed in two main stages and went hand-in-hand with development of standards and guidelines for staff. The courses were for both specialty practice managers and for front- and back-office staff in the 35 ambulatory practices. The course offerings were expanded in 2008. There were also courses directed at skill building for business administration functions. The key offerings in the first roll out were:
• Customer Service For management staff
Connecting with Customers, which targeted all levels of management responsible for patient satisfaction, and which championed employee job performance by providing on-the-job feedback, coaching, recognition, and review (implemented in July 2007 and concluded at the end of 2009, since the majority of leadership had completed the training).
For general staff
Connecting with Customers, which targeted staff who interact with customers directly or indirectly, over the telephone or in-person, and need to use effective communication techniques to build rapport and to succeed at work (implemented in July 2007; on-going).

36
• Systems Training in Business Applications Courses transferred and modified from another department that previously delivered this training:
Introduction to Appointment Scheduling, which targeted first-time users who are responsible for scheduling physician appointments and arriving patients (implemented July 2006; ongoing).
Appointment Scheduling Maintenance, which targeted first-time users or infrequent users responsible for maintaining physician calendars and practice appointment types, and blocking slots or sessions (implemented July 2006; ongoing).
Introduction to Outpatient Encounter Registration was designed to supplement the training provided for outpatient registration on the Encounter Registration 2000 system by offering courses on insurance payers in order to improve employee and organizational performance with the billing claim process and revenue cycle. Employees must pass the training course exam to be granted system access (phased in; see below for additional phases). Implemented as a one-day course in September 2007 through March 2009.
Use of the Training Courses by the Practice In 2007, the specialty practice manager decided to make a concerted effort to
improve staff courteousness and he/she tackled it on several fronts simultaneously with the expectation that all or some of the efforts would have a positive effect. As soon as the training courses were offered in July 2007, the manager encouraged all staff to attend the courses and work schedules were adjusted to accommodate the courses. Many of the patient communication courses were scheduled during the practice’s busiest times; eventually the courses were restructured so that some of the courses enabled groups of staff to attend two or three at a time. The specialty practice managers also attended the courses. Some staff welcomed the courses and others did not. The specialty practice manager commented that in the initial phases of sending staff to the courses, the staff people who needed the courses the most were the ones who resisted attending.
The training for the specialty practice managers was held in February 2007 and the training for the general staff began in July 2007. In the specialty practice, the specialty practice manager attended the training in February 2007 and was able to have all front-office and back-office staff attended the training from July to October 2007.
The specialty practice manager motivated staff to attend the various courses. He/she kept track of who had attended and reminded staff to attend. The manager praised staff verbally for their attendance. When the manager observed good interactions with patients by staff, the manager handed out gold star stickers to employees as a way of showing appreciation. It was known among staff that gold stars were a sign of good work and behaviors. The management training courses had encouraged managers to hand out gold stars to employees as a means of reward and recognition. Other incentives for course attendance included gift cards and pizza.

37
The courses were also used by the specialty practice manager as a disciplinary tool. If a staff member was observed not treating a patient well, then the staff member was sent to the course (either for the first time or as a refresher).
By October 2007, the majority of all existing front office and back office staff in the specialty practice had attended the encounter registration course, the appointment scheduling course, and the “connecting with customers” course. Staff who attended the courses reported that the courses were very helpful and that the teaching scenarios were relevant to real situations in the practice. The specialty practice manager noticed a reduction in patient complaints and fewer problems sent to the specialty practice manager from staff. The staff, as observed by the specialty practice manager, had a better perspective on how to treat patients, a better knowledge of what patients experienced when they came to the practice, and knowledge of options for communicating with patients. The courses taught staff how to say things differently and do things better to make the patient more comfortable and they offered specific guidelines on how to solve problems. Anecdotally, the courses seemed to help build better relationships between the staff and patients. However, it took 18 months to two years to see any of the improvements in the operations and patient experience data.
The specialty practice’s performance measures (especially CAHPS scores) in customer service and access remained flat through 2007 and 2008 even after the initial training for general staff and managers, which carried with it the hope of increasing staff accountability on service and patient communication behaviors.
Adding to the Training Program In late 2008, a new customer service course for general staff was added by the
FPG. “Dealing with Difficult Patient Situations” targeted staff members who might have to deal with a situation where something has gone wrong, and they are faced with an upset, uncooperative, and/or complaining customer (implemented October 2008; on-going).
The specialty practice manager moved forward in having staff attend the new class as soon as it was launched. At first staff were resistant. They believed that they were already good at dealing with difficult situations, since the nature of the patient population meant that they dealt with difficult situations every day. However, the courses provided an educational foundation and structure to the patient-staff interactions. The courses used role-playing to help staff practice and it gave staff resources they could turn to for support in handling difficult situations.
The specialty practice manager made the training mandatory for all specialty practice staff. All front- and back-office staff and any new employees were scheduled to attend the training. Courses added in the second phase were:
• Dealing with Difficult Patient Situations • Managed Care 101 for general staff • Managed Care 101 for management staff
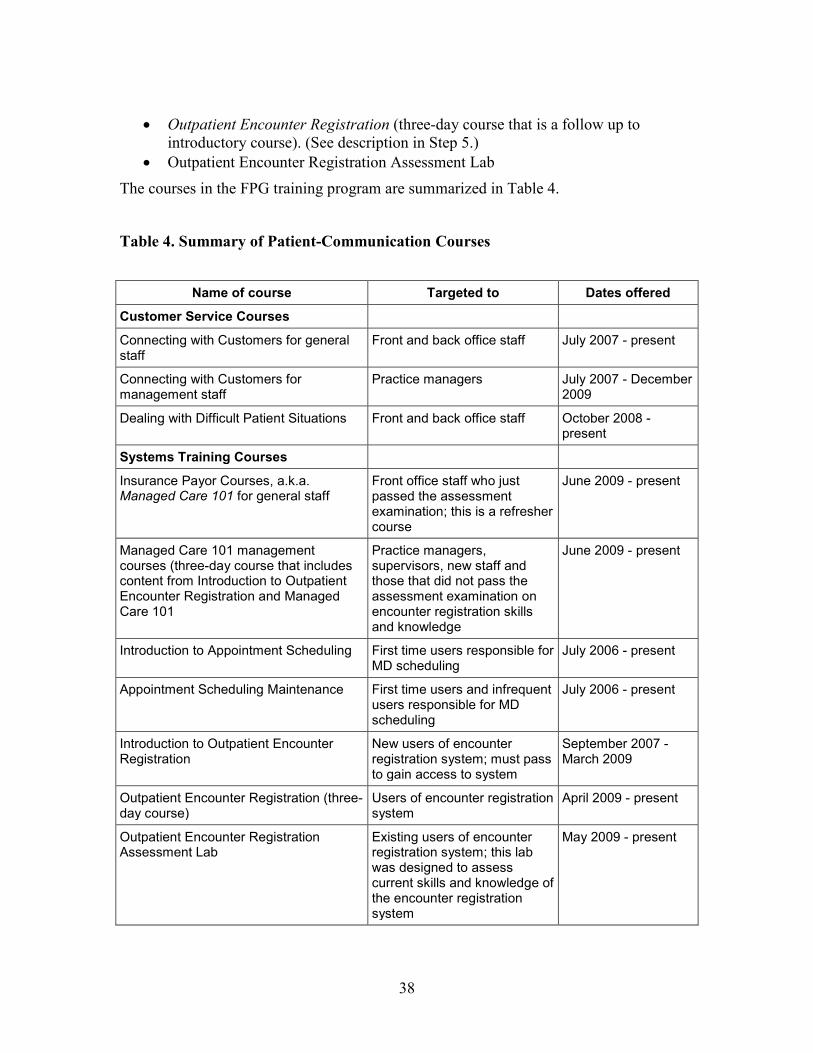
38
• Outpatient Encounter Registration (three-day course that is a follow up to introductory course). (See description in Step 5.)
• Outpatient Encounter Registration Assessment Lab The courses in the FPG training program are summarized in Table 4.
Table 4. Summary of Patient-Communication Courses
Name of course Targeted to Dates offered
Customer Service Courses
Connecting with Customers for general staff
Front and back office staff July 2007 - present
Connecting with Customers for management staff
Practice managers July 2007 - December 2009
Dealing with Difficult Patient Situations Front and back office staff October 2008 - present
Systems Training Courses
Insurance Payor Courses, a.k.a. Managed Care 101 for general staff
Front office staff who just passed the assessment examination; this is a refresher course
June 2009 - present
Managed Care 101 management courses (three-day course that includes content from Introduction to Outpatient Encounter Registration and Managed Care 101
Practice managers, supervisors, new staff and those that did not pass the assessment examination on encounter registration skills and knowledge
June 2009 - present
Introduction to Appointment Scheduling First time users responsible for MD scheduling
July 2006 - present
Appointment Scheduling Maintenance First time users and infrequent users responsible for MD scheduling
July 2006 - present
Introduction to Outpatient Encounter Registration
New users of encounter registration system; must pass to gain access to system
September 2007 - March 2009
Outpatient Encounter Registration (three-day course)
Users of encounter registration system
April 2009 - present
Outpatient Encounter Registration Assessment Lab
Existing users of encounter registration system; this lab was designed to assess current skills and knowledge of the encounter registration system
May 2009 - present

39
Other Quality Improvement Interventions The specialty practice manager also worked with physicians to implement
specialty-specific guidelines and protocols with regard to any contact with patients (for example, whether to use voice mail or e-mail; and reporting lab results in person or over the phone). There is a medical director or chief for each specialty so the specialty practice manager facilitated the process of setting up a meeting with each specialty chief to generate the protocols and guidelines and implement them. The specialty practice manager wanted to bring in an automated telephone answering, voice mail, and messaging system, but physicians didn’t want that, so instead the specialty practice manager asked the physicians in the various specialties to give them standard responses to common scenarios.
Another important piece of improving customer service was a change in the way specialty practice managers communicated with staff. The specialty practice manager became more directive in telling staff what expectations were in terms of patient communication. The specialty practice manager was able to refer to the examples of positive interaction that were modeled in the patient communication courses.
The specialty practice manager made staff-patient communication part of the discussion at weekly staff meetings, discussing acceptable communication, modeling appropriate communication in difficult situations, and reminding staff of their recent training. The specialty practice manager found opportunities to give immediate praise or constructive feedback to individual staff. The specialty practice manager made a point of talking about what was acceptable communication and what wasn’t.
The specialty practice manager also was more systematic and consistent about responding to patient complaints. Several issues were important when utilizing patient complaints to increase accountability: getting feedback to the appropriate staff in a timely manner; identifying the staff members involved in incidents; clarifying the circumstances related to the complaints; and understanding the meaning and underlying issues surrounding the patient comments.
In the summer of 2008, the specialty practice manager also implemented “morning huddles”—quick, daily meetings to let staff know what was going on that day, or that week. Separate huddles were held for cost center staff, and front-office and back-office staff.

40
STEP 5: ASSESS PROGRESS IN ACHIEVING GOALS AND REFINE THE ACTIONS FOR IMPROVEMENT
Over the course of the quality improvement intervention, the FPG, departments of surgery and medicine, and specialty practice manager assessed the performance measures and compared them to the targets that were set when the scorecard was developed in Step 3. Once the results were obtained and analyzed, performance issues were discussed with the chief administrative officer in the department of surgery and with leaders at the hospital and additional suggestions for improvements were made and implemented.
By the middle of 2008, the specialty practice manager had implemented the main components of the improvement strategy. The expectation was that the increased focus on customer service and staff communication would lead to more positive feedback from patients. They were aiming for incremental, steady improvements in the right direction across the targeted measures. There had been minor setbacks in the initial timeline due to the lack of resources to add additional staff. However, the continued emphasis on managing work flow processes and improving the interactions of staff with patients based on the tools from the training courses produced immediate results in that the number of patient complaints dropped as did complaints from doctors.
The Specialty Practice Manager Collected More Data However, there were still a substantial number of complaints from patients and
physicians. To better understand the reasons underlying the complaints, the specialty practice manager began recording patient complaints and wrote detailed descriptions of the situations in which they arose. He/she categorized the complaints and shared them with the staff in the specialty practice. In some cases, patients had to wait too long for a doctor to call back with lab results or write a prescription. Other patients complained that they had to wait too long to get a referral to another doctor outside the specialty practice, or to get authorization from an insurance company for a procedure or referral. The specialty practice manager noticed that the wait time for authorizations was longer with some payers than with others.
After the specialty practice manager recognized the trends in the complaints, he/she studied how long it took for patients to be seen by a physician once they arrived at the practice.
Overall, the poor customer service was a product of management and workflow problems and a few poor-performing individuals. However, the specialty practice manager also found that current staff positions needed to be upgraded. The workforce wasn’t at a high enough level of licensure and training to deal with the type of clinical care that the specialty practice required. For example, in pre-op anesthesia the specialty practice had a very experienced RN who was in the back office and could be a resource for the staff. But that RN did not oversee the back office staff; an LVN did that, and the LVN was inexperienced as a manager. The specialty practice manager and the lead staff for each clinic discussed the possibility--and issues related to liability and risk to patient care--of using an RN to manage staff. One advantage of an RN nurse manager would be to supplement physician services. For example, physicians had been the only ones who

41
could answer clinical questions. If a patient called and said she was having chest pains, staff would have to find a doctor to take the call. A personnel change might mean that another layer of staff—an RN, for example—could respond and triage questions.
Practice Manager Sought Resources for More Staff After reviewing the data, the specialty practice manager decided in October 2008 to
take the problems to the chief administrative officer in the department of surgery—the CAO had been an integral part of the quality improvement effort—and ask for more staff so that the specialty practice could work on restructuring the patient flow. The specialty practice manager felt that hospital leadership would be receptive because the hospital had started several patient-centered initiatives related to customer service. They included a “reminder card” for nurses, residents, and doctors to use to remember the basics on communicating with patients, and a one-page feedback form for patients. The specialty practice manager also knew that the medical center would be concerned about two potential hot button issues, volume and service. The ability of the specialty practice to grow and patient safety were both jeopardized by inadequate staffing levels.
The chief administrative officer and the specialty practice manager made the decision to bring in consultants from the FPG to look at staffing levels and decide what staffing changes might be appropriate. The specialty practice manager also discussed staffing with the FPG director, who took the issues to hospital leadership. (In the end, it was this connection that finally enabled the resources for staff changes to be made available.)
The specialty practice manager and colleagues proposed an immediate solution of hiring a nurse manager, along with a “now, better, and best” plan for moving forward. The hospital and department management agreed to hire a nurse manager at the Administrative Nurse II level for a salary of $80K per year.
At the end of 2008, the specialty practice had a long-term plan. The specialty practice got approval to hire another nurse manager and upgrade the back office staff from hospital assistants to LVNs; LVNs were better equipped to deal with the procedures that were being performed, complicated patient needs, and a wide variety of clinical conditions. All of the recommended staffing changes totaled approximately $1M, paid for by the hospital.
The data from the time study, the access metrics, the patient experience survey, and the tracking of patient and doctor complaints were the tools that were needed to document for upper management the problems that were already apparent to staff “on the ground” in the clinics in the specialty practice.
Improving Patient Flow and Staff Morale Once the monies were approved, the specialty practice manager began to work on
restructuring the way patients were scheduled and triaged, and decided to look deeper into staff morale issues. The manager surveyed staff members about their satisfaction with their jobs and functions. This information helped the specialty practice manager in restructuring and working to improve morale.
42
One of the challenges was that the department of surgery pays the staff but the specialty practice is a hospital-based specialty practice and obtains resources through the hospital, making it difficult to understand who is in charge. In addition, two different divisions of surgery and some doctors from the department of medicine were housed under one roof with different preferences for how, for example, scheduling should happen. Staff were dealing with complex patient illnesses and complex situations and felt underappreciated, particularly by the physicians.
During late 2008, the specialty practice manager empowered the staff to make more decisions on their own by creating scripts with the help of the staff that helped the staff triage difficult situations and know when to call in the manager. They also created scenarios illustrating when the staff could fit urgent patients into the doctors’ schedules so that staff didn’t need to go to the doctors and then wait for a response.
The specialty practice manager also worked on rewarding staff when good behavior was observed. However, the specialty practice manager felt that the staff hears from their manager and sees the manager every day, and what they really needed was to hear praise from the physicians and other staff. The specialty practice manager worked one-by-one with the physicians that were most engaged, asking them to reach out more and thank the staff. The effect was very gradual and is probably still a work in progress. There are 20 doctors in the specialty practice, primarily from surgery and a few from the department of medicine.
Another morale issue was that some of the specialty practice staff—those who were employed by the department of surgery—received bonuses around the holidays. Other staff in the specialty practice are employed by the hospital and did not receive bonuses. The specialty practice manager went to the department of surgery administrators and asked them to extend bonuses to his/her specialty practice staff the next holiday season (in 2008), which they did.
Other things that the specialty practice manager implemented were simple rewards like pizza on Fridays, an hour to play games (team-building), and bringing other administrators to staff meetings to hear the staff members’ concerns. The specialty practice manager indicated that staff people need to know that their comments and complaints are being addressed. The staff perception that “no one cares about us” takes a long time to correct.
In 2008, the specialty practice manager observed changes in “courtesy” first, which took a while to be reflected in patient experience data. The call abandonment rate improved slowly over time in 2008, partly due to the delay in implementing the staffing turnover. The specialty practice manager looked regularly at the “courtesy” question in the patient experience data, the call abandonment rate, the physician “bump” rate, and the other access metrics. Of all of the metrics tracked, the physician bump rate was the measure that didn’t change during 2007 and 2008.
At the end of 2008, the specialty practice manager decided to leave (to be a manager for another specialty practice) and a new manager was hired in January 2009 to implement the new changes.
43
Supplementing the Training Program The FPG in early 2009 transferred and modified a training course from another
department that previously delivered the training. The course is: Outpatient Encounter Registration, designed to supplement the courses provided for outpatient registration on the Encounter Registration 2000 system by offering courses on insurance payers in order to improve employee and organizational performance with the billing claim process and revenue cycle. Employees must pass the course exam to be granted system access (this requirement was phased in).
• Implemented as a one-day course in September 2007 through March 2009
• Implemented as a three-day course for new staff in April 2009 and ongoing
• Assessment lab was added in May 2009 to assess existing staff; those that did not pass the assessment lab were required to go to the three-day course designed for new staff
• Added one-day Managed Care 101 refresher course for those who had low scores on the assessment lab, June 2009
• Added management training three-day course in April 2010 for existing management staff. Concluded in September 2010 after a majority of the specialty practice managers and supervisors had completed the training
Courses are ongoing and all part of the assessment and hiring process as of early 2010. Additional courses are being developed.
The ability to assess employees’ skills and knowledge and then require them to take a refresher course or a series of courses was ground-breaking for the FPG. After the first assessments of existing staff, it was apparent to the FPG that there was an extensive need for training. The FPG provided information across the organization to require existing staff to receive training. (Please see Appendix A for more details on each class.)
With this additional organizational support and resources, the new specialty practice manager (hired in January 2009) took the following additional steps:
• Hired four new staff: one RN, two LVNs and one Administrative Assistant (level 3)
• Re-staffed the front desk (from one to three) to reduce how overworked the staff were and to provide more consistency; there had been one person at the front doing the job of three with others pitching in when they could
• Appointed a lead person in each of the main clinic areas to be responsible for the area, answer questions and, when needed, bump questions and problems to the specialty practice manager. This gave staff a sense of ownership within their individual areas
• Sent all staff to encounter registration and appointment scheduling courses
• Sent select staff to the physician maintenance scheduling course (to enable these staff to access physician schedules and change them)

44
• Sent the five authorization staff to a class called Access Express which was offered by the medical center as part of its training on its financial systems, especially for working with HMO patients
• Gave up to $75 per employee per year in staff recognition awards
• Increased accountability by talking to the staff about the expectations that the specialty practice manager had for them in terms of patient care for each of their jobs. The specialty practice manager borrowed guidelines and scripts being used in the hospital related to patient introduction and patient interaction. The guidelines included these suggestions:
o Connect with the patient, or their family member, by addressing them as “Mr.” or “Mrs.” or by the name the patient prefers
o Introduce yourself and what you do o Communicate what you are going to do and how long it is going to take o Ask or anticipate what a patient or family might need; ask if they have
questions or concerns o Respond in a timely manner to requests o Exit courteously, give an explanation of what is to come next
• Started weekly clinic summaries to inform staff about their performance from the week before. For example, for authorization staff, the report would indicate the percentage of patients for which payment had been secured before or on arrival for their visit
• Started morning “huddles” to encourage communication and problem-solving among staff; this was done with call center staff, greeting staff, back office staff and the nurse managers
• Held regular Friday group staff meetings and every third meeting all lead doctors would attend
• Developed protocols and guidelines for the various sub-specialties; for example, how to communicate lab results to patients
By October 2010 (See Tables 5 and 6), the practice had met four of its seven customer service and access targets and made significant, incremental improvements in the other three measures. For the operations data, a lowering of the percents is an improvement, except for the new patient rate where a higher number indicates better performance; for the CAHPS data, an increase in the score from 0-100 is an improvement. For example, it had scored 87 on a scale of 0 -100 on the office staff composite (a summation score of the two office staff items on the CAHPS survey), with a higher score indicating better performance. This compares with a score of 89 for all the practices in the FPG combined and a target of greater than 85. This had been over the target since March 2009 after the full implementation of the quality improvement strategies and it had been getting incrementally better since April 2006 with a baseline score of 80. The practice had also met its target for the overall rating of the doctor with a score of 95 on the item “would recommend doctor to family and friends,” which was over the target of 90 and higher than the FPG average of 92.

45
STEP 6: MONITOR IMPROVEMENTS FOR SUSTAINABILITY
Just as data are critical for diagnosing problems, they are critical for monitoring and sustaining improvements. Tables 5 and 6 summarize some of the data that were available to the practice manager to monitor improvements. He/she was able to compare the specialty practice scores with mean scores for all the specialty practices in the FPG and compare both scores with the targets set by the FPG for all its specialty practices.
CAHPS scores went up more at the case study specialty practice than at the other specialty practices and they reached their targets for two of the three patient experience measures. For the operations data, a lowering of the percents is an improvement; for the CAHPS data, an increase in the score from 0-100 is an improvement.
In September 2008, after the first quality improvement intervention, the practice had a 14 percent no show rate; that is, 14 percent of patients who had appointments at the practice’s clinics did not show up for their appointments and did not call to cancel. This compares with a score of 8 percent for all the practices combined and a target rate of less than 5 percent. These data guided the specialty practice manager in his/her efforts to improve customer service and access at the practice and by September 2010 the rate had gone down to 10 percent. Still above the target rate, but better. This particular measure is believed to be tied to the bump rate; that is, the rate at which physicians cancel and reschedule appointments. The bump rate has still not moved, but improving it may require upper management to discourage physicians from canceling and rescheduling patient appointments; patient satisfaction rates will never be where they should be if physicians reschedule patient appointments at the current rate.
The call abandonment rate improved by late 2009, and continued incrementally to get better up through October 2010.
Also in September 2008, the practice scored 84 on a scale of 0 -100 on the office staff composite (a summation score of the two office staff items on the Clinician and Group CAHPS survey), with a higher score indicating better performance. This compares with a score of 84 for all the practices in the FPG combined and a target of greater than 85. This was still below the target but was incrementally getting better from baseline of 80. Figures 2 and 3 on page 17 illustrate some of these improvement trends.
The practice manager and the FPG continue to monitor the specialty practice’s progress quarterly using the scorecard, and compare its scores to the other surgery practices and to the FPG as a whole.
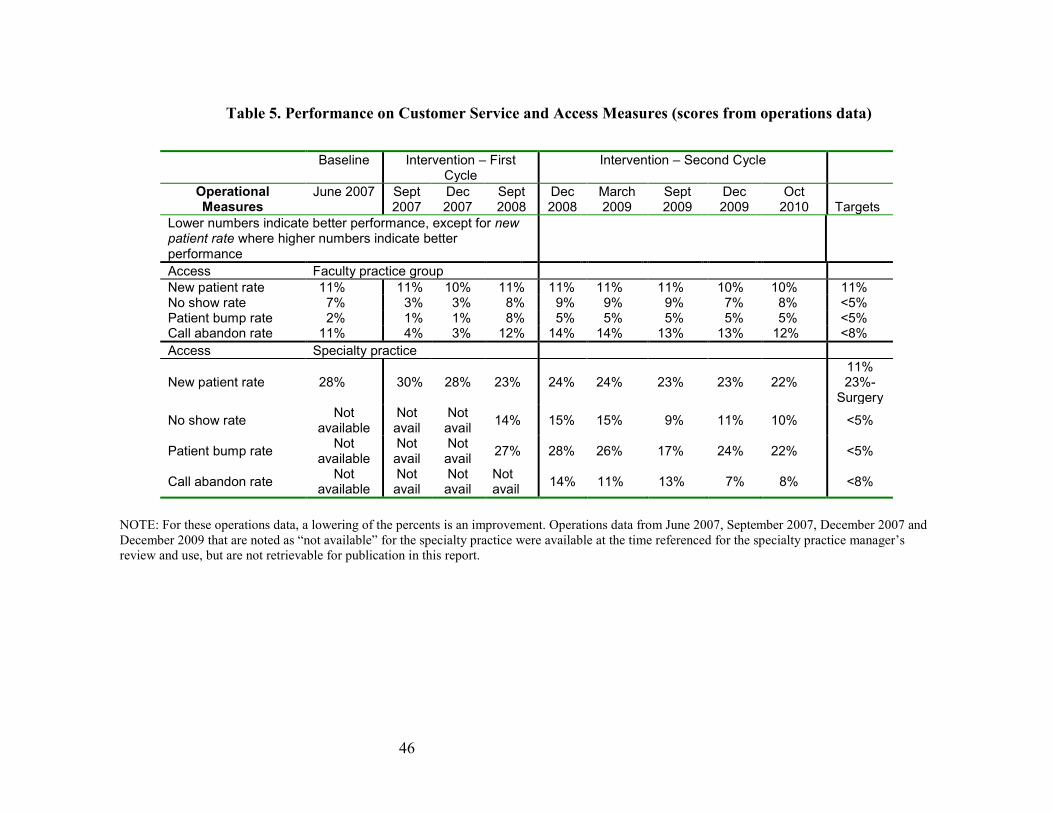
46
Table 5. Performance on Customer Service and Access Measures (scores from operations data)
Baseline Intervention – First Cycle
Intervention – Second Cycle
Operational Measures
June 2007 Sept 2007
Dec 2007
Sept 2008
Dec 2008
March 2009
Sept 2009
Dec 2009
Oct 2010 Targets
Lower numbers indicate better performance, except for new patient rate where higher numbers indicate better performance
Access Faculty practice group New patient rate 11% 11% 10% 11% 11% 11% 11% 10% 10% 11% No show rate 7% 3% 3% 8% 9% 9% 9% 7% 8% <5% Patient bump rate 2% 1% 1% 8% 5% 5% 5% 5% 5% <5% Call abandon rate 11% 4% 3% 12% 14% 14% 13% 13% 12% <8% Access Specialty practice
New patient rate 28% 30% 28% 23% 24% 24% 23% 23% 22% 11% 23%-
Surgery
No show rate Not available
Not avail
Not avail 14% 15% 15% 9% 11% 10% <5%
Patient bump rate Not available
Not avail
Not avail 27% 28% 26% 17% 24% 22% <5%
Call abandon rate Not available
Not avail
Not avail
Not avail 14% 11% 13% 7% 8% <8%
NOTE: For these operations data, a lowering of the percents is an improvement. Operations data from June 2007, September 2007, December 2007 and December 2009 that are noted as “not available” for the specialty practice were available at the time referenced for the specialty practice manager’s review and use, but are not retrievable for publication in this report.
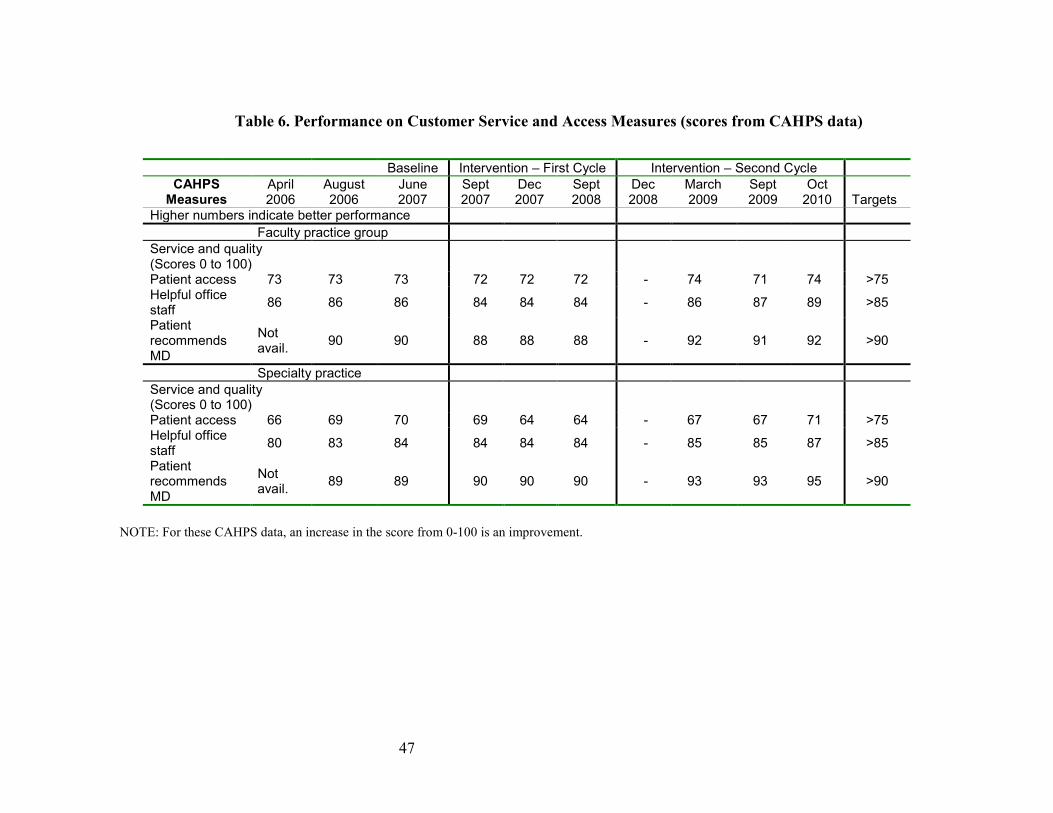
47
Table 6. Performance on Customer Service and Access Measures (scores from CAHPS data)
Baseline Intervention – First Cycle Intervention – Second Cycle CAHPS
Measures April 2006
August 2006
June 2007
Sept 2007
Dec 2007
Sept 2008
Dec 2008
March 2009
Sept 2009
Oct 2010 Targets
Higher numbers indicate better performance Faculty practice group Service and quality (Scores 0 to 100)
Patient access 73 73 73 72 72 72 - 74 71 74 >75 Helpful office staff 86 86 86 84 84 84 - 86 87 89 >85
Patient recommends MD
Not avail. 90 90 88 88 88 - 92 91 92 >90
Specialty practice Service and quality (Scores 0 to 100)
Patient access 66 69 70 69 64 64 - 67 67 71 >75 Helpful office staff 80 83 84 84 84 84 - 85 85 87 >85
Patient recommends MD
Not avail. 89 89 90 90 90 - 93 93 95 >90
NOTE: For these CAHPS data, an increase in the score from 0-100 is an improvement.

48
As this case study concluded, the specialty practice manager reported that interactions between staff and patients had improved considerably. Patients still complained, but generally they love their doctors. In terms of coordination of patient care, particularly for transplant patients, patients take all of their care issues to the transplant nurse and they are disappointed if they are sent elsewhere for care (for example, to their primary care physician). The practice manager believed that, given the volume of patients that the specialty practice handles and the complexity of the cases, coordination of care was pretty good.
The current specialty practice manager reports that when he/she sees a problem trend, he/she acts immediately. For example: if a staff member repeatedly fails to enter the referring physician’s name and/or authorization number (from the insurance company) in the practice’s system, it causes problems that are picked up down the line (for example, with reconciling charges, sending notes to the referring physician, etc.). The specialty practice manager has the person sit down with an experienced staff member and go through the encounter registration process step-by-step. Also, if several patient complaints seem to be focused on one staff person, the manager observes that staff member closely several times per month and has one-on-one feedback meetings with the staff person. The manager often refers to the content of the training courses in those conversations.
The FPG has also set out to pursue several additional FPG-wide quality improvement projects using the CAHPS data aimed at improving communication with patients. This recommitment by executive leadership of the FPG also elevated its importance and priority among mid-level managers of the organization and the lead physicians, and kept the specialty practice manager on track.

49
LESSONS LEARNED THAT CAN BE APPLIED MORE BROADLY
Among the lessons to be learned from the experience of this specialty practice are the need for:
• Change management. The merging of the two specialty practices, and the physical move of one to join the other, comprised major changes for the organization, for staff, and for patients. These kinds of changes need to be managed carefully, with advance planning and close attention to resource requirements, staffing requirements, open communication, etc.
• Support from management. The early specialty practice managers were handicapped in their ability to make improvements because they did not have the authority or the resources to make necessary changes. The people who control financial resources must be involved in the quality improvement process.
• Data. Anecdotal reports from the practice manager and staff “on the ground” in the clinics clearly indicated that customer service and access needed to be improved. But data helped to illustrate the problems for managers in the FPG and in the hospital. Because the specialty practice participated in CAHPS and had access to various operations data, it was able to see where the problems were and to track progress as it implemented the quality improvement program. Decisionmaking about where to invest limited resources is much easier when it is supported by information.
• The right staff. Of all the changes made by the specialty practice, staff changes had the biggest effect on improvements in customer service and access. These changes have been discussed previously, but in general they included hiring a new practice manager, firing a few individuals, increasing the number of staff in the practice and especially at the front desk, and requiring a higher level of qualification (for example, RNs and LVNs) for many staff.
• Standardized, mandatory training courses. The standardized training courses were very important in giving staff the tools they needed to communicate with patients effectively and to use the business/administrative systems that improved efficiency and the ability to capture data.
• Consistency and immediate feedback. The most recent practice manager emphasized the need for consistency in managing staff. He/she observes staff on a regular basis and provides immediate feedback on their communications with patients and other performance issues to maintain quality standards.

50
APPENDIX: COURSE DESCRIPTIONS
CUSTOMER SERVICE COURSES
Connecting with Customers for General Staff This course was implemented in July 2007 and is ongoing. The course was
designed for Health System administrative employees responsible for patient satisfaction. It targets staff members who interact with customers directly or indirectly, over the telephone or in-person, and need to use effective communication techniques to build rapport and to succeed at work. Employee participation rates, for the majority of the FPG practices, are measured on the FPG Ambulatory Scorecard with a benchmark of 80%+ to meet target.
Learning Objectives
By attending this training, participants are able to:
• Reflect on patient views and expectations of Health System and conclude how perceptions impact providing good customer service.
• Examine the myths of good customer service. • Illustrate scripts and behaviors for good patient interaction and
introduction. • Demonstrate how to connect with those we serve in 90 seconds or less.
Learning Benefits
• Concluding this training, participants should:
• Take on a new perspective to enlighten their outlook on patient care. • Discover that the old ways of doing things may interfere with their growth
and success. • See an increase in positive interactions as they begin to consistently apply
new techniques. • Become more comfortable and confident approaching patients, patients’
families, and others they serve or work with.
Connecting with Customers for Management Staff This course was implemented in July 2007 and concluded at the end of 2009, since
the majority of our FPG leadership had completed the courses. This course was designed for Health System administrative employees appointed in a leadership role. It targeted all levels of management responsible for patient satisfaction, and who championed employee job performance by providing on-the-job feedback, coaching, recognition, and review. Leaders were required to attend the management session before any of their direct reports could be enrolled in the general session. By asking leadership to attend courses first,

51
supervisors would then know firsthand what was taught to their employees and would be better equipped to support their employee’s training plan back on the job. Additionally, leadership would be able to follow up on whether or not the newly learned behaviors were applied with the implementation of a formula to “make training stick” in support of sustainability.
Going forward, management is asked to attend the general staff session, review “making training stick” literature posted on the patient communication training web site, and complete/submit an online pledge to support staff performance back on the job.
Dealing with Difficult Patient Situations This course was implemented in October 2008 and is ongoing. The course was
designed for Health System administrative employees responsible for patient satisfaction. It targets staff members who might have to deal with a situation where something has gone wrong, and they are then faced with an upset, uncooperative, and/or complaining customer. As of FY11, employee participation rates are measured on the FPG Ambulatory Scorecard with a benchmark of 80%+ to meet target.
Learning Objectives
By attending this training, participants are able to: • Examine the factors that contribute to difficult patient interactions and
explore strategies to prevent them from occurring. • Uncover their emotional triggers and practice managing those triggers
during difficult patient encounters. • Recognize when a patient is trying to bait them into a confrontation and
become more prepared to respond appropriately. • Apply the L.A.S.T. service recovery strategy during difficult patient
encounters. • Simulate how to use assertive limit setting and enforcement to deal with
patients that are verbally abusive. • Identify the resources available when faced with a threatening or violent
patient encounter. Learning Benefits
Concluding this training, participants should:
• Know how their perceptions play a role in how they treat patients. • Discover the behaviors that can make an innocent situation become
difficult and learn how to increase positive interactions even with upset patients.
• Know how to manage emotions when dealing with rude, unfriendly, and unpleasant patients in order to maintain control and ensure a more positive outcome.
• Have experience applying strategies that rebuild patient loyalty after negative incidents and be more confident and prepared to deal with threatening or violent patient encounters.

52
SYSTEMS TRAINING (BUSINESS APPLICATIONS) COURSES
Introduction to Appointment Scheduling
Financial Systems/IT supported training since the date of purchase and installation until July 2006, when training responsibilities were migrated over to patient communication courses. A new course was designed and implemented in July 2006, which is ongoing. The course is geared towards first-time users who are responsible for scheduling physician appointments and arriving patients.
Learning Objectives
By attending this training, participants are able to:
• Summarize system functionality. • View patient’s appointment details, group schedule, resource availability,
and pending appointments (for rescheduling). • Identify the different print function options and fields. • Confirm appointment arrival and departure by patient and by group. • Update a patient’s appointment status. • Describe patient introduction and interaction initiative and how it links to
appointment scheduling. • Search for and schedule an available appointment. • Recognize and add appropriate appointment comments. • Force book an appointment. • Immediately book an appointment. • Reschedule and cancel an appointment.
Learning Benefits
• Concluding this training, participants should:
• Be more prepared to start using the system—clearly knowing what they need and how to get started.
• Quickly respond to patient inquiries about availability or appointment booking—providing good patient care.
• Know which print options can assist them with appointment communication and how notes correlate with these functions.
• Learn about scripting of patient introduction and interaction initiative and how they can make a different in patient care.
• Search for and book appointments with little difficulty.

53
Appointment Scheduling Maintenance
Financial Systems/IT supported training until July 2006, when training responsibilities were migrated over to patient communication training. A new course was designed and implemented in July 2006, which is ongoing. The course is geared towards first-time users or infrequent users responsible for maintaining physician calendars and practice appointment types, and blocking slots or sessions. Patient communication training also provides instruction and help over the telephone to support on-the-job performance.
Learning Objectives
By attending this training, participants are able to:
• Reference the resources available for obtaining access and support. • Perform the three tasks necessary to add a new resource and open the
resource’s schedule of availability. • Summarize and perform the three options available for blocking a
calendar. • Perform the steps to delete inactive resources and order profiles to ensure
that practice reports remain current. • Evaluate practice records and plan for any required updates.
Learning Benefits
• Concluding this training, participants should:
• Know what they need to have readily available before beginning the Appointment Scheduling Maintenance process.
• Know who to contact for help support when performing Maintenance functions to avoid delays.
• Discover how to keep their practice records current to ensure that their reports will be up-to-date.
• Improve performance when managing maintenance functions.
ADT Outpatient Encounter Registration
Financial Systems/IT supported training until September 2007, when training responsibilities were migrated over to patient communication training. Training design and development were planned and initiated to be in a phased approach. The goal of the project was to supplement the training provided for outpatient registration on the Encounter Registration 2000 system by offering courses on insurance payers in order to improve employee and organizational performance with the billing claim process and revenue cycle. Employees must pass the training course exam to be granted system access.

54
1-Day Introduction Course: September 2007-March 2009
Course Subjects:
• Basic registration terminology. • Patient forms and information. • Don’t forget about service (scripting of patient introduction and
interaction). • Sign-on and security. • Menu functions and navigation. • Patient data searches. • Adding patient records. • Screen flows when encountering patients. • Updating or deleting encounters. • How payors are organized and selected. • The E-ticket process.
3-Day Series Course: April 2009-Present
Course Subjects:
• Our health system. • Front-end operations (workflow, terms, scripts on how to talk to patients). • Billing data (encounter registration fields to claim form). • System sign-on and navigation. • Menu options and database navigation. • Patient-identifiable information. • Searching techniques, steps, and evaluating results. • Confirming the SSN. • Network provider. • Duplicate patient records. • Creating patient IDs. • Masking patient names. • Authorization requirements and entry before encountering. • Encountering self-pay patients and prompt pay discount patients. • Modifying encounters. • Fundamentals of health insurance. • Managed care techniques and types of plans (HMO, PPO, POS, EPO). • Medical groups (capitation, Health System as a whole, RMGs). • Deciphering insurance cards (managed care only). • Selecting FCCs. • Encountering HMO, POS, and PPO patients (adult and minor).

55
Assessment Labs: May 2009-Present
Measures knowledge and skill of existing staff members that have system access, to determine if refresher courses are needed and how much training should be planned. Originally implemented to support the FPG revenue cycle review project.
1-Day Refresher (MC101): June 2009-Present
Scheduled for employees not passing the assessment examination to retrain on managed care health plans not that we have that training curriculum available.
Course Subjects:
• Fundamentals of health insurance. • Managed care techniques and types of plans (HMO, PPO, POS, EPO). • Medical groups (capitation, Health System as a whole, RMGs). • Deciphering insurance cards (managed care only). • Selecting FCCs. • Encountering HMO, POS, and PPO patients (adult and minor).
Management Training: April 2010-September 2010
Faculty practice group leadership requested that a dedicated training course be scheduled to support training existing MSOs on OP Encounter Registration. The FPG Directors Group supported the notation that specialty practice managers and supervisors should complete the same training as new-hire/new-appointment staff in order to effectively train staff on specialty practice-specific requirements, and to support questions on the job. Revisions were made to the new hire 3-day series of training, on the third day of training, in order to provide management specific topics and activities for this offering.
Day 1: Introduction to Outpatient Registration (OPR) Training
Day 2: Insurance Payor Training, Managed Care 101
Day 3: Final Activities—customized to offer a management tool (People Development Plan and Coaching Techniques) to better support staff with on-boarding and performance management, and to facilitate a Q/A session with FPG leaders and experts on encountering and the billing claim process.