improving decision making in organisations - … · improving decision making in organisations 2...
TRANSCRIPT

Improving decisionmaking in organisationsUnlocking business intelligence

Improving decision makingin organisationsUnlocking business intelligence
1

Improving decision making in organisations
2
Contents
Executive summary . . . . . . . . . . . . . . . . . . . . . . . . . . . . . . . . . . . . . . . . . . . . . . . . . . . . . . . . . . . . . . . . . . . . . . . . . . . . 4
The decision making process . . . . . . . . . . . . . . . . . . . . . . . . . . . . . . . . . . . . . . . . . . . . . . . . . . . . . . . . . . . . . . . . . . . . 6
2.1 Developments in the role of the management accountant . . . . . . . . . . . . . . . . . . . . . . . . . . . . . . . . . . . . . . 6
2.2 Effective decision making . . . . . . . . . . . . . . . . . . . . . . . . . . . . . . . . . . . . . . . . . . . . . . . . . . . . . . . . . . . . . . . . . . . 7
2.3 Management information today . . . . . . . . . . . . . . . . . . . . . . . . . . . . . . . . . . . . . . . . . . . . . . . . . . . . . . . . . . . . . 8
2.4 Developments in management information . . . . . . . . . . . . . . . . . . . . . . . . . . . . . . . . . . . . . . . . . . . . . . . . . . . 10
2.5 Could business intelligence be the next big thing? . . . . . . . . . . . . . . . . . . . . . . . . . . . . . . . . . . . . . . . . . . . . . . 12
Business intelligence . . . . . . . . . . . . . . . . . . . . . . . . . . . . . . . . . . . . . . . . . . . . . . . . . . . . . . . . . . . . . . . . . . . . . . . . . . . 16
3.1 Developments in business intelligence . . . . . . . . . . . . . . . . . . . . . . . . . . . . . . . . . . . . . . . . . . . . . . . . . . . . . . . . 16
3.2 Recent developments in business intelligence . . . . . . . . . . . . . . . . . . . . . . . . . . . . . . . . . . . . . . . . . . . . . . . . . . 18
3.3 What now? . . . . . . . . . . . . . . . . . . . . . . . . . . . . . . . . . . . . . . . . . . . . . . . . . . . . . . . . . . . . . . . . . . . . . . . . . . . . . . . 20
3.4 Who are the main players? . . . . . . . . . . . . . . . . . . . . . . . . . . . . . . . . . . . . . . . . . . . . . . . . . . . . . . . . . . . . . . . . . . 21
3.5 What next? . . . . . . . . . . . . . . . . . . . . . . . . . . . . . . . . . . . . . . . . . . . . . . . . . . . . . . . . . . . . . . . . . . . . . . . . . . . . . . . 22
The role of the management accountant in business intelligence . . . . . . . . . . . . . . . . . . . . . . . . . . . . . . . . . 24
4.1 Management accountants and business intelligence . . . . . . . . . . . . . . . . . . . . . . . . . . . . . . . . . . . . . . . . . . . . 24
4.1.1 BI strategy . . . . . . . . . . . . . . . . . . . . . . . . . . . . . . . . . . . . . . . . . . . . . . . . . . . . . . . . . . . . . . . . . . . . . . . . . 24
4.1.2 Business case . . . . . . . . . . . . . . . . . . . . . . . . . . . . . . . . . . . . . . . . . . . . . . . . . . . . . . . . . . . . . . . . . . . . . . . 26
4.1.3 Cost savings . . . . . . . . . . . . . . . . . . . . . . . . . . . . . . . . . . . . . . . . . . . . . . . . . . . . . . . . . . . . . . . . . . . . . . . . 27
4.1.4 Increase profitability . . . . . . . . . . . . . . . . . . . . . . . . . . . . . . . . . . . . . . . . . . . . . . . . . . . . . . . . . . . . . . . . . 28
4.1.5 Intangible benefits . . . . . . . . . . . . . . . . . . . . . . . . . . . . . . . . . . . . . . . . . . . . . . . . . . . . . . . . . . . . . . . . . . . 28
4.2 Implementation . . . . . . . . . . . . . . . . . . . . . . . . . . . . . . . . . . . . . . . . . . . . . . . . . . . . . . . . . . . . . . . . . . . . . . . . . . . 29
4.3 Data quality . . . . . . . . . . . . . . . . . . . . . . . . . . . . . . . . . . . . . . . . . . . . . . . . . . . . . . . . . . . . . . . . . . . . . . . . . . . . . . . 34
4.4 Performance management . . . . . . . . . . . . . . . . . . . . . . . . . . . . . . . . . . . . . . . . . . . . . . . . . . . . . . . . . . . . . . . . . . 37
4.5 Analytics . . . . . . . . . . . . . . . . . . . . . . . . . . . . . . . . . . . . . . . . . . . . . . . . . . . . . . . . . . . . . . . . . . . . . . . . . . . . . . . . . . 39
Conclusion . . . . . . . . . . . . . . . . . . . . . . . . . . . . . . . . . . . . . . . . . . . . . . . . . . . . . . . . . . . . . . . . . . . . . . . . . . . . . . . . . . . . 42
References and further reading . . . . . . . . . . . . . . . . . . . . . . . . . . . . . . . . . . . . . . . . . . . . . . . . . . . . . . . . . . . . . . . . . 43
Appendix: glossary of terms . . . . . . . . . . . . . . . . . . . . . . . . . . . . . . . . . . . . . . . . . . . . . . . . . . . . . . . . . . . . . . . . . 45
12
3
4
567
Figures
Figure 1 Transformation of finance . . . . . . . . . . . . . . . . . . . . . . . . . . . . . . . . . . . . . . . . . . . . . . . . . . . . . . . . . . . . . . . . . . . 6
Figure 2 Management accountancy’s expansion . . . . . . . . . . . . . . . . . . . . . . . . . . . . . . . . . . . . . . . . . . . . . . . . . . . . . . . . 7
Figure 3 How management information has expanded . . . . . . . . . . . . . . . . . . . . . . . . . . . . . . . . . . . . . . . . . . . . . . . . . . 10
Figure 4 Service interfaces insulate business processes from IT change,
and IT from business process change . . . . . . . . . . . . . . . . . . . . . . . . . . . . . . . . . . . . . . . . . . . . . . . . . . . . . . . . . . 17
Figure 5 The business intelligence ‘stack’ . . . . . . . . . . . . . . . . . . . . . . . . . . . . . . . . . . . . . . . . . . . . . . . . . . . . . . . . . . . . . . 19
Figure 6 An example of a dashboard . . . . . . . . . . . . . . . . . . . . . . . . . . . . . . . . . . . . . . . . . . . . . . . . . . . . . . . . . . . . . . . . . . 23
Figure 7 The evolving role of BI . . . . . . . . . . . . . . . . . . . . . . . . . . . . . . . . . . . . . . . . . . . . . . . . . . . . . . . . . . . . . . . . . . . . . . . 25
Figure 8 Reasons for using data warehousing and BI . . . . . . . . . . . . . . . . . . . . . . . . . . . . . . . . . . . . . . . . . . . . . . . . . . . . 26
Figure 9 Stages of a business transformation project where the risks of failure are highest . . . . . . . . . . . . . . . . . . . 29
Figure 10 An example of a partial benefits dependency network . . . . . . . . . . . . . . . . . . . . . . . . . . . . . . . . . . . . . . . . . . . 31
3

Improving decision making in organisations
Business leaders and management accountants must be alert to the potential of current developments in the role of the finance function (finance transformation) and business intelligence (BI). The combination of these developments provides an opportunity to reshape decision making and improve performance.
4
There is a risk that competitors may have already established a competitive advantage through better decision making informed by better management information.
Management accountants have important roles to play in unlocking the potential in BI and finance transformation. BI may threaten some traditional accounting roles in producing management information but it presents new opportunities to stimulate stalled finance transformation projects and release management accountants’ capacity to take on decision support roles and improve decision making.• The role of the finance function is being transformed.
Leading organisations have already grasped the opportunities presented by finance transformation to improve the efficiency of accounting operations. They have also developed finance personnel who can be deployed to help improve decision making across the business. The CIMA Improving Decision Making Forum (the CIMA Forum) contends that any organisation not transforming their finance function in this way could be putting their competitive position at risk.
• Meanwhile, BI has matured as a technology and expanded to include the reporting and analysis or performance management tools used by accountants. Problems with data quality and the integration of systems are being addressed. Major companies in certain sectors already use BI to achieve competitive advantage. This technology is becoming cost-effective for a wider range of sectors and for smaller companies too.
The term business intelligence is often used to describe the technical architecture of systems that extract, assemble, store and access data to provide reports and analysis. It can also be used to describe the reporting and analysis applications or performance management tools at the top of this ‘stack’. But business intelligence is not just about hardware and software. It is about a company wide recognition that a company’s data is an important strategic asset that can yield valuable management information and implement change so that this information is used to improve decision making.
1 Executive summary

Management information needs have expanded and business intelligence has evolved to meet these needs. For example, Business Objects, Cognos and Hyperion performance management applications were often seen as specialised reporting tools for accountants. They are now seen as business intelligence tools and have been acquired by SAP, IBM and Oracle to complete their BI stacks.
The CIMA Forum notes that leading companies are seizing the opportunities presented by developments in business intelligence to provide a broader range of management information in more accessible formats and conducting more forward-looking analysis to improve decision making. But, while competitors are gaining a competitive advantage, business intelligence strategies have stalled where senior executives either do not see the potential in BI for their organisation or do not ensure that the company’s data is managed to generate management information that is used to improve decision making.
Likewise, finance transformation has stalled where senior executives do not have a shared vision for the new, broader, role of finance in improving decision making. If accounting is about producing management information and finance is about applying that knowledge, then too many accountants are still fully occupied by accounting roles in the reporting cycle of accounts, budgets, reports and forecasts and they do not have the capacity to challenge for these new finance roles.
Management accountants should consider the potential for BI in their business and be prepared to champion BI projects where it is appropriate. It could enable them to provide a wider range of information in more accessible formats. In addition to reporting and monitoring, they could provide more forward-looking analysis based on a combination of both financial and non-financial information. It could also release many accountants from the rigour of the reporting cycle to take on decision support roles.
5
Therefore, management accountants should work more closely with their colleagues in IT to help develop and implement a BI strategy. • They can work with IT to develop a BI strategy and
the business case for the investment in BI. They should help determine the actions to be taken and risks to be managed so the expected benefits can be realised.
• They can support implementation, ensuring that change management and project management disciplines are applied.
• They can help ensure data quality; perhaps taking responsibility for this often unclaimed problem area.
• They can help to articulate the business’s information needs for decision making and support performance management with metrics that reflect value creation.
• They can support less quantitative or financially articulate colleagues in the business with analysis and modelling of financial and non-financial data to assess performance and enable evidence based decision making about the future.

Improving decision making in organisations
The CIMA Improving Decision Making Forum (the CIMA Forum), consisting of senior accountants from leading organisations, notes that some leading businesses may have a competitive advantage because they have already transformed their finance and accounts operations. They have streamlined processes and standardised systems. They use shared service centres, whether in-house or outsourced, to achieve economies of scale and form centres of excellence in routine processes and increasingly in higher value services too. But, in addition to increasing the efficiency of the finance function they have also improved its effectiveness in supporting value creation. They have developed finance personnel as business partners and deployed them to help manage performance and improve decision making across the business.
The CIMA Forum’s members find it useful to distinguish between management accountants’ roles in accounts
6
and in finance. They describe accounts as the production of standard reports, budgets, forecasts, analysis and management information; whereas finance is about the application of financial expertise and business understanding to provide insights and to support decision making.
As the finance and accounts function is transformed, there will always be a demand for accountants with technical accounting expertise, for example as specialists in information systems and statutory reporting. But the area of greatest opportunity will be where accounting and management skills are combined in financial roles to support decision making. CIMA’s surveys of its membership confirm that qualification as a management accountant conveys levels of professional competence and standards that equip members to challenge for a broad range of finance and management roles.
2 The decision making process
2.1 Developments in the role of the management accountant
Figure 1 Transformation of finance
Source: PricewaterhouseCoopers, LLPCopyright: DM Review Magazine, April 2001
���������������
��������������������������
������������������������������������������
����������������������
���������������
��������������������������
����������������������
�������������
��������������������������
���������������������
���

Figure 2 Management accountancy’s expansion
Source: CIMA, August 2008
7
The diagram in Figure 1 from PricewaterhouseCoopers illustrates how the finance function is being transformed. Transaction processing costs have been reduced through investment in systems and process improvement and the emphasis has shifted to decision support. Leaders are already at the next stage where management accountants are deployed across the business to support decision making in business functions.
The CIMA Forum contends that, with globalisation giving access to similar resources and competition causing many business processes to converge on similar standards, decision making is the key to superior performance. And the CIMA Forum warns that any company that fails to transform its finance and accounts function to support decision making could be putting its competitive position at risk.
Entrepreneurial spirit and business judgement (that human ability to weigh intangibles and ambiguity) will always be important in decision making. But the risks of personal bias, repeating past mistakes, acting on guesses or following hunches unnecessarily, can be limited if a culture of evidence based decision making is fostered.
Providing evidence in the form of financial and management information has long been the basis for accountants’ role in the decision making process. Supporting the strategic planning process and providing the metrics and analysis to support evidence based decision making are important. But these will no longer suffice. The CIMA Forum believes that management accountants have a much bigger contribution to make.
The emphasis in recent years has been on financial controls, risk management and providing transparency in reporting. But the trend in management accountancy’s expansion continues towards management skills and supporting decision making(see Figure 2).
2.2 Effective decision making
����������������
����������������������������������
����������������������������������������
���������������
���������������
����������������
���������������������
������������
��������������������
�����������������
�������������������
����������������
�����
����������������������
���
���
���
���
�����
���������������������
���������������
���������������
���������������

Improving decision making in organisations
Effective decisions are those that achieve impact. An effective decision making process spans from how strategic decisions are informed and considered, through how performance and risk are assessed and managed, to how routine operational decisions are guided, made and governed so the intended impact is actually achieved. Management accountants who can combine financial expertise with business understanding have the potential to support decision making in a wide range of roles throughout this process.
Training as a management accountant combines accounting and business disciplines so it helps to develop accountants who can support decision making. As CIMA’s focus is on qualifying accountants who meet employers’ needs rather than for public practice, the CIMA syllabus reflects employers’ expanding requirements. The CIMA qualification is for people with ambition that is broader than becoming an accountant.
Nowadays, employers don’t just want accountants with the technical skills to produce accounts. They want accountants who can apply financial expertise in support of the business and contribute to leadership. The domain of management accountancy has expanded in line with this general trend in employers’ emphasis from technical skills and financial reporting to management skills and decision support through to impact.
‘We have surveyed our customers in the business and found that what they value most in finance/business partners is that their finance process training has given them an understanding of business processes, inherent risks and financial impact. This means that they know what it takes to get things done and can attend to the detail.’
Simon NewtonVice-President North Atlantic Finance
and shared services, Kimberly-Clark
8
Enterprise resource planning (ERP) systems have done much to improve processes and rationalise operational data but information still gets duplicated and copied on to multiple systems, making it difficult to ensure consistency and security. Finance, sales and operations reports rarely agree. Even when the data comes from the same ERP source, the reports may not reconcile because of the extract process or how the report was written.
Over recent years specialist software houses have developed performance management applications to address the shortcomings of the accounting modules offered by the major ERP vendors. The CIMA Forum finds that these are better than ERP systems for performing activities such as consolidation, budgets and reforecasts. Some can also deliver insightful management information directly to managers’ desks. They can be used by business users to view scorecards or dashboards, generate their own reports, drill down for more information or conduct analysis. They are a form of business intelligence (BI) application.
Accountants’ main area of interest with regard to BI has been in these financial reporting, consolidation and analysis applications. Business Objects, Cognos and Hyperion are probably the best known. Leaders have invested in these as ‘best of breed’ performance management applications. However, these have often been acquired as solutions for the finance function to produce traditional forms of management information more efficiently rather than as part of a business wide BI strategy.
Elsewhere, and sometimes despite the investment in these BI applications, many accountants still use spreadsheets to re-work numbers, to consolidate information from different systems, to conduct ad hoc analysis and produce reports, budgets, forecasts and reforecasts. This focus on producing management information or ‘number crunching’ perpetuates the myth that accountants are scorekeepers on the sideline rather than players on the business team. It limits their potential to take on business partnering roles.
2.3 Management information today

SurveyMeanwhile, new forms of management information are required to support decision making. The range of information, degree of analysis and presentation format expected by decision makers, knowledge workers, operational staff and external stakeholders is changing.
According to Roger Tomlinson of Rolls-Royce, ‘ERP systems originally threatened the role of the management accountant but actually they have generated extra work for them.’
Rolls-Royce has developed a BI application to tackle the ‘spreadsheet monkey’ problem.
As Roger says, ‘this constant re-working of numbers added no value. Now, the numbers are the numbers and we have more transparency. The debate is much less about whether the numbers are right or how they could be flexed. Management accountants can now help us to consider the business issues and the actions to be taken.
The real benefit of this system to more senior executives is the transparency it provides. The only downside for managers reporting to them is the transparency it provides. The numbers can’t be fudged so the business issues have to be addressed.’
9
Business Objects and CIMA have been surveying companies’ reforecasting capabilities annually for over five years. This capability is an indicator of the quality of a company’s reporting and analysis systems.
The research still finds that ‘many organisations feel they cannot reforecast as often or as quickly as they would like. In fact, evidence suggests that little – if any – progress has been made during the five years since this survey was first initiated.
This inability to reforecast appears due to either the amount of time it takes operational line managers to reforecast resource requirements or how much time it takes the finance function to complete a round of reforecasting. The type of application used for budgeting and reforecasting appears to make little difference to the time it takes organisations to produce an annual budget or complete a reforecast.
Central to the inability to reforecast is the failure to incorporate non-financial or operational data within the budget that helps to predict future resource requirements, and the limitations of the budgeting systems that organisations currently employ.
Regardless of the types of applications companies used for budgeting or reforecasting, much of this modelling is still done offline, on spreadsheets.’
Source: CIMA/Business Objects, 2007

Improving decision making in organisations
The quality of management information expected by business users is expanding both in terms of the range of data to be considered and the level of analysis required (as shown in Figure 3). There is an increased demand for information at all levels. From strategic issues to routine tasks, executives, managers, information workers and staff all expect more information and clearer insights to support decision making. Financial information alone will not suffice. Management information must relate financial tonon-financial data and not just report past performance but monitor the current operations and help to predict the future too.
Regulators, shareholders and stakeholders also require more information and greater transparency about the company’s operations. New financial reporting standards help but financial accounts alone will not provide the clarity required. They will have to be supported by informative narrative notes and commentary as championed by CIMA, PricewaterhouseCoopers and Radley Yeldar in the
10
Report Leadership initiative. This requires discussion of strategy, performance and prospects drawing on a broad range of financial and non-financial data.
If organisations are to be able to meet evolving reporting requirements, they will have to capture and process a wider range of data to produce new business metrics and allow innovative analysis. In time, quoted companies may be expected to report more frequently and/or make current data available over the internet in a standard format (such as extensible business reporting language (XBRL)) so analysts and investors can conduct their own analysis.
The internet has allowed new business models. Management is changing too. Working practices are more flexible. Change is the norm. Cross-functional teams work together on a constant series of initiatives. Company structures are less hierarchical and more open. Virtual collaborative networks are being formed with suppliers and customers.
2.4 Developments in management information
Figure 3 How management information has expanded
Source: CIMA, August 2008
Range of data
Model the future
Monitor current
Report the past
Leve
l of
anal
ysis
Reco
rd
calc
ulat
e co
mm
ent
grap
hics
an
alyt
ics
Financial operational customer external

11
Survey
A 2007 survey commissioned by Business Objects from the Economist Intelligence Unit (EIU) found that nine out of ten corporate executives admit to making important decisions on the basis of inadequate information (2007).
‘Less than one in ten executives in the survey receive information when they need it, and 46% assert that wading through huge volumes of data impedes decision making. Worse still, 56% are often concerned about making poor choices because of faulty, inaccurate or incomplete data.’
‘Senior management decision making at the majority of the surveyed companies (55%) is largely informal and unstructured, with executives consulting others largely on an adhoc basis. Most executives seem comfortable with these arrangements: only 29% think poor decision making structures are a common cause of bad choices. This reflects a view expressed by several interviewees that strategic decisions always require a strong element of intuition or judgement. Nevertheless, there can be no doubt that better data and processes would take some of the guesswork out of decision making. Common metrics and greater use of information tools such as dashboards would also help to support better quality decisions.’
Lord Bilimoria, founder and CEO of Cobra Beer, an Anglo-Indian firm said, ‘You cannot make proper decisions without proper information.’
‘Fully 56% of respondents say they are often concerned about making poor choices because of faulty, inaccurate or incomplete data. Generally speaking, their confidence in the quality of information emanating from within the organisation is high only when it comes from finance. There is a good deal less satisfaction with information coming from HR and IT, as well as from regional and country head offices.’
Also timeliness of information is an issue. ‘Only 10% of executives report that the information to make a decision is usually there as needed, with more than one third admitting it is only available after a long delay or not at all. Another 40% also say that waiting for information to be updated is a common cause of delay in their decision making. And 46% agree that having to process huge volumes of data slows decision making at their companies.’
Source: Kielstra, Economist Intelligence Unit sponsored by Business Objects, September 2007
Many people now routinely use the internet to source information, publish content, socialise, play, access software and collaborate. As employees these people expect ready access to internal information via an intranet. Customers and suppliers also expect to be able to access relevant information too.
Meanwhile, BI has developed and is becoming pervasive, covering financial and non-financial data,
and capable of making information available to a wide range of users as appropriate to their roles. There are new solutions to address problems with data quality and the integration of systems. Major companies in the financial, telecoms, retail and some government agencies have been early adopters. But this technology is now more mature and is becoming cheaper. It is already being used across a wide range of sectors and by smaller companies too.
Improving decision making in organisations
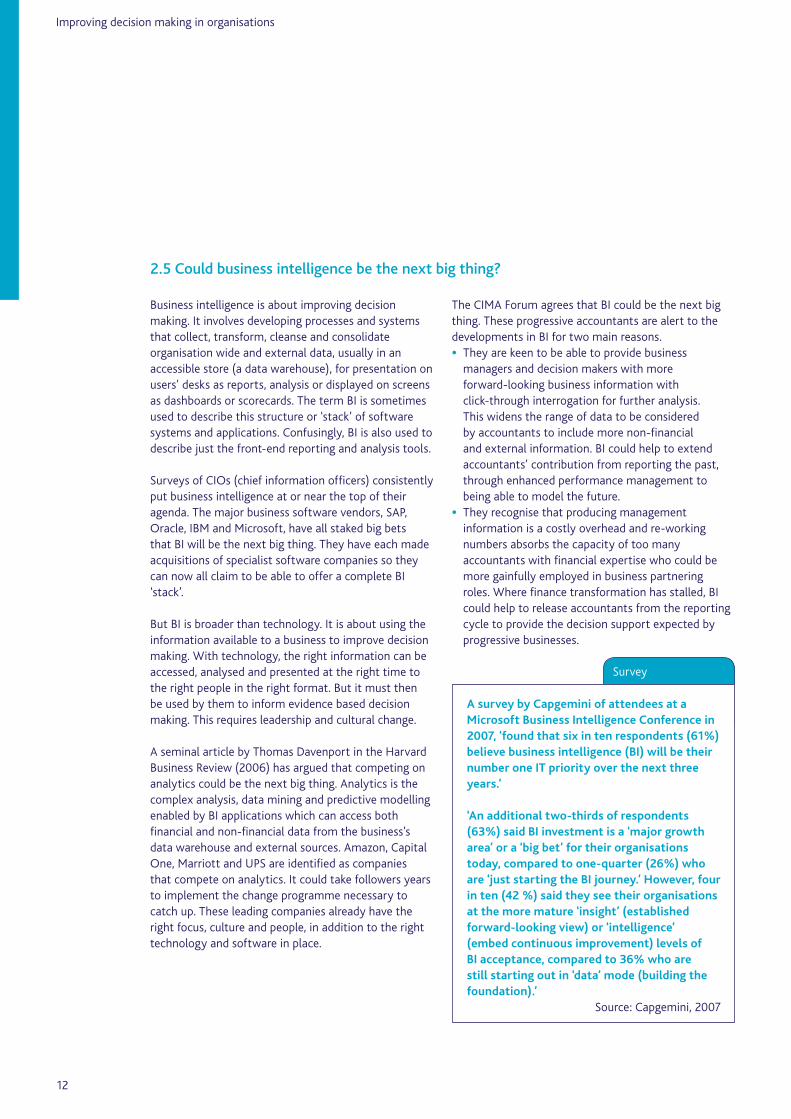
Business intelligence is about improving decision making. It involves developing processes and systems that collect, transform, cleanse and consolidate organisation wide and external data, usually in an accessible store (a data warehouse), for presentation on users’ desks as reports, analysis or displayed on screens as dashboards or scorecards. The term BI is sometimes used to describe this structure or ‘stack’ of software systems and applications. Confusingly, BI is also used to describe just the front-end reporting and analysis tools.
Surveys of CIOs (chief information officers) consistently put business intelligence at or near the top of their agenda. The major business software vendors, SAP, Oracle, IBM and Microsoft, have all staked big bets that BI will be the next big thing. They have each made acquisitions of specialist software companies so they can now all claim to be able to offer a complete BI ‘stack’. But BI is broader than technology. It is about using the information available to a business to improve decision making. With technology, the right information can be accessed, analysed and presented at the right time to the right people in the right format. But it must then be used by them to inform evidence based decision making. This requires leadership and cultural change.
A seminal article by Thomas Davenport in the Harvard Business Review (2006) has argued that competing on analytics could be the next big thing. Analytics is the complex analysis, data mining and predictive modelling enabled by BI applications which can access both financial and non-financial data from the business’s data warehouse and external sources. Amazon, Capital One, Marriott and UPS are identified as companies that compete on analytics. It could take followers years to implement the change programme necessary to catch up. These leading companies already have the right focus, culture and people, in addition to the right technology and software in place.
12
The CIMA Forum agrees that BI could be the next big thing. These progressive accountants are alert to the developments in BI for two main reasons.• They are keen to be able to provide business
managers and decision makers with more forward-looking business information with click-through interrogation for further analysis. This widens the range of data to be considered by accountants to include more non-financial and external information. BI could help to extend accountants’ contribution from reporting the past, through enhanced performance management to being able to model the future.
• They recognise that producing management information is a costly overhead and re-working numbers absorbs the capacity of too many accountants with financial expertise who could be more gainfully employed in business partnering roles. Where finance transformation has stalled, BI could help to release accountants from the reporting cycle to provide the decision support expected by progressive businesses.
2.5 Could business intelligence be the next big thing?
Survey
A survey by Capgemini of attendees at a Microsoft Business Intelligence Conference in 2007, ‘found that six in ten respondents (61%) believe business intelligence (BI) will be their number one IT priority over the next three years.’
‘An additional two-thirds of respondents (63%) said BI investment is a ‘major growth area’ or a ‘big bet’ for their organisations today, compared to one-quarter (26%) who are ‘just starting the BI journey.’ However, four in ten (42 %) said they see their organisations at the more mature ‘insight’ (established forward-looking view) or ‘intelligence’ (embed continuous improvement) levels of BI acceptance, compared to 36% who are still starting out in ‘data’ mode (building the foundation).’
Source: Capgemini, 2007

13
Business leaders and management accountants need to be alert to the developments in BI and what it means for them. As always, new IT looks promising but there are dangers.
• Some early converts may find that they are not at the leading edge but at the ‘bleeding edge’. This is the term used wryly in IT to describe the vendors’ learning experience with users of early release versions of new software.
• Some business users will fall for a BI application, usually with fancy graphics, that promises to meet their own department’s requirements. This may seem satisfactory at first but could prove to be inflexible later. It could form another information silo if it can not be integrated with a company wide BI system.
• A fragmented market is consolidating. Many products will have new owners. Some of these may no longer be supported and upgraded. The provider’s strategy may not be to support and develop the product acquired but to migrate the customers acquired to its own product or cross-sell further products.
• Following a feeding frenzy, newly acquired subsidiaries’ products are still being digested. Sales people may unwittingly over-promise these applications’ ease of connectivity with other systems, future support or ease of implementation.
• Good enough may be good enough. It may suffice to ensure that the data behind key performance indicators is correct. Real time access to all data may not be necessary.
• BI applications can already offer much more functionality than the users currently require. If they pay for functionality and do not learn to use it, they may not realise the benefits that underpinned the business case.
• The potential for BI should be considered. Some organisations could continue to miss out on the opportunity. The audiences at BI events are mostly enthusiastic IT people. There are few converts yet from the finance or business management communities.
• Organisations may decide that BI is not appropriate for their business at this stage but they should consider developing IT investment policies that would enable rather than hinder a strategy in the future.
• A prudent investment in an ideal system could fail to meet expectations due to difficulties with change and project management during implementation. Leadership and cultural change are required.
Source: CIMA, August 2008

Improving decision making in organisations
14
The true information age
At the heart of virtually every business lies the effective gathering, storage and analysis of information. By 2010, the demand for accurate, timely and secure information will have become yet more intense. Among the areas where the demand for data will grow fastest are the following:
• Collaborative working Whether managing a remote workforce, running a globalised R&D project or working with customers to design a turnkey solution, the 2010 organisation will be more dependent on the flow of data between different locations inside and outside the boundaries of the organisations. ‘The better we are connected to our customers and suppliers, the better off we will all be,’ says Terry Assink, CIO at Kimberly-Clark Corp, a health-and-hygiene company.
• Customer insight Identifying changes in customer behaviour is cited by respondents as the single most significant challenge to product and service innovation that organisations will face over the next five years. A greater understanding of customers’ business or personal needs will be similarly essential to the personalisation of products and services. Inventory management will be more responsive, too – 81% of executives in our survey expect demand, not supply, to drive the production of goods and services in the future. Companies will employ data analytics to address these challenges: nearly half of our respondents tapped this set of tools as the most important new technology for innovation purposes in 2005 – 2010.
• Risk management As recent history shows, there’s no telling what’s around the corner. Businesses must prepare all manner of emergency plans, such as data backup and recovery. ‘The better you prepare, the better you’ll be able to react,’ says Bali Padda, Vice President of logistics at Lego Systems. ‘Who could have predicted September 11 or the heatwave in Europe in 2003?’
• Governance In the coming five years, shareholders, managers and board members will demand more transparency than ever. ‘Shareholders will have much more information about the companies they’re investing in’ in 2010, predicts Tom Dolan, President of Xerox Global Services. ‘A lot more due diligence will be going on.’ The quality of corporate governance will increasingly be a source of differentiation in its own right: 82% of survey respondents believe that brand value will be linked to good governance.
Faced with these manifold demands and the rising tide of data they will unleash, more than three-quarters of surveyed executives across all industries agree that a company’s key challenge in 2010 will be to extract knowledge from information. In the teeth of this challenge, organisations will turn to technology for help: most survey respondents want IT to improve the quality of decision making by getting them the right information at the right time. A majority of survey respondents regard IT as a source of competitive advantage rather than simply as a driver of cost-efficiency. The demands of the information age explain why.
Source: Borzo and McCauley, Economist Intelligence Unit sponsored by SAP, February 2005

15
Capital One
A Fortune 500 company, Capital One is one of the major financial services providers on the internet, with online account decisioning, real time account numbering, online retail deposits, and a growing number of customers serviced online.
Capital One has what is known as an information based strategy, which uses technology and information to ensure that they offer as many customers as possible a credit card, with a credit limit that they can afford to manage.
Using its proprietary information based strategy (IBS) to generate constant innovation, Capital One links its database to prize-winning information technology and highly sophisticated analytics to scientifically test ideas before taking them to market and tailoring products to the individual customer.
Source: www.capitalone.co.uk

Improving decision making in organisations
The emergence of the data warehouse in the 1980s was the dawn of BI. Batches of operational data could now be copied across to a centralised pool of data structured to facilitate access and analysis. Queries could be run without affecting the live data in the operating systems. By the early 1990s, online query and reporting systems began to look like the spreadsheets that have become familiar over recent years. This made BI accessible to business managers for the first time.
Developing the data warehouse and maintaining data quality has been the greatest challenge. The source data can be in a range of ERP instances and other legacy systems. Inconsistencies in the data can lead to the loss of managers’ confidence in the analysis.
Data warehouses were followed by data marts – specialised data stores that further accelerated the process of getting information to managers for the purposes of informing decision making.
Soon people in the business without IT or analytical expertise, wanted to be able to drill down to find out more, conducting their own analysis. This form of tactical business analytics depends on a BI architect having a keen understanding of the business to anticipate the most frequently asked questions. Cubes or data tables can then be developed to allow click through-analysis along pre-determined lines of enquiry. Ad hoc queries still required specialist support.
Online analytical processing (OLAP) cubes and other multi-dimensional analytical tools provided a solution. These allowed managers to slice and dice the subset of data in a cube from lots of different angles. The application of data mining into OLAP cubes provides the opportunity to identify hidden relationships or correlations and so find previously hidden insights, about customer buying behaviour for example.
16
Software houses began to offer packaged business analytic applications targeted at particular user groups including accountants. Although the business applications most familiar to accountants are often termed BI applications, the range of data assessed is usually more limited than true BI. Rather than taking the BI approach and working from company wide data in a data warehouse, they usually bundle an OLAP cube with a BI reporting tool and a dashboard. They may use separate OLAP cubes for each ERP module such as the general, sales, purchase and inventory ledgers.
These applications have often been deployed as tactical solutions to specific problems. Users often selected a tool without reference to IT or Finance, potentially creating a new silo of information. Some have been the preserve of data analysts or IT technicians, others have been acquired independently by users, including the finance function, for their own department’s use.
Reflecting the criticism that accountants can sometimes be scorekeepers on the sideline rather than players on the business team, the accounts function might use a performance management system, a form of BI application, as a financial reporting tool alongside rather than as part of the company wide BI architecture. Meanwhile, the IT function may provide other business users with a data warehouse and dashboards, leaving the accountants marginalised in a parallel universe. Users gain tools to produce reports and miss the opportunity to transform the business.
Lacking expertise in the accounting area, IT professionals have tended to allow accountants to acquire these tools tactically as accounting applications. And, lacking expertise in BI, accountants have often limited their use of these tools to improving the efficiency of current reporting cycle processes such as preparing budgets, consolidations, forecasts and reports.
3 Business intelligence
3.1 Developments in business intelligence

According to Gartner, ‘An inherent risk with packaged analytical applications is that they will create another set of stovepiped application systems. Packaged analytic applications that use proprietary, highly de-normalised data models and do not provide a variety of inbound and outbound interfaces represent the greatest risk to an enterprise’s ability to share information for analysis. An additional risk is that packaged analytic applications may use proprietary tools for data extraction and transformation, thus restricting user flexibility and driving the need for data integration specialists.’ (Rayner, 2007).
17
Over recent years, with IT industry support of open standards, it has started to become easier to link different systems, or components of systems, through an approach called service-orientated architecture (SOA). At last, it seemed as though accountants could have an IT architecture which would release them from re-working figures on spreadsheets so they could deliver business partnering.
IBM explained, ‘This means that information (customer data, for example) can be held in one place and shared among the systems and users that require it – hence the use of the word ‘service’. For example, within the ‘order to cash’ process, a component would be credit checking. This could be configured as a service that is used in several other applications such as order acceptance and cash collection.’ (Hayes, Adams and McMillan, 2007).
Figure 4 Service interfaces insulate business processes from IT change, and IT from business process change
Source: IBM Global Business Services. Reprint courtesy of International Business Machines Corporation copyright 2007 © International Business Machines Corporation
�����������
�����������
�����������
�����������
�����������
�����������
�����������
�����������
�����������������
��������������������������������
�������������������������������
������������������ ������������������
The service model (the interfaces) from a new contract between the business and IT

Improving decision making in organisations
Likewise, Accenture said, ‘Service-oriented architecture (SOA) is having a profound impact on integrating applications and business processes. It enables business process components to be assembled and orchestrated efficiently and rapidly, giving businesses the agility to respond to changing business conditions and deliver distinctive business services.’
A more circumspect view is that SOA can be an additional layer of complexity over the legacy systems, making dependencies less obvious. Rather than using SOA as a patch over legacy problems, the core building blocks of a BI architecture should be put in place.
As Oracle has said, ‘This decades-long evolution did not come without a price. During this time companies purchased and deployed a wide variety of BI related products. They employed different deployment models, different user interfaces, and different management interfaces as well as having different integration requirements. By now companies may have eight, ten, or more different BI products deployed. The cost of maintaining this proliferation of tools and technologies is already high and will get higher.
Organisations that maintain multiple BI products from different vendors face high costs in the following areas:• software licenses – the cost of initially acquiring
and deploying the software• software maintenance – annual charges, typically
15%• IT training – the cost of training IT personnel to
manage and maintain the software• user training – the cost of training users to use
the software• integration – the cost of making multiple
products work together• redundant infrastructure – the cost of managing
and maintaining multiple data stores, metadata repositories and other components.’
18
The typical BI ‘stack’ or architecture can be represented as having a series of layers. The base is usually shown as source data systems from where data is extracted, translated and loaded by extract, transform and load (ETL) software into a data warehouse. Above this is an application layer (or BI layer) and on top of this the presentation or delivery layer which can include executive dashboards, scorecards and other tools that make it easier for managers to find and understand the information and proactively use it in decision making (see Figure 5).
As BI has evolved, the greatest challenge has been how to integrate data on different systems accumulated from different vendors over many years. Traditionally, data flows from source systems to data warehouses then to data marts and cubes to be used in BI applications. Source data can now also come from customer facing applications, suppliers and sources of external information. The data warehouse has the potential to become the information hub that distributes data to and from many data sources and applications.
Software houses used to specialise in different layers of this BI stack and businesses applied a ‘best of breed’ approach to assembling their own stacks. For example, a SAP ERP system might feed data to an Oracle data warehouse and the finance function might use an application from Hyperion for consolidation and reports and another from SAS for more advanced analytics. These solutions were developed by independent software houses to meet different businesses’ needs.
3.2 Recent developments in business intelligence

This integration challenge is being addressed.• Service-oriented architecture is promoted as a
flexible solution which eliminates the need to develop point-to-point connections between resources. It provides access to data in legacy systems through ‘services’ which link together and are combined to provide a business intelligence solution.
• The major ERP, ETL, data warehouse and customer relationship management (CRM) vendors now offer what are claimed to be integrated BI applications, for example SAP BW, Informatica PowerCenter, Oracle Applications and Siebel Analytics. And BI vendors began to add ETL tools, such as Business Objects Data Integrator and Cognos DecisionStream.
19
• The major vendors, SAP, Oracle, IBM and Microsoft, who already had some BI solutions, have expanded into performance management by acquisition. There has been a feeding frenzy and the big players are still digesting their prey. If they succeed in doing so, they are expected to offer better integrated BI solutions.
• Meanwhile, data integration tools, such as those offered by Informatica, already allow data from diverse sources to be integrated into the database layer. This enhances the performance and scalability of BI applications accessing this data.
Figure 5 The business intelligence ‘stack’
Source: CIMA, August 2008
Presentation andinformation delivery
BI applications modellingand analysis
Access and interrogation
Data standardised,integrated andkey data organised
Extract, transformand load
Data captured bysource systems
������������������
���������������������
���
����������
�������������
�������� ������� ����������
��������
�������������������
���
��� ������� ��� ��
�����������������
������������

Improving decision making in organisations
‘It’s difficult to underestimate the value and importance of this next-generation data management solution. First of all, being able to access and integrate data from virtually any business system, in any format, and deliver that data throughout the enterprise at any speed has transformed ACH Food Companies’ ability to acquire other businesses. The Informatica suite is a model for acquisition and bringing in data from third-party sources. Business acquisitions are always a challenge, but with Informatica we are able to reduce the time taken to integrate the legacy systems from an acquired organisation from up to nine months to as little as four months. That accelerated integration provides the company with a faster route to value from the acquired business – and a quicker path to profitability.’
Donnie Steward, CIO, ACH Food CompaniesSource: Informatica
Feeding frenzy
• SAP bought Pilot Software and OutlookSoft Corporation and then Business Objects, which had bought ALG Software, Crystal, Fuzzy!Informatik, Inxight and Cartesis.
• Oracle bought PeopleSoft (which had bought JD Edwards), Siebel Systems, Hyperion Corporation and Interlace Systems.
• Cognos bought Celequest and Applix before being bought by IBM.
• Microsoft acquired ProClarity Corporation, Navision Software A/S, Great Plains Software and Solomon.
20
Business intelligence and business performance management (business analytics) used to be seen as different solutions but the major vendors are integrating them.
BI solutions are becoming more accessible through web enablement and more applicable through the inclusion of a range of data sources and pre-defined business content.
As Gartner put it, ‘the data warehouse DBMS has evolved from a traditional information store supporting business intelligence (BI) users and tools into an analytics infrastructure repository of the enterprise.’ (Feinberg and Beyer, 2007).
Business intelligence has developed from reporting on data from an ERP source to include:• enterprise reporting• financial consolidation• enterprise planning• activity based costing• dashboards (and scorecards)• data mining• data integration• data warehousing• pervasive intelligence• structured and unstructured data.
3.3 What now?

The following observations about the $1bn+ vendors are based on the comments of members of the CIMA Forum. Acquisitions made in the recent feeding frenzy have yet to be digested and integrated propositions developed. This is a dynamic area with frequent announcements of new products, alliances and acquisitions. Research reports issued by the likes of Datamonitor, Gartner and Forrester WaveTM should be consulted for more completeness and authority. SAP and Business ObjectsTogether, these are the biggest players in the BI market. SAP would be best known for their ERP system but they have been expanding into BI with the development of SAP Netweaver and SAP BI Accelerator and with the acquisitions of Pilot Software and OutlookSoft Corporation. The acquisition of Business Objects, a leading vendor of reporting and analysis tools in 2007, should give SAP a strong position in this market. SAP also offers Business ByDesign as a software as a service offering which can make BI cost effective for smaller companies.
Oracle and HyperionOracle’s reputation was originally built on database systems rather than ERP. Siebel already provided Oracle with an analytics capability in its CRM application but the acquisition of Hyperion adds strength in the important area of financial reporting tools. Hyperion is highly rated for its consolidation and financial accounting functionality. It is not yet clear how recent acquisitions will fit together. Oracle’s project ‘Fusion’ is developing a co-ordinated approach. IBM and CognosIBM already had capabilities in databases and data management with its DB2 product and SQL servers. The acquisition of Cognos with its reputation for financial, performance management and planning tools should be a valuable addition to IBM’s Information on Demand suite.
21
MicrosoftThe Windows operating system and the MS Office suite (Word, Excel, Powerpoint etc) may have achieved world domination, but, despite the acquisition of Great Plains, Microsoft’s BI offering is not regarded by many as having the same depth as more specialist competitors’ products. However, with the combination of ProClarity, Dundas Data Visualization and the familiar MS Office suite integrated as the top layer, Microsoft’s new PerformancePoint has the potential to bring BI to a much wider market.
Information BuildersInformation Builders’ BI platform enjoys a good reputation for its ability to integrate data. Their web delivery puts them in a strong position to offer a pervasive BI offering throughout a large organisation.
SASSAS are privately owned. They have a broad BI offering that is highly rated but they are best known for their capabilities in data mining and predictive analytics. They have recently formed a strategic alliance in data processing with Teradata, a data warehouse provider. Some may regard them as expensive but most of their customers are enthusiastic advocates.
These are only the major $1bn+ vendors. There are numerous smaller players who should be considered too. The recent spate of acquisitions demonstrates how highly the major vendors value niche players’ ability to develop innovative solutions. Perhaps while the major vendors are busy integrating their acquisitions, smaller players will continue to provide more innovative solutions.
3.4 Who are the main players?

Improving decision making in organisations
• If the big vendors succeed in integrating their acquisitions so that they can offer a complete BI stack, they may be able to command a greater share of the wallet from their customers. But acquisitions made in the recent feeding frenzy may take time to digest and some users will still prefer to take a best of breed approach so as to reduce dependence on any single vendor.
• Developments in BI architecture have focused attention on certain areas.
– Activity based costing solutions are of growing interest as companies look to understand cost allocation at a granular level to be able to reduce costs and improve process efficiencies.
– Likewise, customer profitability is an area of strategic interest. Analysis from a financial perspective of data from EPoS (Electronic Point of Sale) and CRM systems can yield valuable insights.
– Also, business process management (BPM) is being used in the relentless pursuit of efficiency to examine, analyse and improve processes and business activity monitoring (BAM) software is being used to track performance along processes.
• Data mining and BI are coming together. Data mining identifies patterns, correlations or relationships within a data set. This used to be the preserve of niche players such as SAS, SPSS, InforSense etc. Lately, the main database and BI vendors have been integrating data mining functionality into their offerings. Oracle data mining has been integrated into the database layer and the results can be shown in the BI presentation layer. Microsoft has embedded data mining functionality into its SQL Server. SPSS predictive analytics can be used as an element of the Business Objects XI platform.
• Business intelligence considers structured data from relational databases and brings to light patterns and trends that could guide business decisions. But its scope is now expanding to include unstructured data. Text mining vendors, like Inxight, specialise in gleaning information from unstructured text – such as emails, documents, blogs and web pages. Inxight were acquired by Business Objects in 2007, shortly before SAP acquired them. Informatica also offer solutions for capturing unstructured data through their acquisition of Itemfield in 2006.
22
‘Mawby and King’s main objective with the implementation of a new ERP system is to provide an integrated and consistent business view, helping to improve customer service, purchasing and operating efficiencies. This we believe can be achieved through real time access to the right information to make the right decisions.
We believe that the SaaS model is the perfect ERP delivery model for a smaller company like us, significantly reducing the amount of IT support required and allowing us to focus our core strengths.
Mawby and King decided upon ByDesign as it provides comprehensive ‘end-to-end’ ERP functionality that fully integrates the business cycle and empowers the whole organisation with appropriate business information to be readily available to all users, eliminating the use of several fragmented alternatives.’
Andrew King, Director, Mawby and King LtdSource: SAP
• There is a drive to provide BI for everyone through the provision of embedded intelligence into operational business processes. The vehicle for this is likely to be a mixture of packaged BI analytics which may converge with BAM functionality – which is now likely to be driven through the development of service-oriented composite applications.
• BI will become more economical and will be used more widely by smaller companies. For example, Intuit’s Quickbooks offers a low cost BI for mid-sized companies. Larry Ellision’s (founder of Oracle) NetSuite already hosts BI and CRM services over the internet. And SAP’s Business ByDesign is a new SaaS (software as a service) solution whereby software need not be purchased and maintained in-house but can be accessed as a service over the internet.
3.5 What next?

• BI will become ever more user-friendly. Dashboards present information as attractive graphics and intuitive charts. And, according to their website, by using Google OneBox for Enterprise, users can gain access to real time business data from ERP systems, CRM applications or business intelligence analysis. In time, with fuzzy logic, conducting data mining and predictive analytics could become as user-friendly as searching on the internet.
23
As this example from Dundas shows (Figure 6), a dashboard has more appeal than a monthly information pack. Dundas is a leading provider of this technology – as evidenced by the fact that Microsoft selected Dundas technology for their PerformancePoint suite.
Figure 6 An example of a dashboard
Source: Dundas Data Visualization Inc
A dashboard representing sales KPI’s built by Dundas Data Visualization, using Dundas technology.

Improving decision making in organisations
BI is about improving decision making as is the role of the management accountant. Yet, the congregations at BI events are still mostly enthusiastic IT people. So far, there are few converts from the finance discipline. Even if a CIO can persuade a business to invest in BI, the potential benefits cannot be delivered without engaging the business to implement and use it.
BI could release many management accountants from the budgeting and reporting cycle to take on the business partnering role. It could provide accountants in these roles with a means to be more effective in supporting decision making. Others have become experts in the areas of accounting/information systems or data quality to ensure these systems produce better management information more efficiently.
Management accountants should be engaged in BI because they have important roles to play in helping to realise its potential: • making the business case for investing in BI• implementation of BI projects• ensuring data quality • performance management• analytics.
4.1.1 BI strategyAccenture’s long running analysis of high-performing organisations has identified that they consistently use information technology to not only reduce costs but also to build competitive advantage and drive growth. However, having invested in Y2K ready systems, dot com projects and Sarbanes-Oxley compliant systems, many business leaders are wary of further IT projects. Their concern is that these can over run, exceed budget or fail to deliver the benefits expected. In the current climate they are more keen to save costs than to make further investments.
24
Most large organisations will already have an ERP system and database. These are the core, and usually the most expensive, building blocks of a BI stack. BI reporting and analysis tools could allow non-technical business users access to the potentially valuable data already captured. Investing in BI tools could be seen as an incremental cost to release the potential in this data. Often, some business users will have already acquired applications for their own department’s purposes. But unless there is an agreed BI strategy, these will probably have been acquired tactically within a local budget rather than strategically as part of an organisation wide BI programme.
For example, the finance function may have BI tools that access data from the ERP system and allow them to produce consolidated financial reports, budgets, forecasts and financial analysis. Meanwhile the sales and marketing people may have a CRM system that maintains customer data and records contact with customers on a database. Without a common approach and consistency in the data analysed, it is not uncommon for the finance and marketing disciplines to present conflicting views at board level.
In companies that grow through acquisition or which allow business units a high degree of autonomy, the lack of a consistent BI strategy can lead to a fragmented structure of systems and applications. Imposing common operating standards may require cultural change as well as IT investment. Even when local autonomy is not an issue, business users must be engaged throughout the development of the BI strategy and its implementation. Otherwise there will not be ‘buy-in’ and the expected benefits will not be realised. Users may not use the new BI to its full potential. They may continue to expend energy in work-rounds or even continue to invest in their own local solutions.
4 The role of the management accountantin business intelligence
4.1 Management accountants and business intelligence

The future role of BI in the company should be determined. A co-ordinated BI approach could start with an assessment of the organisation’s needs and current solutions. The risk to the company’s competitive position of not investing in BI should be considered.
IT professionals have the expertise in IT architecture but often require the support of the finance function to help make the business case for BI. The business case can be challenging because, although, there may be some efficiency gains, much of the pay-off from BI may have less to do with cost saving than risk mitigation and value creation.
25
‘A BI strategy is advantageous to an organisation, but it requires finance and IT to engage with senior executives and key stakeholders. Management accountants have long been tasked with the provision of information for decision making; BI technology will assist in this process in the future. Therefore there are opportunities for the management accountant to ensure that BI systems deliver valuable information to business users and provides them with decision support. Management accountants are best placed to see where the automated provision of information will deliver the best results to the organisation.’
Kevin Cooper, Finance Manager, AOL BroadbandSource: MIAGEN
Figure 7 The evolving role of BI
Source: Chris Brooker of Obis OmniObis Omni provides support for professionals interested in BI, see: www.obisomni.com
Used by analysts
Historical data
Fragmented view
Reporting results
Tools in silos
Pervasive use
Real time, predictive data
Unified, enterprise view
Analytics to optimise business processes
Unified infrastructure and prebuilt analytic solutions

Improving decision making in organisations
4.1.2 Business case
26
BI, as with any IT investment, has no intrinsic value; it must be used by the people in the business if it is to enable the business to derive economic value. BI is an IT enabler which should allow changes in the way data is processed and information produced. Business changes will occur if the reporting and analysis tools are used and the information obtained is acted upon. This can provide tangible and intangible benefits which the business can use to generate economic value.
Figure 8 Reasons for using data warehousing and BI
Source: PMP ResearchCopyright: Cliff Mills, Evaluation Centre, 2008
Improve quality ofdecision making
Improve data accuracyand integrity
Improve performancemeasures
Provide access toreal time data
Provide insight intotrends
Increase customerawareness
Improve marketing andsales information
0 1 2 3 4 5
On a scale of 1-5 where 1 = ‘not important’ and 5 = ‘very important’
4.5
4.3
4.1
3.7
3.7
3.5
3.3
Although, as this chart from PMP Research shows, the main reasons for investing in BI are for soft benefits, the business case for the investment in BI must meet firm investment objectives based on a cost/benefit analysis. Organisations will take different approaches but achievement of a target return on investment (ROI), payback within a set period or a positive net present value (NPV) are typical approaches.

The direct costs are relatively straight forward to quantify. Many of the building blocks may already be in place. Where new investment is necessary, the cost may be offset to some extent by savings on software licenses and training on a diverse range of legacy systems. In addition to hardware, software, consultancy fees and training, due allowance should be made for proper project governance and change management, without which the hoped for benefits are unlikely to be realised. A contingency factor in line with comparable implementations must also be allowed.
For most enterprises, the potential benefits from today’s BI and performance management software already exceeds their ability to fully exploit them. Users may be empowered to find new unforeseen ways to get further value from the investment in BI in the future but these benefits cannot be taken into account in the investment appraisal.
The only benefits that can be considered in investment appraisal are those for which there is a plan to realise. These will arise from: • the enablers that a broad based project
implementation team with senior level sponsorship contracts to deliver
• the changes that business managers commit to make to realise benefits and generate economic value that can be assessed against investment objectives.
As BI can be used widely throughout the organisation, and even outside through an extranet, the business benefits can be wide and varied. Benefits are unlikely to be realised and the investment objectives met unless there is clarity about the benefits and economic value expected at the outset and a project plan established to manage benefits realisation. These benefits can be grouped into three main categories: costs savings, increasing profitability and intangible benefits.
27
4.1.3 Cost savings• BI tools can be used to produce management
information that is already produced in-house. With the benefit of BI it should be possible to provide this information on a more up-to-date basis, in a more user-friendly format with greater accuracy. There should be quantifiable savings in the production of this information and in the re-working of figures.
• BI tools are user-friendly. Users will be empowered to conduct ad hoc analysis which would previously have required support from the IT function.
• These savings will include efficiency gains, often expressed as numbers of full time equivalent (FTE) employees. To realise these as actual cost savings, for example through redundancies, can be difficult but the capacity released can be deployed to provide more valuable support to the business.
• The BI tools may, to some extent, replace a disparate array of tools already being used. This should yield benefits in terms of savings in software licensing and training costs.
• Virtualisation (bundling applications on a smaller number of servers) can save costs as fewer servers will be required.
• The ability to comply with reporting and regulatory requirements is a form of licence to trade. Without a BI solution, these requirements can only be met with ad hoc analysis. There should be a potential saving here too.
– Changing reporting standards will require greater transparency about business performance and prospects. Narrative reporting requires commentary on financial and non-financial indicators.
– Compliance with regulations can require disclosure of data that may not be readily accessible without a BI solution.

Improving decision making in organisations
4.1.4 Increase profitabilityBI tools will be used for new reports and analysis which should lead to increased profitability through improved operating performance and better strategic focus on profitable products and segments. For example:• Sales people who are better informed about a
customer’s situation and preferences, product holdings, cost to serve and profit margins should be able to achieve more profitable sales.
• Greater transparency enhances performance. Internal benchmarking between individuals and divisions which are measured on a consistent basis can help to identify best practice and raise standards.
• Negotiators can be better informed about the economics of current or comparable arrangements when agreeing contracts with suppliers or customers. Potentially uneconomic arrangements can be identified promptly and renegotiated at the earliest opportunity.
• Advertising and promotional spend can be better focused on initiatives with a higher probability of success based on better analysis of the evidence about the performance of past campaigns.
• Some data may have value outside the business. For example, supermarkets sell EPoS data to their suppliers.
28
4.1.5 Intangible benefitsSome benefits may be intangible. These too can be of value and considered as part of the business case if they will be used by the business to generate value. • The use of planning tools and the ability to identify
trends early should allow a company to forecast more accurately. More prompt closing of period end accounts gives an impression of good systems. Over time, these can reduce investors’ perception of the level of risk and increase shareholder value.
• Greater clarity about which products, segments and customers are most profitable and those which are uneconomic can be used to improve the retention of valuable relationships. These can be defended from competitors and business developers can focus attention on winning more relationships with similar potential. The profitability of less economic products or customer relationships might be improved through using lower cost channels, cross-selling or more appropriate pricing.
• Emerging trends can be spotted earlier and improved or new products and segments developed.
The challenge is to make these benefits clear so as to win buy-in from business managers and their commitment to make use of the benefits which the IT investment will enable to deliver value.
Gaming sector business
‘Our finance team presented a compelling business case for improving our fraud risk controls. With KPMG’s support, they identified patterns of collusion and credit card abuse within online gaming, and assessed registration and authorisation procedures to highlight where fraud detection triggers could be enhanced. They also developed new rules and behavioural triggers to predict where customers were likely to be acting dishonestly. This has helped us to increase our fraud detection rate whilst reducing the level of ‘false positives’ found during subsequent investigations.’
A Chief Executive Officer.
Source: KPMG

The objective of a BI project is not to acquire the latest in IT systems but to improve decision making by delivering the information and analysis that decision makers require at different levels in the organisation and ensuring that this information is used. This can require change of a transformational nature.
Academic research commissioned by CIMA (Grabski et al, 2008) has shown that board management’s project
29
sponsorship was the most critical success factor and that when management accountants were involved in the implementation of an ERP system there was an increased likelihood of success. Successful ERP implementations released management accountants’ capacity to provide decision support. As one top management interviewee put it, they became ‘business partners, not just budget buddies’. This should hold true for BI implementations too.
4.2 Implementation
Figure 9 Stages of a business transformation project where the risks of failure are highest
Source: Capgemini/EIU Trends in Business Transformation (online survey of 125 Western European C level execs inUS$500m+ companies and interviews with 15)
����
Implementation
Communication of objectives
Formulation of strategy andtransformation objectives
Planning of implementation
Post-implementation
Recruitment and motivationof project team
New solution design
No stage tends to be riskiest
Hig
h
Low
37.6
8.8
7.2
6.44.8
10.4
12 12.8

Survey
Improving decision making in organisations
Research by Capgemini into risk in business transformation projects found that implementation is regarded as the stage where the risk of failure is highest (see Figure 9). Project management and change management disciplines have to be applied. Appropriate people from each of the following levels across the business must be engaged.• Strategic decision makers need to be able to review
the business’s strategic position, assess opportunities and risks to prepare strategic plans and to track and review performance in implementing these plans. They will also require management information, financial reports, budgets and forecasts.
• Knowledge workers, including business managers, accountants and marketers, require information, statistics and analysis about the performance of their area. Dashboards, reporting and portals may be required. Some will need to be able to drill down predetermined queries to identify root causes. Others will want to conduct ad hoc analysis and commission reports or forecasts. Usually only more expert users will conduct data mining and advanced analytics, but these tools are becoming more user-friendly too.
• Operational level workers require information, sometimes in real time, about the customer, product or process they are handling. Call centre workers, for example, need access to information about the customer with whom they are dealing. They may be prompted by business rules to ask appropriate questions or offer further products or services. Guidance as to customer value may give them discretion to resolve a valuable customer’s issue promptly, for example by waiving a charge in the event of a complaint.
Some of these people might help form a business intelligence competency centre (BICC). This is a panel of experts which may co-ordinate the implementation of a BI project. This panel often oversees the management of the BI architecture in the business and can serve as a decision support centre.
30
Dr. Thomas D. Queisser of Troy University and Ms Gloria Miller of Maxmetrics GmbH surveyed 529 respondents from 50 countries representing 30 industries. 83.2% or 425 of the respondents indicated that their organisation uses decision making software. 73% or 312 of the respondents indicated that their organisations used decision making software and also indicated having adecision making support entity.
Dr Queisser and Ms Miller found that ‘implementing a decision making support entity (a BICC) can deliver superior decisions, and based on managers’ assessments organisational performance. Although some non-adopters reported quality, speed, or performance improvements without a specific BICC investment, BICC adopters did report a higher degree of improvement thannon-adopters.’
Source: Queissar and Miller, 2008
However, the key to achieving a BI project’s investment objectives is that the business managers who can deliver the project’s benefits must be engaged in the investment decision. They must contract that, subject to the IT enablers being delivered and the necessary changes being made in the processing of data and the generation of information, they will make business changes to use the improved intelligence and deliver the benefits promised, accepting responsibility for generating economic value.
Demonstrations of BI’s potential benefits to them, based on samples of real data (in data marts, for example) may be important in convincing these key business users about the potential of BI.

According to Professors Joseph Peppard and John Ward of Cranfield and Elizabeth Daniel of the Open University Business School, realising benefits depends on a network of IT enablers, IT enabled changes and business changes to realise benefits that will lead to economic value that can be assessed against investment objectives. A benefits dependency network (BDN) provides a framework for explicitly linking the overall investment objectives and the requisite benefits with
31
the business changes which are necessary to deliver those benefits and the essential IT functionality needed to both drive and enable the changes to be made.
The table in Figure 10 is an example of a (partial) benefits dependency network for a new customer relationship management system for a European paper manufacturer.
Figure 10 An example of a partial benefits dependency network
Source: Peppard, Ward and Daniel, 2007
Measure outcome of campaignsre objectives
To improve the effectiveness of Advertising and
Promotion(A&P) spend
Customer and prospectdatabase
Reduce marketing staff time on
admin activities
Use database to improve targeting
in segmentsCoordinate sales and marketing
activity infollow-up
To increase sales value and
volume from new customers
Realign sales activity with
new customer segments
Enquiry quotation and response
tracking system
Increase sales time with customers
Increased conversion rate of
leads-to-orders
Release sales time from post-sales
activityto pre-sales
Use system to target sales
activity/contact time
IT enablersEnabling changes
Business changes BenefitsInvestment objectives
Increased response rate
from A&P campaigns
Increased rate of follow up leads
Allocate sales time to potential high value leads
Reduced cost by avoiding waste on irrelevant customers
Identify most appropriate
communication medium for
target customers
Campaign planning and management
system
Introduce project management for all A&P campaigns
Contact management
systemRedefine customer segments
Introduce new account management
processesNew sales staff
incentives
Wireless PCs and PDAs for sales
staff

Improving decision making in organisations
32
Case study
Eleanor Windsor, Head of BI at European law firm Osborne Clarke, says a critical first step is to set up across-functional project team to look at the use of management information across the business. The key success factor here is to involve people from as many different areas of the organisation as possible – finance, IT, knowledge management, sales, directors/senior managers from the business.
These are the critical aspects to address in the review process.• Robust? Data quality is critical. In Osborne Clarke, the data quality concerns related to culture, processes
and getting buy-in. The review had to get to grips with the problems and take steps to address them.• Timely? It is equally important to ensure information is delivered in sufficient time to be useful and that
the information is up-to-date.• Relevant? Management information and those responsible for the different systems need to properly
understand their audience so the information they collate and then analyse is relevant to them.• Presentation and comparison of data must spark interest. The current trend is to present ‘digital
dashboards’ but will they suit your audience? The information needs to be given context, for example relative to the previous period or targets.
• Insight is the critical bit. Osborne Clarke addressed this by setting up a small specialist team to lead a separate BI function. The team has a variety of different skills, from running CRM systems to research and project management.
This group networks across the business. It is responsible for all research projects, whether one-off or regular surveys, external or internal. The BI function takes responsibility for a range of areas, including regular company wide reporting, business planning and competitor analysis. By doing so, the team develops insights, internal relationships and reputation to ensure a robust and respected business critical function.
A useful spin-off is the ability to combine internal and external information. Internal management information can be contextualised by research into recent market, economic and competitor trends, providing a broader view and helping to identify trends and opportunities.
Source: Evaluation Centre, 2008
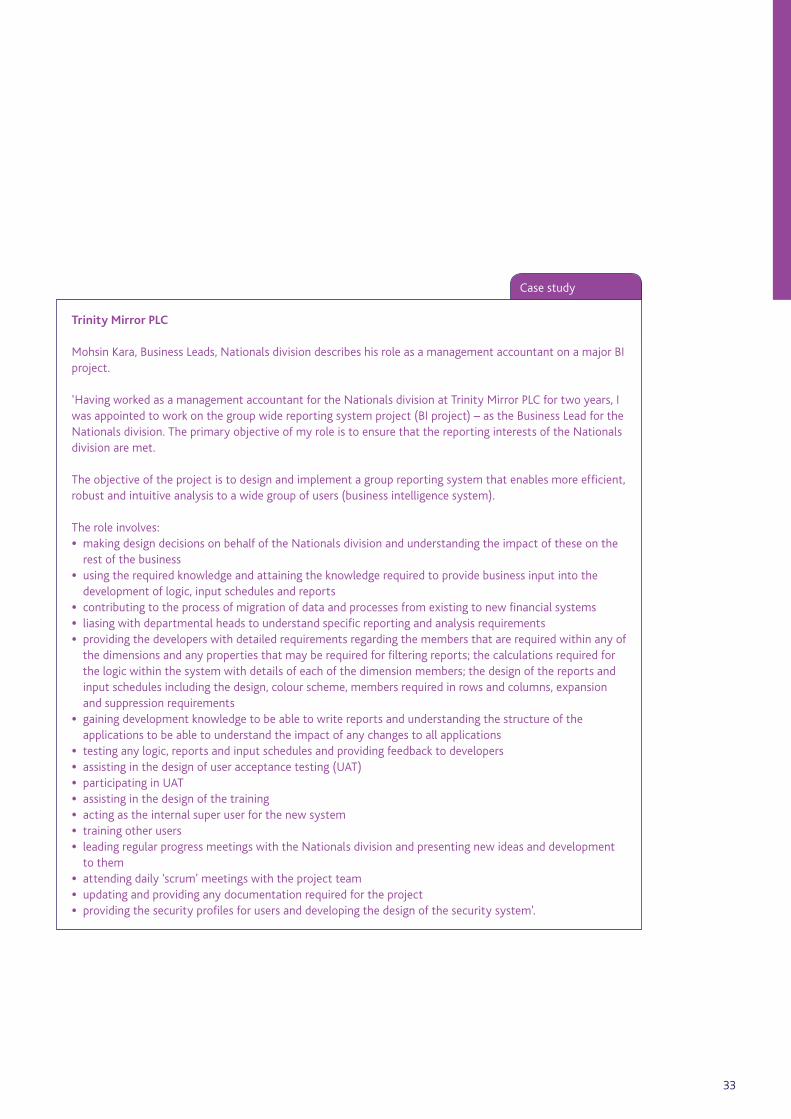
33
Case study
Trinity Mirror PLC
Mohsin Kara, Business Leads, Nationals division describes his role as a management accountant on a major BI project.
‘Having worked as a management accountant for the Nationals division at Trinity Mirror PLC for two years, I was appointed to work on the group wide reporting system project (BI project) – as the Business Lead for the Nationals division. The primary objective of my role is to ensure that the reporting interests of the Nationals division are met.
The objective of the project is to design and implement a group reporting system that enables more efficient, robust and intuitive analysis to a wide group of users (business intelligence system).
The role involves:• making design decisions on behalf of the Nationals division and understanding the impact of these on the
rest of the business• using the required knowledge and attaining the knowledge required to provide business input into the
development of logic, input schedules and reports• contributing to the process of migration of data and processes from existing to new financial systems• liasing with departmental heads to understand specific reporting and analysis requirements• providing the developers with detailed requirements regarding the members that are required within any of
the dimensions and any properties that may be required for filtering reports; the calculations required for the logic within the system with details of each of the dimension members; the design of the reports and input schedules including the design, colour scheme, members required in rows and columns, expansion and suppression requirements
• gaining development knowledge to be able to write reports and understanding the structure of the applications to be able to understand the impact of any changes to all applications
• testing any logic, reports and input schedules and providing feedback to developers• assisting in the design of user acceptance testing (UAT)• participating in UAT• assisting in the design of the training• acting as the internal super user for the new system• training other users• leading regular progress meetings with the Nationals division and presenting new ideas and development
to them• attending daily ‘scrum’ meetings with the project team• updating and providing any documentation required for the project• providing the security profiles for users and developing the design of the security system’.

Improving decision making in organisations
‘We chose to work with a boutique BI consultancy as they can put experienced principals on the project team. Once we consulted with Miagen we realised the true value of implementing the new system through our finance department. In retrospect we can clearly see how natural it is for finance to take the helm with business intelligence. It is not just because the accountant is better equipped to deal with interpreting the data it is also because it is only a small step for those with spreadsheet know-how to adapt to business intelligence technology.’
Norbert Grey, Vice President Finance and Administration, dotMobi
Source: Miagen
34
4.3 Data quality
Companies often have a variety of operational sources across different vendor platforms and technologies. In data warehousing and BI solutions, a great deal of effort must go into sourcing, transforming, integrating and cleansing data from source systems as data must be migrated into a common structure in the data warehouse.
To support evidence based decision making, leading organisations’ accounting and finance functions can no longer rely on multiple data sources, different and often inconsistent data sets and accountants’ work-arounds. These finance functions are showing leadership and pressing for a consistent way of doing business, relentless process improvement and automation, and a single data set, across the whole organisation. This requires data management.
Case study
BPO Freight
Pete Bandtock, Director Finance BPO at DHL Freight in Basel, Switzerland.
‘In-house financial or management accountants are known as controllers in Europe.
A crucial role where finance/management accountants/controlling (call it what you will) can come in – and that is in the overall question of programme governance.
Different functions within an organisation clearly have different priorities and needs – I think controlling is the right place for all these requirements to come together and for overall development priorities to be set. Somebody has to do this arbitration after all. There are significant advantages of having it here – not least of which is that figures coming out of the controlling organisation are generally viewed with less suspicion by the organisation as a whole than those coming out of a less rational department (for example marketing).’

To manage data effectively, many of these leading global organisations are working to streamline their accumulation of systems and standardise operating processes globally. Some leaders, Diageo for example, are moving towards a single instance of ERP.
As IBM’s 2007 report on ‘Finance strategy: delivering the partnering role’ states, ‘When we see organisations with fragmented and inconsistent sources of information, we are witnessing a lack of governance. Where there is a vacuum, we believe that the CFO should own the governance process around information integrity because weaknesses in this ultimately are reflected in financial results. This is not the same as saying that the CFO should own all the data, as clearly others are better placed to own information originating in their domain. For example, marketing may own customer relationship management (CRM) data, finance owns accounts receivable data but finance ensures that there is an overarching governance framework in place.’(Reprinted courtesy of International Business Machines Corporation copyright 2007 © International Business Machines Corporation).
The ideal is to capture data correctly in the first instance and to have control mechanisms to eliminate duplication and inconsistent classification in subsequent records. Accountants are well placed to apply disciplines learned in accounting processes to help ensure the quality of data.
35
• The starting point is to analyse or profile the data to understand its quality and completeness. Data sources must be assessed to identify which system stores what, which is more authoritative and where inconsistencies exist. This helps to assess the complexity of the data transformation exercise.
• Meaningful data integration requires a common set of definitions of metrics – for example, what is a customer? For accounts, a customer may be a debtor. The key to this is clearly articulating the business requirements and objectives of the project. Common master data definitions will have to be determined.
• Data quality assurance – incoming data may need to be corrected, enhanced and validated through the transformation process. This requires a data rejection and error management process. Suspect data must be analysed in the data warehouse or, preferably, at the point of origination.
• Virtualisation (sharing servers) and moving towards network attached storage (NAS) or storage area networks (SANs) can improve data governance. NAS and SANs provide greater agility in the way users store data.
• Data quality management tools allow data from disparate systems to be integrated into a data warehouse, and provide a mechanism for monitoring and improving quality. A master data management (MDM) or customer data integration (CDI) application may appear to be needed but many of the problems with data are people issues that can still occur after investing in MDM or CDI.

Improving decision making in organisations
36
Case study
John Hemming, formerly of Royal Sun Alliance (RSA):
‘RSA are a major general insurance provider globally. I was programme manager for the implementation of an ERP system in the UK. The business case was based on the need for standardisation of reporting (one version of the truth) and a reduction in the costs of providing ad hoc reporting, analysis and the like.
An ERP system cannot provide complete flexibility and the whole point of BI is that it gives flexibility and control to the end user instead of a huge database of information. Instead, everyone tailored the standard reports to suit their own customers (for example, directors) albeit with standard numbers. ERP is not the answer. For the management accountant to succeed as a building partner, he must have control not only of the data but of its style, quality, timeliness and above all the scope of the data so that the non-financials which support the financials are relevant to their customers and also explain the numbers.
Being reliant on IT or anyone else (statisticians, MBAs etc) to provide this information would preclude the business partner from controlling the critical aspects of data validity and timeliness, but more importantly, the scope of data, much of which is hard for non-business people (like IT) to properly understand when there are non-standard questions and analysis that cannot be formalised into algorithms. If there is a strong actuarial based culture as in an insurance company like RSA, or something similar, then the business partner must have a strong relationship with this function.
In fact that function should really report to the FD for this to work properly – which was the case with RSA. Without this control then these functionaries will do everything ‘perfectly’ and ‘to professional standards’ which is not what is always required. Management information is full of assumptions, estimates and so on which will never be perfect and the danger is that these guys will aim for perfection unless someone gives them a sense check.’

Alex Plenty, a senior manager in Deloitte’s consulting practice, suggests a three pillar approach to addressing data quality.
Data risk management• Link key data items to critical business
processes.• Identify controls and monitor these data items
as they impact the processes.• Identify and quantify issues and attribute the
cost/benefit of fixing these.• Identify areas exposed through lack of controls
(e.g. access controls).• Prioritise efforts based on a cost/benefit
analysis of the required solutions.
Data quality technology• Identify the root causes of data quality loss
through machine to machine data flows.• Implement data enhancement through
one-off and business-as-usual (BAU) data ‘quality gates’.
• Monitor data quality levels against KPIs using automated processes.
Data governance• Create policies and procedures to govern
creation, standardisation and dissemination of data.
• Identify the data stewards.• Assign the appropriate levels of responsibility
to a central group, whilst allowing local autonomy within defined parameters.
Source: Evaluation Centre, 2008
37
Enterprise performance management (EPM), corporate performance management (CPM), enterprise information systems (EIS), decision support systems (DSS) and management information systems (MIS) are all terms used to describe BI tools which measure key business metrics and present this information as feedback to decision makers and managers of operations or processes.
Too much business planning can be focused on budgets and financial metrics. These are often measures of outcomes in the short run rather than indicators of performance towards achieving strategic intent.Non-financial metrics may better describe progress towards achievement of a sustainable competitive advantage for the long run.
The financial and non-financial metrics and theclick-throughs for further analysis most readily available through a packaged application may not be the right ones to present. Tracking the wrong metrics or using the wrong metrics in recognition or reward mechanisms can lead to perverse outcomes.
The metrics presented and the analysis allowed should enable management to investigate properly and take prompt action to improve business performance. Determining what the right metrics to track are and the right lines of enquiry is a challenge which management accountants can help organisations address.
4.4 Performance management

Improving decision making in organisations
A consensual approach can be used to identify the key performance indicators (KPIs) that are critical to sustainable success. A balanced scorecard might be used and suitable KPIs selected under the standard headings of customer, operations, finance and learning. Appropriate KPIs can then be selected for different roles in the organisation. This can have the advantage of simplicity and be useful for winning buy-in to the performance management system. But performance measures selected in this manner may not be useful for managing progress towards achieving strategic objectives nor are they likely to help manage the true drivers of value. • Being familiar with the strategic planning process and
the contributions of different divisions, management accountants are well placed to ensure that the metrics selected can be used to measure progress towards achieving the organisation’s performance targets and strategic objectives.
• Management accountants in business partnering roles should engage with business managers to
38
Case study
Tony Gallagher, Senior Vice President of Information Services, Reckitt Benckiser
Reckitt Benckiser, the market leader in household cleaning products and owner of familiar brands – such as Dettol, Calgon, Lemsip, Immac, Harpic and Mr. Sheen in Europe, and Lysol, Resolve, Woolite, Wizard and French’s Mustard in North America – uses ProClarity (now owned by Microsoft), and is an example of a global manufacturer’s aggressive and effective use of business intelligence.
‘It all comes down to what drives shareholder value in our industry. This means Net Revenue Growth, Operating Profit Growth, and Net Working Capital Reduction. However, there are equally importantnon-financial indicators, like market growth, consumer spending, market share, brand competition, as well as soft indicators within supply and sales categories. In short, we needed a BI tool to support our business financially and non-financially, as well as on a strategic, tactical and operational level, and provide management information down to a transaction level.’
‘ProClarity is going to save us enormous amounts of administrative time – a major benefit for a cost conscious organisation – since we will no longer need to search (manually) for KPI details in books or by sifting through numerous reports from our transactional systems. Furthermore, it will also stop the ad hoc ‘what happened and why’ requests for information from users, who now have the means to answer these queries themselves.’
Source: Rockport Software
help identify the best metrics to use to manage performance, risks and progress towards strategic objectives. Assumptions should be challenged as to the evidence on which they are based. Constructing and testing a causal model can be a useful exercise. The value of the metrics used should be subject to review.
• Having selected the metrics to be used, aligned KPIs for people in different roles at strategic, knowledge worker and operational levels have to be identified. Having numerous KPIs distracts focus and can generate extra cost in producing information. A disciplined approach, based on the value versus cost trade-off can be used to manage the demand for management information.
• Finance must take responsibility for non-financial metrics as well as financial ones so these KPIs have credibility. They can then be used with confidence to support decision making, planning, forecasting and predictive modelling.
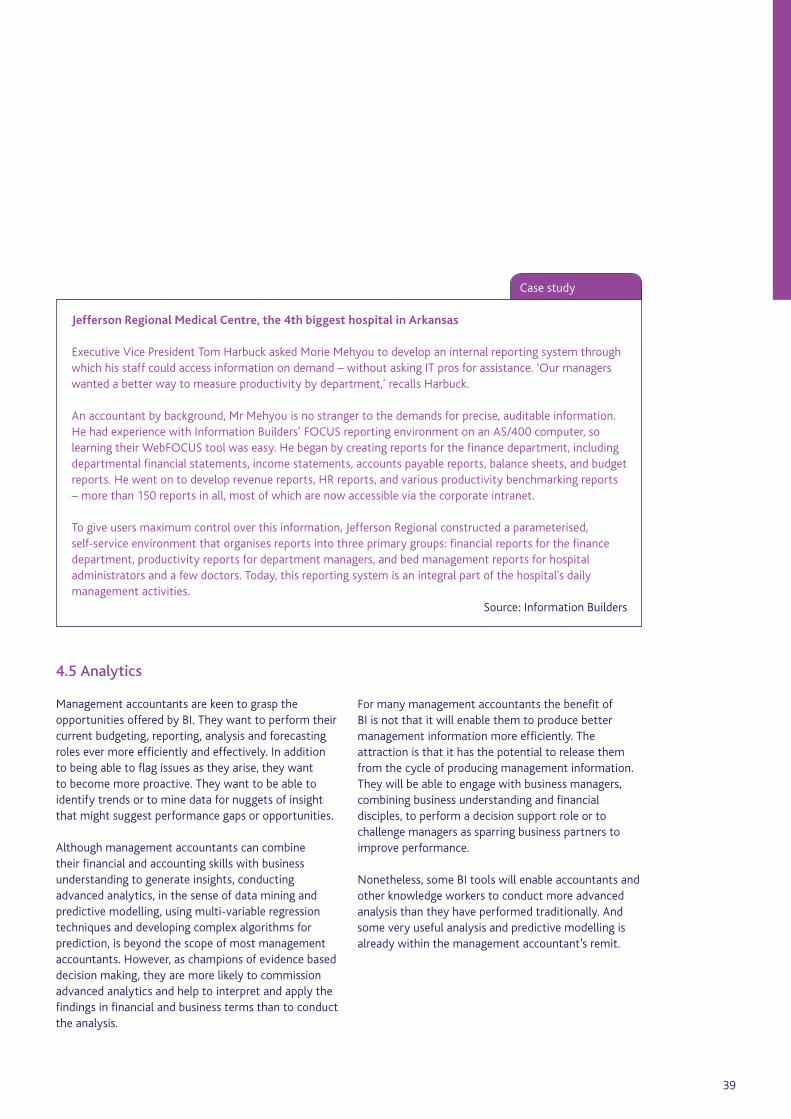
4.5 Analytics
Management accountants are keen to grasp the opportunities offered by BI. They want to perform their current budgeting, reporting, analysis and forecasting roles ever more efficiently and effectively. In addition to being able to flag issues as they arise, they want to become more proactive. They want to be able to identify trends or to mine data for nuggets of insight that might suggest performance gaps or opportunities.
Although management accountants can combine their financial and accounting skills with business understanding to generate insights, conducting advanced analytics, in the sense of data mining and predictive modelling, using multi-variable regression techniques and developing complex algorithms for prediction, is beyond the scope of most management accountants. However, as champions of evidence based decision making, they are more likely to commission advanced analytics and help to interpret and apply the findings in financial and business terms than to conduct the analysis.
39
For many management accountants the benefit of BI is not that it will enable them to produce better management information more efficiently. The attraction is that it has the potential to release them from the cycle of producing management information. They will be able to engage with business managers, combining business understanding and financial disciples, to perform a decision support role or to challenge managers as sparring business partners to improve performance.
Nonetheless, some BI tools will enable accountants and other knowledge workers to conduct more advanced analysis than they have performed traditionally. And some very useful analysis and predictive modelling is already within the management accountant’s remit.
Case study
Jefferson Regional Medical Centre, the 4th biggest hospital in Arkansas
Executive Vice President Tom Harbuck asked Morie Mehyou to develop an internal reporting system through which his staff could access information on demand – without asking IT pros for assistance. ‘Our managers wanted a better way to measure productivity by department,’ recalls Harbuck.
An accountant by background, Mr Mehyou is no stranger to the demands for precise, auditable information. He had experience with Information Builders’ FOCUS reporting environment on an AS/400 computer, so learning their WebFOCUS tool was easy. He began by creating reports for the finance department, including departmental financial statements, income statements, accounts payable reports, balance sheets, and budget reports. He went on to develop revenue reports, HR reports, and various productivity benchmarking reports – more than 150 reports in all, most of which are now accessible via the corporate intranet.
To give users maximum control over this information, Jefferson Regional constructed a parameterised, self-service environment that organises reports into three primary groups: financial reports for the finance department, productivity reports for department managers, and bed management reports for hospital administrators and a few doctors. Today, this reporting system is an integral part of the hospital’s daily management activities.
Source: Information Builders

Improving decision making in organisations
40
to a segmentation of public houses allowed Punch to identify underperformance in product categories. Sara’s team not only produced this analysis but also helped to develop and manage the implementation of plans to close this performance gap.
Case study
Sara Shipton, Director of Finance, Punch Taverns PLC
‘Punch Taverns owns 8,500 licensed properties, and leases around 7,400 of these properties to individual entrepreneurs who run pub retail businesses of their own. The agreements under which these businesses are leased vary, primarily according to level of obligation to buy drink products from the company. This obligation is nearly always for beer, and sometimes for other drink categories like, cider, wines, spirits and minerals.
The estate therefore contains a mix of lessees, who buy non beer categories from the company because they are obliged to, under the terms of their lease, or because they find our prices competitive, and/or they like the advantages of a single delivery of drinks. Since some are not obligated, and also since some don’t comply to the terms of the lease, we have long been aware that there is a large sales/compliance opportunity that we had not tapped into. Knowing where sales were sub-optimal, and moreover, where to challenge retailers for ‘buying-outside of the tie’, however, and where to target our field teams, was very difficult.
In December 2006, Punch Taverns purchased a managed pub company, Spirit Group. A managed house business model is different, in that the pub is run by an employed manager, and the entire retail business is owned by the company. It immediately became apparent that since we now owned and had access to pub retail EPoS data, by segmenting the estate by style of pub operation, we could more accurately provide gap analysis between the non beer sales to our leased pubs, against what we know the throughputs in a like size and style pub in the Spirit estate was.’
For example, as director of finance at Punch Taverns PLC, the UK’s largest pub company, Sara Shipton has demonstrated how management accountants can use new forms of data analysis to produce insightful information and also challenge the business to improve performance. Relating analysis of EPoS data

41
Case study
Andrew Waterer, Director at KPMG specialising in Data Analytics and Business Intelligence, is a CIMA member who has taken his experience as a management accountant on BI projects into consulting. Andrew believes that there is an opportunity for management accountants to use analytics to help improve fraud risk management. For example:
A service sector organisation
‘Fraud is a serious business risk for us. We needed to track the movement of goods between suppliers and the accuracy of the reporting of those movements. The relevant data was contained in large, voluminous reports that were provided from a range of suppliers. Reporting structures had been frequently modified, creating inconsistent and incomplete information. We engaged KPMG to support a project team that included key personnel from finance, IT and operations. We have invested in pattern recognition technology to process the reports and organise them into a consistent data structure. We apply fuzzy matching to both supplier and goods descriptions, to counter attempts to conceal the nature of transactions and to allow for the reconstruction of supply chains. Our finance team can now assess supply chain patterns for fraudulent activity, identifying and investigating suspicious suppliers. As a result we have reduced our losses to fraud, and rationalised our reporting arrangements to address control weaknesses and improve transparency in the supply chain.’
Source: KPMG

Improving decision making in organisations
Business intelligence could inform better decision making in business. Everyone in management needs to be alert to this opportunity and the threat that early adapters may achieve a competitive advantage.
But BI is only a technology enabler. Management accountants have important roles to play if BI is to be of value. The necessary changes will have to be implemented properly. People will have to use it to produce information and that information still has tobe applied in decision making and, for those decisions to be effective, they will have to be managed through to impact.
The accounting and finance function has been transforming and statutory reporting has become more specialised. Accounting operations are about using streamlined and standardised processes, structures and automation to produce better information, ever more efficiently. Employers now need more finance personnel to support decision making across the business and to help manage performance through to achieving impact. Developing accountants to take on these broader roles is a work in progress. Meanwhile, many management accountants are still too occupied in the reporting cycle of producing more traditional management information to progress to these new roles.
The nature of the management information and analysis required by business has expanded. The range of data to be considered now includes non-financial and external information. The emphasis has shifted from reporting through monitoring to providing information and analysis as appropriate to users’ roles. These users may be strategic managers, knowledge workers, people in operational and customer facing roles or external stakeholders and regulators.
42
Business intelligence is evolving to meet these information needs. It now encompasses the reporting and analysis tools used for performance management by accountants. Advances in data management and better integration of systems will enable BI to provide better management information to inform decision making.
Management accountants should be champions of BI. It may threaten the traditional roles of accountants in producing financial and management information. While there will be opportunities for some to become experts in using business intelligence and more advanced analysis, for many more BI presents an opportunity to take on financial management or business partnering roles. The future for these accountants may not be in accounts but in finance with wider career prospects, as players on the team rather than as scorekeepers on the sideline.
5 Conclusion

Accenture (2007), Getting creative: driving performance through SAP-based solutions.
Borzo, J. and McCauley, D. ed. (2005), Business 2010: embracing the challenge of change, The Economist Intelligence Unit sponsored by SAP.
Capgemini (2007), Business intelligence to become leading business priority according to Capgemini survey at Microsoft business intelligence conference,Press release, 15 May 2007.
Capgemini. www.capgemini.com
Capital One. www.capitalone.co.uk
CIMA (2007), Improving decision making in organisations: the opportunity to transform finance, Executive report.www.cimaglobal.com/decisionmaking
CIMA/Business Objects (2007), The reforecasting report: 2006 survey of current practices in the UK. www.cimaglobal.com
CIMA/PricewaterhouseCoopers/Radley Yeldar/Tomkins (2006), Report Leadership, Executive report.www.reportleadership.com
Davenport, T. H. (2006), Competing on analytics, Harvard Business Review, Vol. 84, Issue 1, January, pp98-107.
DM Review Magazine. www.dmreview.com
Dundas. www.dundas.com
43
Feinberg, D. and Beyer, M. A. (2007), Magic quadrant for data warehouse database management systems, 2007, Gartner Inc.
Gartner. www.gartner.com
Grabski, S., Leech, S. and Sangster, A. (due to be published 2009), Management Accounting in Enterprise Resource Planning Systems, Executive Summary, CIMA sponsored research.
Hayes, J., Adams, B. and McMillan, I. (2007), Finance strategy: delivering the partnering role, IBM Global Business Services.
IBM. www.ibm.com
Informatica. www.informatica.com
Information Builders. www.informationbuilders.com
Kielstra, P. and McCauley, D. ed. (2007), In search of clarity: unravelling the complexities of executive decision-making, The Economist Intelligence Unit sponsored by Business Objects.
KPMG. www.kpmg.co.uk
Miagen. www.miagen.com
Mills, C. (2008), BI for all, Evaluation Centre.www.evaluationcentre.com
Oracle (2007), Unified business intelligence meets the needs of 21st century.
6 References and further reading

Improving decision making in organisations
Peppard, J., Ward, J. and Daniel, E. (2007), Managing the realization of business benefits from IT investments, MIS Quarterly Executive, Vol. 6, No. 1, March.
Plenty, A. (2008), Quality control, Evaluation Centre. www.evaluationcentre.com
Queissar, T. D. and Miller, G. J. (2008), Does a business intelligence competency center (BICC) improve business performance through better decision making?
Rayner, N. (2007), Understanding packaged analytic applications, Gartner Inc.
SAP. www.sap.com
Schroeck, M. J. (2001), Financial analytics: the new role of finance, DM Review Magazine, April 2001.
Windsor, E. (2008), Turning information into intelligence, Evaluation Centre.www.evaluationcentre.com
44
Benefits dependency network (BDN)Framework for explicitly linking the overall investment objectives and the requisite benefits with the business changes needed to deliver these benefits along with the essential IT functionality required.
Business activity monitoring (BAM)Also called business activity management, is the use of technology to proactively define and analyse business activities within an organisation, using real time information, to maximise profitability and improve the speed and effectiveness of business operations.
Business process management (BPM)Systematic approach using business practices, techniques and methods to create and improve an organisation’s business processes.
Customer data integration (CDI)Consolidates and manages customer information from all available sources, such as customer contact details, and is an essential element of CRM.
Customer relationship management (CRM)Processes where the emphasis is placed on the interfaces between the entity and its customers. Knowledge is shared, within the entity, to ensure that the customer receives a consistently high service level.
Database management system (DBMS)Complex set of software programs that enable the organisation, storage, retrieval and manipulation of information within a database. It also ensures the integrity and security of data within these databases.
Data martCentral repository of data gathered from operational data and other sources, designed to address specific functions of a department’s needs.
45
Data warehouseCentral repository of data, collected from various business systems, designed to support management decision making and to address the needs of the organisation from an enterprise perspective.
Decision support systems (DSS)Computer based information systems, including knowledge based systems, which support business and organisational decision making activities.
Enterprise information systems (EIS)Computer system that collects large volumes of data from across the entire enterprise so that it can be reported on.
Enterprise resource planning (ERP)Software system designed to support and automate the business processes of medium and large enterprises. ERP systems are accounting orientated information systems which aid in identifying and planning the enterprise wide resources needed to resource, make, account for and deliver customer orders.
eXtensible business reporting language (XBRL)Electronic information of business and financial data; individual items of data can be tagged allowing business information to be selected, analysed, stored and presented automatically.
Extract, transform, load (ETL)Three separate functions combined into one tool that pulls data out of one database and places it into another database:• extract – reads the data from the specified source
and extracts what is required• transform – converts the extracted data, using rules
or look-up tables or by combining data, into a set form so that it can be placed into another database
• load – writes the resulting transformed data into the target database.
7 Appendix: glossary of terms

Improving decision making in organisations
ExtranetPrivate network which uses internet technology to allow the organisation to share data with suppliers, retailers, other partners or customers. Uses include sharing product information, collaboration on joint projects, or sharing supply and demand data throughout a supply chain.
Fuzzy logicProblem solving control system methodology that provides a simple way to arrive at a definite conclusion based on vague, ambiguous, imprecise and missing input information.
Local area network (LAN)Group of computers or devices that share a common communications line or wireless link; typically within a small geographic area, such as an office building.
Management information systems (MIS)Subset of systems covering the application of people, ideas, technologies and procedures which provide management with up-to-date information on an organisation’s performance.
Master data management (MDM)Set of processes and tools which allow organisations to define and manage master data (non-transactional data entities, such as customers, products, accounts).
Net present value (NPV)Difference between the sum of the project discounted cash inflows and outflows attributable to a capital investment or other long-term project.
Network attached storage (NAS)Hard disk computer storage system that isself-contained and connected to the network with the sole purpose of supplying file-based storage services to other devices on the network.
46
Online analytical processing (OLAP)Category of software that enables the analysis of data stored in a database. It enables users to analyse different dimensions of multidimensional data according to user-defined or pre-defined functions, so that patterns, trends and exceptions can be identified. It is often used for data mining.
Return on investment (ROI)Profit before interest and tax/average capital employed; often used to assess managers’ performance. Managers are responsible for all assets (normally defined asnon-current assets plus net current assets).
Service-orientated architecture (SOA)Software architecture grouped around business processes and packaged as interoperable services. It defines how distinct units, or services, are made accessible over a network so that they can interact in such a way to enable one entity to perform a unit of work on behalf of another entity. These services communicate with each other by passing data from one service to another. Each interaction is self-contained and loosely coupled, so that each interaction is independent of any other interaction.
Software as a service (SaaS)Software distribution model where applications are hosted by a vendor or service provider and made available to customers over a network, such as the internet.
Storage area networks (SAN)Architecture which allows all remote computer storage devices to be available to all servers on a LAN or WAN.
VirtualisationConsolidation of hardware devices onto ‘virtual machines’ that run side-by-side on the same hardware.
Wide area network (WAN)Computer network that covers a broad geographical area; typically consists of two or more local area networks, such as the internet.

47

Improving decision making in organisations
48
Notes

September 2008
The Chartered Instituteof Management Accountants26 Chapter StreetLondon SW1P 4NPUnited Kingdom
T. +44 (0)20 8849 2275F. +44 (0)20 8849 2468E. [email protected]
978-1-85971-603-8 (pdf)
TE035V0907