improving fuel economy in heavy-duty vehicles · economy in heavy-duty vehicles ... improving fuel...
TRANSCRIPT

1616 P St. NW Washington, DC 20036 202-328-5000 www.rff.org
March 2012 RFF DP 12-02
Improving Fuel Economy in Heavy-Duty Vehicles
Wi nst on Har r ington and Al an Kr upnick
DIS
CU
SS
ION
PA
PE
R
© 2012 Resources for the Future. All rights reserved. No portion of this paper may be reproduced without
permission of the authors.
Discussion papers are research materials circulated by their authors for purposes of information and discussion.
They have not necessarily undergone formal peer review.
Improving Fuel Economy in Heavy-Duty Vehicles
Winston Harrington and Alan Krupnick
Abstract
In September 2011, the National Highway Traffic Safety Administration and U.S. Environmental
Protection Agency promulgated the first-ever federal regulations mandating fuel economy improvements
for heavy-duty commercial vehicles. While the performance-based approach to these rules offers
familiarity and assurances of fuel economy improvements, it also has some well-known weaknesses. In
this paper, we describe fuel economy technologies for the trucking sector, its economic structure, the
details of the new fuel economy regulations, and the controversies they sparked. We then address issues
raised in reviewing the accompanying regulatory impact analysis. Next, we highlight some flaws of this
form of regulation and suggests a variety of alternative, more market-oriented approaches that might work
better.
Key Words: fuel economy, CAFE, trucks, heavy-duty vehicles, technology-based standards,
regulatory impact analysis, RIA
JEL Classification Numbers: Q41, Q52, Q55, Q58, R48

Contents
1. Introduction ......................................................................................................................... 1
2. Background ......................................................................................................................... 3
2.1. Complex Industry, Complex Products ......................................................................... 5
3. The Regulations ................................................................................................................. 7
4. Controversies ................................................................................................................... 11
4.1. Baselines .................................................................................................................... 11
4.2. Technologies in Vocational Vehicles ........................................................................ 12
4.3. Categorization ............................................................................................................ 13
4.4. Alternate-Fueled Vehicles ......................................................................................... 14
4.5. The Final versus Proposed Standards ........................................................................ 14
5. The Regulatory Impact Analysis ..................................................................................... 15
6. Some Economic Issues with Fuel Consumption Standards .......................................... 19
6.1. Missed Opportunities ................................................................................................. 19
6.2. Unintended Consequences ......................................................................................... 21
7. Conclusion .......................................................................................................................... 24
References .............................................................................................................................. 27
Tables ..................................................................................................................................... 29

Resources for the Future Harrington and Krupnick
1
Improving Fuel Economy in Heavy-Duty Vehicles
Winston Harrington and Alan Krupnick
1. Introduction
In November 2010, the National Highway Traffic Safety Administration (NHTSA) and
the U.S. Environmental Protection Agency (EPA) jointly proposed the first-ever federal
regulations mandating improvements in fuel economy among heavy-duty commercial vehicles
(HDVs)—that is, heavy-duty trucks, buses, and vans (U.S. EPA and NHTSA 2010). After taking
comments from interested parties for about 10 months, the agencies promulgated these rules,
called the Greenhouse Gas Emissions Standards and Fuel Efficiency Standards for Medium- and
Heavy-Duty Engines and Vehicles, in September 2011 (USEPA and NHTSA 2011).
The issuance of these regulations is the first step of what promises to be a long regulatory
journey. The requirements spelled out in the regulations do not become effective until 2014–
2018 so that manufacturers have the lead time necessary to respond. Moreover, we can expect
more regulation in the future. Regulators expect the new rules to impose only modest costs and
require reductions in fuel intensities of 7–24 percent by 2018, depending on vehicle category. By
comparison, a recent study by the National Research Council (NRC) identified a suite of
technologies that could become available in the 2015–2020 time frame that would reduce fuel
intensities in various truck classes by much more—almost 50 percent, albeit at much higher cost
(NRC 2010). Thus, the real significance of the new regulations may not be in their immediate
contribution to fuel savings, which will be modest. Rather, if the past is any guide, future
regulations will seek to exploit the available fuel efficiency technologies and follow the
regulatory approach laid out in this first set of HDV fuel economy regulations.
That path will be familiar to students of government environmental regulation, especially
those who have paid attention to the 32-year history of the CAFE policy for light-duty vehicles.
That is not to say the HDV fuel consumption regulations are a rerun of the LDV CAFE
standards; they are much more complex. Nonetheless, those who study the proposed HDV rules
will see many of the same concepts and regulatory strategies employed in the CAFE rules.
Regulatory familiarity can be advantageous for almost all interested parties. Regulators
have experience implementing and enforcing the rules, the regulated parties and other interested
Winston Harrington is a senior fellow and Alan Krupnick is a senior fellow and director of the Center for Energy
Economics and Policy at Resources for the Future.
Resources for the Future Harrington and Krupnick
2
parties know what to expect, and there are also shared assumptions and a common vocabulary.
Familiarity also can breed consensus. While the firms to be regulated, environmental groups
pushing for more stringent regulation, and other interested parties have submitted comments that
are highly critical of many details, they accept the broad approach for reducing fuel use among
HDVs.
The confidence of stakeholders in the overall approach might be well placed. Besides its
familiarity and the support it enjoys in the regulated community, it appears to offer reassurances
that something actually will be done to improve fuel economy. But this regulatory approach also
has weaknesses that are well known to the regulators and regulated parties. In the first place,
despite heroic attempts by regulators to introduce features that promote economic efficiency and
provide much-needed flexibility, the approach cannot take complete advantage of the
heterogeneity of either vehicle characteristics or the needs of vehicle purchasers. Moreover, the
very act of introducing flexibility risks creating incentives with unintended consequences. That is
precisely what happened with LDVs, when the much more lenient CAFE standard, together with
an exceedingly loose definition of ―truck,‖ allowed manufacturers to market small pickups and
SUVs that appealed to households but were considered trucks for regulatory purposes. The ratio
of light trucks to cars in the household vehicle fleet was increasing prior to the introduction of
CAFE, but the rules no doubt gave it a powerful shove.
More importantly, the current approach is problematic because it regulates fuel intensity
rather than fuel use itself. Total fuel use depends not only on the rate of fuel use in each vehicle
but the total size of the vehicle fleet, the speed with which the new fuel-efficient vehicles are
introduced into the fleet, and the intensity of use in all vehicles. Fuel intensity regulation can
conceivably delay the rate of replacement because new vehicles are more expensive, and it can
induce greater use of the new vehicles because the improved fuel economy reduces the cost of a
given trip (the so-called rebound effect). It also can affect the share and types of goods hauled by
truck rather than by rail and barge, although the effect of these shifts on fossil fuel use is
uncertain. The combined effect of these mechanisms probably is not powerful enough in the
short-to-medium term to reverse the downward effect of fuel economy regulation on total fuel
use, although it can affect fuel use noticeably.
In this paper, we describe fuel economy technologies for the trucking sector, its economic
structure, the details of the new fuel economy regulations for heavy-duty trucks—no easy task
given its length and complexity—and the controversies they sparked. We then address issues
raised in reviewing the accompanying regulatory impact analysis (RIA). Next, we highlight some
flaws of this form of performance-based regulation and suggests a variety of alternative, more
market-oriented approaches that might work better. These policies differ from the current
Resources for the Future Harrington and Krupnick
3
approach by addressing fuel use directly rather than by addressing the design fuel use rates in
new vehicles. Finally, the last section offers some conclusions.
2. Background
Before discussing the regulations themselves, it is useful to discuss briefly several
background topics: truck classifications, fuel economy metrics, how energy is used in HDVs, and
the structure of the truck-manufacturing industry.
Truck Classifications. Table 1 shows the vehicle classes defined by the U.S. Department
of Transportation, which are based primarily on weight. Heavy-duty trucks start with class 2b
(large pickups and utility vans in the 2.5–3.2 ton range when empty) and end with the largest
trucks in class 8b (large tractor trailer, bulk tanker ranging from 11.6 to 17 tons). When full, the
smallest heavy-duty trucks can about double their weight to.35–5 tons, while the largest can
more than double their weight to16.5–40 tons.
Fuel economy metrics. The Federal Highway Administration categorizes trucks by gross
vehicle weight, as shown in Table 1. The table also lists typical fuel consumption rates using two
metrics. The relevant metric for HDVs, in the right-most column, is gallons per ton-mile. Gallons
per 100 miles, which is essentially the reciprocal of the vehicle fuel economy in miles per gallon,
is the metric typically used for LDVs. It is interesting to note that as gross vehicle weight
increases, fuel consumption rates in gallons per 100 miles increases, but gallons per ton-mile
decreases, partly because the loads increase faster than fuel economy falls.
Energy Use in HDVs. To begin to understand the options available for reducing fuel use
in HDVs, it is useful to examine how they use energy. Table 2 shows an energy audit for one
very important type of truck—the class 8 combination tractor, which is the typical large semi one
sees on the interstate—under two different drive cycles or usage patterns, urban and intercity. As
shown, in each duty cycle, about 60 percent of the chemical energy stored in the fuel is lost in
the engine itself; the remainder is the mechanical energy that propels the vehicle. This ―brake‖
energy is dissipated in moving the vehicle, and here the differences in the pattern of losses is
substantial. Outside of the engine there are big differences between energy losses in urban versus
high-speed driving. In urban driving, braking losses account for nearly half the remaining
energy, but this drops to nearly zero on the open road. For rolling resistance and aerodynamic
losses, the pattern is reversed: low-speed urban driving accounts for small losses, while losses
are much larger on the highway. This is not surprising, since the power required to move a body
through a fluid increases with the cube of velocity. Power to overcome rolling resistance

Resources for the Future Harrington and Krupnick
4
increases linearly and exceeds aerodynamic losses at speeds below about 50 miles per hour (
NRC 2010).
Potential fuel economy improvements from technologies. The last column of Table 2
shows estimates from the NRC (2010) report of percentage reductions in fuel consumption from
applying the technologies recommended by the NRC in each energy loss category for the
combination truck. The percentage reduction in fuel use for a given level of output has become
the most common method for displaying and comparing the fuel-saving potential of various
technologies. If, for example, all the engine technologies in a category recommended were
adopted, and technology in all other categories were held constant, the reduction in the fuel
consumption per mile of travel of the vehicle would be reduced by an estimated 28 percent.
Combining estimates for a pair of technologies, however, is not linear, but multiplicative,
whether within the same category or not. In other words, if technology 1 reduces specific fuel
consumption by p1 and technology 2 reduces it by p2, then the reduction when both are applied is
1 21 (1 )(1 )p p . (1)
Thus if all the technologies in Table 1 are applied at once, the estimated reduction in
specific fuel consumption is 47 percent, not the 57.5 percent obtained from adding up the figures
in the column.
The potential energy savings will be specific to the truck’s design and how it is used. For
a class 8 combination tractor, the potential savings from better aerodynamics and tires is far more
important than for other trucks because so much energy is expended in highway driving. For
HDVs with a duty cycle dominated by urban driving—or even more so, an HDV heavily used
off-road—these categories will be much less important. Nonetheless, in all HDVs, the engine is
the largest user of energy, and fuel-savings technologies for engines will be important. In fact,
for vehicles intended principally for urban and other low-speed uses, engine technologies will be
even more important than for other categories because opportunities do not exist in other
categories. Hybrid engines are an especially attractive technology in such vehicles because they
are able to reduce braking losses through regenerative braking.
For the various types of vehicles examined, the NRC committee found that potential
energy reductions of around 45 percent to more than 50 percent in the 2015–2020 time frame
were achievable. In every case, though, the estimated costs of various technology options was
highly variable, and the cost-effectiveness (cost per unit fuel consumption rate reduction) even
more so. Moreover, the least costly technologies are not concentrated in the engine, the

Resources for the Future Harrington and Krupnick
5
aerodynamics, or any other one component or feature, so that a cost-effective approach to
regulation requires a broad-based approach.
Finally, Table 2 provides further insight into our earlier observation that the larger the
vehicle, the better the fuel consumption rate in gallons per ton-mile. While large diesel engines
and vehicles to some extent are inherently more fuel-efficient, in the ton-mile metric, than
smaller engines and vehicles, a more important consideration is that that the weight of the empty
vehicle, which is fixed regardless of load size, is about half the gross vehicle weight. Moreover,
in highway driving, a significant fraction of the energy loss is due to aerodynamic and tire losses,
which do not strongly depend on vehicle load. It follows that one of the most effective ways to
reduce fuel consumption in HDVs is to increase permissible loads, something the trucking
industry has advocated for years. To be sure, increasing maximum loads may raise issues of
safety, road wear, and perhaps congestion, but it makes the point that fuel consumption depends
on much more than vehicle and engine design—it depends on how vehicles are used.
2.1. Complex Industry, Complex Products
Several features of the HDV manufacturing industry complicate regulation of fuel
consumption rates.
Tables 3 and 4 show the principal manufacturers of heavy-duty vehicles and trucks,
illustrating that the industry is dominated by a small number of large manufacturers. Indeed, the
number of independent engine and truck manufacturers is even smaller than Tables 3 and 4
might suggest, because of affiliations, partnerships, and outright ownership of one company by
another. Freightliner, Mercedes Benz, and Detroit Diesel, for example, are owned by Daimler;
Mack is a Volvo company; and Kenworth and Peterbilt are units of PACCAR International.
Cummins Diesel is the only major engine manufacturer without a truck-manufacturing affiliate.
Tables 3 and 4 also suggest that commercial vehicle manufacturing is a very dynamic
industry and that its dynamism creates problems for obtaining the fuel economy levels suggested
by the new regulations. For both trucks and engines, annual production swung between 39
percent above and 35 percent below the five-year average. Some of this variability is a result of
the economic cataclysm that began in 2008, but in fact sales had begun a major decline at least a
year before. A likely reason that contributed to the 2005–2006 increase followed by the 2007
decline is that many buyers bought ahead of an anticipated major price increase in 2007—an
―announcement effect.‖ Truck and engine prices increased primarily because in that year, costly
new regulations to curb emissions of nitrogen oxides (NOx) and fine particulate matter (PM2.5)
from heavy-duty engines began to take effect. At the same time, this pattern also was influenced
by what Gruenspecht (1982) called ―new source bias,‖ which is the lengthening of ownership of
Resources for the Future Harrington and Krupnick
6
older vehicles when prices on new vehicle rise. To the extent the new fuel economy regulations
raise new vehicle prices, similar effects can be expected.
Another important feature of the truck industry is its fragmentation. The market for
trailers and truck bodies is quite different from that of tractors and engines. This sector contains
many manufacturers who design, manufacture, and service equipment for a wide variety of users
and uses, from refuse collection to cement mixers to school buses. The typical manufacturer of
truck bodies produces specialty items for special tasks, and the size of many of them places them
in the category of ―small businesses‖ even though they may have a substantial market share of
their particular niche. Because of policy imperatives to protect small businesses, these specialty
manufacturers can have regulatory advantages over larger manufacturers producing a variety of
products. Many environmental regulations already have exemptions or less onerous regulations
for businesses meeting some size criteria. The number of firms and the heterogeneity of products
complicate the design of efficient and effective regulation in this sector.
The simple weight-based categorization of HDVs shown in Table 1 and the list of engine
and vehicle manufacturers in Tables 3 and 4 also conceal a remarkable diversity of product
designs and uses, which also makes HDVs hard to regulate. In the higher weight classes, some
integrated vehicles are sold, notably by Navistar and Volvo, but a buyer typically purchases an
engine, a vehicle, and a trailer or body separately.
It is not clear whether integrated manufacturers have an advantage in responding to fuel
intensity regulation. While integrated vehicles may be able to take advantage of complementary
technologies that are not available to engines and vehicles produced separately, manufacturers
may not get credit for such innovations unless the regulations are sufficiently flexible—for
example, as they would be in a rule allowing averaging across vehicle and engine sectors.
Finally, tractors, diesel engines, and trailers and bodies are durable goods and have long,
useful lives. In addition to the new equipment market, therefore, there is a strong secondary
market in trucks, engines, and truck bodies. Regulation of products in these secondary markets is
much less extensive than in the primary market. The products may be modified in ways that
either improve or compromise their fuel economy performance. For examples, fairings or hoods
may have been damaged and removed from cabs or trailers, or removed undamaged to reduce
weight. Engines may be altered to improve fuel economy or compromise it to meet emissions
standards. Engines also may be altered to trade off fuel economy for greater power. These
alterations may be beyond the purview of the regulator so that even successful implementation of
new HDV standards may be at least partly undone over time.
Resources for the Future Harrington and Krupnick
7
3. The Regulations
Federal agencies usually do not issue joint regulations, but they did in the case of HDV
fuel economy standards because of an overlap in responsibility at EPA and NHTSA. NHTSA
historically has administered motor vehicle regulation generally and fuel economic regulation in
particular. More recently the agency was directed to produce fuel consumption regulations for
HDVs by the Energy Independence and Security Act of 2008. EPA’s involvement began with
the Supreme Court decision in Massachusetts v. EPA in 2008, which first gave EPA the
authority—and also the responsibility—to regulate greenhouse gases under the Clean Air Act.
The Court directed EPA to initiate an ―endangerment‖ finding under Section 202 of the act,
which governs emissions regulations for new vehicles (Richardson 2011). The result was a
finding that greenhouse gases do in fact endanger the public health, which obliged EPA to
initiate rulemaking for HDVs. At that point, the tight relationship between fuel consumption and
emissions of carbon dioxide (CO2) assured that the two agencies would have to work closely
together during rulemaking.
The proposed HDV regulations are one of the most recent—and complicated—examples
of a style of environmental policymaking called technology-based standards. In the past,
technology-based regulation most often has been applied to emissions from industrial processes,
but in this case the subjects of the regulations are products. These regulations share a number of
common elements. Here we describe those elements and give examples from the HDV rules.
Categorization. Targets of regulations are categorized (and frequently subcategorized)
such that different products in the same subcategory must meet the same standard. At the top
level of the categorization are three vehicle types. One is the class 2b and 3 heavy-duty pickups
and vans, which are primarily sold as integrated vehicles and are treated in the same manner as
the light-duty CAFE standards. They will receive no further discussion here. The other two are
class 7 and 8 combination tractors, and class 2b–8 vocational vehicles.
Tractor cabs are classified by two weight classes and three roof heights. In addition, for
class 8, there are both ―day cabs‖ and ―sleeper cabs‖ at each roof height, making a total of nine
tractor categories. These nine categories differ by weight and aerodynamic qualities, both of
which are adversely affected by height. In addition, two engines subcategories are defined: a
―heavy heavy-duty‖ engine, which primarily for class 8, and a ―medium heavy-duty‖ engine for
class 7.
The class 2b–8 vocational vehicles are so called because of the enormous range of
tasks—transport-related and not—they are called on to perform. The agencies gave up
developing a positive definition for this category. Instead, they defined it as all heavy-duty

Resources for the Future Harrington and Krupnick
8
vehicles that were neither class 7–8 combination trailers nor class 2b–3 heavy-duty pickups and
vans.
A large number of truck body builders in the vocational class will be responsible for
assembly, integrating truck body with a purchased engine and chassis from other manufacturers.
EPA and NHTSA decided not to regulate the design of the truck bodies, only the engine and
chassis components of these vehicles. This decision saved the agencies from having to deal with
a huge number of small equipment manufacturers and an equally larger number of equipment
configurations. In addition, the agencies argued that it is not likely to sacrifice many fuel-saving
opportunities because these vehicles are typically operated at low speeds on local roads or off-
road. Furthermore, there is only one chassis category for each of three class aggregations: light
heavy-duty (class 2b–5), medium heavy-duty (classes 6–7) and heavy heavy-duty (class 8), and
three engine categories: light, medium, and heavy heavy-duty.
Performance metrics. The principal performance metric for determining compliance with
the NHTSA’s fuel consumption standards is the fuel consumption rate in gallons per 1,000 ton-
miles (for vehicles) and gallons per horsepower-hour (for engines). For EPA’s carbon emissions
standard, it is grams CO2 per ton-mile (vehicles) or per horsepower-hour (engines). The
performance standards in both metrics are chosen to be consistent so that achievement of the one
implies the achievement of the other (with appropriate allowance made for alternative fuels).
Baselines. The baseline is defined as current or typical performance by the engines and
vehicles in the industry to be regulated. The baseline can refer either to the designated
performance level or the equipment capable of achieving it. For example, the baseline engine for
class 8 tractors is a heavy heavy-duty 15-liter engine producing 455 horsepower. In class 7, the
baseline engine is a medium heavy-duty 11-liter engine producing 350 horsepower. Both
baseline engines use a sophisticated NOx and PM2.5 aftertreatment system called selective
catalytic reduction (SCR) to comply with the 2007 Heavy Duty Highway Rule (U.S. EPA 2001).
Likewise, three baseline engines with similar equipment (light, medium, and heavy heavy-duty)
are defined for the three engine categories of the class 2b–8 vocational vehicles, and all use SCR
to comply with the 2007 rule.
The current vehicles or engines of some manufacturers in some categories do not meet
the baseline performance criteria values. In those cases, manufacturers were granted some
flexibility. They may use an alternative baseline that equates to the performance of its average
product in that category for meeting the 2014 standards, but by 2018 they must meet the more
stringent common baseline. This is one of several flexibility measures built into the regulations.

Resources for the Future Harrington and Krupnick
9
In principle, baselines are not required to formulate technology-based standards because
compliance can be determined via an absolute performance metric, in terms of gallons per 1,000
ton-mile, for instance. In practice however, fuel economy standards are developed in terms of
percentage reductions in fuel use of CO2 emissions relative to a baseline.
Deciding on the fuel economy standards. The Energy Independence and Security Act lays
out three criteria for setting the fuel economy standards. Quoting from the preamble of the rule,
―The program must be (1) designed to achieve the maximum feasible improvement; (2) the
various required aspects of the program must be appropriate, cost-effective, and technologically
feasible; and (3) the standards adopted under the program must provide not less than four model
years of lead time and three model years of regulatory stability. In considering these various
requirements, NHTSA will also account for relevant environmental and safety considerations‖
(U.S. EPA and NHTSA 2011).
Criteria (1) and (2) generally are at odds. Usually, the maximum feasible improvement
exceeds that which is cost-effective (or, alternatively, reaches maximum net benefits if the CO2
reductions, etc. are monetized) because costs rise faster than emissions reductions.
By a remarkable coincidence, the maximum feasible technologies considered in this
rulemaking process turn out also to have the largest net benefits. The agencies demonstrated this
by first building technology cost curves reflecting CO2/oil-use reductions from a no-action
baseline for the three categories of trucks. Then they constructed four scenarios (plus the
baseline, scenario 1). Working from scenario 5 backward, scenarios 4 and 5, which push fuel
savings technologies beyond their current limits, are by definition ―infeasible‖ against criteria (3)
above. Scenario 3 is the maximum feasible technologies in all three categories. Scenario 2 strips
away the least-cost-effective technologies in each category (presumably the marginal
technologies in scenario 3). This procedure weakens the standards relative to alternative 3 by
about 12 percent. Details of the cost–benefit analysis will be discussed later in this paper.
The Fuel Economy Standards. In each subcategory, the performance standards are the
schedule of regulatory targets to be met. For the HDV regulation the targets are expressed in fuel
consumption rates (in gallons per 1,000 ton-mile) and CO2 emissions rates (in grams per ton-
mile). Deadlines are set for 2014 and 2018, although for engines the 2014 standards are
voluntary until 2015. As shown in Tables 5 and 6, the anticipated improvement is 7–10 percent
for all categories except class 8 sleeper cabs, which are to achieve up to 14 percent improvement
in 2014 and 24 percent improvement in 2018. Standards are more stringent in this last category
because the ground has been prepared by EPA’s Smartway Program, a collaborative agency–
Resources for the Future Harrington and Krupnick
10
industry program to improve the tires and aerodynamic characteristics of tractors and intercity
trailers.
Demonstration of feasibility. For each product, the agencies identify a suite of
technologies available within the time frame that, if applied to a vehicle, will allow the relevant
performance standard to be met. For example, domestic tractor manufacturers already offer
products with some of the aerodynamic features identified and developed as part of the
Smartway Program. A more controversial issue involves the use of post-combustion technologies
in the baseline engine. This is discussed more fully in section 4.1.
Certification. To demonstrate compliance of vehicles, engines, and other components
with the standards, vehicles and engines must be tested and their performance quantified. A great
deal of ink is spilled in the regulation to discuss these methods. The tests must be appropriate not
only to the equipment tested but to its probable use. For example, tests for class 7–8 combination
trailer engines use a Supplemental Engine Test (SET) test, which is heavily weighted toward
steady-state, high-speed highway operation typical of this class of vehicles. In contrast, engines
used in vocational vehicles will be tested on the heavy-duty Federal Test Procedure (FTP), which
has a driving cycle typical of urban driving, with frequent acceleration, deceleration, and stops.
Flexibility. In addition to the alternative baseline, an array of flexibility measures are
available to manufacturers to make it easier to comply with the regulation. Probably the most
important of these are provisions allowing averaging, banking, and trading of emissions credits
within vehicle or engine subcategories. For example, in the subcategory of medium heavy-duty
engines for class 2b–8 vocational vehicles, credits can be traded with other engines in the
subcategory, even across manufacturers, but they cannot be traded with other tractor, chassis, or
engine categories. Despite having the same name, for example, credits in this category cannot be
traded for those in the medium heavy-duty engine subcategory for class 7–8 combination
tractors. Indeed, trading across category boundaries is especially prohibited because the different
duty cycles and annual mileage make it difficult to calculate exchange ratios, which could lead to
unpredictable and perverse outcomes.
Credit also can be received for early adoption, demonstration of improvements before
they become requirements, and ―advanced‖ or ―innovative‖ technology. Four technologies are
available for advanced technology credits, which can then be used in other subcategories if
desired. This is the only category where credits can be traded across subcategories.
Alternate-fueled vehicles. The regulations provide credits for alternative-fueled vehicles
according to the carbon content of their fuel relative to diesel. Thus, a natural gas vehicle, with
30 percent less CO2 emissions per gallon equivalent than the identical vehicle fueled by diesel,

Resources for the Future Harrington and Krupnick
11
would be presumed to be 30 percent more efficient. For some alternative-fueled vehicle types,
this degree of improvement would be enough to meet the standards or, if more than enough,
would generate credits to offset necessary fuel economy improvements in other vehicles.
4. Controversies
EPA and NHTSA received many comments on the proposed HDV fuel economy
regulation from a variety of sources: engine manufacturers, chassis and body manufacturers, tire
makers, nongovernmental organizations, state and local air quality authorities, and private
citizens. The agencies’ responses took up more than 1,000 pages of text. As is usually the case,
the most extensive comments came from those most directly and significantly affected—the
manufacturers. We briefly describe some of these comments, grouped around what we think are
a few significant decisions that generated controversy and some degree of pushback.
4.1. Baselines
The engine baseline definitions described in the previous section may end up being one
of the most contentious issues of the regulation.
In early 2001, EPA promulgated the 2007 Heavy Duty Highway Rule (EPA 2001), which
stringently regulates NOx, hydrocarbons, and particulate emissions from heavy-duty vehicles
manufactured in 2007 and beyond. To meet the new NOx standards, most manufacturers opted to
use SCR, a treatment of exhaust gas that uses ammonia in the presence of a catalyst to
chemically reduce oxides of nitrogen to harmless nitrogen gas. In diesel applications, direct use
of anhydrous ammonia is ruled out by safety and storage concerns. Instead, diesels use urea,
which is not an effective reducing agent until it is thermally decomposed to yield ammonia. SCR
systems must have a method for continuous injection of diesel exhaust fluid (DEF), consisting of
at least 30 percent urea. The substantial volume of DEF required amounts to 3–5 percent of the
volume of diesel fuel.
The chief NOx-reducing alternative to SCR is exhaust gas recirculation (EGR), which
entails recycling part of the exhaust stream back through the engine to lower combustion
temperatures and thus the prevalence of ―hot spots‖ in the engine where NOx is likely to form.
The result is lower emissions of NOx coming out of the engine. The 2007 standards, however,
were so stringent that conventional EGR was no longer effective enough to meet the new
standards, hence the need for an aftertreatment technology.
At least one manufacturer—Navistar—took a different approach to meeting the new NOx
and PM standards: a major redesign of heavy-duty engines, including ―enhanced‖ EGR, to

Resources for the Future Harrington and Krupnick
12
reduce engine-out NOx. But Navistar may in the end find itself effectively required to employ
SCR anyway: SCR allows other manufacturers to take advantage of a variety of performance-
enhancing engine alterations that have a side effect of increasing engine-out NOx emissions,
which can then be removed in aftertreatment. Having committed to a no-SCR solution, Navistar
cannot take advantage of these other measures.
In the company’s comments on the proposed regulation, Navistar (2011) argues against
the incorporation of SCR in the baseline technology, saying that the extant SCR-equipped
engines identified by EPA and used to construct the baseline do not meet the NOx standard and
therefore do not in fact comply with the 2007 Heavy-Duty Highway Rule. Thus the standards
built on this baseline technology are infeasible.
Navistar offers several arguments for the infeasibility of the baseline. First, it claims that
EPA does not calculate the environmental effects of the manufacture of DEF, pointing to a
specific recommendation to that end by a National Academy of Sciences committee (NRC
2010). Second, EPA authorizes extended operation without the SCR system engaged, and thus
there is no NOx control for extended periods of operation. Navistar also claims that present
onboard diagnostic systems are unable to distinguish between use of DEF and water during
operation, creating the potential for fraud and willful noncompliance. Third, it claims that
vehicles in stop-and-go driving do not reach high enough operating temperatures to decompose
the urea into ammonia so that the SCR system can work properly. As shown in Table 4b,
Navistar engines are primarily found in light and medium heavy-duty engines used in vocational
vehicles, most of which have an urban duty cycle.
In its replies to these comments, EPA noted that the feasibility requirement did not mean
that all designated technologies had to be now available, only that they had to be available before
the effective date of the regulations. It was also pointed out that Navistar and other
manufacturers could resort to the alternative standards for an engine, which required a 3 percent
improvement over the engine’s performance by the effective date. Generally the agencies’ view
was that the lead times gave all manufacturers time to achieve compliance.
4.2. Technologies in Vocational Vehicles
The proposed class 2b–7 vocational vehicle standards only reflect two things: the
improvements in engine fuel intensity and an anticipated improvement in rolling resistance. As
numerous commenters pointed out, fuel-saving technologies potentially could apply to other
vehicle components, including transmissions, advanced drive trains, weight reduction and
improved auxiliary systems. Many of those commenters urged the agencies to set the standards
so as to force adoption of these technologies for new vehicles. The agencies declined to do so,

Resources for the Future Harrington and Krupnick
13
claiming that little was known about the baseline performance of currently feasible technologies,
information deemed critical to the setting of the regulations. Because these are performance
standards, the agencies could not simply mandate the use of these technologies—an inadvisable
approach in any case because it is tantamount to picking technological winners.
At the same time, the Notice of Proposed Rulemaking received a great many comments
on the decision to base vocational vehicle performance in 2017 on improved rolling resistance as
well as engine technologies. Part of the justification for this position is the relatively large
percentage of energy losses due to rolling resistance at low speeds (see Table 2). Based on their
comments, vehicle and tire manufacturers are dubious of this approach, arguing that the industry
would need more than six years to develop new tire designs and prove they were safe and
effective on the wide range of vocational vehicle types.
In response, the agencies granted that the market for vocational vehicle tires faced some
obstacles that were not present for the combination trailers. For one thing, vocational vehicle use
tends to be more demanding: more varied terrain and road conditions and typically tighter
turning radii, for example, increases tire wear in this category. Also, frequent use off roads and
on unimproved roads puts a premium on adequate traction, which could raise safety issues if or
as rolling resistance is improved. Market structure also conspires against improved rolling
resistance for vocational vehicles. A much larger variety of tire types is needed for much smaller
market niches, which means there is less return on innovation investment in particular
applications. This is especially true when compared to the combination trailers, where relatively
few large market segments tend to have relatively simple duty cycles dominated by high-speed
intercity travel. It is no surprise that rolling resistance of tires used in combination trailers is
already better than those of the typical vocational vehicle.
Nonetheless, after surveying the range of products available, EPA and NHTSA
concluded that a sufficient range of products was available to lead to significant reductions in
rolling resistance. The requirements were left unchanged in the final regulation.
4.3. Categorization
As noted, two of the three vehicle categories had more or less natural definitions
depending on vehicle characteristics, uses, and duty cycles. The exception—vocational
vehicles—were defined as ―everything else.‖ In this category, the agencies declined to regulate
the large array of truck bodies that fit on the three chassis in the vocational vehicles category
(light, medium, and heavy heavy-duty).

Resources for the Future Harrington and Krupnick
14
Categorization exists most fundamentally because it would neither be fair nor efficient to
lump all vehicles in a single group subject to a single regulation. Ideally, perhaps, each vehicle
type should be in its own category so that the regulation can be precisely tailored to its particular
characteristics, but that approach is unmanageable. But too much categorization can lead to
adverse and unintended consequences if, for example, the job done by one vehicle can be done
by a vehicle in a different category that is subject to less stringent regulation. In this case, vehicle
purchasers could change vehicle types to save costs and subvert to some extent the goals of the
rulemaking. The agencies were aware of these possibilities and in at least one instance took
action to prevent it. In the Notice of Proposed Rulemaking, the agencies classified all vocational
vehicles with sleeper cabs as ―tractors.‖ The argument for doing so was to prevent vocational
vehicles from being modified to serve as intercity combination trailers. However, numerous
commentators objected, arguing that the agencies had underestimated the cost and difficulty of
making vocational sleeper cabs suitable for intercity use. Those costs, it was said, were at least as
great as the savings available from access to the less stringent regulation. (Of course, if the rule’s
cost and benefit estimates are correct, there would be no savings from doing so anyway.) In
response to the new information, the agencies removed the tractor designation from all
vocational vehicles.
4.4. Alternate-Fueled Vehicles
The rule giving credit equal to the difference in CO2 emissions between an alternate-
fueled vehicle and its diesel counterpart generated many comments from producers of alternate-
fueled trucks and exposed a fault line between NHTSA and EPA’s responsibilities. EPA’s
mandate is to focus on reducing CO2 emissions, and the rule on alternate-fueled vehicles fully
reflects the appropriate incentive for these types of vehicles according to that metric. However,
under NHTSA’s mandate to reduce oil consumption and energy dependence, credits for some
alternate-fueled vehicles, such as all-electrics or natural gas vehicles, should be much larger
because they use no petroleum. Indeed, with U.S. shale gas estimates and production rising so
quickly that the expectation is to begin exporting liquefied natural gas instead of importing it,
there is even more reason for crediting natural gas as good for energy security. In any event, the
agencies say that they will revisit this issue in the future.
4.5. The Final versus Proposed Standards
The final rules were issued on August 9, 2011, only nine months after the proposed
regulations. Tables 5 and 6 compare the proposed and final fuel intensity standards for
combination tractors and vocational trucks, respectively. As shown, the engine standards in both
categories remain unchanged between the proposed and final regulations. The vehicle standards

Resources for the Future Harrington and Krupnick
15
show some movement in both the baselines and standards themselves, which in the final rule are
on the order of 5–10 percent higher than in the proposed rule. This is typical in agency
rulemaking, reflecting improved knowledge among the regulators as they receive comments and
new data. The apparent exception in the heavy heavy-duty vocational vehicle standards, where
both the baselines and the standards approximately doubled, is explained by a change in the
payload assumption for these vehicles, from 38,000 pounds in the proposed rule to only 15,000
pounds in the final rule. Apparently the 38,000-pound figure in the Notice of Proposed
Rulemaking resulted from confusion among empty weight, gross weight, and payload that was
corrected in the final rule.
5. The Regulatory Impact Analysis
Because the fuel economy standards are a ―major‖ rule, the EPA and NHTSA were
required by Executive Order to undertake a cost–benefit analysis of their proposed rule and
alternatives. In this section, we present some results from that analysis and offer some
observations.
Alternatives considered. Office of Management and Budget guidelines indicate that
agencies should develop a number of options for a rule, evaluate them, and then pick a preferred
option, carefully justifying their choice. For the fuel economy rule, as indicated in the RIA and
Federal Register (FR), the agencies considered the five options discussed in section 3, only two
of which were substantive (scenarios 2 and 3). The agencies found that net benefits are higher in
scenario 3, and accordingly, they chose that option. Given the many dimensions of this complex
regulation and the many decisions the agencies made, their choice of alternatives to analyze
seems perfunctory.
Costs. The RIA presents the cost of the proposed regulations in several different ways:
costs per truck by category over its lifetime, costs per ton CO2 reductions in any given year of
the policy, and total costs of the program by category. Although the latter are required to
determine the overall size of the regulation, the unit costs are more informative for assessing
both cost-effectiveness and impacts on individual owners. Table 7 shows unit costs in two ways,
by vehicle and by ton of CO2 reduced. As shown, the average per-vehicle costs of the standards
is 16 times higher for combination tractors than for vocational vehicles. Yet the cost per ton of
CO2 reduced (not including fuel savings) by the end of the program in 2050 is actually lower for
the combination tractors. The primary reasons for these disparities are the much lower fuel
economy (greater carbon density per mile driven) and higher mileage of combination trailers, as
shown in Table 1.

Resources for the Future Harrington and Krupnick
16
Fuel cost savings. These factors also play into the huge difference in fuel cost savings per
vehicle across the two vehicle types: $79,089 over the lifetime of a combination vehicle
discounted at 3 percent versus $5,872 for the vocational vehicle, assuming the diesel price path
in the Annual Energy Outlook 2010 reference case (EIA 2010). Indeed, fuel savings for all
vehicle types are predicted to be so large relative to initial cost that payback periods are under
one or two years.1 Overall, by 2050 when the program evaluation stops, costs per ton of carbon
reduced are strongly negative. Note that these costs are negative even before counting all the
nonmarket, public benefits associated with fuel economy, such as energy security, health effects
related to air pollution, and the like. However, these estimates do incorporate the rebound effect.
Accuracy of cost estimates. An initial source of error in the cost estimates driving the
cost-effective valuations is that they are ex ante estimates made by EPA and NHTSA. Previous
studies comparing ex ante and ex post cost estimates of regulation have found substantial
differences (e.g., Harrington et al. 2000; OMB 2005).
A second source can be found in the great heterogeneity of the industry. There are only a
handful of vehicle and engine categories but vastly more types of vehicles, not to mention
combinations of vehicle components and engines. However, the regulatory cost estimates used in
the RIA are based on the deliberations of the NRC (2010) and engineering studies, such as the
TIAX (2009) study commissioned by the NRC committee. They are driven by the estimated
costs of particular technologies, and they necessarily have to be the same for each manufacturer.
But no doubt the cost estimates will differ—perhaps substantially—between various
manufacturers. A likely instance of such variation will be between the integrated manufacturers,
such as Volvo and Navistar, and manufacturers that specialize in engines, vehicles, or chassis
components. Cost heterogeneity is known to enhance the relative performance of economic
incentive approaches relative to direct regulatory approaches. While a credit trading regime
could eliminate much of the cost deviation, the proposed HDV rule restricts many trading
opportunities in an attempt to prevent class shifting and other unintended consequences of the
regulation.
The disparity between the cost and technology imposition on combination vehicles and
vocational vehicles suggests that rules on the latter could be eliminated without much effect on
the overall cost or effectiveness of the regulation. As noted earlier, one strong motivation for the
class 7 vocational vehicle standards is to discourage class shifting. But with cost-effectiveness
1 With fuel savings so large and immediate, the discount rate used to amortize fuel savings is mostly irrelevant.
Resources for the Future Harrington and Krupnick
17
determined by cost per ton CO2 and the incentive for class shifting determined (in part) by cost
per vehicle, it is far from obvious that this set of standards, or indeed any set of standards, is
capable of preventing class shifting at the same time as achieving cost-effectiveness.
Benefits and net benefits. The RIA presents calculations of the benefits of the regulation
as well as the costs. Table 8 shows a summary of costs, benefits, and net benefits, expressed as
the aggregate averages for model years 2014–2018, in millions of 2009 dollars, using a 3 percent
discount rate. The last row of the table shows net benefits using a 7 percent discount rate. These
rates follow Office of Management and Budget guidelines. With technology costs of $1.62
billion per model year and benefits (both public and private) of $10.48 billion, net benefits are
$9.86 billion, implying that the regulations pass the benefit–cost test. Even at 7 percent, net
benefits are still $6.6 billion.
Let’s look under the hood at the benefits. These include increased energy security from
consuming less imported oil ($0.5 billion), reductions in climate damages from reduced CO2,
emissions ($1.14 billion2), and two ―private‖ benefits from less frequent refueling of a more fuel-
efficient vehicle ($0.08 billion) and the savings in fuel costs attributable to greater fuel economy
($10.02 billion). In addition, the agencies adjust these benefits for the external costs of additional
driving from the rebound effect ($0.3 billion, a figure that includes added noise, human health
effects from conventional air pollution, more vehicle accidents, and greater congestion). As
shown, the net benefits are actually negative (-$0.24 billion) until one counts the private fuel-
savings benefits.
A number issues underlie these estimates. The main issue concerns the ―energy-
efficiency paradox‖: although there appear to be large cost savings available from making
energy-efficient investments at prevailing energy prices, few such investments are actually made.
This paradox can be resolved by citing market failures, hidden costs, or both. Assumptions about
which factors are at play can have a large effect on the accuracy of the cost estimates.
Potential market failures include (i) skepticism, fear of novelty, or a lack of information
about the cost-savings; (ii) asymmetric information in the used vehicle market (the ―market for
lemons‖), giving rise to fears that buyers will not be able to recoup their investment in fuel
economy if they sell the vehicle; and (iii) split incentives between owners and operators who
lease vehicles from them. Those who emphasize market failures tend to see real cost savings that
2 This figure is based on EPA’s social-cost-of-carbon estimate, starting at $22 and ending in 2050 at $46 per ton,
calculated with a 3 percent discount rate.
Resources for the Future Harrington and Krupnick
18
justify regulations requiring investments that are in the public interest as well as the interest of
the companies and individuals undertaking them. The conventional wisdom in the trucking
industry is that investments in energy efficiency require a two-to-three year payback in fuel
economy savings, and yet the investments will continue to generate fuel savings over the life of
the vehicle. These additional energy savings may not figure in the private benefit–cost calculus.
The hidden-cost argument starts with the idea that if such fuel savings were available, the
―dollar bills lying on the ground‖ would be picked up—that is, the market would find a way
around any market failures. Thus, if the ―paradox‖ persists, it must be because the market
believes the new technologies are oversold or have hidden costs—for instance, in terms of other
valued vehicle attributes. In this case, if the regulation forces companies or individuals to make
such investments, they will experience real costs, netting out much of the fuel-efficiency benefits
or leading to lower benefits than forecast from engineering information.
In their cost–benefit analysis, EPA and NHTSA assumed that market failures explain the
energy-efficiency paradox. If, alternatively, they had accepted a hidden-cost argument, the
estimated benefits of the regulation would have been smaller. The trouble with the hidden-cost
argument is that its proponents cannot point to any specific hidden costs. Nonetheless, to our
knowledge, there are no careful empirical studies that shed light on this issue in the commercial-
vehicle context.
The concern over these calculations doesn’t end there. The calculations assume a certain
amount of new truck sales in each category and penetration into the fleet over time. But these
assumptions may be wrong. If the firms balk at making these investments, for whatever reason,
they may hold onto their existing trucks longer than usual or shift to less-expensive vehicles.
There is precedent: manufacturers shifted to light-duty trucks from light-duty autos when the
former were less regulated than the latter.
Calculations for some of the other categories are worth discussing as well because their
benefits come close to offsetting technology costs without even counting fuel savings. Of
particular note are the estimates of climate change damage avoided from CO2 reductions, which
offset 52 percent of the costs. These calculations use an estimate of $22/ton in 2010 (rising
slowly in later years), which is taken from a study by the Interagency Working Group on the
Social Cost of Carbon (2010) based on results from three integrated assessment models. These
models are highly aggregative, making many sweeping and controversial assumptions, and
changes to them could have huge effects on the estimate, as the agencies admit.
The other controversial estimate is for energy security benefits, which net out about 22
percent of the costs. For such benefits to count, they must be considered externalities and must

Resources for the Future Harrington and Krupnick
19
be quantifiable. The most widely touted ―benefit‖ to reducing our dependence on foreign oil is to
improve our foreign policy flexibility because we would worry less about the impact of our
national positions and behavior on Middle Eastern governments. Important as this flexibility
might be, it is not an externality as conventionally defined, and how much our flexibility would
increase with a relatively small change in our oil imports in unknown. The agencies rely on more
conventional metrics of energy: monopsony rents created by changes in world oil market prices
given a reduction in U.S. demand and the effect on the U.S. economy of a reduction in oil price
volatility (Leiby 2008). As seen in NRC (2010), both of these ―externalities‖ are questionable.
A final issue concerns the externalities associated with the rebound effect. The additional
vehicle miles driven in response to the lower price of driving may result in greater emissions of
conventional air pollutants. On top of this, if manufacturers believe that emissions standards on
diesel vehicles are binding, when faced with the prospect of lower emissions per mile because of
the new fuel economy standards, they may relax their controls of these conventional air
pollutants, saving on costs to themselves and consumers. In this case, emissions would be
unchanged following the imposition of the new fuel economy standards. But because of technical
and resource limitations, the EPA and NHTSA did not estimate the model-year effects of the
standards on conventional air pollutants (hence this benefit is not in table 8). Instead, they
estimated the effects and benefits of the standards on these pollutants in 2030 and extrapolated
those to all years of the analysis, for an added benefit of $25.3 billion (using a 3 percent discount
rate). Including this benefit adds more than 50 percent to the overall net benefits of the program
from Table 8 over all five model years, of $49.3 billion. This benefit estimate should be viewed
as a possible overestimate, depending on market choices about emissions controls.
6. Some Economic Issues with Fuel Consumption Standards
In this section, we touch briefly on the economic and behavioral aspects of the HDV
standards. These consequences either can be an inherent characteristic of regulations that
mandate product performance characteristics or the result of a particular design feature. Such
features often are added to increase the flexibility of the rule and reduce its cost to the regulated
parties. But they often represent missed opportunities or have unintended negative consequences.
6.1. Missed Opportunities
Numerous factors affect fossil fuel use in both light-duty and heavy-duty vehicles:
fuel consumption rate in new vehicles;
fuel consumption rate in existing vehicles;

Resources for the Future Harrington and Krupnick
20
average vehicle miles (and ton-miles);
fleet mix and, for HDVs, the match between vehicle and use;
fleet turnover rates; and
availability of fuels and engines that use fossil fuels less intensively or use alternative
energy sources.
These factors interact with one another, and any fuel-saving policy, even one that directly
targets only one of these factors, is likely to affect each of the others indirectly, often in ways
that are unexpected or adverse or both. Like CAFE, the HDV fuel economy regulation is a policy
that attacks only one margin: the fuel consumption rate in new vehicles. Fuel consumption rate
standards only affect some of the factors determining overall fuel use because they regulate the
design of new products, rather than their use over the life of the product. In the cost–benefit
analysis, the regulators anticipate the energy savings, based on predictions of how rapidly the
new engines and vehicles will replace existing products, by how and how much the new vehicles
will be used in the future, relative to the vehicles they replace. They also estimate the extent to
which the fuel consumption of new vehicles increase with age. However, after the new trucks
and engines enter the marketplace, the regulation supplies no further incentives to conserve
energy, and indeed, the incentives may run in the opposite direction. Thus, these predictions may
prove to be overly optimistic.
It is possible to expand the rules so that they encourage reduced fuel use along other
margins than new vehicles and engines. For example, the rules could require retrofits,
improvements in existing vehicles. The regulating agencies never seriously considered this
option for the light-duty CAFE standards, presumably because most LDVs are built as whole
vehicles. With HDVs, there are likely to be more opportunities to improve individual
components. For example, the current rule requires the addition of spoilers and fairings to new
intercity trailers, and perhaps with little or no modification, they could be just as effective on
existing trailers.
Another missed opportunity concerns the treatment of alternative-fueled vehicles. Given
the twin goals of reducing oil use and reducing carbon emissions, the agencies settled on an
approach that encourages alternate-fueled vehicles with credits to the extent they reduce carbon
emissions—but not to the extent they reduce oil use. The agencies are quite aware of this
shortcoming and may seek remedies in a future rulemaking.

Resources for the Future Harrington and Krupnick
21
6.2. Unintended Consequences
Evidence of the unintended consequences of new-product or new-plant regulations is
abundant in earlier environmental rulemakings in other contexts. Each of these consequences
arises from the fact that the regulations only exert influence over how the vehicles are designed
and built, while their fuel use depends to a considerable extent on how they are used, or indeed
whether they are purchased at all. While design is also a strong predictor of use, it is not a perfect
one. EPA and NHTSA recognize the potential that vehicles will sometimes be used in ways that
may not be predicted, but for various reasons tend to minimize the significance of this point.
However, the rule also points out that very little empirical work is available that can speak to
these issues.
Consider how improving fuel consumption rates in new vehicles might affect other
variables that influence fuel use. Other things equal, they will have the following effects:
They will reduce the cost per mile (or ton-mile) of travel, which in turn will increase total
vehicle miles traveled and ton-miles (the ―rebound effect‖), implying greater demand for
transport infrastructure and perhaps an increase in accidents, conventional air pollutants,
noise, and congestion.
They will increase the sales price of new vehicles, which will depress sales of new
vehicles, increase the value of existing vehicles, and retard the turnover of the vehicle
fleet.
If regulatory categories vary in stringency such that the incremental costs of compliance
are higher in some categories than others, vehicle buyers will have an incentive for ―class
shifting‖: purchasing a vehicle designed for one purpose and using it for another.
The rebound effect. The rebound effect has been extensively discussed for the CAFE
standards, with recent studies finding it be very low (e.g., Small and Van Dender 2006). But
there has been much less discussion in the case of HDVs. The rebound effect is the product of
the demand elasticity of HDV mileage or ton-mileage with respect to the cost per mile and the
ratio of the fuel costs per mile to total costs per mile.
EPA and NHTSA admit, on the one hand, that commercial users are likely to be far more
conscious of costs than household users, which implies a larger rebound effect for commercial
than for household vehicles. On the other hand, commercial users will be just as conscious of
other costs, such as the capitalized cost of the vehicle and other fixed costs, labor costs, and
vehicle maintenance. But on net, costs per ton-mile arguably will decline because fixed costs per
ton-mile will decline with more ton-miles to spread them over and variable costs, like labor, will

Resources for the Future Harrington and Krupnick
22
remain unchanged. In other words, as fuel costs per mile decrease, this change likely will be
reinforced by changes in the other unit costs.
Even so, the changes in other costs are likely to be secondary effects, so that the decline
in fuel cost will probably account for the bulk of the change in ton-mile costs. At the same time,
the level of fuel costs per mile will be only a fraction of the other costs per mile. The percentage
change in overall costs per mile will therefore be much smaller than the percentage change in the
fuel costs per mile. These considerations suggest that the commercial rebound effect will be a
relatively small.
Incorporating these considerations into their estimate of the effects, costs, and net
benefits of the rule, the agencies assumed that the rebound effect will be 15 percent for
vocational vehicles, 10 percent for heavy-duty pickups and vans, and 5 percent for combination
trailers.
The rebound effect discussed in the RIA is limited to the scope of HDVs. But if the fuel
intensity standards are part of a larger effort to protect consumers from the consequences of high
energy prices, it is not likely to succeed in the long run. As versatile and useful as petroleum is,
keeping it cheap will only encourage its use. Energy savings in regulated sectors of the economy,
such as motor vehicles, are at risk of being dissipated in unregulated sectors both at home and
abroad.
Fleet turnover effect. The essential trade-off of investments in fuel consumption is that
while the price per mile traveled is going down, the initial price of the vehicle is going up. But
the effects do not stop with the increase in new vehicle prices. Potential buyers may decide to
postpone purchase. This effect could be stronger in HDVs than LDVs, simply because their
expected lifetimes are longer. Moreover, this tendency might apply not only to complete vehicles
but to components, inasmuch as buyers are accustomed to assembling vehicles from separately
manufactured engines, chassis, and body. With most of the improvement in HDV fuel
consumption rates in engines, especially for vocational vehicles, it is easy to see how an existing
engine could have its life extended significantly by the an increase in the cost of new vehicles
and components.
The effect of new vehicle regulations on HDV fleet turnover could be significant. As
noted earlier, at least part of the 30 percent decline in sales of new trucks in 2007 could be
attributed to the diesel NOx and particulate standards introduced in that year. The agencies argue
that the situations are not comparable. The NOx rule raised the price of the new vehicles without
providing a compensating private good to the would-be buyer. In contrast, the HDV fuel
consumption rule does provide a private benefit: the reduced expenditure on fuel. But as we note

Resources for the Future Harrington and Krupnick
23
earlier, it is unlikely that the private (and social) benefits will be as large as the agencies suggest.
Moreover, the agencies have to make a contrary argument elsewhere in the rule, citing the so-
called ―energy efficiency paradox‖ to argue against the effectiveness of higher energy prices to
encourage the development and diffusion of fuel-saving technology and justify the need for fuel
consumption regulations.
Perhaps a better argument, at least for this first set of regulations, is that the low
incremental cost of the new fuel consumption standards will not provide a strong incentive to
alter purchase decisions. For this argument to remain valid though, future regulations also must
have low incremental costs, which is likely to place constraints on the rate at which the HDV
standards can be tightened.
Class shifting. In developing the rule, the regulating agencies seemed to be quite
concerned about class shifting, pointing to several possible scenarios where it might arise. The
most important was a potential shift from class 8 to class 7 combination trailers. Class 7
combination trailers are a bit smaller than Class 8 and are meant to serve short-to-medium-haul
transport around metropolitan areas and for short intercity trips. For such vehicles, improving
aerodynamics does not have nearly the fuel-saving advantages that it has in long-haul vehicles.
Yet a class 7 combination vehicle could serve as a workable substitute for class 8 vehicles. To
prevent a shift from the latter to the former, the rule put all combination trailers in the same
category and subjected them to the same standard.
Yet by the logic used in the rule to minimize the importance of the fleet-turnover effect,
this problem should not exist. Purchasers of class 8 vehicles should be willing to pay for their
improvement in fuel consumption. In addition, the solution is an imperfect one at best. By
merging class 7 and 8 vehicles, the regulation risks subjecting class 7 vehicles to technologies
that fail to improve their fuel consumption rates. The fact that there are so many more class 8
than class 7 vehicles may make the merger a net winner, but it does not achieve the level of
efficiency that a policy based on vehicle use rather than vehicle design would achieve, at least in
principle.
This solution also ignores incentives that manufacturers may have for designing and
building vehicles that do not now exist but that could, with relatively minor alterations, have
multiple uses. Looking back at the CAFE standards, the main instance of class shifting arose
when manufacturers began to design a variety of vehicles—small pickups, SUVs, and
minivans—that were classified as trucks but had appeal as household vehicles. This is not to say
that something similar would happen with HDVs, but the incentives for it would be in place if
the technology was to become available.

Resources for the Future Harrington and Krupnick
24
7. Conclusion
The statutory justifications for the first-ever HDV fuel intensity standards are to reduce
carbon emissions and address the issue of petroleum dependency. But as is common in
regulatory matters, most of the projected benefits of the rule lie in an entirely different area. The
regulatory impact analysis predicts that the current regulations have much greater benefits than
costs, even at current fuel prices, but the benefits from reductions in carbon emissions and
petroleum dependency3 are estimated to be quite small. The real source of benefits are the fuel
savings to the purchaser of the vehicle and to future owners. Without these fuel savings, the
remaining benefits are less than the costs. In the near term, then, the rule is more an attempt to
protect consumers from themselves by requiring manufacturers to adopt warranted energy-saving
technologies that consumers are not demanding. It also attempts to protect consumers by
achieving its fuel-conserving objectives without policy instruments, such as taxes or rationing,
that would raise the price.
We think these two near-term objectives will be achieved absent a stronger-than-expected
increase in miles driven as a consequence of the standards. The required technology will be
adopted at relatively modest cost, and fuel use and carbon emissions will decline over time as
more fuel-efficient trucks enter the fleet. Although an NRC (2010) study finds that fuel
consumption in heavy-duty vehicles could be reduced by 50 percent using technology that
already exists or could be developed by 2020, these rules only reduce fuel consumption by 7–24
percent in various vehicle categories. Thus, the first regulatory step for this industry was a
cautious one, despite the many environmental advocates urging greater reductions.
But what if the regulations does lead to a higher increases in miles driven than expected?
This is a real concern, for several reasons. First, little research has been done to back up the
agency’s assumptions about rebound, turnover, and class shifting effects. Second, the trade-off
between power and fuel economy may have unexpected consequences. An anecdotal account
notes that reducing power to take loads up hills will induce drivers to go around rather than up
the mountains, which can lead to increases in fuel use. How widespread such changing
behavioral patterns might be is anyone’s guess at the moment. Third, demand will grow for
trucking services as a result of economic growth, quite apart from reductions in fuel use per ton-
mile. Because the new standards apply only to new vehicle purchases, this demand could easily
overwhelm the reach of the standards in reducing diesel fuel use and carbon emissions.
3 Oil imports are projected by EIA (2011) to fall from 50 percent of total petroleum use today to around 42 percent
by 2035.
Resources for the Future Harrington and Krupnick
25
In the longer-term, more stringent fuel economy regulations will be proposed, so it is not
guaranteed or even likely that the fuel savings will continue to dominate the other benefit
categories. As it is with benefits, so it is with costs: the immediate costs of these rules will be
primarily the cost of the fuel-saving technologies needed to meet the regulation. If later versions
of the regulations add substantially to the cost of new vehicles, the behaviors described earlier
will become common, as owners and buyers attempt to avoid the higher costs, and their actions
will very likely increase the costs and compromise the effectiveness of the regulations. Such
outcomes will be all the more likely if the price of fuel remains low: the lower the price, the
smaller the perceived private benefits of the regulations, and the greater the incentive to take
actions to avoid them. Regulation of vehicle design will always be vulnerable to distortions
caused by behavioral responses because they target vehicle design characteristics rather than use.
Demand issues are of greater concern in the longer run as well. Both EIA (2011, Table:
Liquid Fuels Supply and Disposition) and Exxon-Mobil (2011) are projecting significant
increases in diesel fuel use from increased commercial transportation demand and increased road
congestion, even accounting for assumed increases in fuel economy.
To help avoid these distortions and perverse outcomes, regulations should target vehicle
use either through a carbon tax or a fossil fuel rationing scheme, such as what would be part of
an upstream cap-and-trade system. This is not the place to expand on the virtues and design
issues of such policies; the interested reader should see such studies as by Parry and Small
(2005) and Parry et al. ( 2007). But these policies have several important advantages over fuel
intensity standards: they attack all the margins of fuel use discussed in section 6.1; they are in
principle cost-effective, in that they encourage reductions in fuel use up to the point where the
marginal cost equals the price of carbon; they can be efficient, if the carbon price is set at the
marginal social cost; and they avoid the perverse outcomes that fuel intensity standards are prone
to. They can be implemented gradually, beginning with a very low tax rate or an emission cap
that barely constrains current use, and then gradually ramps up. This would avoid any sudden
and costly disruptions, while still providing plenty of notice of the likely trajectory of future fuel
prices. They also can be coupled with cuts in other taxes, especially corporate and personal
income taxes, to be revenue neutral and actually reduce distortions in the economy (Goulder and
Parry 2008).
Not only can these policies substitute for fuel intensity standards, they also can
supplement them, as a way of mitigating the disadvantages of each. This is especially true of a
carbon tax. As argued above, the incentives for perverse behavior in response to fuel intensity
standards depends on the price of fuel: the lower the price, the greater the incentives. Raising the
price of fuel will therefore reduce the likelihood that significant distortions occur. The
Resources for the Future Harrington and Krupnick
26
combination of fuel intensity standards and a carbon tax to raise the price will be just as effective
as fuel intensity standards alone at improving fuel intensity, and it will reduce the rebound effect,
stagnant fleet turnover, and class shifting.
Unfortunately, the likelihood is low that such measures will get a fair hearing in Congress
for the foreseeable future. Cap and trade is moribund now and few public policy ideas have been
less popular with the general public or their legislators than fuel or carbon taxes.4 Another
possibility is that growing world demand for oil will raise oil prices enough to induce fuel
conservation in the U.S. trucking sector. While that is possible, most projections suggest
otherwise. For one thing, light-duty vehicle demand is projected to flatten by 2020 or so, with the
fleet becoming much more efficient and composed of a high fraction of hybrids and other
alternative vehicles. For another, supply is being augmented by new oil discoveries, and new
technologies allow access to previously untappable resources (e.g., oil shale, oil sands, and
biodiesel) and new areas (e.g., deep water and the Arctic). Both trends will have a depressing
effect on oil prices. Thus, policy action to raise prices of trucking fuels will likely be needed to
meet the goals of the program in the longer term.
4 A nascent interest is budding in carbon taxes; see http://www.rff.org/Events/Pages/Fiscal-Reform-and-Climate-
Protection-Considering-a-US-Carbon-Tax.aspx.
Resources for the Future Harrington and Krupnick
27
References
EIA (Energy Information Agency). 2010. Annual Energy Outlook 2010. Washington, DC: U.S.
Department of Energy.
EIA. 2011. Annual Energy Outlook 2011. Washington, DC: U.S. Department of Energy.
ExxonMobil. 2011. 2012 The Outlook for Energy: A View to 2040. Irving, TX: ExxonMobil.
Goulder, L., and I. Parry. 2008. Instrument Choice in Environmental Policy. Review of Environmental
Economics and Policy 2(2): 152–74.
Gruenspecht, Howard K. 1982. Differentiated Regulation: The Case of Auto Emission Standards.
American Economic Review 72(2): 328–31.
Harrington, Winston, Richard D. Morgenstern, Per-Christian Nelson. 2000. On the Accuracy of
Regulatory Cost Estimates. Journal of Policy Analysis and Management 19(2): 297–322.
Interagency Working Group on the Social cost of Carbon. 2010. Technical Support Document:
Social Cost of Carbon for Regulatory Impact Analysis Under Executive Order 12866.
Washington, DC.
Leiby, Paul N. 2008. Estimating the Energy Security Benefits of Reduced U.S. Oil Imports. Final
report ORNL/TM-2007/028. Oak Ridge, TN: Oak Ridge National Laboratory.
NRC (National Research Council). 2010. Technologies and Approaches to Reducing the Fuel
Consumption of Medium- and Heavy-Duty Vehicles. Washington, DC: National
Academies Press.
Navistar, Inc. 2011. Comments To EPA and DOT/NHTSA Proposed Greenhouse Gas Emissions
Standards and Fuel Efficiency Standards For Medium- and Heavy-Duty Engines and
Vehicles, January 31.
OMB (Office of Management and Budget). 2005. Validating Regulatory Analysis: 2005 Report
to Congress on the Costs and Benefits of Federal Regulations and Unfunded Mandates
on State, Local, and Tribal Entities. Washington, DC.
http://www.whitehouse.gov/omb/inforeg/regpol-reports_congress.html.
Parry, Ian W.H., and Kenneth A. Small. 2005. Does Britain or The United States Have the Right
Gasoline Tax? American Economic Review 95(4): 1276–89.
Parry, Ian, M. Walls, and W. Harrington. 2007. Automobile Externalities and Policies. Journal of
Economic Literature 45(2): 374–400.

Resources for the Future Harrington and Krupnick
28
Richardson, Nathan. 2011. Playing without Aces: Offsets and the Limits of Flexibility under
Clean Air Act Climate Policy. Discussion paper 11-49. Washington, DC: Resources for
the Future.
Small, Kenneth A., and Kurt Van Dender. 2006. Fuel Efficiency and Motor Vehicle Travel: The
Declining Rebound Effect. Energy Journal 28(1): 25–52.
TIAX, Inc. 2009. Assessment of Fuel Economy Technologies for Medium- and Heavy-Duty
Vehicles. Final Report to the National Academy of Sciences. Lexington, MA.
U.S. EPA (Environmental Protection Agency). 2001. Control of Air Pollution from New Motor
Vehicles: Heavy-Duty Engine and Vehicle Standards and Highway Diesel Fuel Sulfur
Control Requirements. Federal Register 66: 5001.
U.S. EPA and NHTSA (National Highway Traffic Safety Administration). 2010. Proposed
Rules: Greenhouse Gas Emissions Standards and Fuel Efficiency Standards for Medium
and Heavy-Duty Engines and Vehicles. Federal Register 75: 74152.
U.S. EPA and NHTSA. 2011. Final Rules: Greenhouse Gas Emissions Standards and Fuel
Efficiency Standards for Medium and Heavy-Duty Engines and Vehicles. Federal
Register 76: 57106.

Resources for the Future Harrington and Krupnick
29
Tables
Table 1. Vehicle Weight Classes Defined by U.S. Department of Transportation
Class Description/examples
Empty
weight
range
Gross
weight
range
Typical fuel intensities
Tons Tons
Gallons
per
thousand
miles
Gallons
per
thousand
ton-miles
1c Passenger cars 1.2–2.5 <3 30–40 67
1t
Small light-duty trucks
(including SUVs and
minivans)
1.6–2.2 <3 40–50 58
2a Standard pickups, large SUVs 2.2–3 3–4.25 50 39
2b Large pickups, utility vans 2.5–3.2 4.25–5 67–100 39
3 Utility vans, minibuses 3.8–4.4 5–7 77–125 33
4 Delivery vans 3.8–4.4 7–8 83–140 24
5 Large delivery vans, bucket
trucks 9.2–10.4 8–9.75 83–166 26
6 School buses, large delivery
vans 5.8–7.2 9.75–13 83–200 20
7 City bus, Refrigerated truck,
fire engine 5.8–7.2 13–16.5 125–250 18
8a Dump/refuse trucks, city
buses, fire engines 10–17 16.5–40 160–400 9
8b Large tractor trailers, bulk
tankers 11.6–17 16.5–40 133–250 7
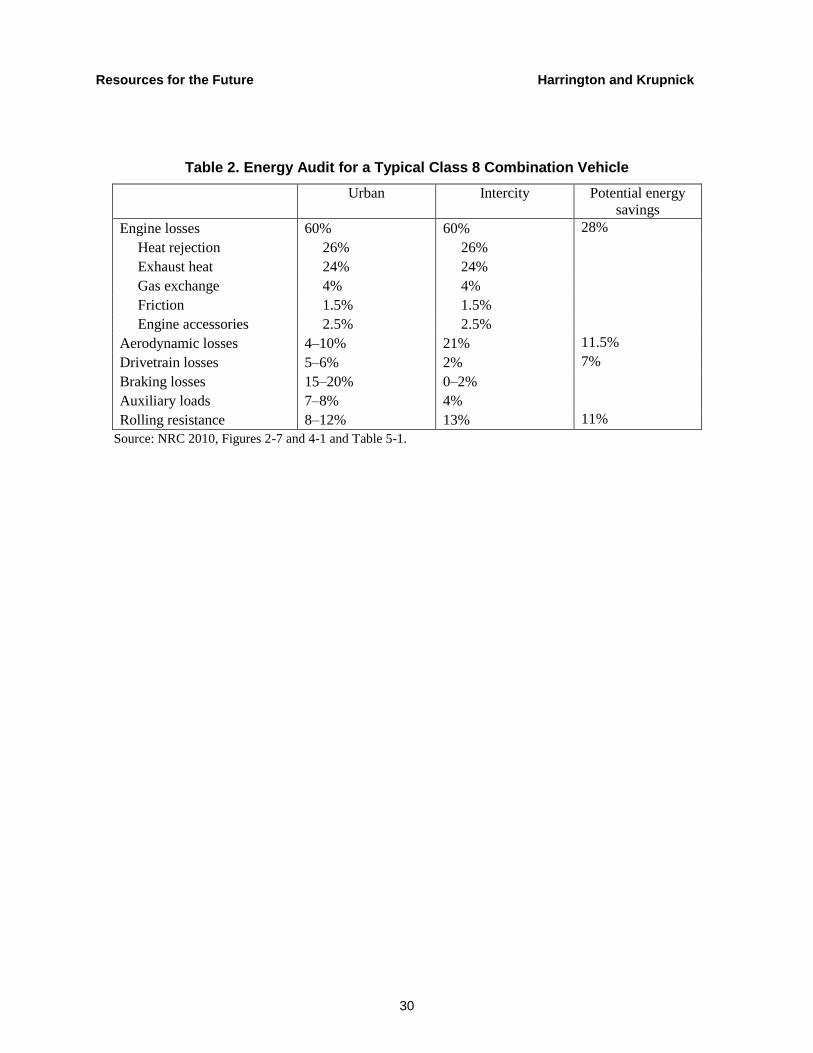
Resources for the Future Harrington and Krupnick
30
Table 2. Energy Audit for a Typical Class 8 Combination Vehicle
Urban Intercity Potential energy
savings
Engine losses 60% 60% 28%
Heat rejection 26% 26%
Exhaust heat 24% 24%
Gas exchange 4% 4%
Friction 1.5% 1.5%
Engine accessories 2.5% 2.5%
Aerodynamic losses 4–10% 21% 11.5%
Drivetrain losses 5–6% 2% 7%
Braking losses 15–20% 0–2%
Auxiliary loads 7–8% 4%
Rolling resistance 8–12% 13% 11%
Source: NRC 2010, Figures 2-7 and 4-1 and Table 5-1.
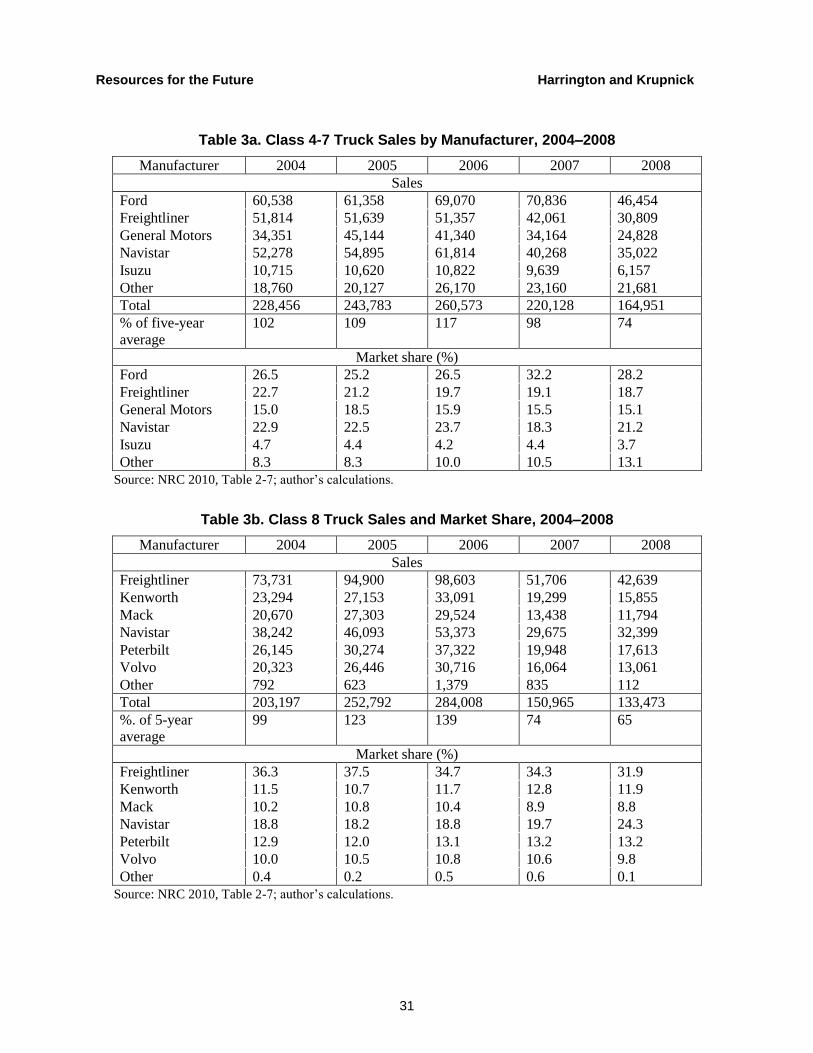
Resources for the Future Harrington and Krupnick
31
Table 3a. Class 4-7 Truck Sales by Manufacturer, 2004–2008
Manufacturer 2004 2005 2006 2007 2008
Sales
Ford 60,538 61,358 69,070 70,836 46,454
Freightliner 51,814 51,639 51,357 42,061 30,809
General Motors 34,351 45,144 41,340 34,164 24,828
Navistar 52,278 54,895 61,814 40,268 35,022
Isuzu 10,715 10,620 10,822 9,639 6,157
Other 18,760 20,127 26,170 23,160 21,681
Total 228,456 243,783 260,573 220,128 164,951
% of five-year
average
102 109 117 98 74
Market share (%)
Ford 26.5 25.2 26.5 32.2 28.2
Freightliner 22.7 21.2 19.7 19.1 18.7
General Motors 15.0 18.5 15.9 15.5 15.1
Navistar 22.9 22.5 23.7 18.3 21.2
Isuzu 4.7 4.4 4.2 4.4 3.7
Other 8.3 8.3 10.0 10.5 13.1
Source: NRC 2010, Table 2-7; author’s calculations.
Table 3b. Class 8 Truck Sales and Market Share, 2004–2008
Manufacturer 2004 2005 2006 2007 2008
Sales
Freightliner 73,731 94,900 98,603 51,706 42,639
Kenworth 23,294 27,153 33,091 19,299 15,855
Mack 20,670 27,303 29,524 13,438 11,794
Navistar 38,242 46,093 53,373 29,675 32,399
Peterbilt 26,145 30,274 37,322 19,948 17,613
Volvo 20,323 26,446 30,716 16,064 13,061
Other 792 623 1,379 835 112
Total 203,197 252,792 284,008 150,965 133,473
%. of 5-year
average
99 123 139 74 65
Market share (%)
Freightliner 36.3 37.5 34.7 34.3 31.9
Kenworth 11.5 10.7 11.7 12.8 11.9
Mack 10.2 10.8 10.4 8.9 8.8
Navistar 18.8 18.2 18.8 19.7 24.3
Peterbilt 12.9 12.0 13.1 13.2 13.2
Volvo 10.0 10.5 10.8 10.6 9.8
Other 0.4 0.2 0.5 0.6 0.1
Source: NRC 2010, Table 2-7; author’s calculations.

Resources for the Future Harrington and Krupnick
32
Table 4a. Engine Production and Market Share for Medium-Duty Trucks
Manufacturer 2004 2005 2006 2007 2008
Sales
Navistar 373,842 382,143 357,470 335,046 264,317
GM 74,328 77,056 83,355 87,749 72,729
Cummins 14,900 15,162 16,400 20,315 27,664
Mercedes Benz 16,075 20,038 27,155 19,330 9,066
Caterpillar 42,535 42,350 45,069 14,693 6,269
Other 671 5,959 7,497 15,550 8,756
Total 522,351 542,708 536,946 492,683 388,801
% of 5-year average 105 109 108 99 78
Market share (%)
Navistar 71.6 70.4 66.6 68.0 68.0
GM 14.2 14.2 15.5 17.8 18.7
Cummins 2.9 2.8 3.1 4.1 7.1
Mercedes Benz 3.1 3.7 5.1 3.9 2.3
Caterpillar 8.1 7.8 8.4 3.0 1.6
Other 0.1 1.1 1.4 3.2 2.3
Source: NRC 2010, Table 2-8; authors’ calculations.
Table 4b. Engine Production and Market Share for Heavy-Duty Trucks
Manufacturer 2004 2005 2006 2007 2008
Sales
Cummins 64,630 79,100 91,317 65,228 75,307
Detroit Diesel 48,060 61,074 63,809 29,506 35,174
Caterpillar 74,224 86,806 97,544 33,232 20,099
Mack 25,158 36,211 36,198 18,544 16,794
Mercedes Benz 17,178 24,414 24,584 17,048 10,925
Volvo 12,567 19,268 23,455 9,850 8,822
Other 0 0 0 56 947
Total 241,817 306,913 336,907 173,464 168,068
% of 5-yr. avg. 99 125 137 71 68
Market share (%)
Cummins 26.7 25.8 27.1 37.6 44.8
Detroit Diesel 19.9 19.9 18.9 17.0 20.9
Caterpillar 30.7 28.3 29.0 19.2 12.0
Mack 10.4 11.8 10.7 10.7 10.0
Mercedes Benz 7.1 8.0 7.3 9.8 6.5
Volvo 5.2 6.3 7.0 5.7 5.2
Other 0.0 0.0 0.0 0.0 0.6
Source: NRC 2010, Table 2-8; authors’ calculations.

Resources for the Future Harrington and Krupnick
33
Table 5. Fuel Consumption Standards for Class 7–8 Combination Vehicles
Engine standards (expressed as percentage emission rate reduction from baseline), by model year (MY)a
Proposed Final
Baseline
(gallons per
Kbhp-hr)a
2014 MY
standardb
2017 MY
standard
Baseline
(gallons per
Kbhp-hr)a
2014 MY
standardb
2018 MY
standard
Medium-heavy duty engines (Class
7)
5.09 4.93 (3%)b 4.78 (6%) 5.09 4.93 (3%) 4.78 (6%)
Heavy-heavy duty engines (Class
8)
4.81 4.67 (3%)b 4.52 (6%) 4.81 4.67 (3%) 4.52 (6%)
Vehicle standards (expressed as percentage emission rate reduction from baseline)c
Baseline
(gallons per
Kton-mi)
2014 MY
Standard
2017 MY
Standard
Baseline
(gallons per
Kton-mi)
2014 MY
Standard
2018 MY
Standard
Class 7 day cab
Low roof 11 10.3 (6.4%) 10.1 (8.2%) 11.4 10.5(7.9%) 10.2 (10.5%)
Mid roof 11 10.3 (6.4%) 10.1 (8.2%) 12.6 11.7 (7.1%) 11.3 (10.3%)
High roof 12.8 11.6 (9.4%) 11.4 (10.9%) 13.6 12.2 (10.3%) 11.8 (13.2%)
Class 8 day cab
Low roof 8.3 7.8 (6%) 7.7 (7.2%) 8.7 8.0 (8.0%) 7.8 (10.3%)
Mid roof 8.3 7.8 (6%) 7.7 (7.2%) 9.4 8.7 (7.4%) 8.4 (10.6%)
High roof 9.4 8.6 (8.5%) 8.5 (9.6%) 10.1 9.0 (10.9%) 8.7 ((13.9%)
Class 8 sleeper cab
Low roof 7.4 6.3 (14.9%) 6.3 (14.9%) 7.8 6.7 (14.1%) 6.5 (16.7%)
Mid roof 8.0 6.9 (13.8%) 6.8 (15%) 8.7 7.4 (14.9%) 7.2 (17.2%)
High roof 8.7 7.1 (18.4%) 7.0 (19.5%) 9.3 7.3 (21.5%) 7.1 (23.7%) Notes: aCarbon dioxide (CO2) emission standards are proportionate and expressed in grams CO2 per (Kbhp-hr, thousands of brake-horse power hours) or (Kton-mi,
thousands of ton-miles). Numerically, the conversion factor from gallons of fuel to grams CO2 is about 10,000. bThe fuel consumption standard for engines is voluntary for 2014. Not so the CO2 standard.
cVehicle standards reflect engine improvements.
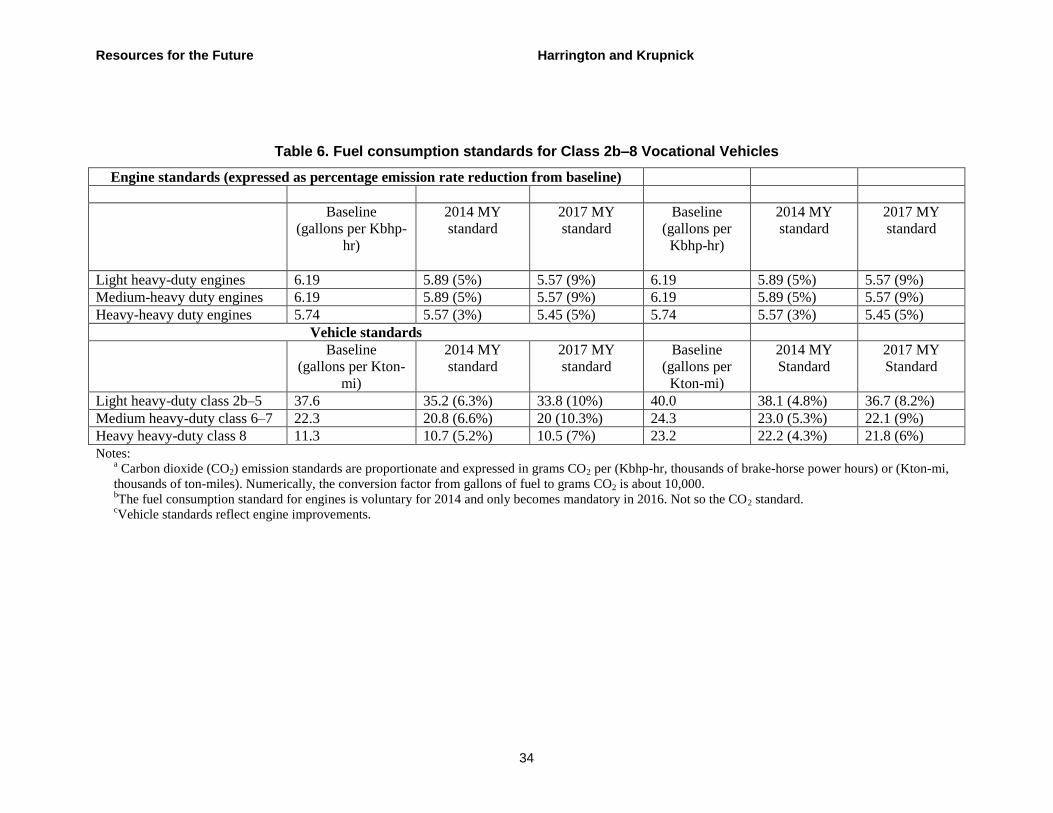
Resources for the Future Harrington and Krupnick
34
Table 6. Fuel consumption standards for Class 2b–8 Vocational Vehicles
Engine standards (expressed as percentage emission rate reduction from baseline)
Baseline
(gallons per Kbhp-
hr)
2014 MY
standard
2017 MY
standard
Baseline
(gallons per
Kbhp-hr)
2014 MY
standard
2017 MY
standard
Light heavy-duty engines 6.19 5.89 (5%) 5.57 (9%) 6.19 5.89 (5%) 5.57 (9%)
Medium-heavy duty engines 6.19 5.89 (5%) 5.57 (9%) 6.19 5.89 (5%) 5.57 (9%)
Heavy-heavy duty engines 5.74 5.57 (3%) 5.45 (5%) 5.74 5.57 (3%) 5.45 (5%)
Vehicle standards
Baseline
(gallons per Kton-
mi)
2014 MY
standard
2017 MY
standard
Baseline
(gallons per
Kton-mi)
2014 MY
Standard
2017 MY
Standard
Light heavy-duty class 2b–5 37.6 35.2 (6.3%) 33.8 (10%) 40.0 38.1 (4.8%) 36.7 (8.2%)
Medium heavy-duty class 6–7 22.3 20.8 (6.6%) 20 (10.3%) 24.3 23.0 (5.3%) 22.1 (9%)
Heavy heavy-duty class 8 11.3 10.7 (5.2%) 10.5 (7%) 23.2 22.2 (4.3%) 21.8 (6%)
Notes: a Carbon dioxide (CO2) emission standards are proportionate and expressed in grams CO2 per (Kbhp-hr, thousands of brake-horse power hours) or (Kton-mi,
thousands of ton-miles). Numerically, the conversion factor from gallons of fuel to grams CO2 is about 10,000. bThe fuel consumption standard for engines is voluntary for 2014 and only becomes mandatory in 2016. Not so the CO2 standard.
cVehicle standards reflect engine improvements.

Resources for the Future Harrington and Krupnick
35
Table 7. Costs Reduced in 2050 from Heavy-Duty Vehicle Regulations, 2009 dollars
Cost measure Class 7–8
combination
tractors
Class 2b–8
vocational
vehicles
Cost per vehicle (2020) $6,004 $366
Cost per ton CO2 reduced (2050, not
including fuel savings)
$20 $30
Fuel savings per 2018 model year
vehicle (lifetime) at 3% and 7%
discount rate
$79,089
$64,376
$5,872
$4,646
Payback period at 3% discount rate ~7 months ~6 months
Cost per ton CO2 reduced (2050,
including fuel savings)
-$320 -$310
Source: U.S. EPA and NHTSA 2011.
Table 8. Estimated Net Benefits of Heavy-Duty Vehicle Regulations
Category Benefits averaged over 2014–2018 model
years, millions of 2009 dollars (3% discount
rate)
Technology costs $1,620
Public good benefits
Energy security $540
Rebound externalities -$300
CO2 emission reductions (3% discount) $1,140
Net Benefits (before private benefits) -$240
Private benefits
Refueling $80
Fuel savings $10,020
Net including private benefits $9,860
Net including private benefits (7% discount
rate)
$6,600
Source: U.S. EPA and NHTSA 2011.

Resources for the Future Harrington and Krupnick
36
Table 9. Estimates of Fuel Price Elasticities, 1966–2001
Short run Long run
Elasticity of vehicle miles traveled with respect to
price per mile
At sample mean -0.047 -0.220
1997–2001 -0.026 -0.121
Elasticity of fuel intensity with respect to price per
gallon
At sample mean -0.044 -0.191
1997–2001 -0.045 -0.220
Elasticity of total fuel use with respect to price per
gallon
At sample mean -0.091 -0.411
1997–2001 -0.071 -0.342
Source: Small and Van Dender 2005.