improving mechanistic-empirical models for predicting hma ... · improving mechanistic-empirical...
TRANSCRIPT
Improving MechanisticImproving Mechanistic--Empirical Models Empirical Models for Predicting HMA Ruttingfor Predicting HMA Rutting
Charles SchwartzCharles SchwartzUniversity of MarylandUniversity of Maryland
Pavement Performance Prediction Symposium 2006, Laramie WY

NCHRP 9-30A
“Calibration of Rutting Models for HMA Structural and Mix Design “
• PI: Harold Von Quintus/Applied Research Associates
• Co-PIs:Charles Schwartz/University of MarylandRamon Bonaquist/Advanced Asphalt Technologies
• Other subcontractors:Burns Denton Cooley, Inc.North Carolina State University

Primary Project Objectives
“Recommend revisions to the HMA rut depth prediction model in the M-E PDG developed in NCHRP Project 1-37A”
Enhancements to existing HMA rutting model
Investigation of alternative models
Evaluation via calibration and validation against field sections using measuredmaterial properties
Secondary Project Objectives
• Compile laboratory-measured material property values for select full-scale pavement sections
• Develop a database tailored to calibration and validation of M-E distress prediction models
• Support the continuing advance toward more fully mechanistic performance prediction models
Motivation for Project
• Perceived deficiencies in current M-E model for HMA rutting:
Inadequate measured (“level 1”) material properties for LTPP calibration sectionsNo layer properties related to permanent deformation resistance of mixtureCounterintuitive variations of permanent deformations with depthNo robust basis for apportioning measured surface rutting to various layers

00.20.40.60.8
11.21.41.6
0 0.2 0.4 0.6 0.8 1 1.2 1.4 1.6
Measured Rut Depth, inches
Pred
icte
d R
ut D
epth
(In
put L
evel
3),
inch
es
NCAT WesTrack Line of EqualityMnRoads FHWA-ALF
00.20.40.60.8
11.21.41.6
0 0.2 0.4 0.6 0.8 1 1.2 1.4 1.6
Measured Rut Depth, inches
Pred
icte
d R
ut D
epth
(In
put L
evel
3),
inch
es
NCAT WesTrack Line of EqualityMnRoads FHWA-ALF
0
0.2
0.4
0.6
0.8
1
1.2
1.4
1.6
0 0.2 0.4 0.6 0.8 1 1.2 1.4 1.6
Measured Rut Depth, inches
Pred
icte
d R
ut D
epth
(Inp
ut
Leve
l 1),
inch
es
NCAT WesTrack FHWA-ALF Line of Equality MnRoads
0
0.2
0.4
0.6
0.8
1
1.2
1.4
1.6
0 0.2 0.4 0.6 0.8 1 1.2 1.4 1.6
Measured Rut Depth, inches
Pred
icte
d R
ut D
epth
(Inp
ut
Leve
l 1),
inch
es
NCAT WesTrack FHWA-ALF Line of Equality MnRoads
Level 3 E* Inputs
Level 1 E* Inputs
NCHRP 9-30(001)
Phase I: Workshop—Objectives
• Identify alternate rut models for evaluation
• Develop guidance on two key issues:Maximum allowable prediction errorDesign criterion/limit for HMA rutting
• Identify problem statements for future workShort term (HMA structural, mix design; performance based specifications)Long term (more mechanistic approaches)
23 participants over 2 days

Phase II: Database Design Review
Major Data Areas• General project information• Pavement structure• Traffic• Climate• Material properties• Performance (load-related cracking,
transverse cracking, rutting, roughness)
M-E_DPM Database
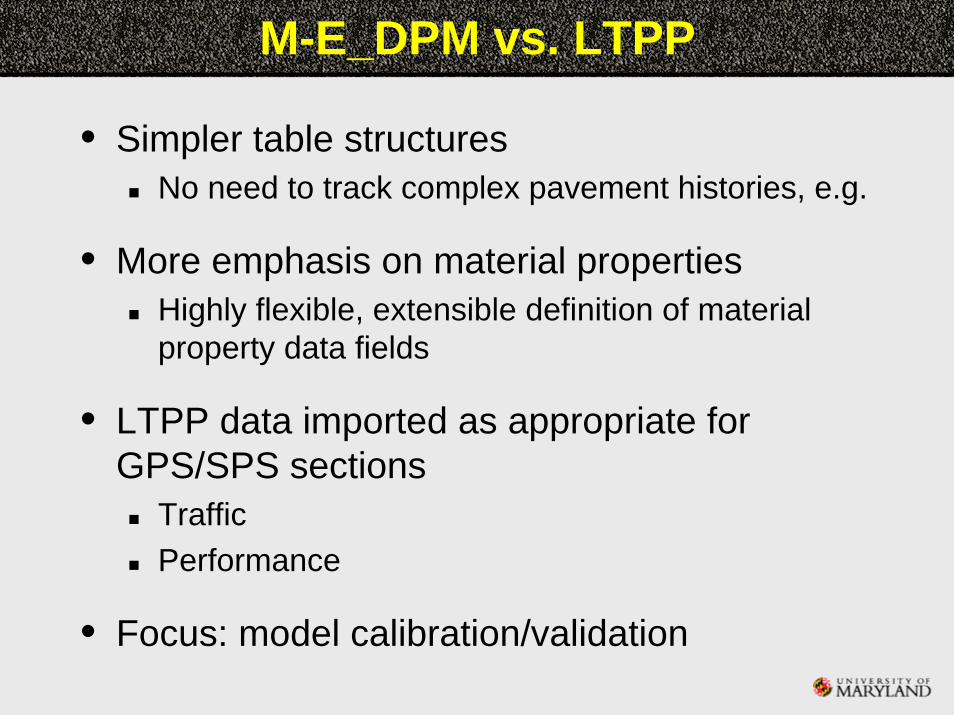
M-E_DPM vs. LTPP
• Simpler table structuresNo need to track complex pavement histories, e.g.
• More emphasis on material propertiesHighly flexible, extensible definition of material property data fields
• LTPP data imported as appropriate for GPS/SPS sections
TrafficPerformance
• Focus: model calibration/validation

+ links to test data files

Current Database Population
1941
96
SPSGPSTest Tracks
1941
96
SPSGPSTest Tracks
291 sections total

SPS Sections
47
85
30
17 9 6SPS-1SPS-5SPS-6SPS-9JSPS-9NSPS-9O
47
85
30
17 9 6SPS-1SPS-5SPS-6SPS-9JSPS-9NSPS-9O

ALF/Test Tracks
12
11
9
922
4
9
20 MnRoadNCATALF (1/2)LA ALFWesTrackNevadaMS I55CAL/APT
12
11
9
922
4
9
20 MnRoadNCATALF (1/2)LA ALFWesTrackNevadaMS I55CAL/APT

Phase III: Execute Experimental Plan
• Final experiment matrix
• Field investigations/sample collection
• Laboratory testingPart A (intensive testing of few sections)Part B (routine testing of all sections)
• Database population
• Model calibration/validation/evaluationModel refinement/enhancement

Experimental Plan Matrix

Identified Sections

Models Considered
• “Mostly” empiricalWorld BankBaladi
• Other Mechanistic-EmpiricalPermanent axial strain models
LeahyAsphalt InstituteVESYSVerstraetenUzan
Permanent shear strain modelsWestrack
• Enhanced NCHRP 1-37ANCHRP 1-40A+NCHRP 1-40B
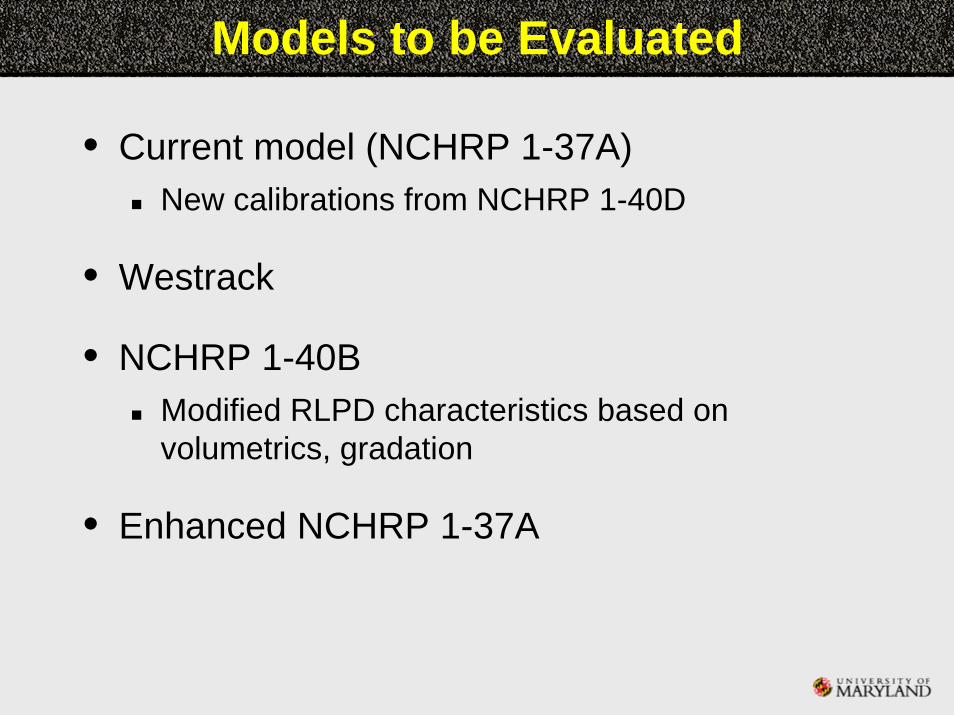
Models to be Evaluated
• Current model (NCHRP 1-37A)New calibrations from NCHRP 1-40D
• Westrack
• NCHRP 1-40BModified RLPD characteristics based on volumetrics, gradation
• Enhanced NCHRP 1-37A

Westrack M-E based on γp
γp = permanent shear strain at a depth of 2 inches below the surface τ = mechanistically-determined elastic shear stress at z = 2 inγe = mechanistically-determined elastic shear strain at z = 2 ina, b, c = material constants, obtained from SST-CH
ce
bp Nae γγ τ=
Time-hardening principle:
[ ],1 1 1c
p a Nγ = Δ1
, 1,
c
cp t
p t t tt
a Na
γγ −
⎡ ⎤⎛ ⎞⎢ ⎥= + Δ⎜ ⎟⎢ ⎥⎝ ⎠⎢ ⎥⎣ ⎦
teb
t aea ,γτ=
γe,t = elastic shear strain for the tth period of loadingγp,t = permanent shear strain for the tth periodΔNt = number of load applications during the tth period
RD = Kγp,t
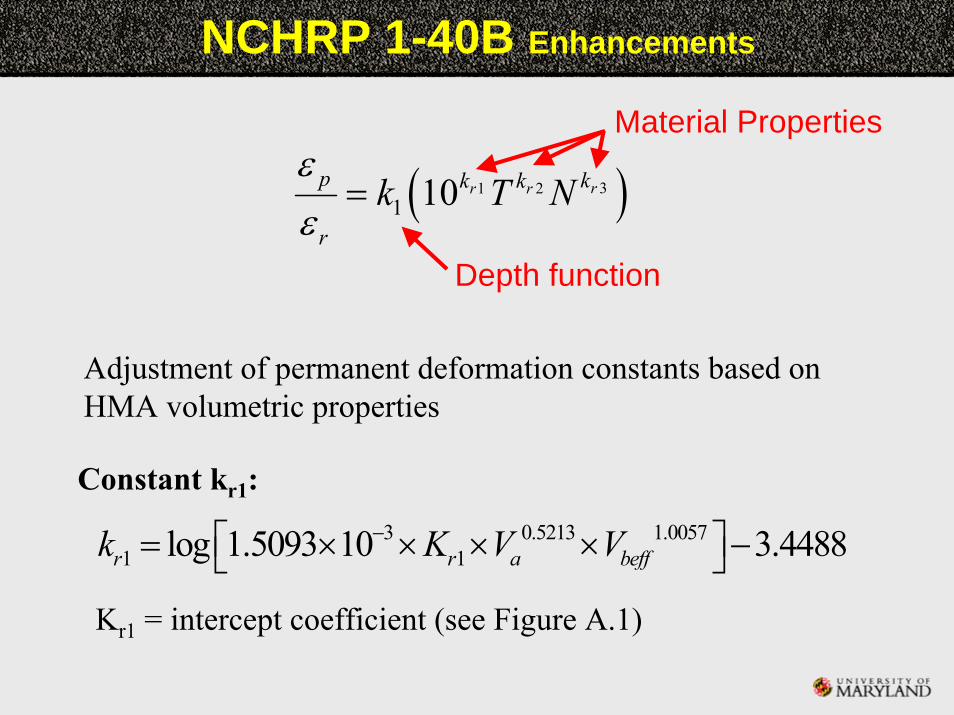
NCHRP 1-40B Enhancements
( )31 21 10 rr rp kk k
r
k T Nεε
=
Adjustment of permanent deformation constants based on HMA volumetric properties
Constant kr1:3 0.5213 1.0057
1 1log 1.5093 10 3.4488r r a beffk K V V−⎡ ⎤= × × × × −⎣ ⎦
Kr1 = intercept coefficient (see Figure A.1)
Depth function
Material Properties
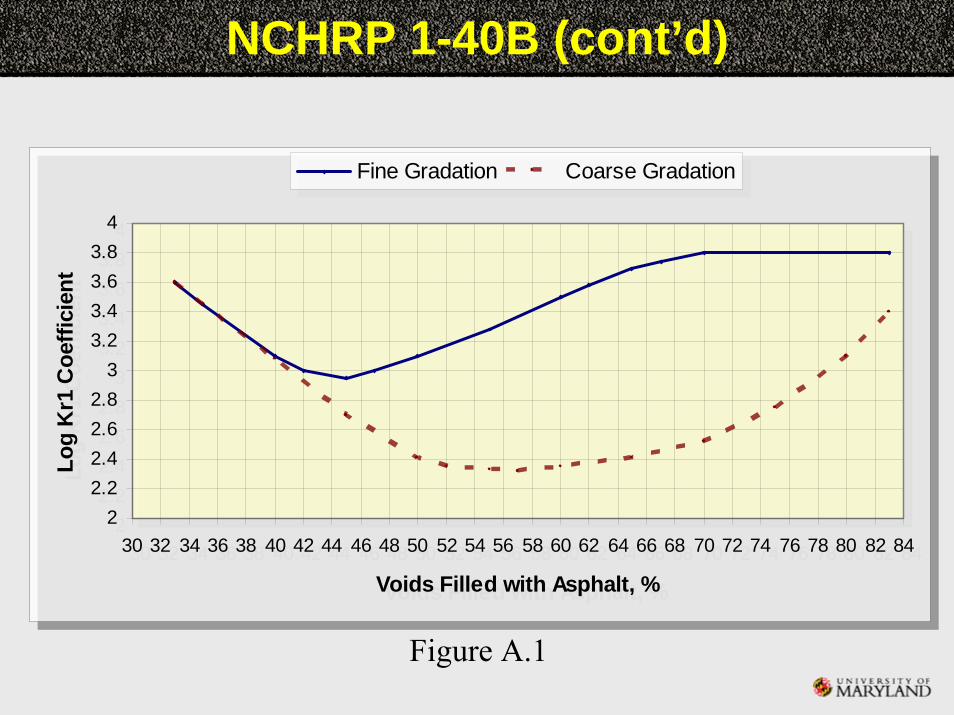
NCHRP 1-40B (cont’d)
22.22.42.62.8
33.23.43.63.8
4
30 32 34 36 38 40 42 44 46 48 50 52 54 56 58 60 62 64 66 68 70 72 74 76 78 80 82 84
Voids Filled with Asphalt, %
Log
Kr1
Coe
ffici
ent
Fine Gradation Coarse Gradation
22.22.42.62.8
33.23.43.63.8
4
30 32 34 36 38 40 42 44 46 48 50 52 54 56 58 60 62 64 66 68 70 72 74 76 78 80 82 84
Voids Filled with Asphalt, %
Log
Kr1
Coe
ffici
ent
Fine Gradation Coarse Gradation
Figure A.1

NCHRP 1-40B (cont’d)
Constant kr2: 0.25 1.25
2( ) ( )
1.5606 a br index index
a design b opt
V Pk F CV P⎛ ⎞ ⎛ ⎞
= ⎜ ⎟ ⎜ ⎟⎜ ⎟ ⎜ ⎟⎝ ⎠ ⎝ ⎠
Va(design) = design air voidsPb = asphalt content by weightPb(opt) = design asphalt content by weightFindex = fine aggregate angularity index (Table A.2)Cindex = coarse aggregate angularity index (Table A.3)

NCHRP 1-40B (cont’d)
Table A.2. Fine aggregate angularity index used to adjust permanent deformation parameters, FIndex.
Fine Aggregate Angularity Gradation – External to restricted zone. < 45 > 45
Dense Grading – External to Restricted Zone 1.00 0.90 Dense Grading – Through Restricted Zone 1.05 1.0
Table A.3. Coarse aggregate angularity index used to adjust permanent deformation parameters, CIndex.
Percent Crushed Material with Two Faces Type of Gradation 0 25 50 75 100 Well Graded 1.1 1.05 1.0 1.0 0.9 Gap Graded 1.2 1.1 1.05 1.0 0.9
NCHRP 1-40B (cont’d)
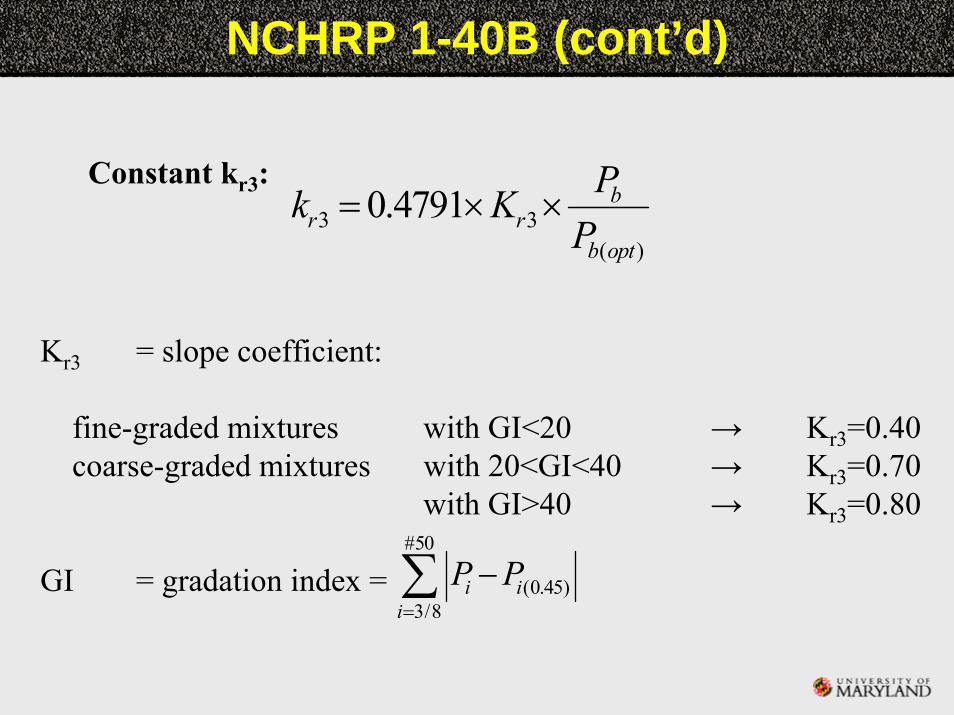
3 3( )
0.4791 br r
b opt
Pk KP
= × ×Constant kr3:
Kr3 = slope coefficient:
fine-graded mixtures with GI<20 → Kr3=0.40coarse-graded mixtures with 20<GI<40 → Kr3=0.70
with GI>40 → Kr3=0.80
GI = gradation index = #50
(0.45)3/8
i ii
P P=
−∑

NCHRP 1-40B (cont’d)
00.20.40.60.8
11.21.41.6
0 0.2 0.4 0.6 0.8 1 1.2 1.4 1.6
Measured Rut Depth, in.
Pre
dict
ed R
ut D
epth
, in.
APT, Full-Scale Truck Loading Line of EqualityAPT, Simulated Truck Loading Roadway, Mixed Truck Traffic
00.20.40.60.8
11.21.41.6
0 0.2 0.4 0.6 0.8 1 1.2 1.4 1.6
Measured Rut Depth, in.
Pre
dict
ed R
ut D
epth
, in.
APT, Full-Scale Truck Loading Line of EqualityAPT, Simulated Truck Loading Roadway, Mixed Truck Traffic

ALF Comparisons: Lane 10
0.0
0.5
1.0
1.5
2.0
2.5
3.0
0 2000 4000 6000 8000 10000ESALs
Rut
ting
(in)
MeasuredLeahyNCHRP 1-37AWestrackVerstraetenVESYSNCHRP 1-40B
0.0
0.5
1.0
1.5
2.0
2.5
3.0
0 2000 4000 6000 8000 10000ESALs
Rut
ting
(in)
MeasuredLeahyNCHRP 1-37AWestrackVerstraetenVESYSNCHRP 1-40B
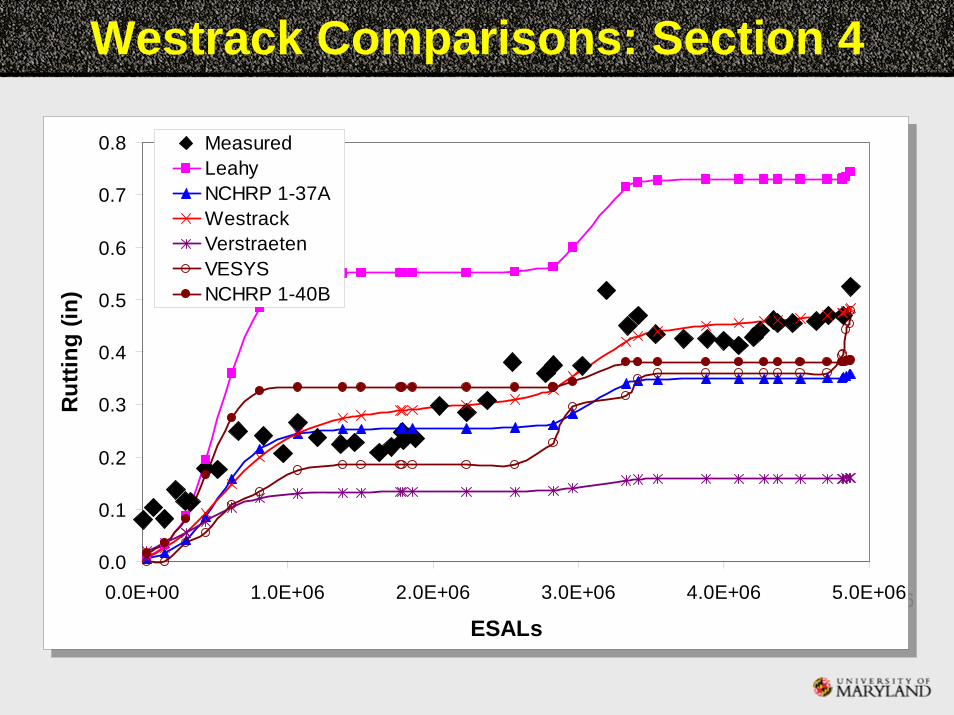
Westrack Comparisons: Section 4
0.0
0.1
0.2
0.3
0.4
0.5
0.6
0.7
0.8
0.0E+00 1.0E+06 2.0E+06 3.0E+06 4.0E+06 5.0E+06
ESALs
Rut
ting
(in)
MeasuredLeahyNCHRP 1-37AWestrackVerstraetenVESYSNCHRP 1-40B
0.0
0.1
0.2
0.3
0.4
0.5
0.6
0.7
0.8
0.0E+00 1.0E+06 2.0E+06 3.0E+06 4.0E+06 5.0E+06
ESALs
Rut
ting
(in)
MeasuredLeahyNCHRP 1-37AWestrackVerstraetenVESYSNCHRP 1-40B
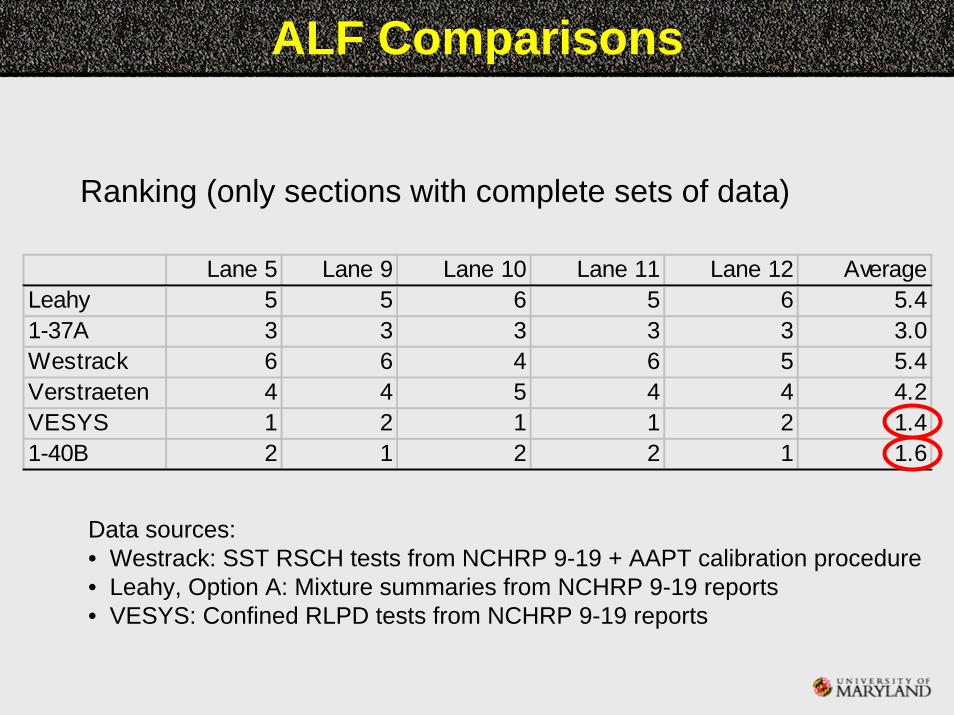
ALF Comparisons
Lane 5 Lane 9 Lane 10 Lane 11 Lane 12 AverageLeahy 5 5 6 5 6 5.41-37A 3 3 3 3 3 3.0Westrack 6 6 4 6 5 5.4Verstraeten 4 4 5 4 4 4.2VESYS 1 2 1 1 2 1.41-40B 2 1 2 2 1 1.6
Ranking (only sections with complete sets of data)
Data sources:• Westrack: SST RSCH tests from NCHRP 9-19 + AAPT calibration procedure• Leahy, Option A: Mixture summaries from NCHRP 9-19 reports• VESYS: Confined RLPD tests from NCHRP 9-19 reports
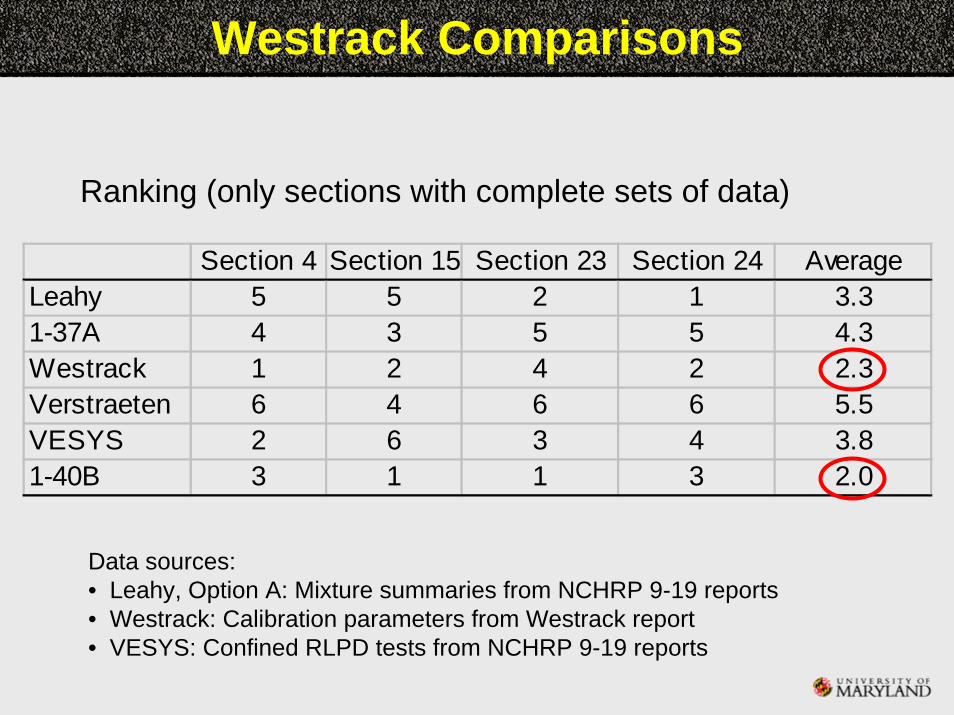
Westrack Comparisons
Ranking (only sections with complete sets of data)
Section 4 Section 15 Section 23 Section 24 AverageLeahy 5 5 2 1 3.31-37A 4 3 5 5 4.3Westrack 1 2 4 2 2.3Verstraeten 6 4 6 6 5.5VESYS 2 6 3 4 3.81-40B 3 1 1 3 2.0
Data sources:• Leahy, Option A: Mixture summaries from NCHRP 9-19 reports• Westrack: Calibration parameters from Westrack report• VESYS: Confined RLPD tests from NCHRP 9-19 reports

Enhanced NCHRP 1-37A
• Material-dependent RLPD propertiesTreat as layer property rather than global parameters
• Additional stress terms/influencesConfining stressDeviatoric stress
• More rational depth factorLook to mechanistic models for guidance?

-1.2-1
-0.8-0.6-0.4-0.2
00.20.40.60.8
11.2
0 0.1 0.2 0.3 0.4 0.5 0.6 0.7 0.8 0.9
Predicted HMA Rut Depth, in.
Resi
dual
Err
or (P
redi
cted
M
inus
Mea
sure
d), i
n.
NCAT WesTrack MnRoads
-1.2-1
-0.8-0.6-0.4-0.2
00.20.40.60.8
11.2
0 0.1 0.2 0.3 0.4 0.5 0.6 0.7 0.8 0.9
Predicted HMA Rut Depth, in.
Resi
dual
Err
or (P
redi
cted
M
inus
Mea
sure
d), i
n.
NCAT WesTrack MnRoads
-1.2-1
-0.8-0.6-0.4-0.2
00.20.40.60.8
11.2
0 0.2 0.4 0.6 0.8 1 1.2 1.4 1.6
Predicted HMA Rut Depth, in.
Resi
dual
Err
or (P
redi
cted
M
inus
Mea
sure
d), i
n.
WesTrack NCAT MnRoads
-1.2-1
-0.8-0.6-0.4-0.2
00.20.40.60.8
11.2
0 0.2 0.4 0.6 0.8 1 1.2 1.4 1.6
Predicted HMA Rut Depth, in.
Resi
dual
Err
or (P
redi
cted
M
inus
Mea
sure
d), i
n.
WesTrack NCAT MnRoads
“Level 3” RLPDProperties
“Level 2” RLPDProperties(NCHRP 1-40B)

Stress Effects on Material Response
0.0001
0.001
0.01
0.1
0.010 0.100 1.000 10.000 100.000 1000.000
Cumulative Deviatoric Load Time (sec)
Cum
. Dev
iato
ric V
isco
plas
tic S
trai
n 1525 kPa Unconfined Replicates1500 kPa 250 kPa Confined Replicates1480 kPa 500 kPa Confined Replicates
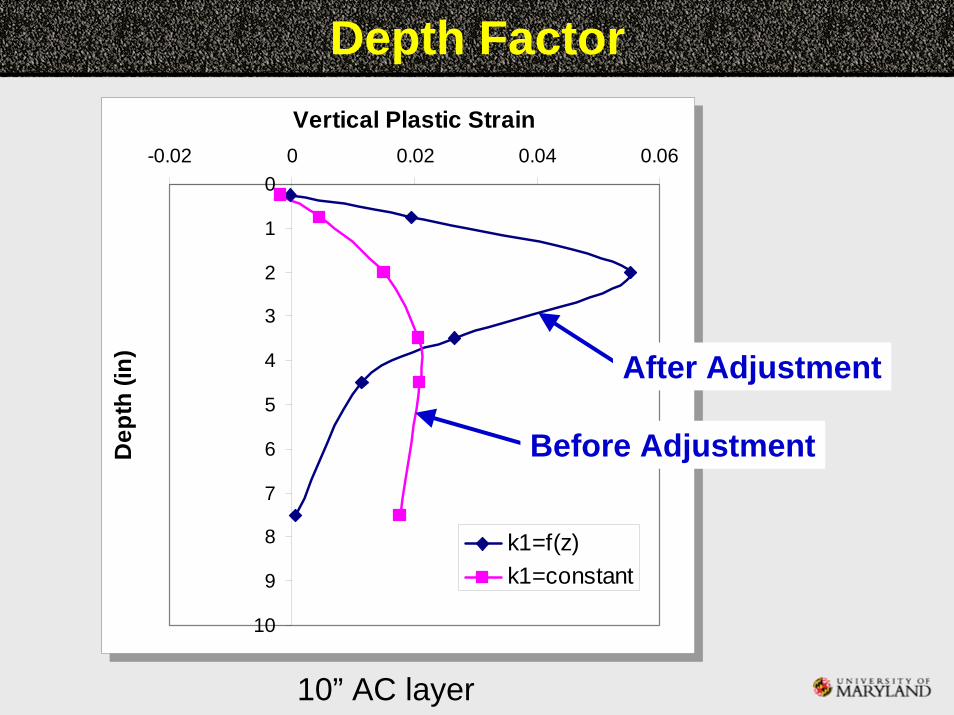
Depth Factor
0
1
2
3
4
5
6
7
8
9
10
-0.02 0 0.02 0.04 0.06
Vertical Plastic StrainD
epth
(in)
k1=f(z)k1=constant
0
1
2
3
4
5
6
7
8
9
10
-0.02 0 0.02 0.04 0.06
Vertical Plastic StrainD
epth
(in)
k1=f(z)k1=constant
10” AC layer
Before Adjustment
After Adjustment
Field Evaluation Activities
• Compile existing data:TrafficClimateVisual distressPerformance (rutting)FWD
• Collect new data:TrenchesCoresMaterial samples
Trenches are Essential
• Measured rutting is total rutting at surface
• M-E models predict rutting in individual layersHMAUnbound base/subbaseSubgrade
• Trench data provide rational basis for apportioning total surface rutting to layers
Material Property Tests
• For all sections:Uniaxial dynamic modulusTriaxial repeated load permanent deformationShear dynamic modulusRepeated load constant height shear
• For selected sections:Triaxial RLPD at additional stress statesAdvanced material characterization (e.g., NCHRP 9-19 test suite):
Triaxial constant strain rate to failure (compression, tension)Triaxial creep and recovery (compression)Others?

Project Timeline
• Project Panel meeting on July 27
• Phase III commences August/September
• Two year duration for Phase III

m-E M-E M-e