improving note segmentation in … note segmentation in automatic ... in automatic piano music...
TRANSCRIPT
IMPROVING NOTE SEGMENTATION IN AUTOMATIC PIANO MUSICTRANSCRIPTION SYSTEMS WITH A TWO-STATE PITCH-WISE HMM
METHOD
Dorian Cazau1 Yuancheng Wang2 Olivier Adam3
Qiao Wang2 Gregory Nuel41 Lab-STICC, ENSTA-Bretagne
2 School of Information Science and Engineering, Southeast China3 Institut d’Alembert, UPMC
4 LPMA, [email protected]
ABSTRACT
Many methods for automatic piano music transcription in-volve a multi-pitch estimation method that estimates anactivity score for each pitch. A second processing step,called note segmentation, has to be performed for eachpitch in order to identify the time intervals when the notesare played. In this study, a pitch-wise two-state on/offfirst-order Hidden Markov Model (HMM) is developedfor note segmentation. A complete parametrization of theHMM sigmoid function is proposed, based on its orig-inal regression formulation, including a parameter α ofslope smoothing and β of thresholding contrast. A com-parative evaluation of different note segmentation strate-gies was performed, differentiated according to whetherthey use a fixed threshold, called “Hard Thresholding”(HT), or a HMM-based thresholding method, called “SoftThresholding” (ST). This evaluation was done followingMIREX standards and using the MAPS dataset. Also, dif-ferent transcription and recording scenarios were tested us-ing three units of the Audio Degradation toolbox. Resultsshow that note segmentation through a HMM soft thresh-olding with a data-based optimization of the {α, β} pa-rameter couple significantly enhances transcription perfor-mance.
1. INTRODUCTION
Work on Automatic Music Transcription (AMT) datesback more than 30 years [21], and has known numerousapplications in the fields of music information retrieval, in-teractive computer systems, and automated musicologicalanalysis [16]. Due to the difficulty in producing all the in-
c© Dorian Cazau, Yuancheng Wang, Olivier Adam, QiaoWang, Gregory Nuel. Licensed under a Creative Commons Attribu-tion 4.0 International License (CC BY 4.0). Attribution: DorianCazau, Yuancheng Wang, Olivier Adam, Qiao Wang, Gregory Nuel. “IM-PROVING NOTE SEGMENTATION IN AUTOMATIC PIANO MUSICTRANSCRIPTION SYSTEMS WITH A TWO-STATE PITCH-WISEHMM METHOD”, 18th International Society for Music Information Re-trieval Conference, Suzhou, China, 2017.
formation required for a complete musical score, AMT iscommonly defined as the computer-assisted process of an-alyzing an acoustic musical signal so as to write down themusical parameters of the sounds that occur in it, whichare basically the pitch, onset time, and duration of eachsound to be played. In this study, we will restrict our-selves to this task of “low-level” transcription. Despite thislarge enthusiasm for AMT challenges, and several audio-to-MIDI converters available commercially, perfect poly-phonic AMT systems are out of reach of today’s technol-ogy.
The diversity of music practice, as well as supportsof recording and diffusion, makes the task of AMT verychallenging. These variability sources can be partitionedbased on three broad classes: 1) instrument based, 2) mu-sic language model based and 3) technology based. Thefirst class covers variability from tonal instrument tim-bre. All instruments possess a specific acoustic signa-ture, that makes them recognizable among different instru-ments playing a same pitch. This timbre is defined byacoustic properties, both spectral and temporal, specificto each instrument. The second class includes variabilityfrom the different ways an instrument can be played, thatvary with the musical genre (e.g. tonality, tuning, rhythm),the playing techniques (e.g. dynamics, plucking modes),and the personal interpretations of a same piece. Thesefirst two classes induce a high complexity of note spec-tra over time, whose non-stationarity is determined bothby the instrument and the musician playing characteris-tics. The third class includes variability from electrome-chanics (e.g. transmission channel, microphone), environ-ment (e.g. background noise, room acoustics, distant mi-crophone), data quality (e.g. sampling rate, recording qual-ity, audio codec/compression). For example, in ethnomu-sicological research, extensive sound datasets currently ex-ist, with generally poor quality recordings made on thefield, while a growing need for automatic analysis appears[9, 18, 20, 25].
Concerning AMT methods, many studies have usedrank reduction and source separation methods, exploitingboth the additive and oscillatory properties of audio sig-
523

nals. Among them, spectrogram factorization methodshave become very popular, from the original Non-negativeMatrix Factorization (NMF) to the recent developmentsof the Probabilistic Latent Component Analysis (PLCA)[2, 5]. PLCA is a powerful method for Multi-Pitch Esti-mation (MPE), representing the spectra as a linear com-bination of vectors from a dictionary. Such models takeadvantage of the inherent low-rank nature of magnitudespectrograms to provide compact and informative descrip-tions. Their output generally takes the form of a pianoroll-like matrix showing the “activity” of each spectral basisagainst time, that is itself discretized into successive timeframe of analysis (of the order of magnitude of 11 ms).From this activity matrix, the next processing step in viewof AMT is note segmentation, that aims to identify for eachpitch the time intervals when the notes are played. To per-form this operation, most spectrogram factorization-basedtranscription methods [11, 15, 22] use a simple threshold-based detection of the note activations from the pitch activ-ity matrix, followed by a minimum duration pruning. Oneof the main drawback of this PLCA method with a simplethreshold is that all successive frame are processed inde-pendently from one another, and thus temporal correlationbetween successive frames is not modeled. One solutionthat has been proposed is to jointly learn spectral dictionar-ies as well as a Markov chain that describes the structureof changes between these dictionaries [5, 22, 23].
In this paper, we will focus on the note segmentationstage, using a pitch-wise two-state on/off first-order HMM,initially proposed by Poliner et al. [24] for AMT. ThisHMM allows taking into account the dependence of pitchactivation across time frames. We review the formalism ofthis model, including a full parametrization of the sigmoidfunction used to map HMM observation probabilities intothe [0, 1] interval, with a term α of slope smoothing andβ of thresholding contrast. After demonstrating the rel-evance of an optimal adjustment of these parameters fornote segmentation, a supervised approach to estimate thesigmoid parameters from a learning corpus is proposed.Note that Cheng et al. [8] explicitly modeled the differentstages of a piano sound for note tracking, while we ratherfocus on more general musical features such as dynam-ics. Also, the Audio Degradation toolbox [19] was usedto build three “degraded” sound datasets that have allowedto evaluate transcription performance on real life types ofaudio recordings, such as radio broadcast and MP3 com-pressed audio, that are almost never dealt with in transcrip-tion studies.
2. METHODS
2.1 Background on PLCA
PLCA is a probabilistic factorization method [26] basedon the assumption that a suitably normalized magnitudespectrogram, V , can be modeled as a joint distribution overtime and frequency, P (f, t), with f is the log-frequencyindex and t = 1, . . . , T the time index with T the numberof time frames. This quantity can be factored into a frame
probability P (t), which can be computed directly from theobserved data (i.e. energy spectrogram), and a conditionaldistribution over frequency bins P (f |t), as follows [7]
P (f |t) =∑p,m
P (f |p,m)P (m|p, t)P (p|t) (1)
where P (f |p,m) are the spectral templates for pitch p =1, . . . , Np (with Np the number of pitches) and playingmode m, P (m|p, t) is the playing mode activation, andP (p|t) is the pitch activation (i.e. the transcription). Inthis paper, the playing mode m will refer to different play-ing dynamics (i.e. note loudness). To estimate the modelparameters P (m|p, t) and P (p|t), since there is usuallyno closed-form solution for the maximization of the log-likelihood or the posterior distributions, iterative updaterules based on the Expectation-Maximization (EM) algo-rithm [10] are employed (see [4] for details). The pitchactivity matrix P (p, t) is deduced from P (p|t) with theBayes’ rule
P (p, t) = P (t)P (p|t) (2)
PLCA note templates are learned with pre-recorded iso-lated notes, using a one component PLCA model (i.e. m =1 in Eq. (1). Three different note templates per pitch areused during MPE. In this paper, we use the PLCA-basedMPE system developed by Benetos and Weyde [6] 1 .
In the following, for p = 1, . . . , Np and t = 1, . . . , T ,we define the logarithmic pitch activity matrix as
Xp,t = log(P (p, t)
)(3)
2.2 Note Segmentation Strategies
2.2.1 HT: Hard Thresholding
The note segmentation strategy HT consists of a sim-ple thresholding βHT of the logarithmic pitch activity ma-trix X(p, t), as it is most commonly done in spectrogramfactorization-based transcription or pitch tracking systems,e.g. in [11, 15, 22]. This HT is sometimes combined witha minimum duration constraint with typical post filteringlike “all runs of active pitch of length smaller than k are setto 0”.
2.2.2 ST: Soft Thresholding
In this note segmentation strategy, initially proposed byPoliner and Ellis [24], each pitch p is modelled as a two-state on/off HMM, i.e. with underlying states qt ∈ {0, 1}that denote pitch activity/inactivity. The state dynamics,transition matrix, and state priors are estimated from our“directly observed” state sequences, i.e. the training MIDIdata, that are sampled at the precise times correspondingto the analysis frames of the activation matrix.
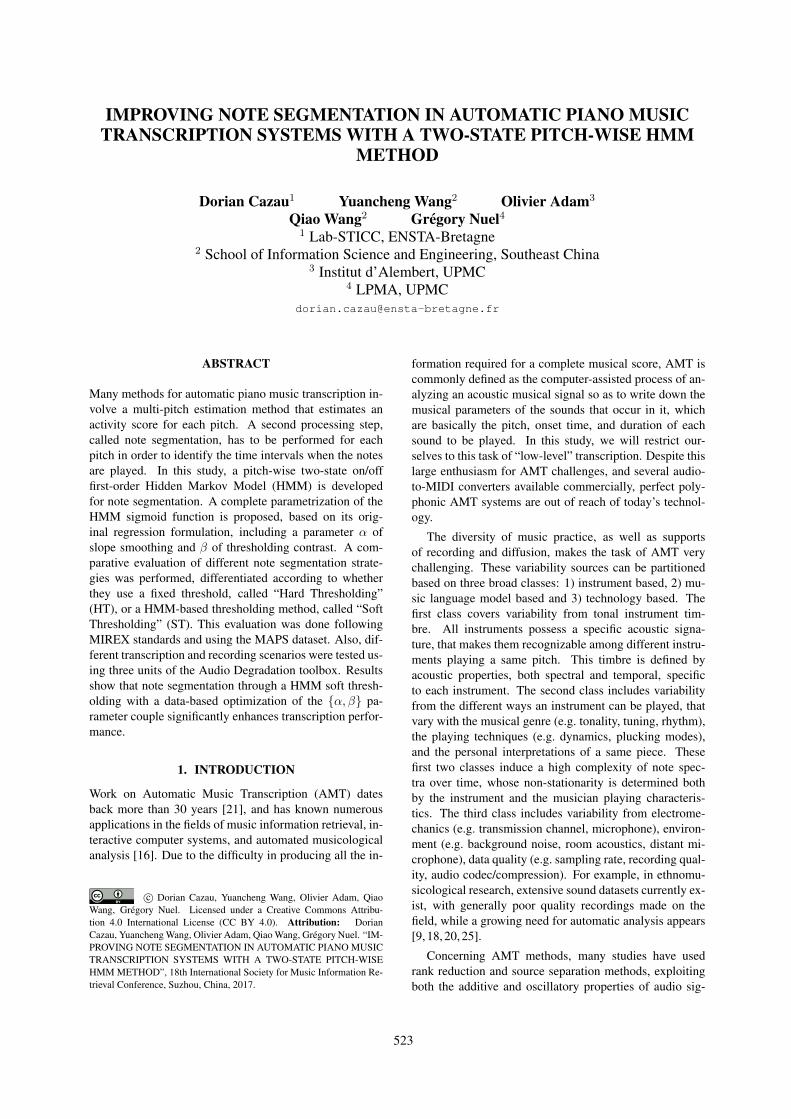
For each pitch p, we consider an independent HMMwith observationsXp,t, that are actually observed, and hid-den binary Markov sequenceQ = q1, . . . , qT , illustrated infigure 1. The Markov model then follows the law:
1 Codes are available at https://code.soundsoftware.ac.uk/projects/amt_mssiplca_fast.
524 Proceedings of the 18th ISMIR Conference, Suzhou, China, October 23-27, 2017
Xp,1 Xp,2 Xp,3 Xp,T
q1 q2 q3 qT
. . . .
Figure 1. Graphical representation of the two-state on/offHMM. qt ∈ {0, 1} are the underlying states label at time t,and ot the the probability observations.
P (Q,X) ∝ P (q1)T∏t=2
P (qt|qt−1)T∏t=1
P (qt|Xp,t) (4)
where ∝ means “proportional to”, as the probabilities donot sum to 1. For t = 1, . . . , T , we assume that:
P (qt = 0|qt = 0) = 1−τ0 P (qt = 1|qt = 0) = τ0 (5)
P (qt = 0|qt = 1) = τ1 P (qt = 1|qt = 1) = 1−τ1 (6)
with τ0, τ1 ∈ [0, 1] the transition probabilities, and the con-vention that q0 = 0 because all notes are inactive at thebeginning of a recording. The transition probabilities τcorrespond to the state transitions: on/on, on/off, off/on,off/off. Parameter τ0 (resp. τ1) is directly related to theprior duration of inactivity (resp. activity) of pitch p. With-out observation, the length of an inactivity run (resp. activ-ity run) would be geometric with parameter τ0 (resp. τ1)with average length 1/τ0 (resp. 1/τ0).
The observation probabilities are defined as follows, us-ing a sigmoid curve with the PLCA pitch activity matrixXp,t as input,
P (qt = 0|Xp,t) ∝ 1/Z (7)
P (qt = 1|Xp,t) ∝ e[eα(Xp,t−β)]/Z (8)
with α, β ∈ R, and Z defined such as∑qtP (qt|Xp,t) =
Z. The parameter of the model is denoted θ = (τ, α, β)which includes the specific value for all pitches. The HMMmodel is solved using classical forward-backward recur-sions for all t = 1, . . . , T , i.e. Pθ(qt = s|Xp,t) = ηs(t) ∝Ft(s)Bt(s).
Note that the HMM definition combines both the spa-tial pitch dependence (the Markov model) with a PLCAgenerative model. As a result of this combination, the re-sulting model is defined up to a constant factor, but this isnot a problem since we will exploit this model to computeposterior distribution. In contrast, in the initial model [24],one should note that a similar model is suggested where thePLCA generative part is associated with the so-called “vir-tual observation”. We here preferred the fully generativeformulation presented above, but both models are totallyequivalent.
Using logarithmic values, the parameters {α, β}, ex-pressed in dB, are directly interpretable by physics. β is an
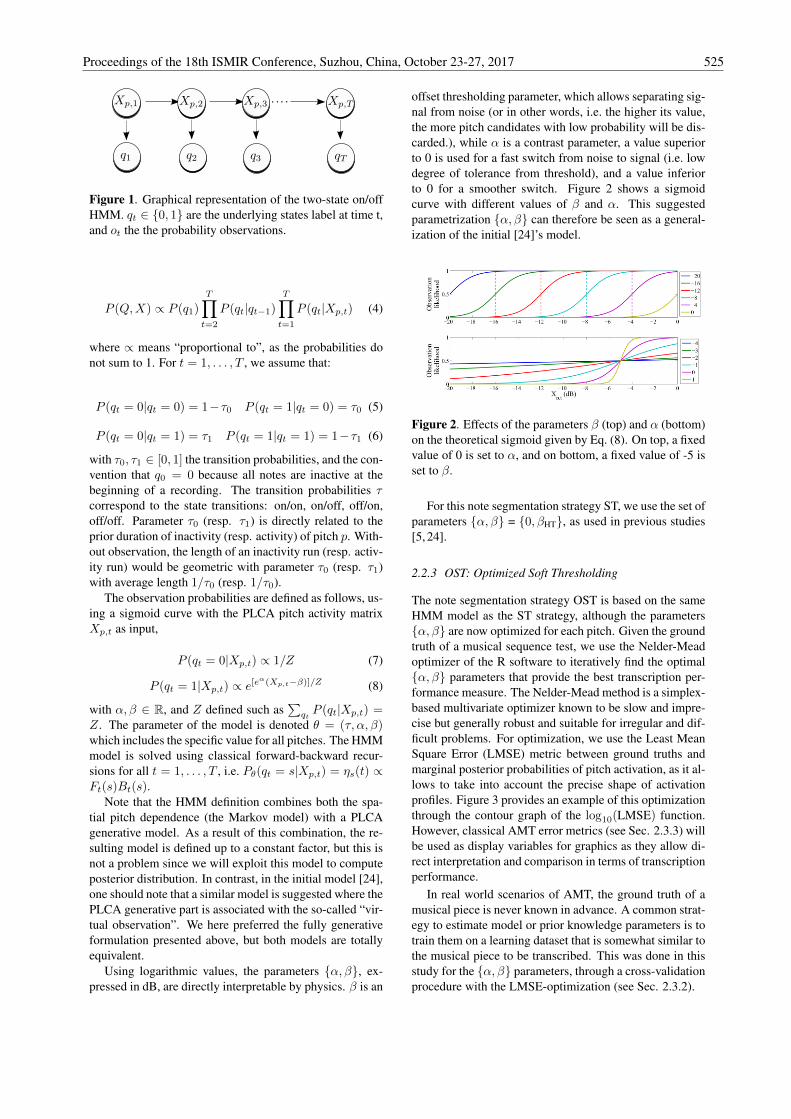
offset thresholding parameter, which allows separating sig-nal from noise (or in other words, i.e. the higher its value,the more pitch candidates with low probability will be dis-carded.), while α is a contrast parameter, a value superiorto 0 is used for a fast switch from noise to signal (i.e. lowdegree of tolerance from threshold), and a value inferiorto 0 for a smoother switch. Figure 2 shows a sigmoidcurve with different values of β and α. This suggestedparametrization {α, β} can therefore be seen as a general-ization of the initial [24]’s model.
Figure 2. Effects of the parameters β (top) and α (bottom)on the theoretical sigmoid given by Eq. (8). On top, a fixedvalue of 0 is set to α, and on bottom, a fixed value of -5 isset to β.
For this note segmentation strategy ST, we use the set ofparameters {α, β} = {0, βHT}, as used in previous studies[5, 24].
2.2.3 OST: Optimized Soft Thresholding
The note segmentation strategy OST is based on the sameHMM model as the ST strategy, although the parameters{α, β} are now optimized for each pitch. Given the groundtruth of a musical sequence test, we use the Nelder-Meadoptimizer of the R software to iteratively find the optimal{α, β} parameters that provide the best transcription per-formance measure. The Nelder-Mead method is a simplex-based multivariate optimizer known to be slow and impre-cise but generally robust and suitable for irregular and dif-ficult problems. For optimization, we use the Least MeanSquare Error (LMSE) metric between ground truths andmarginal posterior probabilities of pitch activation, as it al-lows to take into account the precise shape of activationprofiles. Figure 3 provides an example of this optimizationthrough the contour graph of the log10(LMSE) function.However, classical AMT error metrics (see Sec. 2.3.3) willbe used as display variables for graphics as they allow di-rect interpretation and comparison in terms of transcriptionperformance.
In real world scenarios of AMT, the ground truth of amusical piece is never known in advance. A common strat-egy to estimate model or prior knowledge parameters is totrain them on a learning dataset that is somewhat similar tothe musical piece to be transcribed. This was done in thisstudy for the {α, β} parameters, through a cross-validationprocedure with the LMSE-optimization (see Sec. 2.3.2).
Proceedings of the 18th ISMIR Conference, Suzhou, China, October 23-27, 2017 525
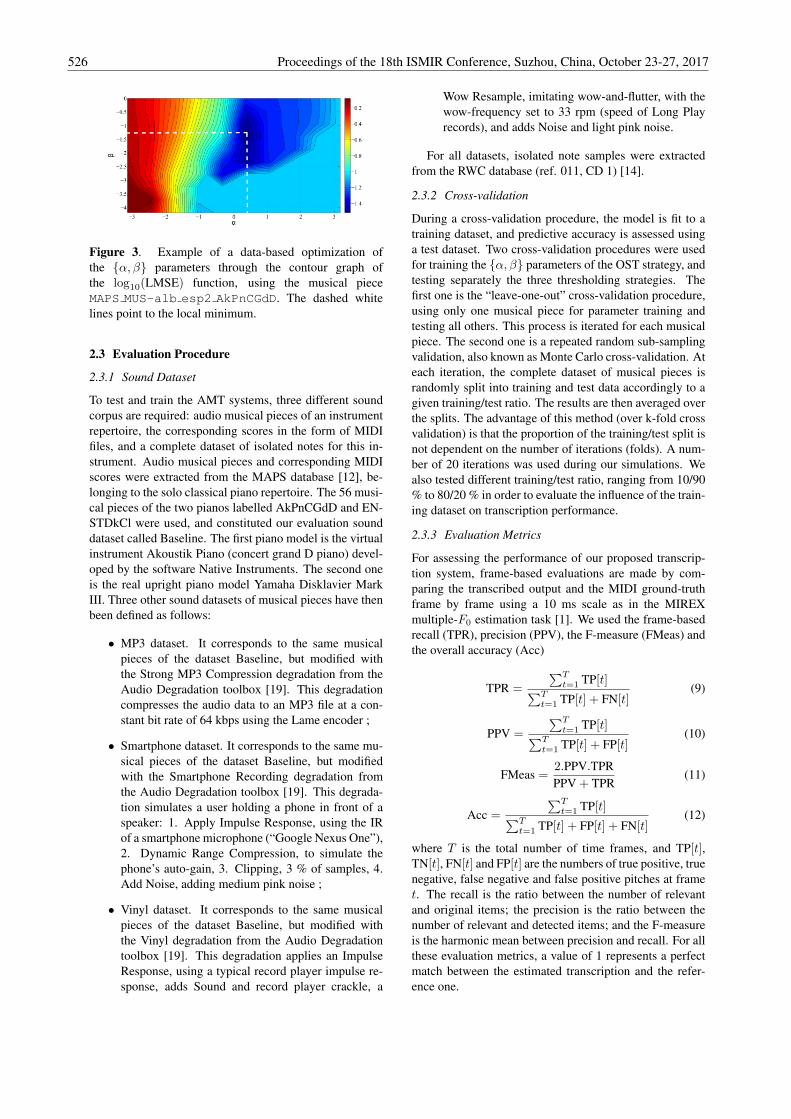
Figure 3. Example of a data-based optimization ofthe {α, β} parameters through the contour graph ofthe log10(LMSE) function, using the musical pieceMAPS MUS-alb esp2 AkPnCGdD. The dashed whitelines point to the local minimum.
2.3 Evaluation Procedure
2.3.1 Sound Dataset
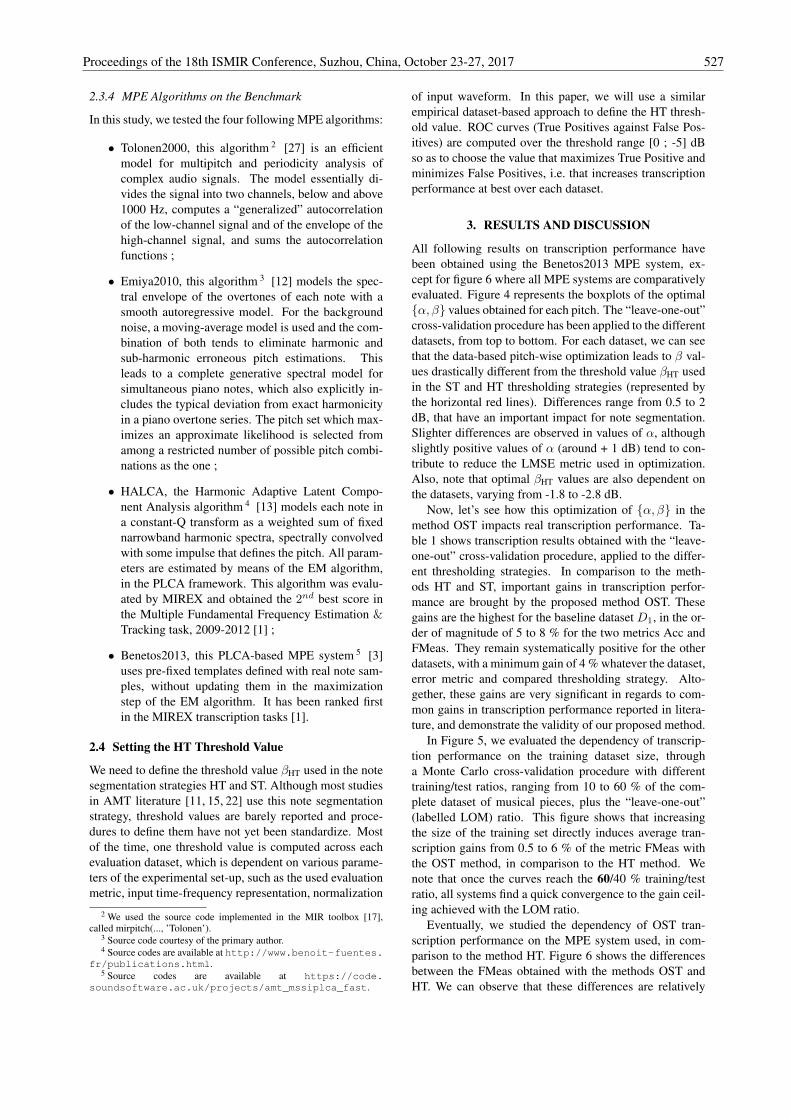
To test and train the AMT systems, three different soundcorpus are required: audio musical pieces of an instrumentrepertoire, the corresponding scores in the form of MIDIfiles, and a complete dataset of isolated notes for this in-strument. Audio musical pieces and corresponding MIDIscores were extracted from the MAPS database [12], be-longing to the solo classical piano repertoire. The 56 musi-cal pieces of the two pianos labelled AkPnCGdD and EN-STDkCl were used, and constituted our evaluation sounddataset called Baseline. The first piano model is the virtualinstrument Akoustik Piano (concert grand D piano) devel-oped by the software Native Instruments. The second oneis the real upright piano model Yamaha Disklavier MarkIII. Three other sound datasets of musical pieces have thenbeen defined as follows:
• MP3 dataset. It corresponds to the same musicalpieces of the dataset Baseline, but modified withthe Strong MP3 Compression degradation from theAudio Degradation toolbox [19]. This degradationcompresses the audio data to an MP3 file at a con-stant bit rate of 64 kbps using the Lame encoder ;
• Smartphone dataset. It corresponds to the same mu-sical pieces of the dataset Baseline, but modifiedwith the Smartphone Recording degradation fromthe Audio Degradation toolbox [19]. This degrada-tion simulates a user holding a phone in front of aspeaker: 1. Apply Impulse Response, using the IRof a smartphone microphone (“Google Nexus One”),2. Dynamic Range Compression, to simulate thephone’s auto-gain, 3. Clipping, 3 % of samples, 4.Add Noise, adding medium pink noise ;
• Vinyl dataset. It corresponds to the same musicalpieces of the dataset Baseline, but modified withthe Vinyl degradation from the Audio Degradationtoolbox [19]. This degradation applies an ImpulseResponse, using a typical record player impulse re-sponse, adds Sound and record player crackle, a
Wow Resample, imitating wow-and-flutter, with thewow-frequency set to 33 rpm (speed of Long Playrecords), and adds Noise and light pink noise.
For all datasets, isolated note samples were extractedfrom the RWC database (ref. 011, CD 1) [14].
2.3.2 Cross-validation
During a cross-validation procedure, the model is fit to atraining dataset, and predictive accuracy is assessed usinga test dataset. Two cross-validation procedures were usedfor training the {α, β} parameters of the OST strategy, andtesting separately the three thresholding strategies. Thefirst one is the “leave-one-out” cross-validation procedure,using only one musical piece for parameter training andtesting all others. This process is iterated for each musicalpiece. The second one is a repeated random sub-samplingvalidation, also known as Monte Carlo cross-validation. Ateach iteration, the complete dataset of musical pieces israndomly split into training and test data accordingly to agiven training/test ratio. The results are then averaged overthe splits. The advantage of this method (over k-fold crossvalidation) is that the proportion of the training/test split isnot dependent on the number of iterations (folds). A num-ber of 20 iterations was used during our simulations. Wealso tested different training/test ratio, ranging from 10/90% to 80/20 % in order to evaluate the influence of the train-ing dataset on transcription performance.
2.3.3 Evaluation Metrics
For assessing the performance of our proposed transcrip-tion system, frame-based evaluations are made by com-paring the transcribed output and the MIDI ground-truthframe by frame using a 10 ms scale as in the MIREXmultiple-F0 estimation task [1]. We used the frame-basedrecall (TPR), precision (PPV), the F-measure (FMeas) andthe overall accuracy (Acc)
TPR =
∑Tt=1 TP[t]∑T
t=1 TP[t] + FN[t](9)
PPV =
∑Tt=1 TP[t]∑T
t=1 TP[t] + FP[t](10)
FMeas =2.PPV.TPRPPV + TPR
(11)
Acc =
∑Tt=1 TP[t]∑T
t=1 TP[t] + FP[t] + FN[t](12)
where T is the total number of time frames, and TP[t],TN[t], FN[t] and FP[t] are the numbers of true positive, truenegative, false negative and false positive pitches at framet. The recall is the ratio between the number of relevantand original items; the precision is the ratio between thenumber of relevant and detected items; and the F-measureis the harmonic mean between precision and recall. For allthese evaluation metrics, a value of 1 represents a perfectmatch between the estimated transcription and the refer-ence one.
526 Proceedings of the 18th ISMIR Conference, Suzhou, China, October 23-27, 2017
2.3.4 MPE Algorithms on the Benchmark
In this study, we tested the four following MPE algorithms:
• Tolonen2000, this algorithm 2 [27] is an efficientmodel for multipitch and periodicity analysis ofcomplex audio signals. The model essentially di-vides the signal into two channels, below and above1000 Hz, computes a “generalized” autocorrelationof the low-channel signal and of the envelope of thehigh-channel signal, and sums the autocorrelationfunctions ;
• Emiya2010, this algorithm 3 [12] models the spec-tral envelope of the overtones of each note with asmooth autoregressive model. For the backgroundnoise, a moving-average model is used and the com-bination of both tends to eliminate harmonic andsub-harmonic erroneous pitch estimations. Thisleads to a complete generative spectral model forsimultaneous piano notes, which also explicitly in-cludes the typical deviation from exact harmonicityin a piano overtone series. The pitch set which max-imizes an approximate likelihood is selected fromamong a restricted number of possible pitch combi-nations as the one ;
• HALCA, the Harmonic Adaptive Latent Compo-nent Analysis algorithm 4 [13] models each note ina constant-Q transform as a weighted sum of fixednarrowband harmonic spectra, spectrally convolvedwith some impulse that defines the pitch. All param-eters are estimated by means of the EM algorithm,in the PLCA framework. This algorithm was evalu-ated by MIREX and obtained the 2nd best score inthe Multiple Fundamental Frequency Estimation &Tracking task, 2009-2012 [1] ;
• Benetos2013, this PLCA-based MPE system 5 [3]uses pre-fixed templates defined with real note sam-ples, without updating them in the maximizationstep of the EM algorithm. It has been ranked firstin the MIREX transcription tasks [1].
2.4 Setting the HT Threshold Value
We need to define the threshold value βHT used in the notesegmentation strategies HT and ST. Although most studiesin AMT literature [11, 15, 22] use this note segmentationstrategy, threshold values are barely reported and proce-dures to define them have not yet been standardize. Mostof the time, one threshold value is computed across eachevaluation dataset, which is dependent on various parame-ters of the experimental set-up, such as the used evaluationmetric, input time-frequency representation, normalization
2 We used the source code implemented in the MIR toolbox [17],called mirpitch(..., ’Tolonen’).
3 Source code courtesy of the primary author.4 Source codes are available at http://www.benoit-fuentes.
fr/publications.html.5 Source codes are available at https://code.
soundsoftware.ac.uk/projects/amt_mssiplca_fast.
of input waveform. In this paper, we will use a similarempirical dataset-based approach to define the HT thresh-old value. ROC curves (True Positives against False Pos-itives) are computed over the threshold range [0 ; -5] dBso as to choose the value that maximizes True Positive andminimizes False Positives, i.e. that increases transcriptionperformance at best over each dataset.
3. RESULTS AND DISCUSSION
All following results on transcription performance havebeen obtained using the Benetos2013 MPE system, ex-cept for figure 6 where all MPE systems are comparativelyevaluated. Figure 4 represents the boxplots of the optimal{α, β} values obtained for each pitch. The “leave-one-out”cross-validation procedure has been applied to the differentdatasets, from top to bottom. For each dataset, we can seethat the data-based pitch-wise optimization leads to β val-ues drastically different from the threshold value βHT usedin the ST and HT thresholding strategies (represented bythe horizontal red lines). Differences range from 0.5 to 2dB, that have an important impact for note segmentation.Slighter differences are observed in values of α, althoughslightly positive values of α (around + 1 dB) tend to con-tribute to reduce the LMSE metric used in optimization.Also, note that optimal βHT values are also dependent onthe datasets, varying from -1.8 to -2.8 dB.
Now, let’s see how this optimization of {α, β} in themethod OST impacts real transcription performance. Ta-ble 1 shows transcription results obtained with the “leave-one-out” cross-validation procedure, applied to the differ-ent thresholding strategies. In comparison to the meth-ods HT and ST, important gains in transcription perfor-mance are brought by the proposed method OST. Thesegains are the highest for the baseline dataset D1, in the or-der of magnitude of 5 to 8 % for the two metrics Acc andFMeas. They remain systematically positive for the otherdatasets, with a minimum gain of 4 % whatever the dataset,error metric and compared thresholding strategy. Alto-gether, these gains are very significant in regards to com-mon gains in transcription performance reported in litera-ture, and demonstrate the validity of our proposed method.
In Figure 5, we evaluated the dependency of transcrip-tion performance on the training dataset size, througha Monte Carlo cross-validation procedure with differenttraining/test ratios, ranging from 10 to 60 % of the com-plete dataset of musical pieces, plus the “leave-one-out”(labelled LOM) ratio. This figure shows that increasingthe size of the training set directly induces average tran-scription gains from 0.5 to 6 % of the metric FMeas withthe OST method, in comparison to the HT method. Wenote that once the curves reach the 60/40 % training/testratio, all systems find a quick convergence to the gain ceil-ing achieved with the LOM ratio.
Eventually, we studied the dependency of OST tran-scription performance on the MPE system used, in com-parison to the method HT. Figure 6 shows the differencesbetween the FMeas obtained with the methods OST andHT. We can observe that these differences are relatively
Proceedings of the 18th ISMIR Conference, Suzhou, China, October 23-27, 2017 527

Figure 4. Boxplots of the optimal {α, β} values obtainedfor each pitch, and for each evaluation dataset. The hor-izontal red lines in each boxplot represents the parametervalues used in the ST and HT thresholding strategies.
Figure 5. Difference between the F-measures obtainedwith the OST and HT note segmentation methods, using20 iterations of the repeated random sub-sampling valida-tion method with training/test ratio ranging from 10/90 %to 60/40 %, plus the “leave-one-out” (labelled LOM) ratio.
DatasetsNote segmentation
strategiesAcc (%) Fmeas (%)
BaselineHT 54.9 53.3ST 57.6 55.3
OST 62.3 59.2
MP3HT 51.9 52.6ST 52.2 50.1
OST 55.6 56.7
SmartphoneHT 52.2 51.9ST 53.1 51.3
OST 58.4 56.5
VinylHT 50.8 48.8ST 51.1 49.2
OST 57.8 54.1
Table 1. Averages of error metrics FMeas and Acc ob-tained with the different thresholding strategies, i.e. ST,OST and HT, using a leave-one-out cross-validation pro-cedure.
small, i.e. inferior to 2 %. This demonstrates that the pro-posed OST method improves transcription performance ina rather universal way, as independent from the character-istics of activation matrices as long as MPE system spe-cific training datasets are used. Only MPE system Tolo-nen2000 shows higher transcription gains (especially forthe datasets D3 and D4) brought by the OST method asthis system outputs the worst activation matrices.
Figure 6. Difference between the F-measures obtainedwith the OST and HT note segmentation methods, usingdifferent MPE systems.
4. CONCLUSION
In this study, an original method for the task of note seg-mentation was presented. This task is a crucial process-ing step in most systems of automatic music transcription.The presented method is based on a two-state pitch-wiseHidden Markov Model method, augmented with two sig-moid parameters on contrast and slope smoothing that aretrained with a learning dataset. This rather simple methodhas brought significant results in transcription performanceon piano music datasets with different characteristics. Itcan also be used as a universal post-processing block afterany pitch-wise activation matrix, showing great promisefor future use, although it remains to be tested on differentinstrument repertoires.
528 Proceedings of the 18th ISMIR Conference, Suzhou, China, October 23-27, 2017
5. REFERENCES
[1] MIREX (2007). Music information retrieval evalua-tion exchange (mirex). 2011. available at http://music-ir.org/mirexwiki/ (date last viewed January 9, 2015).
[2] V. Arora and L. Behera. Instrument identification us-ing PLCA over stretched manifolds. In Communica-tions (NCC), 2014 Twentieth National Conference on,pages 1–5, Feb 2014.
[3] E. Benetos, S. Cherla, and T. Weyde. An efficient shift-invariant model for polyphonic music transcription. In6th Int. Workshop on Machine Learning and Music,Prague, Czech Republic, 2013.
[4] E. Benetos and S. Dixon. A shift-invariant latent vari-able model for automatic music transcription. Com-puter Music Journal, 36:81–84, 2012.
[5] E. Benetos and S. Dixon. Multiple-instrument poly-phonic music transcription using a temporally con-strained shift-invariant model. J. Acoust. Soc. Am.,133:1727–1741, 2013.
[6] E. Benetos and T. Weyde. An efficient temporally-constrained probabilistic model for multiple-instrument music transcription. In 16th InternationalSociety for Music Information Retrieval Conference,Malaga , Spain, pages 355–360, 2015.
[7] D. Cazau, O. Adam, J. T. Laitman, and J. S. Reiden-berg. Understanding the intentional acoustic behaviorof humpback whales: a production-based approach. J.Acoust. Soc. Am., 134:2268–2273, 2013.
[8] T. Cheng, S. Dixon, and M. Mauch. Improving pianonote tracking by HMM smoothing. In 23th EUSIPCOconference, pages 2054–2058, 2015.
[9] O. Cornelis, M. Lesaffre, D. Moelants, and M. Le-man. Access to ethnic music: Advances and perspec-tives in content-based music information retrieval. Sig-nal Proc., 90:1008–1031, 2010.
[10] A. P. Dempster, N. M. Laird, and D. B. Rubin. Maxi-mum likelihood from incomplete data via the em algo-rithm. Journal of the Royal Statistical Society, SeriesB, 39:1–38, 1977.
[11] A. Dessein, A. Cont, and G. Lemaitre. Real-timepolyphonic music transcription with nonnegative ma-trix factorization and beta-divergence. In 11th Interna-tional Society for Music Information Retrieval Confer-ence, Utretcht, Netherlands, pages 489–494, 2010.
[12] V. Emiya, R. Badeau, and G. Richard. Multipitch es-timation of piano sounds using a new probabilisticspectral smoothness principle. IEEE Trans. on Audio,Speech, Lang. Proc., 18:1643–1654, 2010.
[13] B. Fuentes, R. Badeau, and G. Richard. Harmonicadaptive latent component analysis of audio and ap-plication to music transcription. IEEE Trans. on AudioSpeech Lang. Processing, 21:1854–1866, 2013.
[14] M. Goto, H. Hashiguchi, T. Nishimura, and R. Oka.Rwc music database: Popular, classical, and jazz musicdatabases. In 3rd International Conference on MusicInformation Retrieval, Baltimore,MD., pages 287–288,2003.
[15] G. Grindlay and D. P. W. Ellis. Transcribingmulti-instrument polyphonic music with hierarchicaleigeninstruments. IEEE J. Sel. Topics Signal Proc.,5:1159–1169, 2011.
[16] A. Klapuri. Automatic music transcription as we knowit today. J. of New Music Research, 33:269–282, 2004.
[17] O. Lartillot and P. Toiviainen. A matlab toolbox formusical feature extraction from audio. In Proc. of the10th Int. Conference on Digital Audio Effects (DAFx-07), Bordeaux, France, September 10-15, 2007, 2007.
[18] T. Lidy, C. N. Silla, O. Cornelis, F. Gouyon, A. Rauber,C. A. A. Kaestner, and A. L. Koerich. On the suitabilityof state-of-the-art music information retrieval methodsfor analyzing, categorizing and accessing non-westernand ethnic music collections. Signal Proc., 90:1032–1048, 2010.
[19] M. Mauch and S. Ewert. The Audio Degradation tool-box and its application to robustness evaluation. In 14thInternational Society for Music Information RetrievalConference, Curitiba, PR, Brazil, pages 83–88, 2013.
[20] D. Moelants, O. Cornelis, M. Leman, J. Gansemans,R. T. Caluwe, G. D. Tre, T. Matthe, and A. Hallez. Theproblems and opportunities of content-based analysisand description of ethnic music. International J. of In-tangible Heritage, 2:59–67, 2007.
[21] J. A. Moorer. On the transcription of musical sound bycomputer. Computer Music Journal, 1:32–38, 1977.
[22] G. J. Mysore and P. Smaragdis. Relative pitch esti-mation of multiple instruments. In International Con-ference on Acoustical Speech and Signal Processing,Taipei, Taiwan, pages 313–316, 2009.
[23] M. Nakano, J. Le Roux, H. Kameoka, O. Kitano,N. Ono, and S. Sagayama. Nonnegative matrix factor-ization with markov-chained bases for modeling time-varying patterns in music spectrograms. In LVA/ICA2010, LNCS 6365, V. Vigneron et al. (Eds.), pages 149–156, 2010.
[24] G. Poliner and D. Ellis. A discriminative model forpolyphonic piano transcription. J. on Advances in Sig-nal Proc., 8:1–9, 2007.
[25] J. Six and O. Cornelis. Computer-assisted transcriptionof ethnic music. In 3th International Workshop on FolkMusic Analysis, Amsterdam, Netherlands, pages 71–72, 2013.
Proceedings of the 18th ISMIR Conference, Suzhou, China, October 23-27, 2017 529

[26] P. Smaragdis, B. Raj, and M. Shanshanka. A proba-bilistic latent variable model for acoustic modeling. InNeural Information Proc. Systems Workshop, Whistler,BC, Canada, 2006.
[27] T. Tolonen and M. Karjalainen. A computationally effi-cient multipitch analysis model. IEEE Trans. on speechand audio processing, 8:708–716, 2000.
530 Proceedings of the 18th ISMIR Conference, Suzhou, China, October 23-27, 2017