improving perinatal data— the state perspective isabelle horon, dr.p.h. director, vital statistics...
TRANSCRIPT

Improving Perinatal Data—Improving Perinatal Data—the State Perspectivethe State Perspective
Isabelle Horon, Dr.P.H.Isabelle Horon, Dr.P.H.Director, Vital Statistics AdministrationDirector, Vital Statistics Administration
Maryland Department of Health and Mental HygieneMaryland Department of Health and Mental HygieneMarch 2, 2005March 2, 2005

© 2001 By Default!
A Free sample background from www.pptbackgrounds.fsnet.co.uk
Slide 2
Vital StatisticsVital Statistics
What are they?What are they?
What’s right?What’s right?
What’s wrong?What’s wrong?
What can we do?What can we do?

© 2001 By Default!
A Free sample background from www.pptbackgrounds.fsnet.co.uk
Slide 3
Representing states on behalf of NAPHSISRepresenting states on behalf of NAPHSIS
– National Association for Public Health Statistics and National Association for Public Health Statistics and Information SystemsInformation Systems
– Association of state vital records and public health Association of state vital records and public health statistics offices representing 50 states, 5 U.S. territories, statistics offices representing 50 states, 5 U.S. territories, NYC and D.C.NYC and D.C.
– Mission: To provide national leadership to improve public Mission: To provide national leadership to improve public health information through strengthening and integrating health information through strengthening and integrating vital records, health statistics and other health vital records, health statistics and other health information.information.

Vital statisticsVital statistics
Data relating to births, deaths, Data relating to births, deaths, marriages and divorcesmarriages and divorces
Three systemsThree systems
– Civil registration systemCivil registration system
– Records management systemRecords management system
– Public health data systemPublic health data system

How are vital statistics collected?How are vital statistics collected?
State functionState function
Recording of vital events is the responsibility of Recording of vital events is the responsibility of the jurisdiction in which the event occursthe jurisdiction in which the event occurs – 50 states50 states– 5 U.S. territories5 U.S. territories– NYCNYC– DCDC
Contracts to provide data to federal Contracts to provide data to federal agenciesagencies
NCHSNCHS
SSASSA
CPSCCPSC
NIOSHNIOSH

What’s right with vital What’s right with vital statistics?statistics?
Critical source of public health dataCritical source of public health data
(Just about) complete reporting(Just about) complete reporting
(Mostly) consistent data among jurisdictions(Mostly) consistent data among jurisdictions

© 2001 By Default!
A Free sample background from www.pptbackgrounds.fsnet.co.uk
Slide 8
What’s wrong?What’s wrong?
Data qualityData quality
No standard national data setNo standard national data set
UnderutilizedUnderutilized
Antiquated data systemsAntiquated data systems
What’s wrong?What’s wrong?
Data qualityData quality
– Timeliness, completeness, accuracyTimeliness, completeness, accuracy
– Poor reporting of certain eventsPoor reporting of certain events

Percentage of Birth Certificates Filed Within 72 Hours of Birth, Maryland,
Selected Months, 1997-1998.
Decem
ber 1
997
June
199
8
July
1998
Augus
t 199
8
Octobe
r 199
8
Novem
ber 1
998
Month and year
0
20
40
60
80
100
Per
cent
© 2001 By Default!
A Free sample background from www.pptbackgrounds.fsnet.co.uk
Slide 11
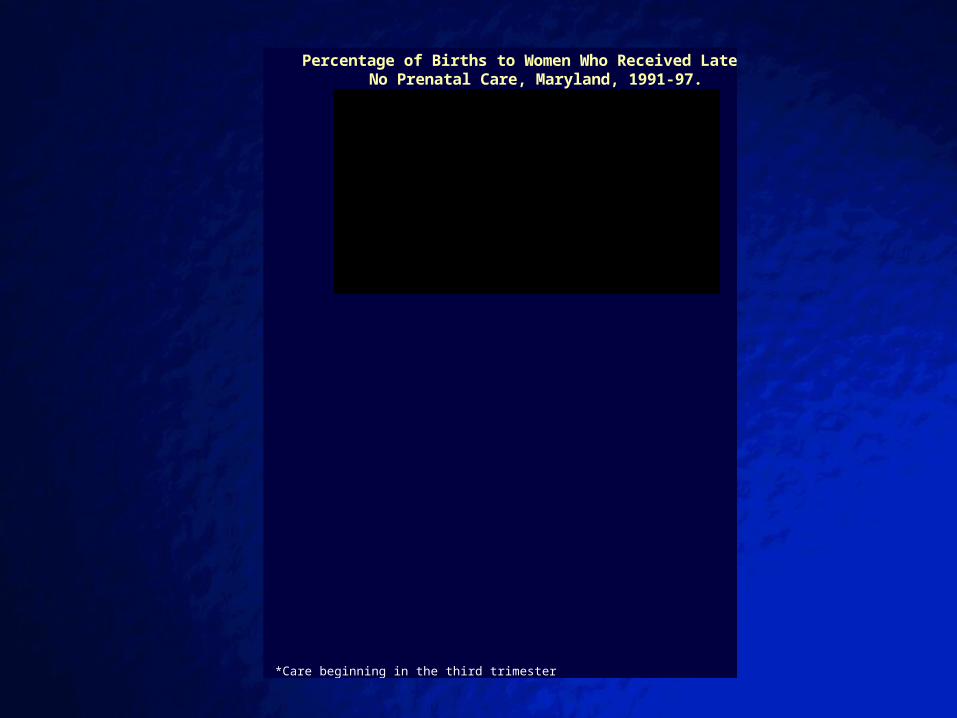
Percentage of Births to Women Who Received Late* or No Prenatal Care, Maryland, 1991-97.
*Care beginning in the third trimester
3.5 3.43.6
3.4
3
2.6 2.6
1991 1992 1993 1994 1995 1996 1997
Year
0
1
2
3
4
Per
cent
Percentage of Birth Certificates With Incomplete Prenatal Care Information, Maryland, 1991-97.
11.2
9.4
7
5.4
7.9
10.911.5
1991 1992 1993 1994 1995 1996 1997
Year
0
2
4
6
8
10
12
14
Per
cent

Percentage of Birth Certificates Missing Information on the Month Prenatal Care Began
December 1997 Births11.5
0000.10.20.20.20.40.50.80.91.21.51.71.82.22.52.63.344.64.64.74.74.84.9
7.68
9.810.510.611.912.5
30.435.2
73.489.7
All Maryland hospitals
Hospital 52Hospital 67Hospital 71Hospital 76Hospital 50Hospital 56Hospital 61Hospital 64Hospital 38Hospital 66Hospital 40Hospital 58Hospital 43Hospital 79Hospital 86Hospital 44Hospital 68Hospital 78Hospital 59Hospital 57Hospital 48Hospital 62Hospital 22Hospital 69Hospital 65Hospital 81Hospital 80Hospital 60Hospital 84Hospital 42Hospital 31Hospital 85Hospital 53Hospital 37Hospital 21Hospital 33Hospital 74
0 20 40 60 80 100
Percent

© 2001 By Default!
A Free sample background from www.pptbackgrounds.fsnet.co.uk
Slide 13Percentage of Births to Women Who Received Late* or
No Prenatal Care, Maryland, 1997-2003.
*Care beginning in the third trimester
2.62.9
3.1 3.1
3.7 3.63.8
1997 1998 1999 2000 2001 2002 2003
Year
0
1
2
3
4
5
Per
cent
Percentage of Birth Certificates With Incomplete Prenatal Care Information, Maryland, 1997-2003.
11.5
4.83.9
2.7 2.41.9
1.3
1997 1998 1999 2000 2001 2002 2003
Year
0
2
4
6
8
10
12
14
Per
cent

© 2001 By Default!
A Free sample background from www.pptbackgrounds.fsnet.co.uk
Slide 14
Efforts to improve perinatal data in Efforts to improve perinatal data in MarylandMaryland
Monthly report cardsMonthly report cards
Medical record auditsMedical record audits
Fetal/infant death field staffFetal/infant death field staff
© 2001 By Default!
A Free sample background from www.pptbackgrounds.fsnet.co.uk
Slide 15
What’s wrong?What’s wrong?
Data qualityData quality
– Timeliness, completeness, accuracyTimeliness, completeness, accuracy
– Poor reporting of certain eventsPoor reporting of certain events• Fetal deathsFetal deaths• Early infant deathsEarly infant deaths

Poor fetal mortality dataPoor fetal mortality data
Poorly collected and reported in many jurisdictionsPoorly collected and reported in many jurisdictions
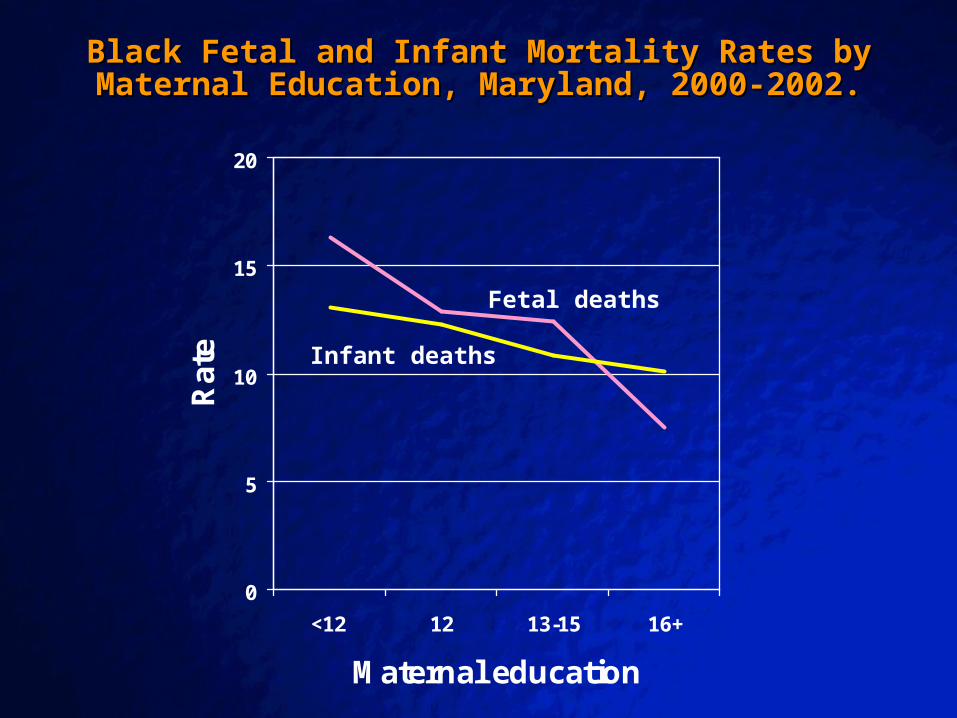
Improved Maryland data showed:Improved Maryland data showed:
– More fetal deaths than infant deathsMore fetal deaths than infant deaths– Misclassification of fetal/early infant deathsMisclassification of fetal/early infant deaths– Trends differ for fetal and infant deathsTrends differ for fetal and infant deaths

© 2001 By Default!
A Free sample background from www.pptbackgrounds.fsnet.co.uk
Slide 17
Black Fetal and Infant Mortality Rates by Maternal Age, Black Fetal and Infant Mortality Rates by Maternal Age, Maryland, 2000-2002.Maryland, 2000-2002.
0
5
10
15
20
25
30
<18 18-19 20-24 25-29 30-34 35-39 40-44
Maternal age
Rat
e
Fetal deaths
Infant deaths
© 2001 By Default!
A Free sample background from www.pptbackgrounds.fsnet.co.uk
Slide 18
Black Fetal and Infant Mortality Rates by Maternal Black Fetal and Infant Mortality Rates by Maternal Education, Maryland, 2000-2002.Education, Maryland, 2000-2002.
0
5
10
15
20
<12 12 13-15 16+
Maternal education
Rat
e
Fetal deaths
Infant deaths
© 2001 By Default!
A Free sample background from www.pptbackgrounds.fsnet.co.uk
Slide 19
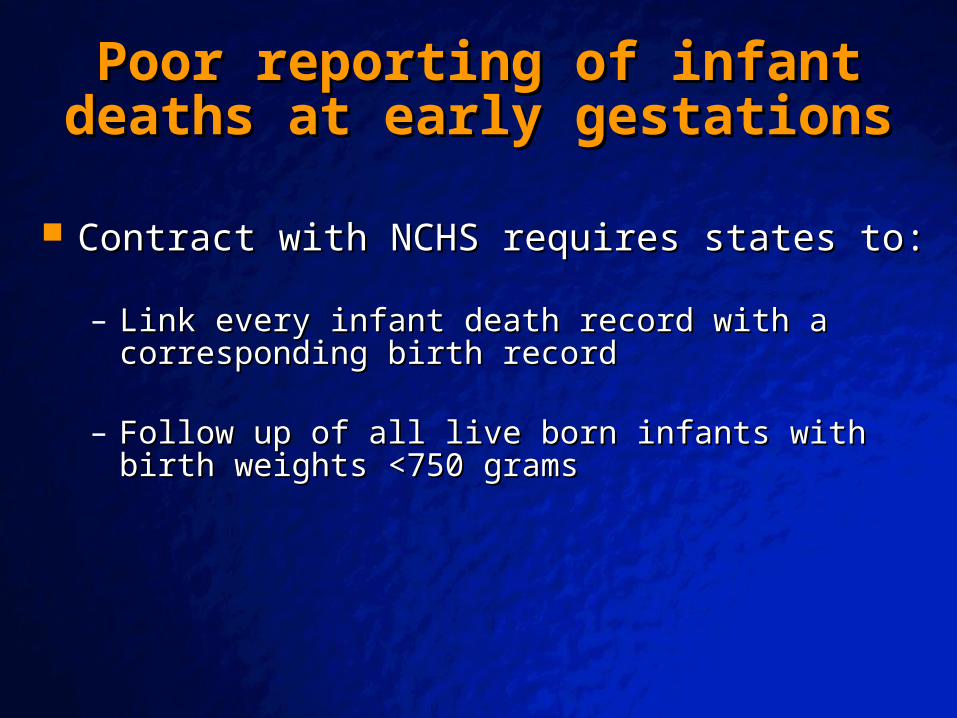
Poor reporting of infant deaths at Poor reporting of infant deaths at early gestationsearly gestations
Contract with NCHS requires states to:Contract with NCHS requires states to:
– Link every infant death record with a corresponding birth Link every infant death record with a corresponding birth recordrecord
– Follow up of all live born infants with birth weights <750 Follow up of all live born infants with birth weights <750 gramsgrams
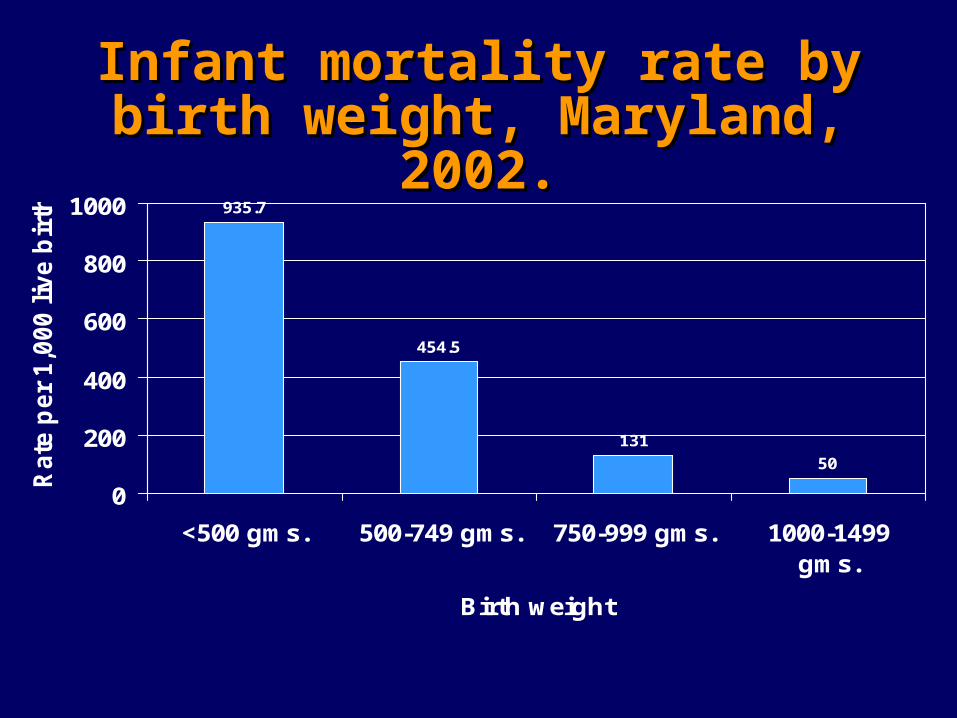
Infant mortality rate by birth Infant mortality rate by birth weight, Maryland, 2002.weight, Maryland, 2002.
935.7
454.5
131
50
0
200
400
600
800
1000
<500 gms. 500-749 gms. 750-999 gms. 1000-1499gms.
Birth weight
Rate
per
1,0
00 l
ive b
irth
s

Infant mortality rate by birth weight Infant mortality rate by birth weight and place of deliveryand place of delivery
935.7
454.5
131
50
352.9
235.3
51.317.5
0
200
400
600
800
1000
<500 gms. 500-749 gms. 750-999 gms. 1000-1499gms.
Rate
per
1,0
00 l
ive b
irth
s
Maryland Neighboring jurisdiction

© 2001 By Default!
A Free sample background from www.pptbackgrounds.fsnet.co.uk
Slide 22
What’s wrong?What’s wrong?
Data qualityData quality
– Timeliness, completeness, accuracyTimeliness, completeness, accuracy– Poor reporting of certain eventsPoor reporting of certain events
No standard national data setNo standard national data set

© 2001 By Default!
A Free sample background from www.pptbackgrounds.fsnet.co.uk
Slide 23
Revised U.S. StandardRevised U.S. StandardBirth CertificateBirth Certificate
New itemsNew items Modified itemsModified itemsFertility therapyFertility therapyWIC during pregnancyWIC during pregnancyInfections during pregnancyInfections during pregnancyMaternal morbidityMaternal morbidityBreast feedingBreast feedingSource of payment for the Source of payment for the deliverydelivery
Race and education of Race and education of parentsparentsCigarette smoking Cigarette smoking Prenatal carePrenatal careMethod of deliveryMethod of deliveryCongenital anomaliesCongenital anomalies
© 2001 By Default!
A Free sample background from www.pptbackgrounds.fsnet.co.uk
Slide 24
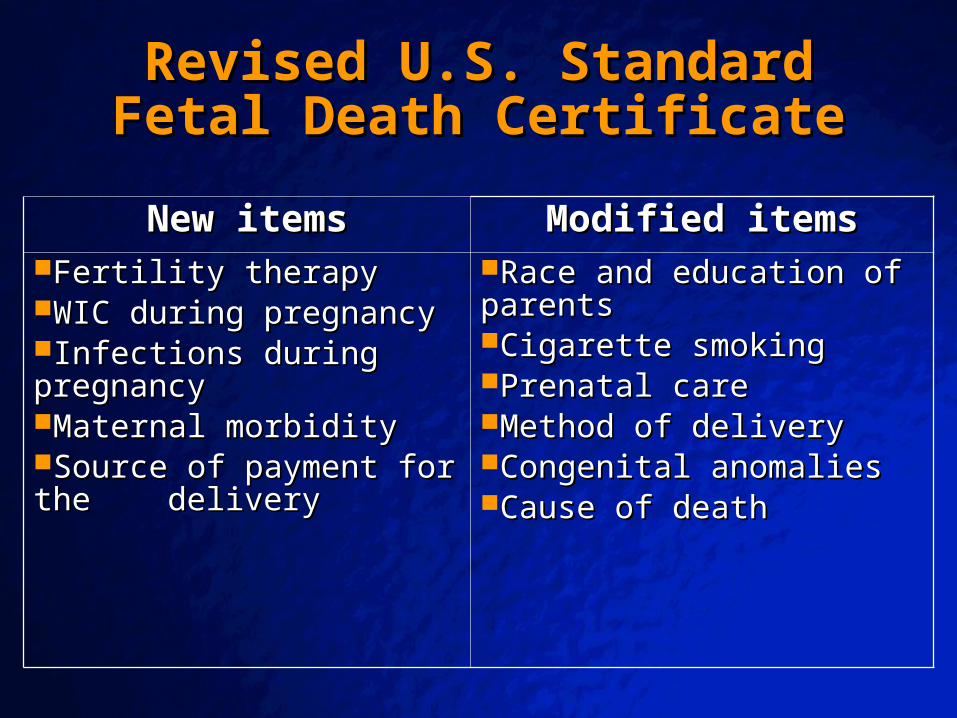
Revised U.S. StandardRevised U.S. StandardFetal Death CertificateFetal Death Certificate
New itemsNew items Modified itemsModified itemsFertility therapyFertility therapyWIC during pregnancyWIC during pregnancyInfections during pregnancyInfections during pregnancyMaternal morbidityMaternal morbiditySource of payment for the Source of payment for the deliverydelivery
Race and education of Race and education of parentsparentsCigarette smoking Cigarette smoking Prenatal carePrenatal careMethod of deliveryMethod of deliveryCongenital anomaliesCongenital anomaliesCause of deathCause of death

© 2001 By Default!
A Free sample background from www.pptbackgrounds.fsnet.co.uk
Slide 25
What’s wrong?What’s wrong?
Data qualityData quality– Timeliness, completeness, accuracyTimeliness, completeness, accuracy– Poor reporting of certain eventsPoor reporting of certain events
No standard national data setNo standard national data set
Data are underutilizedData are underutilized– Traditional role was to collect data for statistical reports Traditional role was to collect data for statistical reports
for state and federal agenciesfor state and federal agencies
– Need to expand functionsNeed to expand functions
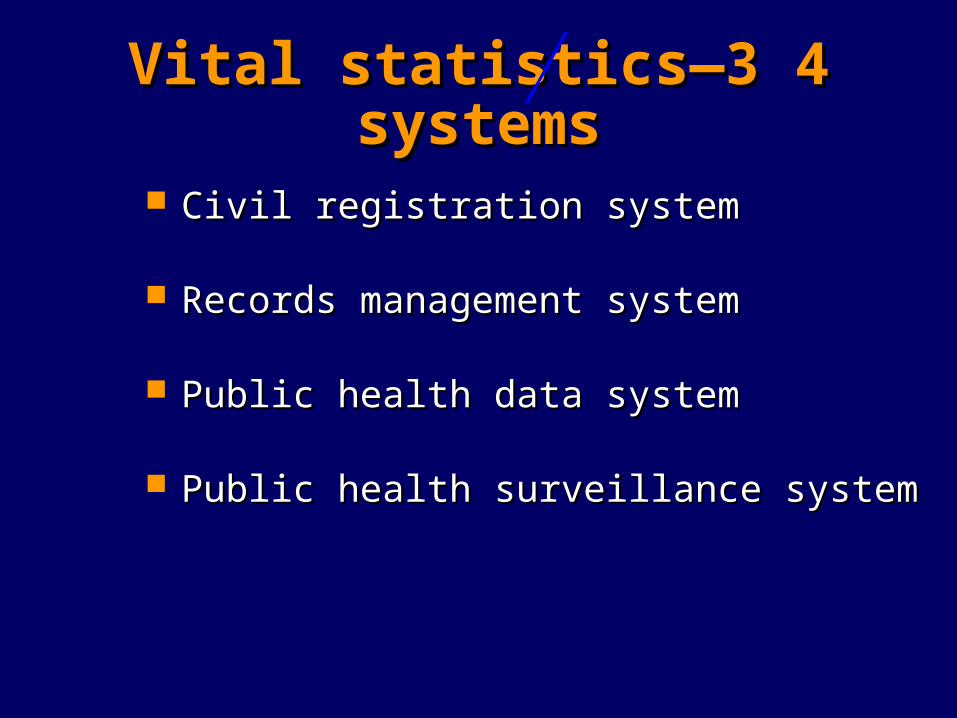
Vital statistics—3 4 systemsVital statistics—3 4 systems
Civil registration systemCivil registration system
Records management systemRecords management system
Public health data systemPublic health data system
Public health surveillance systemPublic health surveillance system

Data surveillance systemData surveillance system
Vital records systems should evolve into perinatal Vital records systems should evolve into perinatal data surveillance systemsdata surveillance systems
– Should allow states to monitor trends as data are Should allow states to monitor trends as data are collectedcollected
– Should allow states to identify problems in real timeShould allow states to identify problems in real time• Immediate identification of areas with high rates of anomalies, Immediate identification of areas with high rates of anomalies,
infant deaths, etc.infant deaths, etc.• Tracking of at-risk infantsTracking of at-risk infants
– Should allow for the collection of additional perinatal dataShould allow for the collection of additional perinatal data
– Should allow for routine linkage with other data setsShould allow for routine linkage with other data sets

Expanded use of data needs to Expanded use of data needs to happen at the state levelhappen at the state level
Only states collect data from the sourceOnly states collect data from the source
Only states have identifiersOnly states have identifiers
Only states have access to other data setsOnly states have access to other data sets

© 2001 By Default!
A Free sample background from www.pptbackgrounds.fsnet.co.uk
Slide 29
What’s wrong?What’s wrong?
Data qualityData quality
No standard national data setNo standard national data set
Underutilized at state levelUnderutilized at state level
Antiquated data systemsAntiquated data systems

Consequences of antiquated data Consequences of antiquated data collection systemscollection systems
Limit efforts to improve data qualityLimit efforts to improve data quality
Create difficulties in moving to revised certificatesCreate difficulties in moving to revised certificates
Limit efforts to expand uses of dataLimit efforts to expand uses of data

History of reengineeringHistory of reengineering
States knew they had to update systemsStates knew they had to update systems– Systems were antiquatedSystems were antiquated– Needed to implement revised standard certificatesNeeded to implement revised standard certificates
Early attempts were often unsuccessfulEarly attempts were often unsuccessful

‘‘Every man for himself” approach Every man for himself” approach wasn’t workingwasn’t working
Repetitive costsRepetitive costs– DollarsDollars– Human resourcesHuman resources– TimeTime
Lack of technical resources in statesLack of technical resources in states
High risk borne by each state individuallyHigh risk borne by each state individually
Failed to build on collective expertise of statesFailed to build on collective expertise of states

Reengineering strategyReengineering strategy
Development of a national, model vital statistics Development of a national, model vital statistics systemsystem
– Collaborative effort of NAPHSIS, NCHS, SSACollaborative effort of NAPHSIS, NCHS, SSA
• Project teams produced conceptual framework for building Project teams produced conceptual framework for building modelsmodels
– Goal: the development of state-specific systems that use Goal: the development of state-specific systems that use the same standards to record the same information in the the same standards to record the same information in the same manner by adhering to the same business rulessame manner by adhering to the same business rules
• Standardized system concept that would meet at least 85% of Standardized system concept that would meet at least 85% of the reengineering needs of any jurisdictionthe reengineering needs of any jurisdiction

Benefits of collaborative effort to Benefits of collaborative effort to create a national modelcreate a national model
Greater probability of successGreater probability of success– Shared expertise and best practicesShared expertise and best practices
Faster implementationFaster implementation
Significantly lower costsSignificantly lower costs– Dollars to statesDollars to states– Human resourcesHuman resources

What will reengineered systems What will reengineered systems allow us to do?allow us to do?
Collect better quality dataCollect better quality data– More timelyMore timely– More complete More complete – More accurateMore accurate
Uniformly employ national standardsUniformly employ national standards
Implement revised certificates/data setsImplement revised certificates/data sets
Enhance the role of vital statistics as a Enhance the role of vital statistics as a surveillance systemsurveillance system

© 2001 By Default!
A Free sample background from www.pptbackgrounds.fsnet.co.uk
Slide 36
South Dakota Electronic Vital South Dakota Electronic Vital Records and Screening SystemRecords and Screening System
Web-based system collects:Web-based system collects:– Vital records dataVital records data– Metabolic screening dataMetabolic screening data– Hearing screening dataHearing screening data– Immunization dataImmunization data
ResultsResults– Improved timeliness, completeness and accuracy of vital Improved timeliness, completeness and accuracy of vital
records datarecords data– Automatic linkage of vital record data with metabolic Automatic linkage of vital record data with metabolic
screening, hearing screening and immunization datascreening, hearing screening and immunization data– Immediate identification of unscreened infantsImmediate identification of unscreened infants– Substantial increase in percentage of screened infantsSubstantial increase in percentage of screened infants

Reengineering—where are we?Reengineering—where are we?
Functional requirements for birth and death Functional requirements for birth and death registration have been establishedregistration have been established
Have national model; being implemented in Have national model; being implemented in selected statesselected states
Lack of funding to complete processLack of funding to complete process

What is our vision?What is our vision?
Collection of timely, complete, accurate dataCollection of timely, complete, accurate data
Reengineered, web-based data collection systems that would allow for:Reengineered, web-based data collection systems that would allow for:– Immediate electronic transfer to state vital records officesImmediate electronic transfer to state vital records offices– Immediate transfer to other health dept. programs (immunization registries, hearing Immediate transfer to other health dept. programs (immunization registries, hearing
screening, birth defects)screening, birth defects)– Timely transfer of out of state dataTimely transfer of out of state data– Timely sharing of data with federal partnersTimely sharing of data with federal partners
Immediate linkage of birth and infant death dataImmediate linkage of birth and infant death data
Linkage with other data setsLinkage with other data sets
Continued evolution from ‘vital registration system’ to ‘surveillance Continued evolution from ‘vital registration system’ to ‘surveillance system’system’

Summary—what do we need to be Summary—what do we need to be successful?successful?
$$$ for reengineered systems based on the national model $$$ for reengineered systems based on the national model in all statesin all states
$$$ to implement revised certificates in all states$$$ to implement revised certificates in all states
$$$ to improve data quality$$$ to improve data quality– National training coordinating centerNational training coordinating center– Technical assistance to states to improve collection and analysis of perinatal dataTechnical assistance to states to improve collection and analysis of perinatal data
NAPHSIS wish list:NAPHSIS wish list:– Support to continue reengineering work Support to continue reengineering work – Support to develop a national training coordinating centerSupport to develop a national training coordinating center– Support to provide technical assistance to states to improve data qualitySupport to provide technical assistance to states to improve data quality
For more information about NAPHSIS and/or the reengineering effort, contact:
Jan Markowitz, Ph.D., Acting Director National Association for Public Health Statistics
and Information Systems801 Roeder Road
Suite 650Silver Spring, MD 20910
Telephone: (301) 563-6001Email:[email protected]