improving retention: assessment data and … retention: assessment data and reporting that supports...
TRANSCRIPT

Improving Retention: Assessment Data and Reporting that Supports
Enrollment Management
Amanda Yale, Ed.D., Slippery Rock University
Rebecca Pierce, Ph.D., Ball State University
Darlena Jones, Ph.D., Educational Benchmarking (EBI)
Session Outline
• The presentation will follow this format:
– Part 1: Discuss the role that institutional research can play in retention and how they can support Enrollment Management offices.
– Part 2: Using MAP-Works in our Enrollment Management office to support one-on-one interactions between faculty/staff and the students they serve.
– Part 3: Examples of aggregate data focused on retention issues, report formats, and tips for reporting locations
– Part 4: Open discussion and questions.

Institutional Research and Enrollment Management
Amanda Yale
Primer for Institutional ResearchEdited by William E. Knight
Chapter 5 - Enrollment Management Authors: Richard J. Kroc and Gary Hanson
In their discussion of enrollment management, Rick Kroc and Gary Hanson provide an overview of student recruitment, including the educational pipeline, enrollment projections, and financial aid; student flow, including academic preparation, the curriculum, academic and student support programs, graduation and retention rates, and issues beyond graduation, and support for enrollment management; including organizational structures, necessary IR technical and analytical skills, data sources, and communicating results of enrollment management studies. They conclude with a consideration of the future of enrollment management.

Primer for Institutional ResearchEdited by William E. Knight
Chapter 5 - Enrollment Management Authors: Richard J. Kroc and Gary Hanson
Student Recruitment The Educational Pipeline
Understanding Student Choice Yield Rates
Enrollment Projections Financial Aid
Understanding the Issues and Data Student Flow
Academic Preparation Selecting Students Placing Students
Other Academic Assets The Curriculum Types of Studies Campus Climate
Academic and Student Support Programs Graduation and Retention Rates
Formative or Process Evaluation Summative or Outcome Evaluation
Descriptive Data Multivariate Analyses Qualitative Methods
Peer Data Beyond Graduation
Supporting Enrollment Management Organizing for Enrollment Management
Organizational Structures Technical and Analytic Skills
Factual Knowledge Methodological Skills
Data Sources Peer Data and Performance Indicators
Organizing Data Communicating Results

Institutional Research and Enrollment Management
• An institution’s office of institutional research plays a key role in strategically managing enrollment.
– The more enrollment management professionals know about the characteristics, attitudes, and values of prospective students, the better able they are to design effective recruitment and retention programs.
– Persistence studies conducted by institutional researchers can inform strategies to enhance the success of first-year students.
– Institutional research professionals can examine the impact of various forms of student financial assistance and scholarships on matriculation decisions and the academic success.
– Institutional research professionals can inform enrollment management professionals on geo-demographic data, academic program enrollment factors, course planning factors, faculty productivity, etc.
Read more: Enrollment Management in Higher Education - Defining Enrollment Management, Key Offices and Tasks in Enrollment Management, Organizational Models http://education.stateuniversity.com/pages/1959/Enrollment-Management-in-Higher-Education.html#ixzz0oZcjQ5Ug

Relationship of IR to EM
Hossler modified his 1986 definition of enrollment management in 1991, stating that “it is an organizational concept and a systematic set of activities designed to enable educational institutions to exert more influence on their enrollments. Organized by strategic planning and supported by institutional research, enrollment management activities concern student college choice, transition to college, student attrition and retention, and student outcomes.” (Hossler 1991)
“Enrollment management is the coordinated effort of a college or university to influence the size and characteristics of the institution’s student body... enrollment is “managed” through a variety of strategies including admissions, pricing, financial aid, and advising. Well designed and well executed institutional research is the key to successful enrollment management.”--Craig Clagett

One Role of IR and EM
Institutionalize the use of data and evidence and data-driven decision making
Promoting the importance and use of institutional research
What gets measured, gets valued

What is MAP-Works?
Student ID: YD252952
HS GPA: 3.93
SAT Verbal: 29
Location: In state
Gender: Female
Race: African American
Age: 18
Major: Undecided
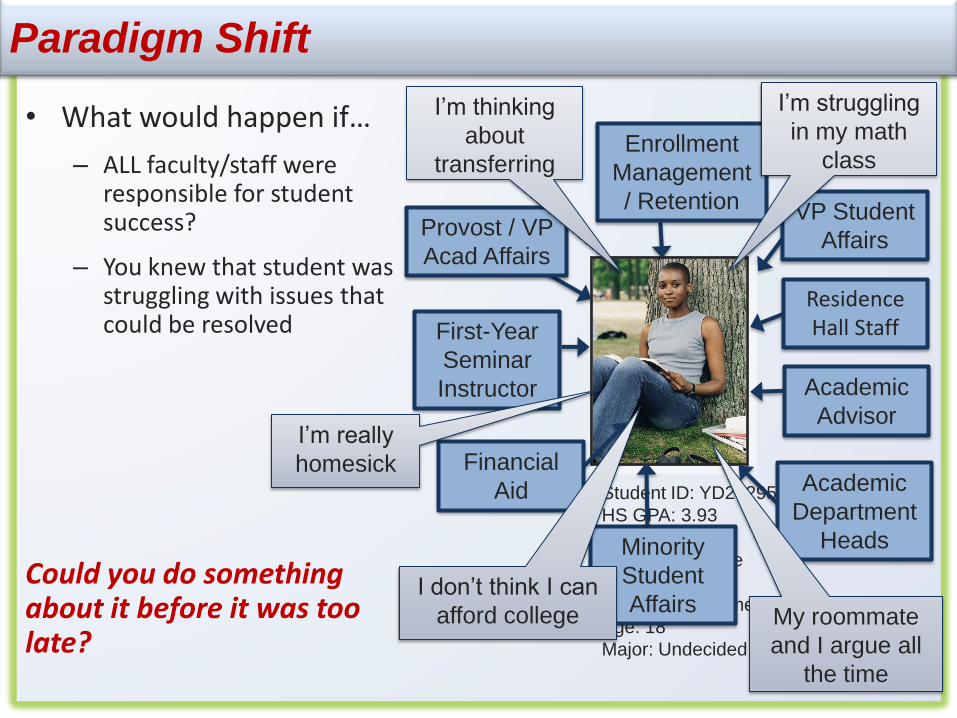
Paradigm Shift
• What would happen if…
– ALL faculty/staff were responsible for student success?
– You knew that student was struggling with issues that could be resolved
Could you do something about it before it was too late?
Enrollment
Management
/ Retention
Residence Hall Staff
Academic
Advisor
First-Year
Seminar
Instructor
Academic
Department
Heads
Financial
Aid
Minority
Student
Affairs
I’m really
homesick
I don’t think I can
afford college My roommate
and I argue all
the time
VP Student
AffairsProvost / VP
Acad Affairs
I’m thinking
about
transferring
I’m struggling
in my math
class

MAP-Works Outcomes
Improved Retention andStudent Success
Focuses students
on college success
behaviors
Motivates, informs and coordinates faculty/staff
Early intervention with at-risk
students
• Retention: Minimize
percentage of capable students who leave your campus due to issues that could have been addressed
• Student Success: Identify discrepancies between student expectations and the academic and social behaviors necessary to succeed.
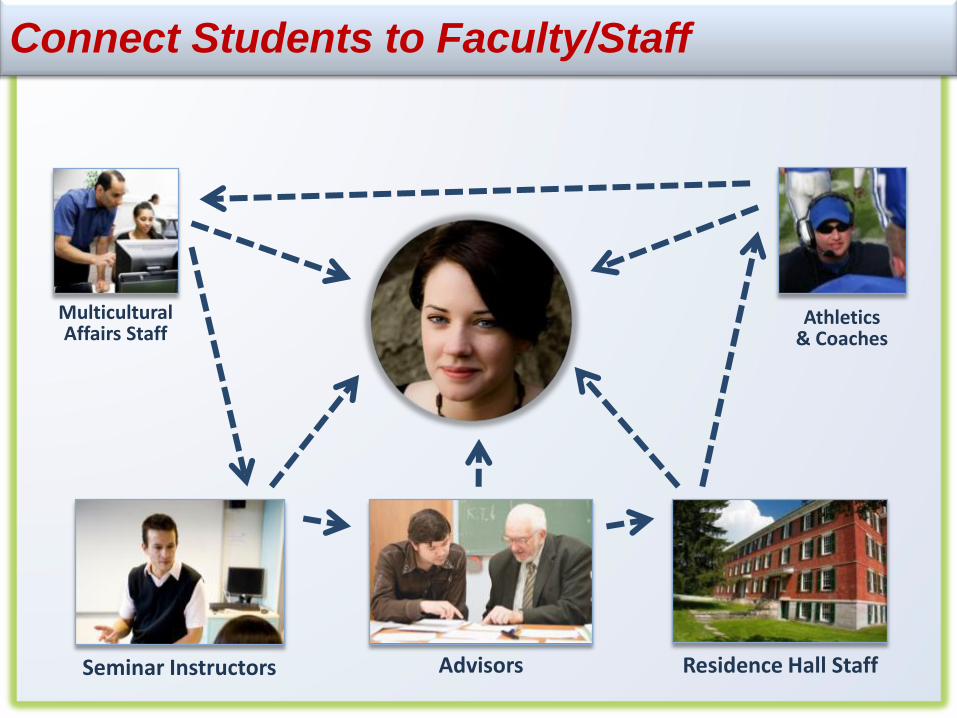
Residence Hall Staff
Multicultural Affairs Staff
Advisors
Athletics& Coaches
Seminar Instructors
Connect Students to Faculty/Staff

Quickly Find Students At-Risk
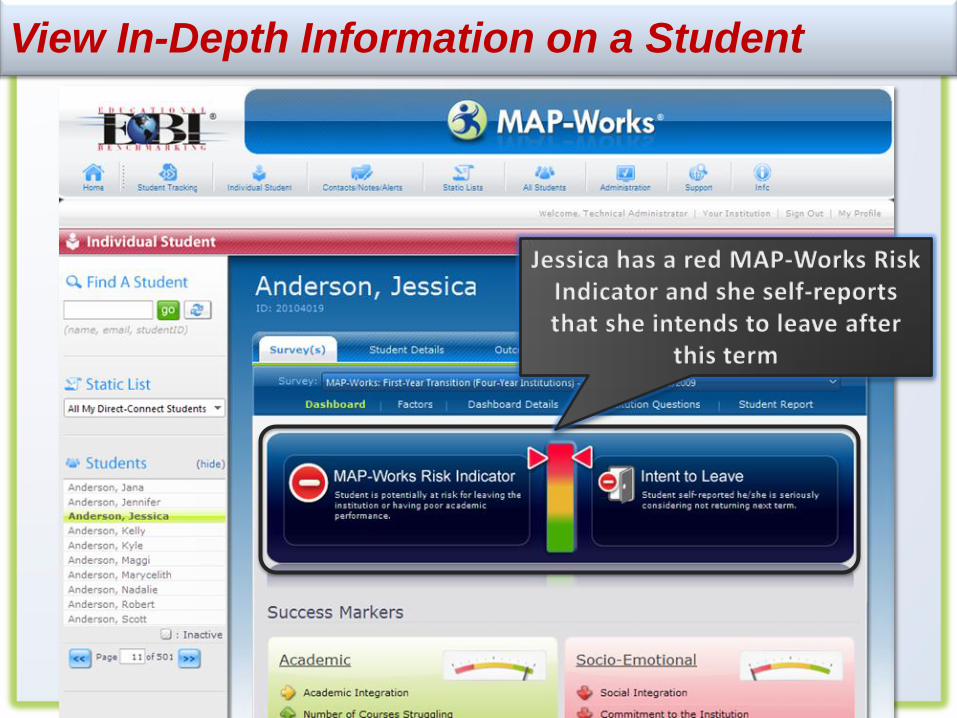
View In-Depth Information on a Student

Identify Potential Reasons for Struggle

Behaviors Impact Performance

Slippery Rock University and MAP-Works
Amanda Yale

Slippery Rock University
• Public institution - PASSHE
• Enrollment - 8,548
• First Year – 1550
– 50% first generation (MAP-Works)
– 85% receive financial aid
– 81% first to second year retention
Map-Works
Two Years of Data
• About 90% completed survey each year
• About 70% completed check-up survey
• About 50% completed end of year check-up survey

• In Fall 2008, Slippery Rock University committed to participation with MAP-Works to identify first year students who are in need of greater support in achieving their academic and personal goals (FOE Project Recommendation).
• Two years of data and evidence on our freshman and one year on transfers
• Our goal was focused on assisting faculty and staff in working with our first year students early in their initial semester on campus to address related to their college transition.
• “Stop doing” SAPA – Student Attendance Performance Adjustment – In place since early 1990’s.
• Information in MAP-Works is viewed as useful and valuable in creating strategic interventions with our students
MAP-Works at SRU

• Administrative Coordination & Training
– Office of Retention Services
• Primary Participating Partners
– Office of Retention Services
– FYRST Seminar Faculty
– Residence Life Staff
• Outreach Partners
– Office of Intercultural Programs
– Tutorial Center
– Office of Student Leadership
– Honors Program
– Athletics
Coordination and Participation

• Administered via FYRST Seminar
• Identified students at risk of a poor transition experience (either socially or academically)
– Challenges with studying/time management
– Experiencing transition issues like making friends, adjusting to the academic work load, or adjusting to living in a residence hall
– Who desire to be involved in student activities or leadership opportunities
• Linked students easily to campus resources
• Facilitated communication with other faculty/staff directly connected to this student to coordinate efforts
• Updated information on individual students throughout the academic year via Check-Up Surveys (Mid-term and Second Semester)
• Learn about characteristics of first year students
How SRU Used MAP-Works Information
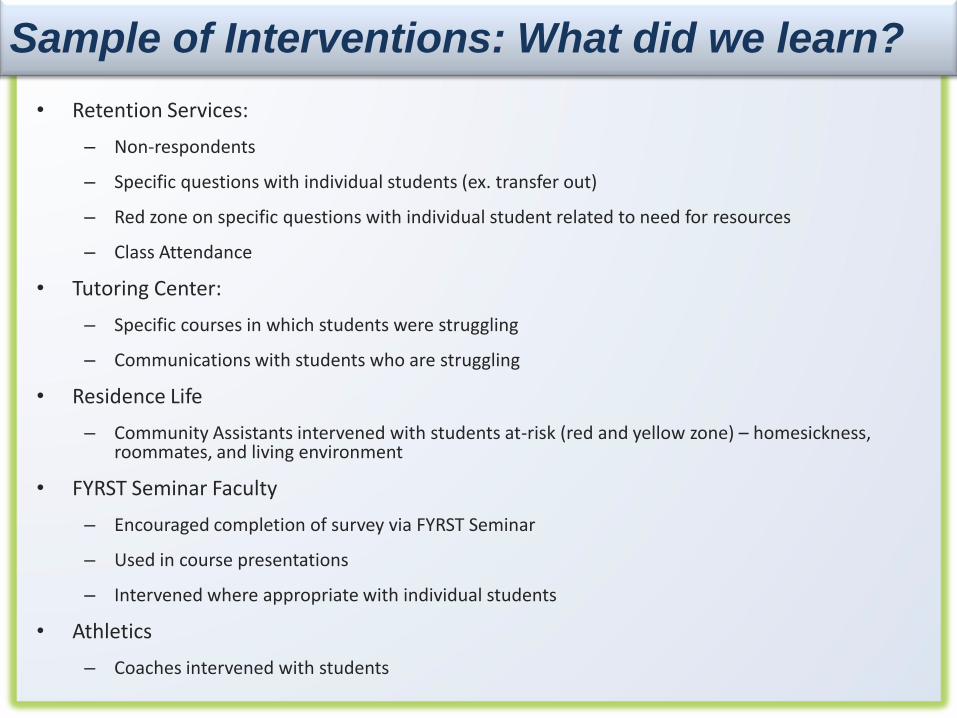
• Retention Services:
– Non-respondents
– Specific questions with individual students (ex. transfer out)
– Red zone on specific questions with individual student related to need for resources
– Class Attendance
• Tutoring Center:
– Specific courses in which students were struggling
– Communications with students who are struggling
• Residence Life
– Community Assistants intervened with students at-risk (red and yellow zone) – homesickness, roommates, and living environment
• FYRST Seminar Faculty
– Encouraged completion of survey via FYRST Seminar
– Used in course presentations
– Intervened where appropriate with individual students
• Athletics
– Coaches intervened with students
Sample of Interventions: What did we learn?

Closing the Assessment
Loop
Planning
Implementation
Assessment
Application of
Assessment
Using the Assessment Findings

Lower entering h.s. grades
Perceived greatest challenge in transition
First Generation
First choice of institution
Transfer intention
Number of courses / struggling
Time on social networking
Living on-off campus
Class attendance
Lower overall grade expectations
Undecided on a major
Students with lower HS
grades self report lower
commitment to SRU
Cross-Tab Reporting & Interventions

• Pilot with transfer students
• Provide more training on specific intervention examples for community assistants
• Involve FYRST Seminar peer leaders more actively with student interventions
• Include a pilot group of faculty advisors via academic departments
• Additional segmented groups – Exploratory students
• Possible interest in sophomore level
What would we do differently in the future?
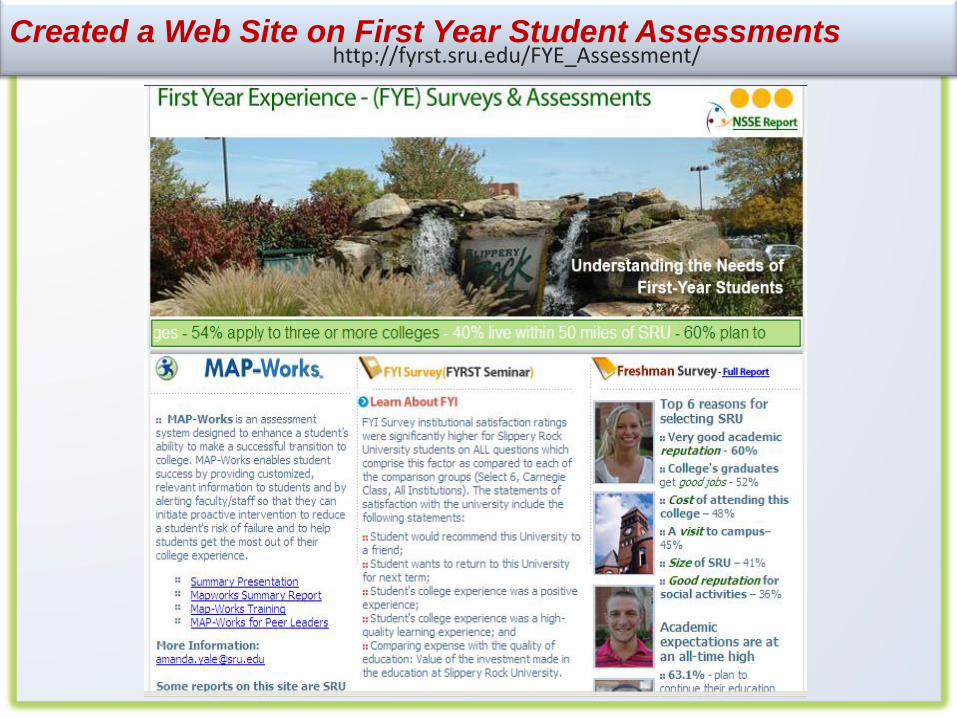
Created a Web Site on First Year Student Assessmentshttp://fyrst.sru.edu/FYE_Assessment/

Cost for SRU - $25,000
If SRU retains 23.1 more students
Tuition and fees $160,177.71
Retention first to second semester
2007- 91.7%; 2008-93.4%; 2009-94.2%
Retention first to second year
2007-79%; 2008-81%; 2009- 82%-83%
Final Word

Fall to Spring Persistence
PersistenceRate
Without 2007 to 2008 91.7%
With 2008 to 2009 93.4%
1 Term Improvement: 1.7%
Research conducted by Slippery Rock University
Focus on Aggregate Data and Retention
Rebecca Pierce

Discussion / Questions
Amanda Yale, Ph.D., [email protected]
Rebecca Pierce, Ph.D., [email protected] Jones, Ph.D., [email protected]
For more information on MAP-Works, please contact Todd Pica at [email protected] or visit www.MAP-Works.com