improving solar policy: lessons from the solar leasing boom in
TRANSCRIPT
Improving Solar Policy: Lessons from the solar leasing boom in CaliforniaClimate Policy Initiative
A CPI Report
Andrew HobbsElinor BenamiUday VaradarajanBrendan Pierpont
July 2013

Copyright © 2013 Climate Policy Initiative www.climatepolicyinitiative.orgAll rights reserved. CPI welcomes the use of its material for noncommercial purposes, such as policy discussions or educational activities, under a Creative Commons Attribution-NonCommercial-ShareAlike 3.0 Unported License. For commercial use, please contact [email protected].
About CPIClimate Policy Initiative is a team of analysts and advisors that works to improve the most important energy and land use policies around the world, with a particular focus on finance. An independent organization supported by a grant from the Open Society Foundations, CPI works in places that provide the most potential for policy impact including Brazil, China, Europe, India, Indonesia, and the United States.
AcknowledgementsThe authors thank the following organizations and professionals for their collaboration and input: Marzia Zafar and Robert Kinosian of CPUC, Michael Mendelsohn, Carolyn Davidson,and Easan Drury of NREL; Varun Rai and Ben Sig-rin of University of Texas – Austin; Jorge Medina and John Stanton of Solar City; Holly Gordon and Walker Wright of Sun Run, Darren Deffner of SEPA; Philip Shen of Roth Capital; Kevin Hurst of the U.S. Office of Science and Technol-ogy Policy, James Fine of the Environmental Defense Fund, Judson Jaffe of the U.S. Treasury; and Eric Gimon of the Vote Solar Initiative. The perspectives expressed here are CPI’s own.
Finally the authors would like to acknowledge inputs, comments and internal review from CPI staff: David Nelson, Jeff Deason, Kath Rowley, Rodney Boyd, Wenjuan Dong, Tim Varga, Elysha Rom-Povolo, and Ruby Barcklay.
DescriptorsSector Renewable Energy
Region U.S.
Keywords Solar; PV; leasing; business models; renewable energy
Contact Andrew Hobbs [email protected]

IIIA CPI Report
Improving Solar Policy: Lessons from the solar leasing boom in CaliforniaJuly 2013
Executive Summary Electricity from solar photovoltaic (PV) panels on roof-tops across the U.S. is an appealing low-carbon energy option – it doesn’t require dedicated land and has the potential to make a significant contribution to meeting future energy demands. Until recently, very little of this potential had been exploited largely due to the high cost of solar. However, other barriers also played a role, includ-ing permitting challenges, financing, and poorly under-stood potential impacts on the electricity system.
Recently, steep solar panel cost reductions as well as strong federal and state policy supports have helped to catalyze substantial growth in rooftop solar PV deploy-ment in California. Interestingly, this growth has hap-pened in the face of declining financial incentives for solar installations at the state level through the California Solar Initiative. This growth has also been accompanied by a shift in market demand: Most homeowners in California are no longer purchasing the panels on their rooftops, they are leasing them. Over 75% of California’s new resi-dential solar systems in 2012 were leased as compared to less than 10% in 2007.
As policymakers across the country and elsewhere look to spur further growth of solar PV in a constrained budget environment, the California experience — and in particu-lar, the rise of leasing — may hold lessons for improving the effectiveness of solar policy generally. In this study, we address four questions about the California leasing experience with a view towards formulating such lessons for policymakers. We use financial modeling and econo-metric analysis to explore these questions:
1. Why are more people leasing rather than buying?
For homeowners, a lease transforms a complex investment into a money-saving service. Solar leasing firms offer customers a way to take advantage of rooftop solar without many of the burdens associated with financing and owning the panels.
2. How has solar leasing affected federal taxpayers?
Leased systems initially cost federal taxpayers more than purchased systems, but not anymore.
For leased systems, taxpayer costs are related to prices, which are determined not only by system
costs, but also by bill savings and state incentives.1 Higher savings and higher state incentives can translate into more generous federal tax incentives for leased systems.2 However, while leasing initially resulted in higher solar prices, and therefore, higher taxpayer costs for federal investment incentives, our analysis of the California experience suggests that the premium associated with leased systems has disappeared over the last two years.
Declining state incentives have likely helped reduce the cost to taxpayers of federal incentives for both types of systems. The California Solar Incentive (CSI) was a performance-based, up-front incentive for solar deployment that declined in a predictable way with increased deployment. Our analysis suggests that the decline of the CSI helped bring down prices for rooftop solar in California more than can be explained by time trends, declines in solar PV module costs, or other factors. As the cost of federal tax incentives are related to prices, the decline in prices also led to a decline in the cost of those incentives to taxpayers.
3. How has policy affected the ownership of solar PV?
Decreasing up-front incentives have, in part, driven the increase in leasing. As the up-front California Solar Initiative incentive has declined, up front incentives have covered a smaller fraction of project costs, increasing the relative burden of financing and making leasing more appealing.
4. What lessons can we draw from the solar leasing experience for improving federal and state solar policy?
• We have found no reason to prohibit solar leasing. While solar leasing once cost federal taxpayers more than purchased systems, we no longer find this to be the case. Leasing companies make it easier for many customers to realize the benefits of rooftop solar: They translate a diverse set of policies and processes into a relatively simple product for households, leaving less for individuals to manage. However, not all states allow leasing. By providing more
1 Federal investment tax incentives – including the investment tax credit and accelerated depreciation – can be claimed on the basis of project’s fair market value – see Box 2 for more detail.
2 This may provide leasing companies an additional incentive to identify the customers who will save the most on their monthly utility bill.

IVA CPI Report
Improving Solar Policy: Lessons from the solar leasing boom in CaliforniaJuly 2013
ways for customers to finance rooftop solar and minimize their transaction costs, states that permit leasing may enable greater solar deployment.
• Use incentives that decline with deployment to help bring down prices. Our analysis suggests that declining incentives provide pressure on both solar installers and leasing companies to identify and implement cost reductions help lower prices for solar customers.
• Take steps to reduce the cost of leasing to taxpayers and customers.
i. Increase availability and comparability of public data on solar lease and purchase pricing to enhance market competition and reduce costs. Maintaining a publicly-acces-sible platform to compare solar pricing data — for leases and purchases — would facilitate a competitive solar market environment and enable more robust research and analysis of trends.
ii. Continue to address permitting, interconnec-tion, and inspection process barriers to reduce financing and installation costs. Each of these offers an opportunity to streamline projects and reduce costs.
iii. Minimize or eliminate the need for expensive tax equity to reduce financing costs. Solar leasing companies could reduce their financing costs and provide leases to more customers if they did not have to rely on costly tax equity finance to realize the value of federal incentives.3
3 This could be done by, for example, providing federal incentives as taxable cash (CPI 2012).
Finally, we note several further issues that may impede efficient deployment of rooftop solar in California, which we also suggest as opportunities for future analysis: California’s tiered rate structure (along with Net Energy Metering) offers much greater solar PV benefits to high energy consumers; solar generation may not currently be sited in areas it most benefits the grid; and there are unmeasured risks that leasing may present to consumers and investors. These risks include changes in retail elec-tricity rates and the Net Energy Metering program being considered by the California Public Utilities Commission, changes to federal tax incentives, and lease portfolio per-formance. Addressing each of these three issues would open opportunities to achieve greater deployment while encouraging cost and price reductions to government and consumers.
Ultimately, policy can and should support the expansion of renewable generation using mechanisms that fit the needs of consumers. Solar leasing has filled and will con-tinue to fill a gap — converting long-term energy savings from a relatively large investment into a product that provides immediate financial benefits. However, leasing is likely not the only way in which business and/or policy innovation can make it easier for consumers to benefit from renewable generation. For example, providing state or federal incentives directly to consumers for choosing to consume clean electricity — and expanding the renew-able options available to consumers through, for example, retail green power options — may yield similar results at lower costs. Like leasing, these approaches present ways to catalyze a shift to cleaner electricity generation driven by consumer choice. We plan to study such innovative approaches in future work.
VA CPI Report
Improving Solar Policy: Lessons from the solar leasing boom in CaliforniaJuly 2013
Table of Contents1. Introduction 1
2. Policy helped make rooftop solar cost-effective for many Californians 32.1 For high-energy consumers, rooftop PV is cost effective (with incentives) 32.2 How state and federal policies helped make solar cost-effective 4
3. Solar leasing transforms a complex home investment into a service 73.1 How a solar lease works 73.2 Solar leasing companies have a strong growth incentive 83.3 Leasing helps overcome some — but not all — barriers to residential solar 8
4. How Policy affects Costs to Taxpayers 124.1 Prices for solar are driven by value and cost 134.2 The effect of policy on prices 144.3 Empirical assessment of price drivers 154.4 State incentive programs and utility rates can affect costs for the federal government 17
5. Policy has facilitated a shift toward solar leases 18
6. Conclusions, Recommendations, and Areas for Future Research 20
7. References 22
8. Appendix A - Description of Policies Under Study 26
9. Appendix B - Econometric Modeling Structure and Assumptions 28
1A CPI Report
Improving Solar Policy: Lessons from the solar leasing boom in CaliforniaJuly 2013
1. IntroductionLow-carbon electricity generation from solar photovoltaic (PV) panels on rooftops has grown rapidly over the last few years, particularly in California. Annual installations of solar PV on rooftops across the state have grown 27% per year on average since 2008 and California currently boasts nearly 40% of grid-connected PV capacity nation-wide (IREC 2012). At least a third of that capacity has come from residential rooftops.
An important contributor to the recent boom in rooftop PV has been that the economics have improved. As discussed in Section 2 a combination of steep technol-ogy cost reductions, federal tax incentives, and state policies (in particular, electricity bill savings enabled by California’s tiered rate structure, Net Energy Metering, and the California Solar Initiative) has made rooftop solar PV cost-effective for many homeowners in California.
However, improved economics alone do not guarantee increased deployment. Additional barriers, such as lack of information about how to access government incentives, high up-front costs, and difficulties in permitting and interconnection remain. Solar leasing helps address these barriers.
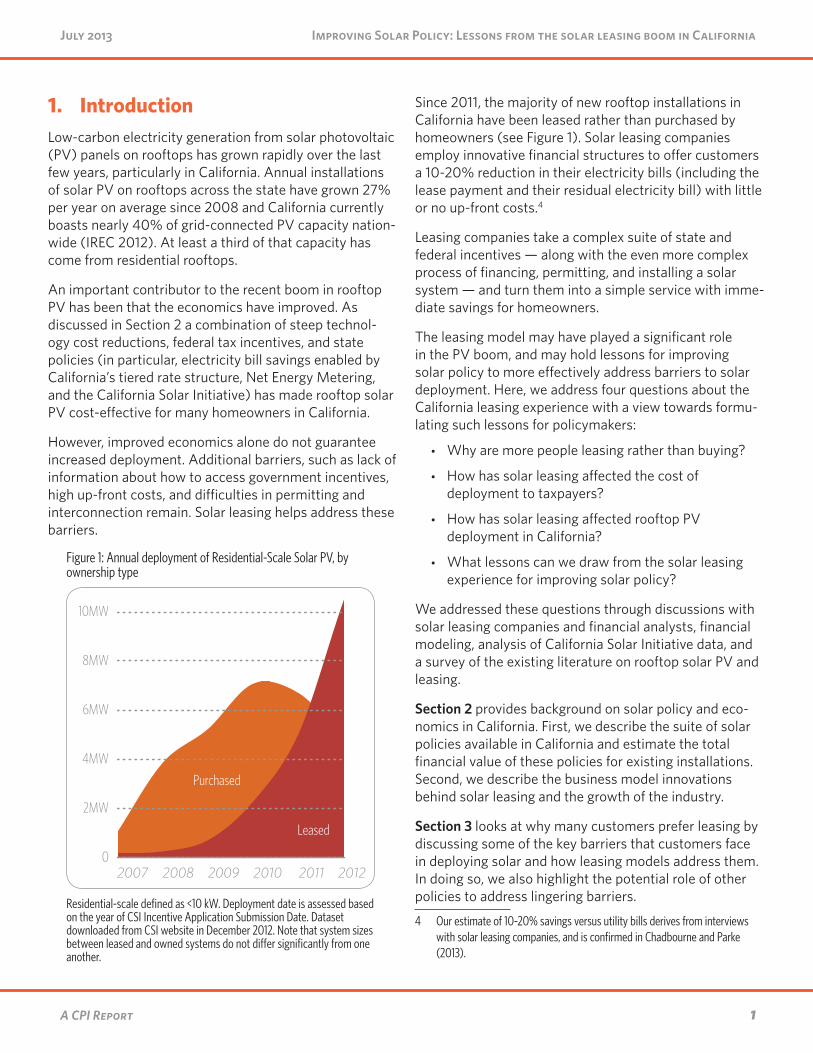
Since 2011, the majority of new rooftop installations in California have been leased rather than purchased by homeowners (see Figure 1). Solar leasing companies employ innovative financial structures to offer customers a 10-20% reduction in their electricity bills (including the lease payment and their residual electricity bill) with little or no up-front costs.4
Leasing companies take a complex suite of state and federal incentives — along with the even more complex process of financing, permitting, and installing a solar system — and turn them into a simple service with imme-diate savings for homeowners.
The leasing model may have played a significant role in the PV boom, and may hold lessons for improving solar policy to more effectively address barriers to solar deployment. Here, we address four questions about the California leasing experience with a view towards formu-lating such lessons for policymakers:
• Why are more people leasing rather than buying?
• How has solar leasing affected the cost of deployment to taxpayers?
• How has solar leasing affected rooftop PV deployment in California?
• What lessons can we draw from the solar leasing experience for improving solar policy?
We addressed these questions through discussions with solar leasing companies and financial analysts, financial modeling, analysis of California Solar Initiative data, and a survey of the existing literature on rooftop solar PV and leasing.
Section 2 provides background on solar policy and eco-nomics in California. First, we describe the suite of solar policies available in California and estimate the total financial value of these policies for existing installations. Second, we describe the business model innovations behind solar leasing and the growth of the industry.
Section 3 looks at why many customers prefer leasing by discussing some of the key barriers that customers face in deploying solar and how leasing models address them. In doing so, we also highlight the potential role of other policies to address lingering barriers.
4 Our estimate of 10-20% savings versus utility bills derives from interviews with solar leasing companies, and is confirmed in Chadbourne and Parke (2013).
Figure 1: Annual deployment of Residential-Scale Solar PV, by ownership type
0
2MW
4MW
6MW
8MW
10MW
2007 2008 2009 2010 2011 2012
Purchased
Leased
Residential-scale defined as <10 kW. Deployment date is assessed based on the year of CSI Incentive Application Submission Date. Dataset downloaded from CSI website in December 2012. Note that system sizes between leased and owned systems do not differ significantly from one another.

2A CPI Report
Improving Solar Policy: Lessons from the solar leasing boom in CaliforniaJuly 2013
Section 4 describes the results of financial modeling and regression analysis of what impact leasing has had on the cost of solar incentives to the federal government. We also discuss how the prices that customers pay for solar leases have changed as the market has grown.
Section 5 uses similar analysis to address the drivers of deployment in California and, in particular, to explore whether leasing may have enabled additional deployment.
Section 6 provides recommendations for U.S. policy makers looking to achieve greater residential solar deployment, at lower costs, within their jurisdictions. It ends suggesting areas for future research.
3A CPI Report
Improving Solar Policy: Lessons from the solar leasing boom in CaliforniaJuly 2013
2. Policy helped make rooftop solar cost-effective for many CaliforniansPolicies at both the federal and state levels have helped spur deployment in California. Here, we describe and quantify the impact of key policies that help make rooftop solar PV cost-effective for many homeowners in California.
Figure 2: Financial value of bill savings and incentives exceeds average system prices
0
$1
$2
$3
$4
$5
$6
$7
$8
2008 2009 2010 2011 2012
Dolla
rs pe
r Wat
t
Bill Savings
CSI Incentive
Tax Credit
Price/Watt
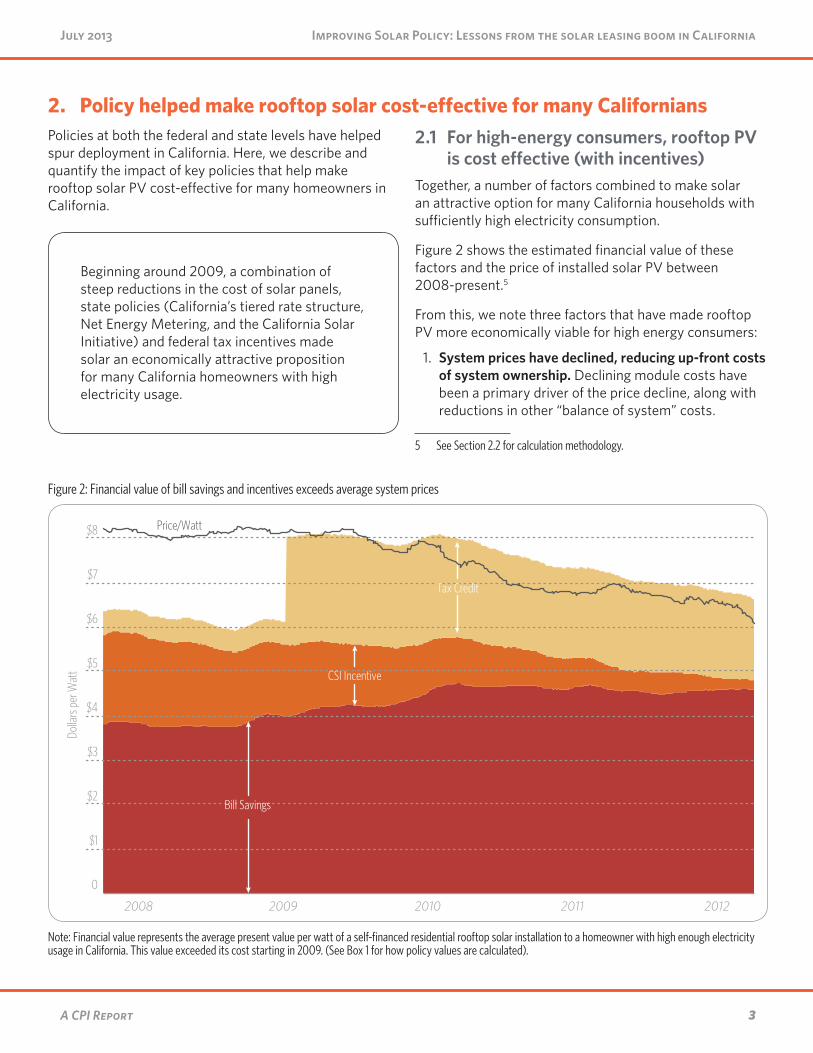
Note: Financial value represents the average present value per watt of a self-financed residential rooftop solar installation to a homeowner with high enough electricity usage in California. This value exceeded its cost starting in 2009. (See Box 1 for how policy values are calculated).
2.1 For high-energy consumers, rooftop PV is cost effective (with incentives)
Together, a number of factors combined to make solar an attractive option for many California households with sufficiently high electricity consumption.
Figure 2 shows the estimated financial value of these factors and the price of installed solar PV between 2008-present.5
From this, we note three factors that have made rooftop PV more economically viable for high energy consumers:
1. System prices have declined, reducing up-front costs of system ownership. Declining module costs have been a primary driver of the price decline, along with reductions in other “balance of system” costs.
5 See Section 2.2 for calculation methodology.
Beginning around 2009, a combination of steep reductions in the cost of solar panels, state policies (California’s tiered rate structure, Net Energy Metering, and the California Solar Initiative) and federal tax incentives made solar an economically attractive proposition for many California homeowners with high electricity usage.

4A CPI Report
Improving Solar Policy: Lessons from the solar leasing boom in CaliforniaJuly 2013
2. The value of electricity bill savings has increased relative to other factors as up-front incentives declined. Electricity bill savings for high-electricity usage customers have provided an increasing share of the value of rooftop solar PV, reflecting both the reduced cost of the system and the increase in top-tier residential electricity rates. Note that bill savings in California is supported by the state’s tiered electricity rates and Net Energy Metering policy, discussed in more detail in Section 2.2.
3. Federal and state policies provided predictable support for solar installations. In particular, the value of policy incentives and electricity bill savings nearly exceeded the average price per watt of installed systems for customers with high enough electricity usage. We discuss these state and federal policies in more detail in the next section. 6
6 When the $2000 cap on the residential ITC for purchased systems was elim-inated at the beginning of 2009, the value of policy incentives and electricity bill savings (enabled by NEM and California’s tiered rate structure) nearly exceeded the average price per watt of installed systems for customers with high enough electricity usage. Rooftop solar PV became economical for these customers shortly thereafter.
2.2 How state and federal policies helped make solar cost-effective
In California, four state and federal policies7 have had a direct impact on the economic value of a residential rooftop solar system. The policies introduced in this section are reflected in our modeling and affect our empirical results:
1. California’s tiered electricity rate structure and Net Energy Metering: Since the mid-nineties, California has allowed electricity customers to reduce their monthly utility bills by the amount of solar PV generated on-site. This amount is credited to the customer’s bill at the retail rate of their consumption, so that they are only charged for electricity consumption net of their solar generation.8
7 A more detailed description of these policies can be found in Appendix A. Additional state policies that also contribute to an environment friendly to re-newable energy include a law protecting a homeowner’s right to have access to the sun/avoid risks of shading, a property tax exclusion for solar energy systems, and a goal for 12GW of ‘localized electric generation’ by 2020. More broadly, California also mandates that a third of the state’s electricity come from renewable sources by 2020 — however, smaller scale solar systems do not currently count towards meeting this mandate.
8 The database on state incentives for renewables and efficiency (DSIRE) pro-vides one of the most comprehensive descriptions of California’s Net Energy Metering history.
Box 1: How we calculate the value of policy incentives and bill savings
To calculate the value of electricity bill savings, we first need to estimate the energy consumption of solar customers, as it is not publicly available. To estimate this, we assume that the system size reported in CSI data reflects the amount of electricity needed to offset the highest tiers of a customer’s electric consumption in each territory (i.e. tier three and above in PG&E; tier four and above in SCE). This assumption matches early sizing patterns of solar deployed under the CSI program, as noted in the 2009 CSI Impact Valuation.a
Second, we add in expected savings, which are the gross reduction in customer utility bills over the 20 year life of the system. Third, we calculated the present value of these savings assuming an 8% real discount rate, 2.5% real escalation in high tier electricity prices, and no further changes in bill/rate structure or customer electricity consumption over the life of the system. Fourth, the average CSI incentive is pulled directly from the CSI database. Finally, we use the CSI database to calculate the amount of federal tax incentive received – assumed to be 30% of reported prices.
a If a system is ‘oversized,’ then this assumption will overstate the value of bill-savings. If a system is ‘undersized,’ then this assumption will understate the value of bill-savings. We do not have data indicating systems are systematically sized larger or smaller than household consumption needs. We also assumed a 17% annualized capacity factor, and used the de-rated production estimate from CSI data, as the de-rated figure accounts for obstacles and the angle of the solar panel in estimating production.

5A CPI Report
Improving Solar Policy: Lessons from the solar leasing boom in CaliforniaJuly 2013
As California’s retail electricity rates increase in steps with greater usage, high usage customers can use Net Energy Metering to reduce their electricity costs substan-tially by deploying a solar PV system sized to eliminate just their high-tier consumption. The amount a household will pay for each unit of electricity depends on how much they have consumed already. As a household consumes more electricity, they move towards the next tier, which charges a higher rate per kilowatt-hour (kWh). The current tiers for PG&E, followed by the monthly kWh usage ranges in each tier for the Bay Area climate zone in the summer, are below.
California’s current Net Energy Metering policy credits a solar customer’s electric bill at the retail rate of the consumption that the solar offsets on a monthly basis. For example, assume an electric customer in the Bay Area consumes 1100kWh per summer month. The first 330kWh would have been charged at the Tier 1 rate, the
next 99kWh at Tier 2, and so on up to the last 100kWh charged at the Tier 5 rate of $0.34/kWh for a total bill of $273.25. If the
customer adds a solar system that generates 500KWh per summer month, they are no longer charged for those 500kWh, eliminating their top two tiers of consumption and lowering their bill to $109.50.9 Thus, for this house-hold, the solar generation provides $163.75 in monthly bill savings.
Since rates are higher for high-usage customers, solar generation provides greater bill savings to households who consume more electricity to begin with.10 For the past several years, the top tier rates (where solar is generally cost effective) have trended upward, as shown in the figure below. This means the incentive from bill savings for high-usage households to install solar has grown stronger.
2. California Solar Initiative (CSI): CSI provides an up-front incentive for small-scale solar installations, based on their expected performance.11 The amount of the incentive provided to each new installation is designed to decrease as more solar is installed in the state.
Additionally, the California Public Utilities Commission (CPUC) requires that CSI incentive recipients report the installed price of the system; the CPUC then makes this information — along with other installation data — pub-licly available. We refer to this as the CSI data.
9 Solar customers often choose to use pricing based on time of use upon installation of a solar system. With time of use pricing, the value of solar generation depends upon the timing of the generation. As solar systems tend to generate near peak times, this could increase the value of solar generation. We have not considered time of use pricing in this example.
10 With net metering, the solar customer does not have to worry about using electricity when the sun is shining. Rather, they can send electricity from their solar panels to the grid when it is generated, and get it back when they need it on a monthly basis – effectively using the electricity grid to store the solar generation. Without net energy metering, the customer would need to arrange for electricity storage services for their system to achieve the same outcome. Thus, the subsidy provided by net energy metering itself is not directly linked to monthly bill savings – but rather the cost of the electricity storage services they do not have to procure.
11 Performance depends on panel manufacturer, orientation, location, and nameplate output.
Table 1 Example of California’s Tiered Electricity Rate Structure (PG&E rates and Bay Area baselines)
TIER 1 2 3 4 5
Cents per kWh .13 .15 .3 .34 .34
Monthly kWh ranges for each tier, Bay Area summer <330 331-429 430-660 661-990 >991
Figure 3 SCE Rate History, September 2006 to June 2012
0
$0.10
$0.20
$0.30
$0.40
$0.50
2006 2007 2008 2009 2010 2011 2012
Tier 5 discontinued in 2010
Cents per kWh
Tier 5
Tier 4
Tier 3
Tier 2
Tier 1

6A CPI Report
Improving Solar Policy: Lessons from the solar leasing boom in CaliforniaJuly 2013
3. Federal Investment Tax Credit (ITC): Businesses and residential consumers may elect to claim a 30% federal tax credit on eligible solar property purchase and installa-tion costs incurred prior to the end of 2016. If an applicant is unable to use the entire credit in one year, they may roll over the credit amount to the next taxable year. Projects installed by homeowners (but not businesses) prior to the end of 2008 were subject to a $2000 cap on the total amount of the tax credit they could claim. For systems installed between 2009 and 2012 applicants could elect a cash grant instead of an investment tax credit (ITC) for 30% of eligible project costs.
4. Modified Accelerated Cost Recovery System (MACRS) and bonus depreciation: A solar leasing company investing in rooftop solar pays taxes on its net revenues from each system. The business can deduct a fraction of the cost or value of the system from its taxable net revenues as a depreciation expense. This reflects that some part of the asset has been “used up” over the year. MACRS is accelerated depreciation for federal tax purposes, meaning that businesses can depreciate a solar asset over five years rather than over the actual life of the system.
Leased systems can benefit from MACRS, while pur-chased systems cannot. However, the owner of a leased system must also pay taxes on lease revenue while a purchased system owner does not pay taxes on energy savings — this additional tax burden for a leased system approximately offsets the value of MACRS.
Further, bonus depreciation has allowed projects placed into service between 2008 and the end of 2013 to take 50% of the property’s value as a tax deduction in the first year. Projects placed in service between September 8, 2010 and January 1, 2012 could be fully depreciated in the first year, thereby treating the investment as a business expense.12 The combination of the Federal ITC and accel-erated depreciation generally offsets most or all of the tax liabilities of a project. That said, stakeholders have noted that, in many cases, leasing companies do not use bonus depreciation as it eliminates the tax liabilities that could otherwise be used to monetize more valuable tax credits.
While all these factors, together, can make a solar system cost effective for some California homeowners, it is a complex decision for any given homeowner. Leasing helps simplify this process, as we discuss in greater detail in the next section.
12 These provisions have been available to many types of investment beyond solar.
7A CPI Report
Improving Solar Policy: Lessons from the solar leasing boom in CaliforniaJuly 2013
3. Solar leasing transforms a complex home investment into a serviceWhile the value of rooftop solar PV now exceeds its cost for homeowners who use enough electricity, the prices of an average system still range in the tens of thousands of dollars. As a result, many potential solar customers need access to financing to take advantage of the value proposition of rooftop PV. Further, the permitting and paperwork associated with accessing incentives, installing a system, and connecting it to the grid present substantial barriers to many homeowners. While many installers can help with the latter problems, solar leasing companies help their customers overcome these barriers while also addressing financing.
Solar leasing firms offer customers a way to take advantage of rooftop solar PV without the burdens associated with financing, installing, permitting, and operating the panels themselves.
In this section we start by discussing how a solar lease works for the electricity consumer, the leasing company, and investors. We then describe in greater detail some key barriers to the deployment of cost-effective rooftop PV and discuss the extent to which solar leasing addresses them, relative to purchased systems which often draw upon the resources of an installer.
3.1 How a solar lease worksA solar lease involves agreements among four main parties:
1. A creditworthy homeowner with sufficiently high electricity consumption. A solar lessee must have a reasonably high credit score (FICO score of 680 to 700 in general). However, they do not need home equity or a down payment. This means that a lease may be a viable option for someone who would be unable to pay for the system otherwise.
The lease payments can be fixed, as in a con-ventional lease, or linked to the actual electricity production of the system, in which case they are called power purchase agreements. The leasing company generally sets the amount of the monthly payment to enable the homeowner to lower their
total payments for electricity services by 10-20% relative to bills before installation. This requires that the homeowner had a high enough electric-ity bill before solar installation so that the lease can yield lower total electricity expenditures for homeowners, while also still generating revenue for developers. Therefore, leasing companies generally target these high-consumption households.
2. The electric utility that interconnects the rooftop system to the electricity grid. Electric utilities must connect rooftop solar to the grid. They must conform to interconnection and safety requirements promulgated by the regulatory authority (for Califor-nia, the California Public Utilities Commission).13
3. A solar leasing company who arranges financing, installation, and operation of the system. Solar leasing companies arrange financing by aggregating large numbers of small projects into funds to which they attract potential investors. They also provide maintenance to ensure operation of the system over the lease term. Leasing companies approach installa-tion, maintenance, and operation of solar systems in two different ways:
i. Integrated companies offer installation and operational services in-house, managing the whole project from start to finish and through operation. SolarCity is the most prominent example of this.
ii. Non-integrated companies also oversee the installation process. However, rather than managing an in-house installation network, they partner with local, independent contrac-tors to install the systems. Some of the largest examples of this model include SunRun, Clean Power Finance, SunPower, and Sungevity.
4. One or more investors who are willing to finance the system. In order to offer a competitive lease option, a solar leasing company partners with a third party (generally a bank or larger corporation) who finances part or all of a fund. Since the solar leasing company
13 Utilities may not be neutral to distributed solar deployment: In California, rooftop PV reduces the utility’s revenue from electricity sales through net metering. On the other hand, if sited appropriately, rooftop solar installations may also reduce the need to build out new infrastructure to meet increasing demands. See Edison Institute (2013).
8A CPI Report
Improving Solar Policy: Lessons from the solar leasing boom in CaliforniaJuly 2013
generally does not have sufficient tax liability to utilize the investment tax credits and accelerated depreciation tax benefits of the fund’s projects, an investor with sufficient tax liability must own part or all of the fund. Such investors are known as tax equity investors. Roughly twenty such investors are currently active in the renewable space. While this number may appear large, the amount of tax equity remains limited, as are the number of alternative options for finance. This means tax equity investors can demand a high rate of return.
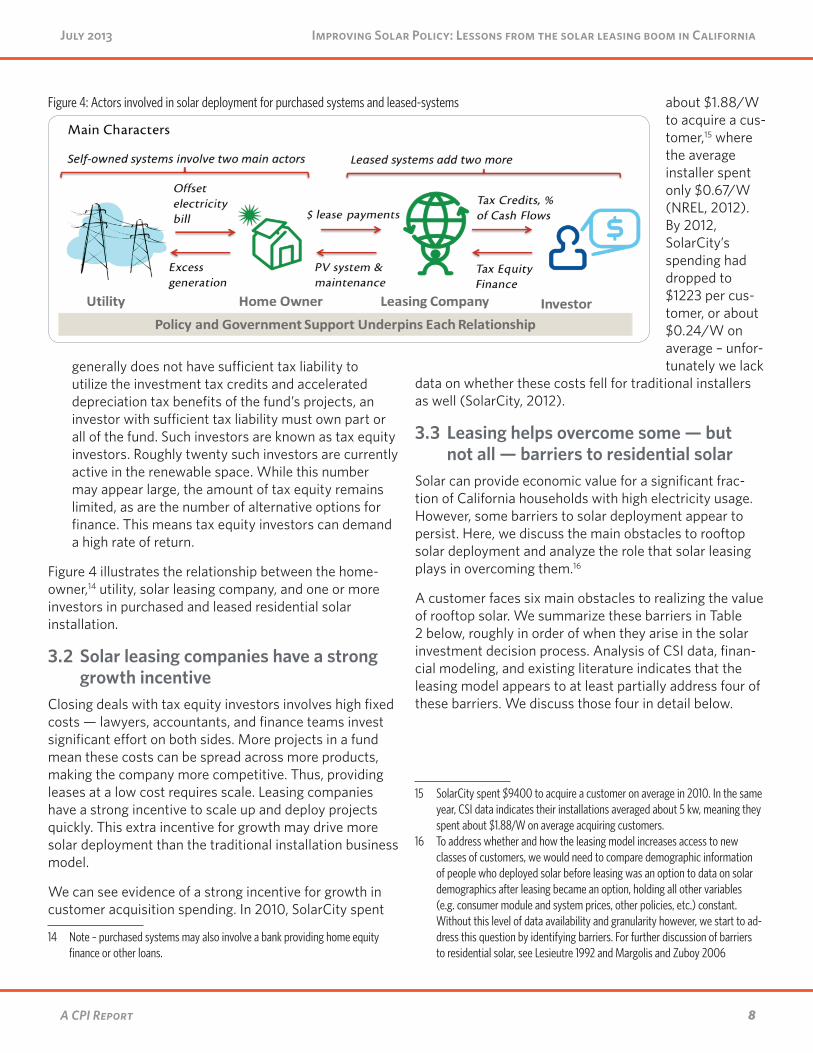
Figure 4 illustrates the relationship between the home-owner,14 utility, solar leasing company, and one or more investors in purchased and leased residential solar installation.
3.2 Solar leasing companies have a strong growth incentive
Closing deals with tax equity investors involves high fixed costs — lawyers, accountants, and finance teams invest significant effort on both sides. More projects in a fund mean these costs can be spread across more products, making the company more competitive. Thus, providing leases at a low cost requires scale. Leasing companies have a strong incentive to scale up and deploy projects quickly. This extra incentive for growth may drive more solar deployment than the traditional installation business model.
We can see evidence of a strong incentive for growth in customer acquisition spending. In 2010, SolarCity spent
14 Note – purchased systems may also involve a bank providing home equity finance or other loans.
about $1.88/W to acquire a cus-tomer,15 where the average installer spent only $0.67/W (NREL, 2012). By 2012, SolarCity’s spending had dropped to $1223 per cus-tomer, or about $0.24/W on average – unfor-tunately we lack
data on whether these costs fell for traditional installers as well (SolarCity, 2012).
3.3 Leasing helps overcome some — but not all — barriers to residential solar
Solar can provide economic value for a significant frac-tion of California households with high electricity usage. However, some barriers to solar deployment appear to persist. Here, we discuss the main obstacles to rooftop solar deployment and analyze the role that solar leasing plays in overcoming them.16
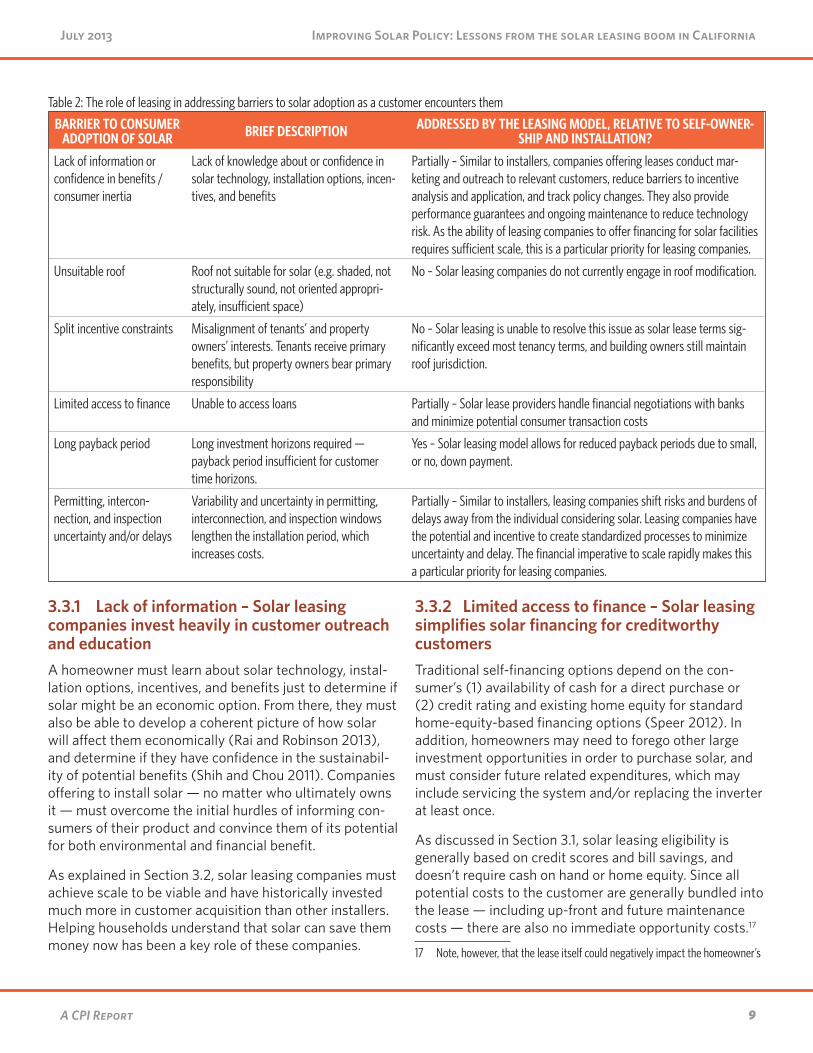
A customer faces six main obstacles to realizing the value of rooftop solar. We summarize these barriers in Table 2 below, roughly in order of when they arise in the solar investment decision process. Analysis of CSI data, finan-cial modeling, and existing literature indicates that the leasing model appears to at least partially address four of these barriers. We discuss those four in detail below.
15 SolarCity spent $9400 to acquire a customer on average in 2010. In the same year, CSI data indicates their installations averaged about 5 kw, meaning they spent about $1.88/W on average acquiring customers.
16 To address whether and how the leasing model increases access to new classes of customers, we would need to compare demographic information of people who deployed solar before leasing was an option to data on solar demographics after leasing became an option, holding all other variables (e.g. consumer module and system prices, other policies, etc.) constant. Without this level of data availability and granularity however, we start to ad-dress this question by identifying barriers. For further discussion of barriers to residential solar, see Lesieutre 1992 and Margolis and Zuboy 2006
Figure 4: Actors involved in solar deployment for purchased systems and leased-systems
9A CPI Report
Improving Solar Policy: Lessons from the solar leasing boom in CaliforniaJuly 2013
3.3.1 Lack of information – Solar leasing companies invest heavily in customer outreach and educationA homeowner must learn about solar technology, instal-lation options, incentives, and benefits just to determine if solar might be an economic option. From there, they must also be able to develop a coherent picture of how solar will affect them economically (Rai and Robinson 2013), and determine if they have confidence in the sustainabil-ity of potential benefits (Shih and Chou 2011). Companies offering to install solar — no matter who ultimately owns it — must overcome the initial hurdles of informing con-sumers of their product and convince them of its potential for both environmental and financial benefit.
As explained in Section 3.2, solar leasing companies must achieve scale to be viable and have historically invested much more in customer acquisition than other installers. Helping households understand that solar can save them money now has been a key role of these companies.
3.3.2 Limited access to finance – Solar leasing simplifies solar financing for creditworthy customersTraditional self-financing options depend on the con-sumer’s (1) availability of cash for a direct purchase or (2) credit rating and existing home equity for standard home-equity-based financing options (Speer 2012). In addition, homeowners may need to forego other large investment opportunities in order to purchase solar, and must consider future related expenditures, which may include servicing the system and/or replacing the inverter at least once.
As discussed in Section 3.1, solar leasing eligibility is generally based on credit scores and bill savings, and doesn’t require cash on hand or home equity. Since all potential costs to the customer are generally bundled into the lease — including up-front and future maintenance costs — there are also no immediate opportunity costs.17
17 Note, however, that the lease itself could negatively impact the homeowner’s
Table 2: The role of leasing in addressing barriers to solar adoption as a customer encounters them
BARRIER TO CONSUMER ADOPTION OF SOLAR BRIEF DESCRIPTION ADDRESSED BY THE LEASING MODEL, RELATIVE TO SELF-OWNER-
SHIP AND INSTALLATION?
Lack of information or confidence in benefits / consumer inertia
Lack of knowledge about or confidence in solar technology, installation options, incen-tives, and benefits
Partially – Similar to installers, companies offering leases conduct mar-keting and outreach to relevant customers, reduce barriers to incentive analysis and application, and track policy changes. They also provide performance guarantees and ongoing maintenance to reduce technology risk. As the ability of leasing companies to offer financing for solar facilities requires sufficient scale, this is a particular priority for leasing companies.
Unsuitable roof Roof not suitable for solar (e.g. shaded, not structurally sound, not oriented appropri-ately, insufficient space)
No – Solar leasing companies do not currently engage in roof modification.
Split incentive constraints Misalignment of tenants’ and property owners’ interests. Tenants receive primary benefits, but property owners bear primary responsibility
No – Solar leasing is unable to resolve this issue as solar lease terms sig-nificantly exceed most tenancy terms, and building owners still maintain roof jurisdiction.
Limited access to finance Unable to access loans Partially – Solar lease providers handle financial negotiations with banks and minimize potential consumer transaction costs
Long payback period Long investment horizons required — payback period insufficient for customer time horizons.
Yes – Solar leasing model allows for reduced payback periods due to small, or no, down payment.
Permitting, intercon-nection, and inspection uncertainty and/or delays
Variability and uncertainty in permitting, interconnection, and inspection windows lengthen the installation period, which increases costs.
Partially – Similar to installers, leasing companies shift risks and burdens of delays away from the individual considering solar. Leasing companies have the potential and incentive to create standardized processes to minimize uncertainty and delay. The financial imperative to scale rapidly makes this a particular priority for leasing companies.

10A CPI Report
Improving Solar Policy: Lessons from the solar leasing boom in CaliforniaJuly 2013
Therefore, the leasing option at least partially addresses this barrier to deployment.
3.3.3 Long payback periods – Solar leasing provides nearly instant savings for consumersWhile traditional financing generally involves a down payment, solar leases provide savings from the first month, eliminating the payback period for solar completely.
Recent research from UT-Austin’s School of Public Affairs and Engineering showed that among a sample of residen-tial PV adopters in Texas:
• Those who selected the leasing option often had higher discount rates (meaning a stronger preference for benefits now over benefits in the future) and appeared to have more cash-flow
ability to obtain further financing, an issue that is beyond the scope of this work.
constraints (i.e. less up-front cash available) than customers who opted to purchase a system.18
• 90% of adopters based their decisions off of some form of financial analysis; of these, the majority of consumers selected payback period as their metric of financial attractiveness.
Most leasing arrangements satisfy these concerns — reducing the payback time of a customer’s investment in solar from a typical 10-20 years down to zero in cases where no down payment is required. In addition, payment in regular installments is well aligned with the high discount rates and tight cash-flow constraints of some customers.
As shown in Figure 5, even for those customers who assess their options using net present value (the current
18 Rai and Sigrin 2012 interviewed 365 individuals who installed solar around Austin, Texas and calculated the discount rates that the decisions of current solar customers implied. This figure hovered around 23%. However, buyers’ discount rates were lower — ranging from 6-18% — than that of leasers, ranging from 20-35%.
Figure 5: Consumer discount rates impact decisions to lease or purchase
-$10,000
-$5,000
0
$5,000
$10,000
$15,000
$20,000
$25,000
0% 5% 10% 15% 20%
Purchased systems
Leased systems
Consumer Discount Rates
Net
Pre
sent
Val
ue
Note: The above graphic shows the net present value of solar for each financing option, relative to consumer discount rates. It shows that leasing and power purchase agreement arrangements are more favorable to customers than up-front cash purchases at discount rates exceeding 10%. Depending on the terms in each contract, loans and/or home equity-based finance may generate an NPV similar to the lease, or somewhere between the lease and the purchasing option.
11A CPI Report
Improving Solar Policy: Lessons from the solar leasing boom in CaliforniaJuly 2013
discounted value of all future costs and revenues from their solar investment) rather than payback period, leasing may be financially superior. It shows that the net present value of leasing increases as the consumer’s discount rate increases. Using CSI data to determine the net present value,19 our modeling shows that leasing can generate a positive net present value for individuals with discount rates that exceed 4%, and that it is preferable to purchasing for individuals with discount rates exceeding 10%. This is substantially lower than recent estimates on solar decision-making, which calculated an average implied discount rate around 23% for solar customers (Rai and Sigrin, 2012).20
3.3.4 Permitting, inspection, and interconnection delays – Solar leasing companies bear these risks at a costSeveral sources indicate that permitting, inspection, and interconnection uncertainty and delays serve as consis-tent barriers to more rapid installation.
• In 2009, the City of San Diego released a report showing that the most common single barrier to solar deployment among its over 500 survey respondents was permitting (est. 9% of responses), followed by inspections (est. 7% of responses).21
19 Using the same discount rate and system size assumptions as described in section 2.3.
20 Depending on the terms in each contract, loans and/or home equity-based finance may generate an NPV similar to the lease, or somewhere between the lease and the purchasing option.
21 Respondents could select multiple barriers in this survey.
• In 2011, SunRun estimated that local permitting and inspection costs added up to an additional fifty cents per installed watt, mostly due to wide variations in process not related to safety; ‘excessive’ fees; and ‘slow, manual submittal and inspection processes.’
While numerous initiatives advanced this issue in recent years, many current installers report that permitting, inspection, and interconnection delays continue to pose barriers across the areas where they operate.22
In addition to the direct costs, variability or uncertainty in regulatory or permitting timing can impact the growth of the leasing model by changing the rate at which existing customers generate referrals (SolarCity 2012), poten-tially increasing costs by depressing the rate of solar installations.
The leasing model partially addresses this barrier, as it shifts risks and burdens of delays away from the customer and onto the leasing company. The leasing companies have the scale, resources, and incentive to more effec-tively manage these processes than individuals. However, leasing companies fold the cost of managing these risks into the prices they charge their customers.
22 The SunShot Initiative has helped direct attention and funding to address this issue, supporting review of best practices and the creation of a National Solar Permit Database. The California governor’s office has generated a Solar Permitting Guidebook to help improve permit review and approval, and IREC (2012b) has produced a report reviewing examples and best practices in overcoming permitting, inspection, and interconnection challenges.
12A CPI Report
Improving Solar Policy: Lessons from the solar leasing boom in CaliforniaJuly 2013
4. How Policy affects Costs to TaxpayersIn this section, we explore how prices are set in both purchased and leased rooftop PV markets and how policy affects prices in each market. We also seek to understand the impact that leasing has had on taxpayer costs (through claims for federal tax incentives, which are based on system prices; see Box 2 for more detail). Through financial modeling and empirical testing of the relationships between prices from the California Solar Initiative and policy for both purchased and leased systems, we find:
• The cost of federal investment tax incentives (the ITC and MACRS) depends on the market value of leased systems, which is based on cost, bill savings, and state incentives. Leasing companies price portfolios of solar leases to reflect the value of lease revenues and state incentives. Since the federal government provides tax incentives based on these prices,23 state and utility policies affect the cost to taxpayers. Further, this provides leasing companies an additional incentive to identify the customers who will save the most on their monthly utility bill — higher savings translate into higher lease payments, which can also lead to a more generous federal tax incentive.
• Leased systems initially cost taxpayers more than purchased systems, but not anymore. Reported prices for leased systems were higher
23 Federal investment tax incentives can be claimed on the basis of project’s fair market value - see Box 2 for more detail.
than purchased systems (see Box 2) in the early days of leasing when incentives were more generous. This resulted in higher costs to taxpayers from leasing early on, possibly as lease prices were more sensitive to incentive levels at that time than purchased prices. As the leasing market has matured, this reported price difference has disappeared. This suggests the leasing market has become more competitive, though changes in the ways leasing companies report prices for tax incentive claims have also played a role.
• Declining state incentives have likely helped reduce taxpayer costs for both types of systems. Prices for both leased and purchased systems were found to decrease as the level of the CSI incentive and bill savings decreased, con-trolling for other factors such as time trends and module costs. Given this relationship, our results suggest that the incentives were an important price driver themselves — not that they merely declined at the same time. In most cases the effect is stronger for leased systems, although this no longer appears to be the case for incentive impacts on prices.
To explain how we arrived at these results, we’ll first describe how prices for purchased and leased systems are set by the residential solar market. Second, we’ll discuss how policy affects both prices, and finally, we’ll review
the results of a regres-sion analysis we used to test our understanding of policy-price relation-ships for both leased and purchased systems. We present an overview of our findings and critical assumptions here; we encourage readers to review the appendix for greater detail on theory, methods, data tables, and assumptions.
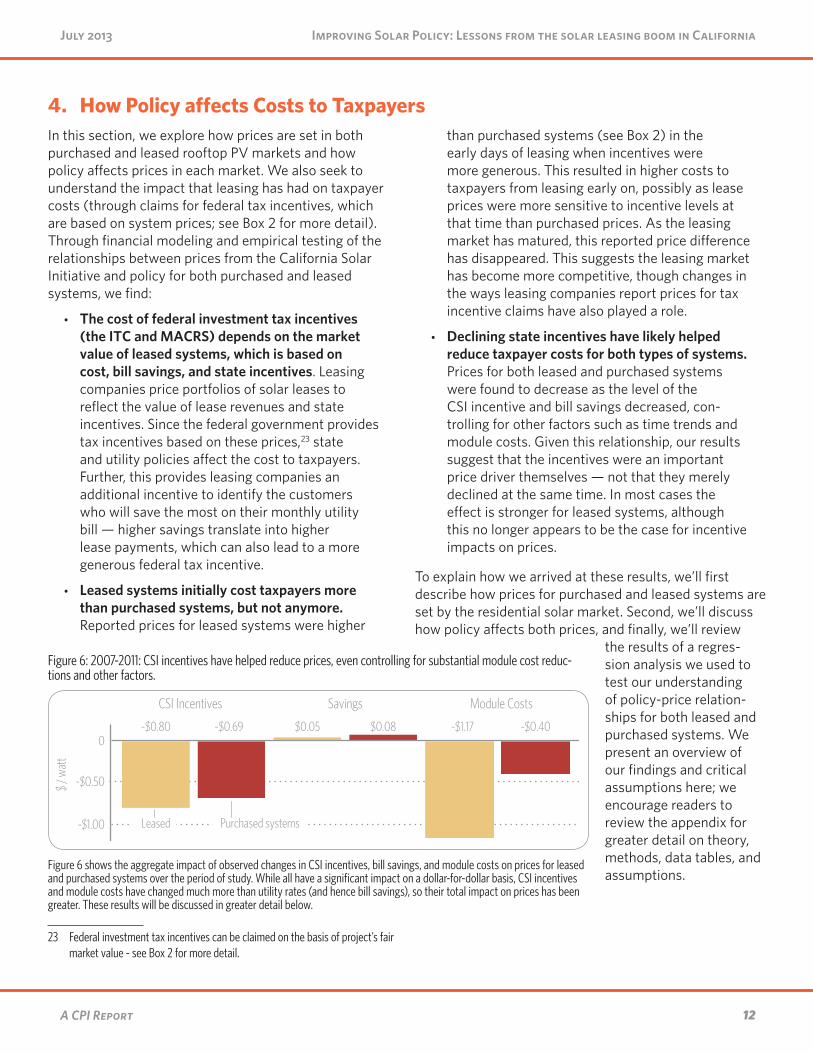
Figure 6: 2007-2011: CSI incentives have helped reduce prices, even controlling for substantial module cost reduc-tions and other factors.
-$1.00
-$0.50
0-$0.80 -$0.69 $0.05 $0.08 -$1.17 -$0.40
CSI Incentives Savings Module Costs
$ / w
att
Leased Purchased systems
Figure 6 shows the aggregate impact of observed changes in CSI incentives, bill savings, and module costs on prices for leased and purchased systems over the period of study. While all have a significant impact on a dollar-for-dollar basis, CSI incentives and module costs have changed much more than utility rates (and hence bill savings), so their total impact on prices has been greater. These results will be discussed in greater detail below.

13A CPI Report
Improving Solar Policy: Lessons from the solar leasing boom in CaliforniaJuly 2013
4.1 Prices for solar are driven by value and cost
Our analysis indicates pricing for both purchased and leased systems is currently driven by the value of tax incentives, bill savings, and the cost of solar installation. Despite the fact that they depend on the same things, prices are set differently for each market. In the leasing market, they represent the price investors paid to own the leased systems, while in the purchased-system market they simply represent sale prices. Since investors and pur-chasers have different concerns and think about invest-ments differently, prices are set differently. This section describes how this works, and more detail can be found in Appendix B.
4.1.1 Prices for purchased systems In a competitive market, prices for purchased systems would be determined primarily by the costs required to install the system. However, the market for rooftop PV is still relatively new and significant information barriers exist. A homeowner can obtain multiple quotes from installation companies (installers), but since prices are roof-specific, homeowners cannot observe a “market” price for their home. Further, current California policy pro-vides enough incentives to consumers that systems can be sold above cost and still provide long-term savings to the buyer.24 As such, some installers may be able to base their pricing (at least to some extent) on the system’s value to the customer, charging higher prices to owners who expect to save more money even if their systems are no more expensive.
If prices are fully competitive, or “cost-based,” they will be unaffected by incentives and utility rates, and driven solely by the cost of installation. At the other extreme, if system prices are entirely “value-based,” they will be driven solely by incentives and utility rates — which affect the system’s profitability to the consumer — and not by costs. For purchased systems (as well as leased systems, as explained in Section 4.2), we expect that pricing is driven by both the value to consumers as well as costs.
4.1.2 Prices for leased systemsPrices for leased systems are more complicated. Leasing companies generally price the lease to deliver
24 Assuming net energy metering continues to apply, and that rates either stay roughly in the same range or increase over the system’s lifetime.
a given level of bill savings to the homeowner, often in the 10-20% range.25 This suggests that lease pricing is primarily value-based. However, costs still matter: If the leasing company cannot provide savings profitably, they will usually not offer a contract. As such, lower costs of installation and service enable leases that would not oth-erwise occur because higher costs would make the lease unprofitable.
Leasing companies collect many projects, package them into a fund, and sell the fund to one or more investors (as described in Section 3). The price to the investor26 depends on the value of the leases and incentives the investors receive when they invest in the fund. The inves-tor price is thereby tied through the leases to some com-bination of system value and system cost, as discussed above.
Since a significant fraction of the value of these funds is in the tax benefits that they deliver to the investor, solar leasing companies generally need to attract invest-ment from a limited pool of tax equity investors who can demand relatively high rates of return. Consistent with a number of recent studies, our modeling suggests that tax equity finance significantly increases project costs.27
As explained in Box 1, we believe the available data on prices of leased systems largely represents the prices paid by investors. These prices generally form the basis for tax credit claims. Where we discuss leases, we therefore focus on investor prices, not the prices a homeowner pays for their lease. As discussed above, lease prices generally target monthly bill savings, and as such are driven largely by the savings generated from Net Energy Metering and California utility rates.
25 Some developers will still offer a lease, but will inform the customer that savings won’t be possible. In this case, the lease is presumably based on the cost of service rather than targeted bill savings.
26 In this section, we use “investors” to refer to those parties that have an investment stake in a portfolio of leases. This includes a tax equity investor; (usually) the developer; and (occasionally) any other party that might purchase an ownership share of the portfolio.
27 See for example, BPC 2011, Bloomberg New Energy Finance 2011, CPI 2012. Taxable cash grants or refundable tax credits are able to provide the same benefits to projects at a lower cost to government compared to nonrefund-able tax credits (CPI 2012). While other considerations will undoubtedly play a factor in the design of new and/or modified solar incentives — including the overall costs allocated to solar programs — we suggest that alternatives to federal tax incentives be a fundamental element of a shift in solar incen-tives.

14A CPI Report
Improving Solar Policy: Lessons from the solar leasing boom in CaliforniaJuly 2013
4.2 The effect of policy on pricesOur analysis (detailed in Appendix B) suggests policy affects prices for both purchased and leased systems. However, the mechanism by which this occurs is different for each type of system.
For purchased systems, policy affects prices when it raises system value to consumers and when the market isn’t competitive enough to force full cost-based pricing. The higher the up-front incentives, the more a consumer can afford to pay and still benefit from a positive return on investment. Higher utility rates, and hence greater potential bill savings, have a similar effect. However, in a fully competitive market, consumers would still be able to find the lowest price, which would be based on the cost of installing the system with some sustainable level of profit; incentives and bill savings, set by policy, would not impact the cost to the customer. If the market were fully compet-itive, consumers would purchase systems from the low-est-cost installers, and capture the benefits themselves.
For leased systems, the effect of policy on investor prices is more direct because of the way the market functions. The value of a lease portfolio is determined by the value of the leases themselves, plus incentives the projects receive. Thus, incentives that increase the cash flow from a leased system increase the value of that system and the price an investor will be willing to pay for it. So, we expect that an increase in up-front incentives will lead directly to an increase in investor prices. Similarly, we expect that an increase in utility rates would also increase investor prices to the extent that it increases lease payments (in other words, to the extent that those leases are priced on
a value rather than cost basis). Not all leasing companies set lease payments the same way, and not all leasing companies (or even funds created by a single leasing company) distribute incentives and lease payments between investors uniformly. Our analysis therefore seeks to measure how savings, incentives, and module cost affect price in an “average” situation.
The difference in price formation for leased and pur-chased systems has driven differences in reported prices in the past, as shown in Figure 7 and elaborated upon in Box 1. From 2009 through 2010, while CSI incentives had yet to decline, the reported prices of leased systems was observably higher than that of purchased systems. However, over time this difference has disappeared. This is likely due to changes in price reporting practices, increased competition among leasing companies, and the declining importance of CSI incentives in system valuations.
Figure 7: CSI reported prices for purchased and leased solar systems have converged
$4
$6
$8
$10
2007 2008 2009 2010 2011 2012 2013
$ / w
att
Leased
Purchased systems

15A CPI Report
Improving Solar Policy: Lessons from the solar leasing boom in CaliforniaJuly 2013
4.3 Empirical assessment of price driversIn order to measure the degree to which prices are affected by costs, savings, and incentives, we use a fixed effects regression model. We have installation-level data from the California Solar Initiative, which provides infor-mation on price, system size, and installer. We combine this with data on module costs, and utility rates. We also control for time trends using quarterly fixed effects. The utility rate data are used to calculate the net present value of 20 year savings per watt, based on the assumption that systems are sized to offset electricity use in the top
two tiers for Southern California Edison customers and top three for Pacific Gas & Electric customers.28 For more detail on our data and methodology, see Appendix B.
We estimate the per-watt impacts of CSI, estimated bill savings, and module costs on prices separately for pur-chased and leased systems. We find that these relation-ships have changed over time, and as such, report results for two different time periods: 2007-10 and 2011-12.
28 While these assumptions affect the magnitude of our coefficients, they do not affect the qualitative results.
Box 2 – Interpreting prices reported in the California Solar Initiative database
The reported price of solar in California has generally been higher for leased systems than purchased systems. However, it is important to note that prices are not the same as costs and that leased system prices are in many cases reported differently than purchased system prices.
System prices reported to the CSI database are not necessarily the same as prices reported to the IRS or Treasury when these companies apply for federal incentives. Unfortunately, federal tax incentive application data are not public, so we are not able to compare the two. Reporting practices vary by installer. Integrated installers generally report prices based on the net present value of income streams attributable to the system, while non-integrated companies may report the purchase price from the installer. We assume that in either case, these numbers are related to (though not identical to) tax credit claims, enabling our statistical analysis. Treasury guidance allows the tax basis for leased systems to be claimed in three different ways, but our research suggests that claims are generally based on the “fair market value” of the systems as established in the market for investment in bundles of leases (see Appendix C for more detail).
Leased systems and purchased systems are different products. As discussed in section 3, leasing generally offers a package of services — from financing to installation and maintenance — instead of just up-front hardware installation. Thus, purchased and leased system prices should not necessarily be directly comparable.
Finally, the data reporting practices among companies offering leases appear to differ from that of purchased systems in the CSI database. Instead of reporting the “price” of an individual installation, they often report the average price per watt of all systems in a given fund multiplied by the installation size of the installation reported to the database. This can easily be seen by observing the large clusters of projects with exactly the same per watt prices in the CSI database. Moreover, how developers arrive at the “price” of a leased system, whether of a fund or an individual installation, likely varies, and there is clear indication that reporting practices changed for at least one developer in 2012, resulting in a change in reported price due solely to reporting practices. In our analysis, we have dropped 2012 data from this developer from our dataset to ensure that the change in reporting practices does not confound our results.
The numbers reported in the database for leased systems can still be used — the reported price appears to be a function of the fair market value, and therefore the lease price, of the system. For that reason, we believe changes in reported prices are a good indicator of changes in lease rates. Thus, while we don’t compare prices between leased systems and purchased systems — as they are different figures — we can separately compare the sensitivity of leased prices and purchased prices to incentive changes.

16A CPI Report
Improving Solar Policy: Lessons from the solar leasing boom in CaliforniaJuly 2013
Figure 8 presents results for purchased systems. Controlling for other factors, a one dollar reduction in CSI was associated with a 71 cent reduction in system prices from 2007-2010. However, in 2011-2012, this effect was smaller: a one dollar reduction in CSI reduced prices by only 30 cents. Savings have gone from having a small impact on price to having no detectable impact. As noted above, our savings variable is only an approximation, since a number of assumptions were employed in cal-culating it (see Appendix C for details). Our bill savings calculation may be overestimating savings, which would mean we are underestimating the dollar-on-dollar impact of bill-savings on prices.29 Module cost has also become a less important determinant of prices over time. Module prices have fallen faster than other costs if solar instal-lation and therefore constitute a smaller share of total system cost today than they did a few years ago. This may explain our results, and we caution that our findings do not necessarily suggest that total costs have become a less important determinant of price.
We see similar impacts for leased systems in Figure 9. Initially, CSI incentives and module costs were roughly
29 We assume systems are optimally sized. If they are actually oversized, we are overestimating savings and hence underestimating their per dollar effect on prices. If they are actually undersized, we are underestimating savings and overestimating the per dollar effect on prices.
equally important in determining leased system prices. More recently, both are less important than they were initially, but module costs and savings matter more than CSI, which no longer appears to be a statistically or eco-nomically important price determinant. The CSI finding may be an artifact of different reporting practices — some companies likely reported cost-based numbers, while others reported income-based numbers (see box 1). The latter more likely correspond to sale prices to investors.
The declining importance of incentives for prices in both markets (and of bill savings in the purchased market) sug-gests that pricing is becoming less value-based and more cost-based. This trend is likely either because incentives are no longer generous enough to make excess profits possible or because the market is becoming more com-petitive (or, likely, both). This may be especially true for leasing, which is a younger market. Since incentives have come down substantially, it may be that in order to ensure savings, developers are now setting prices closer to cost. The fact that there are many more companies offering leases than there were in the early days suggests compe-tition has probably become more intense in that market.
Figure 8: Price drivers for purchased systems
-$0.20 0 $0.20 $0.40 $0.60 $0.80 $1
Module Price
Expected Gross Savings
CSI Incentives
2011-2012
2007-2010
Impact per Watt
Figure 9: Price drivers for leased systems
0 $0.20 $0.40 $0.60 $0.80 $1
Module Price
Expected Gross Savings
CSI Incentives
2011-2012
2007-2010
Impact per Watt

17A CPI Report
Improving Solar Policy: Lessons from the solar leasing boom in CaliforniaJuly 2013
4.4 State incentive programs and utility rates can affect costs for the federal government
As discussed in Box 2, the reported price roughly corre-sponds to the tax basis reported to the U.S. Treasury and IRS, and hence reflects the cost to the federal govern-ment, either through grants allocated through Treasury or through uncollected revenue from the IRS. Given that California state incentives and the availability of bill savings for customers influence reported prices (as demonstrated in Sections 4.2 and 4.3), it is likely that these factors also impact federal incentives awarded to those projects. Declining incentives from CSI likely reduced the cost of federal incentives, while higher federal tax credits and grants may have been delivered to proj-ects with greater bill savings, controlling for other factors. This means state incentive programs and utility rates can affect costs for the federal government, especially for leased systems.
Thus, the leasing model transforms an ostensibly cost-based incentive into one whose value depends on the amount of savings the project generates. As a result, leasing companies target consumers with high electricity bills. In California, the most valuable customers are those with high energy use, given the tiered electricity rate structure. While these high energy users enjoy the largest bill savings from solar, they are also valuable sources of utility revenue. Utilities in California have initiated efforts to modify their rate structure for residential customers, which could have implications for the distribution of valu-able solar customers.

18A CPI Report
Improving Solar Policy: Lessons from the solar leasing boom in CaliforniaJuly 2013
5. Policy has facilitated a shift toward solar leases Over the last five years, California has seen sustained growth in new residential solar installations — and a marked shift to solar leasing — from 7% leased in 2007 to 75% leased in 2012. In this section, we discuss evi-dence from statistical analysis of the California Solar Initiative data regarding potential economic or policy drivers of the shift to leasing. We also discuss evidence about the extent to which leasing led to greater overall deployment. We find that:
The share of leasing grew as the share of total project cost covered by up-front incentives fell. While other factors played a role, smaller up-front incentives led leasing to capture a greater share of the market.
As discussed in Section 3, a solar lease provides a shorter payback period, especially when up-front costs are high. This means we expect more consumers to prefer leasing as up-front incentives are reduced. Our regression analysis confirms this hypothesis.
As the up-front California Solar Initiative incentive has declined, up front incentives have covered a smaller fraction of project costs, increasing the relative burden of financing.30 Increasingly, the bulk of project value is in the form of bill savings, meaning payback times for purchased systems are longer even if their net present value is unchanged. This increases the relative appeal of leases, as their payback period is limited or non-existent.
This relationship is easy to see in the raw data, but to show that it cannot be explained by other factors, we need to control for changes in savings, module
30 As seen in Figure 1.
prices, and underlying time trends. After doing so, our analysis suggests that the decline in the CSI that saw its share of up-front costs fall from over 20% in 2008 to less than 5% in 2012 accounts for a 9% shift in the share of new deployment from leasing. The remainder is explained by time trends, which likely reflect marketing and new industry growth, and changes in costs and savings. In other words, we expect leasing would still account for the majority of new deployment if the CSI had remained constant, but somewhat more customers would be buying systems. (See Appendix B for more details on this analysis.)
Here is an example to show how incentive timing can affect the decision to buy versus lease. We estimate that the net present value of bill savings from solar is roughly $3.45 per watt, on average. Our results suggest that a policy design that reduced consumers bill savings by $1 per watt and shifting to an up-front payment would reduce the lease share of new deployment from around 75% to around 30%. Two effects combine to reach this result — monthly savings offered by leasing companies would be smaller, and the cost of purchasing a system outright would be smaller.
While we can see that leasing, driven in part by the decline in CSI incentives, has gained significant market share, we cannot currently estimate how much new deployment would have happened in a world without leasing. However, Section 3 shows that leasing companies
Figure 10: Share of new deployment from leasing increased as the share of up-front costs covered by CSI declined.
0
10%
20%
30%
40%
50%
60%
70%
80%
2007 2008 2009 2010 2011 2012
Share of New Deployment
Share of Up-front Cost Covered by CSI

19A CPI Report
Improving Solar Policy: Lessons from the solar leasing boom in CaliforniaJuly 2013
address critical barriers for consumer adoption of solar, and Section 4 shows that they respond quickly to chang-ing market conditions and incentives. In addition, it is highly unlikely that all customers who chose to lease would have purchased were leasing unavailable, even with more up-front government support. Altogether, this suggests leasing has made solar more appealing to customers and likely led to more deployment than would have occurred otherwise.
20A CPI Report
Improving Solar Policy: Lessons from the solar leasing boom in CaliforniaJuly 2013
6. Conclusions, Recommendations, and Areas for Future ResearchAs policymakers across the country and elsewhere look to spur further growth of solar PV in a constrained budget environment, the California experience — and in particu-lar, the rise of leasing — may hold lessons for improving the effectiveness of solar policy generally.
Based on our analysis and conversations with industry and regulatory stakeholders, we have arrived at four key conclusions about the solar leasing model:
1. For consumers, a lease transforms a complex home investment into a money-saving service.
2. Leased systems initially cost taxpayers more than purchased systems, but not anymore.
3. Declining state incentives have likely helped reduce taxpayer costs for both leased and purchased systems.
4. Decreasing up-front incentives have, in part, driven the increase in leasing.
Based on these findings, we make the following recommendations:
We have found no reason to prohibit solar leasing. While solar leasing once cost federal taxpayers more than purchased systems, we no longer find this to be the case. Leasing companies translate a diverse set of policies and processes into a relatively simple product for households, leaving less for individuals to manage. However, not all states allow leasing. By providing more ways for custom-ers to finance rooftop solar and minimize their transaction costs, states that permit leasing may enable greater solar deployment.
Use incentives that decline with deployment to help bring down prices. Our analysis suggests that incen-tives that provide pressure on solar installers and leasing companies to identify and implement cost reductions help lower prices for solar customers.
• Take steps to reduce the cost of leasing to taxpayers and customers.
• Increase availability and comparability of public data on solar lease and purchase pricing to enhance market competition and reduce costs. Maintaining a publicly-accessible platform to compare solar pricing data — for leases and purchases — would facilitate a competitive solar
market environment and enable more robust research and analysis of trends.
• Continue to address permitting, interconnec-tion, and inspection process barriers to reduce financing and installation costs. Each of these offers an opportunity to streamline projects and reduce costs.
• Minimize or eliminate the need for expensive tax equity to reduce financing costs. Solar leasing companies could reduce their financing costs and provide leases to more customers if they did not have to rely on costly tax equity finance to realize the benefits of federal incentives.31
Finally, we note several further issues that may impede efficient deployment of rooftop solar in California, which we also suggest as opportunities for future analysis: California’s tiered rate structure (along with Net Energy Metering) offers much greater solar PV benefits to high energy consumers; solar generation may not currently be sited in areas it most benefits the grid; and there are unmeasured risks that leasing may present to consum-ers and investors. These risks include changes in retail electricity rates being considered by the California Public Utilities Commission, changes to federal tax incentives, and lease portfolio performance. Addressing each of these three issues would open opportunities to achieve greater deployment while encouraging cost and price reductions to government and consumers.
Ultimately, policy can and should support the expansion of renewable generation using mechanisms that fit the needs of consumers. Solar leasing has filled and will con-tinue to fill a gap — converting long-term energy savings from a relatively large investment into a product that provides immediate financial benefits. However, leasing is likely not the only way in which business and/or policy innovation can make it easier for consumers to benefit from renewable generation. For example, providing state or federal incentives directly to consumers for choosing to consume clean electricity — and expanding the renew-able options available to consumers through, for example, retail green power options — may yield similar results at lower costs. Like leasing, these approaches present ways
31 This could be done by, for example, providing federal incentives as taxable cash (CPI 2012).
21A CPI Report
Improving Solar Policy: Lessons from the solar leasing boom in CaliforniaJuly 2013
to catalyze a shift to cleaner electricity generation driven by consumer choice. We plan to study such innovative approaches in future work.

22A CPI Report
Improving Solar Policy: Lessons from the solar leasing boom in CaliforniaJuly 2013
7. ReferencesACGov (2011). “A Comparative Discussion of Utility Scale
Solar versus Distributed Solar.” Retrieved from: http://www.acgov.org/cda/planning/landuseproj-ects/documents/Distributed_vs_Utility_Scale.pdf
Ardani et al. 2012. Benchmarking Non-Hardware Balance of System (Soft) Costs for U.S. Photovoltaic Systems Using a Data-Driven Analysis from PV Installer Survey Results. http://www.nrel.gov/docs/fy13os-ti/56806.pdf
Bradford, T., Lin, J. [Prometheus Institute]. 2009. Accel-erating the Deployment of Distributed Renewable Energy through Market-Driven Policy Programs.’ http://www.slideshare.net/thinkingeurope2011/accelerating-the-deployment-of-distributed-renew-able-energy
Berkeley Law – Center for Law, Energy, and the Environ-ment. (2012 June 7). “California’s Transition to Local Renewable Energy: 12,000 MW by 2020.” Retrieved from: http://www.law.berkeley.edu/files/ccelp/CA_Transition_to_Local_Renewable_Energy.pdf
Bipartisan Policy Center. 2011 March. ‘Re-assessing Renewable Energy Subsidies – Issue Brief.’ http://bipartisanpolicy.org/sites/default/files/BPC_RE%20Issue%20Brief_3-22.pdf
Bloomberg New Energy Finance. 2012 June. ‘Reimaging US Solar Financing.’ bnef.com/WhitePapers/down-load/84
Borenstein S. 2008. “The Market Value and Cost of Solar Photovoltaic Electricity Production.” Retrieved from: http://www.ucei.berkeley.edu/PDF/csemwp176.pdf
BundesverbandSolarWirtschaft e.V. (BSW-Solar). 2012 September. Statistiche Zahlen der deutschen Solarstrombranche (Photovoltaik) http://www.solarwirtschaft.de/fileadmin/media/pdf/bsw_solar_fakten_pv.pdf
California Energy Commission (CEC). 2012. ‘Total Elec-tricity System Power.’ http://energyalmanac.ca.gov/electricity/total_system_power.html
California Governor’s Office. 2010. Clean Energy Jobs Program. http://gov.ca.gov/docs/Clean_Energy_Plan.pdf
California Legislative Info. 2006. SB1 – Chaptered Bill Text. http://www.leginfo.ca.gov/pub/05-06/bill/sen/sb_0001-0050/sb_1_bill_20060821_chaptered.html
Chadbourne and Parke. 2013. “The US Distributed Solar Market,” Project Finance Newswire, April 2013. http://www.chadbourne.com/files/Publica-tion/0878ae25-4b46-4b88-8ff3-4235eb11072d/Presentation/PublicationAttachment/857356ea-fd21-4a2a-9dcd-506f3028b3dd/project_finance_news-wire_april13.pdf
CPI. 2012. “Saving Renewables While Saving Taxpayers Money.” Retrieved from: http://climatepolicyinitia-tive.org/wp-content/uploads/2012/09/Support-ing-Renewables-while-Saving-Taxpayers-Money.pdf
CPUC (2009 August 20) “Decision Adopting Cost-Ben-efit Methodology for Distributed Generation.” Retrieved from http://docs.cpuc.ca.gov/published//FINAL_DECISION/105926.htm
CPUC (2010 March) “Introduction to the Net Energy Metering Cost Effectiveness Evaluation.” Retrieved from: http://www.cpuc.ca.gov/NR/rdonlyres/0F42385A-FDBE-4B76-9AB3-E6AD522DB862/0/nem_combined.pdf
CPUC (2012 Aug 27). “Workshop to Discuss & Refine Preliminary Questions for Residential Rate Struc-turing Rulemaking.” Retrieved from: http://www.cpuc.ca.gov/NR/rdonlyres/EE3CA9FA-4850-492B-BD8B-270D76456C2F/0/R1206013Aug27_12Work-shop.pdf
Database on State Incentives for Renewables and Efficien-cy. 2012 October. California
Incentives/Policies for Renewables & Efficiency: Net Energy Metering. http://www.dsireusa.org/incen-tives/incentive.cfm?Incentive_Code=CA02R
Drury, Miller, et al (2012). “Transformation of Southern California’s Residential Photovoltaics Market Through ThirdParty Ownership.” Retrieved from: https://financere.nrel.gov/finance/content/transfor-mation-southern-californias-residential-photovolta-ics-market-through-third-party-own

23A CPI Report
Improving Solar Policy: Lessons from the solar leasing boom in CaliforniaJuly 2013
E3. 2012 March. Technical Potential of Local Distributed Photovoltaics in California. Preliminary Assessment. http://www.cpuc.ca.gov/NR/rdonlyres/8A822C08-A56C-4674-A5D2-099E48B41160/0/LDPVPoten-tialReportMarch2012.pdf
Edison Institute. 2013 January. “Disruptive Challenges: Financial Implications and Strategic
Responses to a Changing Retail Electric Business.” Re-trieved from: http://www.eei.org/ourissues/finance/Documents/disruptivechallenges.pdf
Environment California (2011 November 9) “Building a Brighter Future: California’s Progress Toward a Million Solar Roofs.” http://www.environmentcali-fornia.org/reports/cae/building-brighter-future-cal-ifornia%E2%80%99s-progress-toward-million-so-lar-roofs
Farhar, B.C., and Coburn, T.C. 2006 December. ‘A New Market Paradigm for Zero-Energy Homes: The Comparative San Diego Case Study.” http://www.nrel.gov/docs/fy07osti/38304-01.pdf
Feldman et al. 2012 November. “Photovoltaic (PV) Pricing Trends: Historical, Recent, and Near-Term Projec-tions.” Retrieved from: http://www.nrel.gov/docs/fy13osti/56776.pdf
Gillingham, K., Sweeney, J. 2010 January. ‘Market Failure and the Structure of Externalities.’ http://www.yale.edu/gillingham/Market%20Failure%20and%20the%20Structure%20of%20Externalities.pdf
GTM Research. 2012 September 10. ‘US Solar Market Spikes with 742MW in Solar Installations in Q2 2012.’ http://www.greentechmedia.com/articles/read/U.S.-Solar-Market-Spikes-with-742-MW-in-Solar-Installations-in-Q2-2012
Himmelman, J. 2012 August 9. ‘The Secret to Solar Power.’ New York Times Magazine: http://www.nytimes.com/2012/08/12/magazine/the-secret-to-solar-power.html?_r=5&pagewanted=all&
Hoen, B., Wiser, R.H, Thayer, M, and Cappers, P. 2012 March. ’Residential Photovoltaic Energy Systems in California: The Effect on Home Sales Prices.’ http://emp.lbl.gov/publications/residen-tial-photovoltaic-energy-systems-california-ef-fect-home-sales-prices
Interstate Renewable Energy Council [Wiedman, J.F., Schroeder, E., Beach, T.R.] (2012a) “12,000 MW of Renewable Distributed Generation by 2020 – Bene-fits, Costs and Policy Implications.” Retrieved from: http://www.irecusa.org/wp-content/uploads/Final-12-GW-report-7.31.12.pdf
Interstate Renewable Energy Council [Stanfield, S.C., Schroeder, Culley, T.B. ] (2012b) Sharing Success: Emerging Approaches to Efficient Rooftop Solar Permitting. http://www.irecusa.org/wp-content/uploads/FINAL-Sharing-Success-w-cover-revised-fi-nal052012.pdf
Itron. 2010a January. “Impacts of Distributed Genera-tion – Final Report prepared for CA Public Utilities Commission Energy Division Staff.” Retrieved from: http://www.cpuc.ca.gov/NR/rdonlyres/750FD78D-9E2B-4837-A81A-6146A994CD62/0/Impactsof-DistributedGenerationReport_2010.pdf
Itron. 2010b June. CPUC California Solar Initiative – 2009 Impact Evaluation. http://www.cpuc.ca.gov/NR/rdonlyres/70B3F447-ADF5-48D3-8DF0-5DCE0E9DD09E/0/2009_CSI_Impact_Report.pdf
LeSieutre, A. 1992. ‘Residential Solar Energy Use: bar-riers and incentives in a historical perspective.’ http://ir.library.oregonstate.edu/xmlui/bitstream/handle/1957/31287/LesieutreAimeeL.pdf?se-quence=1
Lovins, A. et al. (2002). Small is Profitable: The Hidden Economic Benefits of Making Electrical Resources the Right Size. Rocky Mountain Institute, Snowmass, Colorado.
Lopez, A., Roberts, B., Heimiller, D., Blair, N., Porro, G. 2012 July. ‘U.S. Renewable Energy Technical Potentials: A GIS-Based Analysis.’ http://www.nrel.gov/docs/fy12osti/51946.pdf
Margolis, R. Zuboy, J. 2006. ‘Nontechnical Barriers to Solar Energy Use: Review of Recent Literature.’ http://www.nrel.gov/docs/fy07osti/40116.pdf
Navigant. (2006). “Distributed Generation and Dis-tribution Planning: An Economic Analysis for the Massachusetts DG Collaborative.” Retrieved from: http://sites.energetics.com/madri/pdfs/cum-mings_020106_2.pdf
24A CPI Report
Improving Solar Policy: Lessons from the solar leasing boom in CaliforniaJuly 2013
Pepermans, G. et al (2005). “Distributed generation – definition, benefits, and issues.’ Retrieved from: http://www.kuleuven.be/ei/Public/publications/EIWP05-03.pdf
Rai, V. and Sigrin, B. 2013 January. Diffusion of environ-mentally-friendly energy technologies: buy versus lease differences in residential PV markets. http://iopscience.iop.org/1748-9326/8/1/014022/pdf/1748-9326_8_1_014022.pdf
Rai, V. and Sigrin, B. 2012 “Economics of Individual Decision-Making: Buy vs. Lease Differences in the Adoption of Residential Solar.” Retrieved from: http://www.usaee.org/usaee2012/submissions/OnlineProceedings/120907,%20Economics%20of%20Decision-Making%20in%20Residential%20PV,%20Rai%20&%20Sigrin,%20USAEE,%20Nov-12.pdf
Rai, V. and Robinson, S.A. 2013. ‘Effective information channels for reducing costs of environmental-ly-friendly technologies: evidence from residential PV markets.’ http://iopscience.iop.org/1748-9326/8/1/014044
Rastler, D, EPRI Project Manager (2004 December). “Economic Costs and Benefits of Distributed Energy Resources.” Retrieved from: http://www.localpower.org/documents/reporto_epri_costandbendg.pdf [prepared by Energy and Environmental Economics, Inc. in SF!]
Rawson, M. (2004 July). “Distributed Generation Costs and Benefits Issue Paper.” Staff Paper from the Public Interest Energy Research Division of the CEC retrieved from: http://www.energy.ca.gov/papers/2004-08-30_RAWSON.PDF
San Diego, the City of. 2009 March. ‘Solar Survey. A Collaboration between the City of San Diego and the California Center for Sustainable Energy Funded Through the U.S. Department of Energy’s Solar America Cities Partnership.’ http://www.sandiego.gov/environmental-services/sustainable/pd-f/090925SOLARCITYSURVEYREPORT.pdf
SolarCity. 2012 October. ‘Form S-1 Registration State-ment.’ http://www.sec.gov/Archives/edgar/data/1408356/000119312512416770/d229977ds1.htm
Schwartz, L. Public Utility Commission Staff. (2005 February) “Distributed Generation in Oregon – Over-view, Regulatory Barriers and Recommendations.” Retrieved from: http://cms.oregon.gov/puc/elec-tric_gas/dg_report.pdf
Sherlock, M.F. 2011 May. ‘Energy Tax Policy: Historical Perspectives on Current Status of Energy Tax Expen-ditures.’ http://www.leahy.senate.gov/imo/media/doc/R41227EnergyLegReport.pdf
Sherwood, L. (2012 August). “U.S. Solar Market Trends 2011.” Retrieved from: http://www.irecusa.org/wp-content/uploads/IRECSolarMar-ketTrends-2012-web.pdf
Shih, L.H., and T.Y. Chou, 2011. Customer Concerns about Uncertainty and Willingness to Pay in Leasing Solar Power Systems. International Journal of Environmen-tal Science and Technology, Vol. 8, No. 3, pp 523-532. http://www.bioline.org.br/pdf?st11048
Speer, B. 2012 October. “Residential Solar Photovoltaics: Comparison of Financing Benefits, Innovations, and Options.” http://www.nrel.gov/docs/fy13osti/51644.pdf
Speer, B., Mendelsohn, M., Cory, K. 2010 February. ‘Insuring Solar Photovoltaics: Challenges and Pos-sible Solutions.’ http://www.nrel.gov/docs/fy10os-ti/46932.pdf
Sunrun. 2011 January. ‘The Impact of Local Permitting on the Cost of Solar Power.’ http://www.sunrunhome.com/solar-lease/cost-of-solar/local-permitting/
Tweedie, A. and Doris, E. 2011 July. “Comparing Ger-many’s and California’s Interconnection Processes for PV systems.” Retrieved from: http://www.nrel.gov/docs/fy11osti/51814.pdf [Literature review on barriers to
US DOE. 2007 Februrary. “The Potential Benefits of Distributed Generation and Rate-Related Issues That May Impede their Expansion - A study pursuant to Section 1817 of the Energy Policy Act of 2005.” Retrieved from: http://www.ferc.gov/legal/fed-sta/exp-study.pdf
US DOE. 2011 January. “Solar Powering Your Community - A Guide for Local Governments.’ Retrieved from: http://www.nrel.gov/docs/fy11osti/47692.pdf

25A CPI Report
Improving Solar Policy: Lessons from the solar leasing boom in CaliforniaJuly 2013
US PREF (2012). ‘Paid in Full: An Analysis of the Return to the Federal Taxpayer for the Internal Revenue Code Section 48 Solar Energy Investment Tax Credit.’ http://www.uspref.org/images/docs/SC_ITC-Pay-back_July_12_2012.pdf
VoteSolar. 2012 July. ‘Survey of Solar Permitting Practices in Pennsylvania Municipalities.’ http://votesolar.org/wp-content/uploads/2012/07/PA_Project-Per-mit-Report_Final_July2012.pdf
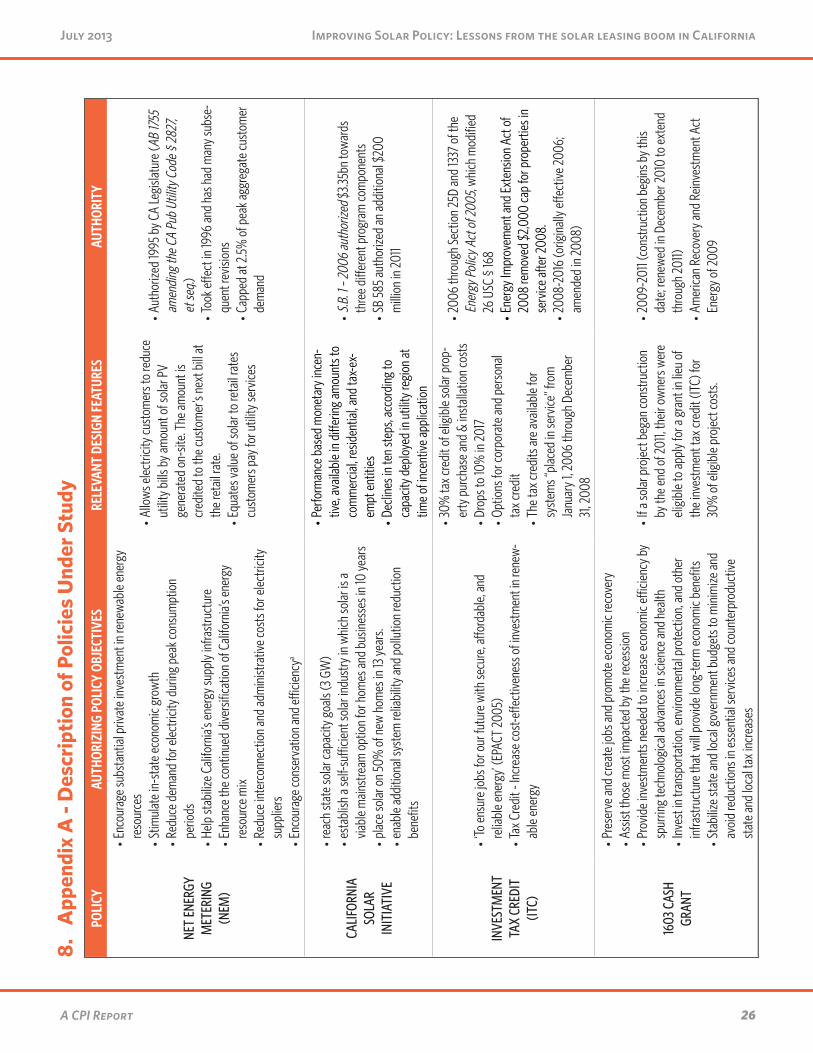
26A CPI Report
Improving Solar Policy: Lessons from the solar leasing boom in CaliforniaJuly 2013
8. A
ppen
dix
A -
Des
crip
tion
of P
olic
ies
Und
er S
tudy
PO
LICY
AUTH
ORIZ
ING
POLI
CY O
BJEC
TIVE
S R
ELEV
ANT
DESI
GN FE
ATUR
ESAU
THOR
ITY
NET
ENER
GY
MET
ERIN
G (N
EM)
•Enc
oura
ge su
bsta
ntial
priv
ate i
nves
tmen
t in
rene
wab
le en
ergy
re
sour
ces
•Stim
ulat
e in-
stat
e eco
nom
ic gr
owth
•Red
uce d
eman
d fo
r elec
tricit
y dur
ing
peak
cons
umpt
ion
perio
ds •H
elp st
abiliz
e Cali
forn
ia’s e
nerg
y sup
ply i
nfra
stru
ctur
e •E
nhan
ce th
e con
tinue
d di
vers
ifica
tion
of C
alifo
rnia’
s ene
rgy
reso
urce
mix
•Red
uce i
nter
conn
ectio
n an
d ad
min
istra
tive c
osts
for e
lectri
city
supp
liers
•Enc
oura
ge co
nser
vatio
n an
d effi
cienc
ya
•Allo
ws el
ectri
city c
usto
mer
s to
redu
ce
utilit
y bills
by a
mou
nt o
f sol
ar P
V ge
nera
ted
on-s
ite. T
he am
ount
is
cred
ited
to th
e cus
tom
er’s
next
bill
at
the r
etail
rate
. •E
quat
es va
lue o
f sol
ar to
reta
il rat
es
cust
omer
s pay
for u
tility
serv
ices
•Aut
horiz
ed 19
95 b
y CA
Legi
slatu
re (A
B 17
55
amen
ding
the C
A Pu
b Ut
ility C
ode §
2827
, et
seq.)
•Too
k effe
ct in
1996
and
has h
ad m
any s
ubse
-qu
ent r
evisi
ons
•Cap
ped
at 2.
5% o
f pea
k agg
rega
te cu
stom
er
dem
and
CALIF
ORNI
A SO
LAR
INIT
IATI
VE
•rea
ch st
ate s
olar
capa
city g
oals
(3 G
W)
•est
ablis
h a s
elf-s
ufficie
nt so
lar in
dust
ry in
whi
ch so
lar is
a via
ble m
ainst
ream
opt
ion
for h
omes
and
busin
esse
s in
10 ye
ars
•plac
e sol
ar o
n 50
% o
f new
hom
es in
13 ye
ars.
•ena
ble a
dditi
onal
syst
em re
liabi
lity a
nd p
ollu
tion
redu
ctio
n be
nefit
s
•Per
form
ance
bas
ed m
onet
ary i
ncen
-tiv
e, av
ailab
le in
diff
erin
g am
ount
s to
com
mer
cial, r
esid
entia
l, and
tax-
ex-
empt
entit
ies •D
eclin
es in
ten
step
s, ac
cord
ing
to
capa
city d
eplo
yed
in u
tility
regi
on at
tim
e of i
ncen
tive a
pplic
atio
n
•S.B
. 1 –
2006
auth
orize
d $3
.35bn
tow
ards
th
ree d
iffer
ent p
rogr
am co
mpo
nent
s •S
B 58
5 au
thor
ized
an ad
ditio
nal $
200
milli
on in
2011
INVE
STM
ENT
TAX
CRED
IT
(ITC)
•‘To
ensu
re jo
bs fo
r our
futu
re w
ith se
cure
, affo
rdab
le, an
d re
liabl
e ene
rgy’
(EPA
CT 20
05)
•Tax
Cre
dit -
Incr
ease
cost-
effec
tiven
ess o
f inv
estm
ent i
n re
new-
able
ener
gy
•30%
tax c
redi
t of e
ligib
le so
lar p
rop-
erty
pur
chas
e and
& in
stall
atio
n co
sts
•Dro
ps to
10%
in 20
17
•Opt
ions
for c
orpo
rate
and
pers
onal
tax c
redi
t •T
he ta
x cre
dits
are a
vaila
ble f
or
syst
ems “
plac
ed in
serv
ice” f
rom
Ja
nuar
y 1, 2
006
thro
ugh
Dece
mbe
r 31
, 200
8
•200
6 th
roug
h Se
ctio
n 25
D an
d 13
37 o
f the
En
ergy
Polic
y Act
of 20
05, w
hich
mod
ified
26
USC
§ 16
8 •E
nerg
y Im
prov
emen
t and
Exte
nsio
n Ac
t of
2008
rem
oved
$2,0
00 ca
p fo
r pro
perti
es in
se
rvice
afte
r 200
8. •2
008-
2016
(orig
inall
y effe
ctive
2006
; am
ende
d in
2008
)
1603
CAS
H GR
ANT
•Pre
serv
e and
crea
te jo
bs an
d pr
omot
e eco
nom
ic re
cove
ry •A
ssist
thos
e mos
t im
pact
ed b
y the
rece
ssio
n •P
rovid
e inv
estm
ents
nee
ded
to in
crea
se ec
onom
ic effi
cienc
y by
spur
ring
tech
nolo
gica
l adv
ance
s in
scien
ce an
d he
alth
•Inv
est i
n tra
nspo
rtatio
n, en
viron
men
tal p
rote
ctio
n, an
d ot
her
infra
stru
ctur
e tha
t will
prov
ide l
ong-
term
econ
omic
bene
fits
•Sta
biliz
e sta
te an
d lo
cal g
over
nmen
t bud
gets
to m
inim
ize an
d av
oid
redu
ctio
ns in
esse
ntial
serv
ices a
nd co
unte
rpro
duct
ive
stat
e and
loca
l tax
incr
ease
s
•If a
solar
pro
ject b
egan
cons
truct
ion
by th
e end
of 2
011,
their
ow
ners
wer
e eli
gibl
e to
appl
y for
a gr
ant i
n lie
u of
th
e inv
estm
ent t
ax cr
edit
(ITC)
for
30%
of e
ligib
le pr
ojec
t cos
ts.
•200
9-20
11 (c
onst
ruct
ion
begi
ns b
y thi
s da
te; r
enew
ed in
Dec
embe
r 201
0 to
exte
nd
thro
ugh
2011)
•Am
erica
n Re
cove
ry an
d Re
inve
stm
ent A
ct
Ener
gy o
f 200
9
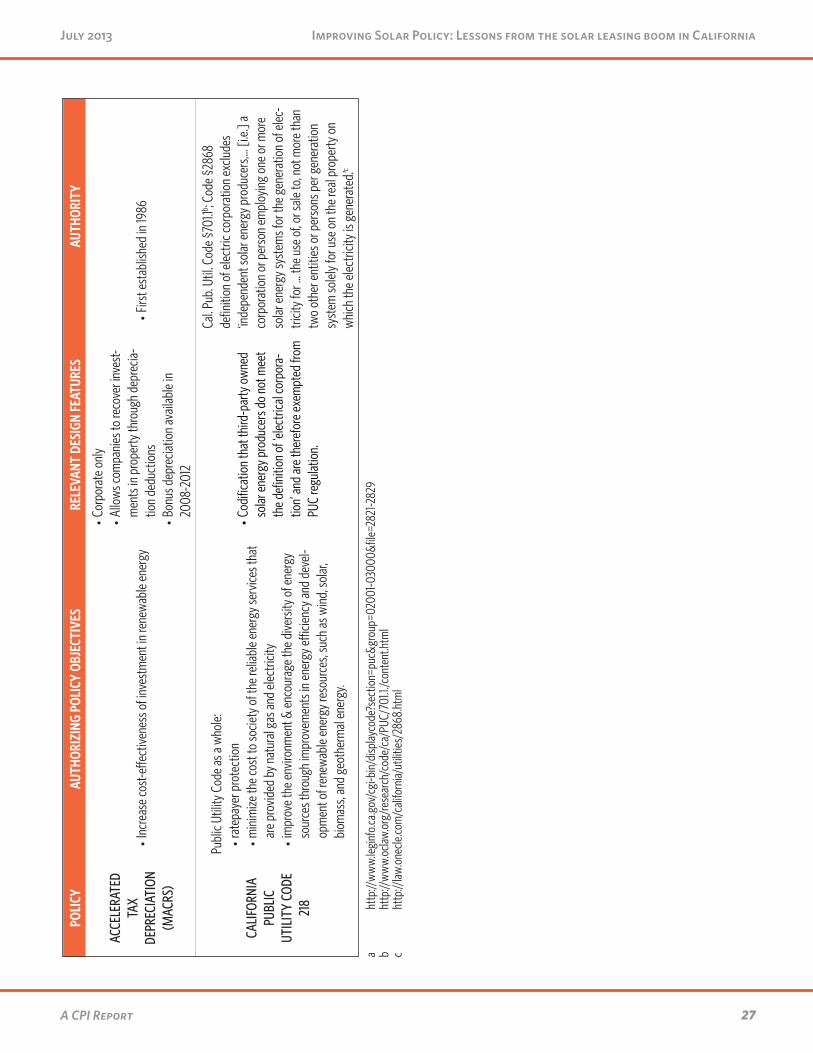
27A CPI Report
Improving Solar Policy: Lessons from the solar leasing boom in CaliforniaJuly 2013
POLI
CYAU
THOR
IZIN
G PO
LICY
OBJ
ECTI
VES
REL
EVAN
T DE
SIGN
FEAT
URES
AUTH
ORIT
Y
ACCE
LERA
TED
TAX
DEPR
ECIA
TION
(M
ACRS
)
•Inc
reas
e cos
t-effe
ctive
ness
of i
nves
tmen
t in
rene
wab
le en
ergy
•Cor
pora
te o
nly
•Allo
ws co
mpa
nies
to re
cove
r inv
est-
men
ts in
pro
perty
thro
ugh
depr
ecia-
tion
dedu
ctio
ns •B
onus
dep
recia
tion
avail
able
in
2008
-201
2
•Firs
t est
ablis
hed
in 19
86
CALIF
ORNI
A PU
BLIC
UT
ILITY
COD
E 21
8
Publ
ic Ut
ility C
ode a
s a w
hole:
•rat
epay
er p
rote
ctio
n •m
inim
ize th
e cos
t to
socie
ty o
f the
relia
ble e
nerg
y ser
vices
that
ar
e pro
vided
by n
atur
al ga
s and
elec
tricit
y •i
mpr
ove t
he en
viron
men
t & en
cour
age t
he d
ivers
ity o
f ene
rgy
sour
ces t
hrou
gh im
prov
emen
ts in
ener
gy effi
cienc
y and
dev
el-op
men
t of r
enew
able
ener
gy re
sour
ces,
such
as w
ind,
solar
, bi
omas
s, an
d ge
othe
rmal
ener
gy.
•Cod
ifica
tion
that
third
-par
ty o
wne
d so
lar en
ergy
pro
duce
rs d
o no
t mee
t th
e defi
nitio
n of
‘elec
trica
l cor
pora
-tio
n’ an
d ar
e the
refo
re ex
empt
ed fr
om
PUC
regu
latio
n.
Cal. P
ub. U
til. C
ode §
701.1
b ; Cod
e §28
68
defin
ition
of e
lectri
c cor
pora
tion
exclu
des
‘inde
pend
ent s
olar
ener
gy p
rodu
cers
,… [i
.e.] a
co
rpor
atio
n or
per
son
empl
oyin
g on
e or m
ore
solar
ener
gy sy
stem
s for
the g
ener
atio
n of
elec
-tri
city f
or …
the u
se o
f, or s
ale to
, not
mor
e tha
n tw
o ot
her e
ntiti
es o
r per
sons
per
gen
erat
ion
syst
em so
lely f
or u
se o
n th
e rea
l pro
perty
on
whi
ch th
e elec
tricit
y is g
ener
ated
.’c
a ht
tp://
ww
w.leg
info
.ca.g
ov/c
gi-b
in/d
isplay
code
?sec
tion=
puc&
grou
p=02
001-0
3000
&file=
2821
-282
9b
http
://w
ww.
oclaw
.org
/rese
arch
/cod
e/ca
/PUC
/701
.1./c
onte
nt.ht
ml
c ht
tp://
law.o
necle
.com
/cali
forn
ia/ut
ilities
/286
8.ht
ml
28A CPI Report
Improving Solar Policy: Lessons from the solar leasing boom in CaliforniaJuly 2013
9. Appendix B - Econometric Modeling Structure and Assumptions
Appendix B: Regression Analysis
1 Introduction
This appendix discusses the regression methodologies used to examine the impact ofincentives, bill savings, and cost on prices and deployment. Section 2 focuses on prices,and Section 3 focuses on deployment. Each begins with a theoretical discussion, movesto the structural model used for the regressions, and then discusses the regression results.
2 Prices
The market for residential solar panels is still relatively new, and information is not freelyavailable. For these reasons, competitive marginal cost based pricing is not expected.We assume price is a function of both value to the buyer (willingness to pay) and cost c,
p = µv(s, i) + (1− µ)c, (1)
where v(s) represents value (willingness to pay) - a function of savings s and incentivesi. The parameter µ is simply a measure of the degree to which prices are perfectlycompetitive, with µ = 0 in the case of perfect competition.
Third party ownership further complicates this, as it creates a separate market witha different pricing system, which is examined in greater detail below.
2.1 Prices for leased systems
The market for solar leases and the market for direct sales of solar installations areseparate and distinct. In the leasing industry, systems are advertised and sold on thebasis of monthly savings. Relatively few companies have entered this space. In order toact as a solar aggregator, a company must be large enough to assemble solar projectsinto a fund and attract investors.
Thus, while we expect the same factors to affect the market prices of third-party-owned systems, we do not necessarily expect the relationships to be the same. For thisreason, we estimate two separate price functions below.
Lease payments are set on the basis of bill savings s. If a homeowner’s initial bill iswritten b0, the lease l will be set to ensure that b0 − s+ l = (1− η)b0 for some targetedpercentage savings (η < 1). We can rewrite this
l = s− ηb0. (2)
1
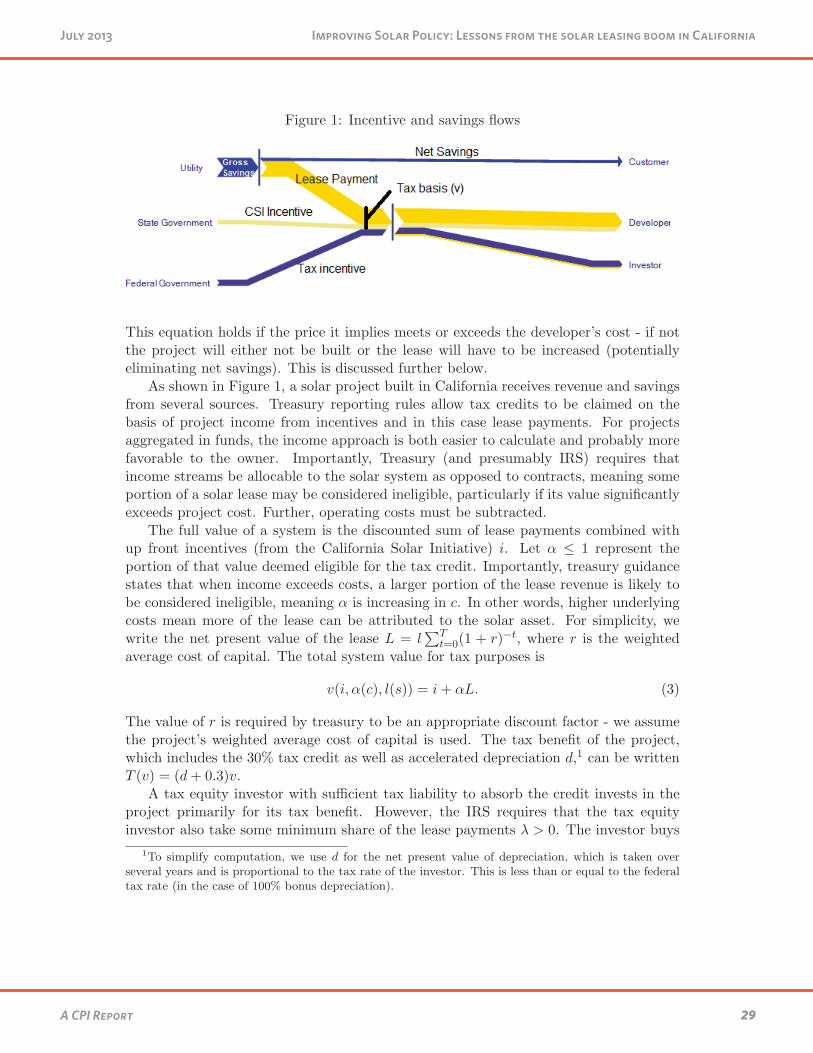
29A CPI Report
Improving Solar Policy: Lessons from the solar leasing boom in CaliforniaJuly 2013
Figure 1: Incentive and savings flows
This equation holds if the price it implies meets or exceeds the developer’s cost - if notthe project will either not be built or the lease will have to be increased (potentiallyeliminating net savings). This is discussed further below.
As shown in Figure 1, a solar project built in California receives revenue and savingsfrom several sources. Treasury reporting rules allow tax credits to be claimed on thebasis of project income from incentives and in this case lease payments. For projectsaggregated in funds, the income approach is both easier to calculate and probably morefavorable to the owner. Importantly, Treasury (and presumably IRS) requires thatincome streams be allocable to the solar system as opposed to contracts, meaning someportion of a solar lease may be considered ineligible, particularly if its value significantlyexceeds project cost. Further, operating costs must be subtracted.
The full value of a system is the discounted sum of lease payments combined withup front incentives (from the California Solar Initiative) i. Let α ≤ 1 represent theportion of that value deemed eligible for the tax credit. Importantly, treasury guidancestates that when income exceeds costs, a larger portion of the lease revenue is likely tobe considered ineligible, meaning α is increasing in c. In other words, higher underlyingcosts mean more of the lease can be attributed to the solar asset. For simplicity, wewrite the net present value of the lease L = l
∑Tt=0(1 + r)−t, where r is the weighted
average cost of capital. The total system value for tax purposes is
v(i, α(c), l(s)) = i+ αL. (3)
The value of r is required by treasury to be an appropriate discount factor - we assumethe project’s weighted average cost of capital is used. The tax benefit of the project,which includes the 30% tax credit as well as accelerated depreciation d,1 can be writtenT (v) = (d+ 0.3)v.
A tax equity investor with sufficient tax liability to absorb the credit invests in theproject primarily for its tax benefit. However, the IRS requires that the tax equityinvestor also take some minimum share of the lease payments λ > 0. The investor buys
1To simplify computation, we use d for the net present value of depreciation, which is taken overseveral years and is proportional to the tax rate of the investor. This is less than or equal to the federaltax rate (in the case of 100% bonus depreciation).
2

30A CPI Report
Improving Solar Policy: Lessons from the solar leasing boom in CaliforniaJuly 2013
a fund composed of many projects with varying characteristics, but in aggregate thepurchase must satisfy their return on investment requirement. Thus, for the averageproject, the tax equity investor pays
pI = T + λLI(1− τ), (4)
which ensures they receive their required return on investment (which is the same astheir discount rate). LI is simply the net present value of the lease from the tax equityinvestor’s perspective and τ is the tax rate.2 This means that the developer (eitherdirectly or through debt financing) contributes
pD = c− pI . (5)
Combining the above, leasing company profits can be written
πD = (1− λ)LD(1− τ) + i− pD = (1− λ)LD(1− τ) + i− c+ T + λLI(1− τ). (6)
Since profits must be greater than or equal to zero for a project to be built, we canrewrite (6) as a constraint on the lease price
l ≥ T + c− i
[(1− λ)∑T
t=0(1 + rD)−t + λ∑T
t=0(1 + rI)−t](1− τ). (7)
In cases where this constraint binds (e.g. leases are set on the basis of cost and incentivesrather than bill savings), lease prices will be increasing in cost and decreasing in theincentive level. Where the constraint doesn’t bind, leases are set on the basis of savings,as in Equation 2. From the customer’s perspective, this means if the developer can’tafford to sell the project and provide savings, they could finance it at cost, but savingsmay not be possible.
The total value of the project is then v̂ = πD − c+ pI , which is equivalent to
v̂(i, α(c), l(s)) = v + T (v). (8)
Note that it is irrelevant to this equation whether i is absorbed by the investor or thedeveloper.
It is unclear whether the prices reported to the CSI database are v or v̂. However,the same regression equation is implied in either case. We’ll proceed as if v̂, which wouldbe the appraised value of the fund including tax flows, is used.
Since prices are often reported in aggregate across a fund, it’s important we interpretthese averaged figures correctly. Letting µ represent the fraction of leases within a fundwhere the developer’s constraint (7) does not bind, we can write the average price
p̄ = T (v) + i+ µL(s) + (1− µ)L(c, i). (9)
Average (reported) price is a function of tax incentives, savings, and cost. Priceshould be increasing in savings and incentives, and decreasing in cost.
2The tax equity investor may have a different discount rate than other project participants.
3

31A CPI Report
Improving Solar Policy: Lessons from the solar leasing boom in CaliforniaJuly 2013
The only parameter we expect to vary between developers is α, which is a functionof costs and the developer’s legal interpretation of the tax credit rules. We allow coststo vary with project size, as well as developer experience (measured by number of wattsdeployed) to account for economies of scale and market power. We expect a positiverelationship between prices and incentives, and a positive relationship between pricesand savings as well as costs, though the size of the expected coefficient is unclear. Ifthe developer constraint rarely binds, costs should have very little impact on prices, andsavings and incentives should dominate. If the constraint binds more often, cost willhave a greater impact.
2.2 Regression Equation
We assume system size is chosen to maximize savings, meaning system size is increasingin the size of the initial bill. This means savings and system size are collinear. Further,the CSI incentive is collinear with system size by design, as it is adminstered on a per wattbasis. For this reason, we conduct our regression analysis on a per watt basis, and controlfor system size separately. We use the natural logarithm of the system size w ratherthan the raw variable, as we expect costs decrease nonlinearly as size increases. We alsocontrol for developer scale Q using the total number of watts they have installed at anygiven time - we interpret this effect as a net effect of learning-by-doing and potentiallymarket power.
To that end, we estimate the following equation
piwi
= β0 + β1siwi
+ β2iiwi
+ β3ctwi
+ β4ln(Qi) + β5ln(wi) + et + eu + εi (10)
We use fixed effects at the utility territory level (eu) to control for prices differencesdue to labor costs, differential insolation, and other regional factors. We also includequarterly time effects (et) to control for changes in costs we don’t explicitly control forbut that are likely uniform across the state (such as inverters, racking, etc.). Theseeffects ought to also capture changing economic conditions.
Further, to distinguish between the market for host-owned and leased systems, weinclude a dummy for leased systems (D) and interact it with all variables listed above,with the exception of the territorial and time effects. This means our complete regressionis written
pi
wi=β0 + β1
siwi
+ β2iiwi
+ β3ctwi
+ β4ln(Qi) + β5ln(wi)+
β6Di + β7Disiwi
+ β8Diiiwi
+ β9Dictwi
+ β10Diln(Qi) + β11Diln(wi)+ (11)
et + eu + εi.
We also include additional dummies for the three largest third party installers in onespecification.
4
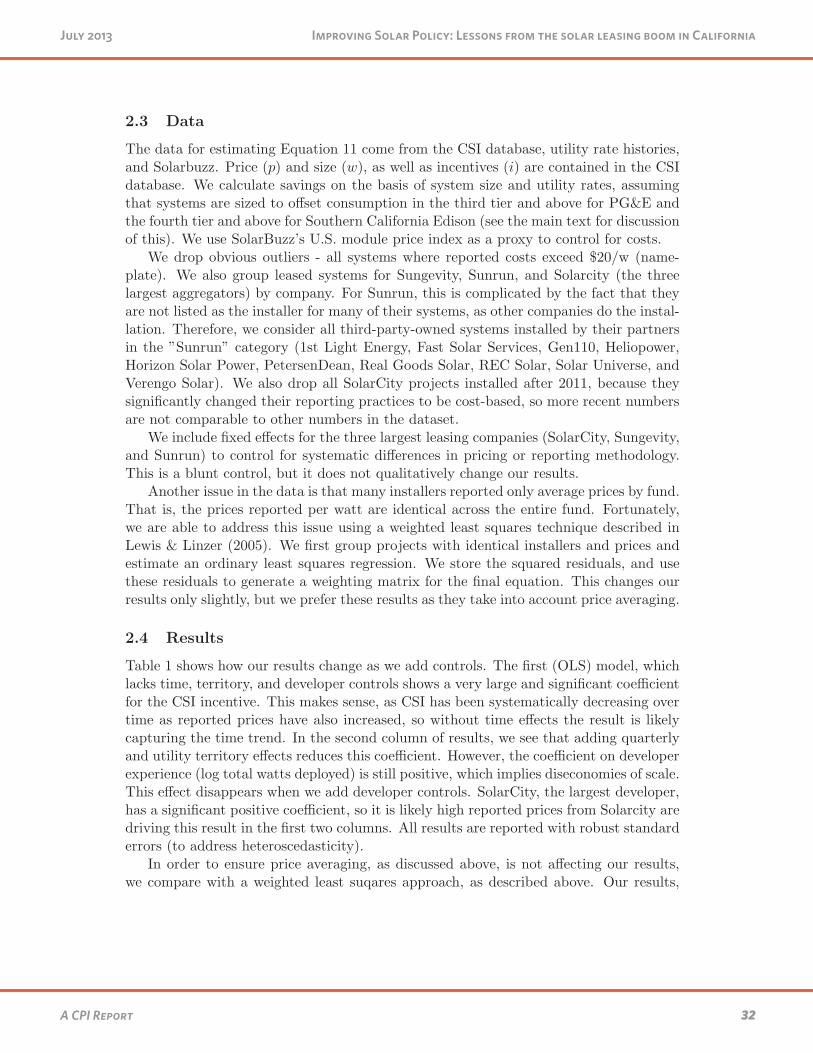
32A CPI Report
Improving Solar Policy: Lessons from the solar leasing boom in CaliforniaJuly 2013
2.3 Data
The data for estimating Equation 11 come from the CSI database, utility rate histories,and Solarbuzz. Price (p) and size (w), as well as incentives (i) are contained in the CSIdatabase. We calculate savings on the basis of system size and utility rates, assumingthat systems are sized to offset consumption in the third tier and above for PG&E andthe fourth tier and above for Southern California Edison (see the main text for discussionof this). We use SolarBuzz’s U.S. module price index as a proxy to control for costs.
We drop obvious outliers - all systems where reported costs exceed $20/w (name-plate). We also group leased systems for Sungevity, Sunrun, and Solarcity (the threelargest aggregators) by company. For Sunrun, this is complicated by the fact that theyare not listed as the installer for many of their systems, as other companies do the instal-lation. Therefore, we consider all third-party-owned systems installed by their partnersin the ”Sunrun” category (1st Light Energy, Fast Solar Services, Gen110, Heliopower,Horizon Solar Power, PetersenDean, Real Goods Solar, REC Solar, Solar Universe, andVerengo Solar). We also drop all SolarCity projects installed after 2011, because theysignificantly changed their reporting practices to be cost-based, so more recent numbersare not comparable to other numbers in the dataset.
We include fixed effects for the three largest leasing companies (SolarCity, Sungevity,and Sunrun) to control for systematic differences in pricing or reporting methodology.This is a blunt control, but it does not qualitatively change our results.
Another issue in the data is that many installers reported only average prices by fund.That is, the prices reported per watt are identical across the entire fund. Fortunately,we are able to address this issue using a weighted least squares technique described inLewis & Linzer (2005). We first group projects with identical installers and prices andestimate an ordinary least squares regression. We store the squared residuals, and usethese residuals to generate a weighting matrix for the final equation. This changes ourresults only slightly, but we prefer these results as they take into account price averaging.
2.4 Results
Table 1 shows how our results change as we add controls. The first (OLS) model, whichlacks time, territory, and developer controls shows a very large and significant coefficientfor the CSI incentive. This makes sense, as CSI has been systematically decreasing overtime as reported prices have also increased, so without time effects the result is likelycapturing the time trend. In the second column of results, we see that adding quarterlyand utility territory effects reduces this coefficient. However, the coefficient on developerexperience (log total watts deployed) is still positive, which implies diseconomies of scale.This effect disappears when we add developer controls. SolarCity, the largest developer,has a significant positive coefficient, so it is likely high reported prices from Solarcity aredriving this result in the first two columns. All results are reported with robust standarderrors (to address heteroscedasticity).
In order to ensure price averaging, as discussed above, is not affecting our results,we compare with a weighted least suqares approach, as described above. Our results,
5

33A CPI Report
Improving Solar Policy: Lessons from the solar leasing boom in CaliforniaJuly 2013
Table 1: Impact of fixed and developer effects
Fixed Effects (Quarter and Territory) No Yes Yes
Developer Effects No No Yes
CSI/Watt 1.094∗∗∗ .805∗∗∗ .555∗∗∗
(.023) (.032) (.032)
Savings/Watt .035∗∗∗ .040∗∗∗ .086∗∗∗
(.007) (.009) (.008)
Module Cost/Watt .059∗∗∗ .339∗∗∗ .288∗∗∗
(.017) (.073) (.067)
Log Watts -1.350∗∗∗ -1.324∗∗∗ -1.336∗∗∗
(.015) (.016) (.015)
Log Experience .014∗∗∗ .009∗∗∗ -.007∗∗
(.003) (.003) (.003)
Third Party Owner -2.232∗∗∗ -2.711∗∗∗ -2.532∗∗∗
(.144) (.146) (.127)
Third × CSI/Watt .241∗∗∗ .137∗∗∗ .113∗∗∗
(.037) (.038) (.033)
Third × Savings/Watt -.020 .015 .100∗∗∗
(.016) (.016) (.013)
Third × Module Cost/Watt .390∗∗∗ .478∗∗∗ .370∗∗∗
(.026) (.027) (.024)
Third × Log Experience .133∗∗∗ .137∗∗∗ .098∗∗∗
(.007) (.007) (.007)
Constant 7.659∗∗∗ 6.806∗∗∗ 7.246∗∗∗
(.072) (.413) (.391)
6

34A CPI Report
Improving Solar Policy: Lessons from the solar leasing boom in CaliforniaJuly 2013
Table 2: Impact of weighted least squares
Robust OLS WLS
CSI/Watt .554∗∗∗ .581∗∗∗
(.032) (.032)
Savings/Watt .069∗∗∗ .069∗∗∗
(.008) (.008)
Module Cost/Watt .291∗∗∗ .223∗∗∗
(.067) (.065)
Log Watts -1.335∗∗∗ -1.279∗∗∗
(.015) (.015)
Log Experience -.007∗∗ -.008∗∗∗
(.003) (.003)
Third Party Dummy -2.518∗∗∗ -2.676∗∗∗
(.126) (.126)
Third × CSI/Watt .118∗∗∗ .079∗∗
(.033) (.033)
Third × Savings/Watt .099∗∗∗ .109∗∗∗
(.013) (.013)
Third × Module Cost/Watt .367∗∗∗ .423∗∗∗
(.024) (.023)
Third × Log Experience .098∗∗∗ .090∗∗∗
(.007) (.007)
Sungevity Dummy 1.180∗∗∗ 1.226∗∗∗
(.056) (.056)
Sunrun Dummy -1.151∗∗∗ -1.171∗∗∗
(.390) (.385)
SolarCity Dummy .920∗∗∗ .989∗∗∗
(.020) (.019)
Constant 7.228∗∗∗ 7.539∗∗∗
(.015) (.015)
R-Squared 0.3520 0.3630
shown in Table 2, are affected only moderately by this change.We focus on the results in the third column, as they are robust to price averaging,
as discussed above. The coefficient for the CSI incentive shows that a $1 increase in theCSI incentive increases reported price by about $0.58 for host-owned systems and $0.66(adding together the baseline with the interacted coefficient) for leased systems. Thisrelationship is as expected, though our model above suggests it could have been evenstronger. This indicates that for some projects the developer constraint in Equation 7held. In other words, developers used some of the up front incentive to reduce leasepayments.
To examine whether these effects vary when we pick different time periods, we splitour sample over time. We see evidence that either competitiveness or cost pressurehave increased over time (see Table 3). In other words, it appears the constraint inEquation 7 was binding in more cases over time, either due to increased competitivenessforcing companies to provide greater savings where possible or simply lower margins
7
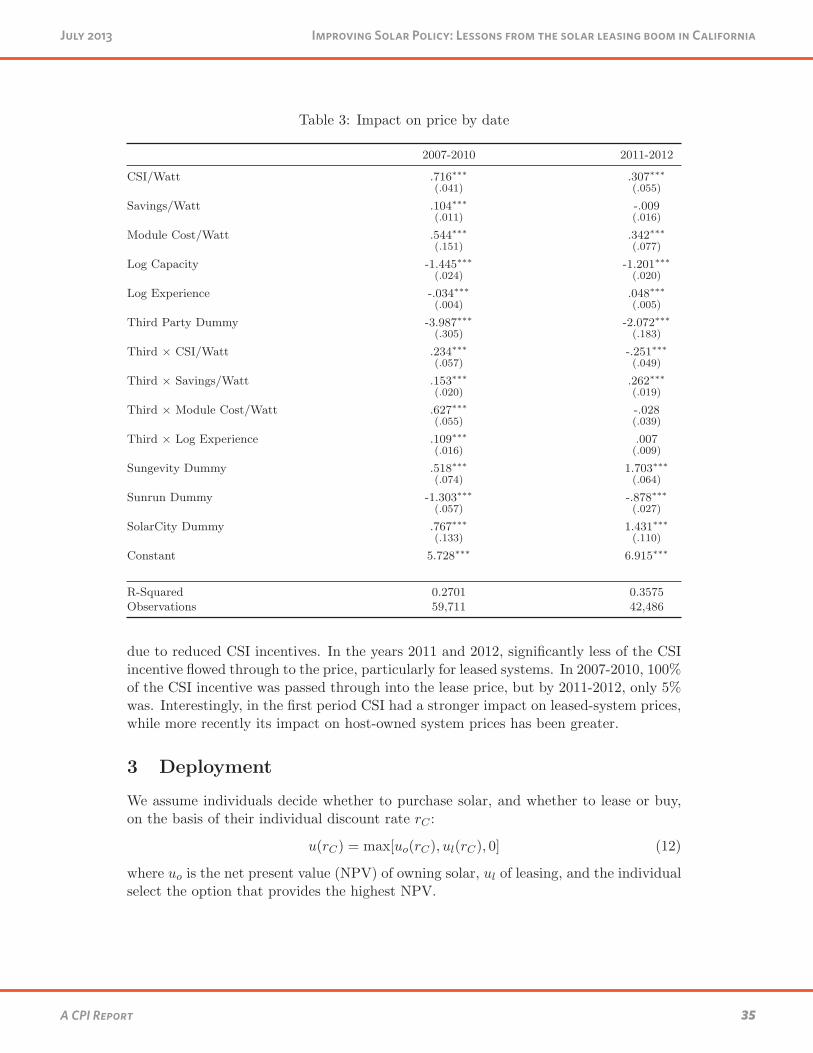
35A CPI Report
Improving Solar Policy: Lessons from the solar leasing boom in CaliforniaJuly 2013
Table 3: Impact on price by date
2007-2010 2011-2012
CSI/Watt .716∗∗∗ .307∗∗∗
(.041) (.055)
Savings/Watt .104∗∗∗ -.009(.011) (.016)
Module Cost/Watt .544∗∗∗ .342∗∗∗
(.151) (.077)
Log Capacity -1.445∗∗∗ -1.201∗∗∗
(.024) (.020)
Log Experience -.034∗∗∗ .048∗∗∗
(.004) (.005)
Third Party Dummy -3.987∗∗∗ -2.072∗∗∗
(.305) (.183)
Third × CSI/Watt .234∗∗∗ -.251∗∗∗
(.057) (.049)
Third × Savings/Watt .153∗∗∗ .262∗∗∗
(.020) (.019)
Third × Module Cost/Watt .627∗∗∗ -.028(.055) (.039)
Third × Log Experience .109∗∗∗ .007(.016) (.009)
Sungevity Dummy .518∗∗∗ 1.703∗∗∗
(.074) (.064)
Sunrun Dummy -1.303∗∗∗ -.878∗∗∗
(.057) (.027)
SolarCity Dummy .767∗∗∗ 1.431∗∗∗
(.133) (.110)
Constant 5.728∗∗∗ 6.915∗∗∗
R-Squared 0.2701 0.3575Observations 59,711 42,486
due to reduced CSI incentives. In the years 2011 and 2012, significantly less of the CSIincentive flowed through to the price, particularly for leased systems. In 2007-2010, 100%of the CSI incentive was passed through into the lease price, but by 2011-2012, only 5%was. Interestingly, in the first period CSI had a stronger impact on leased-system prices,while more recently its impact on host-owned system prices has been greater.
3 Deployment
We assume individuals decide whether to purchase solar, and whether to lease or buy,on the basis of their individual discount rate rC :
u(rC) = max[uo(rC), ul(rC), 0] (12)
where uo is the net present value (NPV) of owning solar, ul of leasing, and the individualselect the option that provides the highest NPV.
8

36A CPI Report
Improving Solar Policy: Lessons from the solar leasing boom in CaliforniaJuly 2013
The value of a lease (ul) is a function of bill savings s from generating solar anda lease payment l. To simplify future computations, we write the net present value ofthe savings SC =
∑Tt=0(1 + rC)
−t and the lease LC = l∑T
t=0(1 + rC)−t Specifically, the
value is the amount of savings minus the lease, discounted over the number of years ofthe lease:
ul(r) = SC − LC . (13)
For owned systems, the value is the amount of bill savings s, discounted over thenumber of years of ownership, minus the up-front cost of the system (i.e. the up-frontpurchase price minus any up-front incentives) plus the tax credit, which in this case issimply 30% of the purchase price c:
uo(r) = SC + i− 0.7c. (14)
An individual will prefer a lease if ul(r) > uo(r), which can be rewritten
LC < 0.7c− i. (15)
As discussed above, up-front incentives only affect lease prices when the constraintin Equation 7 holds. Even in that case, the relationship is less than one to one. Thus,the likelihood any given consumer will lease decreases as up front incentives increase: anincrease in incentives unambiguously decreases the right hand side of the equation morethan the left hand side.
We assume that each individual installs solar only once, so the aggregate demand forsolar ownership and leases is the sum of all individual binary decisions.
Incentive reductions also put pressure on developers - they must either lower pricesto maintain their value proposition or forego sales. That means they must find new waysto reduce costs, accept lower margins, or sell fewer systems. For developers offering solarleases, economies of scale clearly exist - fixed costs associated with closing tax equitydeals are best spread over many projects. For developers selling systems, on the otherhand, it is unclear whether economies of scale exist.
Using a two stage regression, we can separate the impact of prices on deploymentfrom the impact of incentives. We find that incentives affect total deployment, andhave an even stronger effect on host-owned deployment, but no effect on the deploymentof leased systems. This suggests the reduction in demand for leases due to decreasedincentives is offset by switching by customers who with higher up-front incentives wouldhave chosen to own the system.
3.1 Empirical Strategy
As described above, we’re estimating two sets of interrelated equations. First, we’re esti-mating the impact of cost, savings, and incentives on price. Second, we’re estimating theimpact of the same variables on deployment. Savings and incentives affect deploymentboth directly and indirectly. That is, savings and incentives affect the price, and thenaffect the homeowner’s adoption decision given the price.
9
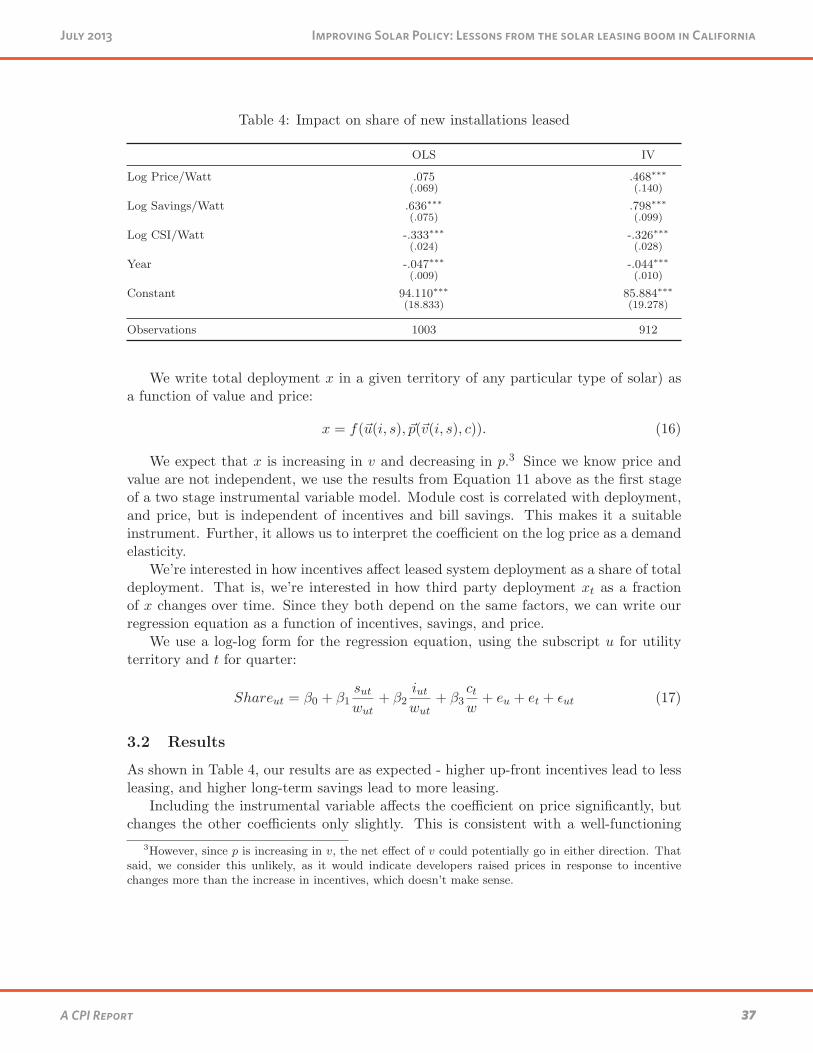
37A CPI Report
Improving Solar Policy: Lessons from the solar leasing boom in CaliforniaJuly 2013
Table 4: Impact on share of new installations leased
OLS IV
Log Price/Watt .075 .468∗∗∗
(.069) (.140)
Log Savings/Watt .636∗∗∗ .798∗∗∗
(.075) (.099)
Log CSI/Watt -.333∗∗∗ -.326∗∗∗
(.024) (.028)
Year -.047∗∗∗ -.044∗∗∗
(.009) (.010)
Constant 94.110∗∗∗ 85.884∗∗∗
(18.833) (19.278)
Observations 1003 912
We write total deployment x in a given territory of any particular type of solar) asa function of value and price:
x = f(�u(i, s), �p(�v(i, s), c)). (16)
We expect that x is increasing in v and decreasing in p.3 Since we know price andvalue are not independent, we use the results from Equation 11 above as the first stageof a two stage instrumental variable model. Module cost is correlated with deployment,and price, but is independent of incentives and bill savings. This makes it a suitableinstrument. Further, it allows us to interpret the coefficient on the log price as a demandelasticity.
We’re interested in how incentives affect leased system deployment as a share of totaldeployment. That is, we’re interested in how third party deployment xt as a fractionof x changes over time. Since they both depend on the same factors, we can write ourregression equation as a function of incentives, savings, and price.
We use a log-log form for the regression equation, using the subscript u for utilityterritory and t for quarter:
Shareut = β0 + β1sutwut
+ β2iutwut
+ β3ctw
+ eu + et + εut (17)
3.2 Results
As shown in Table 4, our results are as expected - higher up-front incentives lead to lessleasing, and higher long-term savings lead to more leasing.
Including the instrumental variable affects the coefficient on price significantly, butchanges the other coefficients only slightly. This is consistent with a well-functioning
3However, since p is increasing in v, the net effect of v could potentially go in either direction. Thatsaid, we consider this unlikely, as it would indicate developers raised prices in response to incentivechanges more than the increase in incentives, which doesn’t make sense.
10
38A CPI Report
Improving Solar Policy: Lessons from the solar leasing boom in CaliforniaJuly 2013
instrument, and also makes more sense - higher prices mean higher up-front costs, so itis consistent with our theory that higher prices would yield more leasing.
The estimates suggest a 1% decrease in the up-front incentive increased the marketshare of leases by 0.326 percentage points, and a 1% increase in savings led to a 0.789percentage point increase in the leasing share. Further, when we include the instrumentalvariable, we see higher prices are associated with more leasing. This is consistent withwhat we found above, and what theory suggests - leasing becomes more appealing asup-front costs increase.
Shifting incentives from savings delivered over time to incentives provided up frontwould impact market share dramatically. Using our sample averages of $6.63 for sav-ings and $1.28 for up front incentives, we can calculate the impact of shifting a dollarper watt from savings to up front incentives, assuming the elasticities are constant (atleast locally). This indicates that such a shift would reduce the market share for newdeployment of leasing by about 38% from its current level of roughly 75%. Of course,this obscures the time value of money - a more realistic shift would involve discount-ing, meaning one would reduce savings by $1 and increase up-front incentives by about$0.50.4 In that case, the change in share of new deployment would be about 25%. Ineither case, our results indicate that the timing of incentives affects how systems arefinanced.
4This is consistent with a discount rate between 7% and 8% assuming a 20 year project lifetime
11