improving student outcomes in southeast schools
DESCRIPTION
Improving Student Outcomes in Southeast Schools Eric Anderson, Manager, Research, Evaluation, & Assessment Michael Tolley, Assistant Superintendent for Teaching & Learning Mia Williams, Principal, Aki Kurose Middle School. School Levels. - PowerPoint PPT PresentationTRANSCRIPT

Photos by Susie Fitzhugh
Improving Student Outcomes in Southeast SchoolsEric Anderson, Manager, Research, Evaluation, & Assessment
Michael Tolley, Assistant Superintendent for Teaching & Learning
Mia Williams, Principal, Aki Kurose Middle School

School Levels
Schools levels defined each year by absolute performance and growth
Purpose is to monitor school progress toward 2013 district goals
SCHOOL LEVELS
LEVEL 5
LEVEL 4
LEVEL 3
LEVEL 2
LEVEL 1
Level 4-5 Schools are near or above the 2013 district goals
Level 1-2 Schools remain far below the 2013 goals and are not making significant annual progress
2

3
2009 2010 2011 20120%
10%
20%
30%
40%
50%
60%
70%
80%
90%
100%
7 64 3
56
44
6 7
9 11
2 1
Level 5
Level 4
Level 3
Level 1
Level Totals by Year – Southeast Schools

4
School Levels by Year
SchoolLevel 2009
Level 2010
Level 2011
Level 2012
Absolute Score 2012
Growth Score 2012
Mercer MS 3 3 5 5 88 85
Maple 3 3 5 3 76 65
Franklin HS 2 3 3 3 73 48
Beacon Hill 2 3 2 3 70 67
Kimball 3 3 3 3 69 33
South Shore K-8 * 2 3 3 68 56
Wing Luke 2 3 3 3 67 53
Cleveland HS 1 2 3 3 62 66
Van Asselt 2 2 3 3 60 78
Orca K-8 3 3 3 3 56 50
Dearborn Park 1 1 3 3 45 79
John Muir 3 2 2 2 43 45
Aki Kurose MS 3 1 3 3 42 75
Dunlap 1 1 1 2 40 48
Rainier Beach HS 1 2 2 2 38 24
Graham Hill 2 2 2 2 37 35
Emerson 1 1 1 1 18 21
Martin Luther King Jr 1 1 1 1 17 34
Hawthorne 1 1 1 1 13 44

5
English Le
arners
(ELL)
Free/Reduce
d Lunch
Asian
Black/A
frica
n-Americ
an
Hispanic/
Latino
Native American
Multi-Racial
Pacific I
slander
White
0%
10%
20%
30%
40%
50%
60%
70%
80%
19%
74%
39%
34%
13%
1%4%
1%
8%
All Other SPS Schools
Southeast Schools
Student Demographics in Southeast Schools (Students Tested in Grades 3-8, Spring 2012)

MATH Achievement in Southeast Schools (Grades 3-8)

READING Achievement in Southeast Schools (Grades 3-8)

8
% MetStd # Tested % MetStd # Tested % MetStd # Tested
ALL STUDENTS 66% 1580 70% 1645 77% 1713 11%ELL 43% 383 46% 435 56% 405 13%Not ELL 74% 1197 79% 1210 84% 1308 10%Cambodian 36% 11 40% 10 46% 13 10%Chinese 81% 365 83% 382 89% 433 8%Filipino 54% 442 61% 435 71% 428 16%Japanese 95% 19 86% 21 87% 23 -8%Laotian 64% 11 77% 13 81% 16 18%Other Asian 57% 212 58% 204 63% 192 6%Vietnamese 71% 504 72% 562 79% 586 8%ALL STUDENTS 27% 1397 31% 1444 40% 1467 13%ELL 12% 182 12% 232 25% 233 13%Not ELL 29% 1215 35% 1212 42% 1234 13%Amharic 42% 43 46% 46 54% 57 13%English 26% 998 31% 992 37% 976 11%Oromo 33% 39 39% 44 69% 45 36%Somalian 27% 266 28% 297 41% 312 14%Tigrigna 38% 24 61% 28 50% 36 13%ALL STUDENTS 32% 507 40% 539 43% 566 11%ELL 16% 173 22% 200 27% 177 11%Not ELL 40% 334 51% 339 51% 389 10%English 37% 174 43% 176 44% 198 7%Spanish 29% 321 38% 352 43% 358 14%
Multi-Racial ALL STUDENTS 53% 128 57% 148 66% 180 12%Native American ALL STUDENTS 29% 56 31% 48 37% 43 9%
Pacific Islander ALL STUDENTS 34% 53 24% 49 39% 36 5%White ALL STUDENTS 68% 357 73% 362 76% 372 8%
SubcategoryFED7
Asian
Black/African-American
Hispanic/Latino
Math
3-Year Change
2010 2011 2012
Disaggregated MATH Achievement for Southeast Schools(Grades 3-8)

9
% MetStd # Tested % MetStd # Tested % MetStd # Tested
ALL STUDENTS 66% 1572 72% 1638 74% 1707 8%ELL 33% 374 43% 427 39% 398 7%Not ELL 77% 1198 82% 1211 85% 1309 8%Cambodian 45% 11 40% 10 46% 13 1%Chinese 70% 360 79% 377 79% 430 8%Filipino 63% 439 70% 438 74% 425 11%Japanese 89% 19 86% 21 91% 23 2%Laotian 73% 11 85% 13 75% 16 2%Other Asian 55% 213 59% 203 64% 192 9%Vietnamese 70% 504 73% 558 75% 586 5%ALL STUDENTS 42% 1398 47% 1447 51% 1465 8%ELL 14% 182 23% 230 24% 232 10%Not ELL 47% 1216 52% 1217 56% 1233 9%Amharic 57% 44 44% 45 52% 58 -5%English 43% 999 49% 997 52% 975 9%Oromo 51% 39 45% 44 59% 44 8%Somalian 37% 264 43% 297 48% 311 11%Tigrigna 38% 24 63% 27 50% 36 13%ALL STUDENTS 45% 508 51% 541 54% 569 9%ELL 19% 174 27% 201 30% 179 11%Not ELL 59% 334 66% 340 65% 390 6%English 55% 174 57% 177 65% 198 10%Spanish 42% 322 49% 353 49% 361 7%
Multi-Racial ALL STUDENTS 70% 127 74% 148 76% 182 6%Native American ALL STUDENTS 50% 56 46% 48 65% 43 15%
Pacific Islander ALL STUDENTS 46% 54 55% 49 61% 36 15%White ALL STUDENTS 80% 357 81% 362 85% 372 5%
3-Year ChangeFED7 Subcategory
Asian
Black/African-American
Hispanic/Latino
Reading
2010 2011 2012
Disaggregated READING Achievement for Southeast Schools (Grades 3-8)
10
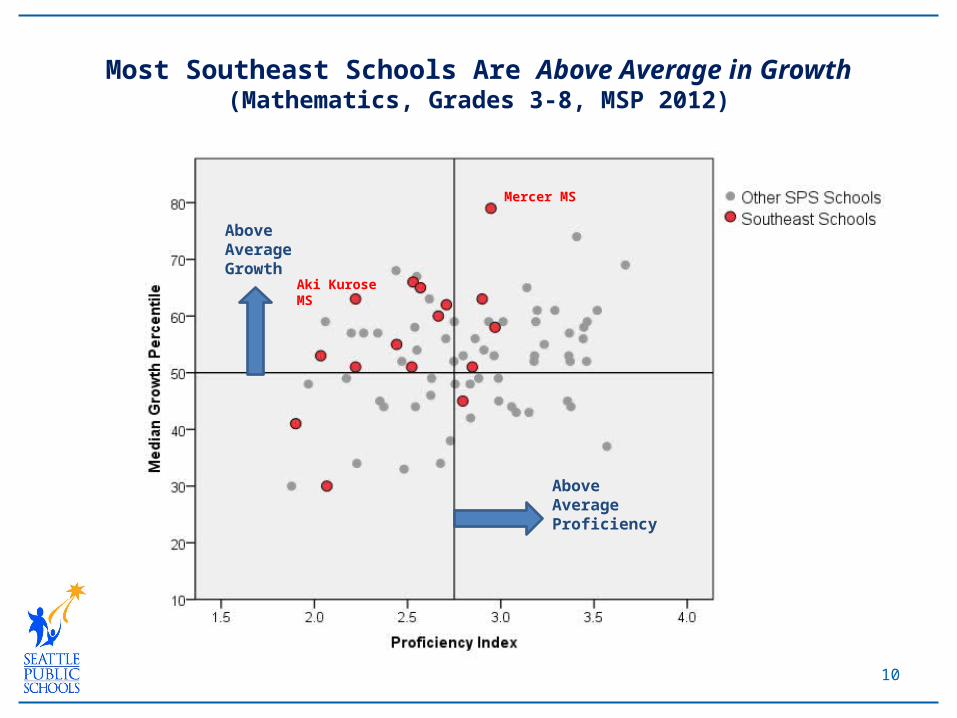
Above Average Growth
Above Average Proficiency
Most Southeast Schools Are Above Average in Growth (Mathematics, Grades 3-8, MSP 2012)
Aki Kurose MS
Mercer MS

11
Four Key Strategies to Improve Student Outcomes
Strategy # 1: Evaluate Teachers• Evaluate teachers based on their instructional practice
• Use a common evaluation tool (Danielson Teaching Framework)
• Provide feedback and support teachers so they can improve
Strategy # 2: Teach and Assess the Standards• Closely match the curriculum to the state standards
• Regularly assess the standards throughout the year
• Teachers collaborate, discuss student data, and plan together

12
Strategy # 3: Provide “Multi-Tiered Supports” (MTSS) • Provide immediate and targeted supports to students
• Consider all factors: academic, language/cultural, social-emotional
• Use research-based programs (e.g., Read 180, System 44, ST Math)
Strategy #4: Partner with Families & the Community• Communicate with families and help them support their children
• Partner with after-school programs and volunteers
• Partner with CBOs to provide wrap-around services
Four Key Strategies to Improve Student Outcomes