improving sugar cookie recipe with functional properties
TRANSCRIPT
ORIGINAL SCIENTIFIC PAPER | 159
Agric. conspec. sci. Vol. 85 (2020) No. 2 (159-174)aCS
Improving Sugar Cookie Recipe with Functional Properties
Alfiya CHERNENKOVA1 (✉)Svetlana LEONOVA1
Elena KUZNETSOVA2
Valentina RUMYANTSEVA3
Tatyana KIRILLOVA4
Valeriy CHERNYKH5
Evgeniy CHERNENKOV1
Olesya KALUZHINA1
Summary
This study dealt with the relevance of adding bee pollen, honey and oat talkan to the sugar cookie formula. The authors estimated the effect of the bee pollen and honey dosage on the properties and quality of the sugar cookie emulsion. The amount of fat droplet fines was found to increase with higher dosage of bee pollen. The emulsion stability exceeded the control sample characteristics. The viscosity was 5.3 Pa∙s (control sample) and 1.68 Pa∙s (sample with bee pollen and honey). Sugar cookie formula with bee pollen, honey, and oat talkan was improved by a multidimensional statistical model. The total production process to manufacture sugar cookies with bee products and oat talkan is reduced by four minutes compared with the control sample. There is a calculated daily intake for macro- and micronutrients at consumption of 100 grams of sugar cookies with pollen, honey, and oat talkan.
Key words
honey products, oat talkan, structural and mechanical properties, sugar cookie
1 Department of Technology of the Catering and Processing of Vegetable Raw Materials, Bashkir State Agrarian University, Ufa, Russia
2 Department of Industrial Chemistry and Biotechnology, Orel State University named after I. Turgenev, Orel, Russia
3 Department of Food Technology and Organization of Restaurant Business, Orel State University named after I. Turgenev, Orel, Russia
4 Department of Mathematics, Mechanics and Engineering Graphics, Saratov State Agrarian University named after N. Vavilov, Saratov, Russia
5 Department of Rheogoniometry, Scientific and Research Institute of the Baking Industry, Moscow, Russia
✉ Corresponding author: [email protected]
Received: October 24, 2019 | Accepted: April 1, 2020
Agric. conspec. sci. Vol. 85 (2020) No. 2
160 | Alfiya CHERNENKOVA, Svetlana LEONOVA, Elena KUZNETSOVA, Valentina RUMYANTSEVA, Tatyana KIRILLOVA, Valeriy CHERNYKH, Evgeniy CHERNENKOV, Olesya KALUZHINA
aCS
IntroductionTo develop functional flour confectionery goods it is necessary
to adjust their chemical composition to the requirements of the balanced nutrition theory, while their traditional organoleptic characteristics, properties and structure must be preserved. As the main principle of the balanced nutrition theory is an intake of food nutrients in certain quantities and ratios, the development of combined products based on an analytical assessment of the nutrient quantity and quality suggests methodological approaches identifying the key nutrient, modeling and optimizing its quality (Freitas and Moretti, 2006; Koryachkin et al., 2006; Koryachkina et al., 2006a; 2006b; Kuznetsova et al., 2008; Kuznetsova, 2009; Kuznetsova, 2010; Fuenmayor et al., 2014). At the same time, changing the chemical composition of food products is a serious intervention in the traditional technology. It suggests the use of new functional raw materials and requires extensive research to get a safe, competitive and high-quality product (Leonova et al., 2012; Leonova and Pogonets, 2016; Fazrakhmanov et al., 2018; Luk'yanova and Kovshov, 2019). The analysis of the physicochemical aspects of the production process that determine the structuring is crucial in the development of flour confectionery products with a manageable technology. Technologies to manufacture flour confectionery goods with combined additives in the dough formula are of key importance in terms of their influence on the dough property and structure, and, consequently, on the properties of finished products (Rumyantseva and Mironova, 2003; Koryachkin et al., 2006; Koryachkina et al., 2006b; Rumyantseva et al., 2007; Rumyantseva et al., 2009; Rumyantseva et al., 2012; Gbenga-Fabusiwa et al., 2018).
The wheat dough rheology is essential in flour confectionery kneading process. There are different ways and devices to investigate the mechanical behavior of the dough and its physical properties, the protein molecular structure in the continuous phase and the chemical reactions of functional groups (Maksimov et al., 2001; Koryachkin et al., 2006; Koryachkina et al., 2006b; Chernykh et al., 2014; Taleysnik et al., 2018). Many scientific papers discuss these topics. Thus, the research team of Munteanu et al. (2016) presented some methods being currently used in the bakery industry to determine the rheological characteristics of flour and dough. Farinograph and mixograph are common devices for evaluating the flour and dough properties in laboratory conditions (Munteanu et al., 2016). Besides, Voychik et al. (2017) and others studied the effect of a mixture of plant components (carob flour, orach, oats) on the structural and mechanical properties of bakery products. In particular, the scientists examined the structural and mechanical properties of the crumb and the crust. There was also a sensory evaluation of the finished product. The results showed increased water absorption of the flour mixture with higher dosage of these additives (Voychik et al., 2017). Therefore the purpose of this research was to better the formulation of sugar cookies with biologically active raw materials as oat talkan, honey and bee pollen.
Materials and Methods
Raw materials
During the research, we used the mixed flower honey obtained at our own apiary of individual entrepreneur Fazylov M. from the
bee families of the population of Bashkir (Burzian) bees, as well as flower pollen (bee pollen). Bashkir beekeeping products differ significantly from similar products of other regions of Russia as they are produced of honey from the wild Bashkir (Burzian) bees belonging to population which live exclusively in the forests of Burzian district of the Republic of Bashkortostan. Bashkir bee population is resistant to winter hardiness, European slight rot, nosematosis and paralysis during honeydew flow. They produce plenty of honey in a short honey harvest period (for example, while Linden is flowering). Bashkir honey is characterized by high diastatic number, golden yellow or yellow-brown color, pleasant taste and flavor, and it does not crystallize for a long time.
Bee pollen has the form of friable granular mass, solid lumps that are similar to millet grain. The lumps flatten when pressed.
Oat talkan is a cereal product made from sprouted oat grain.
Formulation and technology of sugar cookies
At the first stage the bee pollen and honey dosage in sugar cookie formula were optimized. The invert syrup is replaced with flower honey, being added together with bee pollen at the stage of emulsion preparation. To optimize the ratio of components, the influence of bee pollen, honey and oat talkan on the structural and mechanical properties of semi-finished products such as emulsions and dough as well as sugar cookies is examined.
The studies are conducted on emulsion samples with the invert syrup being replaced with natural honey, and bee pollen added in the amount from 2 to 10% of the flour weight (in 2% increments). The emulsion sample made according to a standard formulation with invert syrup and without bee pollen was taken as a control. Emulsion for cookies is a dispersed system consisting of several components. The main ingredients are fat, water, sugar, egg melange and invert syrup. Such characteristics as dispersion, viscosity and stability are studied.
The recipe of one of the most common sugar cookie brand «Chess» was used as a basis (Table 1).
All the formulation ingredients are produced in Russia, the Republic of Bashkortostan.
Using the recipe, experimental samples of cookies were made according to the following scheme:
1. Partial replacement of sugar in the emulsion formulation with bee pollen in the amount of 2; 4; 6; 8 and 10%. Control was the product without bee pollen
2. Partial or complete replacement of invert syrup in the emulsion with honey in the amount of 20; 40; 60; 80 and 100%. Control was the products without honey
3. Replacement of sugar with bee pollen and invert syrup with honey in the emulsion in experimentally confirmed optimal dosage
4. Replacement of wheat flour with oat talkan in the amount of 2.5%, 5%, 7.5%, 10%, 12.5%.
Samples of sugar cookies were made in the laboratory. The technological process consists of the following stages: preparation of raw materials, preparation of the emulsion, dough kneading, dough forming, baking and cooling. Control samples of sugar cookies were made as follows: loose ingredients are mixed
Agric. conspec. sci. Vol. 85 (2020) No. 2
Improving Sugar Cookie Recipe with Functional Properties | 161
aCS
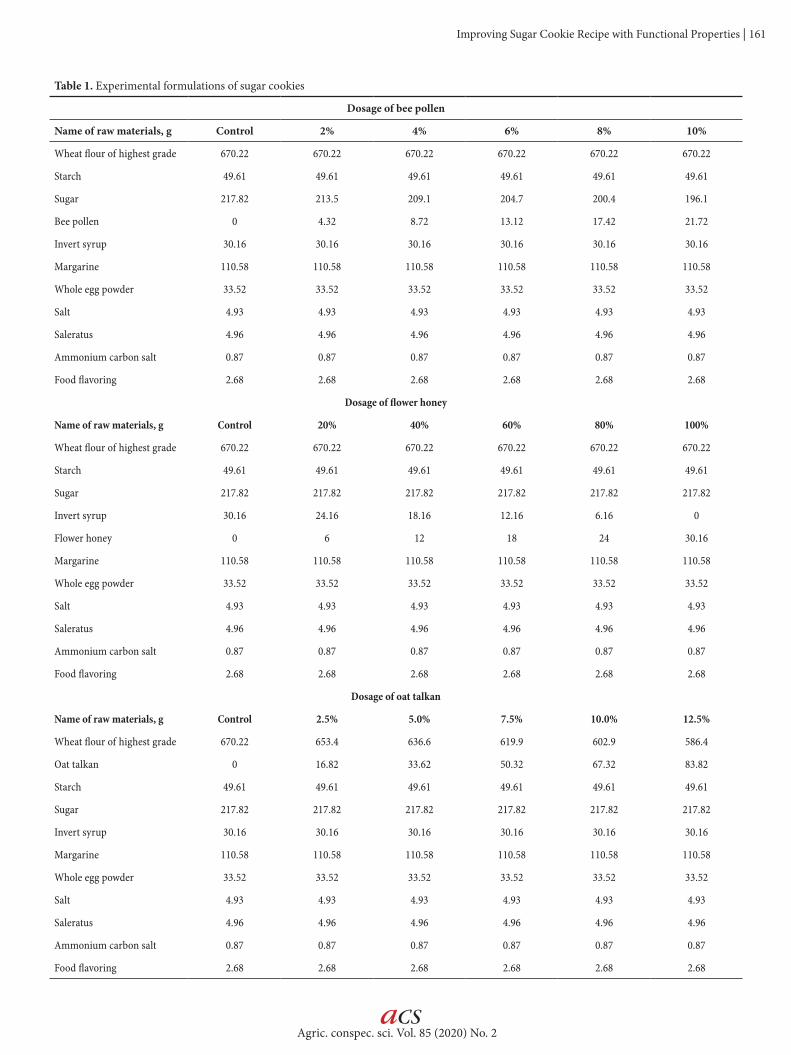
Table 1. Experimental formulations of sugar cookies
Dosage of bee pollen
Name of raw materials, g Control 2% 4% 6% 8% 10%
Wheat flour of highest grade 670.22 670.22 670.22 670.22 670.22 670.22
Starch 49.61 49.61 49.61 49.61 49.61 49.61
Sugar 217.82 213.5 209.1 204.7 200.4 196.1
Bee pollen 0 4.32 8.72 13.12 17.42 21.72
Invert syrup 30.16 30.16 30.16 30.16 30.16 30.16
Margarine 110.58 110.58 110.58 110.58 110.58 110.58
Whole egg powder 33.52 33.52 33.52 33.52 33.52 33.52
Salt 4.93 4.93 4.93 4.93 4.93 4.93
Saleratus 4.96 4.96 4.96 4.96 4.96 4.96
Ammonium carbon salt 0.87 0.87 0.87 0.87 0.87 0.87
Food flavoring 2.68 2.68 2.68 2.68 2.68 2.68
Dosage of flower honey
Name of raw materials, g Control 20% 40% 60% 80% 100%
Wheat flour of highest grade 670.22 670.22 670.22 670.22 670.22 670.22
Starch 49.61 49.61 49.61 49.61 49.61 49.61
Sugar 217.82 217.82 217.82 217.82 217.82 217.82
Invert syrup 30.16 24.16 18.16 12.16 6.16 0
Flower honey 0 6 12 18 24 30.16
Margarine 110.58 110.58 110.58 110.58 110.58 110.58
Whole egg powder 33.52 33.52 33.52 33.52 33.52 33.52
Salt 4.93 4.93 4.93 4.93 4.93 4.93
Saleratus 4.96 4.96 4.96 4.96 4.96 4.96
Ammonium carbon salt 0.87 0.87 0.87 0.87 0.87 0.87
Food flavoring 2.68 2.68 2.68 2.68 2.68 2.68
Dosage of oat talkan
Name of raw materials, g Control 2.5% 5.0% 7.5% 10.0% 12.5%
Wheat flour of highest grade 670.22 653.4 636.6 619.9 602.9 586.4
Oat talkan 0 16.82 33.62 50.32 67.32 83.82
Starch 49.61 49.61 49.61 49.61 49.61 49.61
Sugar 217.82 217.82 217.82 217.82 217.82 217.82
Invert syrup 30.16 30.16 30.16 30.16 30.16 30.16
Margarine 110.58 110.58 110.58 110.58 110.58 110.58
Whole egg powder 33.52 33.52 33.52 33.52 33.52 33.52
Salt 4.93 4.93 4.93 4.93 4.93 4.93
Saleratus 4.96 4.96 4.96 4.96 4.96 4.96
Ammonium carbon salt 0.87 0.87 0.87 0.87 0.87 0.87
Food flavoring 2.68 2.68 2.68 2.68 2.68 2.68
Agric. conspec. sci. Vol. 85 (2020) No. 2
162 | Alfiya CHERNENKOVA, Svetlana LEONOVA, Elena KUZNETSOVA, Valentina RUMYANTSEVA, Tatyana KIRILLOVA, Valeriy CHERNYKH, Evgeniy CHERNENKOV, Olesya KALUZHINA
aCS
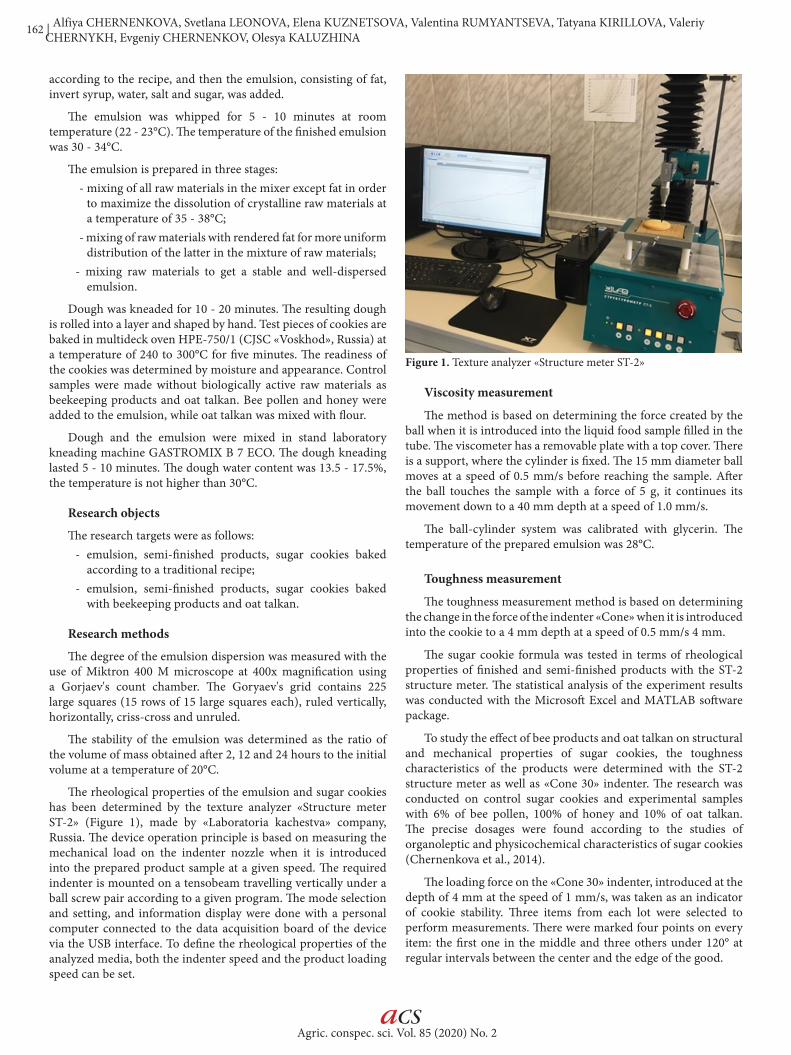
Figure 1. Texture analyzer «Structure meter ST-2»
according to the recipe, and then the emulsion, consisting of fat, invert syrup, water, salt and sugar, was added.
The emulsion was whipped for 5 - 10 minutes at room temperature (22 - 23°C). The temperature of the finished emulsion was 30 - 34°C.
The emulsion is prepared in three stages:- mixing of all raw materials in the mixer except fat in order
to maximize the dissolution of crystalline raw materials at a temperature of 35 - 38°C;
- mixing of raw materials with rendered fat for more uniform distribution of the latter in the mixture of raw materials;
- mixing raw materials to get a stable and well-dispersed emulsion.
Dough was kneaded for 10 - 20 minutes. The resulting dough is rolled into a layer and shaped by hand. Test pieces of cookies are baked in multideck oven HPE-750/1 (CJSC «Voskhod», Russia) at a temperature of 240 to 300°C for five minutes. The readiness of the cookies was determined by moisture and appearance. Control samples were made without biologically active raw materials as beekeeping products and oat talkan. Bee pollen and honey were added to the emulsion, while oat talkan was mixed with flour.
Dough and the emulsion were mixed in stand laboratory kneading machine GASTROMIX B 7 ECO. The dough kneading lasted 5 - 10 minutes. The dough water content was 13.5 - 17.5%, the temperature is not higher than 30°C.
Research objects
The research targets were as follows:- emulsion, semi-finished products, sugar cookies baked
according to a traditional recipe;- emulsion, semi-finished products, sugar cookies baked
with beekeeping products and oat talkan.
Research methods
The degree of the emulsion dispersion was measured with the use of Miktron 400 M microscope at 400х magnification using a Gorjaev's count chamber. The Goryaev's grid contains 225 large squares (15 rows of 15 large squares each), ruled vertically, horizontally, criss-cross and unruled.
The stability of the emulsion was determined as the ratio of the volume of mass obtained after 2, 12 and 24 hours to the initial volume at a temperature of 20°C.
The rheological properties of the emulsion and sugar cookies has been determined by the texture analyzer «Structure meter ST-2» (Figure 1), made by «Laboratoria kachestva» company, Russia. The device operation principle is based on measuring the mechanical load on the indenter nozzle when it is introduced into the prepared product sample at a given speed. The required indenter is mounted on a tensobeam travelling vertically under a ball screw pair according to a given program. The mode selection and setting, and information display were done with a personal computer connected to the data acquisition board of the device via the USB interface. To define the rheological properties of the analyzed media, both the indenter speed and the product loading speed can be set.
Viscosity measurement
The method is based on determining the force created by the ball when it is introduced into the liquid food sample filled in the tube. The viscometer has a removable plate with a top cover. There is a support, where the cylinder is fixed. The 15 mm diameter ball moves at a speed of 0.5 mm/s before reaching the sample. After the ball touches the sample with a force of 5 g, it continues its movement down to a 40 mm depth at a speed of 1.0 mm/s.
The ball-cylinder system was calibrated with glycerin. The temperature of the prepared emulsion was 28°C.
Toughness measurement
The toughness measurement method is based on determining the change in the force of the indenter «Cone» when it is introduced into the cookie to a 4 mm depth at a speed of 0.5 mm/s 4 mm.
The sugar cookie formula was tested in terms of rheological properties of finished and semi-finished products with the ST-2 structure meter. The statistical analysis of the experiment results was conducted with the Microsoft Excel and MATLAB software package.
To study the effect of bee products and oat talkan on structural and mechanical properties of sugar cookies, the toughness characteristics of the products were determined with the ST-2 structure meter as well as «Cone 30» indenter. The research was conducted on control sugar cookies and experimental samples with 6% of bee pollen, 100% of honey and 10% of oat talkan. The precise dosages were found according to the studies of organoleptic and physicochemical characteristics of sugar cookies (Chernenkova et al., 2014).
The loading force on the «Cone 30» indenter, introduced at the depth of 4 mm at the speed of 1 mm/s, was taken as an indicator of cookie stability. Three items from each lot were selected to perform measurements. There were marked four points on every item: the first one in the middle and three others under 120° at regular intervals between the center and the edge of the good.
Agric. conspec. sci. Vol. 85 (2020) No. 2
Improving Sugar Cookie Recipe with Functional Properties | 163
aCS
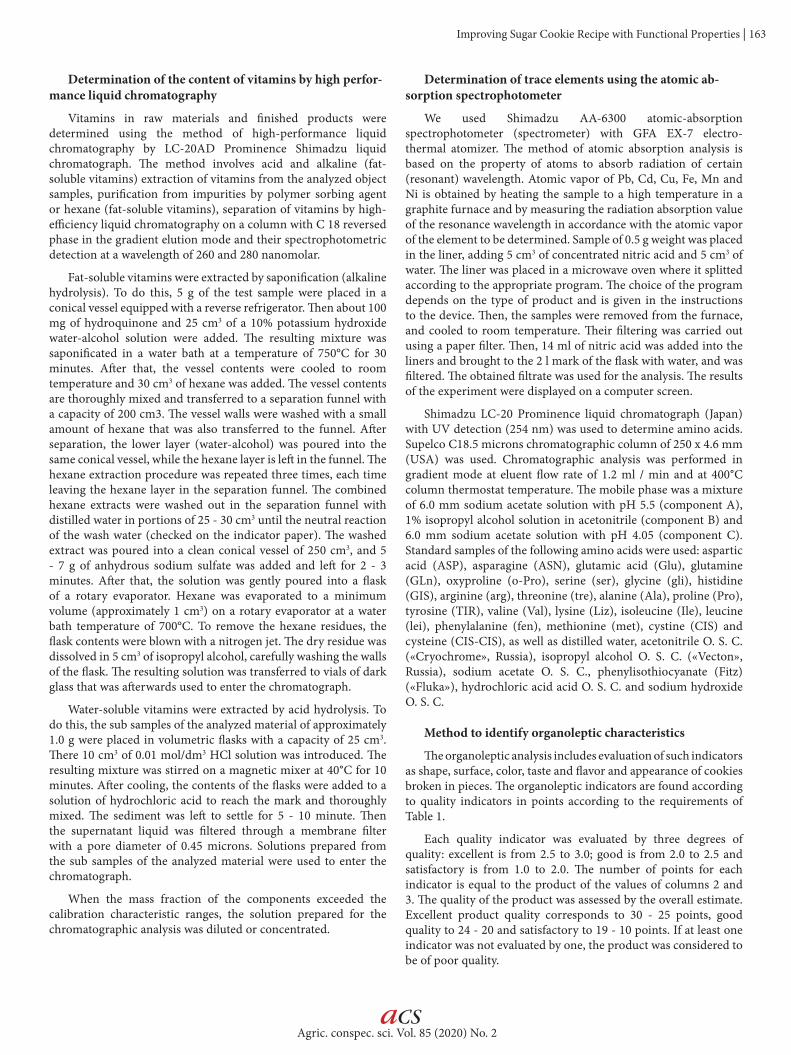
Determination of the content of vitamins by high perfor-mance liquid chromatography
Vitamins in raw materials and finished products were determined using the method of high-performance liquid chromatography by LC-20AD Prominence Shimadzu liquid chromatograph. The method involves acid and alkaline (fat-soluble vitamins) extraction of vitamins from the analyzed object samples, purification from impurities by polymer sorbing agent or hexane (fat-soluble vitamins), separation of vitamins by high-efficiency liquid chromatography on a column with C 18 reversed phase in the gradient elution mode and their spectrophotometric detection at a wavelength of 260 and 280 nanomolar.
Fat-soluble vitamins were extracted by saponification (alkaline hydrolysis). To do this, 5 g of the test sample were placed in a conical vessel equipped with a reverse refrigerator. Then about 100 mg of hydroquinone and 25 cm3 of a 10% potassium hydroxide water-alcohol solution were added. The resulting mixture was saponificated in a water bath at a temperature of 750°C for 30 minutes. After that, the vessel contents were cooled to room temperature and 30 cm3 of hexane was added. The vessel contents are thoroughly mixed and transferred to a separation funnel with a capacity of 200 cm3. The vessel walls were washed with a small amount of hexane that was also transferred to the funnel. After separation, the lower layer (water-alcohol) was poured into the same conical vessel, while the hexane layer is left in the funnel. The hexane extraction procedure was repeated three times, each time leaving the hexane layer in the separation funnel. The combined hexane extracts were washed out in the separation funnel with distilled water in portions of 25 - 30 cm3 until the neutral reaction of the wash water (checked on the indicator paper). The washed extract was poured into a clean conical vessel of 250 cm3, and 5 - 7 g of anhydrous sodium sulfate was added and left for 2 - 3 minutes. After that, the solution was gently poured into a flask of a rotary evaporator. Hexane was evaporated to a minimum volume (approximately 1 cm3) on a rotary evaporator at a water bath temperature of 700°C. To remove the hexane residues, the flask contents were blown with a nitrogen jet. The dry residue was dissolved in 5 cm3 of isopropyl alcohol, carefully washing the walls of the flask. The resulting solution was transferred to vials of dark glass that was afterwards used to enter the chromatograph.
Water-soluble vitamins were extracted by acid hydrolysis. To do this, the sub samples of the analyzed material of approximately 1.0 g were placed in volumetric flasks with a capacity of 25 cm3. There 10 cm3 of 0.01 mol/dm3 HCl solution was introduced. The resulting mixture was stirred on a magnetic mixer at 40°C for 10 minutes. After cooling, the contents of the flasks were added to a solution of hydrochloric acid to reach the mark and thoroughly mixed. The sediment was left to settle for 5 - 10 minute. Then the supernatant liquid was filtered through a membrane filter with a pore diameter of 0.45 microns. Solutions prepared from the sub samples of the analyzed material were used to enter the chromatograph.
When the mass fraction of the components exceeded the calibration characteristic ranges, the solution prepared for the chromatographic analysis was diluted or concentrated.
Determination of trace elements using the atomic ab-sorption spectrophotometer
We used Shimadzu AA-6300 atomic-absorption spectrophotometer (spectrometer) with GFA EX-7 electro-thermal atomizer. The method of atomic absorption analysis is based on the property of atoms to absorb radiation of certain (resonant) wavelength. Atomic vapor of Pb, Cd, Cu, Fe, Mn and Ni is obtained by heating the sample to a high temperature in a graphite furnace and by measuring the radiation absorption value of the resonance wavelength in accordance with the atomic vapor of the element to be determined. Sample of 0.5 g weight was placed in the liner, adding 5 cm3 of concentrated nitric acid and 5 cm3 of water. The liner was placed in a microwave oven where it splitted according to the appropriate program. The choice of the program depends on the type of product and is given in the instructions to the device. Then, the samples were removed from the furnace, and cooled to room temperature. Their filtering was carried out using a paper filter. Then, 14 ml of nitric acid was added into the liners and brought to the 2 l mark of the flask with water, and was filtered. The obtained filtrate was used for the analysis. The results of the experiment were displayed on a computer screen.
Shimadzu LC-20 Prominence liquid chromatograph (Japan) with UV detection (254 nm) was used to determine amino acids. Supelco C18.5 microns chromatographic column of 250 x 4.6 mm (USA) was used. Chromatographic analysis was performed in gradient mode at eluent flow rate of 1.2 ml / min and at 400°C column thermostat temperature. The mobile phase was a mixture of 6.0 mm sodium acetate solution with pH 5.5 (component A), 1% isopropyl alcohol solution in acetonitrile (component B) and 6.0 mm sodium acetate solution with pH 4.05 (component C). Standard samples of the following amino acids were used: aspartic acid (ASP), asparagine (ASN), glutamic acid (Glu), glutamine (GLn), oxyproline (o-Pro), serine (ser), glycine (gli), histidine (GIS), arginine (arg), threonine (tre), alanine (Ala), proline (Pro), tyrosine (TIR), valine (Val), lysine (Liz), isoleucine (Ile), leucine (lei), phenylalanine (fen), methionine (met), cystine (CIS) and cysteine (CIS-CIS), as well as distilled water, acetonitrile O. S. C. («Cryochrome», Russia), isopropyl alcohol O. S. C. («Vecton», Russia), sodium acetate O. S. C., phenylisothiocyanate (Fitz) («Fluka»), hydrochloric acid acid O. S. C. and sodium hydroxide O. S. C.
Method to identify organoleptic characteristics
The organoleptic analysis includes evaluation of such indicators as shape, surface, color, taste and flavor and appearance of cookies broken in pieces. The organoleptic indicators are found according to quality indicators in points according to the requirements of Table 1.
Each quality indicator was evaluated by three degrees of quality: excellent is from 2.5 to 3.0; good is from 2.0 to 2.5 and satisfactory is from 1.0 to 2.0. The number of points for each indicator is equal to the product of the values of columns 2 and 3. The quality of the product was assessed by the overall estimate. Excellent product quality corresponds to 30 - 25 points, good quality to 24 - 20 and satisfactory to 19 - 10 points. If at least one indicator was not evaluated by one, the product was considered to be of poor quality.
Agric. conspec. sci. Vol. 85 (2020) No. 2
164 | Alfiya CHERNENKOVA, Svetlana LEONOVA, Elena KUZNETSOVA, Valentina RUMYANTSEVA, Tatyana KIRILLOVA, Valeriy CHERNYKH, Evgeniy CHERNENKOV, Olesya KALUZHINA
aCS
Table 2. Organoleptic assessment of the product quality on a 30-point scaleProduct quality indicators
Indicatorrating
Number ofquality degrees
Assessment, points (max)
Shape 1 1 - 3
Color and appearance 2 1 - 3
Structure and texture 3 1 - 3
Taste and flavor 4 1 - 3
Total estimate Σ
Method to evaluate moisture content
The crushed test portion of not more than 5 g with inaccuracy of measurement not more than 001 g was weighed in pre-dried and weighed bottles. The opened weighing bottles with test portions were placed in the electrical dryer SESH-3M-02 with a contact or technical thermostat, heated to a temperature of (130 ± 2)°C. The drying period was 30 minutes. At the end of drying, the weighing bottles with the test portions were loosely covered and placed in the desiccator for 30 minutes. Then they were tightly closed and weighed. The moisture content (X) as a percentage was calculated by the formula,
X = ((m1 − m2) / m) × 100
wherem1 is the weight of the weighing bottle with the test portion before drying, g; m2 is the weight of the weighing bottle with the test portion after drying, g; m is weight of the product test portion, g.
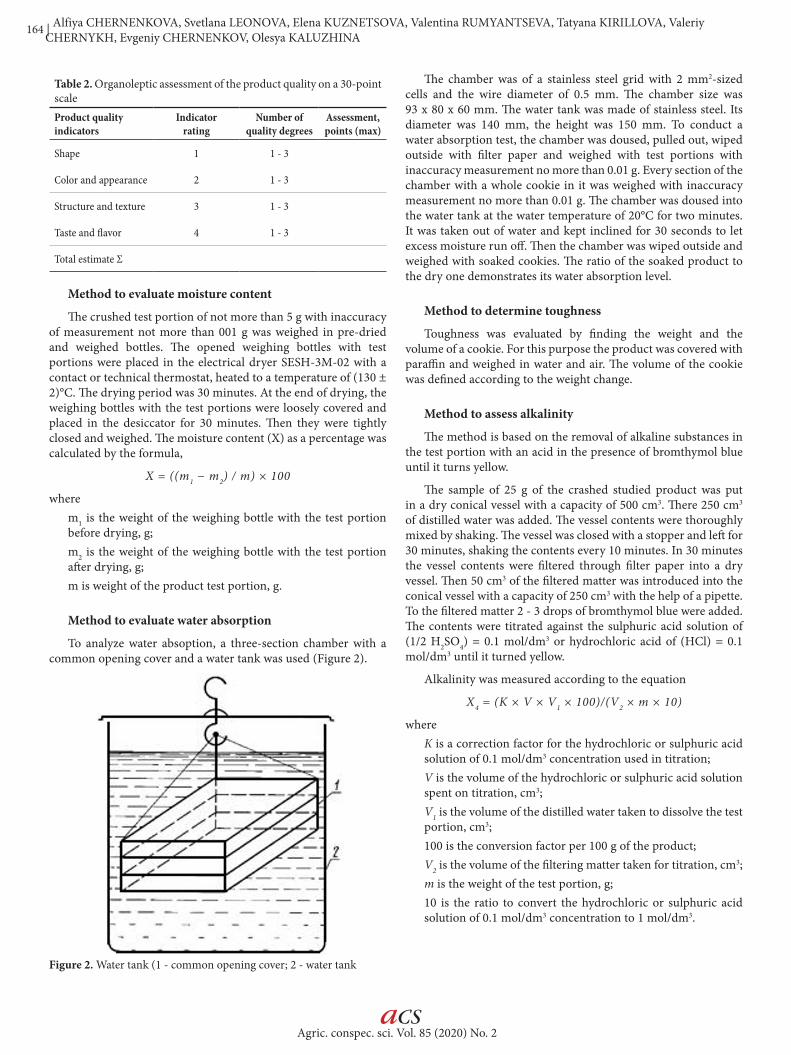
Method to evaluate water absorption
To analyze water absoption, a three-section chamber with a common opening cover and a water tank was used (Figure 2).
Figure 2. Water tank (1 - common opening cover; 2 - water tank
The chamber was of a stainless steel grid with 2 mm2-sized cells and the wire diameter of 0.5 mm. The chamber size was 93 х 80 х 60 mm. The water tank was made of stainless steel. Its diameter was 140 mm, the height was 150 mm. To conduct a water absorption test, the chamber was doused, pulled out, wiped outside with filter paper and weighed with test portions with inaccuracy measurement no more than 0.01 g. Every section of the chamber with a whole cookie in it was weighed with inaccuracy measurement no more than 0.01 g. The chamber was doused into the water tank at the water temperature of 20°С for two minutes. It was taken out of water and kept inclined for 30 seconds to let excess moisture run off. Then the chamber was wiped outside and weighed with soaked cookies. The ratio of the soaked product to the dry one demonstrates its water absorption level.
Method to determine toughness
Toughness was evaluated by finding the weight and the volume of a cookie. For this purpose the product was covered with paraffin and weighed in water and air. The volume of the cookie was defined according to the weight change.
Method to assess alkalinity
The method is based on the removal of alkaline substances in the test portion with an acid in the presence of bromthymol blue until it turns yellow.
The sample of 25 g of the crashed studied product was put in a dry conical vessel with a capacity of 500 cm3. There 250 cm3 of distilled water was added. The vessel contents were thoroughly mixed by shaking. The vessel was closed with a stopper and left for 30 minutes, shaking the contents every 10 minutes. In 30 minutes the vessel contents were filtered through filter paper into a dry vessel. Then 50 cm3 of the filtered matter was introduced into the conical vessel with a capacity of 250 cm3 with the help of a pipette. To the filtered matter 2 - 3 drops of bromthymol blue were added. The contents were titrated against the sulphuric acid solution of (1/2 H2SО4) = 0.1 mol/dm3 or hydrochloric acid of (НCl) = 0.1 mol/dm3 until it turned yellow.
Alkalinity was measured according to the equation
X4 = (K × V × V1 × 100)/(V2 × m × 10)
whereК is a correction factor for the hydrochloric or sulphuric acid solution of 0.1 mol/dm3 concentration used in titration;V is the volume of the hydrochloric or sulphuric acid solution spent on titration, cm3;V1 is the volume of the distilled water taken to dissolve the test portion, cm3;100 is the conversion factor per 100 g of the product;V2 is the volume of the filtering matter taken for titration, cm3;m is the weight of the test portion, g;10 is the ratio to convert the hydrochloric or sulphuric acid solution of 0.1 mol/dm3 concentration to 1 mol/dm3.
Agric. conspec. sci. Vol. 85 (2020) No. 2
Improving Sugar Cookie Recipe with Functional Properties | 165
aCS
Methods of statistical analysis of the results
Nonlinear multidimensional statistical models have been developed to quantify the effect of the dosage of beekeeping products and oat talkan on the organoleptic and physicochemical parameters of sugar cookies. The input parameters of the model are the dosage of pollen pellet, honey and oat talkan. Controlled parameters of the model: moisture, solubility, alkalinity and toughness.
All physicochemical and organoleptic indicators and their arithmetic means were determined during three replications.
The multiple correlation coefficients (correlation index) is appropriate to evaluate the quality. After the regression equation is derived, there is its verification as a whole and of individual parameters. It is necessary to assess the significance of the regression equation, i.e. to determine whether a mathematical model that expresses the relationship between x, y and z corresponds to the actual data and whether there are enough explanatory variables included in the equation to describe the dependent variable z. Assessing the significance of the regression equation allows us to know whether the regression equation is suitable for practical use (for example, for forecasting) or not. At the same time, we put forward the main hypothesis about the insignificance of the equation as a whole, which formally reduces to the hypothesis that the regression parameters are zero.
Fisher's ratio test used to test the significance of the regression model, is calculated as the ratio of the variances of the basic series and the unbiased variance of the residual component. Checking the significance of individual regression coefficients is associated with determining the calculated values of t-test (t-statistics) for the corresponding regression coefficients. The analysis of the model parameters statistical significance (regression coefficients) is carried out using t-statistics by testing the hypothesis that the j-th parameter of the equation is equal to zero.
Determination coefficient (R2) is the most common statistics for evaluating the model quality. R2 is calculated using the following formula:
Ry y
y y1
ii
n
i ii
n
2
1
1= --
-
=
=RR W
Wv//
wheren is the number of observations;yi is the values of the explained variable; - the average value of the explained variable;ỹi is the model values built according to the estimated parameters.
R2 takes on a value from 0 to 1 and demonstrates the fraction of the explained variance of the explained series. The closer R2 is to 1, the better the model is, and the smaller the fraction of the unexplained.
Truncated Taylor series with nonlinear terms were applied to make an adequate mathematical description of the response surface in the experimental area.
/y y nii
n
1=
=/
, !,
f x y kT f x yk
k
0 0
0
=3
=
RR
WW/
where
To determine the optimal dosage of beekeeping products and oat talkan necessary for making sugar cookies, a mathematical optimization model was designed. This model is based on four criteria:f1(x,y,z)=x→max; f2(x,y,z)=y→max; f3(x,y,z)=z→maxf4(x,y,z)=u1(x,y,z) when constraints are
is the differential operator.
Using the goal programming method, a multi-objective optimization problem is rearranged to a single-objective problem of deviation sum minimization with the indicator p:
, , ;
, , ;
, , , ;
, , , ;
; , ;
u x y z
u x y z
u x y z
u x y z
x y z
10
180
0 5
1 6
1 100 0 12 5 0 10
2
3
4
5
#
$
#
#
# # # # # #
R
R
RR
W
W
WW
Z
[
\
]]]]]]]]]]]]]]]]]]
, ,minG W
ff x y z f
kk
K
k
k kp p
1
1
"=-
=
U R W Z/where
Wk is some weight coefficients that characterize the importance of a particular criterion, - the values of target functions for each criterion of the optimal plan,p is a parameter,k is the number of target functions. If p=4 and Wk=1, we obtain the following minimization problem
with a criterion and constraints:
, , ...,f f fk1 2
, ,minG W
ff x y z f
kk k
k k
1
4 2 21
"=-
=
U R W Z/
, , ;
, , ;
, , , ;
, , , ;
; , ;
u x y z
u x y z
u x y z
u x y z
x y z
10
180
0 5
1 6
1 100 0 12 5 0 10
2
3
4
5
#
$
#
#
# # # # # #
R
R
RR
W
W
WW
Z
[
\
]]]]]]]]]]]]]]]]]]
wheref1 is the maximum of the first criterion,f2 is the maximum of the second criterion,f3 is the maximum of the third criterion, and wheref4 is the maximum of the fourth criterion.The optimization problem for each criterion was solved using
the «Solver» procedure in the MATLAB computer program.
Results and DiscussionsTraditional products are subject to functional modifications
when developing formulas and production technologies of functional food products. This provides more essential nutrients as required by the reference intake. Cereal products, especially flour confectionery goods are one of the promising products to get their formula modified in order to attribute functional properties.
Agric. conspec. sci. Vol. 85 (2020) No. 2
166 | Alfiya CHERNENKOVA, Svetlana LEONOVA, Elena KUZNETSOVA, Valentina RUMYANTSEVA, Tatyana KIRILLOVA, Valeriy CHERNYKH, Evgeniy CHERNENKOV, Olesya KALUZHINA
aCS
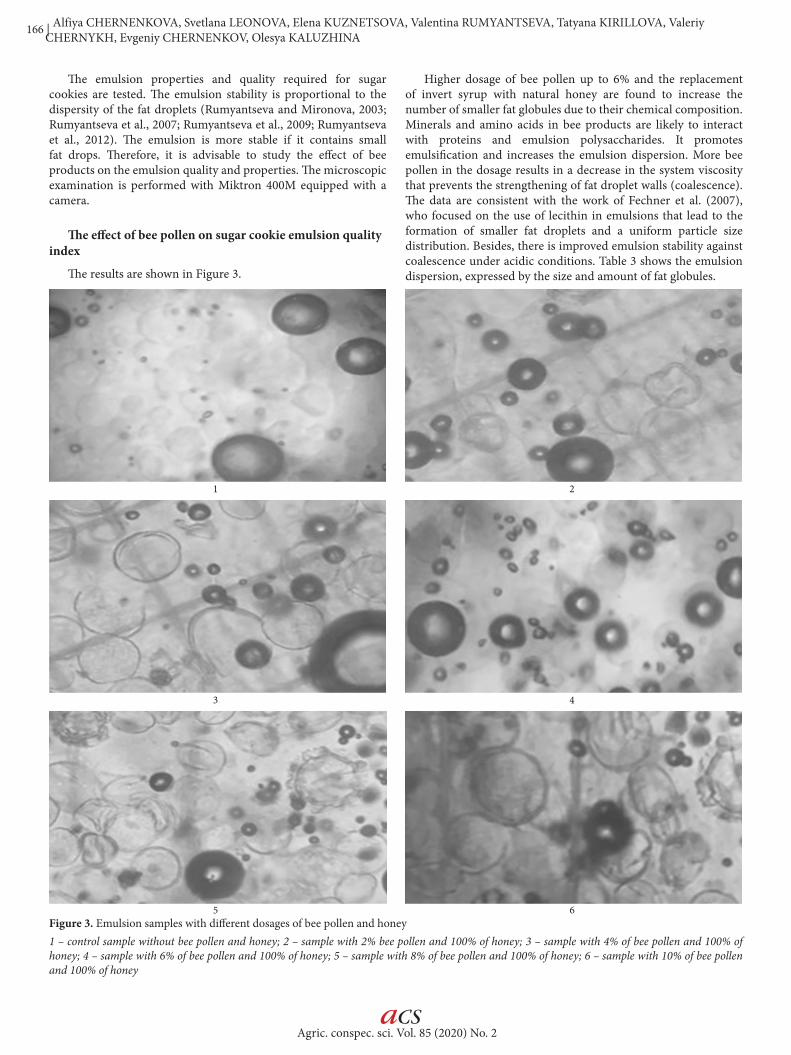
The emulsion properties and quality required for sugar cookies are tested. The emulsion stability is proportional to the dispersity of the fat droplets (Rumyantseva and Mironova, 2003; Rumyantseva et al., 2007; Rumyantseva et al., 2009; Rumyantseva et al., 2012). The emulsion is more stable if it contains small fat drops. Therefore, it is advisable to study the effect of bee products on the emulsion quality and properties. The microscopic examination is performed with Miktron 400M equipped with a camera.
The effect of bee pollen on sugar cookie emulsion quality index
The results are shown in Figure 3.
Higher dosage of bee pollen up to 6% and the replacement of invert syrup with natural honey are found to increase the number of smaller fat globules due to their chemical composition. Minerals and amino acids in bee products are likely to interact with proteins and emulsion polysaccharides. It promotes emulsification and increases the emulsion dispersion. More bee pollen in the dosage results in a decrease in the system viscosity that prevents the strengthening of fat droplet walls (coalescence). The data are consistent with the work of Fechner et al. (2007), who focused on the use of lecithin in emulsions that lead to the formation of smaller fat droplets and a uniform particle size distribution. Besides, there is improved emulsion stability against coalescence under acidic conditions. Table 3 shows the emulsion dispersion, expressed by the size and amount of fat globules.
Figure 3. Emulsion samples with different dosages of bee pollen and honey1 – control sample without bee pollen and honey; 2 – sample with 2% bee pollen and 100% of honey; 3 – sample with 4% of bee pollen and 100% of honey; 4 – sample with 6% of bee pollen and 100% of honey; 5 – sample with 8% of bee pollen and 100% of honey; 6 – sample with 10% of bee pollen and 100% of honey
6
1 2
3 4
5
Agric. conspec. sci. Vol. 85 (2020) No. 2
Improving Sugar Cookie Recipe with Functional Properties | 167
aCS
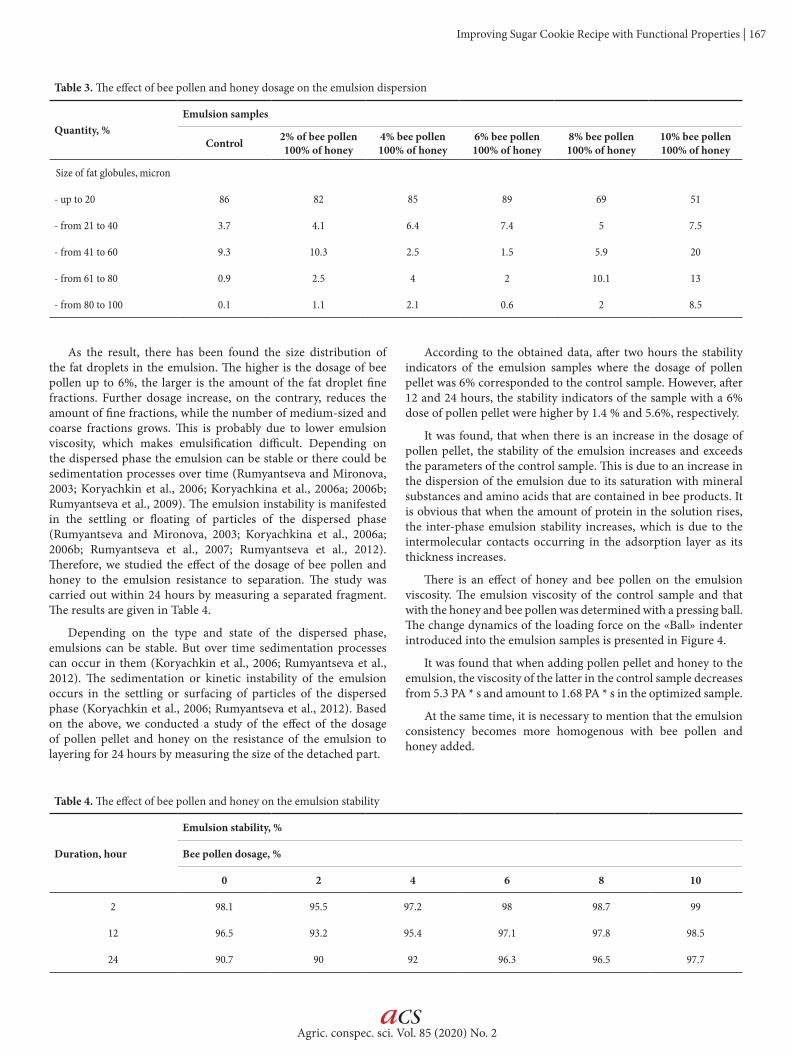
As the result, there has been found the size distribution of the fat droplets in the emulsion. The higher is the dosage of bee pollen up to 6%, the larger is the amount of the fat droplet fine fractions. Further dosage increase, on the contrary, reduces the amount of fine fractions, while the number of medium-sized and coarse fractions grows. This is probably due to lower emulsion viscosity, which makes emulsification difficult. Depending on the dispersed phase the emulsion can be stable or there could be sedimentation processes over time (Rumyantseva and Mironova, 2003; Koryachkin et al., 2006; Koryachkina et al., 2006a; 2006b; Rumyantseva et al., 2009). The emulsion instability is manifested in the settling or floating of particles of the dispersed phase (Rumyantseva and Mironova, 2003; Koryachkina et al., 2006a; 2006b; Rumyantseva et al., 2007; Rumyantseva et al., 2012). Therefore, we studied the effect of the dosage of bee pollen and honey to the emulsion resistance to separation. The study was carried out within 24 hours by measuring a separated fragment. The results are given in Table 4.
Depending on the type and state of the dispersed phase, emulsions can be stable. But over time sedimentation processes can occur in them (Koryachkin et al., 2006; Rumyantseva et al., 2012). The sedimentation or kinetic instability of the emulsion occurs in the settling or surfacing of particles of the dispersed phase (Koryachkin et al., 2006; Rumyantseva et al., 2012). Based on the above, we conducted a study of the effect of the dosage of pollen pellet and honey on the resistance of the emulsion to layering for 24 hours by measuring the size of the detached part.
Table 3. The effect of bee pollen and honey dosage on the emulsion dispersion
Quantity, %Emulsion samples
Control 2% of bee pollen 100% of honey
4% bee pollen 100% of honey
6% bee pollen 100% of honey
8% bee pollen 100% of honey
10% bee pollen 100% of honey
Size of fat globules, micron
- up to 20 86 82 85 89 69 51
- from 21 to 40 3.7 4.1 6.4 7.4 5 7.5
- from 41 to 60 9.3 10.3 2.5 1.5 5.9 20
- from 61 to 80 0.9 2.5 4 2 10.1 13
- from 80 to 100 0.1 1.1 2.1 0.6 2 8.5
Table 4. The effect of bee pollen and honey on the emulsion stability
Duration, hour
Emulsion stability, %
Bee pollen dosage, %
0 2 4 6 8 10
2 98.1 95.5 97.2 98 98.7 99
12 96.5 93.2 95.4 97.1 97.8 98.5
24 90.7 90 92 96.3 96.5 97.7
According to the obtained data, after two hours the stability indicators of the emulsion samples where the dosage of pollen pellet was 6% corresponded to the control sample. However, after 12 and 24 hours, the stability indicators of the sample with a 6% dose of pollen pellet were higher by 1.4 % and 5.6%, respectively.
It was found, that when there is an increase in the dosage of pollen pellet, the stability of the emulsion increases and exceeds the parameters of the control sample. This is due to an increase in the dispersion of the emulsion due to its saturation with mineral substances and amino acids that are contained in bee products. It is obvious that when the amount of protein in the solution rises, the inter-phase emulsion stability increases, which is due to the intermolecular contacts occurring in the adsorption layer as its thickness increases.
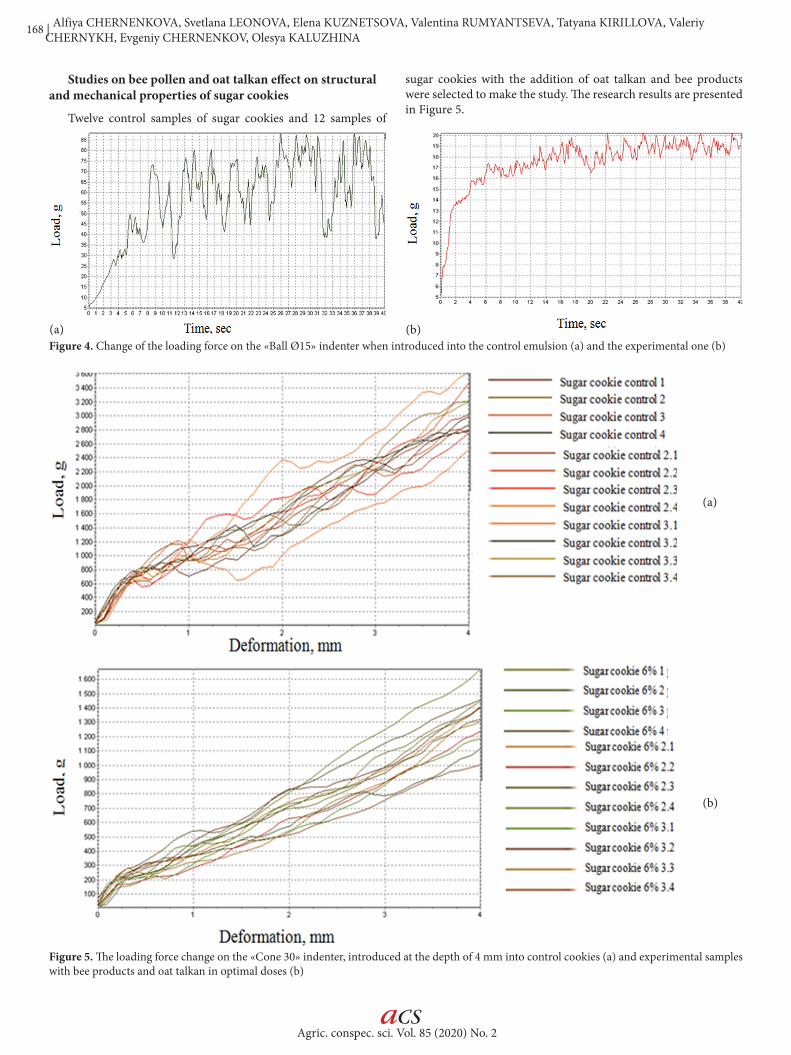
There is an effect of honey and bee pollen on the emulsion viscosity. The emulsion viscosity of the control sample and that with the honey and bee pollen was determined with a pressing ball. The change dynamics of the loading force on the «Ball» indenter introduced into the emulsion samples is presented in Figure 4.
It was found that when adding pollen pellet and honey to the emulsion, the viscosity of the latter in the control sample decreases from 5.3 PA * s and amount to 1.68 PA * s in the optimized sample.
At the same time, it is necessary to mention that the emulsion consistency becomes more homogenous with bee pollen and honey added.
Agric. conspec. sci. Vol. 85 (2020) No. 2
168 | Alfiya CHERNENKOVA, Svetlana LEONOVA, Elena KUZNETSOVA, Valentina RUMYANTSEVA, Tatyana KIRILLOVA, Valeriy CHERNYKH, Evgeniy CHERNENKOV, Olesya KALUZHINA
aCS
Studies on bee pollen and oat talkan effect on structural and mechanical properties of sugar cookies
Twelve control samples of sugar cookies and 12 samples of
Figure 4. Change of the loading force on the «Ball Ø15» indenter when introduced into the control emulsion (a) and the experimental one (b)
sugar cookies with the addition of oat talkan and bee products were selected to make the study. The research results are presented in Figure 5.
(a) (b)
Figure 5. The loading force change on the «Cone 30» indenter, introduced at the depth of 4 mm into control cookies (a) and experimental samples with bee products and oat talkan in optimal doses (b)
(a)
(b)
Agric. conspec. sci. Vol. 85 (2020) No. 2
Improving Sugar Cookie Recipe with Functional Properties | 169
aCS
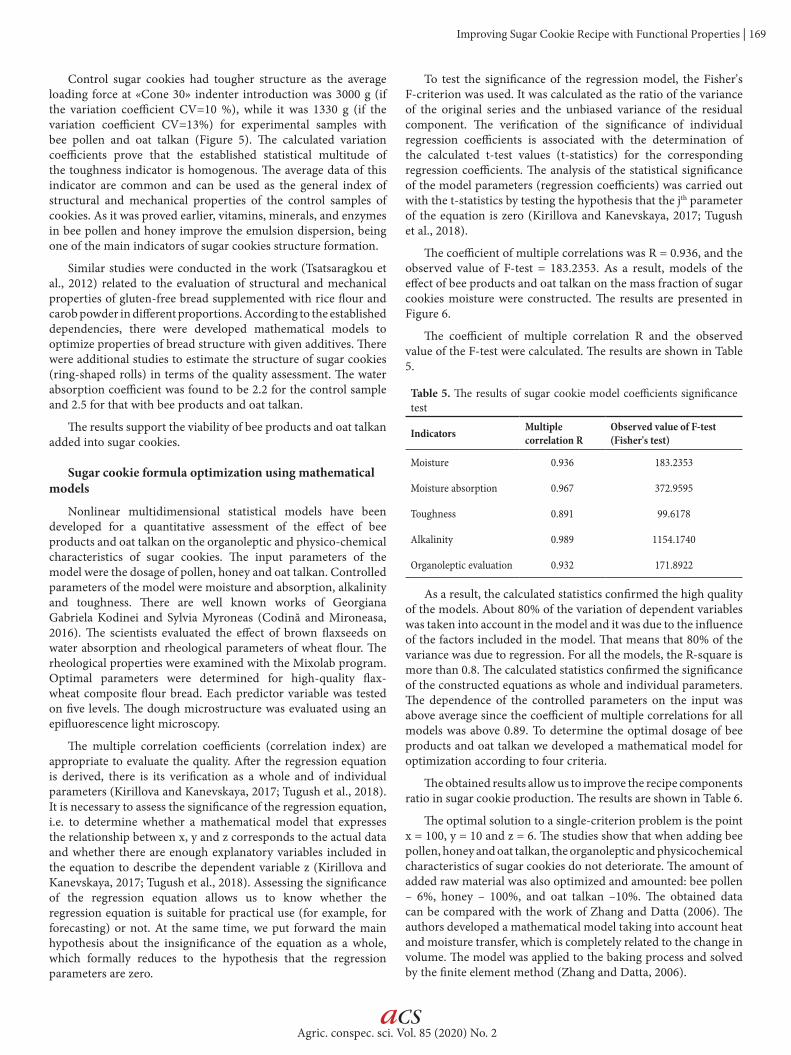
Control sugar cookies had tougher structure as the average loading force at «Cone 30» indenter introduction was 3000 g (if the variation coefficient CV=10 %), while it was 1330 g (if the variation coefficient CV=13%) for experimental samples with bee pollen and oat talkan (Figure 5). The calculated variation coefficients prove that the established statistical multitude of the toughness indicator is homogenous. The average data of this indicator are common and can be used as the general index of structural and mechanical properties of the control samples of cookies. As it was proved earlier, vitamins, minerals, and enzymes in bee pollen and honey improve the emulsion dispersion, being one of the main indicators of sugar cookies structure formation.
Similar studies were conducted in the work (Tsatsaragkou et al., 2012) related to the evaluation of structural and mechanical properties of gluten-free bread supplemented with rice flour and carob powder in different proportions. According to the established dependencies, there were developed mathematical models to optimize properties of bread structure with given additives. There were additional studies to estimate the structure of sugar cookies (ring-shaped rolls) in terms of the quality assessment. The water absorption coefficient was found to be 2.2 for the control sample and 2.5 for that with bee products and oat talkan.
The results support the viability of bee products and oat talkan added into sugar cookies.
Sugar cookie formula optimization using mathematical models
Nonlinear multidimensional statistical models have been developed for a quantitative assessment of the effect of bee products and oat talkan on the organoleptic and physico-chemical characteristics of sugar cookies. The input parameters of the model were the dosage of pollen, honey and oat talkan. Controlled parameters of the model were moisture and absorption, alkalinity and toughness. There are well known works of Georgiana Gabriela Kodinei and Sylvia Myroneas (Codină and Mironeasa, 2016). The scientists evaluated the effect of brown flaxseeds on water absorption and rheological parameters of wheat flour. The rheological properties were examined with the Mixolab program. Optimal parameters were determined for high-quality flax-wheat composite flour bread. Each predictor variable was tested on five levels. The dough microstructure was evaluated using an epifluorescence light microscopy.
The multiple correlation coefficients (correlation index) are appropriate to evaluate the quality. After the regression equation is derived, there is its verification as a whole and of individual parameters (Kirillova and Kanevskaya, 2017; Tugush et al., 2018). It is necessary to assess the significance of the regression equation, i.e. to determine whether a mathematical model that expresses the relationship between x, y and z corresponds to the actual data and whether there are enough explanatory variables included in the equation to describe the dependent variable z (Kirillova and Kanevskaya, 2017; Tugush et al., 2018). Assessing the significance of the regression equation allows us to know whether the regression equation is suitable for practical use (for example, for forecasting) or not. At the same time, we put forward the main hypothesis about the insignificance of the equation as a whole, which formally reduces to the hypothesis that the regression parameters are zero.
To test the significance of the regression model, the Fisher's F-criterion was used. It was calculated as the ratio of the variance of the original series and the unbiased variance of the residual component. The verification of the significance of individual regression coefficients is associated with the determination of the calculated t-test values (t-statistics) for the corresponding regression coefficients. The analysis of the statistical significance of the model parameters (regression coefficients) was carried out with the t-statistics by testing the hypothesis that the jth parameter of the equation is zero (Kirillova and Kanevskaya, 2017; Tugush et al., 2018).
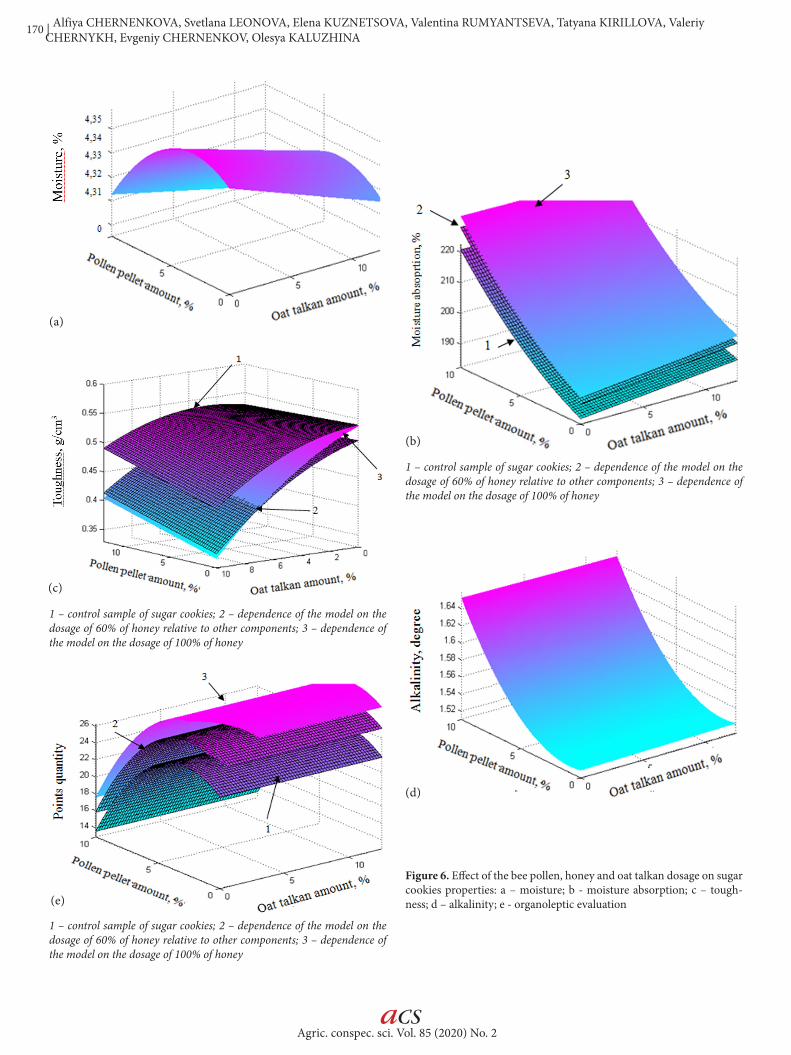
The coefficient of multiple correlations was R = 0.936, and the observed value of F-test = 183.2353. As a result, models of the effect of bee products and oat talkan on the mass fraction of sugar cookies moisture were constructed. The results are presented in Figure 6.
The coefficient of multiple correlation R and the observed value of the F-test were calculated. The results are shown in Table 5.
Table 5. The results of sugar cookie model coefficients significance test
Indicators Multiplecorrelation R
Observed value of F-test(Fisher's test)
Moisture 0.936 183.2353
Moisture absorption 0.967 372.9595
Toughness 0.891 99.6178
Alkalinity 0.989 1154.1740
Organoleptic evaluation 0.932 171.8922
As a result, the calculated statistics confirmed the high quality of the models. About 80% of the variation of dependent variables was taken into account in the model and it was due to the influence of the factors included in the model. That means that 80% of the variance was due to regression. For all the models, the R-square is more than 0.8. The calculated statistics confirmed the significance of the constructed equations as whole and individual parameters. The dependence of the controlled parameters on the input was above average since the coefficient of multiple correlations for all models was above 0.89. To determine the optimal dosage of bee products and oat talkan we developed a mathematical model for optimization according to four criteria.
The obtained results allow us to improve the recipe components ratio in sugar cookie production. The results are shown in Table 6.
The optimal solution to a single-criterion problem is the point x = 100, y = 10 and z = 6. The studies show that when adding bee pollen, honey and oat talkan, the organoleptic and physicochemical characteristics of sugar cookies do not deteriorate. The amount of added raw material was also optimized and amounted: bee pollen – 6%, honey – 100%, and oat talkan –10%. The obtained data can be compared with the work of Zhang and Datta (2006). The authors developed a mathematical model taking into account heat and moisture transfer, which is completely related to the change in volume. The model was applied to the baking process and solved by the finite element method (Zhang and Datta, 2006).
Agric. conspec. sci. Vol. 85 (2020) No. 2
170 | Alfiya CHERNENKOVA, Svetlana LEONOVA, Elena KUZNETSOVA, Valentina RUMYANTSEVA, Tatyana KIRILLOVA, Valeriy CHERNYKH, Evgeniy CHERNENKOV, Olesya KALUZHINA
aCS
Figure 6. Effect of the bee pollen, honey and oat talkan dosage on sugar cookies properties: a – moisture; b - moisture absorption; c – tough-ness; d – alkalinity; e - organoleptic evaluation
(a)
(b)
1 – control sample of sugar cookies; 2 – dependence of the model on the dosage of 60% of honey relative to other components; 3 – dependence of the model on the dosage of 100% of honey
1 – control sample of sugar cookies; 2 – dependence of the model on the dosage of 60% of honey relative to other components; 3 – dependence of the model on the dosage of 100% of honey
1 – control sample of sugar cookies; 2 – dependence of the model on the dosage of 60% of honey relative to other components; 3 – dependence of the model on the dosage of 100% of honey
(c)
(d)
(e)
Agric. conspec. sci. Vol. 85 (2020) No. 2
Improving Sugar Cookie Recipe with Functional Properties | 171
aCS
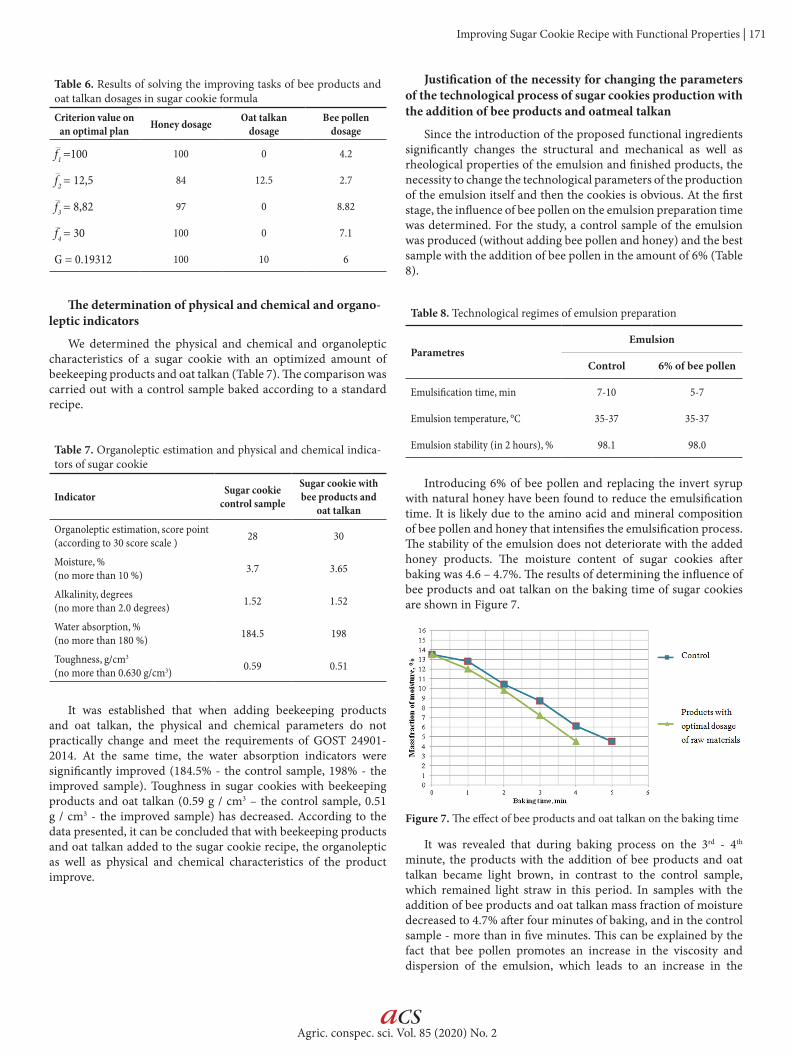
Table 6. Results of solving the improving tasks of bee products and oat talkan dosages in sugar cookie formulaCriterion value on
an optimal plan Honey dosage Oat talkan dosage
Bee pollen dosage
f1 =100 100 0 4.2
f2 = 12,5 84 12.5 2.7
f3 = 8,82 97 0 8.82
f4 = 30 100 0 7.1
G = 0.19312 100 10 6
The determination of physical and chemical and organo-leptic indicators
We determined the physical and chemical and organoleptic characteristics of a sugar cookie with an optimized amount of beekeeping products and oat talkan (Table 7). The comparison was carried out with a control sample baked according to a standard recipe.
Table 7. Organoleptic estimation and physical and chemical indica-tors of sugar cookie
Indicator Sugar cookie control sample
Sugar cookie with bee products and
oat talkan
Organoleptic estimation, score point(according to 30 score scale ) 28 30
Moisture, %(no more than 10 %) 3.7 3.65
Alkalinity, degrees(no more than 2.0 degrees) 1.52 1.52
Water absorption, %(no more than 180 %) 184.5 198
Toughness, g/cm3
(no more than 0.630 g/cm3) 0.59 0.51
It was established that when adding beekeeping products and oat talkan, the physical and chemical parameters do not practically change and meet the requirements of GOST 24901-2014. At the same time, the water absorption indicators were significantly improved (184.5% - the control sample, 198% - the improved sample). Toughness in sugar cookies with beekeeping products and oat talkan (0.59 g / cm3 – the control sample, 0.51 g / cm3 - the improved sample) has decreased. According to the data presented, it can be concluded that with beekeeping products and oat talkan added to the sugar cookie recipe, the organoleptic as well as physical and chemical characteristics of the product improve.
Justification of the necessity for changing the parameters of the technological process of sugar cookies production with the addition of bee products and oatmeal talkan
Since the introduction of the proposed functional ingredients significantly changes the structural and mechanical as well as rheological properties of the emulsion and finished products, the necessity to change the technological parameters of the production of the emulsion itself and then the cookies is obvious. At the first stage, the influence of bee pollen on the emulsion preparation time was determined. For the study, a control sample of the emulsion was produced (without adding bee pollen and honey) and the best sample with the addition of bee pollen in the amount of 6% (Table 8).
Table 8. Technological regimes of emulsion preparation
ParametresEmulsion
Control 6% of bee pollen
Emulsification time, min 7-10 5-7
Emulsion temperature, °С 35-37 35-37
Emulsion stability (in 2 hours), % 98.1 98.0
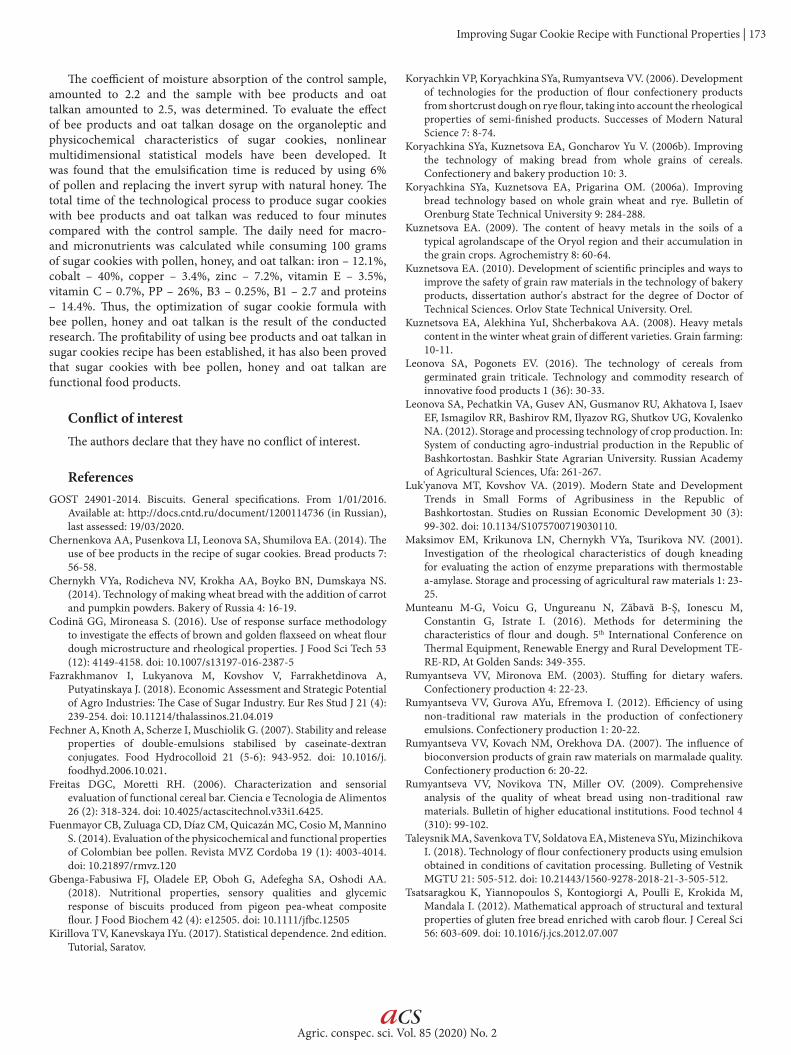
Introducing 6% of bee pollen and replacing the invert syrup with natural honey have been found to reduce the emulsification time. It is likely due to the amino acid and mineral composition of bee pollen and honey that intensifies the emulsification process. The stability of the emulsion does not deteriorate with the added honey products. The moisture content of sugar cookies after baking was 4.6 – 4.7%. The results of determining the influence of bee products and oat talkan on the baking time of sugar cookies are shown in Figure 7.
Figure 7. The effect of bee products and oat talkan on the baking time
It was revealed that during baking process on the 3rd - 4th minute, the products with the addition of bee products and oat talkan became light brown, in contrast to the control sample, which remained light straw in this period. In samples with the addition of bee products and oat talkan mass fraction of moisture decreased to 4.7% after four minutes of baking, and in the control sample - more than in five minutes. This can be explained by the fact that bee pollen promotes an increase in the viscosity and dispersion of the emulsion, which leads to an increase in the
Agric. conspec. sci. Vol. 85 (2020) No. 2
172 | Alfiya CHERNENKOVA, Svetlana LEONOVA, Elena KUZNETSOVA, Valentina RUMYANTSEVA, Tatyana KIRILLOVA, Valeriy CHERNYKH, Evgeniy CHERNENKOV, Olesya KALUZHINA
aCS
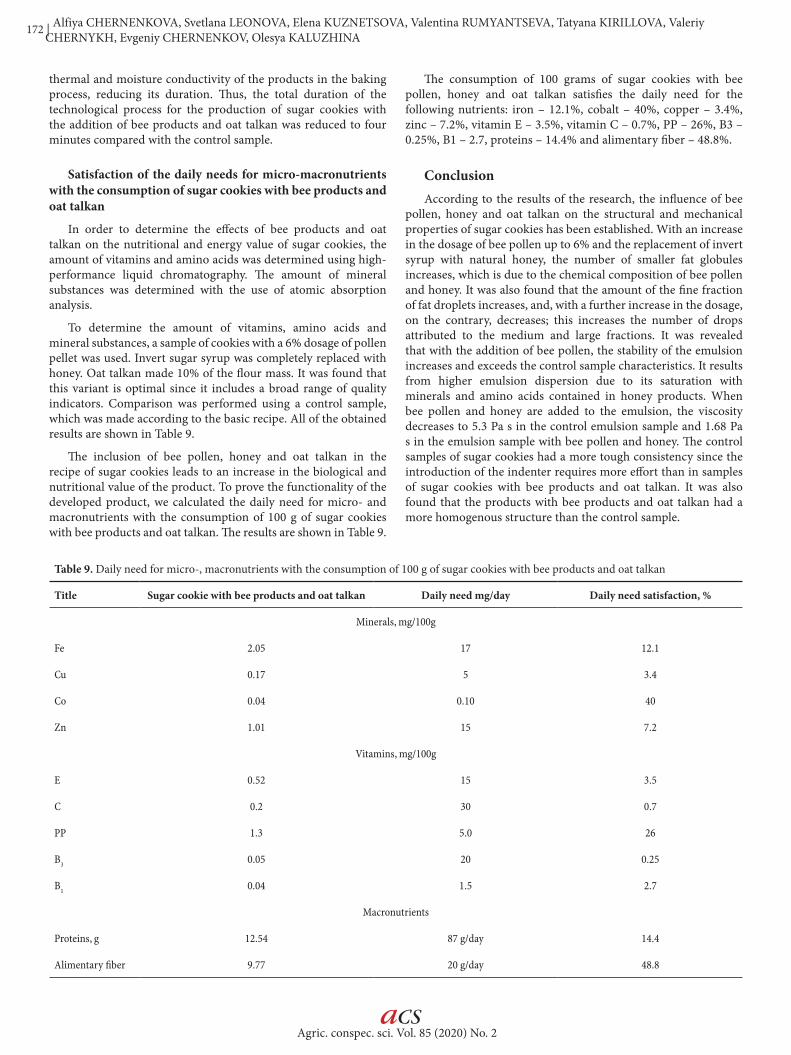
Table 9. Daily need for micro-, macronutrients with the consumption of 100 g of sugar cookies with bee products and oat talkan
Title Sugar cookie with bee products and oat talkan Daily need mg/day Daily need satisfaction, %
Minerals, mg/100g
Fe 2.05 17 12.1
Cu 0.17 5 3.4
Co 0.04 0.10 40
Zn 1.01 15 7.2
Vitamins, mg/100g
E 0.52 15 3.5
C 0.2 30 0.7
PP 1.3 5.0 26
B3 0.05 20 0.25
B1 0.04 1.5 2.7
Macronutrients
Proteins, g 12.54 87 g/day 14.4
Alimentary fiber 9.77 20 g/day 48.8
thermal and moisture conductivity of the products in the baking process, reducing its duration. Thus, the total duration of the technological process for the production of sugar cookies with the addition of bee products and oat talkan was reduced to four minutes compared with the control sample.
Satisfaction of the daily needs for micro-macronutrients with the consumption of sugar cookies with bee products and oat talkan
In order to determine the effects of bee products and oat talkan on the nutritional and energy value of sugar cookies, the amount of vitamins and amino acids was determined using high-performance liquid chromatography. The amount of mineral substances was determined with the use of atomic absorption analysis.
To determine the amount of vitamins, amino acids and mineral substances, a sample of cookies with a 6% dosage of pollen pellet was used. Invert sugar syrup was completely replaced with honey. Oat talkan made 10% of the flour mass. It was found that this variant is optimal since it includes a broad range of quality indicators. Comparison was performed using a control sample, which was made according to the basic recipe. All of the obtained results are shown in Table 9.
The inclusion of bee pollen, honey and oat talkan in the recipe of sugar cookies leads to an increase in the biological and nutritional value of the product. To prove the functionality of the developed product, we calculated the daily need for micro- and macronutrients with the consumption of 100 g of sugar cookies with bee products and oat talkan. The results are shown in Table 9.
The consumption of 100 grams of sugar cookies with bee pollen, honey and oat talkan satisfies the daily need for the following nutrients: iron – 12.1%, cobalt – 40%, copper – 3.4%, zinc – 7.2%, vitamin E – 3.5%, vitamin C – 0.7%, PP – 26%, B3 – 0.25%, B1 – 2.7, proteins – 14.4% and alimentary fiber – 48.8%.
ConclusionAccording to the results of the research, the influence of bee
pollen, honey and oat talkan on the structural and mechanical properties of sugar cookies has been established. With an increase in the dosage of bee pollen up to 6% and the replacement of invert syrup with natural honey, the number of smaller fat globules increases, which is due to the chemical composition of bee pollen and honey. It was also found that the amount of the fine fraction of fat droplets increases, and, with a further increase in the dosage, on the contrary, decreases; this increases the number of drops attributed to the medium and large fractions. It was revealed that with the addition of bee pollen, the stability of the emulsion increases and exceeds the control sample characteristics. It results from higher emulsion dispersion due to its saturation with minerals and amino acids contained in honey products. When bee pollen and honey are added to the emulsion, the viscosity decreases to 5.3 Pa s in the control emulsion sample and 1.68 Pa s in the emulsion sample with bee pollen and honey. The control samples of sugar cookies had a more tough consistency since the introduction of the indenter requires more effort than in samples of sugar cookies with bee products and oat talkan. It was also found that the products with bee products and oat talkan had a more homogenous structure than the control sample.
Agric. conspec. sci. Vol. 85 (2020) No. 2
Improving Sugar Cookie Recipe with Functional Properties | 173
aCS
The coefficient of moisture absorption of the control sample, amounted to 2.2 and the sample with bee products and oat talkan amounted to 2.5, was determined. To evaluate the effect of bee products and oat talkan dosage on the organoleptic and physicochemical characteristics of sugar cookies, nonlinear multidimensional statistical models have been developed. It was found that the emulsification time is reduced by using 6% of pollen and replacing the invert syrup with natural honey. The total time of the technological process to produce sugar cookies with bee products and oat talkan was reduced to four minutes compared with the control sample. The daily need for macro- and micronutrients was calculated while consuming 100 grams of sugar cookies with pollen, honey, and oat talkan: iron – 12.1%, cobalt – 40%, copper – 3.4%, zinc – 7.2%, vitamin E – 3.5%, vitamin C – 0.7%, PP – 26%, B3 – 0.25%, B1 – 2.7 and proteins – 14.4%. Thus, the optimization of sugar cookie formula with bee pollen, honey and oat talkan is the result of the conducted research. The profitability of using bee products and oat talkan in sugar cookies recipe has been established, it has also been proved that sugar cookies with bee pollen, honey and oat talkan are functional food products.
Conflict of interestThe authors declare that they have no conflict of interest.
ReferencesGOST 24901-2014. Biscuits. General specifications. From 1/01/2016.
Available at: http://docs.cntd.ru/document/1200114736 (in Russian), last assessed: 19/03/2020.
Chernenkova AA, Pusenkova LI, Leonova SA, Shumilova EA. (2014). The use of bee products in the recipe of sugar cookies. Bread products 7: 56-58.
Chernykh VYa, Rodicheva NV, Krokha AA, Boyko BN, Dumskaya NS. (2014). Technology of making wheat bread with the addition of carrot and pumpkin powders. Bakery of Russia 4: 16-19.
Codină GG, Mironeasa S. (2016). Use of response surface methodology to investigate the effects of brown and golden flaxseed on wheat flour dough microstructure and rheological properties. J Food Sci Tech 53 (12): 4149-4158. doi: 10.1007/s13197-016-2387-5
Fazrakhmanov I, Lukyanova M, Kovshov V, Farrakhetdinova A, Putyatinskaya J. (2018). Economic Assessment and Strategic Potential of Agro Industries: The Case of Sugar Industry. Eur Res Stud J 21 (4): 239-254. doi: 10.11214/thalassinos.21.04.019
Fechner A, Knoth A, Scherze I, Muschiolik G. (2007). Stability and release properties of double-emulsions stabilised by caseinate-dextran conjugates. Food Hydrocolloid 21 (5-6): 943-952. doi: 10.1016/j.foodhyd.2006.10.021.
Freitas DGC, Moretti RH. (2006). Characterization and sensorial evaluation of functional cereal bar. Ciencia e Tecnologia de Alimentos 26 (2): 318-324. doi: 10.4025/actascitechnol.v33i1.6425.
Fuenmayor CB, Zuluaga CD, Díaz CM, Quicazán MC, Cosio M, Mannino S. (2014). Evaluation of the physicochemical and functional properties of Colombian bee pollen. Revista MVZ Cordoba 19 (1): 4003-4014. doi: 10.21897/rmvz.120
Gbenga-Fabusiwa FJ, Oladele EP, Oboh G, Adefegha SA, Oshodi AA. (2018). Nutritional properties, sensory qualities and glycemic response of biscuits produced from pigeon pea-wheat composite flour. J Food Biochem 42 (4): e12505. doi: 10.1111/jfbc.12505
Kirillova TV, Kanevskaya IYu. (2017). Statistical dependence. 2nd edition. Tutorial, Saratov.
Koryachkin VP, Koryachkina SYa, Rumyantseva VV. (2006). Development of technologies for the production of flour confectionery products from shortcrust dough on rye flour, taking into account the rheological properties of semi-finished products. Successes of Modern Natural Science 7: 8-74.
Koryachkina SYa, Kuznetsova EA, Goncharov Yu V. (2006b). Improving the technology of making bread from whole grains of cereals. Confectionery and bakery production 10: 3.
Koryachkina SYa, Kuznetsova EA, Prigarina OM. (2006a). Improving bread technology based on whole grain wheat and rye. Bulletin of Orenburg State Technical University 9: 284-288.
Kuznetsova EA. (2009). The content of heavy metals in the soils of a typical agrolandscape of the Oryol region and their accumulation in the grain crops. Agrochemistry 8: 60-64.
Kuznetsova EA. (2010). Development of scientific principles and ways to improve the safety of grain raw materials in the technology of bakery products, dissertation author's abstract for the degree of Doctor of Technical Sciences. Orlov State Technical University. Orel.
Kuznetsova EA, Alekhina YuI, Shcherbakova AA. (2008). Heavy metals content in the winter wheat grain of different varieties. Grain farming: 10-11.
Leonova SA, Pogonets EV. (2016). The technology of cereals from germinated grain triticale. Technology and commodity research of innovative food products 1 (36): 30-33.
Leonova SA, Pechatkin VA, Gusev AN, Gusmanov RU, Akhatova I, Isaev EF, Ismagilov RR, Bashirov RM, Ilyazov RG, Shutkov UG, Kovalenko NA. (2012). Storage and processing technology of crop production. In: System of conducting agro-industrial production in the Republic of Bashkortostan. Bashkir State Agrarian University. Russian Academy of Agricultural Sciences, Ufa: 261-267.
Luk'yanova MT, Kovshov VA. (2019). Modern State and Development Trends in Small Forms of Agribusiness in the Republic of Bashkortostan. Studies on Russian Economic Development 30 (3): 99-302. doi: 10.1134/S1075700719030110.
Maksimov EM, Krikunova LN, Chernykh VYa, Tsurikova NV. (2001). Investigation of the rheological characteristics of dough kneading for evaluating the action of enzyme preparations with thermostable a-amylase. Storage and processing of agricultural raw materials 1: 23-25.
Munteanu M-G, Voicu G, Ungureanu N, Zăbavă B-Ș, Ionescu M, Constantin G, Istrate I. (2016). Methods for determining the characteristics of flour and dough. 5th International Conference on Thermal Equipment, Renewable Energy and Rural Development TE-RE-RD, At Golden Sands: 349-355.
Rumyantseva VV, Mironova EM. (2003). Stuffing for dietary wafers. Confectionery production 4: 22-23.
Rumyantseva VV, Gurova AYu, Efremova I. (2012). Efficiency of using non-traditional raw materials in the production of confectionery emulsions. Confectionery production 1: 20-22.
Rumyantseva VV, Kovach NM, Orekhova DA. (2007). The influence of bioconversion products of grain raw materials on marmalade quality. Confectionery production 6: 20-22.
Rumyantseva VV, Novikova TN, Miller OV. (2009). Comprehensive analysis of the quality of wheat bread using non-traditional raw materials. Bulletin of higher educational institutions. Food technol 4 (310): 99-102.
Taleysnik MA, Savenkova TV, Soldatova EA, Misteneva SYu, Mizinchikova I. (2018). Technology of flour confectionery products using emulsion obtained in conditions of cavitation processing. Bulleting of Vestnik MGTU 21: 505-512. doi: 10.21443/1560-9278-2018-21-3-505-512.
Tsatsaragkou K, Yiannopoulos S, Kontogiorgi A, Poulli E, Krokida M, Mandala I. (2012). Mathematical approach of structural and textural properties of gluten free bread enriched with carob flour. J Cereal Sci 56: 603-609. doi: 10.1016/j.jcs.2012.07.007

Agric. conspec. sci. Vol. 85 (2020) No. 2
174 | Alfiya CHERNENKOVA, Svetlana LEONOVA, Elena KUZNETSOVA, Valentina RUMYANTSEVA, Tatyana KIRILLOVA, Valeriy CHERNYKH, Evgeniy CHERNENKOV, Olesya KALUZHINA
aCS
Tugush AR, Sadygova MK, Kirillova TV, Kontareva DD. (2018). Optimization in the recipe for shortbread enrichment additives. In: Resource-saving, environmentally friendly technologies for the storage and processing of agricultural products. Collection of articles on the materials of the international scientific-practical conference dedicated to the 75th anniversary of the Kurgan region: 87-90.
Voychik M, Dziki D, Bernatska B, Ruzhilo R, Miś A, Khassun VKh. (2017). Effect of the addition of mixture of plant components on the mechanical properties of wheat bread. Int Agrophys 31 (4): 563-569. doi: 10.1515/intag-2016-0082.
Zhang J, Datta A. (2006). Mathematical modeling of the bread baking process. J Food Eng 75: 78-89. doi: 10.1016/j.jfoodeng.2005.03.058.
aCS85_18