improving technical efficiency in health spending … · improving technical efficiency in health...
TRANSCRIPT
IMPROVING TECHNICAL EFFICIENCY IN HEALTH SPENDING IN AFRICA
Keynote paper
Improving technical efficiency in health spending in Africa
2 Keynote paper
Contents List of tables figures and boxes ......................................................................................................................... 3
Acronyms and abbreviations ............................................................................................................................. 4
1. Introduction ................................................................................................................................................... 5
2. Why focus on increased efficiency in health? ............................................................................................... 6
3. Defining efficiency in health systems ............................................................................................................ 9
4. Value for money and the health sector ....................................................................................................... 12
5. Efficiency and the health system building blocks ........................................................................................ 13
5.1 Medical products, vaccines and technologies ....................................................................................... 13
5.2 Sustainable financing and social protection .......................................................................................... 14
5.3 Health workforce ................................................................................................................................... 14
5.4 Health service delivery .......................................................................................................................... 14
5.5 Leadership and governance ................................................................................................................... 15
5.6 Information systems .............................................................................................................................. 15
6. Focus: the leading causes of inefficiency in the health sector .................................................................... 15
7. Efficiency and the budget cycle ................................................................................................................... 20
3
List of tables figures and boxes Tables Table 1: Ten leading causes of health system inefficiency Table 2: Efficiency indicators by health system pillar Figures Figure 1: Africa’s GDP growth in historical perspective Figure 2: The UHC cube Figure 3: Fiscal space diamond Figure 4: Government health expenditure as a proportion of general government expenditure in
African countries (1995–2013) Figure 5: Value-for-money tools and the transformation process Figure 6: Entry points in the budget cycle for multi-year performance improvement activities Boxes Box 1: Ethiopia’s improved child outcomes from extensive investment in public health Box 2: Between-district and between-sector efficiency differentials in Lesotho Box 3: Health system efficiency in Africa – frontier analysis Box 4: Improving the efficiency of drug-related expenditure in Morocco Box 5: Efficiency and human resources for health Box 6: Overlapping and differential roles of the ministries of health and finance in managing health
sector efficiency Box 7: Health sector budgeting in Kenya Box 8: A collaborative approach to improving HIV programming in Uganda
Improving technical efficiency in health spending in Africa
4 Keynote paper
Acronyms and abbreviations AOP annual operations plan
CABRI Collaborative Africa Budget Reform Initiative
CHW community health worker
CSO civil society organisation
DEA data envelopment analysis
DFID Department for International Development
GDP gross domestic product
GGHE general government health expenditure
HMIS health management information system
IHME Institute for Health Metrics and Evaluation
KPI key performance indicator
LMICs low- and middle-income countries
MOF ministry of finance
MOH ministry of health
MTEF medium-term expenditure framework
OECD Organisation for Economic Co-operation and Development
OOP out-of-pocket
OPM Oxford Policy Management
PER public expenditure review
SLA service level agreement
THE total health expenditure
UHC universal health coverage
UNAIDS Joint United Nations Programme on HIV and AIDS
VfM value for money
WHO World Health Organisation
5
1. Introduction The Collaborative Africa Budget Reform Initiative (CABRI), in conjunction with the United Republic of Tanzania, the Organisation for Economic Co-operation and Development (OECD), the World Health Organisation (WHO) and the Global Fund, hosted the ‘Financing healthcare in Africa’ conference in Dar es Salaam, Tanzania on 30 November and 1 December 2015. The conference was attended by health and finance officials from 14 African governments, development partners and industry experts. Key messages from the conference included:
There is agreement on the need for a greater focus on uniformity and co-ordination between the health and finance sectors in advancing towards universal health coverage (UHC).
UHC is a valuable goal, which requires appropriate resources. Global UHC spending targets are useful advocacy tools, but have limited relevance for country-level decisions. National benchmarks would provide a much more refined and useful context-specific indication of the cost of UHC.
Value for money (VfM) and analytical capabilities require prioritisation and development in the health sector.
There is widespread under-investment in cost-effective interventions.
Ministries of health need to find ways to integrate vertical programmes into health system strengthening work.
Building on the discussions at the conference, important questions remain on the efficiency and effectiveness of health expenditure in Africa, specifically:
Are health expenditures efficient, and what are the drivers of inefficiencies?
How can ministries of finance play a central role in ensuring VfM?
Are line agencies using resources in the most efficient and effective manner (technical efficiency)? This paper provides a practical approach to answering these questions and designing policy interventions for increased health system efficiency. Section 2 revisits the rationale for increased attention to health system efficiency. Section 3 sets the scene by providing some common definitions relating to efficiency in health systems. Sections 4 and 5 introduce two frameworks for analysing efficiency in the health sector: a transformation chain with a VfM approach; and the WHO health system pillars. Section 6 shows how these two frameworks can be combined to provide a complete conceptual approach with domains, indicators and tools, focusing on the intersection between the ‘three Es’ (economy, efficiency and effectiveness) and those health system pillars in respect of which targeted interventions are likely to have a big impact – drugs and medical supplies, the health workforce and health financing. Section 7 introduces the budget cycle and suggests ways to integrate it with the extended conceptual framework in order to act as a common ground for ministries of health and ministries of finance to work collaboratively on improving health sector efficiency.
Improving technical efficiency in health spending in Africa
6 Keynote paper
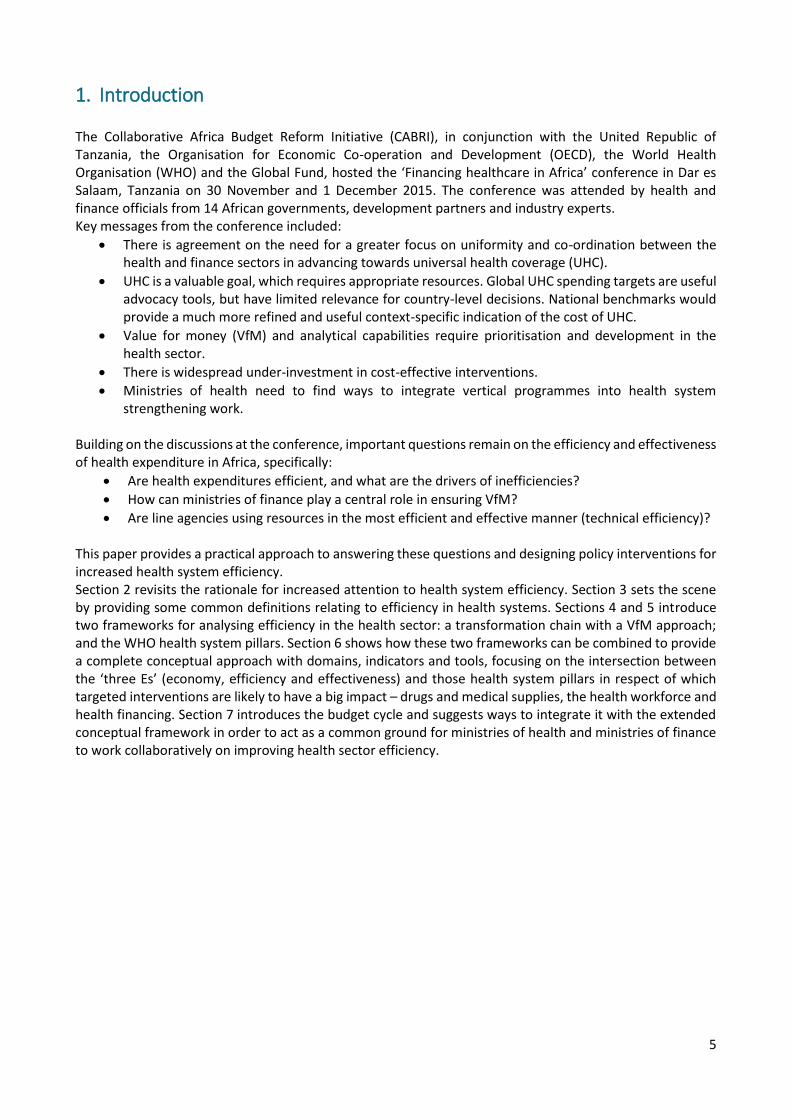
2. Why focus on increased efficiency in health? Africa’s economies and health systems are on the move. Economically, the continent is transforming fast and achieved an average real annual GDP growth of 5.4 per cent between 2000 and 2010. Since then, the picture has become more nuanced, with growth slowing to 3.3 per cent per year in the period 2010 to 2015. However, this deceleration is concentrated mainly in-oil exporting and North African countries. In the rest of Africa, real GDP continued to grow at an annual rate of 4.4 per cent per year.
Figure 1: Africa’s GDP growth in historical perspective
Source: IMF (2015); McKinsey Global Institute (2016)
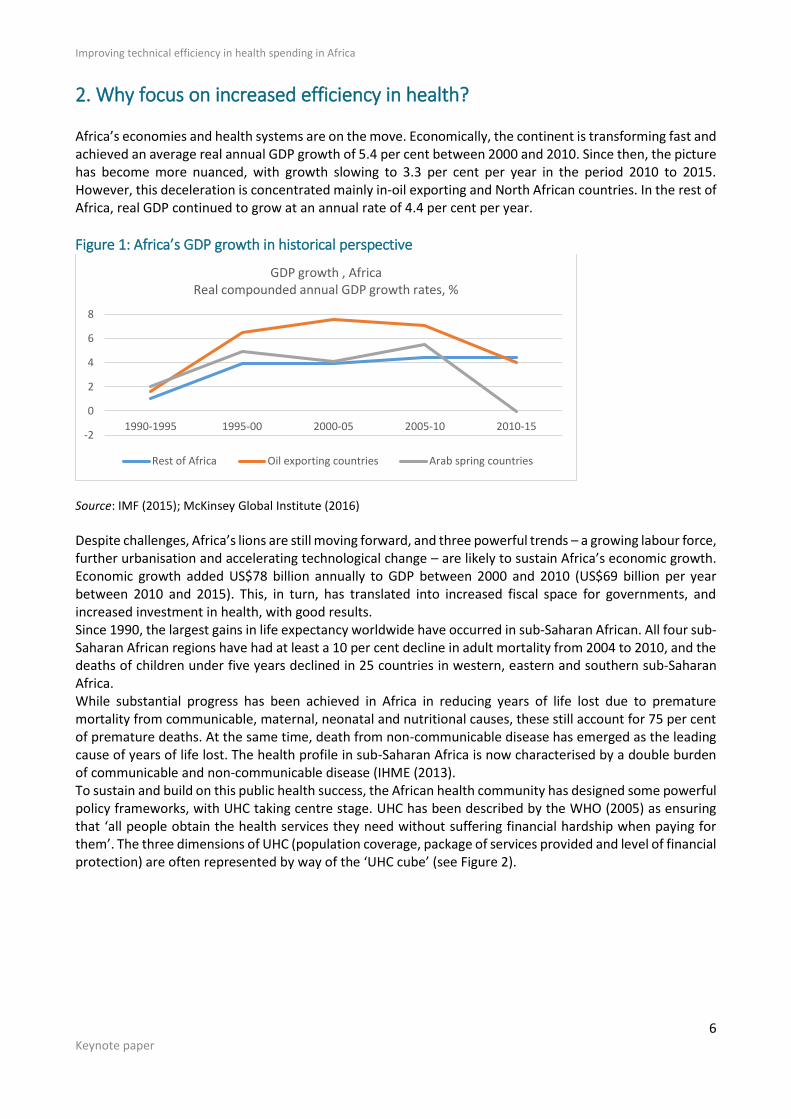
Despite challenges, Africa’s lions are still moving forward, and three powerful trends – a growing labour force, further urbanisation and accelerating technological change – are likely to sustain Africa’s economic growth. Economic growth added US$78 billion annually to GDP between 2000 and 2010 (US$69 billion per year between 2010 and 2015). This, in turn, has translated into increased fiscal space for governments, and increased investment in health, with good results. Since 1990, the largest gains in life expectancy worldwide have occurred in sub-Saharan African. All four sub-Saharan African regions have had at least a 10 per cent decline in adult mortality from 2004 to 2010, and the deaths of children under five years declined in 25 countries in western, eastern and southern sub-Saharan Africa. While substantial progress has been achieved in Africa in reducing years of life lost due to premature mortality from communicable, maternal, neonatal and nutritional causes, these still account for 75 per cent of premature deaths. At the same time, death from non-communicable disease has emerged as the leading cause of years of life lost. The health profile in sub-Saharan Africa is now characterised by a double burden of communicable and non-communicable disease (IHME (2013). To sustain and build on this public health success, the African health community has designed some powerful policy frameworks, with UHC taking centre stage. UHC has been described by the WHO (2005) as ensuring that ‘all people obtain the health services they need without suffering financial hardship when paying for them’. The three dimensions of UHC (population coverage, package of services provided and level of financial protection) are often represented by way of the ‘UHC cube’ (see Figure 2).
-2
0
2
4
6
8
1990-1995 1995-00 2000-05 2005-10 2010-15
GDP growth , AfricaReal compounded annual GDP growth rates, %
Rest of Africa Oil exporting countries Arab spring countries
7
Figure 2: The UHC cube
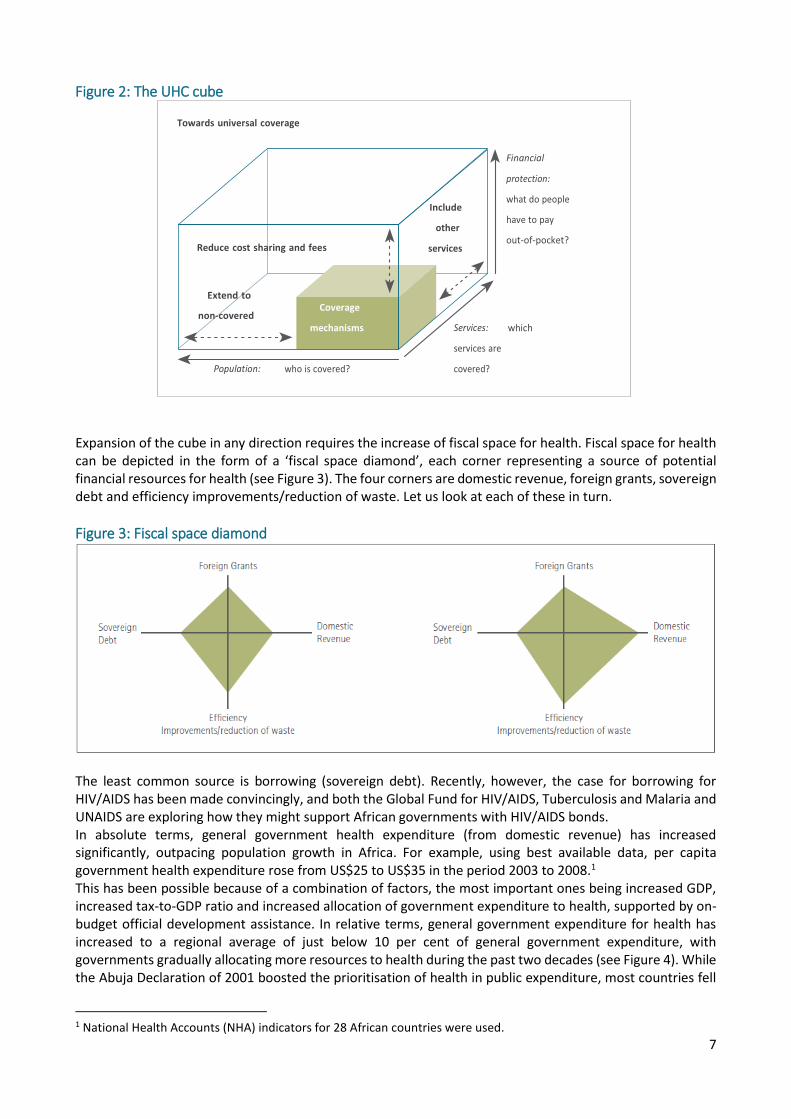
Expansion of the cube in any direction requires the increase of fiscal space for health. Fiscal space for health can be depicted in the form of a ‘fiscal space diamond’, each corner representing a source of potential financial resources for health (see Figure 3). The four corners are domestic revenue, foreign grants, sovereign debt and efficiency improvements/reduction of waste. Let us look at each of these in turn.
Figure 3: Fiscal space diamond
The least common source is borrowing (sovereign debt). Recently, however, the case for borrowing for HIV/AIDS has been made convincingly, and both the Global Fund for HIV/AIDS, Tuberculosis and Malaria and UNAIDS are exploring how they might support African governments with HIV/AIDS bonds. In absolute terms, general government health expenditure (from domestic revenue) has increased significantly, outpacing population growth in Africa. For example, using best available data, per capita government health expenditure rose from US$25 to US$35 in the period 2003 to 2008.1 This has been possible because of a combination of factors, the most important ones being increased GDP, increased tax-to-GDP ratio and increased allocation of government expenditure to health, supported by on-budget official development assistance. In relative terms, general government expenditure for health has increased to a regional average of just below 10 per cent of general government expenditure, with governments gradually allocating more resources to health during the past two decades (see Figure 4). While the Abuja Declaration of 2001 boosted the prioritisation of health in public expenditure, most countries fell
1 National Health Accounts (NHA) indicators for 28 African countries were used.
Extend to
Improving technical efficiency in health spending in Africa
8 Keynote paper
significantly short of the target of 15 per cent of their annual budget being allocated to improving the health sector.
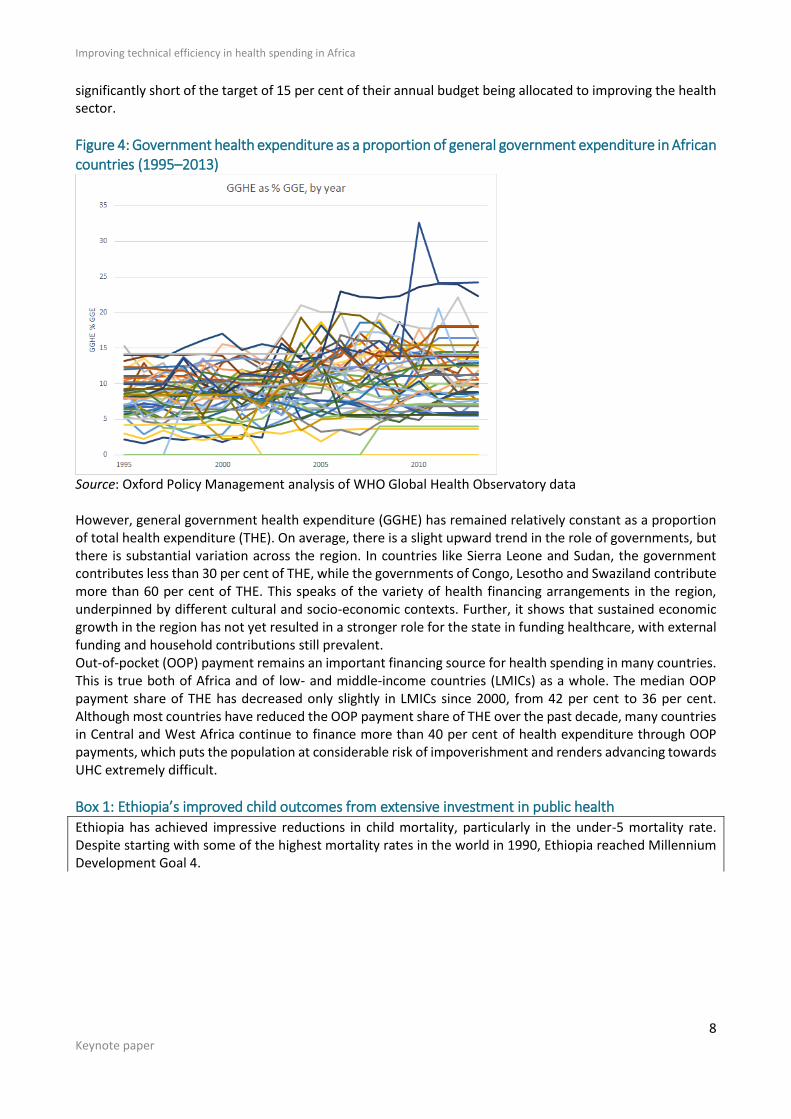
Figure 4: Government health expenditure as a proportion of general government expenditure in African countries (1995–2013)
Source: Oxford Policy Management analysis of WHO Global Health Observatory data However, general government health expenditure (GGHE) has remained relatively constant as a proportion of total health expenditure (THE). On average, there is a slight upward trend in the role of governments, but there is substantial variation across the region. In countries like Sierra Leone and Sudan, the government contributes less than 30 per cent of THE, while the governments of Congo, Lesotho and Swaziland contribute more than 60 per cent of THE. This speaks of the variety of health financing arrangements in the region, underpinned by different cultural and socio-economic contexts. Further, it shows that sustained economic growth in the region has not yet resulted in a stronger role for the state in funding healthcare, with external funding and household contributions still prevalent. Out-of-pocket (OOP) payment remains an important financing source for health spending in many countries. This is true both of Africa and of low- and middle-income countries (LMICs) as a whole. The median OOP payment share of THE has decreased only slightly in LMICs since 2000, from 42 per cent to 36 per cent. Although most countries have reduced the OOP payment share of THE over the past decade, many countries in Central and West Africa continue to finance more than 40 per cent of health expenditure through OOP payments, which puts the population at considerable risk of impoverishment and renders advancing towards UHC extremely difficult.
Box 1: Ethiopia’s improved child outcomes from extensive investment in public health
Ethiopia has achieved impressive reductions in child mortality, particularly in the under-5 mortality rate. Despite starting with some of the highest mortality rates in the world in 1990, Ethiopia reached Millennium Development Goal 4.

9
Increases in health expenditure, fuelled by economic growth and international assistance, contributed significantly to this progress. Health expenditure per capita increased from US$4 (in 1995/6) to US$20 (in 2010/1). Investment in human resources and health infrastructure, with a focus on increasing access in rural areas, was a strong determinant of improved health outcomes. Since 2001, more than 35 000 nurses, 35 000 health extension workers, 2 000 health centres and 16 000 health posts have been added to the health sector. Source: Ethiopian Health Institute (2014)
Foreign grants and loans continue to represent a major source of funding for the health sector. Indeed, dependency on external sources has increased over the past 15 years, from a continental average of about 6 per cent (in 2000) to 12 per cent (in 2011). External sources represented less than 20 per cent of THE in 32 countries in 2001; in 2010, this was the case in 24 countries. At the other end of the spectrum, in only two countries was more than 40 per cent of THE financed through external funding in 2001; in 2010 this was the case in six countries. Some countries (e.g. Malawi) have benefitted consistently from external funding, while in others (e.g. Burundi) the use of external funding has increased over time. With external aid prospects expected to flatten, at best, several countries already face mounting pressure on their domestic budgets. This projects the following stylised picture: after a period of sustained economic growth, fiscal space has expanded across countries. Simultaneously, African governments have increased the share of government expenditure for health. This has led to an increase in available funding for health on a real per capita basis. However, in order to achieve UHC, more has to be done. The large share of THE comprised of OOP payments obstructs the financial protection of populations, and continued donor dependency poses a risk to the long-term sustainability of health financing. Although important variations between countries persist, this stylised picture has focused the attention of the African health community on the remaining corner of the fiscal space diamond – creating fiscal space for health through increased health system efficiency.
3. Defining efficiency in health systems In economic theory, ‘efficiency’ refers to any production process, specifically to the relationship between inputs and outputs. Several types of efficiency can be distinguished – technical, productive and allocative. In the context of healthcare, these may be described as follows:
Technical efficiency is achieved when maximum health outcomes are achieved for a given level of inputs. In other words, no other combination of inputs can achieve a higher health outcome. Task-shifting is an example of improving technical efficiency, by ensuring that the comparatively more costly resource (e.g. a medical doctor) does not carry out tasks that could be accomplished by the comparatively less costly resource (e.g. a nurse).
Productive efficiency is achieved when input costs are minimised for a given level of health outcomes. Important gains in productive efficiency can be achieved through improved drug procurement, driving down the median prices through open and fair competitive processes, or by ensuring that generic drugs are prescribed whenever possible.
Improving technical efficiency in health spending in Africa
10 Keynote paper
Allocative efficiency is achieved when the right mixture of healthcare programmes – for example, finding the optimal balance between preventative and curative care, or between primary and hospital care – maximises the health of the population.
The selection of the approach to efficiency measurement is vital, because it dictates both the type and amount of data required for the analysis, as well as the robustness of the analysis. Simple methods (e.g. input-output ratio methods) are generally easy to calculate. While they can be helpful in identifying efficiency issues, they cannot capture confounding factors, and their results, therefore, can be misleading, especially in the complex environment of the health system. This is illustrated in the case of Lesotho (see Box 2), where the question was how to analyse between-district and between-sector (public and faith-based) efficiency differentials. More advanced methods for efficiency measurement rely on the ‘production frontier’ concept, used, for example, in data envelopment analysis (DEA), which has been widely employed in the health sector. DEA allows for an exploration of efficiency determinants by way of a two-stage process, in which technical efficiency scores are obtained in the first stage and then are regressed against relevant characteristics in the second stage to examine their influence on efficiency (see Box 3 for an example of ‘frontier analysis’).
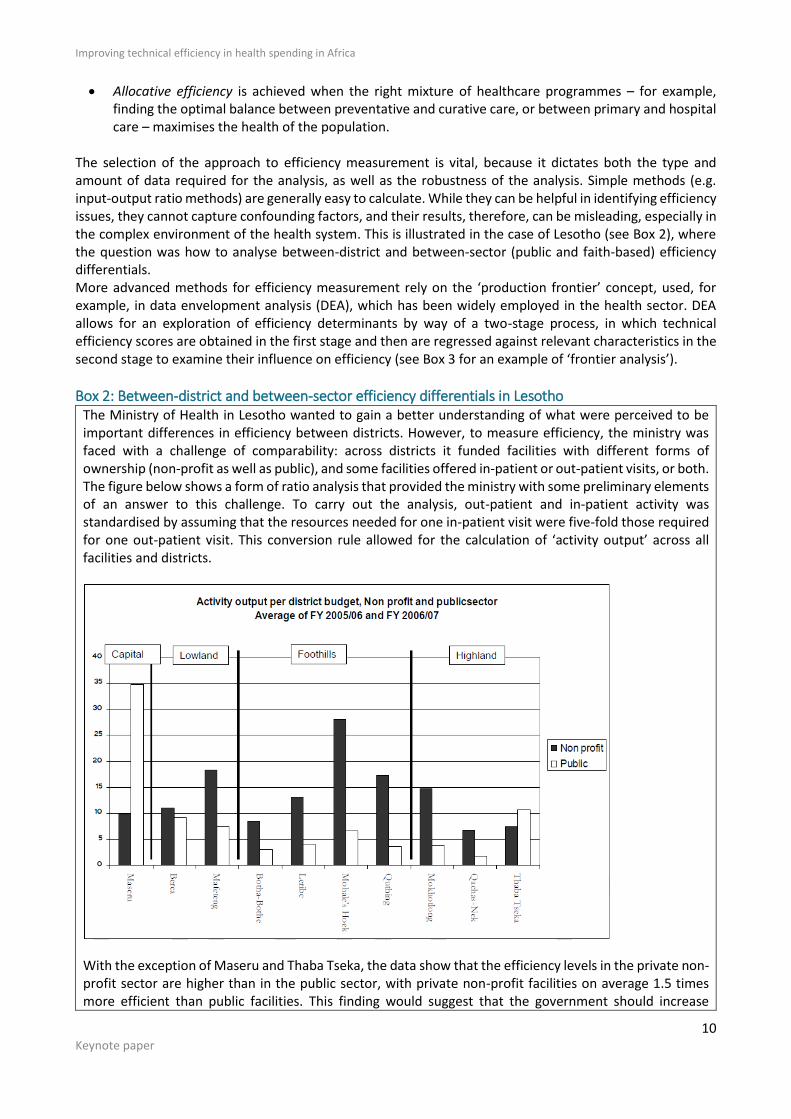
Box 2: Between-district and between-sector efficiency differentials in Lesotho The Ministry of Health in Lesotho wanted to gain a better understanding of what were perceived to be important differences in efficiency between districts. However, to measure efficiency, the ministry was faced with a challenge of comparability: across districts it funded facilities with different forms of ownership (non-profit as well as public), and some facilities offered in-patient or out-patient visits, or both. The figure below shows a form of ratio analysis that provided the ministry with some preliminary elements of an answer to this challenge. To carry out the analysis, out-patient and in-patient activity was standardised by assuming that the resources needed for one in-patient visit were five-fold those required for one out-patient visit. This conversion rule allowed for the calculation of ‘activity output’ across all facilities and districts.
With the exception of Maseru and Thaba Tseka, the data show that the efficiency levels in the private non-profit sector are higher than in the public sector, with private non-profit facilities on average 1.5 times more efficient than public facilities. This finding would suggest that the government should increase
11
resource allocation to the private non-profit sector if it wants to maximise efficiency. However, such findings warrant closer scrutiny before firm conclusions can be drawn. For example, it is unclear whether facility supervision and monitoring costs are not unfairly reducing the public sector efficiency scores. It may also be the case that the quality of service in private non-profit facilities is lower (in terms of time spent, free drugs provided, etc.). It is important, therefore, to understand why efficiency differentials between types of providers occur, before prioritising funding allocation to one rather than the other. Source: OPM (2008)
Box 3: Health system efficiency in Africa – frontier analysis
The efficiency definitions above provide a useful starting point, anchored in economic theory as applied to the health sector. In order for them to be useful at a more practical level to ministries of health and finance, they should be placed more firmly in the context of health systems and expenditure performance analysis. To this end, we present two frameworks:
the now common VfM framework – we show how this applies to the health system, and how it relates to concepts of efficiency (technical, productive and allocative) as defined above (see Section 4); and
the WHO’s health system building blocks, each of which facilitates a better understanding of efficiency issues (see Section 5).
An Oxford Policy Management internal analysis used a two-stage DEA to estimate the efficiency of health systems in 173 countries, based on data covering the period 2004–2011. The study considered three sets of variables from each country: direct inputs of the health system (health expenditure per capita, 2012 Intl$); three types of health system outputs (infant mortality rate, under-five mortality rate and life expectancy at birth); and contextual factors affecting efficiency (gross national income per capita, percentage urbanisation, percentage social security expenditure from total health expenditure, percentage government health spending from total government budget, and rule of law index). Results suggested that, on average, African countries had the lowest efficiency among WHO regions, with an average efficiency score of 67 per cent. Southeast Asia (87 per cent) and Western Pacific (86 per cent) were the most efficient regions. Performance varied widely across countries, even more so within the African region. For example, Sierra Leone (19 per cent), Botswana (26 per cent) and South Africa (38 per cent) were among the low-performing countries, while Kenya (69 per cent), Senegal (69 per cent) and Madagascar (93 per cent) were among the high performers. For African countries as a whole, an average efficiency score of 67 per cent means that health spending could be reduced by 33 per cent without affecting the health outcome attained if they performed as well as their peers. For low-performing countries, as highlighted by the analysis, the potential for efficiency savings could be much more significant (e.g. more than an 80 per cent reduction in health expenditure in Sierra Leone). However, these findings do not automatically imply that monetary efficiency savings can be made in the short term, or at all. Comparing health system efficiency across countries globally is necessarily fraught with difficulty, and important confounding factors, such as differentials in disease burden (e.g. from HIV) or labour costs, will bias the results. Therefore, low-performing health systems should be investigated more thoroughly to identify what precisely might be done to improve their efficiency. Source: Zeng (2014)
Improving technical efficiency in health spending in Africa
12 Keynote paper
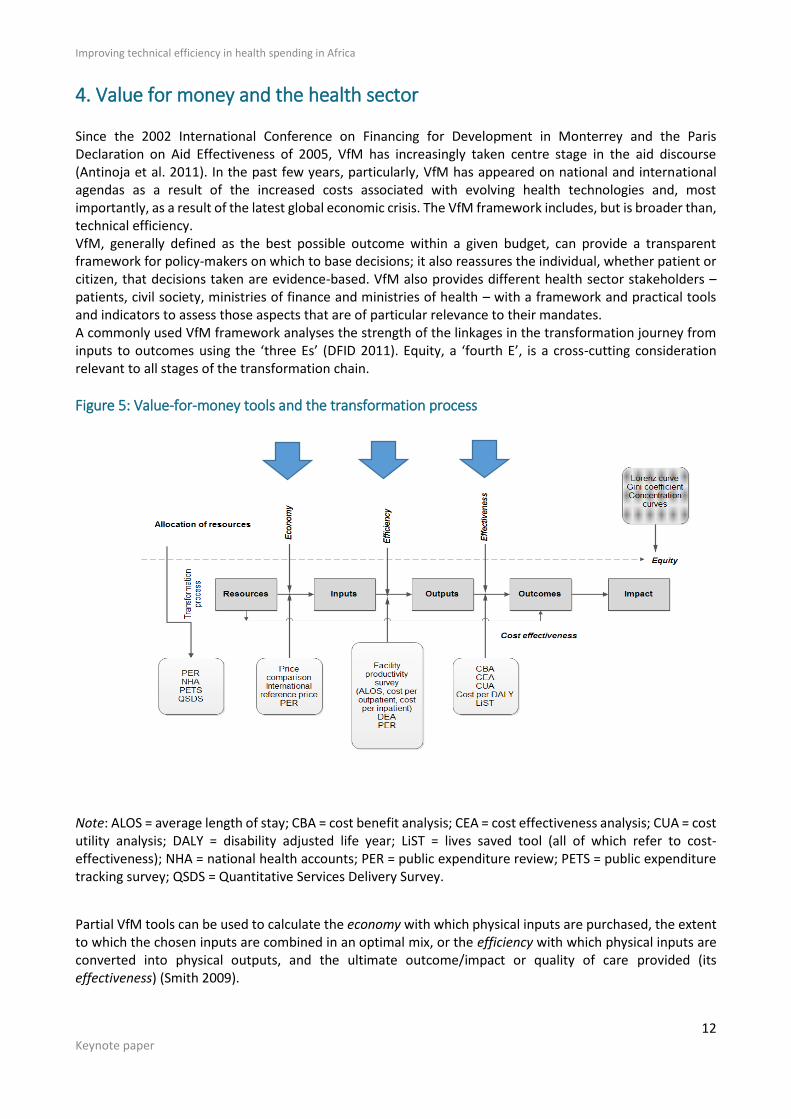
4. Value for money and the health sector Since the 2002 International Conference on Financing for Development in Monterrey and the Paris Declaration on Aid Effectiveness of 2005, VfM has increasingly taken centre stage in the aid discourse (Antinoja et al. 2011). In the past few years, particularly, VfM has appeared on national and international agendas as a result of the increased costs associated with evolving health technologies and, most importantly, as a result of the latest global economic crisis. The VfM framework includes, but is broader than, technical efficiency. VfM, generally defined as the best possible outcome within a given budget, can provide a transparent framework for policy-makers on which to base decisions; it also reassures the individual, whether patient or citizen, that decisions taken are evidence-based. VfM also provides different health sector stakeholders – patients, civil society, ministries of finance and ministries of health – with a framework and practical tools and indicators to assess those aspects that are of particular relevance to their mandates. A commonly used VfM framework analyses the strength of the linkages in the transformation journey from inputs to outcomes using the ‘three Es’ (DFID 2011). Equity, a ‘fourth E’, is a cross-cutting consideration relevant to all stages of the transformation chain.
Figure 5: Value-for-money tools and the transformation process
Note: ALOS = average length of stay; CBA = cost benefit analysis; CEA = cost effectiveness analysis; CUA = cost utility analysis; DALY = disability adjusted life year; LiST = lives saved tool (all of which refer to cost-effectiveness); NHA = national health accounts; PER = public expenditure review; PETS = public expenditure tracking survey; QSDS = Quantitative Services Delivery Survey.
Partial VfM tools can be used to calculate the economy with which physical inputs are purchased, the extent to which the chosen inputs are combined in an optimal mix, or the efficiency with which physical inputs are converted into physical outputs, and the ultimate outcome/impact or quality of care provided (its effectiveness) (Smith 2009).
13
The ‘four Es’ for a given transformation process can be examined using specific indicators, which can be estimated by employing particular methodological tools. For example, an indicator of efficiency in service delivery could be the percentage of medicines prescribed by a generic name, which can be measured using facility surveys as a tool. To take another example, the cost per adjusted bed-day could be a measure of facility-level productivity; the cost component of this indicator could be ascertained using information in public expenditure reviews (PERs), national health accounts (NHAs) and ministry of health and/or ministry of finance expenditure data.2 In order to improve the efficiency (technical, productive or allocative) of the health system, our analysis must focus on the economy, efficiency and effectiveness of the value chain.
5. Efficiency and the health system building blocks In the previous section the health system was portrayed as a transformation chain, from inputs to outcomes and impact, and it was demonstrated that health system efficiency can be improved by focusing on improvements in specific segments of the value chain: economy, efficiency and effectiveness. Another common way of analysing the health system is to use health system building blocks, which are considered from an efficiency perspective. The WHO promotes a shared understanding of what a health system is, and provides a framework for analysis, monitoring and strengthening. It has conceived a single framework consisting of six building blocks that make up a health system: service delivery; health workforce; information; medical products, vaccines and technologies; financing; and leadership and governance (stewardship) (WHO 2000, 2007). The 2010 World Health Report ‘Health System Financing: The Path to Universal Coverage’ identifies sources of inefficiency and links these to the health system building blocks (WHO 2010a). Below, each of the health system building blocks is succinctly described, efficiency issues are identified, and their measurement discussed.
5.1 Medical products, vaccines and technologies A well-functioning health system ensures equitable access to essential medical products, vaccines and technologies of assured quality, safety, efficacy and cost-effectiveness. To achieve these objectives a country needs national policies and standards, information on prices, quality assessment, systems that minimise leakage and other waste, and systems that support the rational use of medicines. Medicine expenditure accounts for more than 25 per cent of health spending in many LMICs. Recent evidence has found that the cost of medicine is amongst the key impediments to treatment in LMICs (WHO 2008). In sub-Sahara Africa, the median price for selected generic medicines was 6.5 times higher than the international reference price in public facilities, and 2.5 times higher in private facilities. This provides a dramatic opportunity to improve the economy of drug policy and management. The WHO (2010a) ranks the following medicine-related causes of inefficiency amongst the most important:
underuse of generics and higher than necessary prices for medicines;
inappropriate and ineffective use of medicines; and
use of substandard and counterfeit medicines.
2 The practical application of this approach to inform health sector decisions presents several challenges. Firstly, calculating costs and valuing outcomes is a complex exercise when all the data are available, and even more so when data are lacking (Drummond et al. 2005). Secondly, incorporating quality and equity considerations is often a complex task (Dawson et al. 2005). Thirdly, some objectives may be hard to measure (e.g. reinforcing civil society’s voice in a national policy debate). Finally, ‘health’ has so many determinants, and attribution of impact to a particular factor is difficult; external events (e.g. air pollution or high stress levels) may have a profound impact health outcomes, and represent confounding factors in the causal relationship between inputs and outputs (or outcomes) (WHO 2003).
Improving technical efficiency in health spending in Africa
14 Keynote paper
5.2 Sustainable financing and social protection Health financing and social protection involve the functions of revenue collection and pooling, and service purchasing. These functions are organised and interact differently across countries, and are the result of institutional and policy developments that took shape over decades, if not centuries. Health financing performance has a direct impact on high-level policy objectives, such as health system effectiveness, efficiency and equity (Kutzin 2001; WHO 2000; WHO 2010a). In a seminal article, Joseph Kutzin (2001) provides a detailed account of each of the health financing functions, their interactions and their impact on health system efficiency, equity and effectiveness. Revenue collection is the way in which the health system raises money to pay for health services. Revenue pooling refers to the accumulation of the collected resources in different funds that manage those resources on behalf of defined population groups. Members of the pool carry entitlements to healthcare, which protect individual pool members from unpredictable and sometimes large health expenditures. In resource pooling, an individual’s ability to pay is not linked to the individual’s expected health expenditure; as such, it allows a redistribution of resources between individuals that have different income and health risk profiles. It is the function of resource pooling that partly drives the extent to which health systems are equitable. Health service purchasing refers to the mechanisms used by the managers of the pooled funds to buy services from public or private providers on behalf of the populations they cover. As individual health risks are uncertain, and because the provision of health services carries high levels of asymmetry of information (e.g. regarding the choice of appropriate healthcare), any purchasing mechanism will specify the levels of inherent financial risk that are borne by the purchaser on the one hand and the provider on the other, which, in turn, gives rise to an incentive framework that has an impact on provider behaviour. Different payment mechanisms, therefore, may result in providers seeking to increase the services they deliver, maximise the number of patients they enrol or hospitalise, shorten or lengthen the number of days they stay in hospital, and so on. Health service purchasing, thus, has a direct bearing on the technical efficiency of the system. The health financing function of purchasing also relates to two of the leading sources of inefficiency (WHO 2010a):
overuse or oversupply of equipment, investigations and procedures following inappropriate prescriber incentives; and
inappropriate hospital admissions and length of stay.
5.3 Health workforce The health workforce is central to a health system’s ability to meet its high-level policy goals. There is a direct relationship between the numbers of health workers and health outcomes (WHO 2010b). However, many especially poorer countries struggle to develop an adequate health workforce for a number of reasons, including mal-distribution of health workers over the country, international migration, lack of motivation, poor skills mix at facility level. The WHO, in ‘Monitoring the Building Blocks of the Health System’, emphasises the need for quality data and information on the health workforce as a prerequisite to improving it (WHO 2010b). Two of the core indicators proposed for monitoring the performance of the health workforce are directly relevant to value for money: the number of health workers per 10 000 population, by cadre; and the distribution of health workers by occupation, region, place of work and gender. The leading causes of inefficiency pertaining to health workers are:
inappropriate or costly staff mix; and
unmotivated workers.
5.4 Health service delivery In ‘Everybody’s Business: Strengthening Health Systems to Improve Health Outcomes’, the WHO asserts that ‘good health services are those which deliver effective, safe, good quality personal and non-personal care to those that need it, when needed, with minimum waste’ (WHO 2007). Health service delivery is concerned
15
with the transformation of inputs, such as health finance, human resources and drugs, into healthcare services that meet defined characteristics in terms of quality, safety, continuity of care, access, and so on. It concerns service delivery models and provider networks, and pays particular attention to incentives that support effective and efficient transformation throughout the transformation chain. By virtue of its complexity and central role in the production of health services, leading causes of inefficiency are associated with the health service delivery building block, such as:
inappropriate hospital size;
medical errors and suboptimal quality of care; and
inefficient service delivery packages (funding high-cost, low-effectiveness interventions when low-cost, high-effectiveness interventions are uncovered).
5.5 Leadership and governance The core principles of good governance (respect for the rule of law, transparency and accountability) are essential in ensuring VfM in resource-allocation decisions. Indeed, ‘10–25 per cent of public spending linked to procurement...is lost each year through corruption’ (WHO 2010a). VfM tools can help in judging the integrity of decision-making processes in relation to fiduciary risk and corruption, as well as testing the effectiveness of resource-allocation processes. PERs can assess public expenditure by sources of funding, for example, but also can measure budgeted versus actual expenditures, or the amount spent per individual. Such information is useful to those wanting to hold government agencies to account – for example, civil society wanting to know whether the ministry of finance is actually disbursing the funds allocated to the health sector – but this can be done only if the budgets of the various ministries are transparently shared (not always the safest of assumptions).
5.6 Information systems A well-functioning health management information system (HMIS) is one that ‘ensures the production, analysis, dissemination and use of reliable and timely information on health determinants, health systems performance and health status’ (WHO 2007). The WHO broadly defines the goal of an HMIS as ‘to produce relevant information that health system stakeholders can use for making transparent and evidence-based decisions for health system interventions’ (WHO 2008). HMISs, therefore, are inherently complex, spanning many data needs and sources. HMISs, as such, do not figure directly in the WHO’s ‘ten leading causes of inefficiencies’. However, quality data are required to assess health system efficiency levels, and to improve decision-making with a view to achieving greater efficiency. Thus, HMISs are essential to all VfM measurement. The Health Metrics Network at the WHO assessed HMISs in 52 countries, and found much room for improvement (WHO 2012). Common weaknesses across countries include:
lack of a well-formulated and implemented HMIS policy, leading to insufficient resources;
lack of compatibility between existing information systems;
data not being used in decision-making; and
lack of timeliness of data (which has been revealed in various assessments).
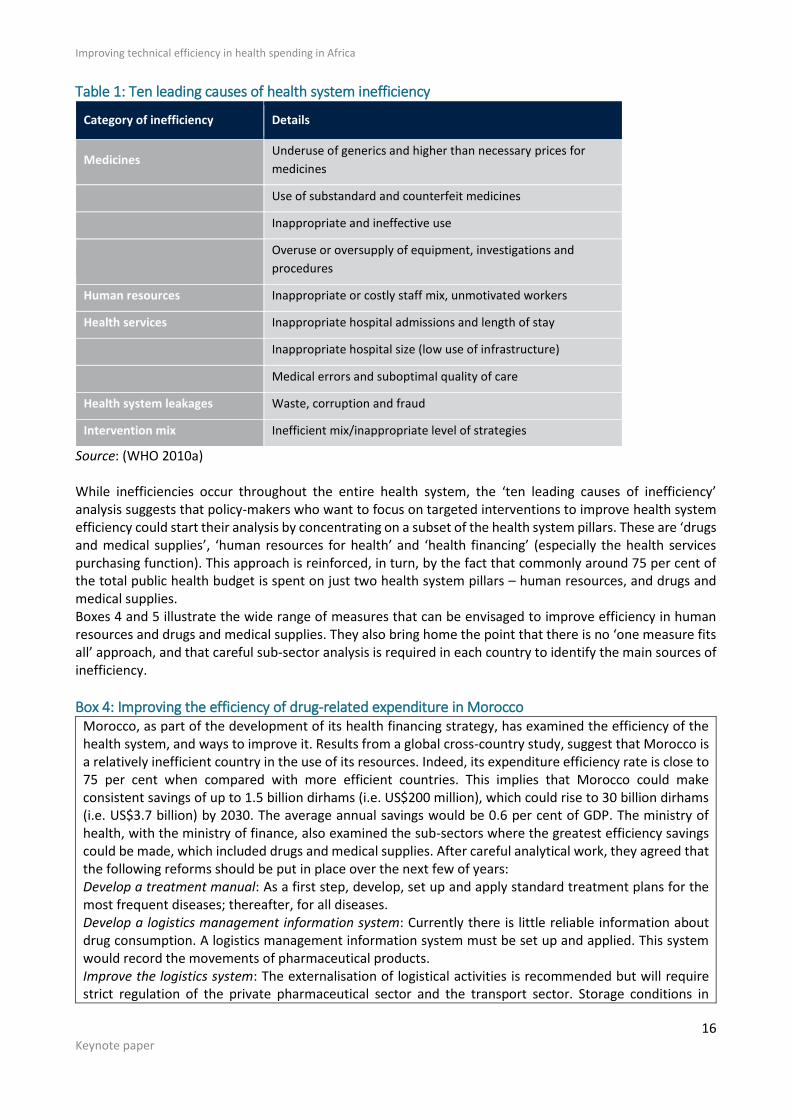
6. Focus: the leading causes of inefficiency in the health sector The WHO (2010a) estimates that between 20 per cent and 40 per cent of health spending is wasted globally through inefficiency, pointing to substantial potential for savings. It also outlines ten leading causes of health system inefficiency grouped under five categories: human resources; medicines; health services; system leakages; and intervention mix (Table 1).
Improving technical efficiency in health spending in Africa
16 Keynote paper
Table 1: Ten leading causes of health system inefficiency
Category of inefficiency Details
Medicines Underuse of generics and higher than necessary prices for
medicines
Use of substandard and counterfeit medicines
Inappropriate and ineffective use
Overuse or oversupply of equipment, investigations and
procedures
Human resources Inappropriate or costly staff mix, unmotivated workers
Health services Inappropriate hospital admissions and length of stay
Inappropriate hospital size (low use of infrastructure)
Medical errors and suboptimal quality of care
Health system leakages Waste, corruption and fraud
Intervention mix Inefficient mix/inappropriate level of strategies
Source: (WHO 2010a) While inefficiencies occur throughout the entire health system, the ‘ten leading causes of inefficiency’ analysis suggests that policy-makers who want to focus on targeted interventions to improve health system efficiency could start their analysis by concentrating on a subset of the health system pillars. These are ‘drugs and medical supplies’, ‘human resources for health’ and ‘health financing’ (especially the health services purchasing function). This approach is reinforced, in turn, by the fact that commonly around 75 per cent of the total public health budget is spent on just two health system pillars – human resources, and drugs and medical supplies. Boxes 4 and 5 illustrate the wide range of measures that can be envisaged to improve efficiency in human resources and drugs and medical supplies. They also bring home the point that there is no ‘one measure fits all’ approach, and that careful sub-sector analysis is required in each country to identify the main sources of inefficiency.
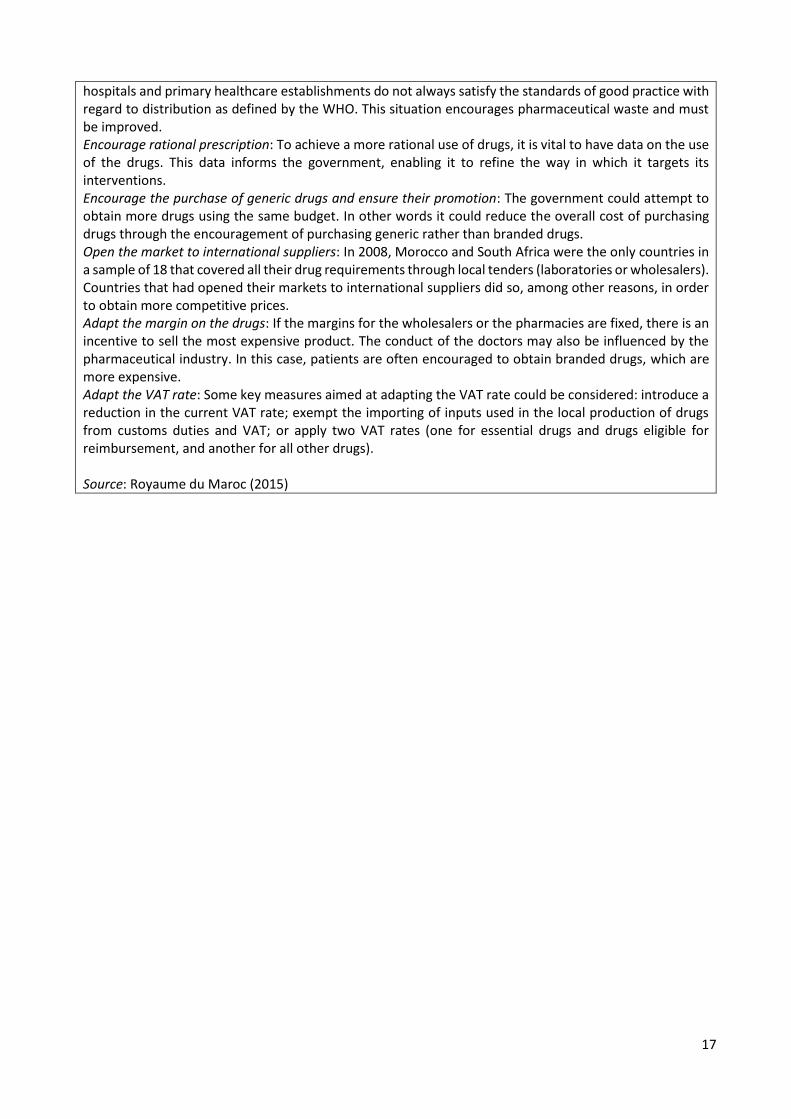
Box 4: Improving the efficiency of drug-related expenditure in Morocco Morocco, as part of the development of its health financing strategy, has examined the efficiency of the health system, and ways to improve it. Results from a global cross-country study, suggest that Morocco is a relatively inefficient country in the use of its resources. Indeed, its expenditure efficiency rate is close to 75 per cent when compared with more efficient countries. This implies that Morocco could make consistent savings of up to 1.5 billion dirhams (i.e. US$200 million), which could rise to 30 billion dirhams (i.e. US$3.7 billion) by 2030. The average annual savings would be 0.6 per cent of GDP. The ministry of health, with the ministry of finance, also examined the sub-sectors where the greatest efficiency savings could be made, which included drugs and medical supplies. After careful analytical work, they agreed that the following reforms should be put in place over the next few of years: Develop a treatment manual: As a first step, develop, set up and apply standard treatment plans for the most frequent diseases; thereafter, for all diseases. Develop a logistics management information system: Currently there is little reliable information about drug consumption. A logistics management information system must be set up and applied. This system would record the movements of pharmaceutical products. Improve the logistics system: The externalisation of logistical activities is recommended but will require strict regulation of the private pharmaceutical sector and the transport sector. Storage conditions in
17
hospitals and primary healthcare establishments do not always satisfy the standards of good practice with regard to distribution as defined by the WHO. This situation encourages pharmaceutical waste and must be improved. Encourage rational prescription: To achieve a more rational use of drugs, it is vital to have data on the use of the drugs. This data informs the government, enabling it to refine the way in which it targets its interventions. Encourage the purchase of generic drugs and ensure their promotion: The government could attempt to obtain more drugs using the same budget. In other words it could reduce the overall cost of purchasing drugs through the encouragement of purchasing generic rather than branded drugs. Open the market to international suppliers: In 2008, Morocco and South Africa were the only countries in a sample of 18 that covered all their drug requirements through local tenders (laboratories or wholesalers). Countries that had opened their markets to international suppliers did so, among other reasons, in order to obtain more competitive prices. Adapt the margin on the drugs: If the margins for the wholesalers or the pharmacies are fixed, there is an incentive to sell the most expensive product. The conduct of the doctors may also be influenced by the pharmaceutical industry. In this case, patients are often encouraged to obtain branded drugs, which are more expensive. Adapt the VAT rate: Some key measures aimed at adapting the VAT rate could be considered: introduce a reduction in the current VAT rate; exempt the importing of inputs used in the local production of drugs from customs duties and VAT; or apply two VAT rates (one for essential drugs and drugs eligible for reimbursement, and another for all other drugs). Source: Royaume du Maroc (2015)
Improving technical efficiency in health spending in Africa
18 Keynote paper
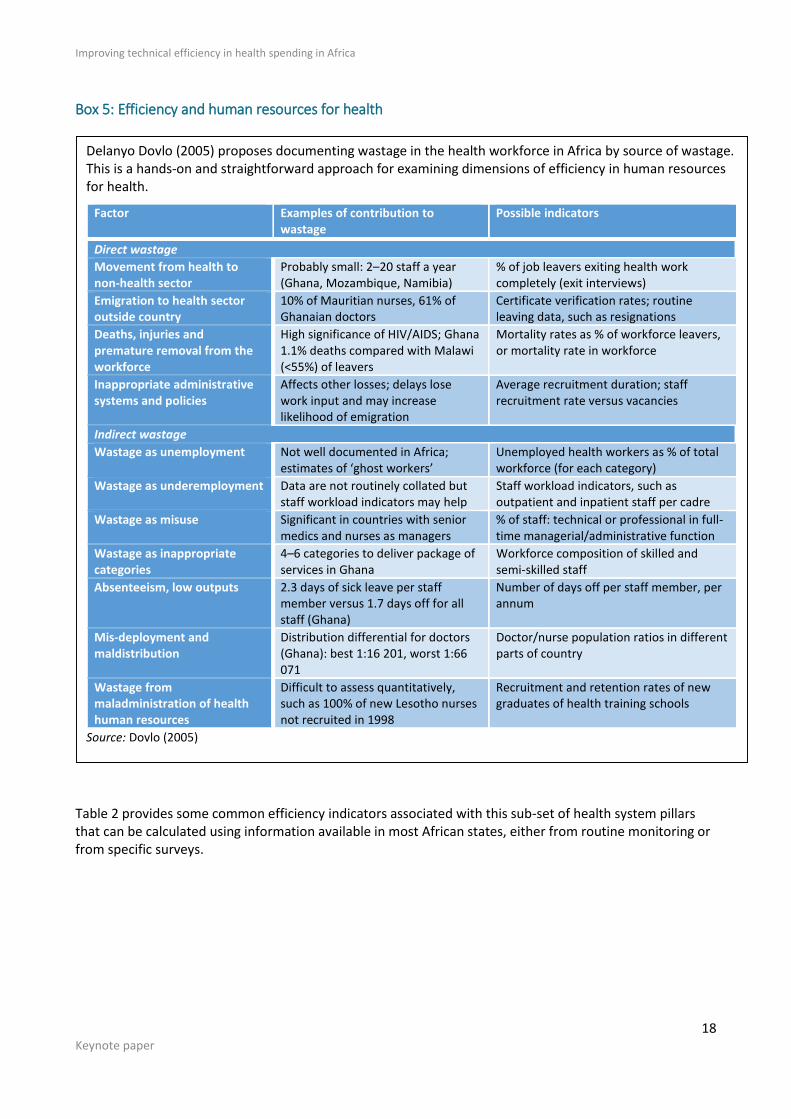
Box 5: Efficiency and human resources for health
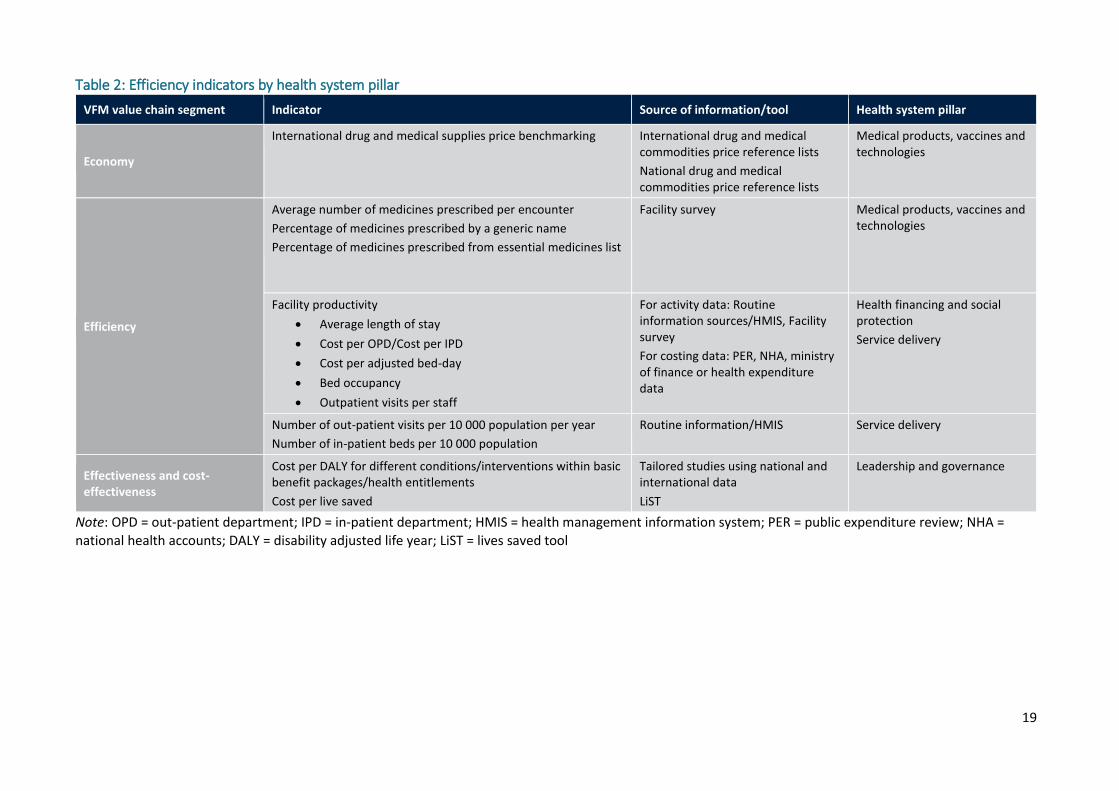
Table 2 provides some common efficiency indicators associated with this sub-set of health system pillars that can be calculated using information available in most African states, either from routine monitoring or from specific surveys.
Delanyo Dovlo (2005) proposes documenting wastage in the health workforce in Africa by source of wastage. This is a hands-on and straightforward approach for examining dimensions of efficiency in human resources for health.
Factor Examples of contribution to wastage
Possible indicators
Direct wastage
Movement from health to non-health sector
Probably small: 2–20 staff a year (Ghana, Mozambique, Namibia)
% of job leavers exiting health work completely (exit interviews)
Emigration to health sector outside country
10% of Mauritian nurses, 61% of Ghanaian doctors
Certificate verification rates; routine leaving data, such as resignations
Deaths, injuries and premature removal from the workforce
High significance of HIV/AIDS; Ghana 1.1% deaths compared with Malawi (<55%) of leavers
Mortality rates as % of workforce leavers, or mortality rate in workforce
Inappropriate administrative systems and policies
Affects other losses; delays lose work input and may increase likelihood of emigration
Average recruitment duration; staff recruitment rate versus vacancies
Indirect wastage
Wastage as unemployment Not well documented in Africa; estimates of ‘ghost workers’
Unemployed health workers as % of total workforce (for each category)
Wastage as underemployment Data are not routinely collated but staff workload indicators may help
Staff workload indicators, such as outpatient and inpatient staff per cadre
Wastage as misuse Significant in countries with senior medics and nurses as managers
% of staff: technical or professional in full-time managerial/administrative function
Wastage as inappropriate categories
4–6 categories to deliver package of services in Ghana
Workforce composition of skilled and semi-skilled staff
Absenteeism, low outputs 2.3 days of sick leave per staff member versus 1.7 days off for all staff (Ghana)
Number of days off per staff member, per annum
Mis-deployment and maldistribution
Distribution differential for doctors (Ghana): best 1:16 201, worst 1:66 071
Doctor/nurse population ratios in different parts of country
Wastage from maladministration of health human resources
Difficult to assess quantitatively, such as 100% of new Lesotho nurses not recruited in 1998
Recruitment and retention rates of new graduates of health training schools
Source: Dovlo (2005)
19
Table 2: Efficiency indicators by health system pillar
VFM value chain segment Indicator Source of information/tool Health system pillar
Economy
International drug and medical supplies price benchmarking International drug and medical commodities price reference lists
National drug and medical commodities price reference lists
Medical products, vaccines and technologies
Efficiency
Average number of medicines prescribed per encounter
Percentage of medicines prescribed by a generic name
Percentage of medicines prescribed from essential medicines list
Facility survey
Medical products, vaccines and technologies
Facility productivity
Average length of stay
Cost per OPD/Cost per IPD
Cost per adjusted bed-day
Bed occupancy
Outpatient visits per staff
For activity data: Routine information sources/HMIS, Facility survey
For costing data: PER, NHA, ministry of finance or health expenditure data
Health financing and social protection
Service delivery
Number of out-patient visits per 10 000 population per year
Number of in-patient beds per 10 000 population
Routine information/HMIS Service delivery
Effectiveness and cost-effectiveness
Cost per DALY for different conditions/interventions within basic benefit packages/health entitlements
Cost per live saved
Tailored studies using national and international data
LiST
Leadership and governance
Note: OPD = out-patient department; IPD = in-patient department; HMIS = health management information system; PER = public expenditure review; NHA = national health accounts; DALY = disability adjusted life year; LiST = lives saved tool
20 Keynote paper
7. Efficiency and the budget cycle The frameworks outlined in the sections above are useful in identifying sources of inefficiency and in quantifying their magnitude. The next step is to develop a systematic approach to address these inefficiencies. Ultimately, tackling sources of inefficiency is a matter of resource allocation and/or re-allocation. For example, adjusting the staff mix to optimal levels may involve the reallocation of existing staff across providers, as well as additional recruitment. If ministries of health and ministries of finance are to work together on improving health sector performance, a further conceptual instrument with a focus on resource allocation is required to harmonise action and serve as a platform for prioritisation. To this end, we introduce the budget cycle.
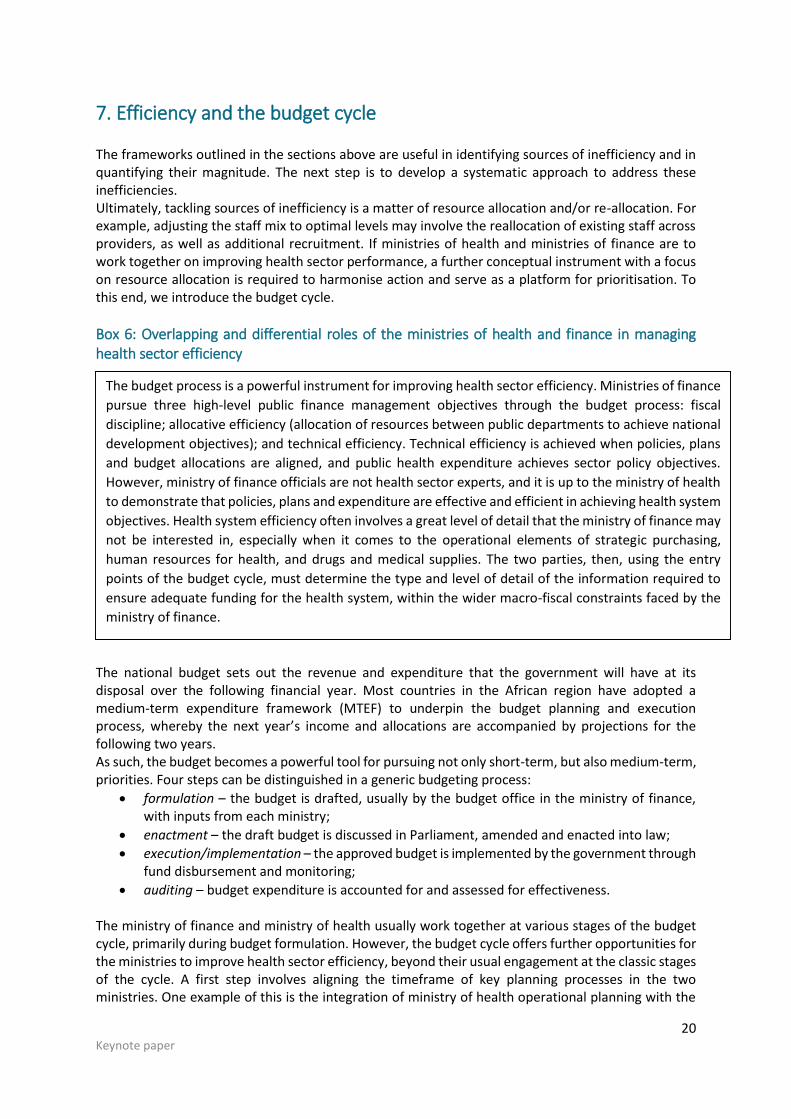
Box 6: Overlapping and differential roles of the ministries of health and finance in managing health sector efficiency
The national budget sets out the revenue and expenditure that the government will have at its disposal over the following financial year. Most countries in the African region have adopted a medium-term expenditure framework (MTEF) to underpin the budget planning and execution process, whereby the next year’s income and allocations are accompanied by projections for the following two years. As such, the budget becomes a powerful tool for pursuing not only short-term, but also medium-term, priorities. Four steps can be distinguished in a generic budgeting process:
formulation – the budget is drafted, usually by the budget office in the ministry of finance, with inputs from each ministry;
enactment – the draft budget is discussed in Parliament, amended and enacted into law;
execution/implementation – the approved budget is implemented by the government through fund disbursement and monitoring;
auditing – budget expenditure is accounted for and assessed for effectiveness. The ministry of finance and ministry of health usually work together at various stages of the budget cycle, primarily during budget formulation. However, the budget cycle offers further opportunities for the ministries to improve health sector efficiency, beyond their usual engagement at the classic stages of the cycle. A first step involves aligning the timeframe of key planning processes in the two ministries. One example of this is the integration of ministry of health operational planning with the
The budget process is a powerful instrument for improving health sector efficiency. Ministries of finance
pursue three high-level public finance management objectives through the budget process: fiscal
discipline; allocative efficiency (allocation of resources between public departments to achieve national
development objectives); and technical efficiency. Technical efficiency is achieved when policies, plans
and budget allocations are aligned, and public health expenditure achieves sector policy objectives.
However, ministry of finance officials are not health sector experts, and it is up to the ministry of health
to demonstrate that policies, plans and expenditure are effective and efficient in achieving health system
objectives. Health system efficiency often involves a great level of detail that the ministry of finance may
not be interested in, especially when it comes to the operational elements of strategic purchasing,
human resources for health, and drugs and medical supplies. The two parties, then, using the entry
points of the budget cycle, must determine the type and level of detail of the information required to
ensure adequate funding for the health system, within the wider macro-fiscal constraints faced by the
ministry of finance.
Improving technical efficiency in health spending in Africa
21 Keynote paper
MTEF in Kenya, which offers lessons as to the necessity of good governance and co-ordination if such complex exercises are to achieve their objectives (see Box 7). A further step, with a direct view to reducing inefficiency, is to go beyond operational planning and develop a medium-term plan to improve health sector performance. In a way similar to how an MTEF underpins budget planning and execution, the two ministries can agree on a multi-year health sector performance improvement framework whereby key health system performance achievements can be met by judicious allocations in the health budget. This entails introducing a distinct, but related, layer to the usual budget process, which allows for the formulation of clear priorities for performance improvement and explicitly links them to yearly budget allocations (see Figure 6).
22 Keynote paper
Box 7: Health sector budgeting in Kenya
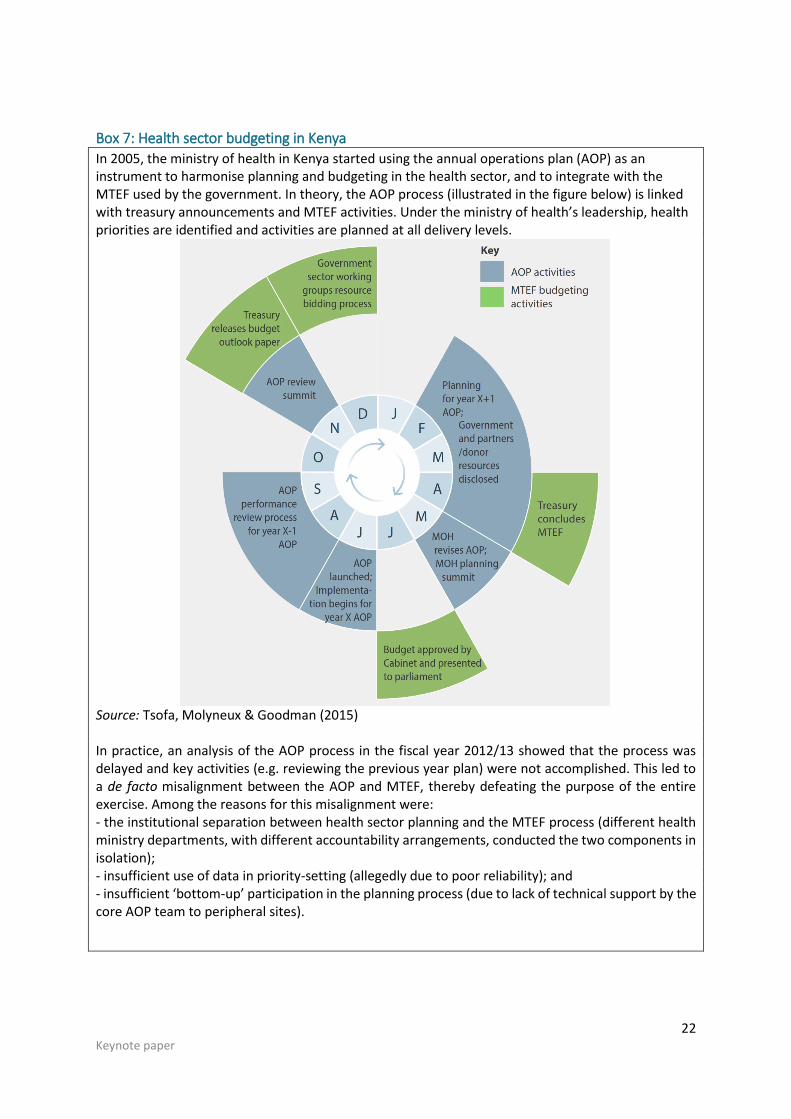
In 2005, the ministry of health in Kenya started using the annual operations plan (AOP) as an instrument to harmonise planning and budgeting in the health sector, and to integrate with the MTEF used by the government. In theory, the AOP process (illustrated in the figure below) is linked with treasury announcements and MTEF activities. Under the ministry of health’s leadership, health priorities are identified and activities are planned at all delivery levels.
Source: Tsofa, Molyneux & Goodman (2015) In practice, an analysis of the AOP process in the fiscal year 2012/13 showed that the process was delayed and key activities (e.g. reviewing the previous year plan) were not accomplished. This led to a de facto misalignment between the AOP and MTEF, thereby defeating the purpose of the entire exercise. Among the reasons for this misalignment were: - the institutional separation between health sector planning and the MTEF process (different health ministry departments, with different accountability arrangements, conducted the two components in isolation); - insufficient use of data in priority-setting (allegedly due to poor reliability); and - insufficient ‘bottom-up’ participation in the planning process (due to lack of technical support by the core AOP team to peripheral sites).
Improving technical efficiency in health spending in Africa
23 Keynote paper
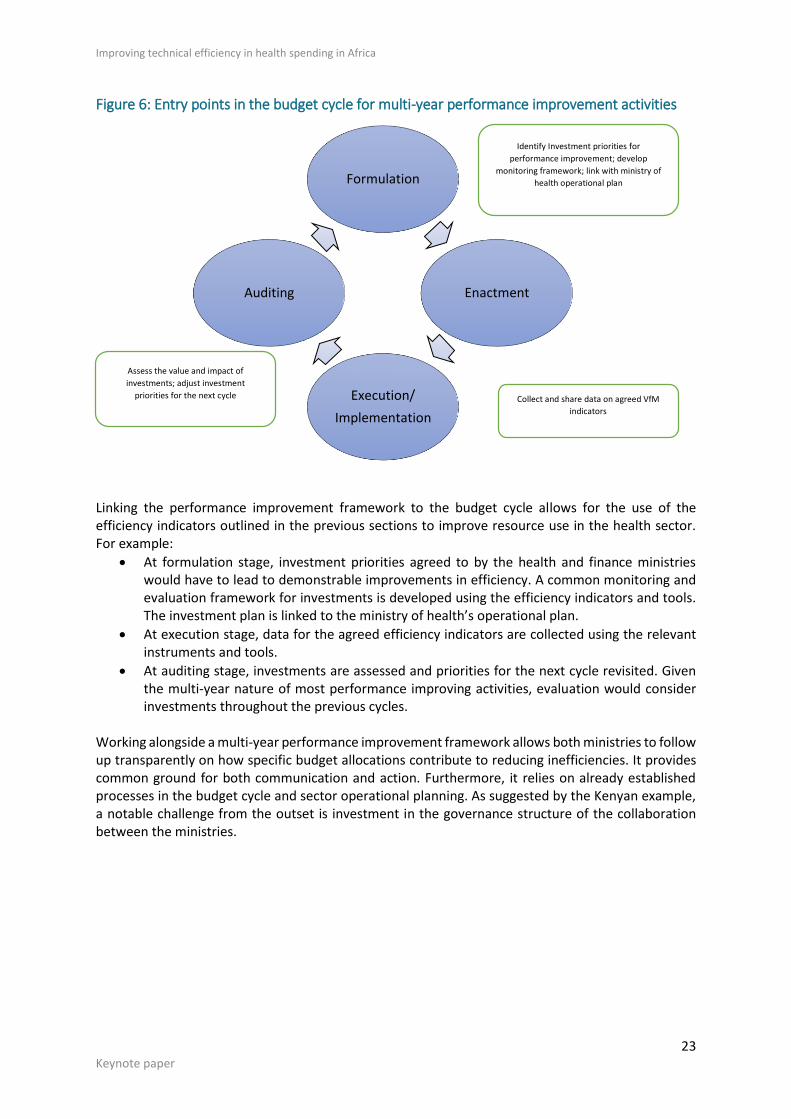
Figure 6: Entry points in the budget cycle for multi-year performance improvement activities
Linking the performance improvement framework to the budget cycle allows for the use of the efficiency indicators outlined in the previous sections to improve resource use in the health sector. For example:
At formulation stage, investment priorities agreed to by the health and finance ministries would have to lead to demonstrable improvements in efficiency. A common monitoring and evaluation framework for investments is developed using the efficiency indicators and tools. The investment plan is linked to the ministry of health’s operational plan.
At execution stage, data for the agreed efficiency indicators are collected using the relevant instruments and tools.
At auditing stage, investments are assessed and priorities for the next cycle revisited. Given the multi-year nature of most performance improving activities, evaluation would consider investments throughout the previous cycles.
Working alongside a multi-year performance improvement framework allows both ministries to follow up transparently on how specific budget allocations contribute to reducing inefficiencies. It provides common ground for both communication and action. Furthermore, it relies on already established processes in the budget cycle and sector operational planning. As suggested by the Kenyan example, a notable challenge from the outset is investment in the governance structure of the collaboration between the ministries.
Formulation
Enactment
Execution/
Implementation
Auditing
Identify Investment priorities for
performance improvement; develop
monitoring framework; link with ministry of
health operational plan
Assess the value and impact of
investments; adjust investment
priorities for the next cycle Collect and share data on agreed VfM
indicators
24 Keynote paper
Box 8: A collaborative approach to improving HIV programming in Uganda
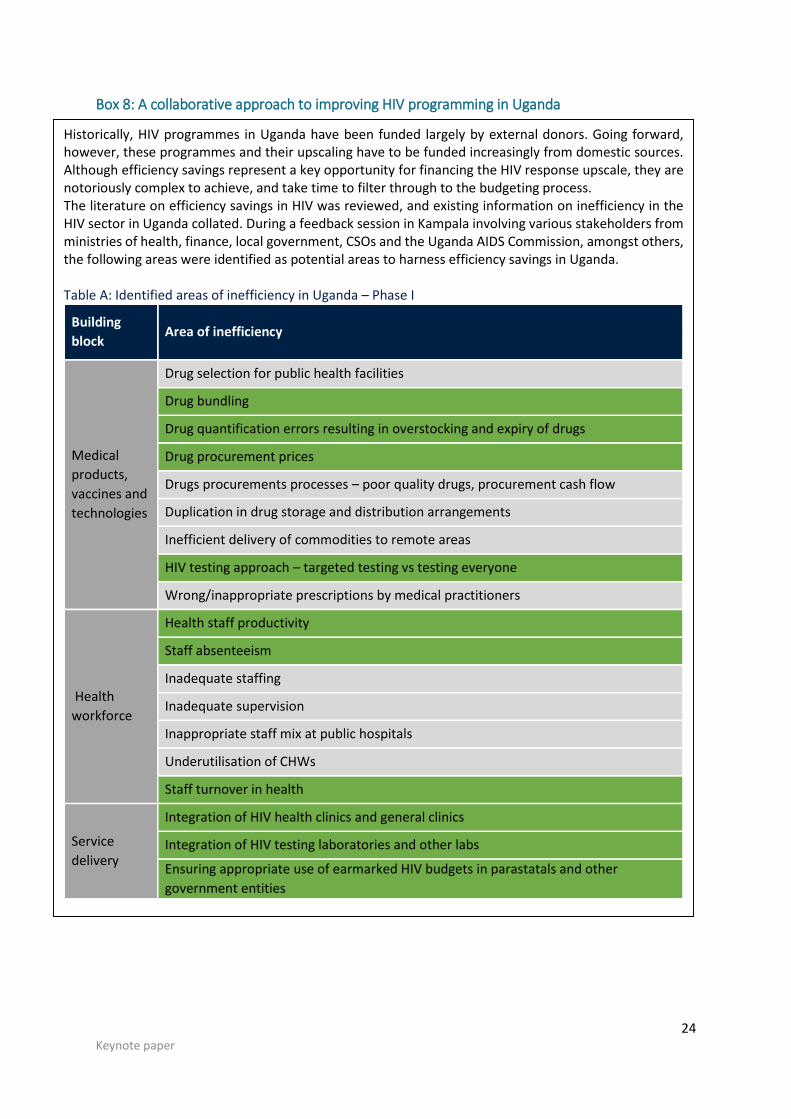
Historically, HIV programmes in Uganda have been funded largely by external donors. Going forward, however, these programmes and their upscaling have to be funded increasingly from domestic sources. Although efficiency savings represent a key opportunity for financing the HIV response upscale, they are notoriously complex to achieve, and take time to filter through to the budgeting process. The literature on efficiency savings in HIV was reviewed, and existing information on inefficiency in the HIV sector in Uganda collated. During a feedback session in Kampala involving various stakeholders from ministries of health, finance, local government, CSOs and the Uganda AIDS Commission, amongst others, the following areas were identified as potential areas to harness efficiency savings in Uganda. Table A: Identified areas of inefficiency in Uganda – Phase I
Building
block Area of inefficiency
Medical
products,
vaccines and
technologies
Drug selection for public health facilities
Drug bundling
Drug quantification errors resulting in overstocking and expiry of drugs
Drug procurement prices
Drugs procurements processes – poor quality drugs, procurement cash flow
Duplication in drug storage and distribution arrangements
Inefficient delivery of commodities to remote areas
HIV testing approach – targeted testing vs testing everyone
Wrong/inappropriate prescriptions by medical practitioners
Health
workforce
Health staff productivity
Staff absenteeism
Inadequate staffing
Inadequate supervision
Inappropriate staff mix at public hospitals
Underutilisation of CHWs
Staff turnover in health
Service
delivery
Integration of HIV health clinics and general clinics
Integration of HIV testing laboratories and other labs
Ensuring appropriate use of earmarked HIV budgets in parastatals and other
government entities
Improving technical efficiency in health spending in Africa
25 Keynote paper
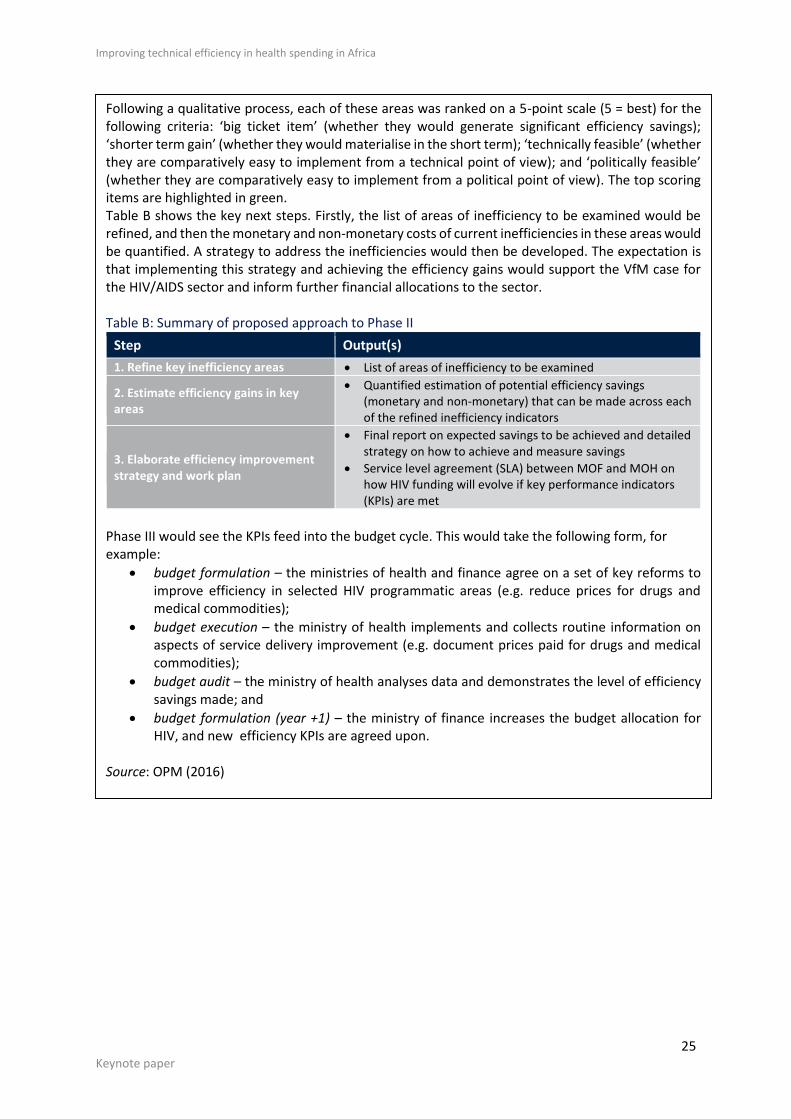
Following a qualitative process, each of these areas was ranked on a 5-point scale (5 = best) for the following criteria: ‘big ticket item’ (whether they would generate significant efficiency savings); ‘shorter term gain’ (whether they would materialise in the short term); ‘technically feasible’ (whether they are comparatively easy to implement from a technical point of view); and ‘politically feasible’ (whether they are comparatively easy to implement from a political point of view). The top scoring items are highlighted in green. Table B shows the key next steps. Firstly, the list of areas of inefficiency to be examined would be refined, and then the monetary and non-monetary costs of current inefficiencies in these areas would be quantified. A strategy to address the inefficiencies would then be developed. The expectation is that implementing this strategy and achieving the efficiency gains would support the VfM case for the HIV/AIDS sector and inform further financial allocations to the sector. Table B: Summary of proposed approach to Phase II
Step Output(s)
1. Refine key inefficiency areas List of areas of inefficiency to be examined
2. Estimate efficiency gains in key areas
Quantified estimation of potential efficiency savings (monetary and non-monetary) that can be made across each of the refined inefficiency indicators
3. Elaborate efficiency improvement strategy and work plan
Final report on expected savings to be achieved and detailed strategy on how to achieve and measure savings
Service level agreement (SLA) between MOF and MOH on how HIV funding will evolve if key performance indicators (KPIs) are met
Phase III would see the KPIs feed into the budget cycle. This would take the following form, for example:
budget formulation – the ministries of health and finance agree on a set of key reforms to improve efficiency in selected HIV programmatic areas (e.g. reduce prices for drugs and medical commodities);
budget execution – the ministry of health implements and collects routine information on aspects of service delivery improvement (e.g. document prices paid for drugs and medical commodities);
budget audit – the ministry of health analyses data and demonstrates the level of efficiency savings made; and
budget formulation (year +1) – the ministry of finance increases the budget allocation for HIV, and new efficiency KPIs are agreed upon.
Source: OPM (2016)
26 Keynote paper
References Antinoja E, Eskiocak O, Kjennerud M, Rozenkopf I & Schatz F (2011) Value for money: Current
approaches and evolving debates. London: London School of Economics.
Dawson D, Gravelle H, O'Mahony M, Street A, Weale M, Castelli A, Jacobs R, Kind P, Loveridge P,
Martin S, Stevens P & Stokes L (2005) Developing new approaches to measuring NHS outputs
and productivity. Centre for Health Economics Research Paper RP6, University of York.
DFID (Department for International Development) (2011) DFID’s approach to value for money (VfM).
DFID.
Dovlo (2005) Wastage in the health workforce: Some perspectives from African countries. Human
Resources for Health 3:6.
Drummond MF, Sculpher MJ, Torrance GW, O’Brien BJ & Stoddart GL (2005) Methods for the economic
evaluation of health care programmes. Oxford: Oxford University Press.
Ethiopian Public Health Institute (2014) Countdown to 2015: Ethiopia’s progress towards reduction in
under-five mortality. Available at:
http://www.ephi.gov.et/images/pictures/Ethiopia%20Countdown%20%20Case%20Study%
20Final%20Report.pdf [accessed 11 November 2016].
IHME (Institute for Health Metrics and Evaluation) (2013) Global burden of disease: Generating
evidence, guiding policy. Seattle: IHME.
IMF (International Monetary Fund) (2015) World economic outlook: Uneven growth – short- and long-
term factors. Washington: IMF.
Kutzin J (2001) A descriptive framework for country-level analysis of health care financing
arrangements. Health Policy 56(3): 171–204.
McKinsey Global Institute (2016) Lions on the move II: Realising the potential of African economies.
Available at: http://www.mckinsey.com/global-themes/middle-east-and-africa/realizing-
the-potential-of-africas-economies [accessed 11 November 2016].
OPM (Oxford Policy Management) (2008) Public Expenditure Review, 2008, Ministry of Health,
Lesotho.
OPM (2016) Technical efficiency in HIV sector in Uganda Unpublished approach paper.
Royaume du Maroc (2015) La stratégie de financement de la sante au Maroc. Rabat : Ministère de la
Santé.
Smith PC (2009) Measuring value for money in healthcare: Concepts and tools. Quest for Quality and
Improved Performance (QQUIP), Centre for Health Economics, University of York.
Tsofa B, Molyneux S & Goodman C (2015) Health sector planning and budgeting in Kenya:
Recommendations to improve alignment. KEMRI Wellcome Trust Policy Brief.
WHO (World Health Organisation) (2000) World health report. Health systems: Improving
performance. Geneva: WHO.
Improving technical efficiency in health spending in Africa
27 Keynote paper
WHO (2003) Making choices in health: WHO guide to cost-effectiveness analysis. Geneva: WHO.
WHO (2005) Sustainable health financing, universal coverage and social health insurance. World
Health Assembly Resolution 58.33 (2005). Geneva: WHO.
WHO (2007) Everybody’s business: Strengthening health systems to improve health outcomes. Geneva:
WHO.
WHO (2008) Framework and standards for country health information systems. Geneva: WHO.
WHO (2010a) World health report. Health systems financing: The path to universal coverage. Geneva:
WHO.
WHO (2010b) Monitoring the building blocks of the health system. Geneva: WHO.
WHO (2012) Country health information system assessments. Geneva: WHO.
Zeng (2014) Global health system DEA. Unpublished document, Oxford Policy Management.