improving the chest protection of elderly occupants … · improving the chest protection of...
TRANSCRIPT
Loughborough UniversityInstitutional Repository
Improving the chestprotection of elderly
occupants in frontal crashesusing SMART load limiters
This item was submitted to Loughborough University's Institutional Repositoryby the/an author.
Citation: EKAMBARAM, K., FRAMPTON, R. and BARTLETT, L., 2015.Improving the chest protection of elderly occupants in frontal crashes usingSMART load limiters. Traffic Injury Prevention, 16 (Suppl 2), pp S77-S86.
Additional Information:
• This is an Accepted Manuscript of an article published by Taylor &Francis in Traffic Injury Prevention on 05 Oct 2015, available online:http://dx.doi.org/10.1080/15389588.2015.1064528 . The article was pub-lished as part a Special Issue of the 59th Annual Scientific Conference ofthe Association for the Advancement of Automotive Medicine (AAAM),October 2015.
Metadata Record: https://dspace.lboro.ac.uk/2134/18982
Version: Accepted for publication
Publisher: c© Taylor & Francis
Rights: This work is made available according to the conditions of the Cre-ative Commons Attribution-NonCommercial-NoDerivatives 4.0 International(CC BY-NC-ND 4.0) licence. Full details of this licence are available at:https://creativecommons.org/licenses/by-nc-nd/4.0/
Please cite the published version.
1
Improving the Chest Protection of Elderly Occupants in Frontal Crashes using SMART Load Limiters
Karthikeyan Ekambaram, Richard Frampton, Lisa Bartlett
Loughborough University, UK
Correspondence: Karthikeyan Ekambaram, Design School, Loughborough University, Loughborough,
Leicestershire, LE11 3TU, UK
Email Address: [email protected]
ABSTRACT
Objective: To determine whether varying the seat belt load limiter (SBL) according to crash and occupant
characteristics could have real world injury reduction benefits in frontal impacts and if so, to quantify those
benefits.
Methods: Real world UK accident data were used to identify the target population of vehicle occupants and
frontal crash scenarios where improved chest protection could be most beneficial. Generic baseline driver and
front passenger numerical models using a 50th percentile dummy were developed with MADYMO software.
Simulations were performed where the load limiter threshold was varied in selected frontal impact scenarios.
For each SBL setting, restraint performance, dummy kinematics and injury outcome were studied in five
different frontal impact types. Thoracic injury predictions were converted into injury probability values using
AIS 2+ age dependent thoracic risk curves which were developed and validated based on a methodology
proposed by Laituri et al. (2005). Real world benefit was quantified using the predicted AIS 2+ risk and
assuming an appropriate adaptive system was fitted to all the cars in a real world sample of recent frontal
crashes involving European passenger cars.
Results: From the accident data sample the chest was the most frequently injured body region at an AIS 2+
level in frontal impacts (7% of front seat occupants). The proportion of older vehicle front seat occupants (>64
years) with AIS 2+ injury was also greater than the proportion of younger occupants. Additionally, older
occupants were more likely to sustain seat belt induced serious chest injury in low and moderate speed frontal
crashes. In both front seating positions, the low SBL provided the best chest injury protection, without
increasing the risk to other body regions. In severe impacts, the low SBL allowed the driver to move
dangerously close to the steering wheel. Compared to the driver side, greater ride down space on the passenger
side gave a higher potential for using the low SBL’s. When applying the AIS 2+ risk reduction findings to the
weighted accident data sample, the risk of sustaining an AIS 2+ seat belt injury changed to 0.9%, 4.9% and 8.1%
for young, mid and older occupants respectively from their actual injury risk of 1.3%, 7.6% and 13.1%.
Conclusions: These results suggest the potential for improving the safety of older occupants with the
development of smarter restraint systems. This is an important finding since the number of older users is
expected to increase rapidly over the next 20 years. The greatest benefits were seen at lower crash severities.
This is also important since most real world crashes occur at lower speeds.
Keywords: Accident data, Frontal impacts, Smart restraints, Chest injury, Older occupants, Benefit analysis

2
INTRODUCTION
Introduction of the European frontal impact directive (UNECE R94) and EuroNCAP test has significantly
improved occupant protection in frontal impact through advancements in vehicle structure and restraint systems.
Frontal airbags and three-point seat belt systems with load limiters and pretensioners form an integral part of
modern restraints. In the regulatory crash test, the car strikes a 40% offset deformable barrier head-on at 56
km/h. The crash performance of the vehicle is assessed by comparing the crash dummy loads with the
prescribed limits. The EuroNCAP test is similar to the regulatory test, but is conducted at a higher impact speed
(64 km/h). Offset test requirements have generally reduced occupant compartment intrusion through an increase
in the stiffness of frontal crash structures and occupant compartment strength.
The senior population is growing rapidly across the globe. In Europe, the ratio of the number of people aged
over 65 years to the population aged 15-64 years is projected to double between 2010 and 2050 (Lanzieri 2011).
It is a well-documented fact that, in general, senior vehicle occupants are more vulnerable to injury in a crash
and they tend to have worse outcomes for a similar level of injury (Kent et al. 2009). Kent and his colleagues
(Kent, Henary, et al. 2005) analysed the NASS CDS raw data between 1992 and 2002 and found that as many as
half of older drivers had sustained fatal injuries that would result in survival if sustained by younger drivers. The
higher rate of chest injury and associated mortality to elderly occupants is reported by several authors (Morris et
al. 2003; Frampton and Lenard 2009; Hill et al. 1994; Welsh et al. 2006). Skeletal fractures are the most
common type of serious chest injury in frontal impacts and elderly occupants are increasingly susceptible to
skeletal injuries from seat belt loading (Morris et al. 2003; Welsh et al. 2006). Changes in the geometrical and
material characteristics of the rib structures with ageing reduce the ability to withstand trauma, resulting in
increased thoracic skeletal injury (Kent, Lee, et al. 2005; Laituri et al. 2005; Gayzik et al. 2008; Cowin 2001).
Analysing the U.S. National Trauma Databank, Kent et al. (2008) found that occupants aged above 60 years had
increased fatality risk from rib fractures. In fact, the majority of elderly occupants who died of a chest trauma
had no injury worse than rib fractures. These predictions emphasise the need to improve the protection offered
by current restraint systems for senior vehicle users involved in a crash.
In Europe the deployment characteristics of restraint systems are generally optimised to best protect an average
young male, using a mid- sized male crash dummy (stature =175cm, BMI=24.3 kg/m3) in a EuroNCAP frontal
crash test. Most modern restraint systems remain “Single Point” i.e. they will deploy at a certain pre-determined
value (usually an acceleration level according to a deployment algorithm in the restraint control module, or a
specific belt load), although some manufacturers claim that some variation in the population is catered for.
Optimising safety systems to one particular type of crash test and one particular type of occupant has produced
safety gains but these systems may not provide similar levels of effectiveness when the crash conditions vary
with respect to the regulatory compliance test procedure. Therefore, there is a need to consider crash protection
potential for a wider occupant group, especially for older occupants whose numbers are increasing rapidly.
Smart restraint technology is a possible way to achieve the deployment variability. One way to increase the
capability of the belt restraint would be to adapt the load limiter threshold according to crash needs. Mertz and
Dalmotas (2007) demonstrated the principle that lowering shoulder belt force can provide gains in chest injury

3
risk reduction. The challenge going forward is to know when and how to vary the load limiter in real crashes in
order to achieve the best chest injury reduction without compromising the protection to other body regions.
The objectives of the current work are therefore a) to define the type of occupant and frontal crash associated
with chest injury from the seat belt, b) to study the effect on injury outcome of varying the load limiter threshold
in different frontal crash types using numerical simulation, and c) to apply the results to real world accident data
to estimate the potential injury reduction benefits.
METHODS
Accident Data Sample
Real world accident data were examined to identify the target population of vehicle occupants and frontal crash
scenarios where improved chest protection could be most beneficial. The UK Co-operative Crash Injury Study
(CCIS) data collected between 1998 and 2008 were used. CCIS collected in–depth crash and injury information
from selected geographical regions representing urban and rural roads in Great Britain (Mackay et al. 1985;
Hassan et al.1995). An accident was included in the sample if it a) occurred in one of the specified sample
regions, b) at least one occupant of a passenger car (7 years old or less at the time of the crash) was injured
according to the police assessment and c) the vehicle was towed from the accident scene. The study investigated
some 80 per cent of ‘serious’ and ‘fatal’ and 10-15 per cent of ‘slight’ injury crashes in the sample regions.
Consequently, the slight injury records were under-represented in the data which was biased toward more
serious crashes. Weighting factors based on sampling percentage were applied to the data in order to give a
representative population of crashes. The injury outcome was recorded using the Abbreviated Injury Scale
(AAAM 1990). The crash severity in this study was determined by the Equivalent Test Speed (ETS). ETS is the
vehicle delta v, calculated on the assumption that deformation was caused by impact with a fixed rigid barrier
(Lenard et al. 1998). The criteria used to select the frontal impact population are shown below:
• Single frontal impact or two impacts with frontal impact being the most significant in causing injuries
• No under-ride
• Non rollover crashes
• Principal direction of force (DOF) between 11 and 1 o’ clock
• Vehicles manufactured after the calendar year 1995
• Three point belted front seat occupants >= 15 years of age
• Vehicle with frontal airbag, and seatbelt pretensioner
Numerical Simulations
Model development: Generic baseline driver and front passenger compartment models using MADYMO
V7.4.1 were developed with identical frontal restraints and interiors including the steering system, seat and
front fascia (dashboard) (TNO 2013). The models were representative of a C segment car, also termed Small
Family Car in Europe. This approximates to the Compact Car category in North America. An example of a car
in this segment is the Volkswagen Golf. The C segment vehicle is one of the most popular in Europe. The
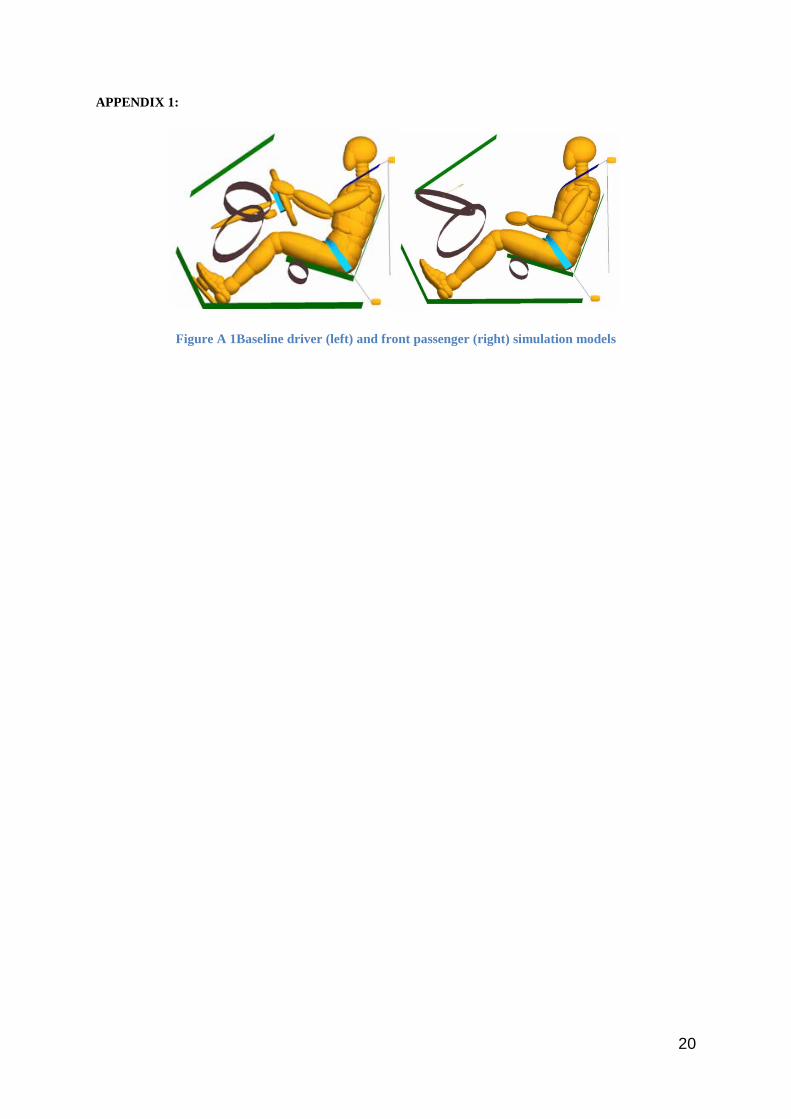
models represented the front compartment of a passenger car and the important points of front seat occupant

4
interaction in a frontal impact (Appendix 1). The stiffness characteristics of the vehicle interior components
such as the steering column, front fascia and seats were based on those defined for the TNO frontal application
model (TNO 2013). The windscreen, floor and toe pan were considered to be rigid. In both models, the
MADYMO 50th percentile Hybrid III ellipsoidal male dummy was positioned as in EuroNCAP frontal crash
tests.
The compartment models were developed with an initial baseline restraint system. This consisted of a frontal
airbag and a 3-point belt with retractor, buckle pretensioner and load limiting at the shoulder. The modelled
retractor was located at the shoulder belt lower anchorage and was locked at 1ms in to each simulated impact.
The pretensioner was modelled with a translational joint in parallel with a spring and was located at the belt
buckle. When triggered, this exerted a maximum force of 1.5 kN on the belt and was able to recoil up to 100mm
of belt slack. A 4 kN load limiter was represented in the baseline models. The driver airbag was adapted from
the TNO frontal application model. It was a standard folded circular airbag with a volume of approximately 43
litres. The passenger compartment had a generic frontal airbag with a volume of approximately 120 litres. Both
airbags were positioned to provide an adequate representation of dummy interaction with the airbag while
deployed. The gas outflow from the airbag was controlled by the vent holes and the fabric permeability. It was
assumed that vehicle intrusion was negligible in all simulated impacts.
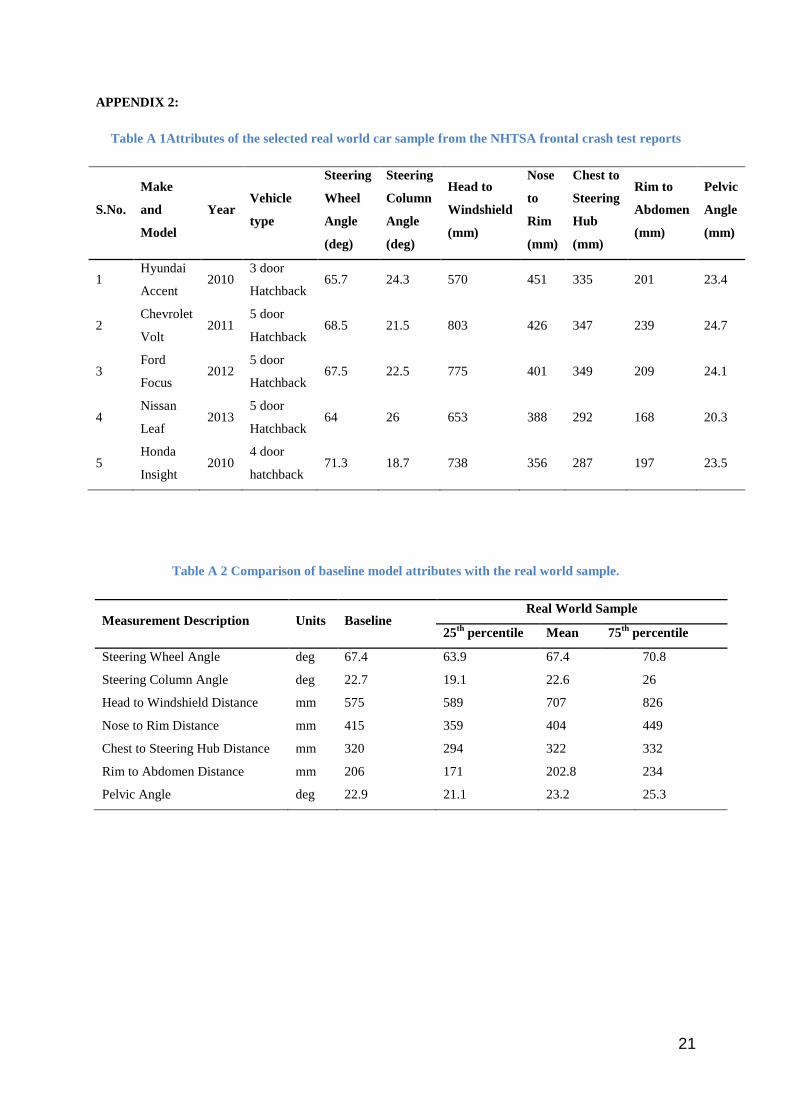
The developed models were validated in two stages. Firstly, the attributes such as dummy orientation (pelvis
angle), position of dummy with respect to vehicle interiors (e.g., chest to steering hub distance, nose to steering
rim distance, abdomen to steering rim distance), and the orientation of the vehicle components (e.g., angle of
steering wheel and steering column angle) were compared against measurements obtained from the USNCAP
frontal barrier test reports of vehicles classified as a small family car according to EuroNCAP. The model
details and its comparison with the measurements of the real car samples are detailed in Appendix 2. Secondly,
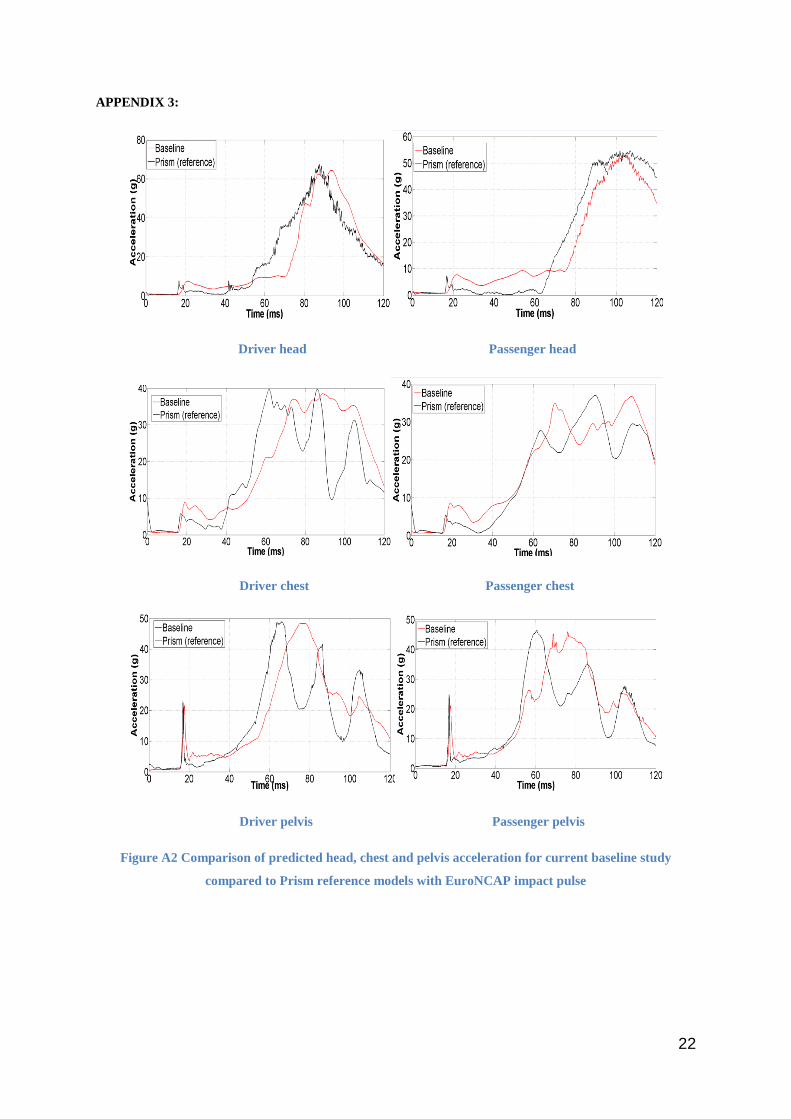
the baseline predictions for head, chest and pelvic acceleration were compared against measures obtained in
comparable tests using the validated PRISM project (Bosch-Rekveldt et al. 2005) numerical model. For
validation, the EuroNCAP impact pulse from a full-scale crash test of an equivalent size vehicle was applied in
both numerical models. Trends in acceleration were similar although differences were observed in the timing
and peak measures predicted by both models (Appendix 3). These were mainly due to modelling differences in
occupant seat position and airbag size. Nevertheless, the overall magnitude of the baseline predictions were
comparable and below the thresholds specified in the European frontal impact directive.
Test definition: Worldwide, NCAP frontal tests generally emphasise restraint performance in a full overlap
high crash pulse scenario (56 km/h USNCAP) or vehicle structural performance in a high speed offset impact
configuration (64 km/h EuroNCAP). The accident data analysis demonstrated that the majority (70%) of front
seat occupants with AIS 2+ chest injury from the seat belt were involved in frontal crashes between 20 and 45
km/h. Much lower impact severities than those employed in NCAP testing. Therefore, to cover as wide a range
of real frontal crash conditions as possible, and based on availability of crash pulse data, five frontal crash
scenarios were selected for modelling. These included both high and low crash severities. The pulses were based
on front end overlap and test speed applied to a C segment passenger car. Using this selection, a series of 40
parametric tests were defined and simulated. The following crash pulse data were applied to the compartment
5
models during the parametric investigations. Peak pulses are shown but it should be noted that pulse duration
also differed between full and offset impact types:
1. Low pulse
• Low FRB: Full width rigid barrier impact at 26 km/h (peak pulse 14 g)
• Low ODB: 40% offset deformable barrier impact at 40 km/h (peak pulse 17g)
2. Mid pulse
• Mid: 40% offset deformable barrier impact at 56 km/h (peak pulse 30 g)
3. High pulse
• EuroNCAP: 40% offset deformable barrier impact at 64 km/h (peak pulse 33 g)
• USNCAP: Full width rigid barrier impact at 56 km/h (peak pulse 40 g)
Passenger compartment intrusion was not considered in the numerical simulation based on two assumptions.
Most European vehicles would exhibit minimal intrusion in the selected impact scenarios and intrusion would
limit the scope for injury reduction using variable load limiters. The pretensioner was fired at 15ms in all
selected impacts and the seat belt load limiting was varied between 2 kN, 3 kN, and 6 kN along with a baseline
model of 4 kN. Airbag triggering time was set according to the crash severity and was as follows a) Low FRB :
45 ms, b) Low ODB : 38 ms, c) Mid : 28 ms, d) EuroNCAP : 25 ms and e) USNCAP : 15 ms. The analysis was
conducted in both front seating positions.
Equivalent real world crashes: In order to assess the relevance of the model’s chest injury predictability for
real crashes, predicted chest injury risks were compared to those in equivalent real world impacts which were
deliberately narrowed to closely resemble the simulations, both in terms of front end overlap and impact speed.
Real world frontal crashes with overlap above 70% were considered as full overlap (100%) and crashes with
overlap less than 60% were considered as offset (40%). Crashes with overlap between 60 and 70%, front fascia
and/or steering wheel intrusion above 80mm and impact to narrow objects with diameter <41cm were excluded
to improve the match.
1. Low pulse
• Low FRB: ETS 20 – 30 km/h, overlap >70%
• Low ODB: ETS 35 – 45 km/h, overlap <60%
2. Mid pulse
• Mid: ETS 51 – 60 km/h, overlap <60%
3. High pulse
• EuroNCAP: ETS 61 – 70 km/h, overlap <60%
• USNCAP: ETS 51 – 61 km/h, overlap >70%
Selection of Best Load Limiter Setting
Tuning the restraints to benefit one body region may have a negative effect on other body regions. To gauge the
performance of the restraint system in a simulated crash scenario, a method used by NHTSA to determine the

6
joint injury probability (Pjoint) was adopted. The evaluation combines the injury risk to each selected body
region assuming that injury to different body regions are independent events (NHTSA 2008).
𝑃𝑗𝑗𝑗𝑗𝑗 = 1 − [(1 − 𝑃ℎ𝑒𝑒𝑒)(1 − 𝑃𝑗𝑒𝑛𝑛)(1 − 𝑃𝑛ℎ𝑒𝑒𝑗)�1 − 𝑃𝑓𝑒𝑓𝑓𝑓�] (1)
The Phead, Pneck, Pchest and Pfemur are the injury probability of head, neck and chest sustaining AIS 3+
injury and the femur sustaining AIS 2+ injury (NHTSA 2008).
The presence of the steering wheel reduces the ride down space on the driver side. High dummy excursion
generally increases the chances of hard contact with the vehicle interior and unstable contact with the deploying
airbag. An additional measure was used to classify the excursion of the driver dummy as safe or not safe in each
of the simulated crash scenarios since dynamic steering wheel intrusion was not considered. From the accident
data it was found that 85% of the records with ETS between 40 km/h and 70 km/h had steering wheel
displacement less than 80 mm. Consequently, the best restraint system was selected in the driver tests only if (a)
the chest injury was reduced without increasing the overall injury risk and b) the minimum distance between the
dummy and steering wheel was greater than 80 mm.
Benefit Quantification
One of the research aims was to quantify the real world injury benefit of the smart restraint. It was achieved by
applying the estimated chest injury risk reduction from the simulations to the accident target sample according
to the occupant seating position, impact scenario and age. For this purpose, frontal impacts where front seat
occupants had sustained AIS 2+ chest injury only from seat belt loading were matched to the simulated impacts.
The inclusion and exclusion criteria used in the predictability analysis were employed, although crash speed
bands were widened to retain as many cases as possible while still representing the general type of loading
severity of the simulated impacts.
1. Low pulse
• Low FRB: ETS ≤ 40 km/h, overlap >70%
• Low ODB: ETS ≤ 45 km/h, overlap <60%
2. Mid pulse
• Mid: ETS 40 – 60 km/h, overlap <60%
3. High pulse
• EuroNCAP: 61 -70 km/h, overlap <60%
• USNCAP: 41 – 70 km/h, overlap >70%
It was assumed that, in each of the categorised crash scenarios, the predicted chest injury risk of the baseline
model would be representative of the real world chest injury risk, and by switching to the best SBL model, the
real world injury risk would reduce relative to the corresponding simulated predictions. Thus, the overall
frequency of AIS 2+ seat belt related chest injury after employing the smart restraint system was calculated
using Eq. (2).
𝐹𝑒𝑓𝑒𝑓𝑗 = ∑ ∑ ∑ [𝐹𝑒𝑛𝑗𝑓𝑒𝑎]𝑗𝑗𝑛[𝑅𝑏𝑏𝑏𝑏]𝑖𝑖𝑖[𝑅𝑏𝑏𝑏𝑏]𝑖𝑖𝑖
3 𝑒𝑎𝑒𝑛=1
5 𝑗𝑓𝑖𝑒𝑛𝑗 𝑗=1
2 𝑖𝑗𝑒𝑗𝑗𝑗𝑗𝑗𝑗=1 (2)
7
where
• 𝐹𝑒𝑓𝑒𝑓𝑗 is the estimated frequency of occupants to sustain AIS 2+ chest injury with a smart system
• [𝐹𝑒𝑛𝑗𝑓𝑒𝑎]𝑗𝑗𝑛 is the actual frequency of AIS 2+ chest injured in the sample for the particular seating
position, impact condition and age group
[𝑅𝑏𝑒𝑒𝑗]𝑗𝑗𝑛 𝑎𝑎𝑎 [𝑅𝑏𝑒𝑒𝑒]𝑗𝑗𝑛 are the AIS 2+ chest injury risk of best and baseline model respectively, estimated for
the particular seating position, impact condition and age group
It was necessary to transfer the simulation results to the likely chest injury severity in terms of the AIS, recorded
in the accident sample. Chest injury risk functions were used for this purpose. An AIS 3+ chest injury risk curve
was developed by Laituri and his colleagues (Laituri et al. 2005) using a dataset containing post mortem human
subjects (PMHS) test results. One of the requirements of the study reported in this paper was to estimate Fsmart
from Eq. (2) for AIS 2+ chest injury. Therefore, the methodology developed by Laituri et al. (2005) was applied
to the same PMHS dataset, in order to develop an AIS 2+ chest injury risk curve.
AIS 2+ chest injury risk curve: As in the reference work (Laituri et al. 2005), the number of rib fractures
(NRF) sustained by the PMHS was used to assess the injury severity outcome. The difference between skeletal
injury outcome among live occupants and the PMHS was also considered. Viano et al. (1977) and Foret Bruno
et al. (1978) observed cadaver specimens sustaining two or three more rib fractures than live humans.
Accordingly, if the PMHS in the database had sustained 4 or more rib fractures, then the injury level was coded
as AIS 2+. Laituri et al. (2005) found logistic regression analyses using the modified maximum likelihood
method (Nakahira et al. 2000) with normalised chest compression (UC����) and age as the predictor variables,
produced the best AIS 3+ injury risk function. A similar procedure was applied for the AIS 2+ injury risk
calculation. MATLAB was used to compute the statistical calculation.
The resulting probability estimate of age dependant AIS 2+ chest injury, as a function of chest deformation for
crash test dummies, is expressed below (Eq. (3)).
𝑃(𝐴𝐴𝐴 2 +) = 11+EXP(12.432−0.0562𝐴𝑎𝑒−1.7955(𝐶ℎ𝑒𝑒𝑗𝑒𝑒𝑓𝑎)0.4612)
(3)
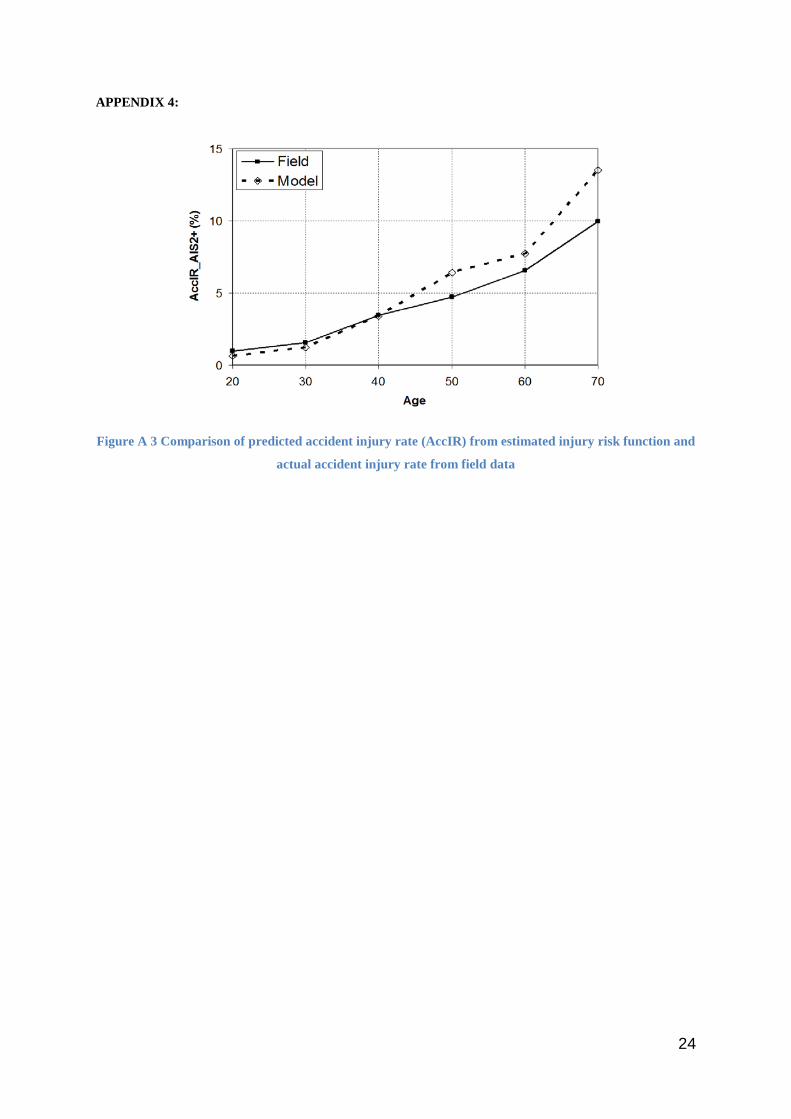
The developed injury risk function was validated by comparing the theoretical risk and the actual field injury
rates (Appendix 4). The details of the validation process can be found in Laituri et al. (2005, 2003).
RESULTS
Accident Analysis
The unweighted accident sample consisted of 2644 front seat occupants. Applying weighting factors gave 7729
front seat occupants consisting of 6644 (86%) drivers and 1085 (14%) front passengers. Unless otherwise stated,
all further analyses used weighted data. Around 60% of the sample had load limiters, 20% had no load limiters
and for the remaining 20%, the presence of a load limiter was unknown. The load limiting threshold employed
in each vehicle was not recorded in the accident data. Industry intelligence suggests that vehicles manufactured
early in the sample might have employed load limiter thresholds as high as 6 kN, dropping to 4 kN as structural

8
performance was improved. The mean occupant age in the sample was 41 years. The driver sample contained
3571 occupants aged between 17 and 39 (young), 2358 aged 40-64 years (middle-aged) and 715 aged 65+ years
(old). The passenger sample included 537 occupants aged between 15 and 39 years (young), 355 aged between
40 and 64 years (middle- aged) and 193 aged 65+ years (old).
In the overall weighted sample, 524 (7%) of all front seat occupants had sustained AIS 2+ chest injury. The
chest was the most frequently injured body region at the AIS 2+ injury level followed by the upper and lower
extremities (6% each). The chest injury risk varied among age groups, in the sample 2% of the younger
occupant, 10% of the middle age occupants and 17% of the older occupants had sustained AIS 2+ chest injuries.
A Chi-square test confirmed that there were significant differences in the chest injury severity rates between age
groups (p<0.001).
Around 90% of occupants with AIS 2+ chest injuries experienced impact speeds lower than that of the current
European regulatory test (56 km/h). The mean ETS of AIS 2+ chest injured older occupants (32 km/h) was less
than that for younger (45 km/h) and middle aged (34 km/h) occupants.
377 (72%) of front seat occupants sustained their AIS 2+ chest injuries from the seat belt alone. Injury causation
for the remaining 28% was either from the vehicle interior or a combination of belt plus interior. The majority
(68%) of all serious injuries to chest regions were rib or sternum fractures. In frontal impacts, the seat belt plays
a significant role in controlling chest load. Therefore, seat belt induced chest injuries are likely to be mitigated
by adapting the load limiter according to the crash needs. Furthermore, a reduction in soft tissue injuries and
associated intrathoracic organ injuries can also be expected with a reduction in skeletal injury.
Numerical Simulations
Four different load limiter settings were simulated in five impact scenarios for both front seating positions. In
each of the simulated impacts, the shoulder belt forces, forward dummy excursion and dummy loads were
analysed. In order to assess the predictability of the numerical model for AIS 2+ belt induced chest injury,
simulation results using the baseline 4 kN load limiter were compared to the real world AIS 2+ chest injury risk
using chest deflection outcome. Chest injury risks for the mean age group of the sample were estimated using
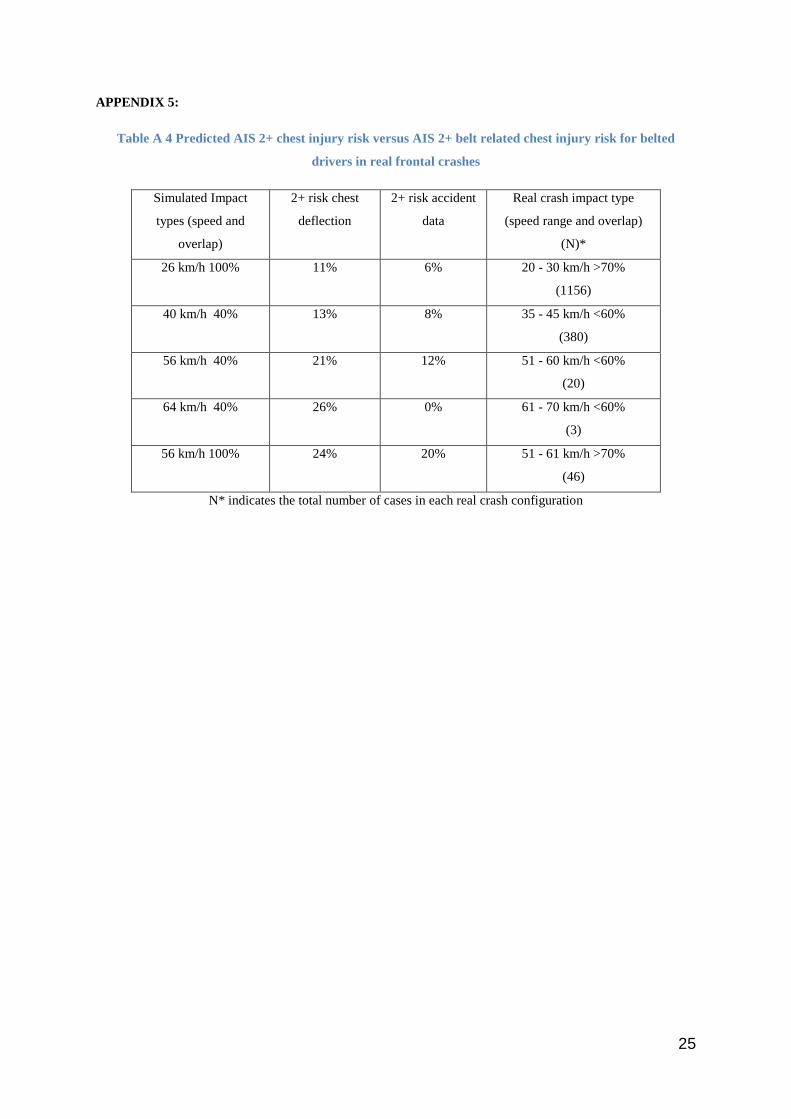
the developed injury risk function. The results comparing simulated and real risks are shown in Appendix 5.
There was not a direct match between the simulated and real chest injury risks, although the order in which the
predicted risk increased by simulated impact configuration was generally mirrored in the real crashes. The real
world risk for the 64 km/h, 40% offset impact was 0% but this may have been the result of only a handful of real
cases (3) matching that crash configuration.
Driver model: The dummy acceleration and displacement was influenced by the crash pulse severity and load
limiter behaviour. The belt load time history curves for all tested driver impacts are provided in Appendix 6. It
can be observed that, for all load limiter values, the peak loads for both the low crash pulses were less than 4 kN
and the measured forces for the 4 kN and 6 kN load limiter were very similar. Only with the high pulses did the
peak load of 6 kN occur with the 6 kN load limiter.
9
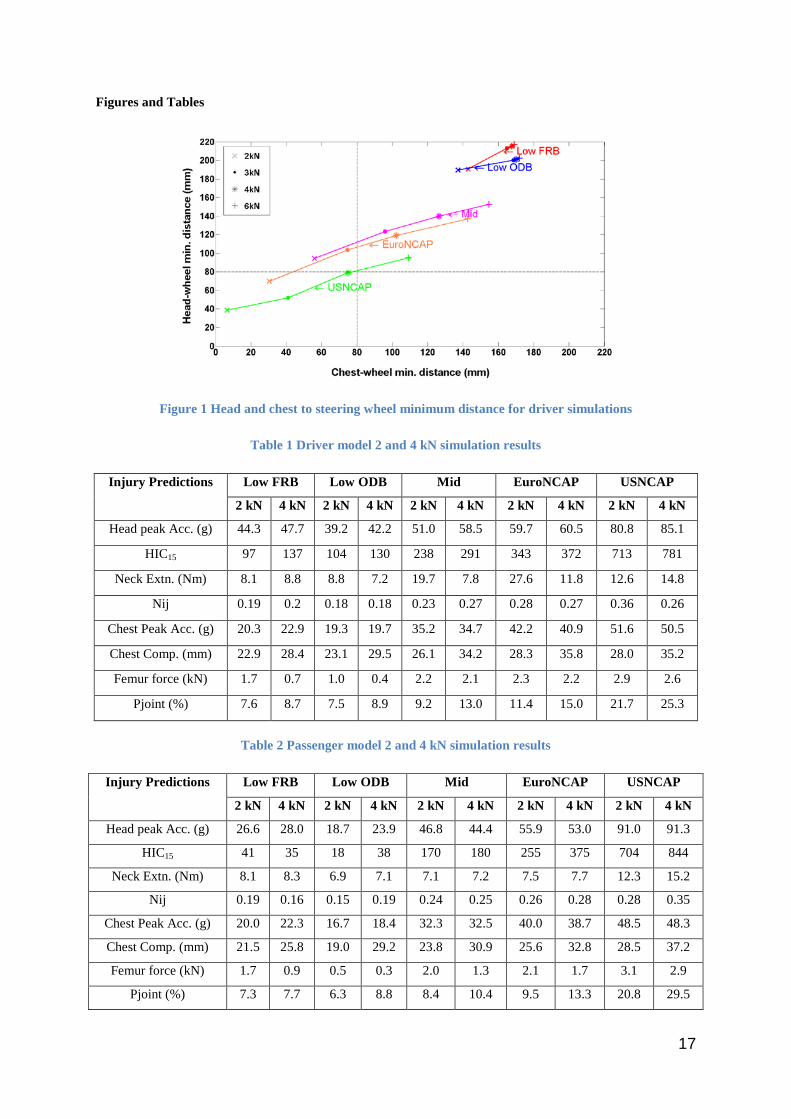
The measured minimum distance between thorax and steering wheel and head and steering wheel are shown in
Figure 1. The extra seat belt webbing with the SBL thresholds less than 4 kN allowed the dummy to displace
further towards the steering wheel than with the baseline 4 kN SBL. The selected safe zone excursion limit of 80
mm is shown as dotted lines in Figure 1. It can be observed that the dummy head excursion was safe in all low
pulse simulations. In high pulse impacts, the dummy tended to displace very close to the steering wheel with the
2 kN SBL. The chest and head of the dummy did not bottom out through the airbag in any of the impacts.
Injury risk assessment values for the 2 and 4 kN SBL in all simulated impacts are listed in Table 1 whilst the
results for all SBL thresholds are given in Appendix 8. In mid and high pulse impacts with a 2 kN SBL, the
greater forward displacement gave rise to unstable head contact on the airbag. This pushed the airbag forward
and upward, reducing the amount of airbag between chest and wheel. In contrast to the low severity crash pulses,
the peak chest accelerations with the 2 kN SBL in high pulse impacts were noticeably greater than with the 4 kN
SBL despite the chest deflection being lower with the 2 kN SBL. This was likely due to the unstable loading of
the airbag onto the steering wheel rim. Nevertheless, even a small extra forward displacement of the thorax
could have induced much harder contact, resulting in increased chest deflection and acceleration. The 3 kN SBL
in the mid pulse impact produced lower chest deflection value whilst avoiding any unstable contact with the
airbag. In all impacts, the HIC and chest deflection outcome exhibited a positive correlation with the SBL
threshold. Due to high belt pay-out and subsequent interaction with the airbag, the neck extension outcome was
significantly higher with the 2 kN SBL in mid crash pulse and EuroNCAP impacts. The 2 kN SBL (allowing a
greater amount of forward displacement) resulted in higher femur loads. The increase in AIS 2+ injury risk did
not however reach levels which would give rise to concern. For example, the femur axial force measured using a
2 kN and 4 kN SBL with the low FRB pulse corresponds to 0.7% and 0.4% AIS 2+ femur injury risk
respectively.
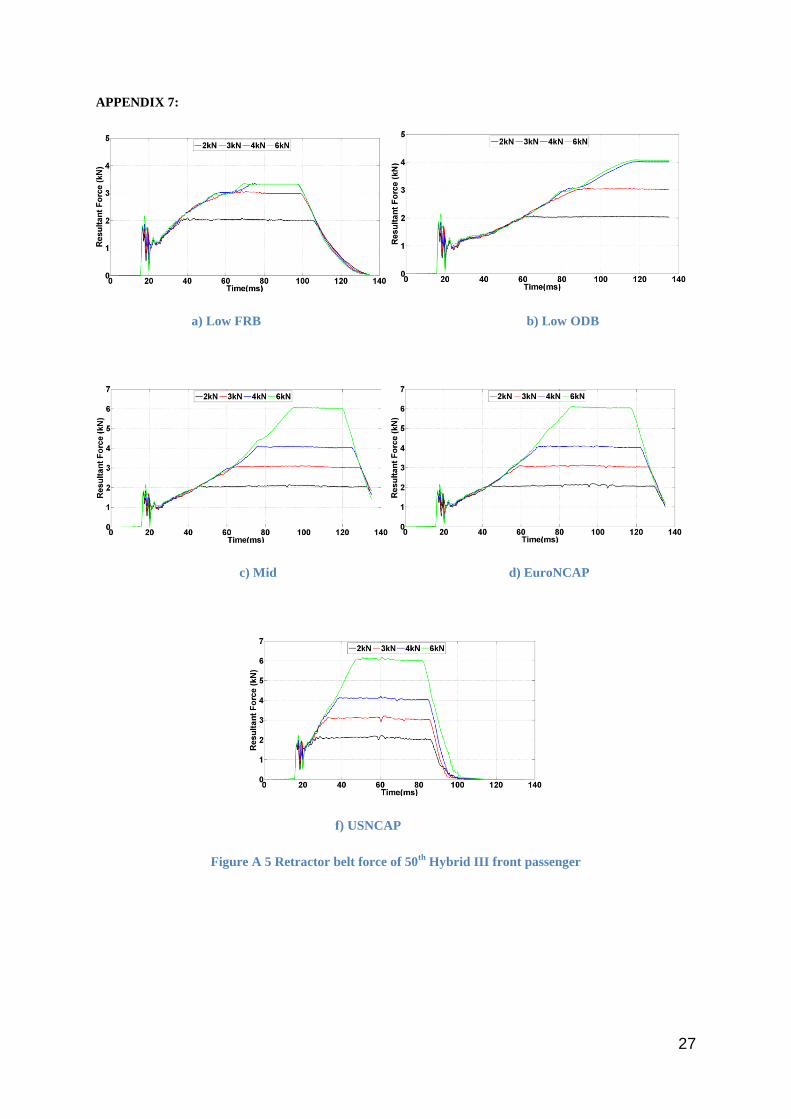
Passenger model: The dummy did not have a hard contact with the vehicle interior in any of the simulated
impacts. Using the 6 kN SBL, the belt force reached 6 kN only in the mid and high pulse impacts. In low pulse
impacts, the resultant forces using the 4 kN and 6 kN SBL were very similar (Appendix 7). Injury risk
assessment values for the 2 kN and 4 kN SBL in all simulated impacts are shown in Table 2. The HIC outcomes
were generally lowest using the 2 kN SBL. The only exception being a lower HIC for the low FRB pulse when
using the 4 kN SBL. The 2 kN SBL produced lowest chest compression scores in all impacts. But a greater
forward displacement of the dummy in high pulse impacts with a 2 kN SBL resulted in higher chest and head
peak acceleration. More simulation runs with different adapted dummy postures and crash pulses would be
required for a greater understanding of the effect of the 2 kN SBL in such crash scenarios. The 3 kN SBL in mid
pulse and EuroNCAP impacts provided the best injury protection with stable airbag loading (Appendix 8).
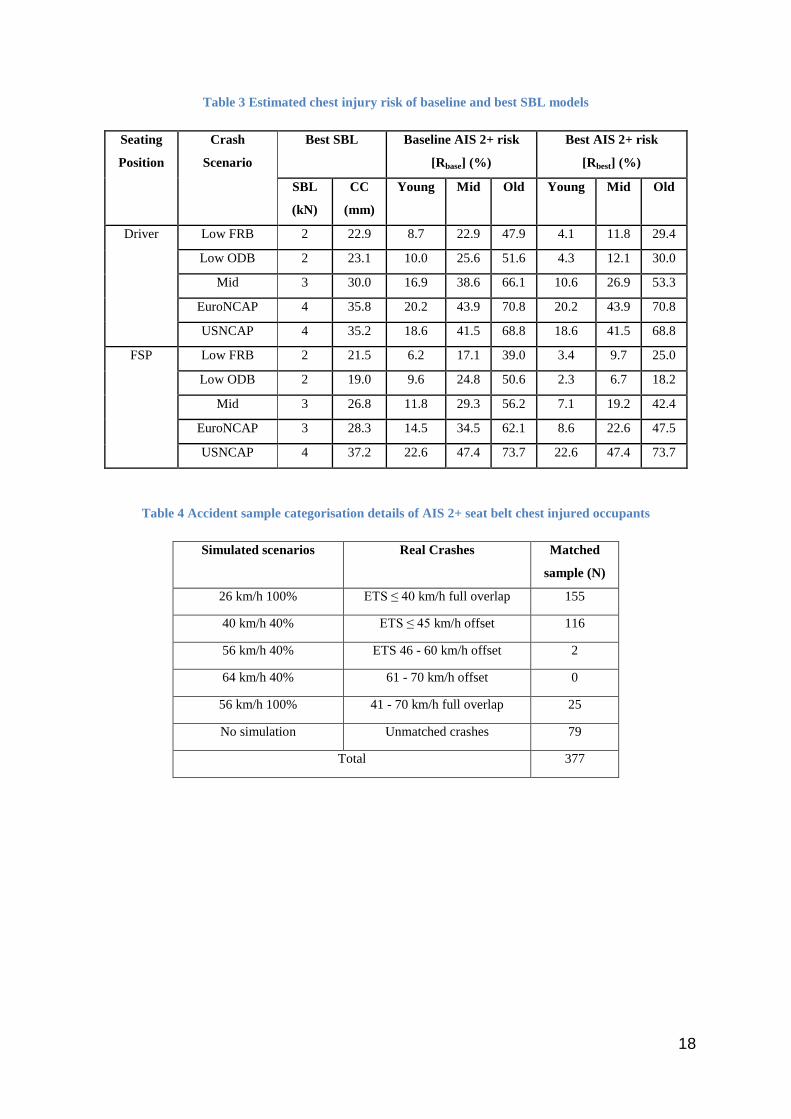
Chest injury risk: The risk of AIS 2+ chest injury in each impact scenario for different age groups, when
employing baseline and best restraint systems are shown in Table 3. In impacts where a low SBL did not
provide the best result, the load limiter threshold was set at the baseline value of 4 kN. In the AIS 2+ chest
injury risk function, the age was set as 30, 50 and 70 years for young, middle-aged and older occupants
respectively and is based on the mean value of age categories from the accident sample. It can be observed that
in low pulse FRB impacts, the injury risk of older drivers using the baseline SBL was almost five times greater
than the younger drivers and twice as great as for middle aged drivers. A similar difference was observed in low

10
pulse ODB impacts. This is seen in real world crashes where a larger proportion of older occupants sustained
AIS 2+ chest injuries in low severity crashes. The chest injury risk of older drivers in the EuroNCAP impact
was approximately 3.5 and 1.5 times greater than the young and middle aged drivers respectively.
Real World Benefit Quantification
Simulations showed that, providing intrusion is controlled, varying the SBL threshold can reduce chest injury
without increasing risk to other body regions. Of the 377 occupants who had sustained AIS 2+ chest injury from
the seat belt alone, 298 (79%) were matched with a simulated scenario. Details of the categorisation of the
matched cases (298) with the frequency of occurrence are shown in Table 4. This reduced target sample of 298
occupants consisted of 221 (74%) drivers and 77 (26%) front passengers. Of which 35 (12%) occupants were
young, 165 (55%) were middle aged and 99 (33%) were older occupants.
The potential benefit of a smart load limiter was then estimated by using Eq. (2). For those 79 cases which were
not matched with a simulated scenario, it was assumed that varying the load limiter would not have produced
any reduction or increase in the chest injury risk i.e. ratio of Rbest and Rbase is 1. It was also assumed that all
vehicles in the target sample of accident data had 4 kN load limiters (similar to the baseline numerical model)
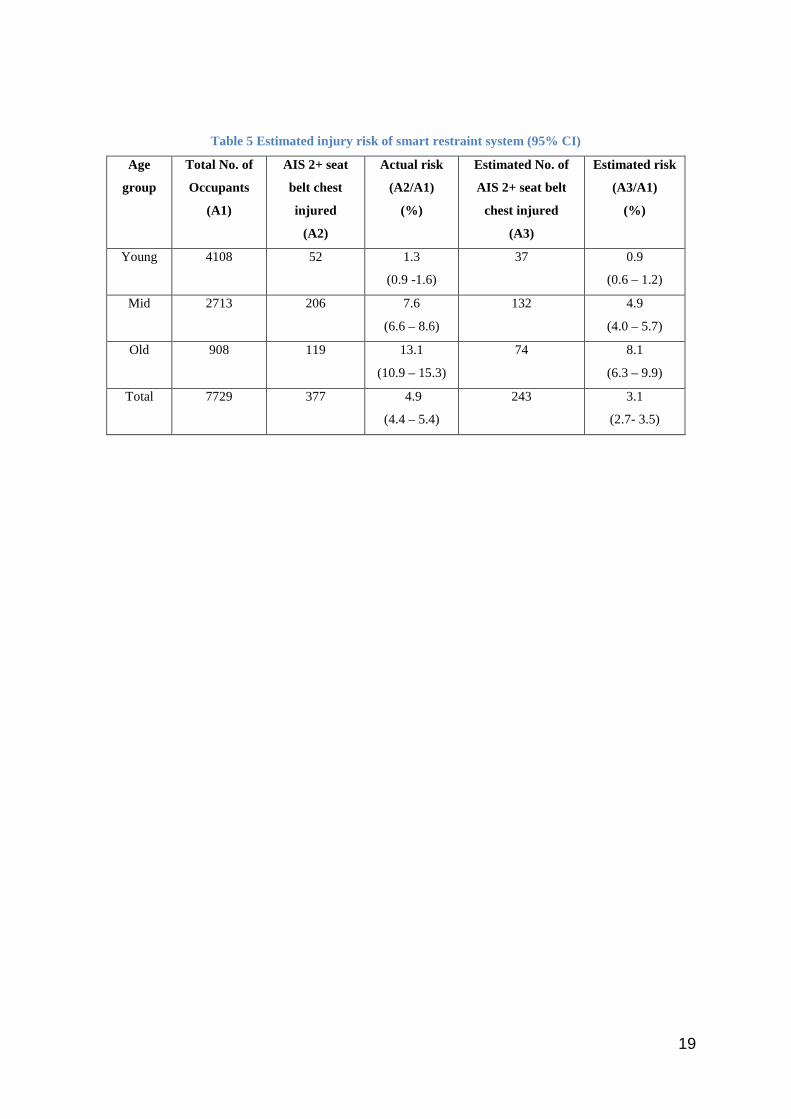
and that the relative changes in simulated risk would also apply to the real world crashes. Table 5 illustrates the
real world potential of intelligently varying the load limiter threshold. The result suggests that, if all the vehicles
in the accident sample had used the best SBL setting, the proportion of older occupants who had sustained AIS
2+ seat belt chest injury in frontal crashes would have reduced to 8.1% from the actual accident injury risk of
13.1% For young and middle aged occupants, the corresponding chest injury risk would have reduced to 0.9%
and 4.9% from their actual accident injury risk of 1.3% and 7.6% respectively.
DISCUSSION
In real crashes, older people were found to sustain significantly higher rates of AIS 2+ chest injury, concurring
with earlier real world studies (Morris et al. 2003; Welsh et al. 2006; Hill et al. 1994). There were also
noticeable differences in the mean ETS between age groups when chest injury occurred. Older occupants tended
to sustain proportionally more AIS 2+ chest injuries in low/moderate speed impacts. This is in agreement with
previous studies (Augenstein et al. 2005; Welsh et al. 2006; Mertz & Dalmotas 2007). Skeletal fracture was the
most common chest injury at the AIS 2+ level and the majority of them were caused by seat belt loading. This
finding clearly suggests the need to reduce restraint forces in frontal impacts with low severity crash pulses,
especially for elderly vehicle occupants.
Crash simulations were developed to represent a range of real world frontal crashes with low, medium and high
impact severities but with no passenger compartment intrusion. Within the simulations, the seat belt load limiter
threshold (SBL) was varied away from a 4 kN baseline and the effect on injury risk noted.
For the 50th percentile driver with low and mid severity crash pulses, the SBL threshold set at 2 kN and 3 kN
respectively, produced the best chest and overall injury outcomes with safe dummy displacement. In both NCAP
scenarios (high pulse), the higher belt payout with the 2 kN SBL allowed the dummy to move further toward the
steering wheel. In those cases, chest deflection was still lower with the 2 kN compared to the 4 kN SBL but peak
11
chest acceleration was increased. If the dummy had displaced only a little further, it is likely that it would have
bottomed out the airbag and struck the steering wheel, resulting in increased chest injury risk. This suggests that
caution is needed when choosing a driver load limiter threshold below baseline in high speed impacts. With the
USNCAP pulse, the excursion of the driver dummy with the baseline 4 kN SBL was on the border of the safe
zone (80mm from steering wheel). With the 6 kN SBL it was well within the safe zone but the predicted chest
injury and overall injury risk was much higher compared to the baseline SBL. For this reason, the baseline SBL
was chosen as the best model and illustrates the trade-off issues between load limiting to reduce occupant
restraint loads and forward excursion with possible hard contact on interior structures. These findings are
consistent with the load limiter adaptation studies reported in the literature (Kitagawa & Yasuki 2013; Hynd et
al. 2012) where lowering the seatbelt load limit increased chest injury caused by steering wheel contact.
Simulations with the 50th percentile male dummy on the passenger side showed that the 2 kN SBL models
produced the best chest and overall injury scores in low severity impacts respectively. Whilst the 3 kN SBL
produced the best injury protection in mid and EuroNCAP impacts with stable airbag loading. Compared to the
driver, there appeared to be more scope for the use of a SBL under 4 kN in that high pulse front passenger
impact due to more available ride-down distance.
The lack of protection offered to older vehicle occupants by the restraint systems tested under current regulatory
and NCAP configurations was documented through literature search and accident data analysis. When factoring
in the effects of occupant age however, the calculated AIS 2+ chest injury risk in all simulated scenarios
predicted a greater level of injury risk to older occupants compared to their younger counterparts. In fact, in all
impacts except low pulse FRB pulse, the AIS 2+ chest injury risk for older front seating occupants with a
baseline SBL was greater than 50%. This clearly highlights the shortcomings of traditional single point restraint
systems and in general the use of a non-age related injury limit in crash test procedures. In an ideal scenario, the
vehicle restraints should provide equal protection to occupants of different ages and such systems would
consider the effect of ageing on injury tolerance. The adaptive system studied has shown its potential to reduce
the chest injury risk, particularly in crashes with a low pulse, which was the real world scenario where the
number of chest injured older occupants was highest. Inclusion of a low speed impact with a lower chest injury
requirement in regulatory testing could address this issue by encouraging manufacturers to adopt variable
restraints. Digges and Dalmotas (Digges & Dalmotas 2007) have already established that the addition of 40
km/h rigid barrier tests and appropriate injury criteria levels would provide significant chest injury reduction,
particularly to elderly occupants in the US. Inclusion of such tests would also have benefits in Europe,
particularly because vehicle structures are generally encouraged to be “stiff” by high speed offset frontal tests. It
is not clear however if great gains in driver chest protection could be achieved with a smarter load limiter in
high speed, high pulse impact scenarios, where major benefits have not been found in this analysis. There may
be more scope for front seat passenger protection as suggested by the simulation results for the front seat
passenger in the EuroNCAP simulation.
The real world benefit of a smart load limiter was calculated by applying simulation results to the real world
data sample. Simulated injury risks by occupant age and crash configuration were matched to occupant age and
crash configuration in the real world impacts. In the absence of thoracic deformation detail from injured
occupants, it was assumed that the predicted baseline chest injury risk from the simulations corresponded to the
12
real world chest injury risk and moreover, that the relative reduction in the chest injury risk through best load
limiter selection in the simulation would reduce the real world chest injury risk by a similar amount. For crashes
not be matched to the simulations, it was assumed that the real world chest injury risk would remain the same.
In other words, the load limiting level would not change. The results showed that if all the vehicles in the
sample studied been equipped with smart load limiters able to adapt to the best setting for crash configuration
and occupant type then, 36% of the front seat occupants who had previously sustained AIS 2+ chest injury from
the seat belt would have sustained a lower chest injury AIS score. Additionally, the rate of AIS 2+ seat belt
chest injury in frontal crashes would have reduced to 8.1% from the actual accident rate of 13.1% for older
occupants. For young and middle aged occupants, the corresponding chest injury rate would have reduced to 0.9%
and 4.9% from their actual accident injury rate of 1.3% and 7.6% respectively. This finding shows a clear
indication of chest injury reduction benefit across all age groups when the load limiter characteristics are varied.
This suggests that employing smart restraint systems in a vehicle would not only benefit the older occupants but
also the middle aged and young occupants. The benefit does appear to be most pronounced for older occupants,
since the older population is more vulnerable to chest injury. As the older population of car users is rapidly
rising, the benefits of smarter systems can only increase in the future.
Representing real world impacts with a limited number of simulations or crash tests always involve assumptions
and compromises due to the wide variation in real world crashes. Injury outcome with real people depends on
occupant age, state of health, size, seating position and seating posture. There is a large variation in crashes in
terms of speed, impact angle, overlap with struck object and type of struck object. Even for the same impact
configuration, the crash pulse will vary due to the particular force deflection characteristics of individual
vehicles, and occupant injury outcome will vary depending on individual restraint system performance
parameters. The biofidelity of ATDs and the accuracy of risk assessment functions also come into play. When
matching simulations with real world impacts, we tried to consider as many variables as possible given the
limited availability of simulated crash pulses and data available from real crashes. Even so, there was not a
direct match between chest injury risk in baseline simulations and in equivalent real world crashes, although the
order in which the predicted risk increased by simulated impact configuration was generally mirrored in the real
crashes. More simulated crash configurations and more accident data would have allowed a greater tuning of
simulations to real world crashes and this is recommended for future work. An injury risk function was used in
this study to convert chest injury criteria from simulations into an AIS 2+ chest injury severity risk for real
occupants. The function was validated based on the original real world data considered by Laituri et al. (2005).
Future enhancement of the function could involve validation with more recent data and restraint conditions.
Passenger compartment intrusion was not considered in this study based on two premises. Most European
vehicles would exhibit minimal intrusion in the selected impact scenarios and intrusion would limit the scope
for injury reduction using variable load limiters. Further work could consider the effect of adaptable load
limiters under intrusion conditions possibly complemented by variable airbag volume and deployment timing to
enhance the scope for load limiting of the belt. Optimal tuning of the airbag to the load limiter characteristics
could allow improved protection across a wider range of frontal crashes.
The benefit calculations in this study assumed that all vehicles in the accident sample were fitted with a baseline
4 kN load limiter although the type of load limiter was not recorded in the accident data. Earlier load limiters
13
may have been set as high as 6 kN but simulations of the most common low pulse crashes showed minimal
difference in shoulder belt loads using a 4 kN or 6 kN SBL. In that respect, the impact of not knowing the load
limiter threshold in the real world sample is likely to be minimal.
In this study, the effect of variable seat belt load limiting on different sized occupants was not investigated. The
SBL threshold selected for 50th percentile dummy may not provide an ideal protection to other sized occupants,
whose stature and adopted seat fore/aft position are generally different. Conducting simulations with dummies
of different sizes (5th and 95th) and quantifying the real world injury benefits according to the occupant size may
provide a more accurate result. Additionally, the SBL threshold was varied by selected discrete values.
Numerous settings could be simulated between and away from these selected values to further refine the
restraint. In practise, a system capable of providing infinite load limiting thresholds, like that studied by Wang
& Zhou (2009), may provide better protection than one which can only enable set values.
ACKNOWLEDGMENTS
The authors are grateful to Mr. Tony Laituri and Mr. Scott Henry of Ford Motor Company, U.S. for their
contributions in validating the AIS 2+ thoracic injury risk curves. All conclusions of the study reported in this
paper are, however, solely those of the authors.
This paper uses accident data from the UK Co-operative Crash Injury Study (CCIS). CCIS was managed by
TRL Limited on behalf of the UK Department for Transport (DfT) Transport Technology and Standards
Division who funded the project along with Autoliv, Ford Motor Company, Nissan Motor Company and Toyota
Motor Europe. Daimler–Chrysler, LAB, Rover Group Ltd, Visteon, Volvo Car Corporation, Daewoo Motor
Company Ltd and Honda R&D Europe (UK) Ltd have also funded CCIS. The data were collected by teams
from the Birmingham Automotive Safety Centre of the University of Birmingham, the Vehicle Safety Research
Centre at Loughborough University, TRL Limited and the Vehicle & Operator Services Agency of the DfT. For
further information about the UK collision investigation data, please go to [email protected]
14
REFERENCES
Abbreviated Injury Scale 1990 Revision. Association for the Advancement of Automotive Medicine
(AAAM). 1990
Augenstein J, Digges K, Bahouth G, Dalmotas D, Perdeck E, Stratton J. Investigation of the performance of
safety systems for protection of the elderly. Investigation of the performance of safety systems for
protection of the elderly. Annual Proceedings / Association for the Advancement of Automotive
Medicine. 2005;49, 361–369.
Bosch-Rekveldt M, Brandse J, Couper G, Morris R, Neale M. Development and application of generic restraint
numerical models for parametric investigations of selected impact scenarios. Prism. Tech. Rep, 6. 2005;
R7. http://www.prismproject.com/FINAL_R6-R7_PRISM_REPORT_09DEC05.PDF
Cowin S. Bone Mechanics Handbook. CRC Press; New York, NY. 2001
Department for Transport (DfT). Reported Road Casualties Great Britain: 2013 Annual Report. 2014.
Digges K, Dalmotas D. Benefits of a Low Severity Frontal Crash Test. Annual Proceedings / Association for the
Advancement of Automotive Medicine. 2007;51: 299-317.
Foret-Bruno J, Hartemann F, Thomas C, Fayon A, Tarriere C, Got C, Patel A. Correlation Between Thoracic
Lesions and Force Values Measured at the Shoulder of 92 Belted Occupants Involved in Real Accidents,
SAE Technical Paper.1978; 780892.
Frampton R, Lenard J. The Potential for Further Development of Passive Safety.Annals of Advances in
Automotive Medicine / Annual Scientific Conference. 2009;53:51-60.
Gayzik F, Yu M, Danelson K, Slice D, Stitzel J. Quantification of age-related shape change of the human rib
cage through geometric morphometrics. J. Biomech. 2008;41(7):1545–1554.
Hassan A, Hill J, Parkin S. Secondary Safety Developments: Some Applications of Field Data. In: Autotech
1995; ImechE.; 1995.
Hill J, Mackay G, Morris A. Chest and abdominal injuries caused by seat belt loading. Accident Analysis
Prevention. 1994;26:11–26.
Hynd D, Carroll J, Cuerden R, Kruse D, Boström O. Restraint system safety diversity in frontal impact
accidents. In Proceedings of the International Research Council on the Biomechanics of Injury conference.
2012;Vol. 40, pp. 114-129.
Kent R, Trowbridge M, Lopez-Valdes FJ, Ordoyo RH, Segui-Gomez M. How Many People Are Injured and
Killed as a Result of Aging? Frailty, Fragility, and the Elderly Risk-Exposure Tradeoff Assessed via a

15
Risk Saturation Model. Annals of Advances in Automotive Medicine / Annual Scientific Conference.
2009;53:41-50.
Kent R, Lee S, Darvish K., Wang S, Poster CS, Lange AW, Brede C, Lange D, Matsuoka F. Structural and
material changes in the aging thorax and their role in crash protection for older occupants. Stapp car crash
journal. 2005; 49, 231-249.
Kent R, Henary B, Matsuoka F. On the fatal crash experience of older drivers. Proc of the Association for the
Advancement of Automotive Medicine.2005;49:371–391.
Kent R, Woods W, Bostrom O. Fatality Risk and the Presence of Rib Fractures.Annals of Advances in
Automotive Medicine / Annual Scientific Conference. 2008;52:73-84.
Kitagawa Y, Yasuki T. Correlation among Seatbelt Load, Chest Deflection, Rib Fracture and Internal Organ
Strain in Frontal Collisions with Human Body Finite Element Models. In Proceedings of the International
Research Council on the Biomechanics of Injury conference. 2013.; 2013:282–316.
Laituri T, Kachnowski B, Prasad P, Sullivan K., Przybylo P. A theoretical, risk assessment procedure for in-
position drivers involved in full-engagement frontal impacts. SAE Technical Paper. 2003; 2003-01-1354
Laituri T, Prasad P, Sullivan K, Frankstein M. Thomas R. Derivation and Evaluation of a Provisional, Age-
Dependent, AIS3+ Thoracic Risk Curve for Belted Adults in Frontal Impacts, SAE Technical Paper.2005;
2005-01-0297.
Lanzieri G. The greying of the baby boomers. Eurostat Statistics in focus, 2011.
Lenard J, Hurley B, Thomas P. The accuracy of CRASH3 for calculating collision severity in Modern European
Cars. The 16th International Conference on the Enhanced Safety of Vehicles Conference (ESV)
1998;Windosr.
Mackay G, Ashton S, Galer M, Thomas P. The methodology of in-depth studies of car crashes in Britain . SAE
Technical Paper. 1985; 850556.
Mertz H and Dalmotas D. Effects of shoulder belt limit forces on adult thoracic protection in frontal collisions.
Stapp car crash journal 51 (2007): 361-380.
Morris A, Welsh R, Hassan A. Requirements for the Crash Protection of Older Vehicle Passengers. Annual
Proceedings / Association for the Advancement of Automotive Medicine. 2003;47:165-180.
Nakahira Y, Furukawa K, Niimi H, Ishihara T, Miki K, Matsuoka F. A combined evaluation method and a
modified maximum likelihood method for injury risk curves. In Proceedings of the International Research
Council on the Biomechanics of Injury conference. 2000; pp. 20-22
16
National Highway Traffic Safety Administration (NHTSA). Consumer Information; New Car Assessment
Programme (NCAP). Washington, DC: National Highway Traffic Safety Administration, US Department
of Transportation; 2008.Docket No. NHTSA-2006-26555
Richards D, Edwards M, Cookson R. Technical assistance and economic analysis in the field of legislation
pertinent to the issue of automotive safety: provision of information and services on. Final Rep.2010.
CPR815 ENTR/05/17.01,
TNO. MADYMO Applications manual version 7.4. 1.Delft, Netherlands; 2013.
Viano D. Evaluation of biomechanical response and potential injury from thoracic impact. Symposium on
Biodynamic Models and their Applications, Aviation, space, and environmental medicine.1977; 49,
Number 1, Section II, January 1978.
Wang C, Zhou Q. Concept study of adaptive seatbelt load limiter using magnetorheological fluid. The 21st
International Technical Conference on the Enhanced Safety of Vehicles Conference (ESV). 2009.
Welsh R, Morris A, Hassan A, Charlton J. Crash characteristics and injury outcomes for older passenger car
occupants. Transportation research part F: traffic psychology and behaviour. 2006;9:322–334.
World Health Organization. WHO global status report on road safety 2013: supporting a decade of action.
World Health Organization. 2013.
17
Figures and Tables
Figure 1 Head and chest to steering wheel minimum distance for driver simulations
Table 1 Driver model 2 and 4 kN simulation results
Injury Predictions Low FRB Low ODB Mid EuroNCAP USNCAP
2 kN 4 kN 2 kN 4 kN 2 kN 4 kN 2 kN 4 kN 2 kN 4 kN
Head peak Acc. (g) 44.3 47.7 39.2 42.2 51.0 58.5 59.7 60.5 80.8 85.1
HIC15 97 137 104 130 238 291 343 372 713 781
Neck Extn. (Nm) 8.1 8.8 8.8 7.2 19.7 7.8 27.6 11.8 12.6 14.8
Nij 0.19 0.2 0.18 0.18 0.23 0.27 0.28 0.27 0.36 0.26
Chest Peak Acc. (g) 20.3 22.9 19.3 19.7 35.2 34.7 42.2 40.9 51.6 50.5
Chest Comp. (mm) 22.9 28.4 23.1 29.5 26.1 34.2 28.3 35.8 28.0 35.2
Femur force (kN) 1.7 0.7 1.0 0.4 2.2 2.1 2.3 2.2 2.9 2.6
Pjoint (%) 7.6 8.7 7.5 8.9 9.2 13.0 11.4 15.0 21.7 25.3
Table 2 Passenger model 2 and 4 kN simulation results
Injury Predictions Low FRB Low ODB Mid EuroNCAP USNCAP
2 kN 4 kN 2 kN 4 kN 2 kN 4 kN 2 kN 4 kN 2 kN 4 kN
Head peak Acc. (g) 26.6 28.0 18.7 23.9 46.8 44.4 55.9 53.0 91.0 91.3
HIC15 41 35 18 38 170 180 255 375 704 844
Neck Extn. (Nm) 8.1 8.3 6.9 7.1 7.1 7.2 7.5 7.7 12.3 15.2
Nij 0.19 0.16 0.15 0.19 0.24 0.25 0.26 0.28 0.28 0.35
Chest Peak Acc. (g) 20.0 22.3 16.7 18.4 32.3 32.5 40.0 38.7 48.5 48.3
Chest Comp. (mm) 21.5 25.8 19.0 29.2 23.8 30.9 25.6 32.8 28.5 37.2
Femur force (kN) 1.7 0.9 0.5 0.3 2.0 1.3 2.1 1.7 3.1 2.9
Pjoint (%) 7.3 7.7 6.3 8.8 8.4 10.4 9.5 13.3 20.8 29.5
18
Table 3 Estimated chest injury risk of baseline and best SBL models
Seating
Position
Crash
Scenario
Best SBL Baseline AIS 2+ risk
[Rbase] (%)
Best AIS 2+ risk
[Rbest] (%)
SBL
(kN)
CC
(mm)
Young Mid Old Young Mid Old
Driver Low FRB 2 22.9 8.7 22.9 47.9 4.1 11.8 29.4
Low ODB 2 23.1 10.0 25.6 51.6 4.3 12.1 30.0
Mid 3 30.0 16.9 38.6 66.1 10.6 26.9 53.3
EuroNCAP 4 35.8 20.2 43.9 70.8 20.2 43.9 70.8
USNCAP 4 35.2 18.6 41.5 68.8 18.6 41.5 68.8
FSP Low FRB 2 21.5 6.2 17.1 39.0 3.4 9.7 25.0
Low ODB 2 19.0 9.6 24.8 50.6 2.3 6.7 18.2
Mid 3 26.8 11.8 29.3 56.2 7.1 19.2 42.4
EuroNCAP 3 28.3 14.5 34.5 62.1 8.6 22.6 47.5
USNCAP 4 37.2 22.6 47.4 73.7 22.6 47.4 73.7
Table 4 Accident sample categorisation details of AIS 2+ seat belt chest injured occupants
Simulated scenarios Real Crashes Matched
sample (N)
26 km/h 100% ETS ≤ 40 km/h full overlap 155
40 km/h 40% ETS ≤ 45 km/h offset 116
56 km/h 40% ETS 46 - 60 km/h offset 2
64 km/h 40% 61 - 70 km/h offset 0
56 km/h 100% 41 - 70 km/h full overlap 25
No simulation Unmatched crashes 79
Total 377
19
Table 5 Estimated injury risk of smart restraint system (95% CI)
Age
group
Total No. of
Occupants
(A1)
AIS 2+ seat
belt chest
injured
(A2)
Actual risk
(A2/A1)
(%)
Estimated No. of
AIS 2+ seat belt
chest injured
(A3)
Estimated risk
(A3/A1)
(%)
Young 4108 52 1.3
(0.9 -1.6)
37 0.9
(0.6 – 1.2)
Mid 2713 206 7.6
(6.6 – 8.6)
132 4.9
(4.0 – 5.7)
Old 908 119 13.1
(10.9 – 15.3)
74 8.1
(6.3 – 9.9)
Total 7729 377 4.9
(4.4 – 5.4)
243 3.1
(2.7- 3.5)
20
APPENDIX 1:
Figure A 1Baseline driver (left) and front passenger (right) simulation models
21
APPENDIX 2:
Table A 1Attributes of the selected real world car sample from the NHTSA frontal crash test reports
S.No.
Make
and
Model
Year Vehicle
type
Steering
Wheel
Angle
(deg)
Steering
Column
Angle
(deg)
Head to
Windshield
(mm)
Nose
to
Rim
(mm)
Chest to
Steering
Hub
(mm)
Rim to
Abdomen
(mm)
Pelvic
Angle
(mm)
1 Hyundai
Accent 2010
3 door
Hatchback 65.7 24.3 570 451 335 201 23.4
2 Chevrolet
Volt 2011
5 door
Hatchback 68.5 21.5 803 426 347 239 24.7
3 Ford
Focus 2012
5 door
Hatchback 67.5 22.5 775 401 349 209 24.1
4 Nissan
Leaf 2013
5 door
Hatchback 64 26 653 388 292 168 20.3
5 Honda
Insight 2010
4 door
hatchback 71.3 18.7 738 356 287 197 23.5
Table A 2 Comparison of baseline model attributes with the real world sample.
Measurement Description Units Baseline Real World Sample
25th percentile Mean 75th percentile
Steering Wheel Angle deg 67.4 63.9 67.4 70.8
Steering Column Angle deg 22.7 19.1 22.6 26
Head to Windshield Distance mm 575 589 707 826
Nose to Rim Distance mm 415 359 404 449
Chest to Steering Hub Distance mm 320 294 322 332
Rim to Abdomen Distance mm 206 171 202.8 234
Pelvic Angle deg 22.9 21.1 23.2 25.3
22
APPENDIX 3:
Driver head Passenger head
Driver chest Passenger chest
Driver pelvis Passenger pelvis
Figure A2 Comparison of predicted head, chest and pelvis acceleration for current baseline study
compared to Prism reference models with EuroNCAP impact pulse
23
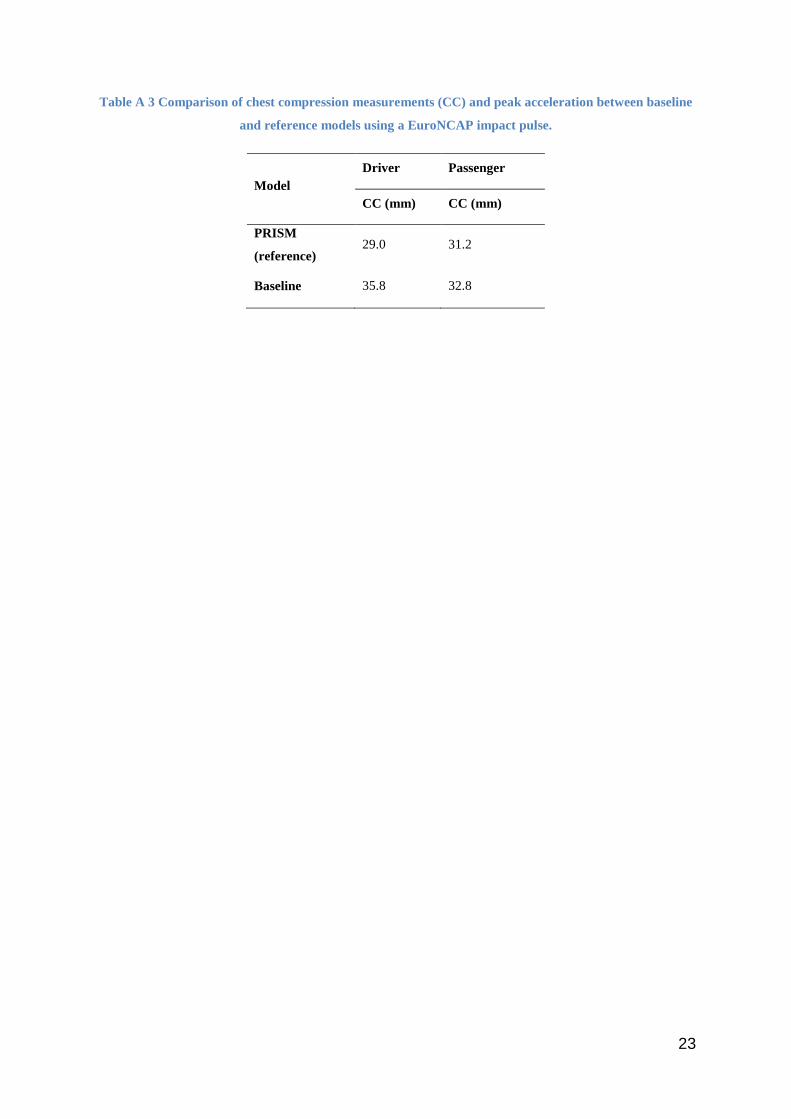
Table A 3 Comparison of chest compression measurements (CC) and peak acceleration between baseline
and reference models using a EuroNCAP impact pulse.
Model Driver Passenger
CC (mm) CC (mm)
PRISM
(reference) 29.0 31.2
Baseline 35.8 32.8
24
APPENDIX 4:
Figure A 3 Comparison of predicted accident injury rate (AccIR) from estimated injury risk function and
actual accident injury rate from field data
25
APPENDIX 5:
Table A 4 Predicted AIS 2+ chest injury risk versus AIS 2+ belt related chest injury risk for belted
drivers in real frontal crashes
Simulated Impact
types (speed and
overlap)
2+ risk chest
deflection
2+ risk accident
data
Real crash impact type
(speed range and overlap)
(N)*
26 km/h 100% 11% 6% 20 - 30 km/h >70%
(1156)
40 km/h 40% 13% 8% 35 - 45 km/h <60%
(380)
56 km/h 40% 21% 12% 51 - 60 km/h <60%
(20)
64 km/h 40% 26% 0% 61 - 70 km/h <60%
(3)
56 km/h 100% 24% 20% 51 - 61 km/h >70%
(46)
N* indicates the total number of cases in each real crash configuration

26
APPENDIX 6:
a) Low FRB b) Low ODB
c) Mid d) EuroNCAP
e) USNCAP
Figure A 4 Retractor belt force of 50th Hybrid III driver
27
APPENDIX 7:
a) Low FRB b) Low ODB
c) Mid d) EuroNCAP
f) USNCAP
Figure A 5 Retractor belt force of 50th Hybrid III front passenger
28
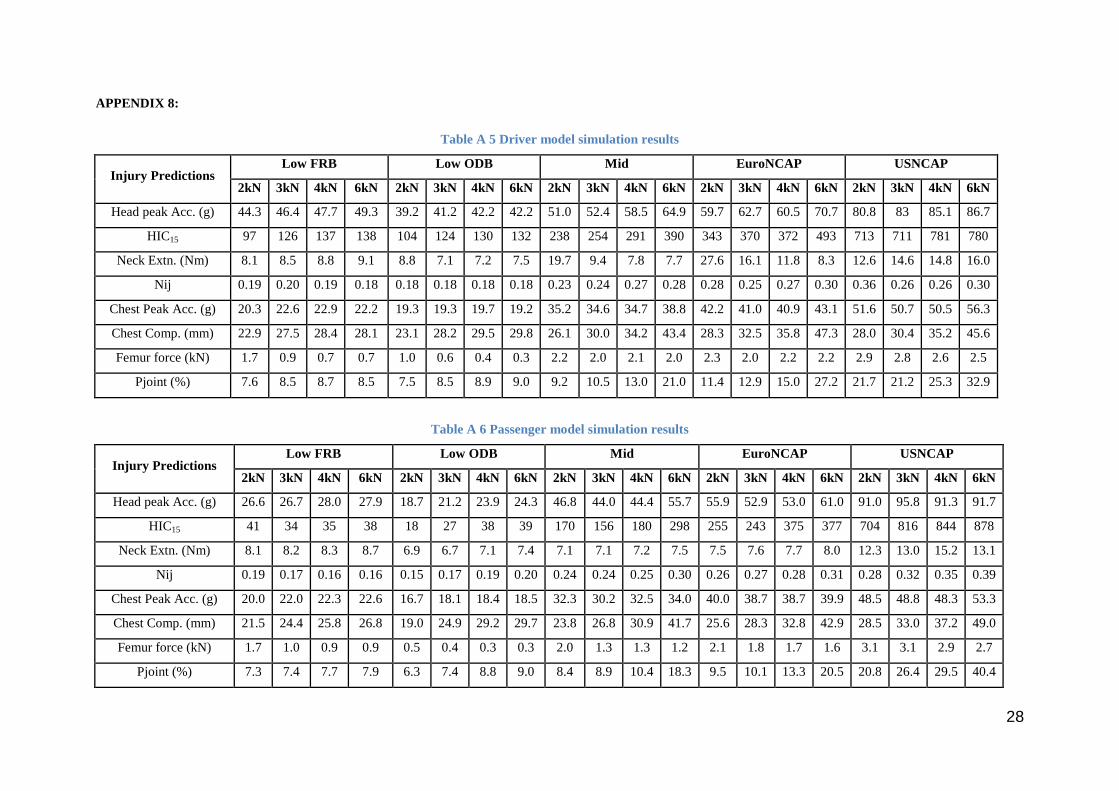
APPENDIX 8:
Table A 5 Driver model simulation results
Injury Predictions Low FRB Low ODB Mid EuroNCAP USNCAP
2kN 3kN 4kN 6kN 2kN 3kN 4kN 6kN 2kN 3kN 4kN 6kN 2kN 3kN 4kN 6kN 2kN 3kN 4kN 6kN
Head peak Acc. (g) 44.3 46.4 47.7 49.3 39.2 41.2 42.2 42.2 51.0 52.4 58.5 64.9 59.7 62.7 60.5 70.7 80.8 83 85.1 86.7
HIC15 97 126 137 138 104 124 130 132 238 254 291 390 343 370 372 493 713 711 781 780
Neck Extn. (Nm) 8.1 8.5 8.8 9.1 8.8 7.1 7.2 7.5 19.7 9.4 7.8 7.7 27.6 16.1 11.8 8.3 12.6 14.6 14.8 16.0
Nij 0.19 0.20 0.19 0.18 0.18 0.18 0.18 0.18 0.23 0.24 0.27 0.28 0.28 0.25 0.27 0.30 0.36 0.26 0.26 0.30
Chest Peak Acc. (g) 20.3 22.6 22.9 22.2 19.3 19.3 19.7 19.2 35.2 34.6 34.7 38.8 42.2 41.0 40.9 43.1 51.6 50.7 50.5 56.3
Chest Comp. (mm) 22.9 27.5 28.4 28.1 23.1 28.2 29.5 29.8 26.1 30.0 34.2 43.4 28.3 32.5 35.8 47.3 28.0 30.4 35.2 45.6
Femur force (kN) 1.7 0.9 0.7 0.7 1.0 0.6 0.4 0.3 2.2 2.0 2.1 2.0 2.3 2.0 2.2 2.2 2.9 2.8 2.6 2.5
Pjoint (%) 7.6 8.5 8.7 8.5 7.5 8.5 8.9 9.0 9.2 10.5 13.0 21.0 11.4 12.9 15.0 27.2 21.7 21.2 25.3 32.9
Table A 6 Passenger model simulation results
Injury Predictions Low FRB Low ODB Mid EuroNCAP USNCAP
2kN 3kN 4kN 6kN 2kN 3kN 4kN 6kN 2kN 3kN 4kN 6kN 2kN 3kN 4kN 6kN 2kN 3kN 4kN 6kN
Head peak Acc. (g) 26.6 26.7 28.0 27.9 18.7 21.2 23.9 24.3 46.8 44.0 44.4 55.7 55.9 52.9 53.0 61.0 91.0 95.8 91.3 91.7
HIC15 41 34 35 38 18 27 38 39 170 156 180 298 255 243 375 377 704 816 844 878
Neck Extn. (Nm) 8.1 8.2 8.3 8.7 6.9 6.7 7.1 7.4 7.1 7.1 7.2 7.5 7.5 7.6 7.7 8.0 12.3 13.0 15.2 13.1
Nij 0.19 0.17 0.16 0.16 0.15 0.17 0.19 0.20 0.24 0.24 0.25 0.30 0.26 0.27 0.28 0.31 0.28 0.32 0.35 0.39
Chest Peak Acc. (g) 20.0 22.0 22.3 22.6 16.7 18.1 18.4 18.5 32.3 30.2 32.5 34.0 40.0 38.7 38.7 39.9 48.5 48.8 48.3 53.3
Chest Comp. (mm) 21.5 24.4 25.8 26.8 19.0 24.9 29.2 29.7 23.8 26.8 30.9 41.7 25.6 28.3 32.8 42.9 28.5 33.0 37.2 49.0
Femur force (kN) 1.7 1.0 0.9 0.9 0.5 0.4 0.3 0.3 2.0 1.3 1.3 1.2 2.1 1.8 1.7 1.6 3.1 3.1 2.9 2.7
Pjoint (%) 7.3 7.4 7.7 7.9 6.3 7.4 8.8 9.0 8.4 8.9 10.4 18.3 9.5 10.1 13.3 20.5 20.8 26.4 29.5 40.4

29