improving the investment - asian development bank the investment climate in indonesia joint asian...
TRANSCRIPT


Improving the InvestmentClimate in Indonesia
Joint Asian Development Bank—World Bank ReportMay 2005
INO Report for Booklet JA sugg Text.pmd 19/05/2005, 11:38 AM1

Improving the Investment Climate in Indonesia
© Asian Development Bank 2005
First published 2005
All rights reserved. No part of this publication may be reproduced,stored in a retrieval system, or transmitted, in any form or by any means,without the prior permission in writing of the Asian Development Bank.
This book was prepared by the staff of the Asian Development Bank,and the analyses and assessments contained herein do not necessarily
reflect the views of the Board of Directors or the governments that theyrepresent. The Asian Development Bank does not guarantee the accuracy
of the data included in this publication and accepts no responsibility whatsoeverfor any consequence for their use. The term “country” does not imply any judgementby the Asian Development Bank as to the legal or other status of any territorial entity.
British Library Cataloguing in Publication Dataavailable
Library of Congress Cataloguing-in Publication Dataavailable
Published by the Asian Development Bank
INO Report for Booklet JA sugg Text.pmd 19/05/2005, 11:38 AM2

Foreword
This report reviews Indonesia's investment climate and productivity based on the resultsof the Investment Climate and Productivity Study (ICS) in 2003. The ICS was carriedout through a survey of 713 firms in 11 regions and in 10 subsectors of manufacturing.The survey was conducted by the Asian Development Bank (ADB) and the World Bank,in collaboration with the Coordinating Ministry for Economic Affairs (CMEA) and theIndonesian Central Board of Statistics (BPS).
The study is very timely, since the Indonesian Government is now improving its strategyto promote and facilitate private sector investment and development, as evidenced bythe recent investment policy reform initiatives. Improving the investment climate inIndonesia is now part of the Government's main agenda alongside issues such aseradication of corruption, job creation, and welfare improvement.
The study aims to highlight the main concerns, with regard to the investment climate,which affect firm performance and productivity. It is hoped that the findings willcontribute toward better informed and improved policies necessary to meet Indonesia'scurrent challenge of achieving higher and more sustained economic growth that requiresa stronger financial sector and more broad-based private sector development. Thehigher growth is necessary to accommodate the increasing number of new entrants tothe labor market, to increase per capita income, and more importantly, to reduce poverty.The gradual recovery to 4–5% growth in recent years was driven mostly by consumption,but this was not enough to meet the twin challenges of increasing employment andreducing poverty. There is clearly a lack of investment that must be addressed throughimproving the investment climate, such that investments can be brought back toprecrisis levels and the current Government's economic growth target of 7–8% a yearcan be achieved.
This report not only includes results from firm-level perspectives, but also from cross-country comparisons to benchmark the Indonesian position against other selectedcountries in the region. This international perspective is possible due to the corequestionnaire in the survey, which is comparable across countries. Specific issues arealso included in the study to shed light on important topics, such as decentralization andlabor market conditions in Indonesia. Early results of the study were distributed atmeetings in Jakarta of the Consultative Group on Indonesia (CGI), an institution formedby Indonesia's development partners, in June 2004, and of the Investment ClimateWorking Group formed by CGI in September 2004.
The study was financed by an ADB's Small-Scale Technical Assistance Project forImproving the Climate for Investment and Productivity in Indonesia (SSTA 3999-INO).The implementation of the overall study was under the direction of Yun-Hwan Kim,Assistant Chief Economist, Development Indicators and Policy Research Division(ERDI) of ADB. Ernesto Pernia, a former Lead Economist of ADB, led the initial partof the study. Abuzar Asra of ADB was in charge of the ICS and early analysis of the
iii
INO Report for Booklet JA sugg Text.pmd 19/05/2005, 11:38 AM3

Improving the Investment Climate in Indonesiaiv
results, while Aleli Rosario helped administer the project. Giuseppe Iarossi of the WorldBank and Abuzar Asra, together with BPS, developed the questionnaires and surveymanuals and held training for the interviewers and supervisors. Dalisay Maligalig ofADB developed the sampling design and drew the samples. Giuseppe Iarossi helpedclean up the data.
The final analysis was carried out by Guntur Sugiyarto of ADB and Mona Haddad ofthe World Bank, with the assistance of Gemma Estrada and Sjamsu Rahardja.Subsequently, they produced this final report. Valuable comments were provided byYun-Hwan Kim, Abuzar Asra, Ayumi Konishi, David Green, Ramesh Subramanian,and Rana Hasan. This report also benefited from comments received in several internalworkshops conducted in ADB in February and August 2004, as well as a consultationworkshop held in Jakarta in March 2004. Rhommell Rico did the design, layout, andtypesetting of the book.
Ifzal AliChief Economist
INO Report for Booklet JA sugg Text.pmd 19/05/2005, 11:38 AM4

v
Table of Contents
Highlights ............................................................................................................ 1
I. Introduction .................................................................................... 7
II. An Overview of Government Initiatives to Improve the
Investment Climate ........................................................................ 8
III. Firm-Level Perspective: What are the Main Concerns? ................ 13
IV. International Comparison: Where Does Indonesia Stand? ............ 33
V. Conclusions and Policy Implications ............................................ 45
References ........................................................................................................ 47
List of Tables
Table 1: Annual Growth Rates of GDP Per Capita and
Gross Capital Formation (%) ......................................................... 7
Table 2: Percent of Firms Rating Business Obstacles as
Moderate to Very Severe ............................................................... 15
Table 3: Changes Since Decentralization (beginning January 2001) .......... 28
Table 4: Investment Climate Index by Location and by Obstacle ............... 33
Table 5: Constraints to Stability in Indonesia—An International
Perspective (%) .............................................................................. 34
Table 6: Governance Indicator Scores, 2002 ............................................... 35
Table 7: Governance Indicator Scores Over Time—Indonesia ................... 35
Table 8: Regulatory Burden and Administrative Delays—An
International Perspective ............................................................... 38
Table 9: Constraints to Business Operation in Indonesia—An
International Perspective (%) ........................................................ 38
Table 10: Corruption Perceptions Index ........................................................ 39
Table 11: Constraints to Infrastructure in Indonesia—An International
Perspective (%) .............................................................................. 40
Table 12: Infrastructure Performance Indicators in Indonesia—An
International Perspective ............................................................... 40
Table 13: Tax and Customs Constraints in Indonesia—An International
Perspective (%) .............................................................................. 42
Table 14: Labor and Training—An International Perspective (%) ............... 43
INO Report for Booklet JA sugg Text.pmd 19/05/2005, 11:38 AM5

Improving the Investment Climate in Indonesiavi
List of Figures
Figure 1: Low Investment Growth and Rising Unemployment Rates ...... 7
Figure 2: Mean Business Obstacle .............................................................. 14
Figure 3: Delays in Electricity, Telephone, and Water Connections,
by Sector (days) ............................................................................ 17
Figure 4: Percent of Firms with Unionized Workers and Percent of
Union Members, by Sector .......................................................... 22
Figure 5: Average Number of Days to Clear Imports and Exports at
Customs, by Sector ....................................................................... 23
Figure 6: Average Number of Days to Clear Imports and Exports at
Customs, by Type of Client ......................................................... 24
Figure 7: Average Percent of Financing for Working Capital from
Commercial Banks, by Sector ..................................................... 25
Figure 8: Informal Payments to Local and National Governments as a
Share of Firm Sales, by Size and by Export Orientation (%) .. 26
Figure 9: Perceptions on Legal and Regulatory Uncertainty,
by Firm Size (%) .......................................................................... 27
Figure 10: Average Days Lost in Production Owing to Infrastructure
Bottlenecks, by Location (days) .................................................. 31
Figure 11: Median Waiting Time to Obtain Permits and Licenses,
by Location ................................................................................... 32
Figure 12: Constraints to Business—Higher in Indonesia than
in the PRC and the Philippines ................................................... 34
Figure 13: Indonesia vs Other ASEAN Countries—Ease of
Entry Indicators, 2003/04 (Value or Ranking
out of 102 Countries) ................................................................... 37
Figure 14: Indonesia vs Other Asian Developing Countries: Ease of
Entry Indicators, 2003/04 (Value or Ranking out of
102 Countries) ............................................................................... 37
Table 15: Constraints to Financing in Indonesia—An International
Perspective (%) .............................................................................. 44
Table 16: Sources of Finance for Firms—An International
Perspective (%) .............................................................................. 44
INO Report for Booklet JA sugg Text.pmd 19/05/2005, 11:38 AM6

vii
Figure 15: Extent of Bureaucratic Red Tape, 2003/04
(Ranking out of 102 Countries) .................................................. 38
Figure 16: Business Costs of Corruption and Irregular Payments in
Tax Collection, 2003 (Ranking out of 102 Countries) .............. 39
Figure 17: Fixed Line and Mobile Phone Subscribers, 2002
(per 1,000 people) ........................................................................ 41
Figure 18: Access to Computers and the Internet, 2002 ............................. 41
Figure 19: Hiring and Firing Practices, 2003/04
(Ranking out of 102 Countries) .................................................. 43
List of Boxes
Box 1: New Investment Policies Statement .............................................. 11
Box 2: Attracting Foreign Direct Investment to the Republic of Korea ... 12
Box 3: Best Practices for Promoting Private Sector Investment in
Infrastructure .................................................................................. 18
Box 4: Minimum Wages ........................................................................... 21
Box 5: One-Stop Service in Sragen—Positive Results from
Decentralization ............................................................................. 29
INO Report for Booklet JA sugg Text.pmd 19/05/2005, 11:38 AM7

Improving the Investment Climate in Indonesiaviii
INO Report for Booklet JA sugg Text.pmd 19/05/2005, 11:38 AM8

Highlights
A. Challenges Ahead
For decades, Indonesia enjoyed a period of high economic growth, fostered by a robustexpansion in manufacturing and fueled mostly by strong investment. The 1997–98financial crisis, however, brought out some inherent weaknesses in the domesticfinancial system and governance, damping investment and private sector development.Investment went into a sharp downturn, taking a heavy toll on the overall economy,especially as the political and other crises further contributed to the overall crisis. Thecurrent gradual recovery of 4–5% annual growth is not enough to significantly increaseper capita income, accommodate the increasing number of new entrants in the labormarket, and reduce poverty. The current investment level (at 16% of GDP) is still farfrom the required level to achieve economic growth of 5% and hence even too far toachieve the new Government’s targeted economic growth of 7–8% a year. Just to putit in perspective, total investment in Indonesia was around 30% of GDP in the 1990sbefore the crisis, when economic growth was around 7–8%.
It is therefore essential that Indonesia should attain a much higher rate of investment byimproving the investment climate. This is a daunting challenge, given that investorconfidence in the Indonesian economy is particularly low. The recent closures andexodus of foreign firms operating in Indonesia and their moving to the People’sRepublic of China (PRC) and Viet Nam send a strong signal about the depth ofIndonesia’s investment climate deterioration.
B. Key Impediments to Investment
This Investment Climate Study (ICS) carried out in Indonesia in 2003 highlights someaspects of the investment climate that merit serious attention. Results from both firm-level assessments and cross-country comparisons emphasize the urgent need for animprovement in the overall investment climate. Results from firm-level assessmentsindicate that:
• Macroeconomic instability, economic and regulatory policy uncertainty, andcorruption are the most severe business obstacles.
• Access to formal financing is a major problem, particularly for medium firms.• Labor regulations are a serious concern, more so than labor skills. In particular,
hiring and lay-off procedures as well as minimum wages weigh heavily on firmoperations.
• The constraints are felt more by large firms, foreign firms, and exporters.• Across provinces, fundamental problems leading to low investment and productivity
persist but vary in scope and degree. Firms outside Jakarta, for instance, have todeal with more serious regulatory constraints, but experience less corruption thanthose in the capital.
• Moreover, decentralization implemented since January 2001 has led to greatereconomic and regulatory uncertainty and increased corruption.
INO Report for Booklet JA sugg Text.pmd 19/05/2005, 11:38 AM9

Improving the Investment Climate in Indonesia
Key findings from the cross-country comparisons indicate that:
• More firms in Indonesia are concerned over key investment climate than in othercountries in the region and the most severe constraints felt have to do with overalluncertainty.
• Key governance indicators are also weak, and starting up and closing a businesstake longer and are costlier in Indonesia.
• The tax rate in Indonesia is similar to those in other countries in the region, but taxadministration has become a source of concern.
• Financing costs and access have become more problematic, making bank financingless popular.
• Indonesia appears to have more restrictive labor regulations, especially withrespect to hiring and firing procedures and wage setting.
Macroeconomic Instability
About 69% of surveyed firms consider macroeconomic instability as a moderate to verysevere obstacle. Given the negative perceptions on the macroeconomic stability of thebusiness community, strong investment growth similar to the period prior to the Asianfinancial crisis era remains a serious challenge. Negative perceptions prevail despitesome gradual improvements in certain macroeconomic indicators. For example,Indonesia’s external debt substantially declined to 80% of gross national income (GNI)in 2003 from about 168% of GNI in 1998. Monetary authorities have also been able toreduce inflation markedly to only about 2% in 2003 and the rupiah–dollar exchange ratehas also been generally stable in recent years.
Policy Uncertainty
The hasty implementation ofdecentralization since January2001 generated greateruncertainty, thus worseningthe business climate. The ICSreveals that about 20–25% offirms reckon that constraintsrelating to labor regulationsand business licensing havebecome more serious. Evenmore striking is the fact thataround 40% of firms indicatethat problems related touncertainty in economicpolicy and regulations, as wellas corruption, have becomeworse.
2
0 10 20 30 40 50
BusinessLicensing
LaborRegulations
RegulatoryPolicy
Uncertainty
Corruption
DecentralizationMade the Investment Climate Worse
% of Firms Rating an Issue asHaving Deteriorated After Decentralization
Source: Investment Climate and Productivity Study, 2003.
INO Report for Booklet JA sugg Text.pmd 19/05/2005, 11:38 AM10

Uncertainty in the legal environmentremains, making potential investorswary. About 45% of firms surveyedin the ICS, do not believe that thecourt system in Indonesia practicesfairness or impartiality, and 40% haveno confidence that the judicial systemwill enforce their contractual andproperty rights. Further, close to 60%of firms do not agree that governmentofficials’ interpretation of regulationsaffecting their businesses is consistentand predictable. These uncertaintiesdeter potential investors for theyincrease the risk and cost ofconducting business in Indonesia.
Corruption
Corruption is one of the greatest obstacles to economic and social development, ascorruption undermines development by distorting the rule of law and weakening theinstitutional foundation on which economic growth depends. Corruption also stiflesprivate sector growth and hurts the poor because it diverts public services from thosewho need them most. Corruption adversely affects various aspects of business operationfrom start-up to regular business transactions. Despite public sector reforms in recentyears, corruption remains a severe obstacle for business. Among the firms surveyed inthe ICS, 38% consider corruption as a major or very severe constraint. Corruption at thenational level amounts to 4.6% of total sales, while at the local level it is slightly higherat 4.8%.
The ICS reveals that informal payments to “get things done” as a share of revenue arelarger in Indonesia than in the PRC and the Philippines. In terms of the business costsof corruption, Indonesia’s ranking (46) is, among Association of Southeast AsianNations (ASEAN) member countries, worse than Malaysia and Thailand.
Labor
Labor regulations are a bigger issue among firms than labor skills. The ICS shows thatclose to one half of firms consider labor regulations to be moderate to very severeobstacles. Specific labor regulatory constraints have to do with lay-off procedures andretrenchment costs, limits on temporary hiring, and inflexible salary scales. A key issuealso troubling Indonesian firms is rising wages and the establishment of a minimumwage system. Indonesia is losing its competitiveness vis-à-vis other developing countriesin Asia due to its institutional problems and highly regulated labor sector. In hiring andfiring practices, for instance, the Global Competitiveness Report 2003–2004 givesIndonesia a ranking of 43, or less favorable than Thailand and Viet Nam. Indonesiaranks better than India and Sri Lanka, but worse than Bangladesh and the PRC.
3
% of Firms
0 20 40 60
Medium
Large
All
Not confident courts will uphold contracts and property rights
Courts are not fair or impartial
Over 40% have Negative Perceptionson the Judicial or Court System
Source: Investment Climate and Productivity
Study, 2003.
INO Report for Booklet JA sugg Text.pmd 19/05/2005, 11:38 AM11

Improving the Investment Climate in Indonesia
Financing
The ICS shows that the cost of financing, rather than access to it, is the greater constraint.High interest rates reflect a tight loan market, as it can also be seen from the ICS findingsthat bank financing for working capital is only 15%. Smaller firms tend to have moredifficulty in this respect, so that the Government should explore mechanisms to improvetheir creditworthiness. Small and medium enterprise (SME) access to financial servicesmay be enhanced through a well-functioning credit information system that lessenscredit risks and lowers borrowing costs.
Taxation
About 30% of Indonesian firms view tax rates as major or very severe constraints, a ratesimilar to the Philippines. In addition, about 23% of firms in Indonesia regard taxadministration as a major issue, close to the figure for the PRC. In terms of customs andtrade regulations, only about 13% of Indonesian firms find them to be major or verysevere constraints, the lowest among selected Asian developing countries. This couldbe the result of trade liberalization policies adopted since the mid-1980s.
Infrastructure
Firms need smooth delivery of infrastructure services since power outages, transportfailures, and inadequate water (and other) supply lead to production losses. The effectsof declining infrastructure investments after the crisis are now being increasingly felt.Power outages, transport failures, and inadequate water supply are currently experiencedin most regions, stalling business operations. Power outages create production lossesamong the firms surveyed, amounting to around 4% of total sales. The power interruptionshave also prompted firms to rely on private generators, supplying more than one thirdof the energy requirements in some regions. Starting a business in Indonesia is alsoconstrained by delays in acquiring telephone and electricity connections.
Indonesia has yet to gainfully advance in information and communications technologies(ICT) to access information, speed up communications, and broaden markets. This is incontrast with other ASEAN member countries, which have increasingly been maximizingtheir use of ICT. The ICS reveals that only around one half of firms in Indonesia useeither email or a web site regularly in their communications.
C. Policy Implications
The ICS results above bring forth three main areas of policy concerns, namelyinstitutional reform, better infrastructure, and incentives.
First, Indonesia needs to undertake urgently comprehensive institutional reform in thekey areas. Institutional problems that create uncertainty, unnecessary red tape, andbureaucratic burdens hinder the process of setting up and running a business inIndonesia. The institutional problems also send alarming signals to potential investors,further reinforcing the need for institutional reforms. The new Government needs to
4
INO Report for Booklet JA sugg Text.pmd 19/05/2005, 11:38 AM12

provide assurance on the enforcement of contracts and property rights and to upholdpolicy credibility and consistency. In particular, the Government should ensure theproper working of judicial and legal system, such that firms do believe and haveconfidence that the court system practices fairness or impartiality and that the judicialsystem will enforce business contracts and property rights. This should be in line withthe Government’s commitment to the overall battle against corruption.
The current efforts of establishing a “one-stop” investment service and improving theexisting investment law are positive developments that should be followed by morecomprehensive policies such as streamlining the local and central governments’ rolesin investment procedures.
The experience of decentralization indicates that some local governments are ill-equipped to assume their new and expanded role. Consequently, there is a need toimprove the capacity of local governments and to introduce better and more efficientarrangements of investment-related regulations between local and central governments,including investment licensing and start-up regulations. A better budget allocationbetween local and central governments is also necessary to ensure that local governmentshave sufficient resources to undertake their new responsibilities and to stop resortingto nuisance taxes and retributions.
5
0 10 20 30 40 50 60 70
Average
West Java
Outer Java
DKI Jakarta
Central Javaand Yogyakarta
Banten
Bali and East Java
Electricity Telephone Water
Business Start-Up is Constrained by LongDelays in Infrastructure Connections
Mean Delays (Days) in Infrastructure Connections
Source: Investment Climate and Productivity Study, 2003.
INO Report for Booklet JA sugg Text.pmd 19/05/2005, 11:38 AM13

Improving the Investment Climate in Indonesia
On competition, the introduction of a competition commission (based on Anti-MonopolyLaw No. 5/1999) affirms the Government’s commitment toward promoting competition.To effectively carry out its mandate, commission is expected to work closely with thelegal system and should practice fairness, credibility, and transparency in enforcing thelaw.
Second, the availability of adequate physical infrastructure for setting up and runninga business on a daily basis is critical to attract new investments and to ensure thecontinuity of ongoing investment projects. Power outages, transport failures, andinadequate water supplies create production losses and force firms to rely on higher-priced private sources that reduce the capability of firms in Indonesia to competeglobally. The Government must solve current infrastructure bottlenecks to avert apotential crisis in the future, and examine areas where start-up connections to infrastructureservices are deficient. Indonesia also needs to make real strides in ICT to be able tocompete with its neighboring countries. The latest Telecommunications Law, No. 36/1999, has attracted more players to the telecommunications sector, while theGovernment’s Five-Year Action Plan for the Development and Implementation of ICTin Indonesia should provide a further boost to ICT growth.
The recent annulment of Electricity Law No. 20/2002 by the Constitutional Court, onthe grounds that the concepts of sector unbundling and competition were incompatiblewith the Constitution, has created a major uncertainty about the future direction ofreforms. While the Government has issued a new regulation (No. 3/2005) in responseto the Court’s decision and to encourage private sector participation, financing ofinfrastructure projects to meet the rising demand for electricity remains a tremendouschallenge. A revised electricity law, that takes into account the Constitutional Court’sconcerns, should therefore be actively pursued to encourage private sector investment,foster competition, and achieve better service delivery. With the Government’spronouncement of an Infrastructure Road Map during its 2005 Infrastructure Summit,the broad policy initiatives and sector–specific policy directions need to be followed byfirm implementation.
Lastly, Indonesia might have to consider a new package of policy incentives forinvestment. Countries strive for a bigger share in foreign direct investment (FDI) tocreate more employment, increase exports and tax revenue, and gain knowledge andproductivity spillover effects. Foreign investors are, however, mainly attracted by astrong investment climate in the host country, such as availability of infrastructure,skilled and productive labor, a flexible labor market, as well as open trade policies andpolitical and macroeconomic stability. In addition to strengthening the investmentclimate, the Government needs to provide incentives and to send positive signals inorder to win over both foreign and domestic investors’ confidence. The incentivesshould be made available on equal terms to both foreign and domestic investors. In thedecentralization era, however, there is a risk that competition in attracting FDI amonglocal governments may cause them to offer incentives that may well exceed the benefits.Accordingly, the incentive system should fit in a comprehensive framework thatadequately uses the country’s (or region’s) comparative advantage and maximizes itscompetitiveness.
6
INO Report for Booklet JA sugg Text.pmd 19/05/2005, 11:38 AM14

I. Introduction
Since the turmoil of the Asian financial crisis in 1997–98, Indonesia has achievedmacroeconomic stability but only weak investment. The gradual recovery of growth—to 4.9% in 2003—has been mostly consumption driven; the investment recovery is stilllagging. The country’s recent lowinvestment rates and its modestgrowth rates are insufficient tocreate enough job opportunitiesto absorb new entrants to the labormarket—about 2 million–2.5million a year. Unemploymentcontinues to increase, reaching9.5% in 2003 (Figure 1). WhileIndonesia continues to surprise inthe manner it is composing itselffollowing major shake-ups—theeconomic crisis, democratization,and decentralization—economicresurgence, as well as attaininghigh growth similar to the precrisisera, remains a real challenge, asthe country struggles to revive itsfinancial sector, reform itsbureaucracy, maintainmacroeconomic and politicalstability, and restore investor confidence. The implications of failing to achieve thisresurgence could be substantial—Indonesia may remain on a lower growth path thanbefore the crisis, unless it improves its investment climate and pushes its investmentlevels up (Table 1).
7
–35
–30
–25
–20
–15
–10
–5
0
5
10
15
20
1997 1998 1999 2000 2001 2002 2003
Unemployment rate
GDP growth rate
Investment growth rate
Source: Key Indicators 2004, ADB and World
Development Indicators Online, World Bank
Figure 1 Low Investment Growthand Rising Unemployment Rates
GDP per Capita Gross Capital Formation 1970–1979 1980–1989 1990–1996 1997–2002 1970–1979 1980–1989 1990–1996 1997–2002
ASEAN Indonesia 5.3 4.4 6.3 –0.6 18.6 10.0 9.3 –8.2 Malaysia 5.2 3.0 6.7 0.8 13.9 7.7 17.3 –1.4 Philippines 2.9 –0.4 0.5 1.3 9.7 1.0 5.2 2.5 Singapore 7.6 5.3 5.5 1.7 12.2 5.5 11.7 –3.0 Thailand 4.6 5.4 7.4 0.1 7.1 8.8 12.7 –7.3 Viet Nam — 2.1 5.8 5.2 — — 22.0 9.1
Other Asian Economies PRC 5.3 8.2 9.2 7.0 11.9 9.6 12.1 8.3 Hong Kong, China 6.7 5.9 3.0 1.8 13.1 5.1 9.0 0.6 India 0.6 3.7 3.7 3.5 4.2 5.9 6.4 6.6 Korea, Republic of 6.6 6.3 6.5 3.9 15.0 8.2 10.3 –0.5 Sri Lanka 2.4 3.0 4.1 2.6 14.9 2.1 5.7 3.5
Table 1 Annual Growth Rates ofGDP Per Capita and Gross Capital Formation (%)
Note: — = not available, ASEAN = Association of Southeast Asian Nations, GDP = gross
domestic product, PRC = People's Republic of China.
Sources: Asian Development Bank. Key Indicators (various years); World Bank. World Development
Indicators Online.
INO Report for Booklet JA sugg Text.pmd 19/05/2005, 11:38 AM15

Improving the Investment Climate in Indonesia
What is the “investment climate”? The investment climate is defined as “the policy,institutional, and behavioral environment, both present and expected, that influences thereturns and risks associated with investment” (Stern 2002). Three broad sets of factorsthat make up the investment climate include:
• macro fundamentals—including macroeconomic stability, economic openness,competitive markets, and social and political stability;
• governance and institutions—transparency and efficiency in regulation, taxation,and the legal system; a strong and well-functioning financial sector; labor marketflexibility; and a skilled labor force; and
• infrastructure—transportation (roads and ports), telecommunications, and powerand water supply.
This report reviews the investment climate in Indonesia and attempts to trace the effectson firms of various policy measures, many of which have been put in place in recentyears. To this end, data on perceptions and actual performance of business establishmentsobtained through a firm-level survey are analyzed. The survey is part of the InvestmentClimate and Productivity Study, which was conducted in 2003 by the Asian DevelopmentBank (ADB) and the World Bank, in collaboration with the Coordinating Ministry forEconomic Affairs (CMEA) and the Indonesian Central Board of Statistics (BPS).
The firm-level survey gathered information on the constraints faced by firms in doingbusiness. Such constraints relate to physical and financial infrastructure, business-government relations, labor issues, and other factors affecting firm-level productivity.The survey covered 713 firms in 11 regions of Indonesia and in 10 subsectors ofmanufacturing, namely food and beverages, tobacco, textiles, garments, leather andfootwear, wood, paper, chemicals and chemical products, electronics and electricalmachinery, and transport equipment. The subsectors were selected on the basis of theirimportance to the country’s value added for 1996–2000.
II. An Overview of GovernmentInitiatives to Improve the InvestmentClimate
The Government is fully aware of the need to step up investment. The well-knownproblems discouraging investors include legal and security qualms, compounded bycomplicated labor regulations and poor implementation of decentralization. This has ledto less certainty and legal protection for investors. Since the crisis, the Government hastaken steps in several areas to improve the investment climate, as discussed in thefollowing paragraphs.
Infrastructure. After the financial crisis, various laws have been introduced to supportinfrastructure development. One is in the area of telecommunications, where major
8
INO Report for Booklet JA sugg Text.pmd 19/05/2005, 11:38 AM16

reforms were implemented. In 1999, the Telecommunications Law No. 36/1999 waspassed, phasing out the exclusive rights of PT Indosat and Satelindo for internationalcalling services and PT Telkom for domestic long-distance and local fixed-line services.In addition, the Government divested portions of its stakes in PT Indosat and Satelindoand raised telephone rates to conform with market levels and encourage privateinvestment in telecommunications services (United States Trade Representative 2003).However, much remains to be done to expand telecommunications services in Indonesia,which has one of the lowest rates of fixed-line and mobile phone subscribers amongAsian developing countries (ADCs).
Other important laws were also enacted. In 2001, Oil and Gas Law No. 22 waspromulgated to introduce competition and market pricing in the sector. Enacted in 2004,Water Resources Law No. 7 regulates water usage for irrigation, industry, and households,and provides for the protection and sanitation of water resources. Another recentinitiative is Road Law No. 38/2004, which aims to improve management of roads byopening the toll road industry to the private sector. On electricity, the recent annulmentof Electricity Law No. 20/2002 by the Constitutional Court has prompted the Governmentto issue a new regulation (No. 3/2005) that allows private sector participation in the formof a partnership with the state-run electricity firm.
A recent government undertaking to accelerate infrastructure development was theInfrastructure Summit in January 2005. One of the highlights of this event was thepresentation of the Infrastructure Road Map, encompassing policy initiatives to encourageprivate sector participation and policy directions for the transportation, electricity,telecommunications, oil and gas, and water sectors, among others.
Competition. In 1999, the Anti-Monopoly Law No. 5/1999 was enacted to promotecompetition and enhance market efficiency by prohibiting monopolistic and unfairbusiness practices. Specifically, this law forbids firms from drawing up agreements tojointly control the production and marketing of goods, or to influence prices of particulargoods. Based on the law, a Supervisory Commission on Business Competition wascreated, which is tasked, among other things, to evaluate agreements and business actswith monopolistic tendencies. While tracking down businesses violating such regulationswould be difficult, this law in effect signaled the Government’s desire to promote a morecompetitive environment.
Corporate Governance. A major legislative measure to address deficiencies in corporategovernance was the amendment to Indonesia’s Bankruptcy Law in 1998. Despite suchimportant legislation, legal certainty on enforcement of contracts remains a major issue,along with differential treatment between domestic and foreign companies. The lack ofsupport from the justice system in terms of enforcing contracts has been causing seriousalarm in the national and international business community.
Corruption. Recognizing that poor governance contributes to a deteriorating investmentclimate, the Government has initiated major reforms in an attempt to enhance governance
9
INO Report for Booklet JA sugg Text.pmd 19/05/2005, 11:38 AM17

Improving the Investment Climate in Indonesia
and address widespread corruption in the public sector. Enacted in 1999, two lawsspecifically target corruption in the government bureaucracy. One is the CleanGovernment and Anti-Corruption, Collusion, and Nepotism Law, which advocatesgreater transparency in public officials’ asset holdings. The other is the Eradication ofCriminal Acts of Corruption Law, which identifies acts of corruption, provides the basisfor prosecution of corrupt practices, and mandates the establishment of an anticorruptioncommission. Such measures are expected to help stimulate investment by improvingprivate-public sector dealings and by eliminating indirect transaction costs arising fromcorrupt acts. So far, however, enforcement has been weak.
Decentralization. Decentralization was launched by the issuance of Law No. 22/1999on Regional Autonomy and Law No. 25/1999 on the Fiscal Balance between the CentralGovernment and the Regions. Decentralization has generated issues inimical to thebusiness sector, as local governments are free to impose new taxes and levies withincertain limits and approve investments in all areas except oil and gas. However, giventhe unclear division of authority between the provincial and district governments, fiscaldecentralization tends to impose duplicative levies. Licensing procedures have alsobecome complicated, costly, and time-consuming in the absence of common proceduresand standards among local governments. The issuance of conflicting license requirementshas generated confusion among investors and unnecessarily raised transaction costs(Akhtar 2003, Usman et al. 2002).
Decentralization progressed with the amendment of laws on Regional Autonomy byLaw No. 32/2004 and on Regional Fiscal Balance by Law No. 33/2004. Issues ofcentral-local fiscal relations are largely dealt with under the revised Law on RegionalFiscal Balance (Law No. 33/2004), adopted in September 2004 to replace the earlierLaw No. 25/1999. Under this law, local governments are financed through own sourcerevenues, shared revenues, transfers from the national government and borrowings.Parliament also amended the original Law on Regional Autonomy (Law No. 22/1999)in September 2004 (as Law No. 32/2004) to confer greater autonomy on the regionsthrough direct elections of heads of districts, and by expanding the list of functions tobe performed at local levels.
In addition to amendments to decentralization laws, in 2004 there were other economicpolicy developments in the fiscal front. Following the enactment of the State FinanceLaw (Law No. 17/2003) in March 2003, Parliament endorsed three other major laws:the State Treasury Law (Law No. 1/2004) in January, the State Audit Law (Law No. 15/2004) in June, and the Law on National Development Planning (Law No. 25/2004) inJuly. They provide an overall framework for all planning, budgeting, and administrativeaspects of public expenditure management, and guide intergovernmental fiscal relationsin Indonesia.
Indeed, while some progress has been made on governance, as well as on legal andjudicial reforms, more work needs to be done in these areas to revive investorconfidence. Continued uncertainty arising from decentralization, slow progress on
10
INO Report for Booklet JA sugg Text.pmd 19/05/2005, 11:38 AM18

anticorruption measures, lack of credibility of legal and judicial institutions, and poorlaw and order in various provinces—all remain major obstacles to improving theinvestment climate.
A highlight in investment promotion was the launching of “Investment Year” in 2003,extended until 2004. This initiative has stressed the importance of investment in pushingthe country onto a higher growth path. In line with “Investment Year,” the Governmenthas made policy commitments to facilitate private sector development, along with therequired investment reforms (Box 1). It has also launched an Investment Policy ReformInitiative. Given the need to enhance Indonesia’s international competitiveness, theGovernment is preparing a new investment law that will streamline all investment lawsand regulations. It is reviewing the draft investment law, which is aimed at increasingFDI in the country. A case from the Republic of Korea can provide a good example ofpolicy reforms designed to attract FDI (Box 2). Such a move is particularly welcomedand important given the lack of a coherent investment law. The existing multilayeredregulatory framework is among the common concerns of the business sector. Assimilarly advocated in Indonesia’s Investment Policy Statement in 2001, the newinvestment law is expected to provide equal treatment to domestic and foreign investors.
11
Box 1 New Investment Policies Statement
In line with “Investment Year 2003,” the Government has adopted policies for promoting and facilitating private
sector investment in Indonesia. It is fully committed to the policy objectives and will take the necessary steps
to ensure their effective implementation. In this context, the Government:
(i) Recognizes the importance of private sector investment to achieve sustainable economic growth,
employment creation, development of strategic national resources, transfer and implementation of
competitive technology and technical skills, export growth, and an improved balance of payments.
(ii) Appreciates the appropriateness of a legal framework as a prerequisite to promoting a stable,
predictable, and attractive business environment that will encourage and support private economic
activity.
(iii) Acknowledges the importance of providing key principles such as equal treatment of investors in
similar circumstances irrespective of nationality; protection against expropriation, confiscation, or
requisition of investments and unilateral alteration or termination of contracts; freedom to repatriate
foreign investment capital and net proceeds thereon; and access to impartial, quick, and effective
mechanisms for the resolution of commercial and other investment disputes.
(iv) Is aware of the importance of adopting the principles above as an international standard practice and
incorporating them into national legislation, including full recognition of a range of international
agreements such as the World Trade Organization Agreements, the Asia-Pacific Economic Cooperation
Non-Binding Investment Principles, and numerous bilateral investment agreements.
The Government therefore undertakes and resolves to reform the investment policies, legislation, and regulations
so as to create an enabling environment for private investment that is consistent with the above principles and
to be characterized by active promotion and facilitation of investment, transparent criteria for the admission and
establishment of investments, transparency of government procedures and administration, and minimized
restrictions, prohibitions, screening and licensing requirements.
Source: Investment Coordinating Board, Government of Indonesia,
available at: http://www.bkpm.go.id/en/investment.php?mode=baca&info_id=18.
INO Report for Booklet JA sugg Text.pmd 19/05/2005, 11:38 AM19

Improving the Investment Climate in Indonesia12
Box 2 Attracting Foreign Direct Investment to the Republic of Korea
Prior to 1998, a major obstacle to foreign direct investment (FDI) in the Republic of Korea was its complex set
of laws and regulations. One of the priorities of the Government after the Asian financial crisis was to improve
the investment climate by educating the relevant government officials involved in implementing investment
policies and regulations; steering restructuring efforts toward eliminating red tape; conforming to international
standards; and giving foreign investors more information on investment prospects, policies, and regulations. In
1998, the Government opened 98% of all sectors to foreign investment, keeping the remaining 2% closed for
reasons of national defense, culture, or to protect the livelihoods of small farmers.
The Government made further fundamental changes, making attracting FDI a top priority: in 2000, it developed
a four-point plan:
(i) using foreign investment to develop the industrial infrastructure;
(ii) aggressively improving the investment climate to boost the economy;
(iii) supporting local autonomy in attracting foreign investors and providing services to them; and
(iv) aggressive public relations campaigns to change public attitudes to foreign investment.
One of the key measures introduced to encourage FDI was the Foreign Investment Promotion Act, enacted in
September 1998 to make the foreign investment climate more attractive, especially by offering tax incentives,
lower rents on factory sites, simplified procedures, comprehensive support services, and job training. With this
law, local governments were allowed to offer their own tax reductions or exemptions and to have more say in
creating and running foreign investment zones. Administrative procedures were abolished or substantially
simplified and two new entities were
created, namely the Korea
Investment Service Center (KISC)
and the Office of the Investment
Ombudsman (OIO). KISC offers a
comprehensive one-stop service for
entry into the Korean market and its
experts on visas, property acquisition,
construction codes, etc., can answer
questions and guide investors
through the investment process.
KISC also helps with mergers and
acquisitions; joint ventures; legal,
accounting, and tax matters;
accommodation; schooling; health
care; feasibility studies; partner
search; and market research.
OIO was set up to tackle foreign
investors’ problems in running their
business, either concerning
investment or settlement. It was staffed by around 30 investment experts coming from both the private sector
and specialized government agencies, who are experts in various investment areas, including international
investment issues. These experts discuss and help solve problems individually.
OIO can also directly investigate complaints by foreign companies and ask for help from relevant administrative
bodies, which must come up with a solution within 7 days. If the solution requires a significant change in laws
or regulations, the issue is presented to those members of the Foreign Investment Committee who are also in
the cabinet. The results to 2000 were very impressive, as can be seen in the figure above.
Source: Based on Kim Wan-Soon. 2000. Foreign Direct
Investment in Korea: The Role of the
Ombudsman. ADB and OECD: Paris.
69.71
88.52
155.41 156.9
20
40
60
80
100
120
140
160
180
1997 1998 1999 2000
In US$B
FDI Approvals, 1997–2000,Republic of Korea
INO Report for Booklet JA sugg Text.pmd 19/05/2005, 11:38 AM20

13
The Government has produced a new economic policy package—better known as theWhite Paper—to steer the country after the ending of the International Monetary Fund(IMF) program.1 Its policies include:
(i) improvement of the basic strategy for investment and trade, introducing aone–stop policy for investors, and the creation of National Team forInvestment Promotion and Exports;
(ii) enhancement of legal certainty by revising the Bankruptcy Law andharmonization of regional rules and regulations with other national laws,review of the Investment Negative List, and a proposal for a new investmentlaw;
(iii) development and rehabilitation of public infrastructure such as electricity,transportation, telecommunications, and water resources for the businesscommunity; and
(iv) improvement of transparency in public services.
III. Firm-Level Perspective: What are theMain Concerns?
The 2003 firm-level survey under the ICS, conducted by ADB and the World Bank withCMEA and BPS, covered 713 firms in the 10 manufacturing subsectors with the highestcontribution to the country’s value added and distributed across 11 regions of thecountry. The general information obtained from firms during the survey included theirlegal status (state-owned, private limited liability, partnership, cooperative, etc.),ownership (government, private domestic, or foreign), presence of overseas operations,number of establishments, number of products, number of products introduced in thelast 3 years, if their machinery is less than 5 years old, and if they export or not. The ICSuses this information to categorize firms.
The survey targeted only medium and large firms.2 They were asked to provideinformation on the number of workers: firms with 20–99 permanent workers wereclassified as medium, and those with over 99 permanent workers as large.
A key section of the survey probes the perceptions of firms with regard to variousbusiness obstacles. There are 22 business obstacles or constraints used in the questionnairethat are standard across countries in which the ICS was conducted. Firms were asked torate each obstacle on a scale of 0 (no obstacle), 1 (minor obstacle), 2 (moderate obstacle),3 (major obstacle), and 4 (very severe obstacle).
1 The IMF package was signed at the height of the financial crisis in 1997 in support ofIndonesia’s macroeconomic stabilization and structural reform program. It ended in 2003.
2 While the survey planned to cover only medium and large firms, employment data from thesurvey show that 10 firms are small (with fewer than 10 workers). Analysis by employment size,therefore, excludes small firms.
INO Report for Booklet JA sugg Text.pmd 19/05/2005, 11:38 AM21
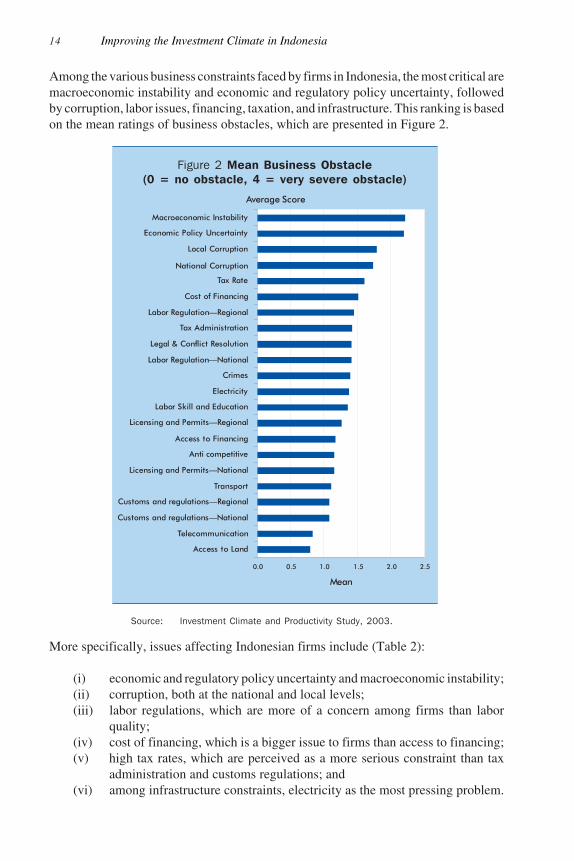
Improving the Investment Climate in Indonesia
Among the various business constraints faced by firms in Indonesia, the most critical aremacroeconomic instability and economic and regulatory policy uncertainty, followedby corruption, labor issues, financing, taxation, and infrastructure. This ranking is basedon the mean ratings of business obstacles, which are presented in Figure 2.
14
Average Score
0.0 0.5 1.0 1.5 2.0 2.5
Access to Land
Telecommunication
Customs and regulations—National
Customs and regulations—Regional
Transport
Licensing and Permits—National
Anti competitive
Access to Financing
Licensing and Permits—Regional
Labor Skill and Education
Electricity
Crimes
Labor Regulation—National
Legal & Conflict Resolution
Tax Administration
Labor Regulation—Regional
Cost of Financing
Tax Rate
National Corruption
Local Corruption
Economic Policy Uncertainty
Macroeconomic Instability
Mean
Figure 2 Mean Business Obstacle(0 = no obstacle, 4 = very severe obstacle)
Source: Investment Climate and Productivity Study, 2003.
More specifically, issues affecting Indonesian firms include (Table 2):
(i) economic and regulatory policy uncertainty and macroeconomic instability;(ii) corruption, both at the national and local levels;(iii) labor regulations, which are more of a concern among firms than labor
quality;(iv) cost of financing, which is a bigger issue to firms than access to financing;(v) high tax rates, which are perceived as a more serious constraint than tax
administration and customs regulations; and(vi) among infrastructure constraints, electricity as the most pressing problem.
INO Report for Booklet JA sugg Text.pmd 19/05/2005, 11:38 AM22

Variation in Perception of Obstacles by Type of Firm
Business obstacles are more pronounced among firms with a wider scale of operations,namely, among large firms, those with more than one establishment, and firms thatproduce two or more products. Large firms are more likely to feel the burden of businessobstacles than medium firms. Nearly 80% of large firms consider economic andregulatory policy uncertainty, and macroeconomic instability as moderate to verysevere obstacles, compared with nearly 60% of medium firms (Table 2). In several otheraspects of the investment climate, firms with two or more establishments tend to facemore constraints than those with only one establishment. There is a higher percentage
15
Investment Climate Factors
and Components Percent of Firms
Total Medium Large Exporter Non–exporter
Infrastructure
Telecommunication 22.0 17.7 26.2 26.0 18.1
Electricity 36.6 30.4 42.5 44.6 28.7
Transport 34.5 28.3 40.6 40.4 28.7
Access to Land 22.6 21.5 23.8 24.5 20.9
Taxation
Tax Rate 53.2 43.4 63.0 61.9 44.6
Tax Administration 47.6 38.4 56.9 57.6 37.6
Customs and Regulations—National 36.0 21.5 50.6 50.6 21.7
Customs and Regulations—Regional 36.6 25.1 47.5 49.2 24.2
Labor
Labor Regulation—National 45.4 35.1 55.5 54.5 36.5
Labor Regulation—Regional 46.6 37.8 55.5 55.7 37.6
Labor Skill and Education 43.9 33.9 53.3 51.1 36.8
Business Operation and Corruption
Licensing and Permits—National 36.9 30.1 43.7 43.5 30.4
Licensing and Permits—Regional 40.7 35.7 45.6 45.8 35.7
Anticompetitive 36.5 27.4 45.3 44.1 29.0
National Corruption 53.2 44.0 62.7 63.8 42.6
Local Corruption 54.4 46.3 62.2 63.0 46.0
Financing
Access to Financing 38.6 32.2 44.5 44.4 32.9
Cost of Financing 48.4 38.1 58.3 56.8 40.1
Stability
Economic Policy Uncertainty 69.1 59.0 79.0 78.0 60.5
Macroeconomic Instability 68.9 58.7 79.0 77.7 60.2
Crimes 41.0 31.3 49.7 48.9 33.2
Legal and Conflict Resolution 45.0 35.1 54.1 54.5 35.7
Table 2 Percent of Firms RatingBusiness Obstacles as Moderate to Very Severe
Source: Investment Climate and Productivity Study, 2003.
INO Report for Booklet JA sugg Text.pmd 19/05/2005, 11:38 AM23

Improving the Investment Climate in Indonesia
of firms among those with two or more product lines that experience business obstaclesthan those with only one product, especially in taxation issues, labor issues, economicand regulatory policy uncertainty, and macroeconomic stability. Even the more innovativefirms (i.e., those that have introduced new products in the last 3 years) are more likelyto face more obstacles.
It is not surprising that the deterioration in the investment climate is felt more stronglyby large firms, since they operate with a more structured setup that entails rigidcoordination with buyers, suppliers, and operating units or branches. Having moreestablishments in different areas further complicates business operations because thismeans resolving region–specific obstacles. Losses tend to be higher among large firmsor those with more complex operations when business is derailed by power outages,transport bottlenecks, labor strikes, or social unrest. For medium firms, the hierarchy ofbusiness constraints is similar to that observed for large firms; the five main concernsof medium firms are economic and regulatory policy uncertainty, macroeconomicinstability, corruption, tax rates, and cost of financing.
Obstacles are more in evidence among firms that deal in international markets. Ahigher percentage of exporters than non-exporters are more constrained by all types ofbusiness obstacles. In the same vein, firms with operations in other countries are likelyto face greater obstacles than those without such operations. On the basis of theexperience of this group of firms, as well as that of exporters, obstacles are moreapparent among those exposed to international standards and engaged in more competitiveenvironments than those operating purely in the domestic market. In addition, firms thatdeal in international markets also tend to have substantial operations, as 75% of firmswith overseas operations and nearly 80% of exporters are large firms.
Business obstacles are more serious for foreign than domestic firms. In terms ofownership, concerns on taxation, labor issues, economic and regulatory policy uncertainty,macroeconomic instability, and legal and conflict resolution obstacles are more seriousamong foreign firms than domestic firms. Problems of electricity and transport are alsofelt more strongly by foreign firms. Foreign firms are also mostly large and exposed tothe frequently high standards of their countries of origin. In general, a greater percentageof private firms faces business obstacles than government firms, especially in taxation,the legal system, and conflict resolution. Among private firms, limited liability companiesare beset by greater business constraints than the informal, usually smaller or lessorganized establishments.
Infrastructure
Infrastructure development received priority attention in Indonesia in the 1970s and1980s, with total infrastructure investments accounting for around 10% of GDP. In theimmediate aftermath of the 1997 financial crisis, the Government postponed plannedinfrastructure projects. The share of infrastructure spending fell from 7% of GDP in1996 to about 3% in 2002. There has been no recovery since then in public spending oninfrastructure, and private investments have not returned due to concerns over the
16
INO Report for Booklet JA sugg Text.pmd 19/05/2005, 11:38 AM24

unpredictable legal and regulatory environment. The government therefore has limitedcapacity to address the poor quality of infrastructure services and inadequate coverage.3
Other issues that confront the sector are the lack of fairness and transparency ininfrastructure policy and inconsistent regulatory framework.
Infrastructure was regarded as a less serious business constraint than other investmentclimate factors, such as economic stability, corruption, and labor regulations. Still, over60% of firms find infrastructure services at the national and local levels to be somewhatinefficient to very inefficient. Access to electricity is the most problematic, as about 37%of firms consider electricity as moderate to very severe obstacle; this is higher than thepercentages for telecommunications and transport.
Obtaining connections toelectricity, telephone, andwater is the first problem;ensuring steady and efficientservice is the next. Securingan electricity connection takesabout 15 days on average(with a median of 7); theelectronics industry has thelongest delays in electricityconnections, averaging 45days (Figure 3). For telephoneconnections, delays were anaverage of 27 days, with amedian of 7 days; the averagenumber of days is even longerfor firms in the wood industry(50 days). Non-exporters anddomestic firms are also moredisadvantaged than exportersand foreign-owned firms interms of waiting time fortelephone connections.
Delays in water connectionare less serious than telephone,averaging 13 days (with a median of 7 days). Large firms or those with moreestablishments are more likely to encounter longer delays in obtaining a water connection.
17
3 In the Infrastructure Summit held in January 2005, the Government estimated that about US$30billion are needed annually to reach the country’s growth target of 6–8%. Of this amount, theGovernment committed to spend about 20% while the rest has to be financed by the privatesector or through international financing sources.
0 10 20 30 40 50 60
Total
Wood
Transport
Tobacco
Textiles
Paper
Leather and Footwear
Garments
Food and Beverages
Electronics andElectrical Equipment
Chemicals
Days
Electricity Telephone Water
Figure 3 Delays in Electricity, Telephone,and Water Connections, by Sector (days)
Source: Investment Climate and Productivity Study, 2003.
INO Report for Booklet JA sugg Text.pmd 19/05/2005, 11:38 AM25

Improving the Investment Climate in Indonesia
After firms are finally connected to infrastructure services, they still face poor qualityand reliability, especially for power. Power outages lead to important losses—eitherdirectly through production losses or indirectly when firms pay higher prices to obtainprivate generators. The garments and chemical industries are the worst hit by poweroutages in terms of production losses. About 35–40% of electricity used in theelectronics, chemicals, textiles, and wood industries comes from private generators.Given the huge requirements for infrastructure development, among other things, it isimportant for the Government to promote a conducive legal and regulatory environmentfor private sector participation in infrastructure investments (Box 3).
18
Box 3 Best Practices for Promoting Private Sector Investment in Infrastructure
Private sector participation in infrastructure development is necessary to prevent shortages in capacity. The
effectiveness of such participation in Indonesia, however, has suffered from a lack of adequate regulatory
structures. Accordingly, the basic objectives of autonomy, accountability, transparency, and predictability have
been difficult to achieve. Without a well-developed legal and regulatory framework, private sector participation
increases the risk level and encourages rent-seeking activities.
Unbundling infrastructure—unbundling is an important technique to reduce natural monopoly and to promote
competition—into competitive and monopolistic components can significantly reduce the need for regulation.
The competitive components can be transferred to the private sector in a way that promotes competition, while
the monopolistic components can be assigned to the private sector once an effective regulatory framework has
been established. The decisions on which infrastructure components should be transferred to the private sector
are of a strategic nature, and depend not only on the characteristics of the sector and the market but also on
government objectives, which should primarily be consumer benefits. A government should also consider
additional objectives: reduction of the national debt, stimulation of domestic capital markets, reduction in capital
and operating subsidies to existing infrastructure facilities, investment in new infrastructure or rehabilitation of
existing infrastructure, improvements in the quality of service, an increased range of services, lower prices for
services, client-oriented operations, and more effective marketing. The pace and sequence of such transfer
depends on the size and complexity of the infrastructure sector, the rate of growth in demand and the
competitiveness of the market, options for unbundling by function or geography, the legal regime regarding
ownership of land and other critical assets, and the capacity for economic regulation. This shift to a new model
for infrastructure development—unbundling—does not mean a total retreat by governments; on the contrary, it
is a move to best practices, involving a shift to good governance and an enhancement of governments’ regulatory,
restructuring, and monitoring roles.
Best practices for private sector participation in key infrastructure sectors—namely, water supply, roads, ports,
and airports—highlight the importance of competition, transparent tendering, and effective regulation. Best
practices include the following:
• governments should concentrate on planning, restructuring, and regulation, while the private sector
should specialize in management, investment, construction, and financing;
• the transfer of responsibility to the private sector should be accomplished through deregulation and
open competition or well-established contractual arrangements;
• economic regulation should be transparent and predictable. It should accommodate the concerns of
the affected parties and be applied where there is insufficient competition;
• long-term domestic financing sources must be developed; and
• governments should build up capacity to negotiate and deal with the private sector, and let commercial
risks be assumed by the private sector.
Sources: Sean Sullivan. 2000. Best Practices for Promoting Private Sector Investment in
Infrastructure. ADB and OECD: Paris.
INO Report for Booklet JA sugg Text.pmd 19/05/2005, 11:38 AM26

Openness and Technology
The electronics and transport sectors are at the forefront of technological upgrading.FDI can contribute to technology enhancement in developing economies throughvarious mechanisms. FDI alone can stimulate competition, forcing local firms to searchfor more efficient technologies. Another important mechanism is through the linkagesbetween multinational corporations (MNCs) and their local suppliers. Some 14% ofsurveyed firms have some scope for technology transfer through direct linkages withMNCs. In terms of sectors, electronics and transport have the greatest opportunity fortechnology transfer, as about one third of the respondent electronics and transportcompanies serve as suppliers of intermediate inputs to MNCs. Other than direct equityinvestment, a major mechanism by which foreign technology is transferred to domesticfirms is through licensing agreements with foreign firms. Again, the electronics andtransport sectors are drawn toward foreign technology, as 40–50% of the firms surveyedin these sectors license technology from foreign companies.
Across sectors, the use of modern machinery and the drive toward innovation arestronger among firms that compete more forcefully in international markets. Inparticular, roughly one half of electronics firms use machinery that is less than 5 yearsold compared with less than 40% for firms in other sectors except tobacco. While 54%of firms in the textiles industry export, on average only 25% of their machinery is under5 years old; this may be due to a reassessment of the industry, as competition increasesfrom the PRC and others, and the ending of the Multifiber Arrangement by 2005. About67% of electronics firms introduced new products in the last 2 years, significantly morethan the paper and textiles industries, at 27% and 29%, respectively. The introductionof new technology is also weaker among firms in the food and beverages sector; less than30% firms in this sector and the paper sector are exporters.
There is a marked gap in access to modern technology between large and mediumfirms. About 28% of large firms use foreign technology compared with just 8% ofmedium firms. Also, only 8% of medium firms have been tapped by MNCs to serve astheir suppliers compared with 19% of large firms. In addition to less exposure to moderntechnology, the drive toward innovation is weaker among medium firms. In the last 2years, 21% of large firms applied for patents compared with only 10% of medium firms.The introduction of new products as well as the upgrading of existing products has alsooccurred more extensively among large firms. The use of modern machinery (i.e., lessthan 5 years old) is also more prevalent among large firms (41%) than medium firms(30%).
Even in the use of ICT, there is a significant disparity between large and medium firms.Overall, only about 13% of workers regularly use a computer in their work, but theproportion for large firms is about 18% while that for medium firms is 7%. Half of thefirms have regularly used email or web sites in their interaction with clients andsuppliers, but this splits down to 75% of large firms compared with only 24% of mediumfirms. Smaller firms are lagging behind in technology partly because the Government’s
19
INO Report for Booklet JA sugg Text.pmd 19/05/2005, 11:38 AM27

Improving the Investment Climate in Indonesia
strategy for technology development neglects small and medium enterprises (SMEs)(Hill and Wie 1998). The Government’s approach, especially in the past, has focusedon large-scale strategic industries. However, some progress has been made: since 1993,the Agency for the Assessment and Application of Technology (BPPT), Department ofCooperatives and Small Enterprises Development, and Department of Industry havebeen setting up technology and quality upgrading programs for SMEs.
Labor Issues
The ease of adopting advanced technology hinges partly on the inherent capacity of localfirms to absorb new technology. A high level of human capital enables local firms toadopt modern technology more easily.
Firms that are internationally integrated and exposed to modern technology hiremore educated workers and provide more extensive training. Overall, only about 36%of workers have more than 12 years of schooling. The proportion of workers at this levelranges from a high of 60% in the electronics sector, where 92% are exporters, to a lowof 25% in the paper industry, where only 29% are exporters. Moreover, nearly 60% oftransport firms and 80% of electronics firms provide either in-house or external training.In contrast, domestically oriented firms such as those in the paper and the food andbeverage sectors provide only limited training despite the relatively low level ofeducation of their workforce. But to produce high-quality and competitive products,even domestically oriented firms have to continuously upgrade the skills of theirworkers, or lose to heightened import competition.
Foreign firms offer much more training to staff than domestic firms. Trainingprovision by foreign firms to their local staff, who later on transfer to domesticcompanies or set up their own firms, is an important means of transferring technology.The ICS shows that about 43% of foreign firms provide in-house training, twice theproportion for domestic firms. Foreign firms are also more active in offering externaltraining4 to their workers, at 36% against 22% of domestic firms.
Labor regulations are a bigger issue among firms than labor skills. Specific laborregulatory constraints have to do with lay-off procedures and retrenchment costs, limitson temporary hiring, and inflexible salary scales. A key issue troubling Indonesian firmsis rising minimum wages (Box 4). While in the 1980s Indonesia maintained itscompetitiveness vis-à-vis its regional neighbors through relatively low unit labor costs,it began to lose this advantage in labor-intensive industries after the adoption of aminimum wage policy in the 1990s (Agrawal 1995).
Two new bills proposed to address industrial relations issues—Labor Protection andLabor Dispute Settlement—have met with strong resistance from both employers and
20
4 External training refers to formal training programs run by other organizations (e.g., university,government institute, private training school).
INO Report for Booklet JA sugg Text.pmd 19/05/2005, 11:38 AM28

21
Box 4 Minimum Wages
One of the major issues affecting Indonesian firms in recent years has been rising minimum wages. Minimum
wages significantly increased after the crisis such that in 2001, they were already above their peak precrisis levels
in 1997. In 2001, minimum wages in local currency terms increased by 46–49%, twice as fast as the increase
between 1999 and 2000 (Sudjana 2002, SMERU 2001). The national Government usually adjusts minimum
wages to reflect changes in labor productivity, employment, and gross domestic product (GDP) per capita.
Minimum wages used to be kept low to attract foreign investment, but this led to greater labor unrest, especially
before the crisis. In 1999, the minimum wage could meet only two-thirds of the basic expenditure needs of
households of four persons (Islam and Nazara 2000). Despite the low minimum wage, in 1998 nearly one third
of paid workers received incomes which were lower than the minimum wage. With the onset of decentralization
in January 2001, local governments were given authority to set minimum wages, creating apprehensions over
further increases in minimum wages, as regional governments may give in to a populist approach to wage setting
(SMERU 2001).
There are concerns that further large increases in minimum wages may reduce employment in the modern
industrial sector and harm prospects for long-term growth. In 1999–2002, real GDP growth in Indonesia averaged
4% annually, whereas labor productivity increased by only 3% a year. Clearly, Indonesia’s recent growth
performance is still way below what it achieved in the early to mid-1990s.
Substantial increases in minimum wages constrain business operations. However, noncompliance with minimum
wages can also be costly, especially if this leads to industrial strife and work stoppages. On balance therefore,
it is critical to weigh the merits of a minimum wage policy against its effects on employment. This is because firms
may react to substantial increases in minimum wages by lowering their production and therefore reducing their
demand for labor.
In a perfectly competitive world, a minimum wage has negative effects on employment, though in the real world
no definite conclusions can be drawn. A literature review by Saget (2001) concludes that for low levels of minimum
wage in selected developing countries, the theoretical effects on the employment level are marginal except when
the conditions of perfect competition are met. Empirical studies, on the other hand, reveal contrasting
conclusions as to the effects of minimum wages on employment.
In Indonesia, a study by Islam and Nazara (2000) found that after controlling for the level of GDP and location,
there is no evidence of a negative relationship between the ratio of the minimum wage to the average wage and
wage employment in Indonesia. They also found that, due to consultations between unions and business
organizations in the country, minimum wage increases did not have an adverse impact on employment between
1990 and 1998. But in a more recent steady of SMERU (2001) using a panel data set of 26 provinces for 1988
to 1999, increases in minimum wages were found to have a negative impact on urban, formal sector employment.
According to Saget (2001), when the likely adverse effects on employment are considered, the overall effect is
difficult to ascertain as theory leads to no clear predictions on the effect of minimum wage. While there are those
who may lose employment in the formal wage sector, some workers, especially in the highly productive sectors
covered by minimum wages, stand to gain. Some displaced workers become employed in the informal sector,
and the welfare effect depends on the difference in wages between the formal and informal sectors. It is possible
that rising minimum wages can widen the gap between workers in the formal and informal sectors, and worsen
relative poverty. Empirical evidence from some countries, however, appears to support a positive correlation
between the minimum wage and poverty reduction (Saget 2001). This is in line with the main purpose of the
Government’s minimum wage policies, i.e., to enhance the well-being of workers. In Indonesia, the substantial
increase in prices after the crisis forced the Government to increase minimum wages. Given a more democratic
setting and with decentralization in effect, there are fears that current efforts to increase minimum wages may
be driven more by political pressures.
Minimum wage-setting remains a relevant social policy in Indonesia to ensure that workers receive a decent level
of income. The main problem is how to set up the minimum wage without necessarily constraining employment
and growth.
Source: Compiled by Asian Development Bank staff.
INO Report for Booklet JA sugg Text.pmd 19/05/2005, 11:38 AM29

Improving the Investment Climate in Indonesia
labor unions. Protests from labor unions led the Government to propose regulations thatmake it difficult for firms to lay off workers, even those who have been involved in amajor violation of the firm’s policies or who have committed a crime.
Although inflexibility in hiring and firing could lead to an excessive workforce, theICS survey suggests that overstaffing is not yet a serious issue. Firms with moreworkers than they want are inclined to cut their workforce by only 6% on average,though firms with relatively extensive operations, such as large firms, exporters, andlimited liability companies, are more likely to want to cut their labor force by more than6%.
Textiles and garments account for the highest share of unionized members and thehighest share of strikes. Overall, about 81% of the workforce of firms with labor unions(with a median of 90%) are union members (Figure 4). The proportion of unionizedworkers is lowest in the electronics industry (55%) and highest in the textiles andgarments industries (88% and 86%, respectively).
There are reports that inrecent years, the growthof labor unions inIndonesia has led tomounting strikes. TheICS survey reveals thatstrikes occurred in about9% of firms in theprevious year. Abouthalf of the firms surveyedthat experienced strikesare in the garments ortextiles sectors, whichalso have the largestaverage share of unionmembers, at 86% and88%, respectively. Theselabor-intensive sectorsare struggling to redefinetheir competitiveness ina more competitiveworld. While theu n e m p l o y m e n timplications will beimportant if these sectorsfail to adjust andreposition themselves,protection is not the
22
0 20 40 60 80 100
Total
Wood
Transport
Tobacco
Textiles
Paper
Leather and Footwear
Garments
Food and Beverages
Electronics andElectrical Equipment
Chemicals
Percent
% of Firms with unionized workers % Union members
Figure 4 Percent of Firms with Unionized Workersand Percent of Union Members, by Sector
Source: Investment Climate and Productivity Study, 2003.
INO Report for Booklet JA sugg Text.pmd 19/05/2005, 11:38 AM30

23
answer. What these sectors need are increases in productivity that can be possiblethrough technology improvements and a conducive business environment.
Customs Regulations
Indonesian firms importroughly 20% of their inputand supplies, and exportnearly 30% of their output.Simple and transparentcustoms regulations canfacilitate firms’ export andimport activities, and ensuresmooth trading in their goodsand a steady supply ofimported raw materials.
Customs clearance isgenerally acceptable.Clearing customs for exportsis fairly fast, at 4 days onaverage, or even quicker inthe electronics industry, atslightly more than 2 days (asboth the mean and median).But clearing customs forimports for the food andbeverages, paper, andtextiles industries takeslonger than the 6–dayaverage (Figure 5).
Firms catering to MNCs and wholesalers are the most likely to experience delays atcustoms. MNCs and wholesalers experience longer customs delays than retailers,government firms, or firms serving their parent companies as main clients (Figure 6).This could be due to the high volume of trade of MNCs and wholesalers, requiringrelatively longer inspections and documentation. Or it could be due to higher potentialfor bribery from these firms.
Financing
Bank financing accounts for only about 10% of medium firms’ working capital asagainst 17% for large firms. A survey of banks in 2001 revealed that SMEs areassociated with low credit risk, yet banks remain hesitant to extend credit to thembecause of high transaction costs and the banks’ limited experience in dealing withSMEs (Agung et al. 2001).
0 2 4 6 8 10
Total
Wood
Transport
Tobacco
Textiles
Paper
Leather and Footwear
Garments
Food and Beverages
Electronics andElectrical Equipment
Chemicals
Days
Average days to clear imports Average days to clear exports
Figure 5 Average Number of Days toClear Imports and Exports at Customs, by Sector
Source: Investment Climate and Productivity Study, 2003.
INO Report for Booklet JA sugg Text.pmd 19/05/2005, 11:38 AM31

Improving the Investment Climate in Indonesia
In traditional sectors, suchas garments, textiles,footwear, and paper, bankfinancing is relativelysignificant, especially forlarge firms. In some of thesesectors, there is a wide gap inaccess to bank financingbetween large and mediumfirms. On a sector basisamong medium firms, thechemicals, electronics, andpaper industries are amongthose with the lowestproportion of working capitalfrom commercial banks,averaging 2–5% (Figure 7).Medium firms in both thechemicals and paperindustries rely more onretained earnings, whilethose in the electronicsindustry depend mostly onother sources.
24
0 2 4 6 8 10 12
All
Wholesalers
Retail/Consumers
Parent Company
Multinational
Government
Days
Average days to clear imports Average days to clear exports
Figure 6 Average Number of Days toClear Imports and Exports at Customs,
by Type of Client
Source: Investment Climate and Productivity Study, 2003.
5 Brojonegoro (2003) finds that the extra cost of doing business due to corruption is close to 10%in Java, and 11% in Outer Java.
Business Operation and Corruption
At national level, exporters pay higher bribes. A significant business deterrent iscorruption in the bureaucracy. The ICS results indicate that corruption at the nationalgovernment level amounts to about 4.6% of sales.5 Informal payments to the nationalgovernment are higher among firms dealing with MNCs operating in Indonesia.Exporters also make greater informal payments than non-exporters to national governmentauthorities as a proportion of sales (Figures 8a and 8b).
Informal payments to local authorities are even higher than those at the nationallevel. At 4.8% of sales, informal payments to local authorities are slightly higher thanto the national authorities. Among the sectors surveyed, electronics reports the highestlevel of informal payments to local authorities, at 8% of sales. Large firms, exporters,foreign firms, and firms with two or more establishments on average allocate a higherproportion of their sales to local informal payments. Bureaucrats may expect that suchfirms have more capacity to provide informal payments and therefore ask for higherpayments; alternatively, these firms may desire to provide higher payments because thecorresponding losses due to delays may be more costly. In some cases, awarding ofpublic contracts involves irregular payments, amounting to 25.3% of the value ofnational government contracts or 15.8% of local government contracts.
INO Report for Booklet JA sugg Text.pmd 19/05/2005, 11:38 AM32

Management spends about 5% of its time dealing with national government regulationsand another 6% with local government regulations. Exporters, firms with two or moreestablishments, and firms dealing with MNCs operating in Indonesia are more likely tospend a higher proportion of their management time on local government regulations.Considering the scale and complexity of their operations, any violation of government
regulations may beevident to the authorities,and this forces these firmsto spend more time indealing with regulations.
Legal and RegulatoryUncertainty
Uncertainty in the legalenvironment remains.Investors seek somedegree of certainty in thelegal environment beforecommitting to invest. InIndonesia, inconsistencyin the legal system hasmade potential investorswary. Although thecountry has established acommercial court andmade amendments to theBankruptcy Law,implementation of thislaw has not been veryeffective. There are three
major reasons for this (Schroeder and Sidharta 2003): (i) judges are vulnerable tocorruption, (ii) judges do not understand the law, and (iii) the Bankruptcy Law isimplemented inconsistently in Indonesia. Some recent court rulings against foreigncompanies have prompted criticisms and reinforced the common view that Indonesia’scourt system is beset by corruption.6 Another source of uncertainty for investors hasbeen the assertion of local governments of their new rights of ownership or control overenterprises within their borders.7
25
0 5 10 15 20 25 30
Total
Wood
Transport
Tobacco
Textiles
Paper
Leather and Footwear
Garments
Food and Beverages
Electronics
Percent
Medium Large
Figure 7 Average Percentof Financing for Working Capital
from Commercial Banks, by Sector
Source: Investment Climate and Productivity Study, 2003.
6 One such case involved Manulife, a major Canadian insurance company, which saw itsIndonesian subsidiary declared bankrupt by a commercial court in 2002 though it was solvent.The judges who granted the ruling against Manulife were investigated and, subsequently, theSupreme Court overturned the ruling.
7 One illustrative case is Cemex, which is being prevented by the provincial government frompurchasing the remaining equity of its subsidiary, Semen Gresik. Such an option was, in fact,part of an agreement the company made with the national Government.
INO Report for Booklet JA sugg Text.pmd 19/05/2005, 11:38 AM33

Improving the Investment Climate in Indonesia
Most business disputes are resolved out of court. About 35% of firms report havingbusiness disputes over the last 2 years. Only a few disputes are elevated to courts, asother avenues for dealing with conflicts are explored; a large majority of disputes (80%)are resolved through amicable settlements. In a few cases, the local or nationalgovernment and business associations are involved in addressing business disputes.Nearly half of the firms surveyed still hold negative views about the legal system—about 45% never associate the court system with fairness or impartiality, and about 40%of foreign firms and exporters have such perceptions.
Perceptions of uncertainty about the court system are causing some firms to take await–and–see attitude toward investment. More domestic firms (46–47%) than foreignfirms (38–40%) think that the court system is not fair or honest. More large firms thanmedium firms are confident that courts will uphold property rights (Figure 9). Whenfirms were asked whether “they are confident that the judicial system will enforce theircontractual and property rights in business disputes”, about 40% expressed misgivings.Further, close to 60% of firms do not agree that government officials’ interpretation ofregulations affecting their businesses are consistent and predictable.
Moreover, the Investor Experience Survey 2003 conducted by the International BusinessChamber in Indonesia revealed the following issues among investors: contract or lawenforcement, instability of contracts, weakness of the regulatory system, and corruptionin the legal system. The process in setting up or expanding business is seen to becomplicated. Some firms report that licensing procedures are unclear, while others areconstrained by bureaucratic delays. Firms highlight the need to streamline the regulatoryprocess, and to better coordinate the activities of government regulatory agencies.
26
0 1 2 3
NationalGovernment
LocalGovernment
Percent
Large Medium
0 1 2 3
NationalGovernment
LocalGovernment
Percent
Exporter Non-exporter
Informal Payments to Local and National Governmentsas a Share of Firm Sales, by Size and by Export Orientation (%)
Figure 8a Large vs Medium Companies
Source: Investment Climate and Productivity Study, 2003.
Figure 8b Exporting vs Non-Exporting Companies
INO Report for Booklet JA sugg Text.pmd 19/05/2005, 11:38 AM34

Since 1999, political instability and security concerns have increased. Firms on averagespend about 1% of their sales on security (equipment, personnel, or professional securityservices). This figure appears uniform across firm types, regardless of size, exporter ornon-exporter status, or ownership.
Trends in Business Constraints since Decentralization
“Big bang” decentralization, which started in 2001, faces a number of concerns. TheLaw on Regional Autonomy (1999) is too general in assigning spending responsibilities,causing confusion to regions. The Law on Fiscal Balance (1999) also lacks clarity in theassignment of functions that could exacerbate macroeconomic imbalances. The proposedrevenue-sharing and fiscalarrangements might worsen theincome disparity across regions.Regional governments have notbeen given new taxing powersand have limited autonomy overminor levies only, such as waterand street lighting user charges.Given the limited revenue-sharing arrangements, localgovernments have undertakeninitiatives to impose additionaltaxes and levies, which can becostly to business. Under LawNo. 34/2000, local governmentscan impose 11 types of taxes,though these are subject toseveral criteria: the tax objectsshould reside in the region wherethe tax is implemented, with lowmobility; local tax objects shouldnot overlap with those imposed by the central and/or provincial governments; and taxesshould follow principles of equity and ability to pay, have significant tax potential, andbe nondistortionary to the economy. Despite this, some new taxes have brought aboutdistortions in investment, intraregional trade, and other economic activities. Of the 693local regulations issued during 2000–2002, as reviewed by the Regional AutonomyWatch, about 492 were found problematic and 70% were user charges.
Decentralization led to a worsening of the business climate. The ICS reveals that about21–25% of firms reckon that constraints relating to labor regulations and businesslicensing have become more serious (Table 3). Even more striking is the fact that around40% of firms indicate that problems related to uncertainty in economic policy andregulations, as well as corruption, have become worse. The ICS findings ondecentralization are in line with the conclusion of the Monitoring Committee on theImplementation of Regional Autonomy of the Indonesian Chamber of Commerce andIndustry (Kompas 2004). On a positive note, some local governments have managed to
27
0 10 20 30 40 50 60 70
UpholdProperty
Rights
ConsistentRegulations
Percent
Medium Large
Figure 9 Perceptions on Legaland Regulatory Uncertainty, by Firm Size (%)
Source: Investment Climate and Productivity Study, 2003.
INO Report for Booklet JA sugg Text.pmd 19/05/2005, 11:38 AM35

Improving the Investment Climate in Indonesia
take advantage of the opportunities that accompany decentralization. One example is thelocal government of Sragen (Box 5).
One third of the firms surveyed report that informal payments have increased sinceJanuary 2001, even though the effectiveness of such payments has not improved. Whilefirms surveyed in the ICS resort to informal payments to help resolve certain issues andreduce delays, most firms report that issues were not resolved in the expected mannerand time. Roughly 40% report that only “half of the time” and another 30% state that“rarely or never” was an issue resolved in the desired way.
With decentralization, problems associated with local taxation have surfaced ascritical issues. In the ICS survey, taxation came out as the foremost issue in the post-decentralization period. Half of the firms indicated that local taxes present a problem tobusiness. Large firms and exporters tend to be more affected by local tax issues. Of thefirms considering local taxes a problem, 85% complain about the multitude of taxesimposed by local authorities, 77% are unhappy with the confusion in the applicabilityof taxes, and 73% register dissatisfaction with high tax rates. The surge of local taxesand fees and the confusion in their implementation cause managers to spend part of theirtime in meetings or inspections with the tax inspectorate. About 11% of firms report thatin these interactions, informal payments are expected or requested.
Interregional Comparisons
Stable macroeconomic conditions and a conducive legal and regulatory environmentare important factors that affect the flow of investment. In addition, investment locationchoice is driven by three crucial factors: proximity to markets, availability of inputs andraw materials, and adequacy of infrastructure. Jakarta has generally enjoyed theseadvantages over all other regions and thus has been the largest recipient of investment,especially foreign investment. For the period 1997 to mid-2004, Jakarta accounted forabout 45% of total foreign investment approvals in the country. Some of the differencesbetween the capital and the regions are outlined in the following paragraphs.
28
Indicator Improved/Somewhat
Improved Stayed the Same
Deteriorated/ Somewhat Deteriorated
N % N % N %
National and Local Labor Regulations 155 21.7 379 53.2 179 25.1
National and Local Business Licensing and Operating Permits
150 21.0 411 57.6 152 21.3
Economic and Regulatory Policy Uncertainty
85 11.9 345 48.4 283 39.7
National and Local Corruption 81 11.4 336 47.1 296 41.5
Table 3 Changes Since Decentralization(beginning January 2001)
Note: N = Number of responses.
Source: Investment Climate and Productivity Study, 2003.
INO Report for Booklet JA sugg Text.pmd 19/05/2005, 11:38 AM36

29
Box 5 One-Stop Service in Sragen—Positive Results from Decentralization
Decentralization is a devolution or a delegation of responsibilities, authority, and concomitant resources from a
central government to subnational levels of government, as it is desirable to move decision making closer to those
most directly affected by the decisions. Over the last few decades, there has been a global movement toward
decentralization as a means of promoting key principles of regional autonomy, government accountability and
transparency, economic efficiency and effectiveness, and equitable access to services.
Decentralization in Indonesia started in January 2001 with the implementation of two laws, governing regional
governance and autonomy, namely Law No. 22/1999 on Regional Autonomy and Law No. 25/1999 on Fiscal
Balance between the central and regional governments. The main aim is to improve the planning and
implementation of public services provision, by incorporating local needs and conditions while meeting regional
and national social and economic development objectives. This is expected to lead to a better allocation of
resources.
The implementation of decentralization in Indonesia resulted in, among others, a marked increase in local
business regulations with the potential for a wide and damaging regional variation in regulations, which needs
to be mitigated. Local and central governments must ensure that their economic policies are consistent. While
the legislation provides a regulatory monitoring role by the central Government, the sheer volume of new or revised
local regulations makes this task unmanageable. Systematic regulatory streamlining and impact monitoring
functions should extend to the local level, providing a uniform framework for business regulations and impact
assessment across regions.
The local government of Sragen in Central Java shows a rare case of a typical district striving to support better
regulations under decentralization. The district has a population of 850,000 people, with livelihoods mainly in
agriculture and annual average incomes of $98 a month; 48% of them are classified as poor. A new local
government came into office in 2001 and promoted easier access to business licenses and counted on support
from the local parliament to improve infrastructure and increase local support to the garment, furniture, and
handicraft industries, aware that agriculture alone could support the people and that the local economy requires
diversification toward labor-intensive industries.
Doing Business 2004 of the World Bank estimates that registering a business (limited company status) in
Indonesia takes 151 days and involves 12 procedures, the longest process among surveyed countries in Asia.
One third of all businesses in Sragen have no legal status, and only 1% are a limited company. In October 2002,
with support from Asian Development Bank technical assistance (TA 3829: Strengthening Business Development
Services for SMEs approved in January 2002), Sragen moved to integrate local government agencies to provide
licenses from a centralized local office known as the Unit Pelayanan Terpadu or One-Stop Service (OSS). The
move meant that all the different government agencies represented within the local government would surrender
authority to a single office.
Efficiency has improved dramatically (see Box Figure below). The four most common licenses provided by local
governments, for example, are the construction permit, antinuisance permit, industry business license, and
trading license—together providing on average about one third of Sragen’s revenues, shared by all government
agencies (1% funds the OSS office). With the introduction of the OSS office, run by 27 staff members, license
processing has increased substantially—from 43% for trade permits to 126% for construction permits. The
antinuisance permit, industry business license, or trading license takes only an average of 5 to 7 days to obtain,
much shorter than before the OSS office was set up. The complicated construction permit now takes just 15 days,
while in neighboring districts it may take up to 35 days.
The key to the improvement has been the emphasis on accountability, which involved introducing a tracking time
sheet to find out who was processing a specific document at each stage and how long that person took to process
it. The OSS team is highly motivated to perform their administrative tasks, and have good academic qualifications.
They also undergo regular training in new techniques, such as monitoring customer satisfaction through feedback.
The latest such survey indicated that 74% of OSS visitors appreciate the services offered.
Source: Compiled by Asian Development Bank staff.
INO Report for Booklet JA sugg Text.pmd 19/05/2005, 11:38 AM37

Improving the Investment Climate in Indonesia30
Box Figure Processed Licenses before and after Introductionof One-Stop Service Office, Sragen, Central Java,
January–September 2002 and January–September 2003
Note: HO = antinuisance permit, IMB = building construction permit, SIUP =
trading license, TDP = company business registration.
Sources: Sragen-One-Stop Service Office; staff estimates.
Type of Permit Delivery Time Location Permit 12 Days IMB (construction permit) 15 Days HO/SITU (antinuisance permit/business location permit) 7 DaysSIUP (trading license) 5 DaysIUI (industry business license) 7 DaysTDP (company business registration) 5 DaysTDI (industry business registration) 5 DaysPublic Recreation and Entertainment Permit 5 DaysRestaurant Permit 5 DaysBeauty Salon Permit 5 DaysFlower class Hotel Permit 12 Days Travel Bureau Permit 10 Days Tourist Home Stay Permit 12 Days Closing Road Permit 2 Days Billboard Permit 1 Day
Box Table 1 One-Stop Service in Sragen:Types and Delivery Time of Permits
Sources: Asian Development Bank Technical Assistance 3829:
Strengthening Business Development Services for SMEs.
Types of Services Delivery Time Family Registration Card—Sragen Town 1 Day Personal Identity Card—Sragen Town 1 Day Birth Certificate 5 Days Death Certificate 2 Days Child Adoption Certificate 2 Days Child Custody Certificate 2 Days Change Name Certificate 2 Days Marriage Certificate 2 Days Divorce Certificate 2 Days Land Title/Deed, Certificate of Land Ownership 6 Months
HO IMB SIUP TDP
70
60
50
40
30
20
10
0
Before One-Stop Service After One-Stop Service
Number of Licenses a Month
Box Table 2 Types andDelivery Time of Services
Sources: Asian Development Bank Technical Assistance 3829:
Strengthening Business Development Services for SMEs.
Box 5 (cont’d)
INO Report for Booklet JA sugg Text.pmd 19/05/2005, 11:38 AM38

31
Firms in Jakarta face a more severe deterioration in infrastructure. Jakarta’sinfrastructure services are inadequate to support its relatively large concentration offirms. Firms regard congestion in transport and land access in Jakarta as key constraints.Jakarta has one of the highest number of days of power outages, insufficient watersupply, telephone unavailability, and transport failure (Figure 10), leading to seriouslosses in sales, respectively, at 4%, 5%, 3%, and 3%.
Infrastructure constraints appear less severe in other regions, particularly Bali and EastJava, which together experience the lowest frequency of power outages, have thesmallest share of private generators (36% compared with around 50% for other regions),the least incidence of insufficient water supply (along with Banten), and the lowest shareof firms that consider telecommunications, electricity, and transport as moderate to verysevere constraints.
Business and regulatory processes in Jakarta are quicker than in other regions. Theslow speed of government licensing bodies makes other regions less desirable forinvestment. In terms ofthe time taken forgovernment authoritiesto approve businesslicenses and permits,Jakarta fares veryfavorably relative toother regions. Based onthe experience of firmsover the 2 years prior tothe survey, the medianwaiting time to obtain aconstruction permit inJakarta is only about 14days, compared withabout 30 days in Bantenand in Central Java andYogyakarta (Figure11). The mediannumber of days toobtain operatinglicenses from either thenational or localgovernment is alsolower in Jakarta than inmost regions. Jakarta has the lowest share of firms that regard permits or licenses at thenational or local government as moderate to very severe obstacles (at around 30%compared with 50% in West Java).
Jakarta also fares better than most regions in customs efficiency, particularly importclearance. Firms in Central Java and Yogyakarta experience the longest time to clear
0 1 2 3 4 5 6 7 8
West Java
Outer Java
DKI Jakarta
Central Java andYogyakarta
Banten
Bali and East Java
Days
Power Outages Insufficient WaterUnavailable Phone Transport Failure
Source: Investment Climate and Productivity Study, 2003.
Figure 10 Average Days Lost in Production Owing toInfrastructure Bottlenecks, by Location (days)
INO Report for Booklet JA sugg Text.pmd 19/05/2005, 11:38 AM39

Improving the Investment Climate in Indonesia32
imports among all regions, at a median of 7 days. In contrast, importers in Jakarta andOuter Java8 can clear imports in only 2–3 days. The median delays in clearing exports,however, are fairly similar across regions; export clearance tends to be faster than importclearance. Given that exporters rely heavily on imported inputs, their production is liableto be seriously hampered by long delays in import clearance.
Taxation issues also appear less severe in Jakarta than in other regions. Only 42–46%of firms in Jakarta consider tax administration and tax rates in general as moderate tovery severe obstacles, compared with 50–60% of firms in Banten, Central Java andYogyakarta, and Outer Java. Even local taxes are a problem to more firms outsideJakarta, particularly West Java (70%). In dealing with local regulations, firms in all otherregions spend about twice the average time spent by firms in Jakarta.
Corruption is more seriousin Jakarta. The ICS surveyreveals that average informalpayments to the nationalGovernment as a share ofsales, including payments togain public contracts, arehigher in Jakarta than inother regions. In addition,nearly 40% of firms inJakarta reported makinginformal payments tonational authorities,compared with only 22–23% of firms in Bali andEast Java and in Outer Java.After Jakarta, Banten andWest Java have the mostfirms making informalpayments, at 32%. In termsof informal payments to thelocal government, Jakartaand Outer Java have thehighest share of firmsmaking informal payments,at 48%.
Overall, fewer regulatory and bureaucratic constraints in Jakarta come at theexpense of higher bribery. Jakarta ranks worse in corruption and better in regulatoryaspects than other regions. The seemingly better quality of government services in
8 Outer Java consists of East Kalimantan, North Sumatera, Riau, and South Sulawesi.
0 5 10 15 20 25 30 35
West Java
Outer Java
DKI Jakarta
Central Java andYogyakarta
Banten
Bali and East Java
Days
Construction Permit Import LicenseOperating License: National Operating License: Local
Source: Investment Climate and Productivity Study, 2003.
Figure 11 Median Waiting Time toObtain Permits and Licenses, by Location
INO Report for Booklet JA sugg Text.pmd 19/05/2005, 11:38 AM40

33
Jakarta may not just be linked to the quality of government institutions, but to theincentives emanating from corrupt payments. Considering that Jakarta has a highcorruption index but low indexes on time to obtain licenses and permits, customsclearance, and time spent on dealing with government regulations, it would seem thatfirms in Jakarta make higher informal payments and make more extensive use of briberyto expedite matters in dealing with government authorities (Table 4).
Infrastructureb Licenses and
Permitsc Customs
Clearanced Time Spent on Gov't
Regulations Corruptione
Bali and East Java 1.3 8.5 14.0 5.6 1.4
Banten 1.9 14.7 13.6 7.1 2.0
Central Java and Yogyakarta 1.4 16.1 22.3 7.3 1.1
DKI Jakarta 2.8 8.5 10.5 3.7 3.2
Outer Java 2.1 7.7 5.5 6.9 1.9
West Java 1.5 10.6 13.9 7.1 1.5
Table 4 Investment Climate Index by Location and by Obstaclea
a Each investment climate index in the table is obtained by using the standardization
method commonly used by the United Nations Development Programme in its calculation
of the Human Development Index (see various Human Development Reports). In this
method, a specific investment climate variable is calculated with regard to its minimum
and maximum values. Accordingly, the calculation of the standardized index (SI) can be
described as follows: SI = (actual value – minimum value)/(maximum value – minimum
value)*100. The index is intended to be representative and, more importantly,
comparable across sectors, regions, or locations. In line with the desirable characteristic
of an index, the value of index should range from 0 to 100 to show the level of
obstacle. An index value of 0 represents the lowest (none) obstacle and 100 to show
the highest (maximum) obstacle. The lower the index value, the better.b Computed from days lost due to power outages, insufficient water supply, unavailable
telephone, and transport failures.c Obtained from waiting time to obtain a construction permit, import license, national
operating license, or local operating license.d Covers average and longest days to clear imports and exports.e Derived from informal payments as a share of sales and a share of the value of
contracts at the national and local levels.
Source: Investment Climate and Productivity Study, 2003.
IV. International Comparison: WhereDoes Indonesia Stand?
A higher share of respondent firms in Indonesia are concerned over key investmentclimate constraints than in some other countries in the region.9 What is striking aboutIndonesia’s investment climate is the extent to which firms perceive the negativeconstraints. Of all the countries in the region surveyed by the investment climateassessments, fewer than 40% of firms in each country evaluate any investment climateconstraint as major or very severe.
9 In the perceptions of business constraints captured by the ICS, Indonesia is being comparedwith ADCs that have conducted their investment climate studies or assessments, namely,Bangladesh, PRC, Pakistan, and Philippines.
INO Report for Booklet JA sugg Text.pmd 19/05/2005, 11:38 AM41

Improving the Investment Climate in Indonesia34
In Indonesia, more than 40% of firms surveyed say that macroeconomic instability andeconomic and regulatory policy uncertainty are major or very severe constraints tobusiness operation (Figure 12). Corruption is another serious issue, with nearly 40%finding it as major or very severe constraint.
Governance and Uncertainty
The most severe constraints affecting Indonesian firms all have to do with overalluncertainty. While all investment involves risks in various forms, higher risks discouragefirms from undertaking investments. In addition to concerns over security in Indonesia,
risks are influenced bym a c r o e c o n o m i cinstability and theuncertainty ingovernment policies andregulations affectingbusiness. The ICSresults show that themost severe constraintsaffecting firms inIndonesia all deal withhigher risks anduncertainties, rather thanhigher costs. Indonesiaperformed the worst inm a c r o e c o n o m i cinstability and economicand regulatory policyuncertainty (Table 5).
Constraints Bangladesh PRC Pakistan Philippines Indonesia
Macroeconomic Instability 38.6 26.0 34.4 38.4 50.1
Crime, Theft, and Disorder 39.2 15.7 21.5 26.5 22.0
Economic and Regulatory Policy Uncertainty 44.4 28.0 40.1 29.5 48.3 Firms disagreeing that interpretations of regulations within a country are consistent and predictable (%)
7.8 14.7 50.0 49.1 59.9
Table 5 Constraints to Stability in Indonesia—AnInternational Perspective (%)
Note: The constraints—macroeconomic instability, crime, theft and disorder, and economic and
regulatory policy uncertainty—are calculated as a share of firms having major or very
severe constraints.
Sources: Investment Climate and Productivity Study, 2003; World Bank and Bangladesh Enterprise
Institute (2003).
% of Firms Surveyed
0
10
20
30
40
50
60
Indonesia Philippines People’s Republic of China
Labor Regulations
Business Licensing and Operating Permits
Cost of Financing
Economic Policy Uncertainty
Macroeconomic Instability
Corruption
Figure 12 Constraints to Business—Higherin Indonesia than in the PRC and the Philippines
Source: Investment Climate and Productivity Study, 2003.
There is a very high levelof “uncertainty” in the interpretation of regulations, which is worse than in the PRC andPhilippines. Higher costs—from tax rates, financing, or power shortages—come onlysecond.
INO Report for Booklet JA sugg Text.pmd 19/05/2005, 11:38 AM42

35
Key governance indicators are also weak in Indonesia compared with other countriesin the region. Indonesia’s scores are among the worst in all six dimensions ofgovernance (Table 6) and are no match to its main competitors, such as Malaysia,Thailand, or the PRC. The weak scores on political stability and control of corruptionstand out. But the scores for rule of law, regulatory quality, and government effectivenessare also much lower than its neighbors’. More worrisome is the trend in these indicators.With the exception of the voice and accountability indicator, governance appears tohave worsened between 1996 and 2002, as reflected in declining scores on politicalstability, government effectiveness, regulatory quality, rule of law, and control ofcorruption (Table 7). Good governance can be seen in the well-functioning legal and
ASEAN Other ADCs Indicator
Indonesia Malaysia Philippines Thailand Viet Nam Bangladesh PRC India Voice and Accountability –0.49 –0.27 0.17 0.20 –1.36 –0.57 –1.38 0.38 Political Stability –1.37 0.51 –0.49 0.55 0.49 –0.61 0.22 –0.84 Government Effectiveness –0.56 0.92 –0.06 0.28 –0.27 –0.53 0.18 –0.13 Regulatory Quality –0.68 0.58 0.10 0.34 –0.69 –1.05 –0.41 –0.34 Rule of Law –0.80 0.58 –0.50 0.30 –0.39 –0.78 –0.22 0.07 Control of Corruption –1.16 0.38 –0.52 –0.15 –0.69 –1.12 –0.41 –0.25
Table 6 Governance Indicator Scores, 2002
Notes:
1 Voice and Accountability: measures the extent to which citizens of the country are able to
participate in the selection of government, based on various aspects of the political
process, civil liberties, and political rights (including indicators measuring the
independence of the media).
Political Stability: measures perception of the livelihood that the government in power will
be destabilized or overthrown by mostly unconstitutional and/or violent means, including
terrorism.
Government Effectiveness: measures quality of public service provision, quality of
bureaucracy, competence of civil servants, the independence of civil service from political
pressure, etc.
Regulatory Quality: measures the quality of government policies, using indicators relating
to various regulatory measures such as trade policy, business ownership restrictions, price
and wage controls, tax system, financial regulations, and competition policy.
Rule of Law: measures the extent to which individuals have confidence in and abide by
the rules of society, using indicators relating to quality of the legal system, independence
of the judiciary, enforceability of contracts and property rights, and incidence of violence
and crime.
Control of Corruption: measures the extent of corruption, using indicators rating severity of
corruption in the political system, as indicated by patterns of nepotism, cronyism, and
patronage, indirect diversion of funds, lack of transparency, extent of irregular payments,
and costs of corruption.
2 Estimates are normally distributed with a mean of zero and standard deviation of 1 in
each period. Virtually all scores lie between –2.5 and +2.5, with higher scores
corresponding to better outcomes.
Source: Kaufmann et al. (2003).
Indicator 2002 2000 1998 1996 Remarks Voice and Accountability –0.49 –0.52 –1.33 –1.08 Improving Political Stability –1.37 –1.85 –1.52 –0.34 Worsening Government Effectiveness –0.56 –0.49 –0.58 0.08 Worsening Regulatory Quality –0.68 –0.43 0.10 0.19 Worsening Rule of Law –0.80 –0.90 –0.97 –0.34 Worsening Control of Corruption –1.16 –1.09 –0.99 –0.44 Worsening
Table 7 Governance Indicator Scores Over Time—Indonesia
Source: Kaufmann et al. (2003).
INO Report for Booklet JA sugg Text.pmd 19/05/2005, 11:38 AM43

Improving the Investment Climate in Indonesia36
10 The World Bank's Doing Business collects information on the sequence in which the insolvencyprocedures are to be completed, including those that can be carried out simultaneously. Delaysdue to legal tactics in slowing the process (e.g., extension of response periods or appeals) arealso included in the estimated time in closing a business.
regulatory frameworks, clear enforcement of contracts and property rights, and controlof corruption, and is associated with macroeconomic stability, along with deepereconomic and financial development. Studies have shown that countries with bettergovernance achieve higher income levels. Good governance requires accountability ingovernments; participation of the public in the development process; predictability orfairness and consistency in government rules and policies; and transparency in governmentrules, regulations, and decisions. Such are the elements that Indonesia currently needsto improve in order to foster overall stability, enhance its investment climate, and attainhigher and sustainable economic growth.
Business Operation and Corruption
Starting up and closing a business take longer and are costlier in Indonesia. Firmshave to go through 12 procedures to start a business in Indonesia, worse than Malaysiaand Thailand and even worse than Bangladesh and Sri Lanka (Figures 13 and 14).Although the Investment Coordinating Board (BKPM) claims that it takes only 10 daysto approve initial investments once the required documentation is completed, the totalnumber of days to start a firm in Indonesia is about 151 days, compared with less than60 days for the other ASEAN countries surveyed. On firms’ overall view of starting abusiness as measured by the administrative burden for start–ups, Indonesia ranks 64 outof 102 countries—behind Malaysia, Philippines, Thailand, and Viet Nam. The timerequired to close a business, based on the average duration that insolvency lawyersconsider necessary to complete the procedures, is about 6 years, slightly longer than inthe Philippines but more than double the time required in Malaysia and Thailand.10
Indonesia has one of the poorest rankings (97) among all countries covered by theGlobal Competitiveness Report in the extent of bureaucratic red tape, measured by thefirms’ extent of management time spent dealing or negotiating with governmentofficials (Figures 15a and 15b). But the ICS survey shows that the management time thatIndonesian firms spend on dealing with requirements imposed by government regulationsis comparable to the Philippines and the PRC (Table 8). But more than half the time,inspections and meetings with officials by Indonesian firms are conducted with localauthorities.
Excessive regulations raise business transaction costs and unduly discourageinvestments; they also lead to corruption. Too many regulations force firms to resortto illegal payments or bribery to hasten the process of obtaining permits, clearances, andpublic service connections. This is supported by the findings of the ICS survey,indicating that 38% of Indonesian firms consider corruption a very serious issue, ahigher rate than in the PRC and the Philippines (Table 9). Informal payments to “getthings done” as a share of revenue is worse in Indonesia than in these two countries. Interms of the business costs of corruption, Indonesia’s ranking (46) is, among ASEAN
INO Report for Booklet JA sugg Text.pmd 19/05/2005, 11:38 AM44

37
0 20 40 60 80 100 120 140 160
Administrative Burden forStart-Ups (rank, 2003)
Days to Start a Business(2004)
Number of Proceduresto Start a Business (2004)
Good to Bad
Indonesia
Bangladesh
PRC
India
Sri Lanka
Indonesia
Bangladesh
PRC
India
Sri Lanka
Indonesia
Bangladesh
PRC
India
Sri Lanka
Figure 14 Indonesia vs Other Asian DevelopingCountries—Ease of Entry Indicators, 2003/04
(Value or Ranking out of 102 Countries)
Note: The lower the rank order, the better.
Source: Doing Business 2004 and Global Competitiveness Report 2003–2004.
0 20 40 60 80 100 120 140 160
Administrative Burdenfor Start-Ups (rank,
2003)
Days to Start aBusiness (2004)
Number of Proceduresto Start a Business
(2004)
Good to Bad
Indonesia
MalaysiaPhilippines
Thailand
Viet Nam
Indonesia
Malaysia
PhilippinesThailand
Viet Nam
Indonesia
MalaysiaPhilippines
Thailand
Viet Nam
Figure 13 Indonesia vs Other ASEAN Countries—Easeof Entry Indicators, 2003/04
(Value or Ranking out of 102 Countries)
Note: The lower the rank order, the better.
Source: Doing Business 2004 and Global Competitiveness Report 2003–2004.
INO Report for Booklet JA sugg Text.pmd 19/05/2005, 11:38 AM45

Improving the Investment Climate in Indonesia38
Indicator Bangladesh PRC India Pakistan Philippines Indonesia
Share of senior management time spent dealing with requirements imposed by government regulations (%)
4.2 11.5 — 10.1 8.8 10.8a
Inspections:Days spent in inspections or
required meetings with officials
9.9 30.9 1.9 32.8 7.4 3.8
Share of meetings and inspections by local authorities (%)
— — 69.8 — 90.6 57.0
Table 8 Regulatory Burden and AdministrativeDelays—An International Perspective
Note: — = not available.a Sum of time spent with national and local government authorities.
Sources: Investment Climate and Productivity Study, 2003; World Bank and Bangladesh Enterprise
Institute (2003).
0 20 40 60 80 100
Viet Nam
Thailand
Philippines
Malaysia
Indonesia
Good to Bad
0 20 40 60 80 100
Good to Bad
Sri Lanka
India
PRC
Bangladesh
Indonesia
Extent of Bureaucratic Red Tape, 2003/04(Ranking out of 102 Countries)
Figure 15a Indonesia vs Other ASEAN Countries Figure 15b Indonesia vs Other ADCs
Note: The lower the rank order, the better.
Sources: Global Competitiveness Report 2003–2004.
Constraints Bangladesh PRC Pakistan Philippines Indonesia
Anticompetitive or Informal Practices 29.3 17.6 21.3 24.3 17.3
Business Licensing and Operating Permits 16.5 15.9 14.5 13.5 17.5
Corruption 57.8 22.4 40.3 35.2 38.2Informal Payments to Officials to “Get
Things Done” as Share of Revenue (%) 2.5 1.8 2.0 1.9 3.4a
Table 9 Constraints to Business Operation inIndonesia—An International Perspective (%)
Note: Calculated as a share of firms having major or very severe constraints in business
operation.a Sum of percentages of informal payments to national and local government
authorities.
Sources: Investment Climate and Productivity Study, 2003; World Bank and Bangladesh Enterprise
Institute (2003).
INO Report for Booklet JA sugg Text.pmd 19/05/2005, 11:38 AM46

39
countries, worse than Malaysia and Thailand (Figure 16a). Indonesia also ranks worsethan the PRC (Figure 16b). Tax collection in Indonesia is also made inefficient bycorruption. The country ranks 82 in irregular payments in tax collection, worse thanMalaysia, Thailand, and Viet Nam (Figure 16a).
0 20 40 60 80 100 120
Business Costsof Corruption
IrregularPayments in Tax
Collection
Good to Bad
Indonesia
Malaysia
PhilippinesThailand
Viet Nam
Indonesia
Malaysia
Philippines
Thailand
Viet Nam
0 20 40 60 80 100 120
Business Costsof Corruption
IrregularPayments in
Tax Collection
Good to Bad
Indonesia
BangladeshPRC
India
Sri Lanka
India
Indonesia
Bangladesh
PRC
Sri Lanka
Business Costs of Corruption and IrregularPayments in Tax Collection, 2003 (Ranking out of 102 Countries)
Figure 16 Indonesia vs Other ASEAN Figure 16b Indonesia vs Other ADCs
Note: The lower the rank order, the better.
Sources: Global Competitiveness Report 2003–2004.
Indonesia ranks worst among ASEAN countries in the severity of corruption and inthe extent of its deterioration in recent years. According to the Corruption PerceptionsIndex of Transparency International, in 2003, Indonesia ranked 122 out of 133countries, or equivalent to being the 12th most corrupt country in the countries surveyed(Table 10). Indonesia fares worse than other ASEAN countries. Corruption wasaggravated after the crisis by the process of decentralization. While in the pastcompanies knew the cost of informal payments and used bribery to get things done fast,in the current setup bribery alone is no longer an efficient means to cut transaction costs,and the amounts needed for informal payments are no longer known. Such uncertaintyis adversely affecting business plans.
Country 1996 2000 2001 2002 2003 2003 Ranking (133 countries)
Malaysia 5.3 4.8 5 4.9 5.2 37
Thailand 3.3 3.2 3.2 3.2 3.3 70
Philippines 2.7 2.8 2.9 2.6 2.5 92
Indonesia 2.7 1.7 1.9 1.9 1.9 122
Table 10 Corruption Perceptions Index
Source: Transparency International. The corruption perceptions index
relates to perceptions of the degree of corruption as seen by
the business community, academics, and risk analysts, and
ranges between 10 (highly clean) and 0 (highly corrupt).
INO Report for Booklet JA sugg Text.pmd 19/05/2005, 11:38 AM47

Improving the Investment Climate in Indonesia40
Infrastructure
Somewhat fewer firms in Indonesia than in the PRC and the Philippines considerinfrastructure to be a major or very severe constraint (Table 11). The main concern ofIndonesian firms is electricity. Indonesian firms report incurring losses from poweroutages amounting to about 4% of production, slightly worse than those experienced byfirms in the PRC (Table 12). After power, transport is another important issue forIndonesian firms. They report incurring losses amounting to about 3.6% of sales owingto transport failures. In addition, losses due to shipment problems (i.e., breakage, theft,or spoilage) amount to 2.3% of total shipment value, higher than those reported in thePRC. Insufficient water is another infrastructure constraint, resulting in losses of about4.4% of sales.
Constraints Bangladesh PRC Pakistan Philippines Indonesia
Telecommunications 24.4 16.5 9.2 11.3 9.1
Electricity 73.2 28.1 39.2 33.4 22.3
Transport 24.2 19.4 9.9 18.3 16.4
Access to land 27.5 16.3 20.4 14.8 13.0
Table 11 Constraints to Infrastructure inIndonesia—An International Perspective (%)
Note: Calculated as a share of firms having major or very severe constraints in
infrastructure.
Sources: Investment Climate and Productivity Study, 2003; World Bank and
Bangladesh Enterprise Institute (2003).
Indicators Bangladesh PRC Pakistan Philippines Indonesia
Frequency of Power Outages (days) 249.0 — 14.5 6.0 4.4
Production Lost Due to Power Outages (%) 3.3 1.8 5.4 7.1 4.2
Firms with Own Generator (%) 71.5 17.0 41.8 36.5 39.1
Firms with Own Well (%) 54.5 21.1 43.8 38.7 69.2
Value Lost in Shipment (%) 1.0 1.2 — 4.2 2.3
Days to Obtain a Telephone Connection 150.4 12.5 25.3 13.2 26.6
Days to Obtain an Electricity Connection 79.6 18.2 32.4 8.1 14.6
Table 12 Infrastructure PerformanceIndicators in Indonesia—An International Perspective
Note: — = not available.
Sources: Investment Climate and Productivity Study, 2003; World Bank and Bangladesh Enterprise
Institute (2003).
Only 9% of firms regard telecommunications as a major or very severe constraint,better than the PRC and the Philippines. But with only 92 per 1,000 people phonesubscribers in 2002, Indonesia is still lagging behind other ASEAN countries (exceptViet Nam) and even the PRC (Figures 17a and 17b). The average number of days toacquire a telephone in Indonesia is also longer than in the PRC and the Philippines. Therelatively low percentage of Indonesian firms that find telecommunications an obstaclemost likely, therefore, indicates a favorable attitude on the part of the businesscommunity that stems from the Government’s efforts to develop the telecommunicationssector. One important initiative of the Government has been the TelecommunicationsLaw No. 36/1999, which has attracted more players into the sector to stimulatecompetition and lead to better telephone services.
INO Report for Booklet JA sugg Text.pmd 19/05/2005, 11:38 AM48

41
Internet services in Indonesia are not as developed as those in Malaysia and Thailand.There are only 22 Internet hosts per 100,000 people in Indonesia, while Malaysia has311 and Thailand 118 (Figure 18a). With only 11 computers per 1,000 inhabitants,Indonesia has one of the lowest rates of computer availability among ASEAN countries,though the number of Internet hosts in Indonesia is higher than in Bangladesh, PRC,India, and Sri Lanka (Figure 18b). Yet a greater proportion of the population in the PRChas higher access to a computer than in Indonesia, as the PRC has 19 computers per1,000 people, compared with Indonesia’s 12 per 1,000 (Figure 18b). Clearly, Indonesianeeds to catch up on ICT to compete with its ASEAN neighbors and other ADCs.
0 100 200 300 400 500 600
Viet Nam
Philippines
Thailand
Malaysia
Indonesia
Number of Subscribers per 1,000 people
0 100 200 300 400 500
Sri Lanka
India
PRC
Bangladesh
Indonesia
Number of Subsribers per 1,000 People
Fixed Line and Mobile Phone Subscribers, 2002 (per 1,000 people)
Figure 17a Indonesia vs Other ASEAN Figure 17b Indonesia vs Other ADCs
Source: World Bank. World Development Indicators Online.
0 50 100 150 200 250 300 350
PersonalComputersper 1,000
Inhabitants
Internet Usersper 1,000
Inhabitants
Internet Hostsper 100,000Inhabitants
Indonesia Malaysia
PhilippinesThailand
Viet Nam
Indonesia Malaysia
Malaysia
PhilippinesThailand
Viet Nam
Indonesia
PhilippinesThailand
Viet Nam
0 5 10 15 20 25 30 35 40 45 50 55 60
PersonalComputersper 1,000
Inhabitants
InternetUsers per
1,000Inhabitants
Internet Hostsper 100,000Inhabitants
IndonesiaBangladesh
PRCIndia
Sri Lanka
IndonesiaBangladesh
PRCIndia
Sri Lanka
Indonesia
Bangladesh
PRCIndia
Sri Lanka
Access to Computers and the Internet, 2002
Figure 18a Indonesia vs ASEAN Figure 18b Indonesia vs Other ADCs
Source: Global Competitiveness Report 2003–2004; World Bank. World Development
Indicators Online.
INO Report for Booklet JA sugg Text.pmd 19/05/2005, 11:38 AM49

Improving the Investment Climate in Indonesia42
Taxation and Customs Regulations
About 30% of Indonesian firms view tax rates as major or very severe constraints, arate similar to the Philippines (Table 13). In addition, about 23% of firms in Indonesiaregard tax administration as a major issue, close to the figure for the PRC. In terms ofcustoms and trade regulations, only about 13% of Indonesian firms find them to be majoror very severe constraints, the lowest among selected ADCs. This could be the result oftrade liberalization policies adopted since the mid-1980s. In addition, as part of itsderegulation measures, Indonesia has moved toward simplifying its customs proceduresand some efforts have been made recently to hasten import clearance and to adoptelectronic filing. Indonesia is in a very favorable position in terms of delays in clearanceof imports and exports at customs.11
Constraints Bangladesh PRC Pakistan Philippines Indonesia
Tax Rates 35.4 34.1 45.6 30.4 29.5
Tax Administration 49.8 23.7 46.0 25.2 23.0
Customs and Trade Regulations 41.9 21.1 24.5 21.7 13.5
Import delays (days)
Average Wait to Clear Customs 11.7 7.5 17.9 9.2 5.9
Longest Wait to Clear Customs 23.2 12.2 31.9 16.6 12.1
Export Delays (days)
Average Wait to Clear Customs 8.8 5.5 9.2 6.5 4.1
Longest Wait to Clear Customs 14.0 8.1 17.7 10.4 7.5
Table 13 Tax and Customs Constraints inIndonesia—An International Perspective (%)
Note: Calculated as a share of firms having major or very severe constraints in taxation.
Sources: Investment Climate and Productivity Study, 2003; World Bank and Bangladesh Enterprise
Institute (2003).
11 However, there is the issue of smuggling, which is not covered by the ICS but generates concernamong some domestic firms.
Labor Regulations
Indonesia appears to have more restrictive labor regulations than other ASEANcountries and ADCs. Among the key concerns of Indonesian firms with respect to laborregulations are hiring and firing procedures and wage setting. Stringent labor regulationscan significantly affect a firm’s decision to invest, especially if labor accounts for a largeshare of the production costs. In hiring and firing practices, the Global CompetitivenessReport 2003–2004 gives Indonesia a ranking of 43, or less favorable than Thailand andViet Nam (Figure 19a). Indonesia ranks better than India and Sri Lanka, but worse thanBangladesh and the PRC, (Figure 19b). A more recent issue faced by Indonesian firmsis the new law on severance, which appears to be distorting the incentive system andmaking it costly for private firms to lay off even unproductive workers. Despite suchissues on hiring and firing, overstaffing does not seem to be a major concern for firmsin Indonesia. On average, firms’ desired workforce as a share of their current level isclose to 100% (Table 14). On job security, viewed in terms of the proportion ofpermanent workers, Indonesia is similar to the PRC and the Philippines.
INO Report for Booklet JA sugg Text.pmd 19/05/2005, 11:38 AM50

43
Labor quality does not appear to severely constrain Indonesian firms as only fewer than20% of firms regard the skills and education of workers as a major to severe issue. Inaddition, Indonesian firms on average have a greater share of workers than those in thePRC with more than 12 years of schooling (Table 14). But in terms of providing formaltraining to workers, Indonesian firms are fairly weak. While the majority (70%) of firmsin the PRC offer formal training, only 24% of Indonesian firms do this.
Indicator Bangladesh PRC India Pakistan Philippines Indonesia
Labor Composition
Share of Permanent Workers 65.3 85.9 59.7 86.6 88.7 88.6
Share of Female Permanent Workers 38.5 44.5 18.3 3.0 49.7 27.3
Share of Female Temporary Workers — 20.8 31.8 — 27.7 15.4
Share of Permanent Skilled Workers who are Foreign Nationals — — — 1.9 0.2 0.7
Labor Turnover
Average Time to Fill a Skilled Technical Vacancy (weeks) 3.1 — — 1.5 2.9 1.6
Average Time to Fill a Production or Service Vacancy (weeks) 1.6 2.9 — 1.2 2.3 1.0
Desired Level of Workforce as a Share of Current Level 99.0 87.4 82.8 97.0 95.7 96.8
Training and Education
Share of Workforce with less than 6 Years of Schooling — 1.7 — 34.9 — 12.2
Share of Workforce with more than 12 years of Schooling — 11.4 — 9.5 — 35.9
Share of Firms Offering Formal Training 26.6 69.6 27.2 11.1 21.3 24.3
Table 14 Labor and Training—An International Perspective (%)
Note: — = not available.
Sources: Investment Climate and Productivity Study, 2003; World Bank and Bangladesh Enterprise
Institute (2003).
0 20 40 60 80 100
Viet Nam
Thailand
Philippines
Malaysia
Indonesia
Good to Bad
0 20 40 60 80 100
Sri Lanka
India
PRC
Bangladesh
Indonesia
Good to Bad
Hiring and Firing Practices, 2003/04(Ranking out of 102 Countries)
Figure 19a Indonesia vs Other ASEAN Figure 19b Indonesia vs Other ADCs
Note: The lower the rank order, the better.
Source: Global Competitiveness Report 2003–2004.
INO Report for Booklet JA sugg Text.pmd 19/05/2005, 11:38 AM51

Improving the Investment Climate in Indonesia44
A major labor-related issue for Indonesian firms concerns minimum wage increases,which can seriously undermine the country’s competitiveness, especially if theseincreases are not followed by greater productivity. The amount of the minimum wagein rupiah per month is now higher than its peak precrisis level. Labor unions, however,consider the increase in minimum wage as nominal, given the rise in the cost of livingsince the start of the crisis. Sudjana (2002) contends that despite the increase in nominalvalue of minimum wages, real wages have remained stable.
Financing
Easy access to credit can spur firms to expand existing businesses or undertake newinvestments. A weak financial system, however, makes it difficult for firms to obtainfunds from formal financial institutions. Since the crisis, banks in Indonesia haveremained reluctant to extend loans. A higher percentage of firms in Indonesia than in thePhilippines regard financing costs for working capital needs or for new investments, andaccess to such finance, as major or very severe obstacles (Table 15). Bank financingaccounts for only 15% of the working capital of Indonesian firms, lower than those inthe PRC and Bangladesh (Table 16). With limited bank financing, Indonesian firms relyon internal funds as an important source of financing for their working capital needs andnew investments. Internal funds account for around 38% of financing for Indonesianfirms, higher than in the PRC. Tight credit procedures, along with high interest rates,have prompted Indonesian firms to rely more on internal funds. Firms admit that
Constraints Bangladesh PRC Pakistan Philippines Indonesia
Access to Financing 41.5 24.1 37.5 13.5 17.5
Cost of Financing 49.8 21.6 42.6 23.0 28.5
Table 15 Constraints to Financing inIndonesia—An International Perspective (%)
Note: Calculated as a share of firms having major or very severe constraints in
Financing.
Sources: Investment Climate and Productivity Study, 2003; World Bank and Bangladesh
Enterprise Institute (2003).
Indicator Bangladesh PRC Pakistan Philippines Indonesia Sources for Working Capital
Retained Earnings 55.6 13.1 65.4 61.7 38.1 Banks and Other Financial Institutions 33.5 26.8 5.1 8.9 15.0 Trade Credit 4.2 2.3 4.6 11.6 3.5 Equity 0.5 3.3 12.7 6.1 1.4 Informal Sources 0.5 1.9 1.3 1.1 7.6 All Others 5.8 – 10.9 11.2 33.7
Sources for New Investments Retained Earnings 59.9 15.2 55.6 16.4 41.9 Banks and Other Financial Institutions 29.7 20.9 6.2 3.8 18.0 Trade Credit 2.6 1.0 1.7 2.3 2.8 Equity 0.4 3.0 14.1 1.2 1.3 Informal Sources 0.3 1.8 2.6 0.2 6.7 All Others 7.1 — 15.4 4.5 29.3
Table 16 Sources of Finance for Firms—An International Perspective (%)
Note: — = not available.
Sources: Investment Climate and Productivity Study, 2003; World Bank and Bangladesh Enterprise
Institute (2003); Investment Climate Survey Online,
World Bank (http://econ.worldbank.org/programs/21168/topic/23907/).
INO Report for Booklet JA sugg Text.pmd 19/05/2005, 11:38 AM52

45
negotiations on collateral and loan rates with banks have become more difficult in theaftermath of the crisis (Agung et al. 2001). Banks are now more careful in examiningborrower information prior to any loan approval. Provision of loans is also held back bybanks’ poor capitalization, increasing nonperforming loans, and perceptions amongbanks of high credit risk in the business sector. Although bank financing in Indonesiahas been limited in recent years, some progress has been made in restructuring thecountry’s financial system. Sound developments include the sale by the Government ofsome banks that it acquired during the crisis and a decrease in government shareholdingsin state-owned banks, which enhanced the private sector’s role in banking. With thelimited amount of bank lending, Indonesian firms are compelled to find other forms offinancing as internal funds alone are insufficient. Informal financing and other sourcesaccount for around 40% of working capital and 30% of new investments—much higherthan in other countries in the region.
V. Conclusions and Policy Implications
Indonesia has achieved macroeconomic stability but with only low investment, and thecurrent gradual recovery has been driven mainly by consumption. Recent economicgrowth of 4–5% per year is not enough to significantly increase per capita income,accommodate the increasing number of new entrants to the labor market, and reducepoverty. Increasing the level of investment is critical, but this is a daunting challengegiven that investor confidence in the economy remains particularly low. A key steptoward increasing investment and achieving high growth is to improve the investmentclimate. The Indonesian Government has acknowledged the weaknesses surroundingthe investment climate and has introduced several reform initiatives to improve it.
Despite the initiatives, the ICS indicates that the following major issues still need to beaddressed:
• Macroeconomic instability, economic and regulatory policy uncertainty, andcorruption are the most severe business obstacles affecting Indonesian firms.
• Access to formal financing is a major problem among firms, particularly formedium firms.
• Electricity is the main concern among infrastructure problems.• Labor regulations are a serious concern to firms, more so than labor skills.• Decentralization has led to a deterioration in the business climate, especially in
terms of a worsening of economic and regulatory policy uncertainty and corruption.
Key findings from the cross-country comparisons indicate that:• More firms in Indonesia are concerned over key investment climate constraints
than in other countries in the region.• The most severe constraints affecting Indonesian firms all have to do with overall
uncertainty.• Key governance indicators are also weak, and starting up and closing a business
take longer and are costlier in Indonesia.• Among the countries in the Global Competitiveness Report, Indonesia has one of
the poorest rankings in the extent of bureaucratic red tape. Excessive regulations
INO Report for Booklet JA sugg Text.pmd 19/05/2005, 11:38 AM53

Improving the Investment Climate in Indonesia46
raise business transaction costs and unduly discourage investments, leading tocorruption.
• While fewer firms in Indonesia relative to the Philippines and the PRC findtelecommunications to be a major or very severe constraint, Indonesia is laggingbehind the other two countries in terms of access to telephones and the number ofdays to acquire telephone lines.
• Financing costs and access have become more problematic, making bank financingless popular than other sources of financing.
• Indonesia appears to have more restrictive labor regulations than other countriesin the region. Among the key concerns of Indonesian firms with respect to laborregulations are hiring and firing procedures and wage setting.
On a positive note, somewhat fewer firms in Indonesia than in most other regionalcountries consider infrastructure and telecommunications to be a major or very severeobstacle, even though the country still lags behind some other ASEAN countries in thisarea. Fewer firms in Indonesia than elsewhere—in fact, the lowest rate among selectedADCs—consider customs and trade regulations to be a major or very severe constraint.
Based on the ICS results some important policy implications can be drawn, particularlyin the areas of institutional reform, infrastructure, and incentives.
First, the country should undertake institutional reform in key areas. Institutionalproblems create uncertainty, unnecessary red tape, and bureaucratic burdens, hinderingthe process of setting up and running businesses in Indonesia. These problems also sendalarm signals to potential investors, further reinforcing the need for institutionalreforms.
The Government needs to provide assurance on contract enforcement and propertyrights, and to uphold policy credibility and consistency. The current efforts ofestablishing a “one-stop” investment service and improving the existing investment laware positive developments that should be followed by bolder and more comprehensivepolicies, such as streamlining the local and central governments’ roles in investmentprocedures.
The experience of decentralization shows that some local governments are ill-equippedto assume their new and expanded role. Consequently, there is a need to improve thecapacity of local governments. More efficient arrangements for sharing investment-related responsibilities between local and central governments are also important,including investment licensing and regulations. A better budget allocation betweenlocal and central governments is also necessary to ensure that local governments havesufficient resources to undertake their new responsibilities and to stop them resorting tonuisance taxes and retributions.
The introduction of a competition commission (based on the Anti-Monopoly Law No.5/1999) affirms the Government’s commitment toward promoting competition. Toeffectively carry out its mandate, the commission is expected to adhere strictly to thelegal system and should practice fairness, credibility, and transparency in enforcing the
INO Report for Booklet JA sugg Text.pmd 19/05/2005, 11:38 AM54

47
law. Since the commission covers a broad area of responsibility, it needs to identify areasof immediate interventions with most significant potential impacts.
Second, the availability of adequate physical infrastructure for setting up and runninga business on a daily basis is critical to attract new investment and to ensure thecontinuity of ongoing investment projects. Power outages, transport failures, andinadequate water supply have caused losses among the firms surveyed, stalling theirbusiness operations. The power interruptions have also prompted firms to rely onprivate generators to provide a more reliable power service. This is, however, a costlysolution for businesses trying to compete globally.
Indonesia has yet to make real strides in ICT to access valuable information in real time,speeding up its communications and broadening its markets. This is in contrast toASEAN countries, which have increasingly been maximizing their use of ICT.
It is clear, then, that the Government must solve these current infrastructure bottlenecksto avert a potential crisis in the future, and examine areas where start-up connections toinfrastructure services are deficient.
The December 2004 annulment of Electricity Law No. 20/2002 by the ConstitutionalCourt, on the grounds that the concepts of sector unbundling and competition wereincompatible with the Constitution, has created major uncertainty about the futuredirection of reform. A revised electricity law, which takes into account the ConstitutionalCourt’s concerns, should therefore be actively pursued to encourage private sectorinvestment, foster competition, and achieve better service delivery.
Lastly, Indonesia might have to introduce a new package of incentives and to sendpositive signals in order to win over both foreign and domestic investors’ confidence.The incentives should be made available on equal terms to both domestic and foreigninvestors. In the decentralization era, however, there is a risk that competition inattracting FDI among local governments may cause them to offer incentives that maywell exceed the benefits. Accordingly. the incentive system should fit a comprehensiveframework that adequately uses the country’s (or region’s) comparative advantage andmaximizes its competitiveness.
References
Agrawal, Nisha. 1995. Indonesia: Labor Market Policies and InternationalCompetitiveness. World Bank Working Paper 1515, Washington, DC.
Agung, Juda, Bambang Kusmiarso, Bambang Pramono, Erwin Hutapea, AndryPrasmuko, and Nugroho Joko Prastowo. 2001. Credit Crunch in Indonesia in theAftermath of the Crisis: Facts, Causes and Policy Implications. Directorate ofEconomic Research and Monetary Policy, Bank Indonesia.
Akhtar, Shamsahd. 2003. Indonesia: Issues and Constraints Surrounding InvestmentClimate. Southeast Asian Department, Asian Development Bank, July.
INO Report for Booklet JA sugg Text.pmd 19/05/2005, 11:38 AM55
Improving the Investment Climate in Indonesia48
Brojonegoro, Bambang P.S. 2003. “Business climate in the decentralization era”. Paperpresented at the Indonesia Updates 2003: Business in the Reformasi Era: NewChallenges, Old Problems”. Australian National University, 26–27 September.
Hill, Hal, and Thee Kian Wie. 1998. Indonesia’s Technological Challenge. Singapore:Institute of Southeast Asian Studies.
Islam, Iyanatul and Suahasil Nazara. 2000. Minimum Wage and the Welfare ofIndonesian Workers. Occasional Discussion Paper Series No. 3. InternationalLabour Organization, Jakarta.
Kauffman, Daniel, Aart Kraay, and Massimo Mastruzzi. 2003. Governance Matters III:Governance Indicators for 1996–2000. World Bank, Washington, DC.
Kim, Wan–Soon. 2000. “Attracting Foreign Direct Investments in Korea.” InDevelopment Centre Seminars: Sustainable Recovery in Asia Mobilising Resourcesfor Development, co–edited by the Asian Development Bank and Organisation forEconomic Co–operation and Development. Paris: OECD.
Kompas. 2004. Monitoring Committee on the Implementation of Regional Autonomyof the Indonesian Chamber of Commerce and Industry (Otonomi Daerah CenderungMenghambat Pelayanan Investasi—Decentralization Tends to Hinder InvestmentServices). 5 February.
Saget, Catherine. 2001.Poverty Reduction and Employment in Developing Countries:Do Minimum Wages Help? International Labour Review, Vol. 140(3):237–269.
Schroeder, Marie–Christine, and Kevin Sidharta. 2003. “Upholding bankruptcylegislation: Five years of Court Performance on Indonesian Bankruptcy Law.”Paper presented at the Indonesia Updates 2003: Business in the Reformasi Era: NewChallenges, Old Problems”. Australian National University, 26–27 September.
Social Monitoring and Early Response Unit (SMERU). 2001. Wage and EmploymentEffects of Minimum Wage Policy in the Indonesian Urban Labor Market. SMERUResearch Institute, Jakarta.
Stern, Nicholas. 2002. A Strategy for Development. Washington, DC: World Bank.Sudjana, Brasukra. 2002. Voices of the Private Sector: Assessment of a Changing
Environment. UNSFIR Working Paper 02/10, Jakarta, September.Sullivan, Sean. 2000. “Best Practices for Promoting Private Sector Investment in
Infrastructure.” In Development Centre Seminars: Sustainable Recovery in AsiaMobilising Resources for Development, co–edited by the Asian Development Bankand Organisation for Economic Co–operation and Development. Paris: OECD.
United States Trade Representative. 2003. National Trade Estimate Report on ForeignTrade Barriers. Available: http://www.ustr.gov/assets/Document_Library/Reports_Publications/2003/ 2003_NTE_Report/asset_upload_file586_6204.pdf.
Usman, Syaikhu, Nina Toyamah, M. Sulton Mawardi, Vita Febriany, and Ilyas Saad.2002. Regional Autonomy and the Business Climate: Three Kabupaten CaseStudies from West Java. SMERU Research Institute, June.
World Bank and Bangladesh Enterprise Institute. 2003. Improving the InvestmentClimate in Bangladesh. World Bank, Washington, DC. Available: http://econ.worldbank.org/programs/21168/topic/23907/.
World Economic Forum. 2004 and 2003. The Global Competitiveness Report 2003–2004 and 2002–2003. New York: Oxford University Press.
INO Report for Booklet JA sugg Text.pmd 19/05/2005, 11:38 AM56