improving the science process skills ability of science student
TRANSCRIPT
Eurasian J. Phys. Chem. Educ. 3(1):26-38, 2011
journal homepage: http://www.eurasianjournals.com/index.php/ejpce
26
Improving the Science Process Skills Ability of Science Student Teachers Using I Diagrams
Sevilay Karamustafaoğlu* Faculty of Education, Amasya University, Amasya, Turkey
Received: 30 November 2010 – Revised: 19 January 2011 – Accepted: 21 January 2011 Abstract This study was carried out to identify the level of Science and Technology student teachers’ science process skills and to determine how efficient I diagrams are in developing these skills. The corpus of the study was consisted of 40 science and technology student teachers who were having Instructional Technologies and Material Design course during the 2009-10 academic years at Amasya University, Faculty of Education. The study was conducted as a basic experimental design. A science process skills test was applied on the student teachers as pre-test and post-test, then the points they got from each test were compared. During the study, the student teachers developed I-diagrams on science topics with the guidance of their supervisors. The results revealed that the student teachers had problems with the pre-tests, and especially with the integrated process skill. At the end of the study it was observed that the student teachers’ skills on developing I-diagrams were increased as well as their integrated process skills problems were disappeared. Accordingly, it was concluded that I-diagrams were important for the acquisition and development of science process skills.
Keywords: Scientific Process Skills, Science Education, I Diagram
Introduction Inquiry-based activities have been using in science classrooms at all educational levels.
Science process skills are beneficial in that students can realize by participating in inquiry in the science laboratory. Science process skills are inseparable in practice from the conceptual understanding that is involved in learning and applying science. Classroom studies on scientific reasoning have centered on the basic and integrated science process skills over the past three decades; many researchers have focused their attention on these skills (Germann & Aram, 1996a; Harlen, 1999; Brotherton & Preece, 1995). Basic science process skills are (BSPS): Observing, classifying, measuring, and predicting. These skills provide the intellectual groundwork in scientific inquiry, such as the ability to order and describe natural objects and events. The ability to use BSPS is attributed to the ability to perform empirical-inductive reasoning or Piagetian concrete operational reasoning (Beaumont-Walters & Soyibo; Germann & Aram, 1996a; Eilam, 2002). Integrated Science Process Skills (ISPS): identifying and defining variables, collecting and transforming data, constructing tables of data and graphs, describing relationships between variables, interpreting data, manipulating materials, recording data, formulating hypotheses, designing investigations, drawing conclusions and generalizing. The ISPS are the terminal skills for solving problems or doing
*Correspondence Author: Phone: +90 358 2526230 Fax: +90 2526222 E-mail: [email protected]
ISSN: 1306-3049, ©2011
Karamustafaoğlu
27
science experiments. The ability to carry out ISPS is attributed to hypothetico-deductive reasoning (Piaget’s formal operational reasoning; Beaumont-Walters, & Soyibo; Germann & Aram, 1996a; Huppert, Lomask & Lazarowitz, 2002).
Science process skills are special skills that simplify learning science, activate students, develop students’ sense of responsibility in their own learning, increase the permanency of learning, as well as teach them the research methods (Carey, Evans, Honda, Jay & Unger, 1989; Korkmaz, 1997; Karamustafaoğlu, 2003). Besides, they are the thinking skills that we use to get information, think on the problems and formulate the results. They are also the skills that scientists use in their studies. According to Bredderman (1983), they are cognitive skills which are used to understand and develop the information. These skills are appropriate for all science fields, and they reflect on the correct behaviours of scientists while they are solving a problem and planning an experiment. They also constitute the essence of the thinking and research within science. It is more important for the students to learn how to apply science than learning reality, concepts, generalizations, theories and laws in science lessons. Therefore, it is necessary for them to pick up the habit of science process skills. These skills are considered to be efficient in learning and teaching, engage a significant place in various countries’ teaching programs. Such as ‘Science-A Process Approach’ (SAPA) developed by the American Association for the Advancement of Science between 1963 and 1974. In this approach, the teaching of science process skills was specifically focused on in elementary and high school science curricula (Preece & Brotherton, 1997).
The studies on developing programs on teaching these skills to students efficiently began in 2000s in Turkey. It was highlighted that these skills should be included in the teaching programs. When the acquisitions of the students who are having the Elementary Science and Technology Program were investigated by the researchers it was found that the skills such as predicting, hypothesizing, identifying and controlling the variables and recording the data were not sufficient (Taşar, Temiz & Tan, 2002). In order to have them to acquire the related skills, the teachers who are conducting these lessons should also have these skills. When the teachers have and believe in the effectiveness of these skills it will be much easier for the students’ acquisition and habit-formation.
At research based science labs, the development of science process skills enable students to construct and solve problems, critical thinking, deciding and finding answers to their curiosity, rather than having the students to memorize the concepts (Rehorek, 2004; Germann & Aram, 1996b). Science process skills construct the framework of research based lab applications. With the research based lab activities, students are able to learn meaningfully, use science process skills and familiarize with the process of how they construct the information they got at science lessons. The problems solved in this way enable the apprehension of scientific method and process skills. In order for the research based science labs to be impressive, effective lab environment should be developed. In the studies carried out for the efficacy of lab applications, it was determined that the advantages stated above were not accessed, and that the students couldn’t use the science process skills during lab applications and couldn’t acquire meaningful learning experience (Hoffstein & Lunetta, 1982; Nakipoğlu & Meriç, 2000; Nakipoğlu, Benlikaya & Karakoç, 2001).
In his study on the efficiency of labs as a learning environment, Nakhleh (1994) evaluated the efficiency of lab applications in terms of the Constructivist Learning Theory. According to the findings of this study, students couldn’t configure their knowledge during the lab applications and couldn’t achieve meaningful learning. He explained this finding that the students and teachers were affected by the lab environment prepared by the others and this complex environment led them to memorize rather than to learn.
Eurasian J. Phys. Chem. Educ. 3(1):26-38, 2011
28
Therefore, in science education through scientific research, teachers have the mission for facilitating the necessary learning environment such as active participating, integration to life, meaningful learning, developing science process skills, taking responsibility of their own learning. For this purpose, several approaches, methods, techniques and materials which are considered to be effective by many educationalists have been advised. One of these materials is I-diagrams.
Inspired by Gowin’s Vee diagrams, I-diagrams were developed by Philips and Germann (2002). I-diagrams are the materials of application and evaluation that enable the students to comprehend the scientific researches thoroughly and organize the experimental activities which used science process skills. It aims to help students and teachers to run the research correctly, to connect the research question with the daily life, to uncover the previous knowledge of students, and to transfer to a new research question at the end of research.
As stated above, the most effective person that enables students to gain science process skills is the teacher. It is crucial for the teachers and student teachers to acquire these skills at the desired level. Science student teachers of the future who educate their students with these skills will help to grow up the future’s scientists.
Purpose This study has two purposes. The first is to identify the level of science process skills of
student teachers, and the second is to determine how efficient the I-diagrams are in developing the student teachers’ science process skills.
Research Questions (1) Is the level of performance of some science student teachers on a SPST (Science
Process Skill Test) satisfactory or not?
(2) What are the factors that influence the skills to develop the I-diagrams, and the points they have difficulty in this process? Science student teachers develop the skills I diagram of the factors affecting and what are the difficult points in this process?
(3) What is the efficiency of developing and using I-diagrams in the acquisition of science process skills?
Method
In this study, a basic experimental study using pre test and post test was designed.
Sample In this study, 40 science and technology student teachers participated. They are at the 3rd
grade, having Instructional Technologies and Material Design course during the 2009-10 academic years, fall semester at Education Faculty of Amasya University.
Instrumentation and Analysis Science Process Skill Test (SPST): SPST was used to identify the extent to which the
student teachers have science process skills before the study, and how far they are able to apply these skills, as well as the extent to which they acquired the skills related to the development of I-diagrams.
The science process skills test which was developed by Enger ve Yager (1998) was translated into Turkish by the researchers, and was applied to 300 students with similar
Karamustafaoğlu
29
characteristics to provide the reliability of the study. After excluding the items whose reliability was low with the ITEMAN program, the test got its last version with 31 items.
The content reliability of the test was justified according to the views of the scholars, and KR-21 reliability coefficient was found to be 0.81. The test consists of 31 items; the questions cover 2 observations, 3 classifications, 6 assessments and using numbers, 3 space-number relationships, 3 predictions, 3 controlling the variables, 2 data interpretations, 3 hypothesizes, 2 experimentations, and 4 deductions. This test was applied to the student teachers as pre-test and post-test. The findings were presented within tables after the calculation of means and the standard deviation of student teachers’ answers for pre-test and post-test. Also, the answers given for each answer and for each science process skill on the pre and post test were examined one by one, and their frequencies and percentages were presented within the tables.
Procedure The study was carried on during the Instructional Technologies and Material Design
course which covers 2 theoretical and 2 application hours. In this course the students are aimed to gain the knowledge and skills on developing, application and evaluation of teaching materials. In the first step of the study SPST was applied as the pre-test, and then analyzed to determine how fat the students know and can apply science process skills. Then, the information on how the I-diagrams developed by Phillips and Germann in 2002 were organized, how and for what purpose they were used in teaching and their advantages and disadvantages were instructed by the supervisors during the eight hours were taught to the student teachers.
The developmental steps of I-diagrams were summarized below:
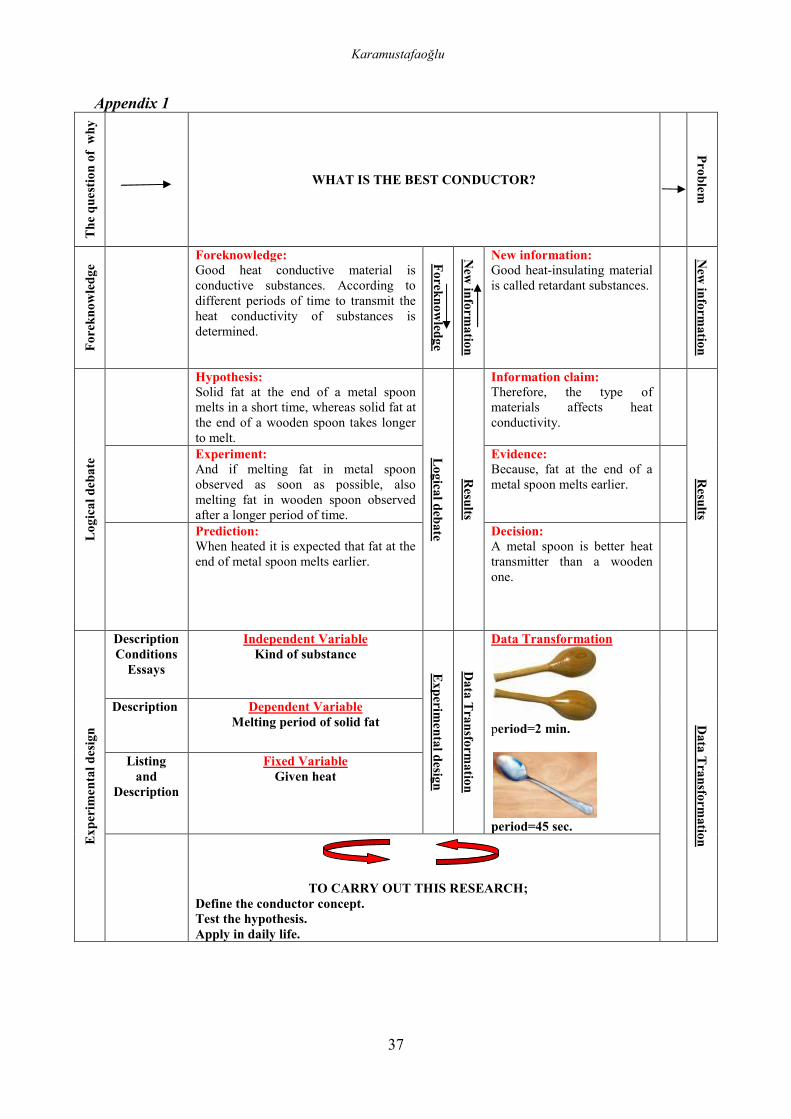
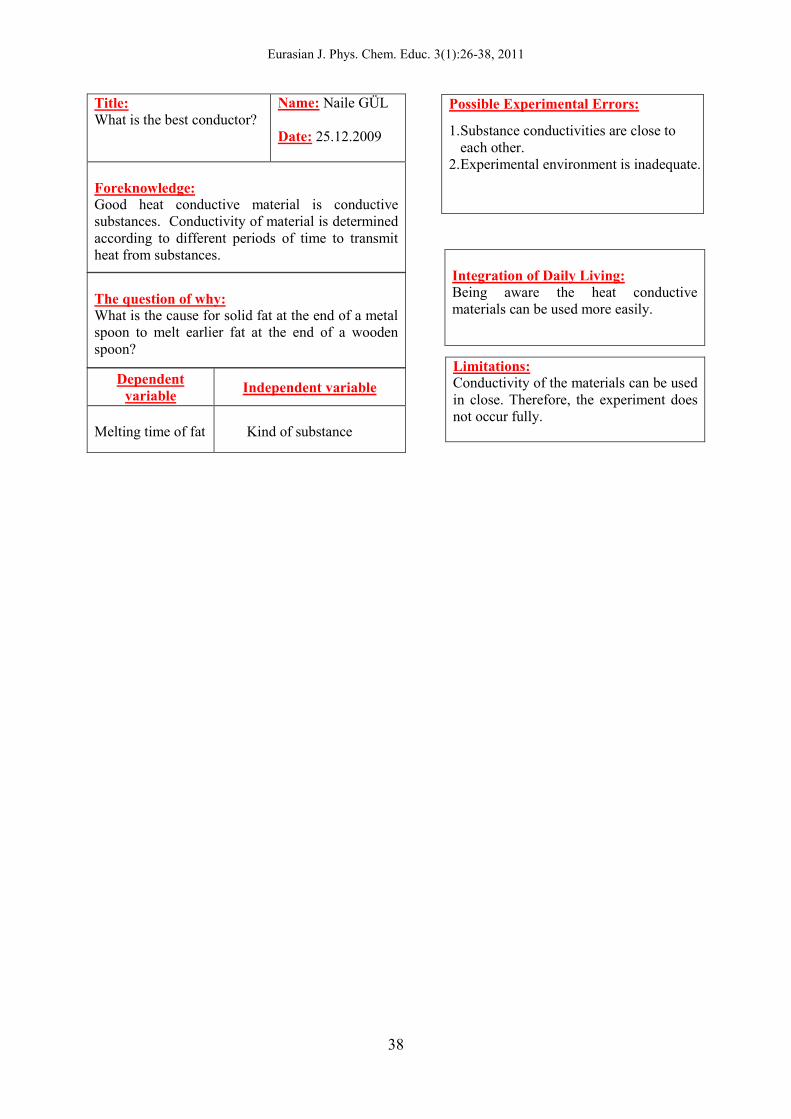
I-diagrams consist of two pages (see Appendix–1). The first page of the material included sections that covered the steps of scientific research, and the second part included the tables to record the notes related to the current research and the experimental drafts for further research.
Since the first page’s shape resembles the letter ‘I’ this material is called the I-diagram. The left part of the diagram whose middle section in the first page is in the shape of ‘I’ is organized to include the planning and theoretical side of the research while the right part includes the method. In the main part, there are arrows which help the students to follow while making research. The arrows are top down at the left part, and bottom-up at the right part. Students who follow these arrows respectively design and complete their research. Above ‘I’ there is a research question which was raised from the question ‘why’. In the main part of ‘I’, there are sections answering to the research questions such as foreknowledge, logical debate (hypothesis, experiment, prediction), experimental design (dependent, independent and control variables), process steps (occurring independent variables, recording the answers of dependent variables, experiments and manipulations), collecting data (tables), transforming the data (calculations and graphics), results (claims on knowledge, evidence and decision) and new knowledge (new experience and research).
The causative questions that form the fundamental question that guides the research and information and applications related to this question are also included. Asking questions requires high level skills. Students who make use of ‘I' devise, begin the work with asking the correct and meaningful questions which will direct their scientific research. After that they revise their previous knowledge related to the questions they asked. In the logical discussion part, related to the answer of the research question, the students develop testable hypotheses based on their experience. Later, they are able to predict about how they realize the

Eurasian J. Phys. Chem. Educ. 3(1):26-38, 2011
30
experiment easily. In the experimental design section, the variables of research are determined. In this way, the students design and do the experiment by taking into account the hypothesis and the variables in it. The left side of ‘I’ devise that covers the methodological part begins with the data collection part. The experimental data gathered from the assessments and observation during the experiment is recorded in this part.
The transformation of the collected data into the graphics, mathematical calculations and equations and other operations were performed at this stage. In this way, the data that answer the research question are formed. In the conclusion part of ‘I’ devise, the students comment on the data that they got from the experiments they did to test the experiments and transformed to the correct form. The hypothesis is either justified or refuted based on these conclusions. Another alternative is to re-plan the design, apply it and to come up with conclusions by changing the hypothesis. If the results of their research justify the hypothesis, the students prove their knowledge. They decide on the result of their research based on their proof. In the new information section of the upper part of the left side, the students account for the new information and experience that they have learnt from their research. The tables in the back page of I diagram focus on the experimental process and results that direct the students towards a new research design by making use of the information obtained from the research. These tables are in the form of two columns. At the top of the left table one can find information about the student, date and research title, and at the bottom one can find the previous knowledge, the why question and the dependent and independent variables. The right column includes the potential experiment errors and limitations section where the learners write the limitations of the experiments and list their experiment errors to avoid from their previous mistakes. The most important step of I diagrams is the daily life integration level which places under this column and shows how to relate and integrate the new information to the daily life. After completing this process, in four lesson hours, science and technology student teachers were given the I-diagrams which were previously developed by the lecturer to examine and evaluate. In this way, the student teachers are helped to improve their I-diagram developing skills.
After this step, for the group work study, 8 groups were formed by the student teachers, each containing 5 students. Each group decided on a topic to develop an I-diagram for the Primary 6th, 7th, and 8th grade Science and Technology lesson. The topics focused on the ones which the primary students have difficulty in understanding and have conceptual errors. The student teachers were given some time to determine these conceptual errors, and to review the literature. At the end of this time, the topics were determined as ‘Matter and Heat’, ‘Physical Change’, ‘Chemical Change’, ‘Pressure’, ‘Food Chain’, ‘Grow and Evolution’, ‘Acids and Bases’ and ‘Electric’. Each group explicated their literature knowledge and the reasons of developing I diagrams related to their topics. After this step, the student teachers identified a problem statement about their topics. This problem statement was transformed into an interesting and intelligible ‘why’ question. The advance information that form a basis to the solution of these questions, and the related theories, principles, concepts, and if exists analogies were searched. Next, the hypothesis was determined, and the possible experiment results were predicted. Dependent, independent and the controlled variables which may influence the experiment were stated. The experiment and operation steps were performed as group work. Each group made the data intelligible by calculating and drawing tables and figures on the data they got from their experiments.
After data analysis, the groups arrived at a decision by presenting their experiment results with the proofs according to their knowledge assertions. The new information was related to the newly gained one, and new problems and questions were formed, so that the students become ready to order the first and the second pages of I diagrams. In the light of this
Karamustafaoğlu
31
information, the student teachers developed I diagrams and presented them to their friends. During the presentation, the I-diagrams were examined through the group discussions. The missing or problematic points were identified and some time was given to make the necessary corrections. After that the Science Process skill which was applied as pretest was applied as post test, and was analyzed.
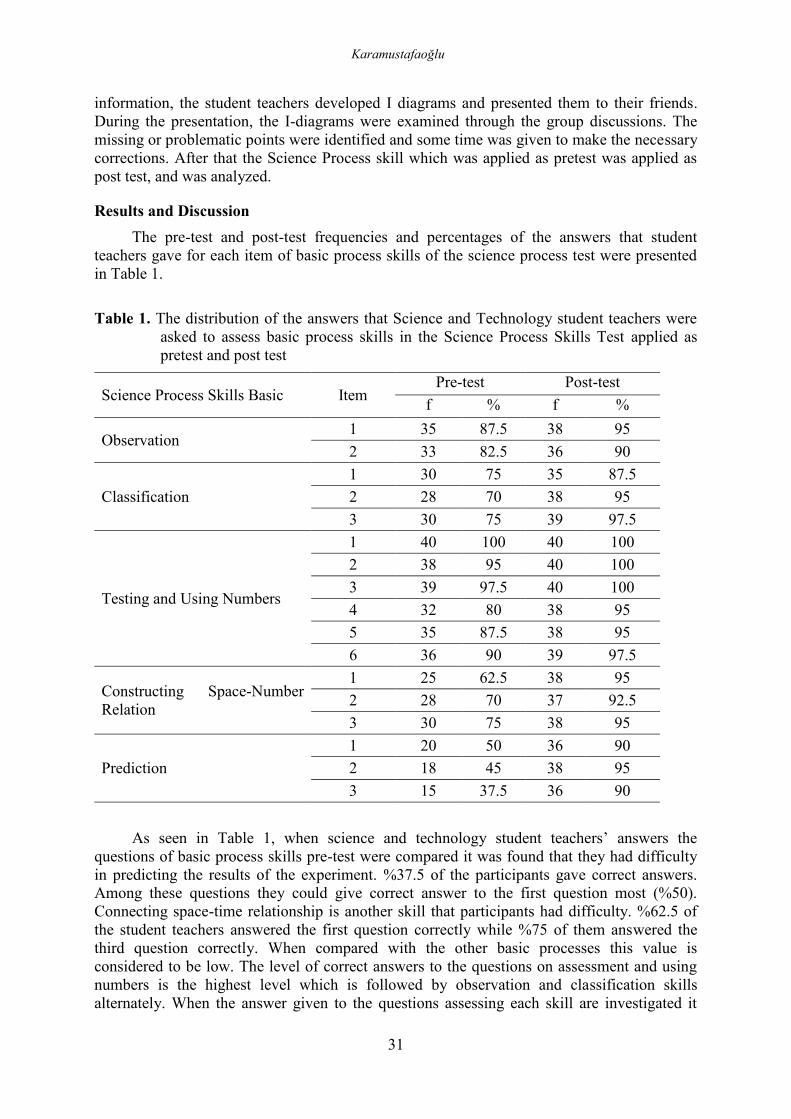
Results and Discussion The pre-test and post-test frequencies and percentages of the answers that student
teachers gave for each item of basic process skills of the science process test were presented in Table 1. Table 1. The distribution of the answers that Science and Technology student teachers were
asked to assess basic process skills in the Science Process Skills Test applied as pretest and post test
Science Process Skills Basic Item Pre-test Post-test
f % f %
Observation 1 35 87.5 38 95 2 33 82.5 36 90
Classification 1 30 75 35 87.5 2 28 70 38 95 3 30 75 39 97.5
Testing and Using Numbers
1 40 100 40 100 2 38 95 40 100 3 39 97.5 40 100 4 32 80 38 95 5 35 87.5 38 95 6 36 90 39 97.5
Constructing Space-Number Relation
1 25 62.5 38 95 2 28 70 37 92.5 3 30 75 38 95
Prediction 1 20 50 36 90 2 18 45 38 95 3 15 37.5 36 90
As seen in Table 1, when science and technology student teachers’ answers the questions of basic process skills pre-test were compared it was found that they had difficulty in predicting the results of the experiment. %37.5 of the participants gave correct answers. Among these questions they could give correct answer to the first question most (%50). Connecting space-time relationship is another skill that participants had difficulty. %62.5 of the student teachers answered the first question correctly while %75 of them answered the third question correctly. When compared with the other basic processes this value is considered to be low. The level of correct answers to the questions on assessment and using numbers is the highest level which is followed by observation and classification skills alternately. When the answer given to the questions assessing each skill are investigated it
Eurasian J. Phys. Chem. Educ. 3(1):26-38, 2011
32
was observed that the student teachers’ skills on observation, classification, assessment and using numbers at the desired level whereas their connecting space-time relationship and predicting skills are not adequate. The reason of this can be explained by the fact that predicting and connecting space-time relationship skills are more abstract than the others. Accordingly, one can conclude that the student teachers’ thinking skills such as interpreting, guessing the results of events, and predicting are not adequate. This finding is not surprising as the old Science Curricula and the programs of other lessons are teacher oriented programs which are not connected to the daily life and require the students to have good memorizing skills. The participants of this study were grown up with these programs. The questions of TIMMS Project were applied on the 8th graders in our country in 1999, and found that many skills of students including thinking and interpreting were not developed.
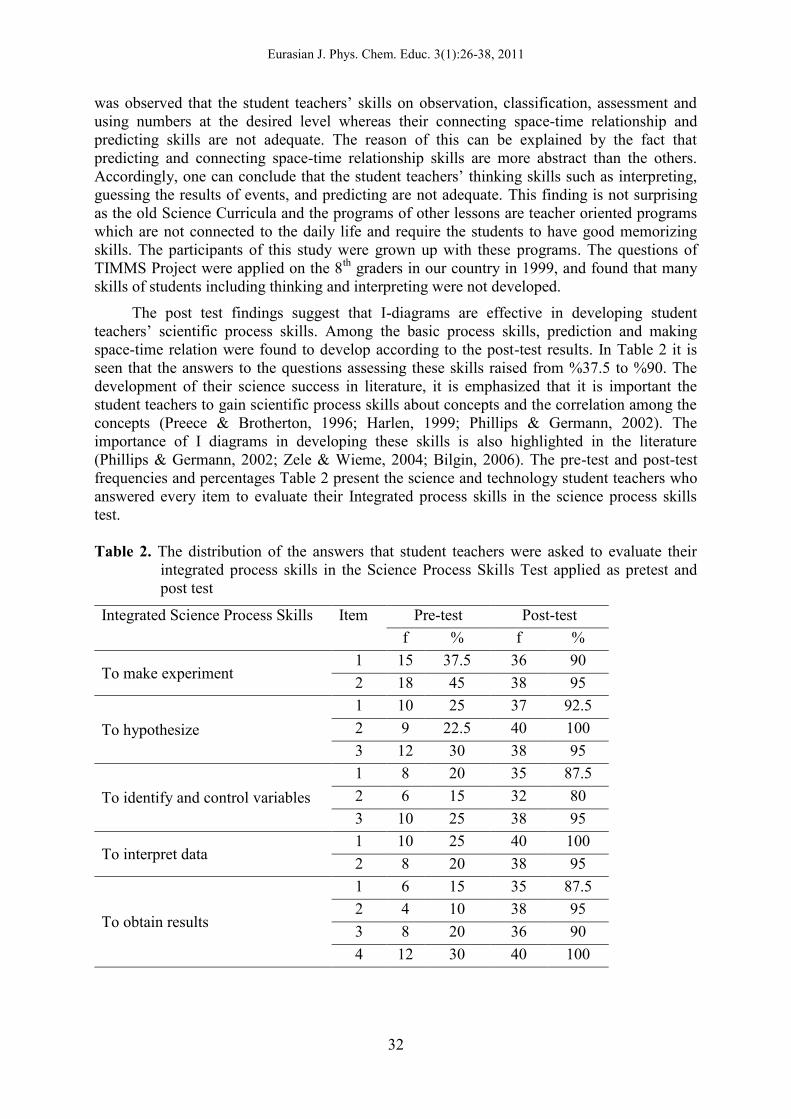
The post test findings suggest that I-diagrams are effective in developing student teachers’ scientific process skills. Among the basic process skills, prediction and making space-time relation were found to develop according to the post-test results. In Table 2 it is seen that the answers to the questions assessing these skills raised from %37.5 to %90. The development of their science success in literature, it is emphasized that it is important the student teachers to gain scientific process skills about concepts and the correlation among the concepts (Preece & Brotherton, 1996; Harlen, 1999; Phillips & Germann, 2002). The importance of I diagrams in developing these skills is also highlighted in the literature (Phillips & Germann, 2002; Zele & Wieme, 2004; Bilgin, 2006). The pre-test and post-test frequencies and percentages Table 2 present the science and technology student teachers who answered every item to evaluate their Integrated process skills in the science process skills test. Table 2. The distribution of the answers that student teachers were asked to evaluate their
integrated process skills in the Science Process Skills Test applied as pretest and post test
Integrated Science Process Skills Item Pre-test Post-test f % f %
To make experiment 1 15 37.5 36 90 2 18 45 38 95
To hypothesize 1 10 25 37 92.5 2 9 22.5 40 100 3 12 30 38 95
To identify and control variables 1 8 20 35 87.5 2 6 15 32 80 3 10 25 38 95
To interpret data 1 10 25 40 100 2 8 20 38 95
To obtain results
1 6 15 35 87.5 2 4 10 38 95 3 8 20 36 90 4 12 30 40 100
Karamustafaoğlu
33
As seen in Table 2 the student teachers were found not to comprehend or apply the integrated process skills thoroughly. According to the findings of pre-test, the skills in which the student teachers are least successful are hypothesizing, identifying and controlling the variables, and interpreting data. Making experiment is their most successful skill among the integrated science process skills. However, when this skill is compared with the basic process skills it is seen that they are not adequate in this field, either. When the answers related to the skills on inference and determining and controlling the variables are examined the percentages are seen as %10 and %15 respectively. Experimenting skill is at the highest level with %45. When the pre-test basic process and integrated process skills are compared it can be stated that the student teachers are not as successful in incorporated process skills as they are in basic process skills. It is thought provoking to see that the students at second level in primary schools didn’t have such skills.
When the data obtained from the pre-test was examined it is seen that the skills which the students have trouble most are the upper level, namely, integrated skills. The student teachers were found not to be in the desired level on hypothesizing, determining on the experiment, identifying and controlling the variables that influence on the experiment, commenting on the data and concluding. There also found deficiencies on predicting and contacting space-time relationship skills which are also basic process skills.
As stated above, the programs applied in our country before 2000 were teacher oriented that made use of the narrative method and did not give enough place to the labs. Therefore, it is an expected situation to observe student teachers with inadequate skills who were educated under such a teaching mentality.
When the post-test findings were evaluated it was found that the participants improve the skills that they were not succeeding in pre-test. They answered correctly %95 of the inference and interpreting data skill, %90 of the determining and controlling the variables skill, and %100 of the hypothesizing skill. This finding shows that the application realized with the I-diagram is effective. They not only succeeded in basic process skills but also in developing the integrated processes. It is right to state that I diagrams are effective in learning conceptually as well as acquiring science process skills and forming as behavior.
Some problems were seen in the previous studies on students and student teachers about teaching and improving the integrated process skills, but at the same time these problems were eliminated in these studies with the I-diagrams. (Şimşek, 2010; Ateş, 2005; Bowen & Roth, 1999).
Conclusions and Implications For the past several decades, science educators have focused attention on the basic and
integrated science processes. Science process skills are crucial for meaningful learning; because learning continues throughout the life, and individuals need to find, interpret, and judge evidences under different conditions they encounter. Therefore, it is essential for the students’ future to be provided with science process skills at educational institutions (Harlen, 1999). If these skills are not developed sufficiently, students cannot interpret the knowledge. For example, if the related evidence is not collected, collected concepts will not help students to understand what takes place (Tobin, Kahle & Fraser, 1990). For this reason, the basic target in science classes should be teaching students how to attain knowledge rather than passing the convenient knowledge.
The related literature reveals that studies on science process skills have begun to be studied from 1960s, and become widespread in our country in 1990s and 2000s. Besides, in
Eurasian J. Phys. Chem. Educ. 3(1):26-38, 2011
34
1999, in the study of TIMMS, the subfield of science was also defined, and an examination was prepared consisting of three fields, and 38 countries translated and applied this examination to their student samples. The study was not restricted to the examination; in order to compare the participated countries more comprehensively, data were collected through questionnaires from students, and through lesson applications from teachers and other administrative.
When the questions were examined it was found that there is great importance in assessing the science process skills. Turkey was the 33rd of 38 countries, and was below the international mean with a significant difference as a result of the statistical comparison. It was found that the students in our country don’t have the eight skills. Among these skills science process skills stands in the first rank. Therefore, in the year 2000, a new science and technology teaching program was developed and applied bearing in mind the fact that the students should be more active. On the other hand, in 2004, the science and technology teaching program was improved as the science process skills was thought to be inadequate in terms of the nature of science and Science-Technology-Society relationship. One of the fundamental goals of this program is to bring up individuals with science literacy. However, the teachers who bring up science literate individuals should also have the skills that require science literacy. It is easier for the individuals who make the habit of science process skills to get their students to comprehend the science process skills. It is a real problem to teach these skills to those who have brought up with teacher oriented program and don’t have these abilities. However, with the help of I diagrams which were argued to be effective (Phillips & Germann, 2002) in the present study, were developed by the student teachers related to some areas of science. Here, the aim is to enable the student teachers to comprehend the relevant subjects and concepts well, and to realize the development and application of science process skills which constructed the main aim of the study. The findings show that we attained this aim. Accordingly, it is concluded that the student teachers have acquired and improved the science process skills when I-diagrams are developed towards science topics and concepts.
It is highly recommended that in order for the teachers to acquire and give importance to these skills, studies on I diagrams should be done in in-service courses and implementations should be done on the importance of science process skills. Similarly, it is advised to the teachers to use I-diagrams in their lessons to teach and improve their students’ science process skills.
References Ateş, S. (2005). Öğretmen adaylarının değişkenleri belirleme ve kontrol etme yeteneklerinin
geliştirilmesi, GÜ Gazi Eğitim Fakültesi Dergisi, 25(1), 21-39. Beaumont-Walters, Y. & Soyibo K. (2001). An analysis of high school students’ performance
on five integrated science process skills, Research in Science & Technological Education, 19(2), 133-145.
Bilgin, İ. (2006). The effects of hands-on activities incorporating a cooperative learning approach on eight grade students’ science process skills and attitudes toward science, Journal of Baltic Science Education, 1(9), 27-37.
Bowen, G.M. & Roth, W-M. (1999). “Do-able” questions, covariation and graghical representation : do we adequately prepare preservice science teachers to teach inquiry? Pare presented at the Annual Meeting of the National Association for Research in Science Teaching, Boston, http:// search.ebscohost.com, retrieved date: 16.03.2010.
Karamustafaoğlu
35
Bredderman, T. (1983). Effects of activity-based elementary science on student outcomes: A quantitative synthesis. Review of Educational Research, 53,(4), 499-518.
Brotherton, P.N. & Preece, P.F.W. (1995). Science process skills: Their nature and interrelationships. Research in Science and Technological Education, 13(1), 5-11.
Carey, S., Evans, R., Honda, M., Jay E. & Unger, C. (1989). An experiment is when you try it and see if it works: A study of grade 7 students’ understanding of the construction of scientific knowledge. International Journal of Science Education, 11(Special Issue), 514-529.
Eilam, B. (2002) Phases of learning: ninth graders' skill acquisition. Research in Science and Technological Education, 20(1), 5-24.
Enger, S.K. & Yager, R.E. [Eds.] (1998). Iowa assessment handbook. Iowa City: Science Education Center, The University of Iowa.
Germann, P.J. & Aram, R.J. (1996a). Identifying patterns and relationships among the responses of seventh-grade students to the science process skill of designing experiments, Journal of Research in Science Teaching, 33(1), 79-99.
Germann, P.J. & Aram, R. J. (1996b). Student performances on the science processes of recording data, analyzing data, drawing conclusions, and providing evidence. Journal of Research in Science Teaching, 33(7), 773-798.
Harlen, W. (1999). Purposes and procedures for assessing science process skills. Assessment in Education: Principles, Policy & Practice, 6(1), 129-144.
Hofstein, A. & Lunetta, V.N. (1982). The role of laboratory work in science teaching: Neglected aspects of research. Review of Educational Research, 52(2), 20l-217.
Huppert, J., Lomask, S. & Lazarowitz, R. (2002). Computer simulations in high school: students' cognitive stages, science process skills and academic achievement in microbiology. International Journal of Science Education, 24(8), 803-821.
Karamustafaoğlu, S. (2003). “Maddenin İç Yapısına Yolculuk” ünitesi ile ilgili basit araç-gereçlere dayalı rehber materyal geliştirilmesi ve öğretim sürecindeki etkililiği, Yayınlanmamış Doktora Tezi, Fen Bilimleri Enstitüsü KTÜ, Trabzon.
Korkmaz, H. (1997). İlköğretim fen öğretiminde araç-gereç kullanımı ve laboratuvar kullanımı açısından öğretmen yeterlikleri. Yayınlanmamış Yüksek Lisans Tezi, Sosyal Bilimler Enstitüsü, Hacettepe Üniversitesi, Ankara.
Nakhleh, M.B. (1994). Chemical education research in the laboratory environment: How can research uncover what students are learning? Journal of Chemical Education, 71(3), 201-205.
Nakiboğlu, C., Benlikaya, R. & Karakoç, Ö. (2001). Ortaöğretim kimya derslerinde V-diyagramı uygulamaları. Hacettepe Üniversitesi Eğitim Fakültesi Dergisi, 21, 97-104.
Nakipoğlu, C. & Meriç, G. (2000). Genel kimya laboratuvarlarında V-Diyagramı kullanımı ve uygulamaları, Balıkesir Üniversitesi Fen Bilimleri Enstitüsü Dergisi, 2(1), 58-75.
Phillips, K. & German, P.J. (2002). The inquiry ‘I’ a tool for learning scientific inquiry. The American Biology Teacher, 64(7), 514-520.
Preece, P.F.W. & Brotherton, P.N. (1997). Teaching science process skills: Long-term effects on science achievement. International Journal of Science Education, 19(8), 895-901.
Eurasian J. Phys. Chem. Educ. 3(1):26-38, 2011
36
Rehorek J.S. (2004). Inquiry-Based Teaching: An example of descriptive science in action. American Biology Teacher, 66(7), 493-500.
Şimşek, C.L. (2010). Classroom teacher candidates’ sufficiency of analyzing the experiments in primary school science and technology textbooks’ in terms of scientific process skills, Elementary Education Online, 9(2), 433-445.
Tasar, M.F., Temiz, B.K. & Tan, M., (2002). An examination of the Turkish national middle school science curriculum from the perspective of fostering science process skills thorough its proposed aims, content, and teaching methods. Paper presented at the Fifth National Congress of Science and Mathematics Education, Middle East Technical University, Ankara, Turkey.
Tatar, N. (2006). İlköğretim fen eğitiminde araştırmaya dayalı öğrenme yaklaşımının bilimsel süreç becerilerine, akademik başarıya ve tutuma etkisi. Yayınlanmamış Doktora Tezi, Eğitim Bilimleri Enstitüsü, Gazi Üniversitesi, Ankara.
Tobin, K., Kahle, J.B. & Fraser, B.J. (1990). Windows into science classrooms: associated with higher–level learning (London, Falmer Press).
Zele, E.V. & Wieme, W. (2004). Improving the usefulness of concept maps as a research tool for science education, International Journal of Science Education, 26(9), 1043-1064.
Karamustafaoğlu
37
Appendix 1 T
he q
uest
ion
of w
hy
WHAT IS THE BEST CONDUCTOR?
Problem
Fore
know
ledg
e
Foreknowledge: Good heat conductive material is conductive substances. According to different periods of time to transmit the heat conductivity of substances is determined.
Foreknowledge
New
information
New information: Good heat-insulating material is called retardant substances.
New
information
Log
ical
deb
ate
Hypothesis: Solid fat at the end of a metal spoon melts in a short time, whereas solid fat at the end of a wooden spoon takes longer to melt.
Logical debate
Results
Information claim: Therefore, the type of materials affects heat conductivity.
Results
Experiment: And if melting fat in metal spoon observed as soon as possible, also melting fat in wooden spoon observed after a longer period of time.
Evidence: Because, fat at the end of a metal spoon melts earlier.
Prediction: When heated it is expected that fat at the end of metal spoon melts earlier.
Decision: A metal spoon is better heat transmitter than a wooden one.
Exp
erim
enta
l des
ign
Description Conditions
Essays
Independent Variable Kind of substance
Experim
ental design
Data T
ransformation
Data Transformation
period=2 min.
period=45 sec.
Data T
ransformation
Description Dependent Variable Melting period of solid fat
Listing and
Description
Fixed Variable Given heat
TO CARRY OUT THIS RESEARCH; Define the conductor concept. Test the hypothesis. Apply in daily life.
Eurasian J. Phys. Chem. Educ. 3(1):26-38, 2011
38
Title: What is the best conductor?
Name: Naile GÜL Date: 25.12.2009
Foreknowledge: Good heat conductive material is conductive substances. Conductivity of material is determined according to different periods of time to transmit heat from substances.
Possible Experimental Errors:
1. Substance conductivities are close to each other.
2. Experimental environment is inadequate.
The question of why: What is the cause for solid fat at the end of a metal spoon to melt earlier fat at the end of a wooden spoon?
Dependent variable Independent variable
Melting time of fat
Kind of substance
Integration of Daily Living: Being aware the heat conductive materials can be used more easily.
Limitations: Conductivity of the materials can be used in close. Therefore, the experiment does not occur fully.