improving the speed and quantitative performance for the …€¦ · · 2015-07-221 improving the...
TRANSCRIPT

1
Improving the Speed and Quantitative Performance for the Separation of Furans and the Passivator Benzotriazole in Transformer Oil AnalysisJane Cooper Waters Corporation, Manchester, UK
IN T RO DU C T IO N
Transformer oil is usually a highly-refined mineral oil and due to its stability
at high temperatures, it has excellent electrical insulating and heat transfer
properties. Because of these properties transformer oil has many uses including:
oil-filled transformers, high-voltage capacitors, fluorescent lamp ballasts,
high-voltage switches, and in circuit breakers.
Furanic compounds can originate from the thermal depolymerization of cellulose
solid insulation used within electrical equipment, which can then migrate into the
transformer oil.
Electrical and mechanical stresses and the presence of water and oxygen
increase the degree of cellulose degradation, eventually rendering the
transformer ineffective. These changes can occur either due to normal aging
or the presence of a fault.
Therefore an effective preventative maintenance program is critical to aid the
planning of system servicing and, as a result, reduce costly instrument downtime.
Periodic analysis of transformer oil for furans can be used to assess the degree
of depolymerization of the cellulose, which does not require taking the unit out
of service in order to take a sample.
Various additives can be incorporated into transformer oil to boost the quality of
the oil, for either short or long term. All additives present need to be declared,
therefore methodology to confirm the presence of declared additives, for example
the passivator benzotriazole (BTA) – but also to detect undeclared additives,
for example passivator Irgamet 301 – could be very valuable.
The presence of corrosive sulfur in transformer oil could potentially cause
expensive power transformer failures. Passivators2 (metal deactivators), such as
BTA, act as long term corrosion inhibitors when added to transformer oil. They
react with reactive metal surfaces both on metal surfaces and with dissolved
metals (copper and silver) therefore reducing the rate of reaction with other
compounds in the oil such as corrosive sulfur. But there are passivators, for
example Irgamet 30,1 that are not declared but are added to transformer oils
to temporarily boost the oils quality to aid the passing of acceptance testing,
therefore giving a false indication about the quality of the transformer oil.
WAT E R S SO LU T IO NS
ACQUITY UPLC® H-Class System
ACQUITY UPLC PDA Detector
ACQUITY UPLC BEH C18 Column
Xevo® TQ MS
MassLynx™ Software
Empower™ 3 Software
K E Y W O R D S
Furans, passivator, transformer oil
A P P L I C AT IO N B E N E F I T S
This application note illustrates increased
sample throughput for the identification and
quantification of furans and the passivator
benzotriazole in transformer oil offering:
■■ Reduction of solvent usage
due to reduced run times.
■■ Improved sensitivity, selectivity,
and robustness, compared with
existing methodologies.

2Improving the Speed and Quantitative Performance for the Separation of Furans and the Passivator Benzotriazole in Transformer Oil Analysis
Sample preparation
Transformer oil analysis
■■ 1-mL transformer oil was extracted
with 2 mL of acetonitrile for 1 min
using a vortex mixer.
■■ 100 μL of the acetonitrile layer were
transferred to an LC vial and diluted
with 900 μL water.
LC conditions
LC system: ACQUITY UPLC H-Class
Runtime: 4.00 min
Column: ACQUITY UPLC BEH C18
1.7 μm, 2.1 x 150 mm
Column temp.: 40 °C
Sample temp.: 10 °C
Mobile phase A: Water
(0.1% formic acid)
Mobile phase B: Acetonitrile
(0.1% formic acid)
Flow rate: 0.45 mL/min
Injection volume: 10.0 μL
Mobile phase gradient is detailed in Table 1.
UV conditions (for furans)
UV system: ACQUITY UPLC
PDA Detector
Range: 190 to 350 nm
Resolution: 1.2 nm
Sampling rate: 20 pts/sec
Filter time constant: Normal
MS conditions (for furans and the passivator benzotriazole)
MS system: Xevo TQ MS
Ionization mode: APCI positive
Corona current: 20 µA
Source temp.: 150 °C
APCI probe temp.: 400 °C
Desolvation gas: 1000 L/hr
Cone gas: 100 L/hr
Acquisition: Multiple Reaction
Monitoring (MRM)
Optimum UV absorbances were established for
each furan, detailed in Table 2, for the analysis
of furans.
E X P E R IM E N TA L
3Improving the Speed and Quantitative Performance for the Separation of Furans and the Passivator Benzotriazole in Transformer Oil Analysis
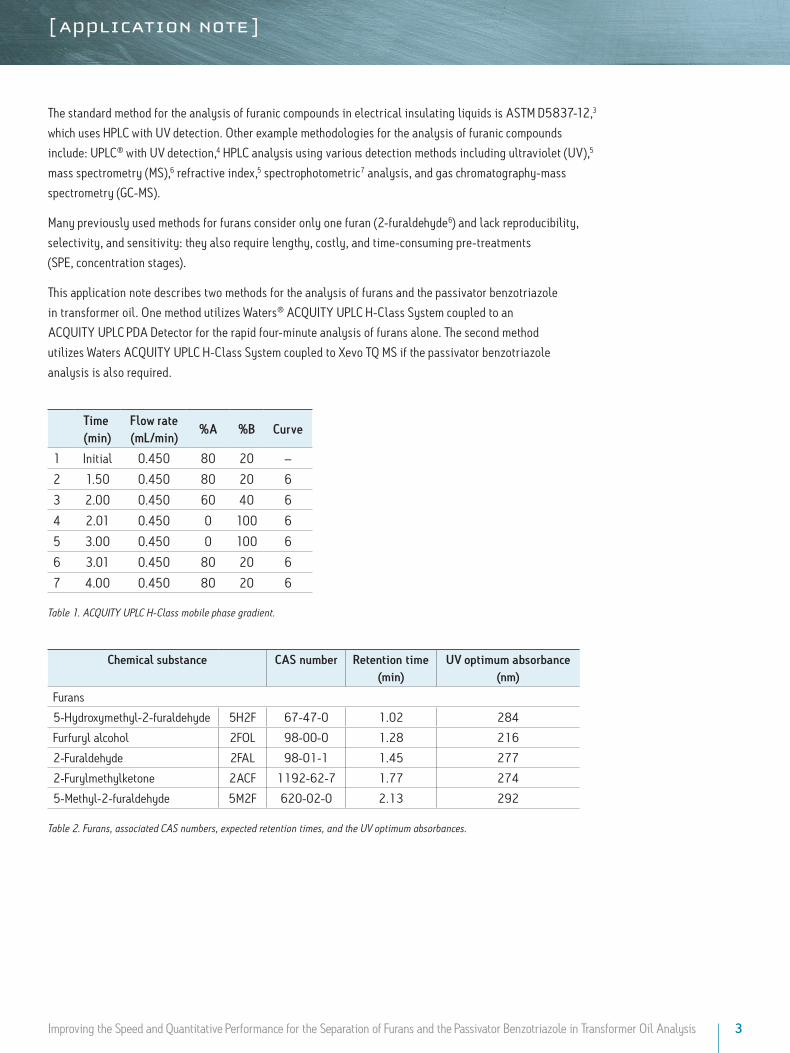
The standard method for the analysis of furanic compounds in electrical insulating liquids is ASTM D5837-12,3
which uses HPLC with UV detection. Other example methodologies for the analysis of furanic compounds
include: UPLC® with UV detection,4 HPLC analysis using various detection methods including ultraviolet (UV),5
mass spectrometry (MS),6 refractive index,5 spectrophotometric7 analysis, and gas chromatography-mass
spectrometry (GC-MS).
Many previously used methods for furans consider only one furan (2-furaldehyde6) and lack reproducibility,
selectivity, and sensitivity: they also require lengthy, costly, and time-consuming pre-treatments
(SPE, concentration stages).
This application note describes two methods for the analysis of furans and the passivator benzotriazole
in transformer oil. One method utilizes Waters® ACQUITY UPLC H-Class System coupled to an
ACQUITY UPLC PDA Detector for the rapid four-minute analysis of furans alone. The second method
utilizes Waters ACQUITY UPLC H-Class System coupled to Xevo TQ MS if the passivator benzotriazole
analysis is also required.
Time (min)
Flow rate (mL/min)
%A %B Curve
1 Initial 0.450 80 20 –
2 1.50 0.450 80 20 6
3 2.00 0.450 60 40 6
4 2.01 0.450 0 100 6
5 3.00 0.450 0 100 6
6 3.01 0.450 80 20 6
7 4.00 0.450 80 20 6
Table 1. ACQUITY UPLC H-Class mobile phase gradient.
Chemical substance CAS number Retention time (min)
UV optimum absorbance (nm)
Furans
5-Hydroxymethyl-2-furaldehyde 5H2F 67-47-0 1.02 284
Furfuryl alcohol 2FOL 98-00-0 1.28 216
2-Furaldehyde 2FAL 98-01-1 1.45 277
2-Furylmethylketone 2ACF 1192-62-7 1.77 274
5-Methyl-2-furaldehyde 5M2F 620-02-0 2.13 292
Table 2. Furans, associated CAS numbers, expected retention times, and the UV optimum absorbances.

4Improving the Speed and Quantitative Performance for the Separation of Furans and the Passivator Benzotriazole in Transformer Oil Analysis
MS conditions were also optimized, detailed in Table 3, for the analysis of furans and the passivator
benzotriazole. The established MRM method is illustrated in Figure 1.
Chemical substanceCAS
NumberRetention time
(min)Cone voltage
(V)Transition
Collision energy
Furans
5-Hydroxymethyl-2-furaldehyde
5H2F 67-47-0 1.05 20127.0 > 109.0 15
127.0 > 81.0 20
Furfuryl alcohol 2FOL 98-00-0 1.30 25 81.1 > 53.0 15
2-Furaldehyde 2FAL 98-01-1 1.46 2597.1 > 69.0 15
97.1 > 41.1 15
2-Furylmethylketone 2ACF 1192-62-7 1.79 20111.1 > 43.0 20
111.1 > 69.1 15
5-Methyl-2-furaldehyde 5M2F 620-02-0 2.15 25111.1 > 55.0 20
111.1 > 83.0 15
Passivator
Benzotriazole BTA 95-14-7 1.66 40120.1 > 65.0 20
120.1 > 92.0 20
Table 3. Furans and the passivator benzotriazole, associated CAS numbers, expected retention times, cone voltages, MRM transitions, and associated collision energy values.
Figure 1. Furans MRM method (six compounds).
Instrument control, data acquisition, and result processing
Empower 3 Software was used for the UPLC-UV method.
MassLynx Software v.4.1 and TargetLynx™ Application Manager were used for the UPLC-MRM method.

5Improving the Speed and Quantitative Performance for the Separation of Furans and the Passivator Benzotriazole in Transformer Oil Analysis
R E SU LT S A N D D IS C U S S IO N
Furans
The analysis of five furans was achieved using an ACQUITY UPLC H-Class System with an
ACQUITY UPLC PDA Detector.
Optimum UPLC and UV conditions were developed, with the elution of all compounds within a four-minute run.
When compared to the standard ASTM D5837-122 method with a minimum run time of 28 min, greater than
seven times increase in sample throughput was achieved, with an excess of 88% less solvent usage.
Matrix matched mixed calibration standards, 0.01 to 5.00 µg/mL, were prepared and analyzed for all the
compounds considered (equivalent range of 2 to 100 mg/kg in transformer oil using the developed method).
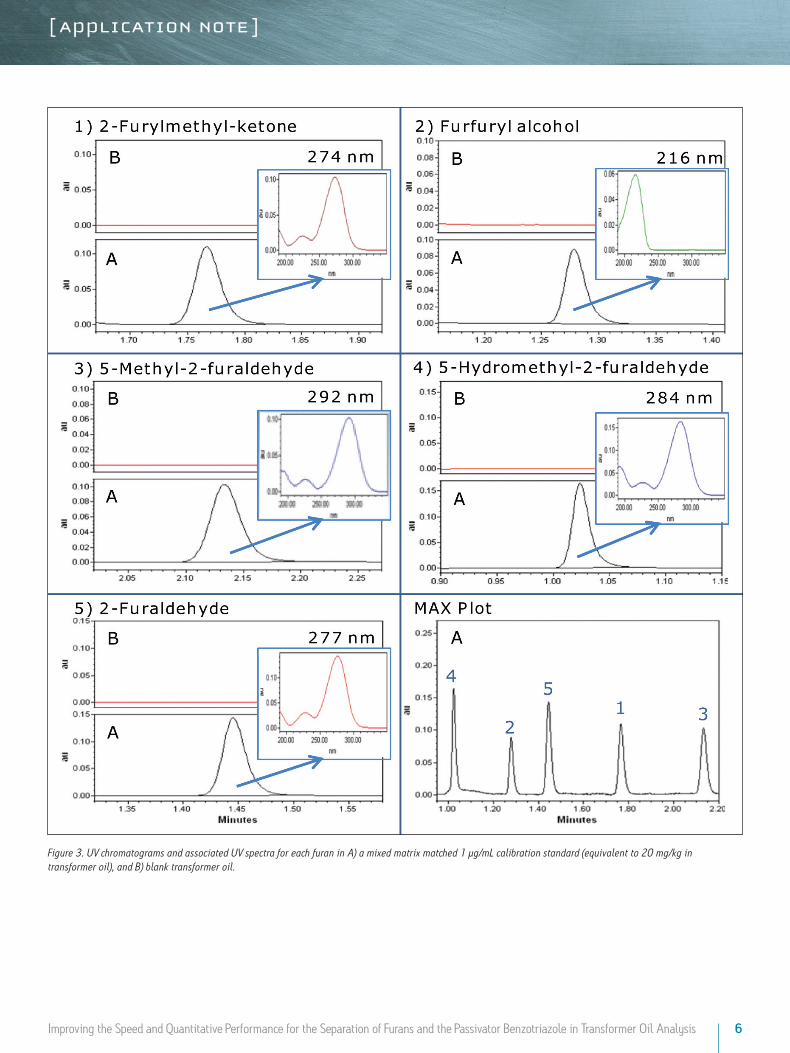
The calibration curve results generated by Empower Software for 5-hydroxymethyl-2-furaldehyde are shown in
Figure 2, and the UV chromatograms, including associated UV spectra for each compound, are shown in Figure 3.
Figure 2. Empower Software calibration curve for 5-hydroxymethyl-2-furaldehyde.
6Improving the Speed and Quantitative Performance for the Separation of Furans and the Passivator Benzotriazole in Transformer Oil Analysis
Figure 3. UV chromatograms and associated UV spectra for each furan in A) a mixed matrix matched 1 µg/mL calibration standard (equivalent to 20 mg/kg in transformer oil), and B) blank transformer oil.

7Improving the Speed and Quantitative Performance for the Separation of Furans and the Passivator Benzotriazole in Transformer Oil Analysis
Figure 4. TargetLynx Quantify results browser shows the calibration quantitation results, calibration curve, and example MRM chromatogram for 5-hydroxymethyl-2-furaldehyde.

8Improving the Speed and Quantitative Performance for the Separation of Furans and the Passivator Benzotriazole in Transformer Oil Analysis
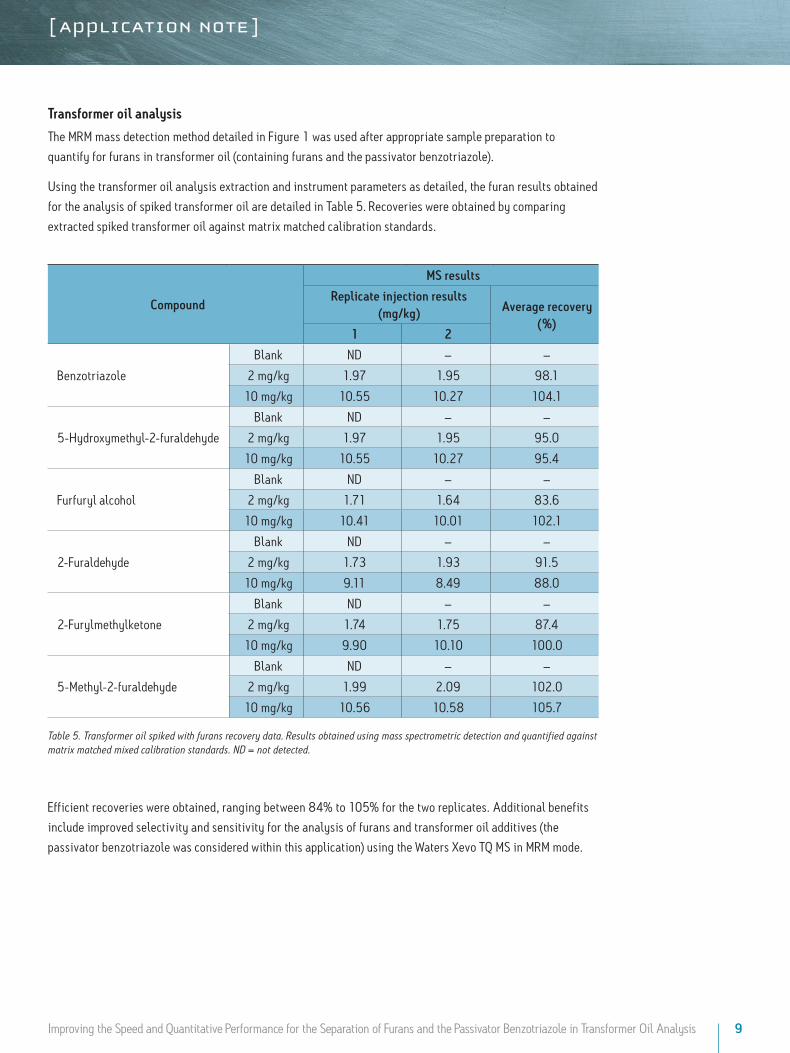
Transformer oil analysis
Using the transformer oil analysis extraction and instrument parameters as detailed, the furan results obtained
for the analysis of spiked transformer oil are detailed in Table 4. Recoveries were obtained by comparing
extracted spiked transformer oil against matrix matched calibration standards.
Compound
UV results
Replicate injection results (mg/kg) Average recovery
(%)1 2
5-Hydroxymethyl-2-furaldehyde
Blank ND – –
2 mg/kg 1.63 1.64 81.9
10 mg/kg 9.37 9.36 93.6
Furfuryl alcohol
Blank ND – –
2 mg/kg 1.89 1.87 93.8
10 mg/kg 9.51 9.38 94.5
2-Furaldehyde
Blank ND – –
2 mg/kg 1.90 1.91 95.1
10 mg/kg 9.54 9.55 95.4
2-Furylmethylketone
Blank ND – –
2 mg/kg 1.94 1.95 97.3
10 mg/kg 9.59 9.58 95.8
5-Methyl-2-furaldehyde
Blank ND – –
2 mg/kg 1.86 1.86 93.2
10 mg/kg 9.96 10.01 99.8
Table 4. Transformer oil spiked with furans recovery data. Results obtained using PDA detection and quantified against matrix matched mixed calibration standards. ND = not detected.
Efficient recoveries were obtained, ranging between 82% to 100% for two replicates, no evidence of matrix
interference was observed.
Furans and the passivator benzotriazole
The analysis of six compounds (five furans and the passivator benzotriazole) was achieved using
Waters Xevo TQ MS in MRM mode with APCI ionization, coupled to an ACQUITY UPLC H-Class System.
Optimum UPLC and MRM conditions were developed, with the elution of all compounds within
a four-minute run.
9Improving the Speed and Quantitative Performance for the Separation of Furans and the Passivator Benzotriazole in Transformer Oil Analysis
Transformer oil analysis
The MRM mass detection method detailed in Figure 1 was used after appropriate sample preparation to
quantify for furans in transformer oil (containing furans and the passivator benzotriazole).
Using the transformer oil analysis extraction and instrument parameters as detailed, the furan results obtained
for the analysis of spiked transformer oil are detailed in Table 5. Recoveries were obtained by comparing
extracted spiked transformer oil against matrix matched calibration standards.
Compound
MS results
Replicate injection results (mg/kg) Average recovery
(%)1 2
Benzotriazole
Blank ND – –
2 mg/kg 1.97 1.95 98.1
10 mg/kg 10.55 10.27 104.1
5-Hydroxymethyl-2-furaldehyde
Blank ND – –
2 mg/kg 1.97 1.95 95.0
10 mg/kg 10.55 10.27 95.4
Furfuryl alcohol
Blank ND – –
2 mg/kg 1.71 1.64 83.6
10 mg/kg 10.41 10.01 102.1
2-Furaldehyde
Blank ND – –
2 mg/kg 1.73 1.93 91.5
10 mg/kg 9.11 8.49 88.0
2-Furylmethylketone
Blank ND – –
2 mg/kg 1.74 1.75 87.4
10 mg/kg 9.90 10.10 100.0
5-Methyl-2-furaldehyde
Blank ND – –
2 mg/kg 1.99 2.09 102.0
10 mg/kg 10.56 10.58 105.7
Table 5. Transformer oil spiked with furans recovery data. Results obtained using mass spectrometric detection and quantified against matrix matched mixed calibration standards. ND = not detected.
Efficient recoveries were obtained, ranging between 84% to 105% for the two replicates. Additional benefits
include improved selectivity and sensitivity for the analysis of furans and transformer oil additives (the
passivator benzotriazole was considered within this application) using the Waters Xevo TQ MS in MRM mode.

10Improving the Speed and Quantitative Performance for the Separation of Furans and the Passivator Benzotriazole in Transformer Oil Analysis
Matrix matched mixed calibration standards, 0.01 to 5.00 µg/mL, were prepared and analyzed for all the
compounds considered (equivalent range of 2 to 100 mg/kg in transformer oil using the developed method).
The TargetLynx Quantify results for 5-hydroxymethyl-2-furaldehyde are shown in Figure 4, and the MRM
chromatograms for each compound are shown in Figure 5.
Figure 5. MRM chromatograms for furans and the passivator benzotriazole in A) a mixed matrix matched 1 µg/mL calibration standard (equivalent to 20 mg/kg in transformer oil), and B) blank transformer oil.
Benzotriazole
5-Methyl-2-furaldehyde
2-Furylmethylketone
2-Furaldehyde
Furfuryl alcohol
5-Hydroxymethyl-2-furaldehyde
A
A
A
A
A
A
B
B
B
B
B
B
Waters Corporation34 Maple Street Milford, MA 01757 U.S.A. T: 1 508 478 2000 F: 1 508 872 1990 www.waters.com
CO N C LU S IO NS
Two fast, selective, and sensitive methods have been developed
for the analysis of furans and the passivator benzotriazole in
transformer oil.
One method utilizes the ACQUITY UPLC H-Class System coupled
to the ACQUITY UPLC PDA Detector for the rapid four-minute
analysis of furans alone. The second method utilizes the
ACQUITY UPLC H-Class System coupled to Xevo TQ MS if furans
and additional transformer oil additives are required,
the passivator benzotriazole was considered within this application.
The described approach offers many benefits when compared
to the standard method:
■■ Business benefits of using UPLC analysis including, greater
than seven times increase in sample throughput and an excess
of 88% less solvent usage.
■■ Enhanced sensitivity and selectivity resulting in improved
confidence in identification and quantification offered using
Xevo TQ MS.
APCI provides an efficient ionization mode for the analysis
of the broad distribution of diverse polarities of the compounds
being analyzed.
Quantitative furan analysis as detailed, using a small amount
of insulating oil sampled from the transformer (without taking
it out of operation), can be used as a representation of the
degree of depolymerization and hence establish the condition
of the transformer.
Waters, ACQUITY UPLC, UPLC, and Xevo are registered trademarks of Waters Corporation. MassLynx, Empower, TargetLynx, and T he Science of What’s Possible are trademarks of Waters Corporation. All other trademarks are the property of their respective owners.
©2012 Waters Corporation. Produced in the U.S.A.August 2012 720004426EN AG-PDF
References
1. Laborelec GDF Suez. News: focus on electrical equipment. Journal twelfth year. No 124, April 2011. [cited 2012 July 12]. Available from http://www.laborelec.com/pages_files/news_april_11.pdf.
2. Lewand L. Passivators – What they are and how they work. Neta World, Spring 2006; [cited 2012 January 10]. Available from: http://www.netaworld.org/files/neta-journals/NWsp06ChemPersp.pdf
3. Standard test method for furanic compounds in electrical insulating liquids by high-performance liquid chromatography (HPLC). ASTM. D5837-12, Feb 2012.
4. Schwarz M, Rodriguez C, Gullillen D, Barroso C. Development and validation of UPLC for the determination of phenolic compounds and furanic derivatives in Brandy de Jerez. J Sep Sci. 32: 1782-1790.
5. Yuan J, Chen F. Simultaneous separation and determination of sugars, ascorbic acid and furanic compounds by HPLC – dual detection. Food Chemistry. 64: 423-427, 1999.
6. Koreh O, Ludanyi K, Vekey K, Javorszky E, Molnar E, Torkos K, Borossay J. Determination of furanic compounds in insulating oil by high performance liquid chromatography/mass spectrometry using atmospheric pressure chemical ionization. Rapid Communications in Mass Spectrometry. 12: 1515-1519, 1998.
7. Pahlavanpour B, Duffy G, Rapid spectrophotometery analysis of furfuraldehyde in transformer oil. Cigre 110-11, Symposium Berlin (1993).