improving the speed of electrical distribution management systems
TRANSCRIPT

Improving the Speed of Electrical Distribution Management Systems
through Improved Data Representation Techniques
MANSOOR AL-A’ALI Department of Computer Science, University of Bahrain, PO Box 32038.
BAHRAIN. Abstract: - The speed of operations carried out by the control engineers on the electricity distribution networks normally takes longer than acceptable in this dynamic environment where speed is vital for both safety and efficiency. The research presented in this paper provides some findings about the evaluation of the efficiency and speed of a number of network traversing algorithms against a set of specially designed data representation techniques. The results of testing the different algorithms are given. We demonstrate that by improving the data representation of the distribution network, we improve the speed of the algorithms which reflects highly on the speed of the variety of operations, such as switching, tracing and locating the source. Keywords: Electricity Distribution Networks, Distribution Algorithms, Data Structures. 1 Introduction 1.1 Electrical Distribution Network Research on automating the Electricity Distribution Control Centers and their activities of monitoring and controlling electricity distribution networks received some attention in the research literature. Automation based on distributed control systems technology enormously increases the plant supervision capability of a single human. Distributed control systems makes possible the integration and operation of a country-wide electricity generation and distribution system. Out-of-plant supervision is, however, more risky due to the impossibility of direct plant observation and exclusive reliance on digital data systems for decision-making. After thoroughly searching the literature, we have found few reported attempts to present some solutions to the problems of distribution control systems. We have found no published work about the problems and methods of display of the distribution network. Clavijo etal (2001) describe a distributed system based on CORBA technology to provide real-time visual feedback to operators of large supervision systems. Dash etal (1999) present a functional-link-neural network for short-term electric load forecasting. Tae-I Choi etal (1999) report on a remote control and fault location system for distribution lines. Hua etal (1999)
proposed an algorithm and implementation of an incident based connectivity trace system for distribution network. Carvalho etal (1999) proposed an approach to operational planning and expansion planning of large-scale distribution systems. Herrell etal (1998) proposed a method of modeling of power distribution systems in PCs. Yeh, etal (1997) present an integrated solution for computerized Distribution planning in a geographic information system (GIS) context, is a synergy that magnifies the data accessibility between load forecasting and feeder planning tools, sealing the traditional gap between long-term and short-term distribution system planning. According to these authors, this approach enables the multi-year distribution system studies in a GIS context, to best assist utility planners in deciding where and when the customers will grow and how to expand the system facilities to meet the demand growth. Wainwright (1997) presents a Distribution Engineering Geographical Information System as a major program of network information data capture at all voltage levels from the customer service cable right through to the primary supply in-feed; a suite of software for viewing the data in the office and in the field; tools for network optimization; and a range of automation and information processing systems which assist in the operation and maintenance of
Proceedings of the 10th WSEAS International Conference on CIRCUITS, Vouliagmeni, Athens, Greece, July 10-12, 2006 (pp229-234)

the distribution network. Lestan etal (1997) present a form of a distribution network automation utility experience. Cavattoni etal (1996) describe the GIS experience of a company that manages Verona's utilities networks. It outlines some particular aspects of the GIS project, of the numerical cartography and of the utilities network database. It also describes two utilizations of geographic information systems to handle data referring to geographical positions giving the length calculation of 50 electricity distribution lines. Xing Weiguo etal (1996) report on a proposal for a PC-based distribution system. These monitoring and control activities of a distribution control centre include switching the flow from ‘on’ to ‘off’ and vv, preparing switching plans such as those required for isolating stations or circuits for maintenance, adding and removing substations, etc. All these activities and more have been incorporated in the Hi-Tech EDMS system. This system accommodates all the operations required by the control engineer and help in decision making. Hi-Tech EDMS system was developed using Microstation MDL with ORACLE database and works on a schematic digitized Microstation based diagrams.
An Electrical Distribution Network System is a collection of electrical circuits consisting of primary stations and substations linked via cables. Stations are linked to each other through switches, which are fixed in the stations. Every station may contain one or more switches and has one or more busbars, where every busbar can be considered as a station by itself. Switches are directly linked to cables. Primary stations are the sources that feed other stations, except in some rare situations. Substations are the stations that are fed by primary stations. Switches on primary stations are called circuit breakers. All connecting stations linked to a circuit breaker represent an electrical circuit. Electrical circuits form the Electrical Distribution Network, see Fig. 1. The electrical distribution network system is a collection of electrical circuits consist of primary stations and substations linked by cables. The cable is connected to a station through a switch which is fixed in the station. Fig. 1, shows part of an electrical distribution network. Fig. (2) shows the key to the symbols used.
001
101102103
104105
106107
108
109
110
111
112113114
115116
117
118 119 120
121 122
123 124 125
126
127 128
129 130 131
132
133 134
002
003
135
136137138
139 140 141 142
143 144
145146
147148 149
Fig. 1: A sample Electricity Distribution System Primary station or source is the station which feeds other stations and never fed by another, except in some rare situations. This means that it is the Power House where the electricity is generated. Substations are the stations which are fed by primary stations. At the same time substations can serve as feeders for other substations. Every station may contain one or more busbars, every busbar can be considered as a station by
itself. A station contains one or more switches. These switches are connected directly to the cables. The cable joins a station to another. A primary station and all the connected substations constructs a circuit. The network consists of many circuits Switch Status The status of a switch can take three cases; on, off, and earth. When a switch is in off position, it is called open-point, where the electricity current can not go to another substation. Flow The flow is the direction of the electricity current flow. We have represented the flow in a switch as follows: 1. In flow: when the electricity goes from
another station to the base station of the switch. The base station of a switch is the station where the switch is fixed on.
2. Out flow: when the electricity goes from the base station of the switch to another substation.
3. None: when no electricity goes through the switch, or when its status is off.
Proceedings of the 10th WSEAS International Conference on CIRCUITS, Vouliagmeni, Athens, Greece, July 10-12, 2006 (pp229-234)
Primary stations always have switches with flow which goes out (we will simply call them out-switches), or switches with none flow. Substations usually have one switch with flow which goes in (in-switch). In some cases, substations can have more then one in-switch. This case is called parallel situation which will be defined later. Tracing a given station is the operation of finding all the substations fed by this station till the open-points or tail-end stations. 1.3 The Critical Issue of Speed As mentioned earlier, electrical distribution network system is large and complex, and its elements are dependent on each other. This means that changing the state of an element, such as a switch, may affect a large circuit. The information of all the elements in this effected circuit need to be updated. For this reason the speed of update and the system reaction is very critical. A control engineers normally works on three to five circuits at the same time where he/she communicates with outside crew who carry out his order in the field. On a large scale system, each switching operation takes one to five minuets and this causes aggravation and loss of control and speed. To make the system as quick as possible, the elements of the network must be modeled in away that optimize the time of update and the display of new results. Database tables structure and data structures used in the programs are two vital factors to achieve this goal. Because one of our goals is to achieve minimum speed in implementing some network operations, we are going to use two types of database tables structure. We are going to apply the same algorithms on the two structures and the speed will be compared in both cases. The details of these two structures will be explained later. 2. The First Database Structure By first database structure we mean: the first method of organizing the database tables. The second database structure will be explained in the next section. The first database structure contains the following tables:
Stations Table: This table defines all stations: primaries and substations. All stations have further description in the Stn_Descrip Table. A separate record is kept for each different busbar. This table contains the following fields: • Station_Code: char(18).. • Busbar_Code: char(1). • Name: char(50). • Load: number. Switches Table: This table contains important information about each switch in the primary and substations. These information are useful for executing the different network operations. Further details in the Sw_descrip table. It contains the following fields: • Station_Code1: char(18). • Busbar_Code1: char(1).. • Switch_Sequence1: char(1).. • Station_Code2: char(18).. • Busbar_Code2: char(1).. • Switch_Sequence2: char(1).. • Flow: char(1). • Status: char(1). ( 0 = on, 1 = off ). Cable Table: This table contains information about each cable. In the first table structure this table will not be used in executing the network operations. In the second table structure this table will define the connection between any two stations and will specify the actual switches. It contains the fields: • Station_Code1: char(18). • Busbar_Code1: char(1). • Switch_Sequence1: char(1). • Station_Code2: char(18). • Busbar_Code2: char(1). • Switch_Sequence2: char(1). 3. The Second Database Structure In this alternative approach we are going to use the following table structure: Stations Table: As described above in the first database structure. Switches Table: Contains the following fields only: • Station_Code. • Busbar_Code. • Switch_Sequence. • Status.
Proceedings of the 10th WSEAS International Conference on CIRCUITS, Vouliagmeni, Athens, Greece, July 10-12, 2006 (pp229-234)

Cable Table: As described above. In this structure the cable table will be used in some operations, in addition to storing cables information. Stn_Descrip Table: As described above. Sw_descrip Table: As described above. The following two tables are new in this structure. They are used to define the flow between the stations. Their main aim is to speed up some operations like tracing and getting the primary feeder of a station.
Stn_In Table: each record in this table contains the ID of a switch (in a station) and the ID of the previous switch which is in the stations which feeds that station, namely the following fields: • Station_Code . • Busbar_Code. • Switch_Sequence. • In_Station_Code: the stations code
of the previous station. • In_Busbar_Code: the busbar code of
the previous station. • In_Switch_Sequence: the switch
sequence of the previous station. • In_Status: the status of the previous
switch. Stn_Out Table: each record in this table contains the ID of a switch (in a station) and the ID of the next switch which is in the station which is fed by that station, namely the following fields: • Station_Code . • Busbar_Code. • Switch_Sequence. • Out_Station_Code: the stations code
of the next station. • Out_Busbar_Code: the busbar code
of the next station. • Out_Switch_Sequence: the switch
sequence of the next station. • Out_Status: the status of the next
switch. 4 Testing and Results This chapter presents the results of implementing the algorithms presented in the previous chapters. The original aim was to develop algorithms and associated data structures which will ensure a fast enough response for the distribution control
engineers. One of the major contributions to the speedy response is the data structure selected to keep the flow. A number of algorithms were evaluated and an average response time for each was produced: These algorithms are: Get source, Turn on, Turn off and Generate flow. For each of the algorithms a wide spectrum of circuit length was used ranging from few stations to tens of stations and the response time of each was recorded. For the algorithms Trace and Generate Flow, their evaluation is done according to the two table structures presented earlier in chapter 2. This will give us a good indication to choose the best and optimum method. 4.1 Size of Test Data In order to produce realistic test results a sizable distribution network was entered in the database reflecting the original network and its flow. A total of seven primaries with about thirty circuits and a total of 300 substations were used. The length of the circuits are varying from short, to middle, and long. The circuits contain switches with various status, on and off, and terminal switches. Also, there are many tail-end substations. The necessary data used in the first database structure were entered from the keyboard, while the necessary data used in the second database structure copied by a small program. The records of the table Stn_out are generated by the system itself by Generate Flow process, and used by Trace process. 4.2 Results Trace Process The first column contains the traced station code of the testing data, and the second contains the number of stations reachable form the station in column one. The time given is the rounded average of five readings after each operation is shown in Fig. 2.
Proceedings of the 10th WSEAS International Conference on CIRCUITS, Vouliagmeni, Athens, Greece, July 10-12, 2006 (pp229-234)

Trace Process
0
500
1000
5 12 18 26 31 37 43 50 53 60
No of stations
Ave
rage
Tim
e (m
s)
Fig. (2): Trace process results. It can be seen from the graph that the increase of time is directly proportional to the number of reachable stations. It is also very clear that there is a great difference in the response time between the two types of structures. This gives us a good evidence of the importance of using fast machines in the real use of the system especially in Client/Server environment. Fig. 3 shows the graph of results of Trace process according to both database structures. It is clear from the graph that the second database structure is faster in responds time than the first. This is expected because the Stn_out table is designed originally to speed up the Trace process.
Trace Algorithm
0500
1000
2 4 7 14 19 28 37 43 50 60
5 12 18 26 31 37 43 50 53 60
No of Stations
Ave
rage
Tim
e (m
s)
Fig. (3): Trace algorithm according to the first and second data structures.
Get Source Process Fig. 4 shows of the time taken by the get source algorithm.
Get Source Algorithm
050
100150200
1 4 7 9 12 15 15
Stations Level
Ave
rage
Tim
e (m
s)
Fig. (4): results of Get Source process. Turn on/off Processes Fig. 5 shows the results of applying the different structures for the turn on/turn off algorithm. It is clear from the graph that the process of turning on a switch and updating the dependent circuit takes more time than turning it off. This happens because of two reasons: 1. The number of evaluated conditions in case
of Turn on process is more than that of the Turn off process ( See the algorithms in chapter 3).
2. The update of flow in case of Turn on process is varying between in and out depending on the location of the switch. In case of Turn off, all the switches flow is set to none only.
Turn on/off Algorithms
0500
10001500
1 4 8 19 23 27 44
No of Updated Stations
Ave
rage
Tim
e (m
s)
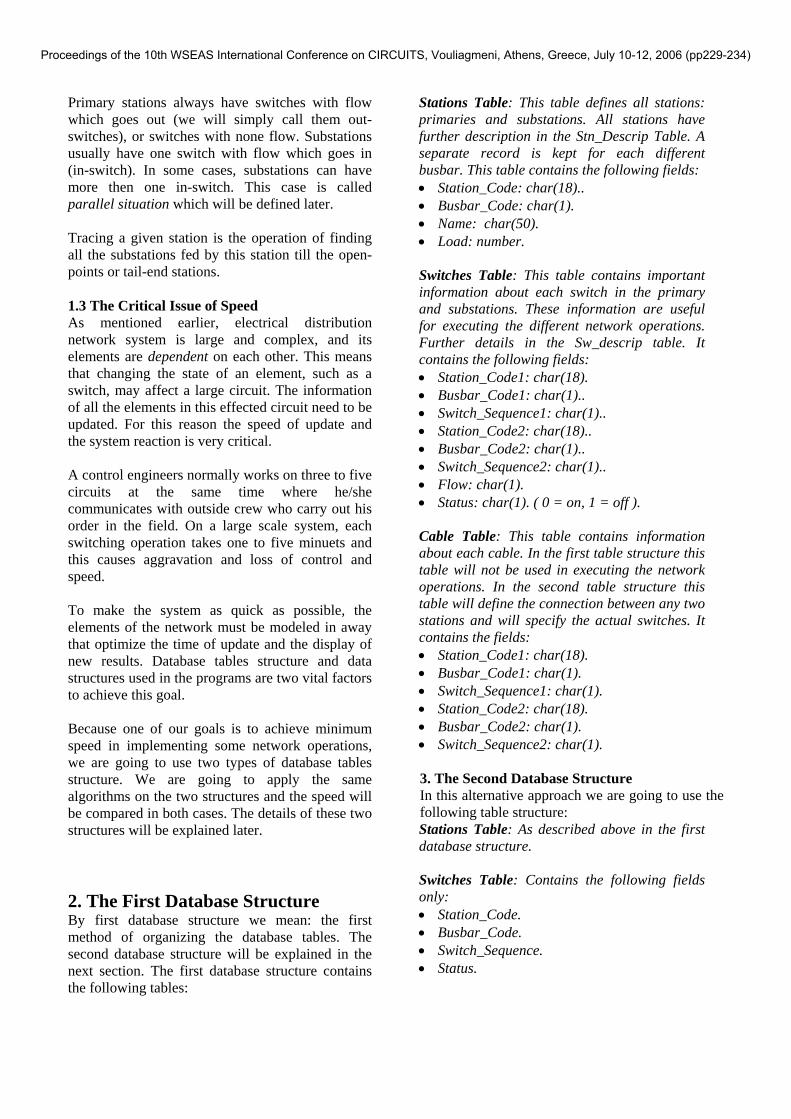
Fig. (5) results of Turn on/off processes. Generate Flow Generate flow is one of the processes which was implemented and evaluated using both database structures. Fig. 6 shows the comparison of the results of both structures..
Proceedings of the 10th WSEAS International Conference on CIRCUITS, Vouliagmeni, Athens, Greece, July 10-12, 2006 (pp229-234)
Generate Flow Algorithm
0
500
1000
1500
7 19 28 31 37 50 60
No of Stations
Ave
rage
Tim
e (m
s)
Fig. (6) results of Generate Flow according to both database structure.
As in the previous algorithm, the increase of time is directly proportional to the number of stations. It is obvious that the second method takes less time in all the cases which was not expected. It also clear that the gab between the two curves gets bigger as more stations are considered which gives the impression that the second approach gets more efficient as the number of stations increases. 5 Conclusion The research in this paper demonstrated that the efficiency of traversing algorithms for electrical circuits distribution management cannot be separated from the data representation techniques of the data related to these complex tree like circuits. The paper demonstrated that big improvements in the traversing speed of the algorithms was improved by high percentages. A number of algorithms were evaluated, these include, switching on and off operations, tracing operations and get source operations. . References: - [1] Clavijo, J.A.; Segarra, M.J.; Baeza, C.; Moreno, C.D.; Sanz, R. ; Jimenez, A.; Vazquez, R. ; Diaz, F.J. ; Diez, A. Real-time video for distributed control systems (Journal Paper). Control Engineering Practice. Vol. 9, Iss. 4, pp. 459-66; April 2001. [2] Dash, P.K.; Liew, A.C.; Satpathy, H.P., A functional-link-neural network for short-term electric load forecasting, Journal of Intelligent & Fuzzy Systems vol.7, no.3, p.209-21, 1999.
[3] Tae-I Choi; In-Seok Koh; Bok-Hyun Kim; Won-Soon Song; Wan-Sung Jang, PC-based remote control and fault location system for distribution line, IEEE Power Engineering Society. 1999 Winter Meeting, 1999. [4] Hua Li; Hsiao-Dong Chiang; Gale, W.G.; Bennett, J.T.H., An incident based connectivity trace system for distribution network: algorithm and implementation, 1999 IEEE Power Engineering Society Summer Meeting. [5] Carvalho, P.M.S.; Barruncho, L.M.F., An evolutionary approach to operational planning and expansion planning of large-scale distribution systems, Ferreira, L.A.F.M.; 1999 IEEE Transmission and Distribution Conference, 1999. [6] Herrell, D.; Beker, B., Modeling of power distribution systems in PCs, IEEE 7th Topical Meeting on Electrical Performance of Electronic Packaging, p.159-62, 1998. [7] Yeh, E.-C.; Tram, H., Information integration in computerized distribution system planning (Journal Paper). IEEE Transactions on Power Systems. Vol. 12, Iss. 2, pp. 1008-13; May 1997. [8] Wainwright, I., Engineering the benefits of a geographical information system: the business case for GIS (Conference Paper). Wainwright, I. IEE Colloquium on Engineering the Benefits of Geographical Information Systems (Digest No.1997/105). IEE, London, UK. pp. 2/1-7; 1997. [9] Gorisek, J., Distribution network automation utility experience, 10th International Conference on Power System Automation and Control. PSAC'97, p.103-8, 1997. [10] Lestan, D.; Gorisek, J., Distribution network automation utility experience, 10th International Conference on Power System Automation and Control. PSAC'97, p.103-8, 1997.
[11] Cavattoni, E.; Giusti, M.; Rumor, M.; McMillian, R.; Ottens, H.F.L, GIS for utilities networks: the Verona's experience (Conference Paper) Geographical Information from Research to Application through Cooperation. Second Joint European Conference and Exhibition. IOS Press, Amsterdam, Netherlands. pp. 1123-32 vol.2; 1996.
[12] Xing Weiguo; Yu Yixin; Xiao Jun; Wang Ruying, A PC-based distribution AM/FM system, ICEE '96. Proceedings of the International Conference on Electrical Engineering, p.165-9 vol.1, 1996.
Proceedings of the 10th WSEAS International Conference on CIRCUITS, Vouliagmeni, Athens, Greece, July 10-12, 2006 (pp229-234)