improving understanding of local-scale vulnerability in ... · vulnerability in atoll island...
TRANSCRIPT

FINAL REPORT for APN PROJECT
Project Reference: CBA2010-06NSY-Kench
Dr Paul Kench, The University of Auckland, New Zealand Dr Susan Owen, The University of Auckland, New Zealand
Mr Alan Resture, The University of Auckland, New Zealand Dr Murray Ford, College of the Marshall Islands, Republic of the Marshall Islands
Mr Doan Trevor and Mrs Sophia Fowler, Marshall Islands Conservation Society, Republic of Marshall Islands Mr Juda Langrine, Environmental Protection Authority, Republic of Marshall Islands
Mr Ajiken Lometo, Ailinglaplap Council, Republic of Marshall Islands Mr Semese Alefaio, Tuvalu Climate Action Network, Tuvalu
Mr Taukiei Kitala, Tuvalu Association of NGOs, Global Environment Facility Small Grants Program, Tuvalu Ms Pepetua Latasi, Mr Feagaiga Penivao & Salemona Tanielu, Department of Environment, Tuvalu
Mr Tataua Pese, Tuvalu Red Cross, Tuvalu
- Making a Difference – SScciieennttiiffiicc CCaappaacciittyy BBuuiillddiinngg && EEnnhhaanncceemmeenntt ffoorr SSuussttaaiinnaabbllee DDeevveellooppmmeenntt iinn DDeevveellooppiinngg CCoouunnttrriieess
IImmpprroovviinngg UUnnddeerrssttaannddiinngg ooff LLooccaall--SSccaallee VVuullnneerraabbiilliittyy iinn AAttoollll IIssllaanndd CCoouunnttrriieess::
DDeevveellooppiinngg CCaappaacciittyy ttoo IImmpprroovvee IInn--CCoouunnttrryy AApppprrooaacchheess aanndd RReesseeaarrcchh

PPrroojjeecctt TTiittllee
IImmpprroovviinngg UUnnddeerrssttaannddiinngg ooff LLooccaall--SSccaallee VVuullnneerraabbiilliittyy iinn AAttoollll IIssllaanndd CCoouunnttrriieess:: DDeevveellooppiinngg CCaappaacciittyy ttoo IImmpprroovvee IInn--CCoouunnttrryy AApppprrooaacchheess aanndd RReesseeaarrcchh
Project Reference Number: CBA2010-06NSY-Kench Final Report submitted to APN
©Asia-Pacific Network for Global Change Research

PAGE LEFT INTENTIONALLY BLANK

CBA2
010-
06N
SY-K
ench
-FIN
AL R
EPO
RT
]
1
OVERVIEW OF PROJECT WORK AND OUTCOMES Non-technical summary
The aim of this project was to build the skills of scientists in Pacific atoll countries to undertake physical vulnerability assessments. The project targeted collaboration with participants from two Pacific atoll countries, the Republic of the Marshall Islands and Tuvalu. Workshops and field based case studies were designed to provide training on methods to undertake rapid assessment of vulnerability of reef islands. The use of case studies of different environments allowed the comparison of local scale variations in vulnerability. After training workshops were completed in Majuro, Republic of the Marshall Islands and Fogafale, Tuvalu, workshop participants undertook rapid vulnerability assessments on case study sites. In the Republic of the Marshall Islands assessments were undertaken on Jeh island, Alinglaplap atoll and Jabót island. In Tuvalu assessments were undertaken in the village of Te Kavatoetoe on Fogafale island, Funafuti atoll. Closing workshops where held to consider inundation scenarios and report findings to collaborating organizations.
Objectives
The main objectives of the project were:
1. To build research skills in atoll countries to undertake rapid vulnerability assessments at the local scale
2. To identify local scale variances in atoll island vulnerability
3. To explore policy implications of local scale variations in island vulnerability Amount received and number years supported
The Grant awarded to this project was:
US$ 29,760 for Year 1 Activity undertaken
The first phase of capacity building was undertaken in the Republic of the Marshall Islands over a three week period in September 2010. The participants included: Dr Murray Ford, College of the Marshall Islands; Mr Doan Trevor and Mrs Sophia Fowler, Marshall Islands Conservation Society; Mr Juda Langrine, Environmental Protection Authority; Mr Ajiken Lometo, Ailinglaplap Council.
Capacity building activities involved:
• A two-day workshop on September 7th and 8th 2010, at the Long Island Hotel, Long Island, Majuro Atoll.
• A 10-day field trip to Jeh Island, Ailinglalap Atoll and Jabót Island. On each island the project team undertook detailed field surveys of rural villages documenting land levels with respect to mean sea level and community assets.

]
2
• A 2-day closing workshop in which field data was analysed, and the vulnerability of rural villages to increased sea level was established.
• A final closing workshop to senior government officials and ministers presenting the results of the work.
The second phase of capacity building was undertaken in Tuvalu over a two week period in February 2011. The participants included: Mr Semese Alefaio, Tuvalu Climate Action Network; Mr Taukiei Kitala, Tuvalu Association of NGOs, Global Environment Facility Small Grants Program; Ms Pepetua Latasi, Mr Feagaiga Penivao & Salemona Tanielu, Department of Environment; Mr Tataua Pese, Tuvalu Red Cross.
Capacity building activities involved:
• A two-day workshop on February 7th and 8th 2011, at the Government of Tuvalu conference room, Fogafale, Tuvalu.
• A 4-day field trip to Te Kavatoetoe village, Fogafale. The project team undertook detailed field surveys of the village documenting land levels with respect to mean sea level and community assets.
• A 2-day closing workshop in which field data was analysed, and the vulnerability of Te Kavatoetoe village to increased sea level was established.
• A final closing workshop to senior government officials presenting the results of the work. Results
Two training workshops were successfully completed in the Republic of the Marshall Islands and Tuvalu. These workshops trained 10 Pacific Island researchers on techniques for community-scale vulnerability assessment.
Project participants undertook three case studies to determine local-scale vulnerability. These exercises provided participants experience in application of research skills. On the islands of Jeh and Jabót all members of the survey team met with community members and discussed the work to be undertaken. In the village of Te Kavatoetoe one of the team members, involved with the community committee, contacted members of the community to discuss the project with them. In each case study site the survey team spent the first day visiting households and recording information about the impacts of past flooding and erosion events.
The survey teams used basic surveying techniques (dumpy levels) to survey the land elevation along transects in each village. In Jeh village, 12 transects were undertaken. On Jabót, 6 transects were run across Jabót village. In Te Kavatoetoe, Funafuti, 10 transects were surveyed across the island from the lagoon flat to the oceanside reef flat. Each of the profiles was reduced to a known sea level datum.
The survey teams also gathered data on the elevation of houses in each village. The location of every house was located on aerial photographs and maps and each house numbered. The elevation of the ground at the edge of the houses and the elevation of the floor level of the houses was recorded. The elevation of structures such as external cook houses was also documented.

CBA2
010-
06N
SY-K
ench
-FIN
AL R
EPO
RT
]
3
Two post field trip workshops were held (one in each country) to reduce, catalogue and interpret data captured from the case study sites. The data was used to develop participant generated maps of the location of community structures and the elevation of these structures. This information allowed discussion of possible inundation scenarios. Three vulnerability reports were prepared for the case study islands (Jeh, Jabót and Te Kavatoetoe). Final workshops were undertaken in Tuvalu and the Republic of the Marshall Islands to present findings of the study to Government officials and policy makers.
Mrs Sophia Fowler (Marshall Islands Conservation Society) and Mr Juda Langrine (EPA, Marshall Islands) surveying on Jeh Island Ailinglaplap.
Mrs Sophia Fowler (Marshall Islands Conservation Society) and Mr Juda Langrine (EPA, Marshall Islands) and Mr Ajiken Lometo (Ailinglaplap Council) and Dr Susan Owen (University of Auckland) at the Marshall Islands’ data analysis workshop.
Tuvaluan workshop participants surveying at Te Kavatoetoe, Fogafale Island, Tuvalu.
Tuvalu data analysis workshop, Fogafale Island, Tuvalu, February 2011.
Relevance to the APN Goals and Science Agenda, Scientific Capacity Development and Sustainable Development
This project has generated new data to improve the understanding of local scale variations in vulnerability. Science-policy linkages have been informed through high resolution comparisons of geographic variations in atoll island vulnerability. This information is necessary to underpin policy development in regard to future adaptation strategies. The findings of these projects and relevant policy implications were disseminated to officials through closing workshops. The projects were

]
4
reported on in the local media in the Republic of the Marshall Islands and by international media in Tuvalu.
The project directly met the aims of CAPaBLE through the explicit development of scientific capacity to enhance decision-making in relation to issues of sustainable development. The project has developed the capacity of 10 in-country participants, through training in specific surveying techniques, to undertake rapid vulnerability assessments and the translation of this data to allow for scenario generation. The process of capacity building and knowledge exchange between partners in this project will further enhance academic institutional and government relationships, providing opportunities to develop future scientific work. The project provided a co-learning environment to strengthen scientific capacity and exchange ideas and to develop a set of readily replicable processes to inform future decision making. The strengthened capacity of atoll island countries to undertake vulnerability assessments will improve the potential for these countries to access multilateral and global research and development programs.
Self evaluation
The project enabled in-country participants to actively develop new skills and apply them to relevant case studies. Participants commented during the process that they could see immediate applicability of the skills that they were learning and that there was scope to build these approaches into existing programs for assessing community vulnerability. In the Republic of the Marshall Islands it became apparent that there is a possible intersection between the collation of physical datasets and the community asset mapping undertaken through the existing Reimaanlok program that seeks to develop community conservation areas. In Tuvalu participants could see possibilities to integrate the collation of physical datasets into existing community based adaptation programs. Feedback from senior government officials was positive, with one senior manager commenting that: "The work was valuable in helping us understand the vulnerability of our remote outer-islands to the impacts of climate. The training provided the tools and knowledge for us to apply these techniques to other islands" (Mrs Deborah Barker-Manase, General Manager, RMI Environmental Protection Authority).
Potential for further work
As an outcome of the project in the Republic of the Marshalls Islands, local counterparts have secured funding from the US embassy to support two additional in-country case studies. As a result of the project in Tuvalu participants were seeking organizational funding to obtain of additional survey equipment to integrate these approaches into proposed in-country vulnerability and adaption projects.
There are still significant gaps in understanding of local scale variation in vulnerability. The ongoing potential for work of this type to be undertaken in the partner countries and in other states is significant. It is apparent that these techniques are easily integrated into existing projects and would strengthen the scientific understanding of many local scale adaptation programs.
CBA2
010-
06N
SY-K
ench
-FIN
AL R
EPO
RT
]
5
5
Publications (please write the complete citation)
Case study reports were disseminated at the end of each workshop program.
Kench, P.S., Owen, S.D., Ford, M.R., Trevor D., Fowler, S., Langrine, J., Lometo, A., 2010. Improving Understanding of Local-Scale Vulnerability in Atoll Island Countries: Case Study 1: Jeh Island, Ailinglaplap Atoll, Republic of Marshall Islands, 12 pages.
Kench, P.S., Owen, S.D., Ford, M.R., Trevor D., Fowler, S., Langrine, J., Lometo, A., 2010. Improving Understanding of Local-Scale Vulnerability in Atoll Island Countries: Case Study 2: Jabót Island, Republic of Marshall Islands, 10 pages.
Kench, P.S., Owen, S.D., Resture, A., Alefaio, S., Kitala, T., Latasi, P., Penivao, F., Tanielu, S., Pese, T., 2011. Improving Understanding of Local-Scale Vulnerability in Atoll Island Countries: Te Kavatoetoe, Fogafale, Tuvalu 14 pages.
Acknowledgments
Technical equipment and resourcing support was received from the University of Auckland, the College of the Republic of the Marshall Islands and the Government of Tuvalu. Acknowledgement also needs to be made to the support of the following organizations for allowing collaborators to participate in the program: Marshall Islands Conservation Society; Environmental Protection Authority, Republic of Marshall Islands; Tuvalu Climate Action Network; Tuvalu Association of NGOs and Global Environment Facility Small Grants Program; Department of Environment, Tuvalu; Tuvalu Red Cross.

6
TECHNICAL REPORT Preface
There is a need to better understand variations in the level of impacts of climate change within atoll island countries. The aim of this project was to build the skills of scientists in Pacific atoll countries to undertake physical vulnerability assessments. The project has targeted collaboration with two Pacific atoll countries, the Republic of the Marshall Islands and Tuvalu. Workshops and field based case studies have been designed to provide training on methods to undertake rapid assessment of vulnerability of reef islands. The use of case studies of different physical environments allows for comparison of local scale variations in vulnerability to be undertaken.
CBA2
010-
06N
SY-K
ench
-FIN
AL R
EPO
RT
]
7
Table of Contents Page 1.0 Introduction 8 2.0 Methodology 8 3.0 Results & Discussion 10
3.1 Vulnerability Assessment: Jeh Island, Ailinglaplap, Marshall Islands 11 3.2 Vulnerability Assessment: Jabót Island, Marshall Islands 21 3.3 Vulnerability Assessment: Te Kavatoetoe Village, Fogafale Atoll, Tuvalu 29
4.0 Conclusions 41 5.0 Future Directions 41 Appendix
Workshop Timetables 43
Workshop Participants 46
Training Worksheets 48

8
1.0 Introduction
Low-lying atoll countries are considered the most vulnerable on earth. However, existing national evaluations of vulnerability frequently lack local assessments of the physical impacts of environmental change on reef islands. Studies tend to be undertaken at the national scale and may not reflect the vulnerability of communities on outer islands and the variations of vulnerability of communities within an island. Consequently, there is a need to better understand variations in the level of impacts of climate change within atoll nations. The project objectives were:
1. To build research skills in atoll countries to undertake rapid vulnerability assessments at the local scale
2. To identify local scale variances in atoll island vulnerability 3. To explore policy implications of local scale variations in island vulnerability
Workshops and rapid vulnerability assessments were undertaken in two countries, the Republic of the Marshall Islands and Tuvalu. Participants from collaborating agencies attended the training workshops and participated in the collection of data in case study villages. The use of case studies of different environments allows for the comparison of local scale variations in vulnerability. Data was collated and analysed and the implications of different inundation scenarios for future decision making were discussed. 2.0 Methodology
A three step methodology was developed for the project and implemented in both the Marshall Islands and Tuvalu. 2.1. Workshop on vulnerability assessment in atoll islands
In each country the project activities began with a two-day workshop outlining the project objectives and training workshop participants in the rapid assessment methodologies to assess vulnerability of communities to sea level rise. The workshop programs for each country are contained in Appendix 1. Training materials were developed to support the workshops and these are contained in Appendix 2. In summary, workshop training included:
• Use of aerial photographs and satellite images to define case study areas and identify key community resources;
• Use of simple survey techniques to capture information on historic flood/inundation events;
• Household surveys to determine localised impacts of coastal erosion and flooding on structures, water resources and crops;
• Dumpy level survey techniques to determine: o Land level of islands with respect to a known water level (e.g. Mean Low Lowest
Water, MLLW); o Elevation of structures (ground and floor level) with respect to a known water level
(e.g. Mean Low Lowest Water, MLLW);

CBA2
010-
06N
SY-K
ench
-FIN
AL R
EPO
RT
]
9
Field exercises were undertaken during the workshop sessions to train participants in the use of survey instruments and the reduction of data. The findings of these data were discussed and used to inform the techniques used in each case study. 2.2. Field data collection
To demonstrate the rapid vulnerability assessment methodology and enforce workshop training skills a number of case studies were undertaken. In the Republic of the Marshall Islands the research team travelled to two atoll islands (Jeh, in Ailinglaplap atoll and Jabót Island). Both islands were host to small villages. Due to the logistical constraints of travel the Tuvalu case study occurred in a large village (Te Kavatoetoe) on Fogafale, Funafuti atoll. This case study provided a useful illustration of the variation in land levels and exposure to certain risk within a village. In each case study data was primarily obtained by the collaborating Pacific Islands researchers under the supervision of the project leaders.
On the islands of Jeh and Jabót all members of the survey team met with community members and discussed the work to be undertaken. In the village of Te Kavatoetoe one of the team members, involved with the community committee, contacted members of the community to discuss the project with them. In each case study site the survey team spent the first day visiting households and recording information about the impacts of past flooding and erosion events.
The survey teams used basic surveying techniques (dumpy levels) to survey the land elevation along transects in each village. In Jeh village, 12 transects were undertaken. On Jabót, 6 transects were run across Jabót village. In Te Kavatoetoe, Funafuti, 10 transects were surveyed across the island from the lagoon flat to the oceanside reef flat. Each of the profiles was reduced to a known sea level datum.
The survey teams also gathered data on the elevation of houses in each village. The location of every house was located on aerial photographs and maps and each house numbered. The elevation of the ground at the edge of the houses and the elevation of the floor level of the houses was recorded. The elevation of structures such as external cook houses was also documented. 2.3. Data Analysis Workshop
Following field data collection a workshop was held to train collaborating researchers in the techniques required to analyse data. This included:
• Reduction and presentation of dumpy level survey data to known water level. • Mapping of land and household elevation data to produce contour maps.
Once primary data had been analysed workshops focussed on the use of data to determine the vulnerability of islands/communities to sea level rise. Training included:
• Generation of simple future sea-level rise scenarios (based on IPCC projections) • Simulations of land area susceptible to flooding as a consequence of sea level rise.
This was undertaken on topographic survey profiles and contour maps. • Quantification of land area and community assets susceptible to flooding under
future scenarios.

10
• Production of a report stating the vulnerability of each village to sea-level rise. Results were discussed to consider the impacts of different climate change scenarios for different communities. Identification of such differences in impacts is essential to support effective adaptation. The results were presented by the participants to senior government officials in each country. 3.0 Results & Discussion
Three reports were produced presenting the results. These reports are presented in the following sections.

CBA2
010-
06N
SY-K
ench
-FIN
AL R
EPO
RT
]
11
3.1 Case Study 1: Jeh Island, Ailinglaplap Atoll, Marshall Islands
Oblique aerial photograph of Jeh Island (foreground) Ailinglaplap Atoll, Marshall islands
3.1.1 Atoll Description
The case study island is located in Ailinglaplap atoll ( 839373.337 N, 275661.335 E) situated in the Ralik Chain 160 nautical miles west of Majuro. The atoll has a semi-continuous reef rim enclosing a lagoon. Approximately 100 vegetated reef islands are located on the atoll reef rim. Five of these islands contain villages.
3.1.2 Island Description
Physical characteristics
Jeh Island is located on the northern atoll reef rim of Ailinglaplap atoll. The island extends along the northern reef and follows the reef rim toward the south (Figure 1). The island is approximately 7 km long and varies in width from 150 to 600 m. The island is composed of sand and gravel sediments. The oceanside sections of islands contain a higher proportion of gravel and boulder-sized material. The lagoon shoreline comprises sand-size material. Anecdotal evidence indicates the western section of the island has recently been welded to the main island of Jeh through closing of a shallow intertidal passage.

12
Social characteristics
• The village of Jeh is located along the lagoon shoreline. The village is spread over a distance of 2.5 kms. The population is approximately 200.
• The houses are mainly constructed of wood with iron roofing. Houses have a separate cookhouse that is located near the main house. Houses are located on elevated coral gravel platforms.
• The water table is approximately 1.3-1.5 m below the surface. The majority of houses have both wells and rainwater tanks.
• Banana, coconut, taro, limes and other food crops are grown on the island. • Copra is the main product for people. Ailinglaplap is the highest producer of copra in the
Marshall islands • There is one main road that runs the length of Jeh and there is one vehicle on the island. • A runway is located in the southeastern section of the island.
3.1.3 Results
Table 3.1 Community information about flooding and erosion hazards
Coastal Erosion • Western and Eastern ends of Jeh experience frequent coastal erosion during high tides in the months of January to March.
• Eastern and Western main roads have also experienced flooding and damage. As a result, different paths have been made by the local community.
• Beach erosion along the lagoonside of Jeh village has been noted by locals.
Flooding • Major flooding occurs on low lying parts of the main road • During the months of January to March flooding erodes the
shoreline, damages shoreline food crops and increases salinity in groundwater wells
• Some parts of the road are affected by rainwater flooding Water • Most of the households have at least one water tank and a well
• Water quality of wells decreases during high tides • Rainwater tank quality decreases from salt spray during high tides
and strong winds Crop Damage • Shoreline crops like coconut trees, banana and pandanus plants
get washed away during storm surges and from coastal erosion • Inland crops like breadfruit, bananas, pandanus, papayas
pumpkins and lime trees are impacted by salt spray • Taro patches get salty during high tides

CBA2
010-
06N
SY-K
ench
-FIN
AL R
EPO
RT
]
13
Land elevation data
Ten elevation profiles were surveyed at points through Jeh village from the lagoon reef towards the ocean side of the island (Figure 3.1). Five of these profiles (2, 4, 6, 8, 10) extended the width of the island onto the ocean side reef flat. Two additional profiles (11 and 12) were set up in response to observed flooding of the road in the southern part of the island. Reduced survey profiles constructed by the participants are presented in Figure 3.2 and 3.3.
Figure 3.1. Location map of Jeh Island, Ailinglaplap showing location of survey benchmarks and survey profile lines.

14
Figure 3.2. Cross Island surveys, Jeh Island, Ailinglaplap. All profiles are reduced to Mean low lowest water level (MLLW). Location of profiles shown in Figure 3.1.

CBA2
010-
06N
SY-K
ench
-FIN
AL R
EPO
RT
]
15
Figure 3.3. Lagoon shoreline surveys through village, Jeh Island, Ailinglaplap. All profiles are reduced to Mean low lowest water level (MLLW). Location of profiles shown in Figure 3.1.

16
Figure 3.3 Continued. Lagoon shoreline surveys through village, Jeh Island, Ailinglaplap. All profiles are reduced to Mean low lowest water level (MLLW). Location of profiles shown in Figure 3.1.

CBA2
010-
06N
SY-K
ench
-FIN
AL R
EPO
RT
]
17
Table 3.2. Land elevations with respect to sea level (MLLW), Jeh Island, Ailinglaplap.
Profile Maximum lagoon shoreline elevation (m above MLLW)
Maximum oceanside elevation (m above MLLW)
1 2.029 -
2 2.078 3.878
3 2.095 -
4 2.061 3.707
5 1.919 -
6 1.925 3.509
7 1.759 -
8 2.048 3.395
9 1.62 -
10 1.703 2.714
11 1.84 -
12 1.52 -
Summary of Land Levels
• Lagoon land levels typically range from 1.6-2.09 m relative to MLLW. This equates to only -0.1 -0.3 m above high spring tide level (HST = 1.7 m).
• Oceanside land level ranges from 2.7 to 3.8 m above MLLW (1.0-2.0 m above spring high tide).
• The data indicate that the lagoon shoreline is significantly lower in elevation than the ocean shoreline.

18
Community Infrastructure Data
Table 3.3. Summary of land levels and house elevations on Jeh Island, Ailinglaplap relative to water level, spring high tide level and future sea-level rise.
Elevation reduced to Mean Low Lowest Water
Elevation with respect to highest tide (1.7m)
Elevation with respect to highest tide + 0.5 m sea-level rise (2.2m)
House Elevation lagoonside
(m)
Elevation landward side (m)
Floor elevation
(m)
Elevation lagoonside
(m)
Elevation landward side (m)
Floor elevation
(m)
Elevation lagoonside
(m)
Elevation landward side (m)
Floor elevation
(m)
1 2.059 2.019 2.099 0.359 0.319 0.399 -0.141 -0.181 -0.101
1a 1.979 1.989 0.279 0.289 -0.221 -0.211
2 2.229 2.029 0.529 0.329 0.029 -0.171
3 1.818 2.028 0.118 0.328 -0.382 -0.172
4 1.763 1.913 0.063 0.213 -0.437 -0.287
5 1.748 1.913 0.048 0.213 -0.452 -0.287
5a 1.813 0.113 -0.387
6 1.848 1.788 2.063 0.148 0.088 0.363 -0.352 -0.412 -0.137
7 2.233 2.138 2.278 0.533 0.438 0.578 0.033 -0.062 0.078
7a 1.878 0.178 -0.322
8 1.838 1.938 0.138 0.238 -0.362 -0.262
9 2.288 1.043 0.588 -0.657 0.088 -1.157
10 1.968 1.883 2.038 0.268 0.183 0.338 -0.232 -0.317 -0.162
11 2.023 0.323 -0.177
11a 1.978 2.078 0.278 0.378 -0.222 -0.122
12 1.928 1.798 2.208 0.228 0.098 0.508 -0.272 -0.402 0.008
13 2.198 2.018 2.238 0.498 0.318 0.538 -0.002 -0.182 0.038
13a 2.054 1.878 2.418 0.354 0.178 0.718 -0.146 -0.322 0.218
13b 1.978 1.948 0.278 0.248 -0.222 -0.252
14 2.418 3.088 0.718 1.388 0.218 0.888
15 2.208 0.508 0.008
16 2.018 1.998 2.018 0.318 0.298 0.318 -0.182 -0.202 -0.182
16a 2.118 2.168 0.418 0.468 -0.082 -0.032
17 1.741 2.076 0.041 0.376 -0.459 -0.124
18 1.706 1.761 1.836 0.006 0.061 0.136 -0.494 -0.439 -0.364
19 2.146 2.076 2.341 0.446 0.376 0.641 -0.054 -0.124 0.141
19a 2.026 3.083 0.326 1.383 -0.174 0.883
20 1.199 1.009 1.389 -0.501 -0.691 -0.311 -1.001 -1.191 -0.811
21 1.169 1.169 1.239 -0.531 -0.531 -0.461 -1.031 -1.031 -0.961
21a 1.089 -0.611 -1.111
22 1.779 1.839 2.049 0.079 0.139 0.349 -0.421 -0.361 -0.151
23 1.889 1.659 0.189 -0.041 -0.311 -0.541
24 1.669 1.789 -0.031 0.089 -0.531 -0.411
25 1.859 1.939 0.159 0.239 -0.341 -0.261
26 1.729 1.909 0.029 0.209 -0.471 -0.291

CBA2
010-
06N
SY-K
ench
-FIN
AL R
EPO
RT
]
19
27 1.839 1.769 1.929 0.139 0.069 0.229 -0.361 -0.431 -0.271
28 1.769 2.109 0.069 0.409 -0.431 -0.091
29 2.559 2.814 0.859 1.114 0.359 0.614
29a 2.694 2.639 2.769 0.994 0.939 1.069 0.494 0.439 0.569
30 2.589 2.379 2.7 0.889 0.679 1 0.389 0.179 0.5
31 1.529 2.379 -0.171 0.679 -0.671 0.179
32 1.844 2.019 0.144 0.319 -0.356 -0.181
33 1.959 1.959 0.259 0.259 -0.241 -0.241
34 1.789 1.769 1.849 0.089 0.069 0.149 -0.411 -0.431 -0.351
35 1.781 1.919 0.081 0.219 -0.419 -0.281
36 1.849 1.849 2.119 0.149 0.149 0.419 -0.351 -0.351 -0.081
37 1.999 2.329 0.299 0.629 -0.201 0.129
38 1.669 1.949 2.139 -0.031 0.249 0.439 -0.531 -0.251 -0.061
39 1.086 1.196 2.066 -0.614 -0.504 0.366 -1.114 -1.004 -0.134
39a 1.656 1.736 1.746 -0.044 0.036 0.046 -0.544 -0.464 -0.454
40 -0.004 1.556 -1.704 -0.144 -2.204 -0.644
41 1.716 1.326 1.856 0.016 -0.374 0.156 -0.484 -0.874 -0.344
42 1.736 0.036 -0.464
43 1.916 1.986 0.216 0.286 -0.284 -0.214
44 1.926 1.966 0.226 0.266 -0.274 -0.234
45 1.106 1.106 -0.594 -0.594 -1.094 -1.094
46 1.766 1.916 0.066 0.216 -0.434 -0.284
47 1.736 0.036 -0.464
47 1.896 1.921 0.196 0.221 -0.304 -0.279
48 2.071 2.026 0.371 0.326 -0.129 -0.174

20
3.1.4 Discussion
Current Vulnerability Currently the village on Jeh experiences periodic coastal flooding under extreme high tides and storm events. Erosion of the shoreline has also been observed in places. The road at both ends of the island is experiencing inundation at spring high tide. Future Vulnerability Under a scenario of a 0.5 metre sea level rise (as projected by the IPCC to 2100) the village of Jeh will experience flooding of up to 90% of existing structures under higher tidal conditions. This flooding level appears to equate to current extreme flood impacts. Therefore under mid-range projections of sea-level rise Jeh village will be vulnerable to increased frequency of flooding.
CBA2
010-
06N
SY-K
ench
-FIN
AL R
EPO
RT
]
21
3.2 Case Study 2: Jabót Island, Marshall Islands
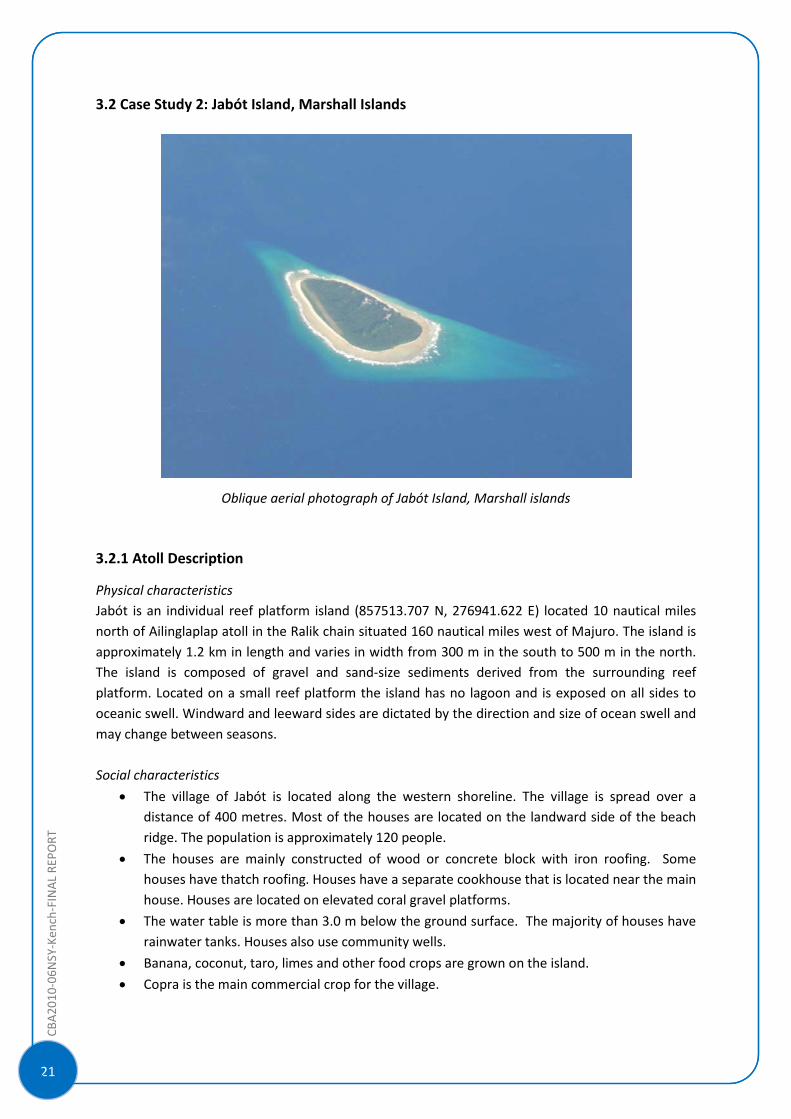
Oblique aerial photograph of Jabót Island, Marshall islands 3.2.1 Atoll Description
Physical characteristics Jabót is an individual reef platform island (857513.707 N, 276941.622 E) located 10 nautical miles north of Ailinglaplap atoll in the Ralik chain situated 160 nautical miles west of Majuro. The island is approximately 1.2 km in length and varies in width from 300 m in the south to 500 m in the north. The island is composed of gravel and sand-size sediments derived from the surrounding reef platform. Located on a small reef platform the island has no lagoon and is exposed on all sides to oceanic swell. Windward and leeward sides are dictated by the direction and size of ocean swell and may change between seasons.
Social characteristics
• The village of Jabót is located along the western shoreline. The village is spread over a distance of 400 metres. Most of the houses are located on the landward side of the beach ridge. The population is approximately 120 people.
• The houses are mainly constructed of wood or concrete block with iron roofing. Some houses have thatch roofing. Houses have a separate cookhouse that is located near the main house. Houses are located on elevated coral gravel platforms.
• The water table is more than 3.0 m below the ground surface. The majority of houses have rainwater tanks. Houses also use community wells.
• Banana, coconut, taro, limes and other food crops are grown on the island. • Copra is the main commercial crop for the village.
22
• A runway is located in the southeastern section of the island. However, this has not been used in recent years.
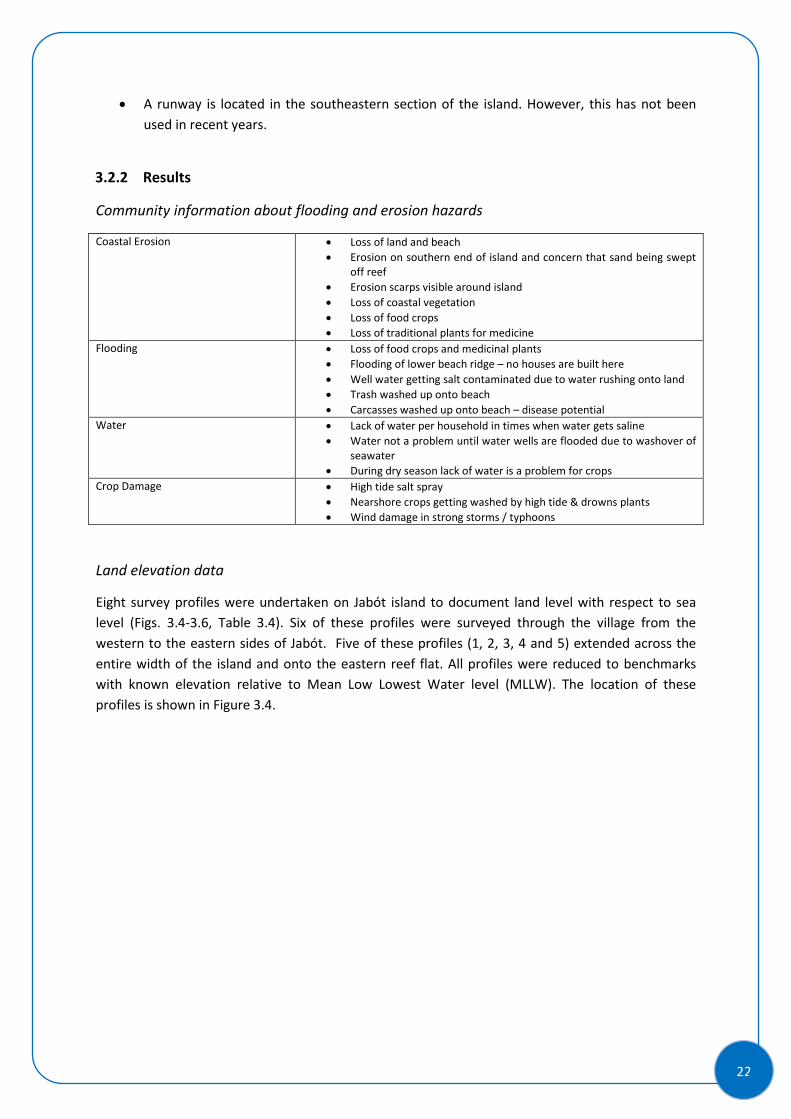
3.2.2 Results
Community information about flooding and erosion hazards
Coastal Erosion
• Loss of land and beach • Erosion on southern end of island and concern that sand being swept
off reef • Erosion scarps visible around island • Loss of coastal vegetation • Loss of food crops • Loss of traditional plants for medicine
Flooding • Loss of food crops and medicinal plants • Flooding of lower beach ridge – no houses are built here • Well water getting salt contaminated due to water rushing onto land • Trash washed up onto beach • Carcasses washed up onto beach – disease potential
Water • Lack of water per household in times when water gets saline • Water not a problem until water wells are flooded due to washover of
seawater • During dry season lack of water is a problem for crops
Crop Damage • High tide salt spray • Nearshore crops getting washed by high tide & drowns plants • Wind damage in strong storms / typhoons
Land elevation data
Eight survey profiles were undertaken on Jabót island to document land level with respect to sea level (Figs. 3.4-3.6, Table 3.4). Six of these profiles were surveyed through the village from the western to the eastern sides of Jabót. Five of these profiles (1, 2, 3, 4 and 5) extended across the entire width of the island and onto the eastern reef flat. All profiles were reduced to benchmarks with known elevation relative to Mean Low Lowest Water level (MLLW). The location of these profiles is shown in Figure 3.4.

CBA2
010-
06N
SY-K
ench
-FIN
AL R
EPO
RT
]
23
Figure 3.4 Location map of Jabót Island showing position of survey benchmarks and survey profile lines.

24
Figure 3.5. Cross Island surveys Jabót Island. All profiles are reduced to MLLW. Location of profiles shown in Figure 3.4.

CBA2
010-
06N
SY-K
ench
-FIN
AL R
EPO
RT
]
25
Figure 3.6. Western shoreline surveys through Jabót village. All profiles are reduced to MLLW. Location of profiles shown in Figure 3.4.

26
Table 3.4. Land elevations with respect to sea level Jabót island (MLLW)
Profile Maximum western shoreline elevation (m
above MLLW)
Maximum eastern elevation (m above
MLLW)
Runway elevation taken from the middle of the way (m above MLLW)
1 6.114 3.829 3.23
2 6.3 3.39 2.814
2A 5.64 -
3 5.367 3.325 2.913
4 4.944 3.158 -
4A 4.801 3.079
5 2.755 3.62 -
Summary of land levels
• Western island ridge heights range from 2.755 m in the north to 6.3 m relative to MLLW in the south (P2). This equates to 1-4.6 metres above high spring tide level (HST = 1.7 m).
• Eastern shoreline ridge levels range from 3.1-3.8 metres above MLLW (1.4-2.1 m above spring high tide).
• The runway, located on the Eastern shoreline has elevations ranging from 2.8 to 3.2 m above MLLW.
• The data indicate that the western shoreline is significantly higher in elevation than the ocean shoreline. Furthermore, the island ridge on the western side of the island is highest in the south and slopes northward.

CBA2
010-
06N
SY-K
ench
-FIN
AL R
EPO
RT
]
27
Community Infrastructure Data
Table 3.5. Summary of land levels and house elevations on Jabót Island relative to water level, spring high tide level and future sea-level rise.
Elevation reduced to Mean Low Lowest Water
Elevation with respect to highest tide (1.7m)
Elevation with respect to highest tide + 0.5 m sea-level rise (2.2m)
House Elevation lagoonsid
e (m)
Elevation landward side (m)
Floor elevation
(m)
Elevation lagoonside
(m)
Elevation landward side (m)
Floor elevation
(m)
Elevation lagoonside
(m)
Elevation landward side (m)
Floor elevation
(m)
21 6.088 6.018 6.193 4.388 4.318 4.493 3.888 3.818 3.993
19 5.817 5.817 5.892 4.117 4.117 4.192 3.617 3.617 3.692
20 6.477 5.872 6.456 4.777 4.172 4.756 4.277 3.672 4.256
12 5.577 5.707 3.877 4.007 3.377 3.507
13 5.747 6.067 4.047 4.367 3.547 3.867
14 5.087 4.827 5.082 3.387 3.127 3.382 2.887 2.627 2.882
15 5.852 6.017 4.152 4.317 3.652 3.817
16 5.742 5.727 5.997 4.042 4.027 4.297 3.542 3.527 3.797
16a 5.147 5.287 3.447 3.587 2.947 3.087
17 5.827 5.542 6.002 4.127 3.842 4.302 3.627 3.342 3.802
23 4.892 4.997 5.177 3.192 3.297 3.477 2.692 2.797 2.977
24 4.487 5.172 2.787 3.472 2.287 2.972
26 2.912 3.012 1.212 1.312 0.712 0.812
10 5.172 5.272 5.322 3.472 3.572 3.622 2.972 3.072 3.122
1 4.387 4.362 4.672 2.687 2.662 2.972 2.187 2.162 2.472
2 4.377 4.652 1.652 2.677 2.952 -0.048 2.177 2.452 -0.548
3 4.012 4.172 3.792 2.312 2.472 2.092 1.812 1.972 1.592
4 3.292 2.452 1.592 0.752 1.092 0.252
5 4.582 2.882 2.382
6 4.502 4.642 2.802 2.942 2.302 2.442
7 5.242 5.442 3.542 3.742 3.042 3.242
8 5.082 5.392 3.382 3.692 2.882 3.192
9 5.352 5.422 5.562 3.652 3.722 3.862 3.152 3.222 3.362
27 4.492 4.702 2.792 3.002 2.292 2.502
28 4.812 5.062 3.112 3.362 2.612 2.862
29 4.312 2.612 2.112
3.2.3 Discussion
Current Vulnerability
The village of Jabót is located on the elevated western island ridge. The ridge is 2-3 m above current spring high tide levels and well above current flood levels. Houses are also set well back from the active beach. Consequently, the village is relatively protected from current storm surge inundation.

28
Future Vulnerability
Under a scenario of a 0.5 metre sea level rise (as projected by the IPCC to 2100) the village of Jabót is sufficiently elevated that storm surge inundation will not increase significantly. Inundation of lower lying structures and some gardens may be experienced. Areas of contemporary erosion may be exacerbated under this scenario and these points may require ongoing observation. It is important that new structures are not built seaward of existing structures. It appears that mid-range projections of sea-level rise in Jabót village will not result in a significant increase in flood impact on existing structures.

CBA2
010-
06N
SY-K
ench
-FIN
AL R
EPO
RT
]
29
3.3 Case Study 3: Te Kavatoetoe Village, Fogafale, Tuvalu 3.3.1 Case Study Islands The case study island of Fogafale is located in Funafuti atoll, situated in Tuvalu. The atoll is approximately 18 km long and 14 km wide and has a semi-continuous reef rim enclosing a lagoon. The atoll has approximately 30 vegetated reef islands located on the atoll reef rim. The population is largely located on the island of Fogafale.
Island Physical characteristics
Fogafale is located on the north-eastern atoll reef rim of Funafuti atoll. The island extends along the northern reef and follows the reef rim toward the south (see Figure 3.7). The island is approximately 6 km long and varies in width from 60 to 500 m. The island is composed of cobble and gravel sediments. The oceanside sections of islands contain a higher proportion of gravel and boulder-sized material. The lagoon shoreline comprises sand-size sediments and small cobbles. The case study site of Te Kavatoetoe encompasses the stretch of island from the southern end of the runway to the southern tip of the island.
Social Characteristics
• The town of Fogafale is concentrated along the lagoon shoreline with some housing established on the ocean ridge line. The settlement is spread over the length of the island. The population is approximately 6,000 people.
• Fogafale is the capital of Tuvalu and houses the government buildings.
• The settlement of Te Kavatoetoe consists of approximately 120 households.
• The houses are mainly constructed of either concrete block or wood with iron roofing. Some houses have a separate cookhouse that is located near the main house. Many houses are elevated above ground level by concrete or wooden piles.
• Most houses have rainwater tanks, though some houses rely on community cisterns for water. There is a desalination plant on island.
• Banana, coconut, pulaka, breadfruit and other food crops are grown on the island.
• At the northern and southern end of the island there is one main road.
• A runway is located in the eastern section of the island.

30
Figure 3.7. Location of case study island of Fogafale, Funafuti atoll, Tuvalu.
3.3.2 Results
Community Information About Flooding and Erosion Hazards
Coastal Erosion • Southern main road has experienced flooding and damage with storm surge overwash. Debris was washed across to the ocean side of the island.
• Storm surge events have also occurred over the ocean ridge.
Flooding • Major flooding occurs on low lying parts of the island and ponding of water can occur.
• During the king tides ground water is pushed up to exacerbate flooding in some parts of the island.
• King tides push up sewage from unlined septic pits to surface.
Water • Households are dependent on rainwater tanks and are susceptible to periods of drought
• Rainwater quality decreases from salt spray during high tides and strong winds
Crop Damage • Crops like coconut trees, banana and pandanus plants damaged during storm surges and from coastal erosion
• Pulaka patches get salty during high tides

CBA2
010-
06N
SY-K
ench
-FIN
AL R
EPO
RT
]
31
Land Elevation Data
A total of 10 cross island transects were surveyed across the case study settlement of Te Kavatoetoe. Profiles were evenly spaced to document changes in island physical dimensions (Figure 3.8). All surveys were tied to established benchmarks located along the island. Each benchmark has a known elevation to tidal datum.
Each profile was reduced to tidal datum using benchmark elevations. Summary profiles of the 10 transects are presented in Figure 3.9.
Figure 3.8. Location of survey profiles across Te Kavatoetoe settlement, Fogafale island.

32
Distance (m)
Elev
atio
n (m
)

CBA2
010-
06N
SY-K
ench
-FIN
AL R
EPO
RT
]
33
1
2
3
4
5
6
7
0 20 40 60 80 100 120 140 160
Profile 4 - FUN 161C
HAT
1
2
3
4
5
6
7
0 20 40 60 80 100 120 140 160
Profile 5: FUN 163
HAT
Distance (m)
Elev
atio
n (m
)

34
1
2
3
4
5
6
7
0 20 40 60 80 100 120 140 160
Profile 8: FUN 168
HAT
Distance (m)
Elev
atio
n (m
)

CBA2
010-
06N
SY-K
ench
-FIN
AL R
EPO
RT
]
35
Figure 3.9 Cross island surveys at 10 locations along Te Kavatoetoe settlement, Fogafale. Surveys are oriented from lagoon to ocean. Surveys are reduced to tidal datum (zero on the tide gauge). The level of 3.52 m relative level (RL) is the approximate level of highest astronomical tide (HAT). Location of profiles found in Figure 3.8.
A summary of the major land levels on each profile is contained in Table 3.6.
Table 3.6. Summary of maximum and minimum elevations on each profile along Te Kavatoetoe settlement, Fogafale.
Profile Maximum Lagoon Ridge Elevation (m
R.L.)
Minimum Island Basin Elevation (m
R.L.)
Maximum Ocean Ridge Elevation (m R.L.)
1 4.12 3.24 4.85
2 4.72 3.30 5.08
3 4.74 3.29 4.76
4 4.22 3.19 -
5 4.20 2.02 4.86
6 4.10 1.98 4.74
7 4.56 3.33 4.86
8 4.45 3.26 6.56
9 4.18 4.12 5.82
10 4.00 3.41 5.50
Distance (m)
Elev
atio
n (m
)

36
Summary of Land Levels
• Te Kavatoetoe ranges in width from 160 m in the north and tapers to approximately 80 m along the southern section.
• The island is characterised by high ridges on both the lagoon and ocean margins with a lower elevation internal basin.
• The lagoon ridge has a mean elevation of 4.33 m RL. Maximum lagoon ridge elevation is 4.73 m in the north (Profile 3). The minimum elevation is 4.0 m in profile 10 in the south.
• The ocean ridge has a mean elevation of 5.23m RL. Maximum ocean ridge heights are found in the south (e.g. 6.5 m RL on profile 8). The minimum ocean ridge elevation is 4.76 m RL in profile 3.
• As the ocean ridge gets higher in the south the lagoon ridge becomes lower in elevation. This may be a result of human modification.
• The minimum levels of the island interior range from a maximum 4.123m RL (Profile 9) to 1.98 m RL (Profile 6). Both profiles 5 and 6 have minimum elevation levels of 2.0 m RL or less which reflect the location of the borrow pit. Generally other land levels outside the borrow pits are over 3 m RL.
Community Infrastructure Data
Ground and floor level elevations at each structure in Te Kavatoetoe settlement were recorded with respect to tidal datum. Two scenarios were generated to examine the susceptibility of dwellings to flooding. Scenario 1 examined the effect of extreme high water level (approximate known highest astronomical tide). Scenario 2 examined the effect of a 0.5 metre increase in sea level imposed on highest astronomical tide (RL 4.02m). This increase is consistent with IPCC projects for sea level change to 2100. This data is presented in Table 3.7.

CBA2
010-
06N
SY-K
ench
-FIN
AL R
EPO
RT
]
37
Table 3.7. Summary of land levels and house elevations on Te Kavatoetoe (running north to south), Fongafale relative to water level, approximate highest astronomical tide (HAT) and future sea-level rise.
HOUSE Reduced Tidal Level (m R.L.)
Elevation Difference to HAT = 3.52 m R.L.
Elevation Difference to HAT + 0.5 m (4.02 m)
Ground Level Floor Level Ground Level
Floor Level Ground Level Floor Level
X1 3.74 4.25 0.22 0.73 -0.28 0.23
X2 3.89 4.73 0.37 1.21 -0.13 0.71
X3 3.80 4.53 0.28 1.01 -0.22 0.51
X4 3.67 4.39 0.15 0.87 -0.35 0.37
X5 3.55 4.25 0.03 0.73 -0.47 0.23
X6 3.76 4.28 0.24 0.76 -0.26 0.26
X7 3.54 3.59 0.02 0.07 -0.48 -0.43
X8 3.72 4.05 0.20 0.53 -0.30 0.03
X9 3.60 3.91 0.08 0.39 -0.42 -0.11
X10 3.74 4.32 0.22 0.80 -0.28 0.30
X11 3.51 3.64 -0.01 0.12 -0.51 -0.38
X12 3.61 3.89 0.09 0.37 -0.41 -0.13
X13 3.56 3.93 0.04 0.41 -0.46 -0.09
X14 3.67 4.09 0.15 0.57 -0.35 0.07
X15 3.84 4.28 0.32 0.76 -0.18 0.26
X16 3.48 4.22 -0.04 0.70 -0.54 0.20
X17 3.60 3.76 0.08 0.24 -0.42 -0.26
X18 3.50 3.82 -0.02 0.30 -0.52 -0.20
X19 3.53 3.75 0.01 0.23 -0.49 -0.27
X20 3.57 3.76 0.05 0.24 -0.45 -0.26
X21 3.63 4.31 0.11 0.79 -0.39 0.29
X22 3.69 4.53 0.17 1.01 -0.33 0.51
X23 3.59 5.13 0.07 1.61 -0.43 1.11
X24 3.49 3.65 -0.03 0.13 -0.53 -0.37
X25 3.37 4.05 -0.15 0.53 -0.65 0.03
X26 3.31 4.11 -0.21 0.59 -0.71 0.09
X27 3.49 4.26 -0.03 0.74 -0.53 0.24
X28 3.54 3.71 0.02 0.19 -0.48 -0.31
X29 3.71 4.63 0.19 1.11 -0.31 0.61
X30 3.90 6.90 0.38 3.38 -0.12 2.88
X31 3.39 3.87 -0.14 0.35 -0.64 -0.15
X32 3.30 3.87 -0.22 0.35 -0.72 -0.15
X33 3.44 3.75 -0.08 0.23 -0.58 -0.27
X34 3.43 4.20 -0.09 0.68 -0.59 0.18
X35 3.37 3.97 -0.16 0.45 -0.65 -0.05
F1 3.53 3.98 0.01 0.46 -0.49 -0.04
X36 3.36 3.88 -0.16 0.36 -0.66 -0.14
X37 3.36 3.82 -0.16 0.30 -0.66 -0.20
X38 4.03 4.75 0.51 1.23 0.01 0.73
X39 3.37 4.38 -0.15 0.86 -0.65 0.36

38
X40 3.36 3.36 -0.16 -0.16 -0.66 -0.66
91 3.52 3.77 0.00 0.25 -0.50 -0.25
90 3.25 3.88 -0.27 0.36 -0.77 -0.14
89 3.54 3.90 0.02 0.38 -0.48 -0.12
88 3.18 3.96 -0.34 0.44 -0.84 -0.06
87 3.25 3.81 -0.27 0.29 -0.77 -0.21
86 3.31 3.99 -0.21 0.47 -0.71 -0.03
85 3.18 3.73 -0.34 0.21 -0.84 -0.29
84 3.61 4.03 0.09 0.51 -0.41 0.01
83 3.78 4.16 0.26 0.64 -0.24 0.14
82 4.20 4.42 0.68 0.90 0.18 0.40
81 4.30 5.09 0.78 1.57 0.28 1.07
80 4.41 5.03 0.89 1.51 0.39 1.01
79 3.49 3.80 -0.03 0.28 -0.53 -0.22
78 3.12 3.35 -0.40 -0.17 -0.90 -0.67
77 3.25 3.59 -0.27 0.07 -0.77 -0.43
76 3.14 3.74 -0.38 0.22 -0.88 -0.28
75 3.68 4.47 0.16 0.95 -0.34 0.45
73 4.04 4.17 0.52 0.65 0.02 0.15
72 4.00 4.23 0.48 0.71 -0.02 0.21
71 4.20 4.84 0.68 1.32 0.18 0.82
70 3.61 4.56 0.09 1.04 -0.41 0.54
68 3.31 4.53 -0.21 1.01 -0.71 0.51
67 4.13 4.46 0.61 0.94 0.11 0.44
66 4.13 4.64 0.61 1.12 0.11 0.62
65 4.10 4.61 0.58 1.09 0.08 0.59
63 3.70 4.38 0.18 0.86 -0.32 0.36
62 4.11 4.42 0.59 0.90 0.09 0.40
60 3.80 4.16 0.28 0.64 -0.22 0.14
59 3.73 4.25 0.21 0.73 -0.29 0.23
58 3.71 4.04 0.19 0.52 -0.31 0.02
57 3.78 3.78 0.26 0.26 -0.24 -0.24
56 3.74 3.74 0.22 0.22 -0.28 -0.28
55 3.78 4.04 0.26 0.52 -0.24 0.02
54 4.33 4.41 0.81 0.89 0.31 0.39
53 3.78 3.78 0.26 0.26 -0.24 -0.24
51 3.84 4.45 0.32 0.93 -0.18 0.43
50 3.81 3.81 0.29 0.29 -0.21 -0.21
49 3.84 4.15 0.32 0.63 -0.18 0.13
48 3.95 4.61 0.43 1.09 -0.07 0.59
45 3.92 4.37 0.40 0.85 -0.10 0.35
44 4.00 4.42 0.48 0.90 -0.02 0.40
43 3.99 4.72 0.47 1.20 -0.03 0.70
42 2.26 3.05 -1.26 -0.47 -1.76 -0.97
41 2.73 3.92 -0.79 0.40 -1.29 -0.10
40 3.16 4.32 -0.36 0.80 -0.86 0.30
38 4.78 5.32 1.26 1.80 0.76 1.30
37 2.33 3.95 -1.19 0.43 -1.69 -0.07

CBA2
010-
06N
SY-K
ench
-FIN
AL R
EPO
RT
]
39
36 4.07 4.34 0.55 0.82 0.05 0.32
35 4.22 4.59 0.70 1.07 0.20 0.57
34 4.11 4.48 0.59 0.96 0.09 0.46
33 4.22 4.39 0.70 0.87 0.20 0.37
32 3.95 4.28 0.43 0.76 -0.07 0.26
31 4.29 4.42 0.77 0.90 0.27 0.40
30 4.13 4.44 0.61 0.92 0.11 0.42
29 4.38 4.99 0.86 1.47 0.36 0.97
28 4.18 4.71 0.66 1.19 0.16 0.69
27 3.81 4.38 0.29 0.86 -0.21 0.36
26 3.59 4.41 0.07 0.89 -0.43 0.39
25 3.42 4.00 -0.10 0.48 -0.60 -0.02
24 3.77 4.30 0.25 0.78 -0.25 0.28
23 3.46 4.04 -0.06 0.52 -0.56 0.02
22 4.07 4.38 0.55 0.86 0.05 0.36
21 4.67 4.67 1.15 1.15 0.65 0.65
19 4.83 4.95 1.31 1.43 0.81 0.93
18 3.81 4.65 0.29 1.13 -0.21 0.63
17 5.15 5.99 1.63 2.47 1.13 1.97
16 4.61 5.25 1.09 1.73 0.59 1.23
15 5.79 6.48 2.27 2.96 1.77 2.46
14 4.11 4.80 0.59 1.28 0.09 0.78
13 4.31 4.74 0.79 1.22 0.29 0.72
12 4.80 5.67 1.28 2.15 0.78 1.65
10 4.95 5.50 1.43 1.98 0.93 1.48
9 4.73 5.14 1.21 1.62 0.71 1.12
8 4.16 5.25 0.64 1.73 0.14 1.23
7 4.05 4.74 0.53 1.22 0.03 0.72
6 3.51 4.60 -0.01 1.08 -0.51 0.58
5 5.18 5.53 1.66 2.01 1.16 1.51
4 5.03 5.61 1.51 2.09 1.01 1.59
3 4.48 5.06 0.96 1.54 0.46 1.04
1 4.46 4.62 0.94 1.10 0.44 0.60
3.3.3 Discussion
Current Vulnerability
• Currently the settlement of Te Kavatoetoe experiences coastal flooding under extreme high tides and storm events. Erosion of the shoreline has also been observed in places. The road at the southern end of the profile experiences inundation under extreme events.
• The elevation of the island ridges are higher than highest astronomical tide in all cases. This implies that the ridges provide a buffer and offset the potential for marine flooding under non storm conditions. This highlights the importance of these ridges in protecting the lower lying houses behind.

40
• However, under even moderate storm conditions (that would further elevate water) some overtopping is likely where the ridge elevation is lowest. A number of past events confirm this. Under these conditions the ground level around approximately 42% of houses has the potential to be inundated, but the majority of floor elevations are above the inundation level. Potentially 4% of houses may experience flooding about floor elevation under this scenario.
• It is also noted, that under these extreme tidal conditions that the flooding is exacerbated by the elevation of the water table and may not purely a function of tidal overwash. This factor may exacerbate flooding in areas of lower elevation.
• There is a geographic variation in housing susceptibility for flooding. It is possible to identify groups of houses that have a higher risk of marine flooding, water table flooding and ponding through lack of drainage. This allows for the identification of potential hotspots for flooding events.
Future Vulnerability
• Under a scenario of highest astronomical tide and elevated sea-level (based on IPCC projections but also reflective of moderate storm conditions) overtopping of some parts of the island ridge will occur. Given the observations above regarding local variation in experiences of marine inundation and local flooding, under this scenario 78 % of land level has the potential to be flooded and 34 % of households may experience floor level flooding.
• This level of flooding is consistent with contemporary storm events and flooding. It s worth noting that under increased sea level scenarios this frequency of flooding is likely to increase.
3.4. Conclusions
The settlement of Te Kavatoetoe consists of a set of complex physical and social characteristics. The environmental interactions mean that simple models of sea level inundation do not provide the full insight into the local scale potential for flooding of some households. While the existing island ridge provides a buffer under certain water level scenarios, flooding may still be experienced as a result of water table elevation and rain water ponding.
Analysis shows that there is significant variation in morphology of Te Kavatoetoe. As a consequence, this influences spatial variation in susceptibility to flooding. Detailed analysis enables the identification of hotspots at greatest risk of flooding.

CBA2
010-
06N
SY-K
ench
-FIN
AL R
EPO
RT
]
41
4.0 Conclusions
The aim of this project was to build the capacity of in-country scientists to interpret atoll variation in vulnerability. The project targeted collaboration with participants from two Pacific atoll countries, the Republic of the Marshall Islands and Tuvalu.
The project objectives were:
• To build research skills in atoll countries to undertake rapid vulnerability assessments at the local scale
• To identify local scale variances in atoll island vulnerability • To explore policy implications of local scale variations in island vulnerability
Workshops and field based case studies were designed to provide training on methods to undertake rapid assessment of vulnerability of reef islands. A range of simple field techniques were used to guide rapid assessment of the biophysical vulnerability of island communities to sea level rise and flooding. Such techniques included: mapping of key community resources, assets and coastal characteristics, and surveying to establish the relative position and elevation of major community assets, resources and the coast to sea level and extreme sea levels.
The use of case studies of different island environments allowed the comparison of local scale variations in vulnerability. After training workshops were completed in Majuro, Republic of the Marshall Islands and Fogafale, Tuvalu, workshop participants undertook rapid vulnerability assessments on case study sites. In the Republic of the Marshall Islands assessments were undertaken on Jeh island, Ailinglaplap atoll and Jabót island. In Tuvalu assessments were undertaken in the village of Te Kavatoetoe on Fogafale island, Funafuti atoll.
Analysis of the data collected at each case study site allowed for assessment of island vulnerability in response to future sea level change scenarios. The scenarios were adopted from the IPPC projections and integrated with field based data to assess the assets, resources and coastal areas at risk from a range of sea-level rise scenarios and extreme water levels. This analysis allowed participants to explore local differences in vulnerability to sea level change.
The data analysis revealed considerable variation in local scale vulnerability both within and between islands. These variations can relate to the island morphology and the height of structures relative to sea-level. These observations are of importance in informing local decision makers of areas of risk of inundation and prioritizing future adaptation efforts.
5.0 Future Directions
There are still significant gaps in understanding of local scale variation in vulnerability. The ongoing potential for work of this type to be undertaken in the partner countries and in other states is significant.
The variation in community exposure to inundation within and between villages highlights the need for focused effort on improving understanding of vulnerability at this resolution. An increase in the number of case studies in each country would improve the rigor of discussions about atoll vulnerability and provide for more detailed information to support adaptation strategies. These approaches are easily replicated in other small island states and a network of such assessments across the Asia-Pacific region would significantly strengthen understanding of current and future risks of inundation faced by island communities.

42
The transferability of the methods used and the low requirements for technological equipment are strengths of these projects. By training in-country partners there is an opportunity to embed such rapid assessments in existing biophysical and social evaluations, strengthening local scale understanding of community vulnerability. It is apparent that these techniques are easily integrated into existing projects and would strengthen the scientific understanding of many local scale adaptation programs.

CBA2
010-
06N
SY-K
ench
-FIN
AL R
EPO
RT
]
43
Appendix Workshop Timetables Republic of Marshall Islands Workshops 7th, 8th, 21st and 22nd September 2010 held at the Long Island Hotel, Majuro. TUES 7TH SEPT LONG ISLAND HOTEL, MAJURO, REPUBLIC OF THE MARSHALL ISLANDS
09.00- 10.00
10.00-10.30
10.30-12.00
12.00-13.00
13.00-17.00
INTRODUCTION
• WHAT DO WE MEAN BY VULNERABILITY? • WHAT MAKES COMMUNITIES VULNERABLE? • WHO AND WHAT IS VULNERABLE? • WHY IS LOCAL SCALE ASSESSMENT IMPORTANT? • WHAT THINGS SHOULD BE MEASURED? • DEVELOPING A VULNERABILITY CHECKLIST
MORNING TEA
METHOD
• HOW DO WE DO A VULNERABILITY ASSESSMENT? • DEVELOPING SURVEYING SKILLS
LUNCH
CASE STUDY 1: (MAJURO)
1. IDENTIFYING A SITE OF VULNERABILITY 2. DEVELOPING A SURVEY PLAN 3. MAPPING COMMUNITY (PHYSICAL ENVIRONMENT AND RESOURCES)
- PROFILES
WED 8TH SEPT CASE STUDY 1: (MAJURO)
09.00-12.00
12.00-13.00
13.00-15.00
18.00
1. MAPPING COMMUNITY (PHYSICAL ENVIRONMENT AND RESOURCES) - ELEVATION POINTS
LUNCH
HOW IS DATA USED?
WHAT CAN THIS TELL US?
DEPART FOR AILINGLAPLAP
CASE STUDY 2 (AILINGLAPLAP)
1. TALKING WITH COMMUNITY - UNDERSTANDING LOCAL VULNERABILITY (WHO, WHAT, WHERE AND WHY?)
2. DEVELOPING A SURVEY PLAN 3. MAPPING COMMUNITY (PHYSICAL ENVIRONMENT AND RESOURCES) 4. ENTERING THE DATA
CASE STUDY 3 (JABÓT)
1. TALKING WITH COMMUNITY - UNDERSTANDING LOCAL VULNERABILITY (WHO, WHAT, WHERE AND WHY?)
2. DEVELOPING A SURVEY PLAN

44
3. MAPPING COMMUNITY (PHYSICAL ENVIRONMENT AND RESOURCES) 4. ENTERING THE DATA
TUES 21ST SEPT
09.30-12.00
12.00-13.00
13.00-16.00
WHAT DATA WAS COLLECTED?
LUNCH
HOW IS THIS DATA ANALYSED
WED 22ND SEPT
09.00 -13.00 DISCUSSING SCENARIOS
PRESENTING FINDINGS

CBA2
010-
06N
SY-K
ench
-FIN
AL R
EPO
RT
]
45
Tuvalu Workshop 7th, 8th, 14th and 15th February 2011 held in the conference room at the Tuvaluan government buildings, Fogafale. MONDAY 7TH FEBRUARY TUVALUAN GOVERNMENT CONFERENCE ROOM
09.00- 10.00
10.00-10.30
10.30-12.00
12.00-13.00
13.00-17.00
INTRODUCTION
• WHAT DO WE MEAN BY VULNERABILITY? • WHAT MAKES COMMUNITIES VULNERABLE? • WHO AND WHAT IS VULNERABLE? • WHY IS LOCAL SCALE ASSESSMENT IMPORTANT? • WHAT THINGS SHOULD BE MEASURED? • DEVELOPING A VULNERABILITY CHECKLIST
MORNING TEA
METHOD
• HOW DO WE DO A VULNERABILITY ASSESSMENT? • DEVELOPING SURVEYING SKILLS
LUNCH
CASE STUDY 1: (TUVALU GOVERNMENT BUILDINGS)
1. IDENTIFYING A SITE OF VULNERABILITY 2. DEVELOPING A SURVEY PLAN 3. MAPPING COMMUNITY (PHYSICAL ENVIRONMENT AND RESOURCES)
- PROFILES
TUES 8TH FEB CASE STUDY 1: (TUVALU GOVERNMENT BUILDINGS)
09.00-12.00
12.00-13.00
13.00-15.00
MAPPING COMMUNITY (PHYSICAL ENVIRONMENT AND RESOURCES) - ELEVATION POINTS
LUNCH
HOW IS DATA USED?
WHAT CAN THIS TELL US?
WED-FRI 9TH-11TH FEB CASE STUDY 2 (TE KAVATOETOE VILLAGE, FOGAFALE)
1. DEVELOPING A SURVEY PLAN 2. MAPPING COMMUNITY (PHYSICAL ENVIRONMENT AND RESOURCES) 3. ENTERING THE DATA
MON 14TH FEB
9.30-12.00
12.00-13.00
13.00-16.00
COMPLETION OF FIELD DATA COLLECTION AND ENTERING DATA
WHAT DATA WAS COLLECTED?
LUNCH
HOW IS THIS DATA ANALYSED?
TUES 15TH FEB PRESENTATION OF FINDINGS
9.00-13.00
DISCUSSING SCENARIOS
PRESENTING FINDINGS

46
Workshop Participants Dr Paul Kench School of Environment The University of Auckland Private Bag 92019 649 373 7599 extn 88440 [email protected] Dr Susan Owen School of Environment The University of Auckland Private Bag 92019 649 373 7599 extn 85185 [email protected] Mr Alan Resture School of Environment The University of Auckland Private Bag 92019 [email protected] Dr Murray Ford College of the Marshall Islands, P.O. Box 1258, Majuro, Republic of the Marshall Islands MH 96960 Tel. Number: +1 692 625-3394 Fax Number: + 1 692 625-7203 [email protected] Mr Doan Trevor Marshall Islands Conservation Society, P.O. Box 1234, Majuro, Republic of the Marshall Islands, 96960 Tel. Number: + 1 692 625-6427 Fax Number: + 1 692 625-6427 [email protected] Mrs Sophia Fowler Marshall Islands Conservation Society, P.O. Box 1234, Majuro, Republic of the Marshall Islands, 96960 Tel. Number: + 1 692 625-6427 Fax Number: + 1 692 625-6427 [email protected] Mr Juda Langrine Coastal Management Environmental Protection Authority, P.O. Box 1322, Majuro Republic of Marshall Islands Tel. Number: +1 692 625-3035 Fax Number: +1 692 625-5202

CBA2
010-
06N
SY-K
ench
-FIN
AL R
EPO
RT
]
47
Mr Ajiken Lometo Ailinglaplap Council, Jeh, Ailinglaplap Republic of Marshall Islands Mr Semese Alefaio Tuvalu Climate Action Network, TANGO, PO Box 136, Funafuti, Tuvalu [email protected] Mr Taukiei Kitala Tuvalu Association of NGOs, Global Environment Facility Small Grants Programme, Tuvalu TANGO, PO Box 136, Funafuti, Tuvalu Telephone: (688) 20758 Fax: (688) 29759 [email protected] Ms Pepetua Latasi Department of Environment Private Mail Bag, Funafuti Tuvalu Ph: (688) 20 179 Fax: (688) 20 113 [email protected] Mr Feagaiga Penivao Department of Environment Private Mail Bag, Funafuti Tuvalu Ph: (688) 20 179 Fax: (688) 20 113 [email protected] Salemona Tanielu Department of Environment Private Mail Bag, Funafuti Tuvalu Ph: (688) 20 179 Fax: (688) 20 113 [email protected] Mr Tataua Pese Tuvalu Red Cross Society, PO Box 14, Funafuti, Tuvalu Tel: (688) 20740, [email protected]

48
Funding sources outside the APN Technical equipment and resourcing support were provided by The University of Auckland and the College of the Republic of the Marshall Islands and the Government of Tuvalu. The University of Auckland provided technical equipment including dumpy survey equipment, tripods and a survey staff. Resourcing support (including photocopying and training resources) was also provided by The University of Auckland. Survey equipment was left with workshop participants. Additional support was provided by the College of the Marshall Islands in the form of photocopying and stationery as well as logistical support for organizing field exercises. The Government of Tuvalu provided conference facilities and photocopying resources to support the workshop in Fogafale.

CBA2
010-
06N
SY-K
ench
-FIN
AL R
EPO
RT
]
49
Training worksheets
WORKSHEET 1: SCOPING COMMUNITY RESOURCES AND COMMUNITY VULNERABILITY
To begin to assess the potential vulnerability of a community on an island to environmental change it is important to start with a base map. From this information you can begin to build layers of information about community assets and resources, the island topography and through talking with people and field observation begin to identify potential sites of vulnerability. By spending time talking with community on the first day and throughout the assessment it is possible to improve some understanding of community concerns and the impacts that past events have had on buildings and resources. This information can then be supported by surveys of land height to identify areas of land that have a higher likelihood of being flooded by waves or rainwater.
To start the process you need to:
1. Assemble maps In many instances it is possible to access existing detailed maps or aerial photos that can be used as a base map for the study. These maps and photos may be stored in a number of government agencies or with the College of the Marshall Islands. Another useful source of information is the internet and sites such as Google Earth which allow you to access satellite imagery of islands. Satellite images and aerial photos are useful if they are recent as they will show the location and layout of buildings on islands. However, sometimes it is not possible to access a map, or satellite images may be too blurry to get a clear picture of community settlement on the island. If this is the case you will need to make your own base map of the island. This can be done using a Global Positioning System (GPS) to plot the edge of the island and where appropriate the location of buildings and community resources on the map.
2. Meeting with community to talk about vulnerability hotspots The base map can be used to mark on sites of flooding or environmental changes and to note the location of buildings and community resources. Conversations with community members about past events that have impacted on community will help with understanding of areas of concern. There are a number of topics that should be discussed with community to gain an understanding of local concerns about vulnerable sites. The types of conversations should include:
• Documenting past events - what events have impacted on the community? - how long ago were they? - what was the impact (e.g. houses damaged, saline water, loss of land)? - where were the impacts? (on map &/ or in the field)? - have there been any changes in where people live as a result of past events?
• Location of community food and water resources
- location of sources of water (community wells, rain tanks) - what are these sources used for? - location of crops, coconuts, taro and other food sources?

50
• Buildings: location, use and type - where are all houses located? - record the use of buildings (e.g. medical clinic, school, house, churches, government buildings)? - what are buildings made of (e.g. concrete wood)? - which buildings have experienced flooding or other damage (e.g. wind)? - where are the damaged houses located?
3. Field observation
Once you have talked with community members about sites that they are concerned about it is important to then visit those sites and document physical characteristics of those locations. For example, stories of flood levels against walls or coconut trees may be a very useful guide to the level of flooding on an island. You can then survey the extent and height of flooding.

CBA2
010-
06N
SY-K
ench
-FIN
AL R
EPO
RT
]
51
WORKSHEET 2: SURVEYING ISLAND HEIGHT
One of the most efficient and effective ways of measuring island height (elevation) is through surveying. A simple survey approach is to make 2-dimensional profiles that extend from the reef to island surface. A 2-dimensional profile consists of measuring the elevation and distance (relative to the known point) which when combined gives us the form (topography) of the land. A 2-dimensional profile (or island profile) is simply a cross-section of the reef and land collected using survey equipment. It is usually plotted as a scatter graph with connected lines. The x-axis is distance, while the y-axis is elevation (see Figure 1). If you survey the same profile line at least twice you can establish whether there has been any change. This change can either be through erosion (loss of land) or accretion (gaining land).
Figure 1. Example of an island cross section showing the difference in elevation between the reef and island surface. SURVEYING BASICS There are various ways to measure a beach and island profile, from highly expensive GPS based systems, through to more inexpensive methods, more suitable for outer-island environments. The approach outlined here is simple, accurate and cheap. The equipment we use is called a dumpy level. The equipment required to undertake this survey involves:
• Tripod • Staff/ruler (5m long ruler) • Instrument (often called the level, basically a telescope with cross-hairs) • Recording sheets (paper, pencil, notebook etc)
THE DUMPY LEVEL The dumpy level is telescope that is set up LEVEL on top of the tripod. There are screws on the side to make sure it is level. There is also a small glass spirit level with a bubble in it. When the bubble is in the red target circle the equipment is level. This takes a bit of practice, best tip is to make sure the tripod is firmly setup with the top surface as close to level/horizontal as is possible. Make sure the tripod setup is not bumped during the survey or this may throw it off level, which will make all your measurements wrong.
-2
-1
0
1
2
3
4
5
0 50 100 150 200 250 300 350 400 450 500
Lagoon Ocean

52
Using the dumpy level is very easy…
1. Do a visual inspection of area, ask yourself: will trees get in the way? Will I be able to see the staff/ruler over the survey range? Is the site stable for the tripod? Am I set up over the bench mark (if a benchmark is installed).
2. Setup the tripod, visually checking to see the top of the tripod is roughly level.
3. Attach the instrument; make sure it is screwed on correctly.
4. Level the instrument using the 3 adjustable screw knobs; it is level when the air bubble is in the red circle.
5. Extend the staff/ruler from the bottom (or else you’ll have incorrect readings).
6. Measure the height of the instrument from the ground. Measure accurately from the center
of the lens to the ground vertically (some instruments have a line to indicate the center point).
7. Start taking recordings…
a. Select positions on along the profile to make sure you capture the terrain correctly (see Figure 2)
b. Start taking measurements (see inset)

CBA2
010-
06N
SY-K
ench
-FIN
AL R
EPO
RT
]
53
Reading 1
Reading 2Reading 3
Reading 4Line of sight
The dumpy level instrument has three crosshairs that you can see when you take a reading. IT IS VERY IMPORTANT to take all THREE readings for each point. These are called the upper, middle and lower readings. Using these 3 readings we can calculate how far away the staff/ruler is.

54
Calculating distance using the dumpy level It is possible to calculate the distance the staff is from the dumpy level using some very simple math. When you record your measurements you must record the upper, middle and lower values of the crosshairs. To calculate the distance the staff was at the time of measurement you use the simple equation:
Distance = (Upper – Lower) X 100
Recording survey data The data should be recorded carefully in a notebook. The surveyor should record the data in columns with the following headings UPPER, MIDDLE ,LOWER (see below). The surveyor should also record the instrument height, and note any features such as the high tide line, water level (with time), erosional scarp or other noteworthy features. Once a profile line is complete the surveyor should have a table consisting of recordings of the upper, middle and lower reading of the staff at each survey point. UPPER MIDDLE LOWER NOTES
1 0.087 0.147 0.022
2 0.24 Instrument Height
In this example A = 1.70m (lower) B = 1.725m (middle) C = 1.75m (upper)
C
B
A
The staff/ruler has some interesting looking markings on it… Don’t be worried, it is simply a 5 meter long ruler with 1cm intervals. The ‘E’ blocks make it easier to see from a distance. The numbers (i.e. 17, 18) represent the height (i.e. 1.7m, 1.8m). The numbers refer to the line under them, or the start of the red ‘E’.

CBA2
010-
06N
SY-K
ench
-FIN
AL R
EPO
RT
]
55
3 0.55 0.428 0.4 Edge of island
4 0.62 0.595 0.573
5 0.74 0.715 0.695 Water Level (13.20)
6 1.94 1.93 1.925 Start of beach rock

56
WORKSHEET 3: ENTERING AND PLOTTING THE PROFILE DATA
Once back in the office the surveyor most process the data in order to plot profiles. This is usually done in Microsoft Excel. Once the data is entered into Excel, calculating the distance and elevation, relative to the benchmark is straightforward.
1. Enter data into spreadsheet.
2. Add two columns for distance relative to benchmark and elevation relative to benchmark.
3. The distance relative to the benchmark (in meters) is equal to the UPPER – LOWER
multiplied by 100. If you have recorded in centimeters, then you don’t need to multiply by 100 to get the distance in meters, be careful and consistent.
4. To calculate the elevation relative to the benchmark (in meters), subtract the elevation of the instrument from the middle.
Notes Upper Middle LowerINTSTRUMENT 1.59
1.58 1.56 1.541.645 1.61 1.5751.795 1.742 1.692.15 2.075 2
Water level 2.785 2.685 2.5853.46 3.33 3.23.77 3.62 3.47
3.962 3.8 3.629
Notes Upper Middle LowerDistance (relative to BM)
Elevation (relative to BM)
INTSTRUMENT 1.591.58 1.56 1.54
1.645 1.61 1.5751.795 1.742 1.692.15 2.075 2
Water level 2.785 2.685 2.5853.46 3.33 3.23.77 3.62 3.47
3.962 3.8 3.629
Notes Upper Middle LowerDistance (relative to BM)
Elevation (relative to BM)
INTSTRUMENT 1.59 01.58 1.56 1.54 (1.58-1.54)*100
1.645 1.61 1.575 (1.645-1.575)*1001.795 1.742 1.692.15 2.075 2
Water level 2.785 2.685 2.5853.46 3.33 3.23.77 3.62 3.47
3.962 3.8 3.629

CBA2
010-
06N
SY-K
ench
-FIN
AL R
EPO
RT
]
57
5. The final product should be a table with both distance and elevation (relative to the benchmark calculated. At this stage elevation cannot be reference to mean sea level. However, if you knew the benchmark elevation (relative to MSL) you can simply add this value to the elevation.
6. To plot a graph which allows you to present the morphology, simple highlight the distance and elevation columns and insert an X,Y scatter graph.
Notes Upper Middle LowerDistance (relative to BM)
Elevation (relative to BM)
INTSTRUMENT 1.59 1.59-1.591.58 1.56 1.54 4 1.59-1.56
1.645 1.61 1.575 7 1.59-1.611.795 1.742 1.69 10.52.15 2.075 2 15
Water level 2.785 2.685 2.585 203.46 3.33 3.2 263.77 3.62 3.47 30
3.962 3.8 3.629 33.3
Notes Upper Middle LowerDistance (relative to BM)
Elevation (relative to BM)
INTSTRUMENT 1.59 0 01.58 1.56 1.54 4 0.03
1.645 1.61 1.575 7 -0.021.795 1.742 1.69 10.5 -0.1522.15 2.075 2 15 -0.485
Water level 2.785 2.685 2.585 20 -1.0953.46 3.33 3.2 26 -1.743.77 3.62 3.47 30 -2.03
3.962 3.8 3.629 33.3 -2.21
-2.5
-2
-1.5
-1
-0.5
0
0.5
0 5 10 15 20 25 30 35
Elev
atio
n (m
-re
lativ
e to
BM
)
Distance (m - relative to BM)
58
WORKSHEET 4: DEVELOPING BENCHMARKS AND REDUCING TO SEA-LEVEL
Benchmarks For the purposes of assessing the risk of flooding to buildings it is important to be able to relate land levels to the level of the sea. When you conduct multiple surveys through a village it is necessary to relate the levels between each profile to a common level (datum) so that all the levels are comparable. To do this we use benchmarks. Benchmarks are an identifiable feature whose position does not change through time. This means we can go back to the same point in the future and we can be confident it has not changed. Often, this will be some form of concrete or steel structure fixed firmly into the ground (e.g. fence post or edge of concrete slab). Be careful with making or selecting benchmarks. A coconut tree might seem like a sturdy safe spot to use as a benchmark, but will it be there in 3 months? 6 months? 5 years? It is also important to record where these benchmarks are located for future reference. To mark a benchmark you can: take a photo, etch a number on the concrete or post, take a GPS location, or write a description and draw a diagram. Ideally you would do all of these things. Calculating elevation relative to water level This method of calculating elevation is useful as it allows you to show height of land and buildings relative to mean sea level (MSL). If we can do this we can then examine how changes in sea level might affect the frequency of flooding of land and buildings. However, this method is best used for atolls where there are tidal predictions available (most but not all RMI atolls). This method also involves more preparation and analysis, but the effort is worth it, especially if you take the extra steps to calculate MSL and the spring high water elevation (see additional notes).
1. Produce a tidal curve based on tidal predictions for the atoll. Tidal predictions are found online at http://tidesandcurrents.noaa.gov/tide_predictions.shtml?gid=352
2. Using Excel produce a graph of the tidal predictions for the period in which you are undertaking your assessment. The tidal levels are relative to Mean Lower-Low Water (MLLW). It is best to work in meters as the survey equipment works in the metric system (Figure 1).
3. When in the field, go to the water and mark the level and record the time (insert a strong
stake or piece of rebar to mark this point). It is best to take a 2-3 minute average of water level, over a 2-3 minute period come up with a best estimate for what the still water level is. This is best done in the lagoon, the calmer the water the easier it is to establish the still water level.
4. Using the dumpy level establish the elevation of a position on land relative to water level (Figure 2). You will want to establish a benchmark on the land; this is often a stake, a piece of rebar or a bolt inserted into concrete. It often pays to have 2-3 benchmarks in case they are destroyed or get moved.
Using community water level If there are no tidal predictions available for the area of interest it is possible to establish elevation relative to the last high tide which is usually the freshest washed up line of debris. If community consultations indicate a level of the highest tide (i.e. “the tide came up to this tree”) then it is possible to survey relative to this level.

CBA2
010-
06N
SY-K
ench
-FIN
AL R
EPO
RT
]
59
FIGURE 1. Using a tidal curve to establish elevation of land relative to water level. In this example the surveyor has made their measurements at 16:15 at which time water level was 1.0 meters above mean low-lower water. Figure 2 shows how to then establish island elevation relative to this level.
FIGURE 2. Method for calculating the elevation of a point on the island relative to the water level.
0
0.2
0.4
0.6
0.8
1
1.2
12:00 13:00 14:00 15:00 16:00 17:00 18:00 19:00 20:00 21:00
Time
Leve
l (re
lativ
e to
MLL
W)
Reef flat
Island
Y2
Water level (2 minute average)
Y1
Elevation of the island at point (A) relative to the water level at time (T) is equal to Y1 – Y2. Further calculations are required to make measurements relative to MLLW

60
Calculating elevation relative to reef flat level If you don’t have any way to reference your elevations to sea level this is the next best option. Reef flat level around the island is used as a common datum level. While reef flat level can vary based on several factors it is more likely to be uniform compared to features like berm crest or top of beach.
1. Set up the dumpy level on the island with a clear view of reef flat and the island.
2. Usually this will have to be done on the ocean side at low tide.
3. Measure and record the elevation of the reef flat in 10 positions.
4. Average these 10 measurements.
5. Insert a stake on the island and calculate the elevation of the ground next to the stake. This elevation will be relative to the reef flat level.
6. You can now survey the elevation of assets on the island, relative to the reef flat level. For
example, if your stake is 5 meters above reef flat level and a building is 1.2 meters above the level of the stake, that building is 6.2 meters above reef flat level.
FIGURE 3. Calculating the elevation of land relative to the reef flat. Once a benchmark has been installed on the land you can survey the elevation of assets relative to the benchmark (and therefore reef flat).
Reef flat
Island Y1
Y2
Elevation of island at (A) relative tothe reef flat is equal to Y1 – Y2.
Y1 is the average of 10 reef flat measurements

CBA2
010-
06N
SY-K
ench
-FIN
AL R
EPO
RT
]
61
Example In this example we have first established a benchmark (red stake). This benchmark is 3.2m in elevation above our datum (reef flat or a measure of water level MLLW or MSL). Using this benchmark we have set up the dumpy level in a good spot, visible to the two assets we are investigating. Once the dumpy level is correctly set up we have a horizontal line of sight which is 0.5m above the benchmark elevation. What is the elevation of the line of sight? Benchmark 3.2m Line of sight 0.5m Line of sight relative to datum 3.2 + 0.5 = 3.7m Elevation of road Line of sight relative to datum 3.7m Road 1.0m Road relative to datum 3.7 – 1.0 = 2.7m Elevation of asset Line of sight relative to datum 3.7m Asset 0.8m Asset relative to datum 3.7 – 0.8 = 2.9m
FIGURE 4. Working out the elevation of assets using dumpy level having establishing a benchmark with an elevation above a chosen datum.
Benchmark (3.2m)
Asset (road)
Asset 0.5m0.8m 1.0m

62
Example Community consultations have revealed that during storms the water level reaches the base of the coconut tree in front of the school. Residents are concerned about sea-level rise. Using the dumpy level we can establish where the annual storm would reach with a projected amount of sea-level rise. In this example we can see that with 0.4m of sea-level rise the school would be inundated during an annual storm.
FIGURE 5. Using the dumpy level to assess the impact of sea-level rise on an asset, based on a combination of information derived from community consultation and dumpy level surveying.
Benchmark (3.2m) Community consultation suggests that during storms the waves reach the base of the Coconut tree. This happens about once a year
0.6m 0.8m 0.4m