ims 13 100k transactions per second (tps) benchmark ... · pdf fileims 13 100k transactions...
TRANSCRIPT

© 2014 IBM Corporation
20141
IMS 13 100K Transactions Per Second (TPS) Benchmark - Roadblocks, Limitations, and Solutions
Presenter:
Jack Yuan
With THANKS to Dave Viguers, Kevin Hite, and IMS performance team
Bruce Naylor and IMS development team
Session 14772

© 2014 IBM Corporation
20142
NOTE:
This presentation is based on the IMS white paper, “IMS 13 fast path: high volume transaction processing”. See appendix for more information of the paper.
IMS 100K TPS performance is based on measurements and projections using IMS benchmarks in a controlled environment. The results that any user will experience will vary depending upon many factors, including considerations such as the amount of multiprogramming in the user's job stream, the I/O configuration, the storage configuration, the amount of zIIP capacity available during processing, and the workload processed. Therefore, results may vary significantly and no assurance can be given that an individual user will achieve results similar to those stated here. Results should be used for reference purposes only.

© 2014 IBM Corporation
20143
3
Agenda
Introduction
Summary of the Results
Workload Used and Measurement Environment
Base IMS 13 Reduced TCO Changes Applied
Roadblocks, Limitations and Solutions
Conclusion
Appendix

© 2014 IBM Corporation
20144
Introduction
At the release of IMS 12, the IMS Performance Evaluation Team announced a new high transaction processing rate of 46,000 transactions per second (TPS) using the IMS Fast Path (FP) Credit Card benchmark workload, driven by a VTAM terminal network.
During development of IMS 13, the team was tasked with a goal of 100,000 transactions per second (TPS) using IMS Connect and OTMA as the primary interface to drive the IMS transactions.

© 2014 IBM Corporation
20145
5
Summary
The IMS 13 100K TPS project achieved a sustained average transaction rate of over 117,000 transactions per second (TPS) on a single system.
– running on the most current IBM hardware (IBM System zEnterprise EC12TM mainframe processor, IBM System Storage® DS8870 and DS8800 DASD) and operating system software (z/OS 2.1)
– Multiple measurement runs were made to demonstrate repeatability
– Each measurement run demonstrated the greater than 117,000 TPS average rate over a 15-minute interval
Using IMS Fast Path (FP) Credit Card benchmark application
Messages were generated by IBM's Teleprocessing Network Simulator (TPNS)
IMS via TCP/IP through five IMS Connect address spaces with RACF security and OTMA security=CHECK
Periodic IMS system checkpoints were taken during the run, and IMS Online Log Data Set (OLDS) switching and archiving
occurred as needed

© 2014 IBM Corporation
20146
Workload Used - IMS Fast Path (FP) Credit Card benchmark application
Three Fast Path Data Entry Databases (DEDB) used: – ACCTA: this Account Database (DEDB) is a “customer account” database
containing general information, such as account #, credit limit, used credit, customer name, address, amount of the debit/credit, store code number and date of transaction.
– EXCEPTA: this Exception Card Database (DEDB) is an “exception card” database containing records for lost, stolen, or otherwise invalid cards.
– STOREDBA: this Store Database (DEDB) is a database containing a record for each point of sale terminal for customers subscribing to the credit card service.
© 2014 IBM Corporation
20147
Workload Used - IMS Fast Path (FP) Credit Card benchmark application…
Four transactions run in IMS Fast Path regions (IFP regions) and are Fast Path only:
– CCCK transaction performs credit card authorization checking services– CLCK transaction performs credit limit check– DEBIT transaction offers the debit and credit services– LOST transaction provides the lost or stolen card reporting services
All transactions provide on-line update capability with full integrity and recovery facilities.
Each transaction written in COBOL starts with a 76-byte input message and replies with an 83-byte output message.

© 2014 IBM Corporation
20148
Measurement Environment: System Configuration

© 2014 IBM Corporation
20149
Base IMS 13 Reduced TCO Changes Applied
Log Latch Contention Reduction– IMS writes log records for many different tasks and threads in many different
address spaces.– The logger serialized the process of copying log records into a buffer by getting
an internal latch called the log latch (LOGL) in exclusive mode. • This meant that only one caller at a time could execute the logger code that located
buffer space, copied the log record data, and scheduled buffers for writes. The other callers have to wait for the latch.
– For workloads with high logging volumes, this single threading of the logging process caused high rates of contention for the log latch.
• Latch contention increases both CPU consumption and elapsed time.
– In IMS 13, the logger code was enhanced to permit multiple callers to log data in parallel. The log latch is still obtained, but in shared mode (multiple share mode callers are allowed to own the latch simultaneously, as opposed to exclusive mode, which permits only a single owner at a time).

© 2014 IBM Corporation
201410
Base IMS 13 Reduced TCO Changes Applied…
z/OS Storage call elimination in IMS Connect and OTMA – The IMS Connect and OTMA XCF input exits copy the message data from
XCF buffers to storage that they obtain, and then send the copied message into the IMS Connect or IMS address space to be processed.
– These XCF exits issued several z/OS STORAGE OBTAIN calls which obtain exclusive serialization to protect its processing in the form of the address space local lock.
• Because XCF input exits can execute in parallel within an address space, this use of the local lock can become a contention bottleneck at high message rates. This in turn can limit the throughput capacity of the system.
– In IMS 13, the STORAGE OBTAIN calls for fixed-sized storage areas in the IMS Connect and OTMA input exits were replaced with z/OS CPOOL and IMS DFSBCB storage service calls that do not routinely require local lock serialization.

© 2014 IBM Corporation
201411
Base IMS 13 Reduced TCO Changes Applied…
OTMA Control Block (YTIB) Hashing – IMS OTMA internally represents the source of a submitted IMS transaction by
a control block called an OTMA Transaction Instance Block, or “YTIB”. Prior to IMS 13, YTIBs related to a given OTMA TPIPE were chained on a single linked list anchored off of the TPIPE control block. At various points in the processing of an OTMA transaction, the transaction’s YTIB needed to be located, which required a serial search of this linked list.
– When the number of YTIBs on the TPIPE chain became large, the time required to search for a given YTIB increased.
• For example, there could be thousands of YTIBs or transaction messages anchored off of an IMS Connect port TPIPE.
– In IMS 13, the chaining of the OTMA YTIB control blocks was changed from a single linked list to a hash table. This improves search time for a given YTIB by reducing the length of the chain that must be scanned.

© 2014 IBM Corporation
201412
Roadblocks, Limitations and Solutions

© 2014 IBM Corporation
201413
XCF Message Rate Limitations
Observation:– Initial IMS Connect/OTMA runs showed an upper limit 25,000 transaction per
second, which was far fewer than with SNA.
Analysis:– OTMA table trace and IMS Connect recorder trace indicated that there was a
delay occurring in the transfer of the XCF message.

© 2014 IBM Corporation
201414
XCF Message Rate Limitations…
Solution: – XCF development was able to determine that code within XCF was limiting the
number of message transfers per second to a given member of the XCF group. This was initially done to avoid having some XCF member dominate all the resources within a system, but with the ever-increasing processing capability of the System z hardware, a change was integrated into z/OS 2.1 to allow more messages to flow.
• It used to be 16 messages per SRB per schedule before waiting for 10ms to begin again. It is now 64 messages.
Results:– The effect of this change was to immediately increase our throughput by more
than 100%, which then exposed additional challenges to be diagnosed and ultimately resolved.

© 2014 IBM Corporation
201415
OTMA Limitations
Observation:– With larger numbers of TCP/IP clients active, we noticed a much higher than
expected contention rate for two IMS internal latches: the LUBT latch (used for OTMA control block chain serialization) and the CBTS latch (used for IMS DFSBCB storage manager serialization).
Analysis:– It was discovered that OTMA attempted to minimize the creation and deletion
of ITASKs by maintaining two separate chains of YTIBs: a ”free chain” and an ”available chain”. The process of maintaining these two chains was not as effective as desired with larger numbers of clients.
YTIB Free Chain YTIB Available Chain
YTIB
YTIB YTIB
YTIB
YTIB YTIB
Up to 100 freed YTIBs Up to 200 available YTIBs
LUBT latch
CBTS latchLUBT latch
CBTS latch
YTIB
YTIB Active Chain in TPIPE
YTIB YTIB
YTIB YTIB

© 2014 IBM Corporation
201416
OTMA Limitations…
Solution:– The YTIB free chain was eliminated and the number of YTIBs kept on the
available chain was increased to minimize the number of times an ITASK was terminated prematurely.
Results:– Even with thousands of OTMA clients, the number of ITASK terminations and
creations along with the associated overhead of freeing and getting DFSBCB control storage was reduced or eliminated. This in turn reduced the CBTS latch contentions. In addition, the removal of the OTMA YTIB free chain significantly reduced the LUBT latch contentions, resulting in increased throughput and reduced overhead.
YTIB Available Chain
YTIB
YTIB YTIB
Up to 300 available YTIBs
LUBT latch
CBTS latch
YTIB
YTIB Active Chain in TPIPE
YTIB YTIB
YTIB YTIB

© 2014 IBM Corporation
201417
OTMA CM1 Output Buffer Clearing
Observation:– A scaling test showed that an OTMA output module was at the top of the list
for high use modules and the MVCL instruction accounted for 81% of that module.
Analysis: – The OTMA output module allocates a big buffer, clears the buffer with MVCL,
and moves the output message to the buffer for XCF send.
Solution:– In IMS 13, this unneeded buffer clear was removed for sync levels NONE and
CONFIRM of OTMA CM1 output messages.

© 2014 IBM Corporation
201418
IMS Latch Manager Changes: Contention Management and Wait Queue POSTing
Problem:– When we changed the IMS logger component to log records in parallel without
needing an exclusive latch, we expected performance to improve. Instead, when the log latch elimination code was initially integrated into IMS, we found an unexpected reduction in transaction rate.
Analysis:– We investigated the problem and discovered very high CPU use within certain
sections in the IMS latch manager modules. These sections were the code that posted waiters off of the latch wait queue when a previously-unavailable latch became available.

© 2014 IBM Corporation
201419
IMS Latch Manager Changes: Contention Management and Wait Queue POSTing…
Solution:– Investigation into this issue led us to identify several areas that could be
improved in the IMS latch manager wait queue management algorithms for shared latches. These changes involved priority promotion for callers who had already waited once to get a latch, and “latch fairness” algorithm changes to equalize the granting of the latch between shared and exclusive waiters.
Results:– The effect of all of these changes increased transaction rate.

© 2014 IBM Corporation
201420
New LREC Latch for Serializing Log Record Creation
Problem:– Even with the latch manager wait queue management changes, we were still
seeing a large number of log latch contentions.
Analysis:– The changes made to the IMS logger ensured that log writes could now
execute in parallel. The observed latch contentions were caused, not by logger activity, but by callers outside of the logger that were getting the log latch (LOGL) in exclusive mode to serialize the building of a set of related log records.

© 2014 IBM Corporation
201421
New LREC Latch for Serializing Log Record Creation…
Solution:– We decided we could reduce overall contention by splitting the LOGL latch into
two latches. We created a new latch – the LREC latch. Fast Path syncpoint was changed to obtain this new latch instead of the LOGL latch when building and logging its log records.
Results:– With this change, LOGL latch contentions in the Fast Path workload dropped
from many thousands per second down to low double digits per second. LREC latch contentions were of course higher than that, but were still lower than the LOGL latch contentions previously. The contention for both latches taken together was lower than the contention seen for the single LOGL latch.
© 2014 IBM Corporation
201422
IMS Fast Path Syncpoint Processing
Problem: – We hit a point around 70K where we could not get the transaction rate to
increase.
Analysis:– For OTMA, the write of the syncpoint record under the IFP is followed by an
IMS logger function called a “check write” (CHKW). A CHKW call waits for the logger to write the targeted log record to either the OLDS or the WADS logger data set. This wait holds up the dependent region until the syncpoint log record is written. After the CHKW returns, the IFP issues the OTMA send-deallocate back to the inputting client, and only then is free to execute the next transaction. Thus, for OTMA, the capacity of each IFP is reduced because of this extra waiting and processing, which is absent for SNA.
© 2014 IBM Corporation
201423
IMS Fast Path Syncpoint Processing…
© 2014 IBM Corporation
201424
IMS Fast Path Syncpoint Processing…Solution:
– The logger write of the final syncpoint record for OTMA under the IFP is now issued with a parameter that tells the logger to send a notification to Fast Path code in the control region when the log record has been physically written to disk. The dependent region is then able to immediately process the next transaction, without waiting for the log write to complete. A new ITASK that processes the logger notification. The ITASK runs under a new Fast Path TCB – TCB type FP2 – to minimize any interference with the existing XFP Fast Path TCB processing.
Results:– Removing the CHKW call from the dependent region improved IFP transaction
capacity by about 30%, and allowed us to get past the 70K TPS limit that we had previously been hitting.

© 2014 IBM Corporation
201425
Periodic Slowdowns due to AWE Pool Shortages
Problem: – As we finally achieved transaction rates over 100,000 per second, we started
noticing severe fluctuations in the transaction rate. Graphs of the transaction rate showed that there were two modes: The system would run at well above 100K TPS for minutes at a time, but then it would suddenly drop to around 60K TPS, and would often remain at this level also for several minutes.

© 2014 IBM Corporation
201426
Periodic Slowdowns due to AWE Pool Shortages…
Analysis:
IMS internal statistics showed that during the "good" periods, one DFSBCB AWE control block was gotten per transaction processed. During the "bad" periods, one AWE was gotten for every five transactions processed.
In this workload, the main requester of AWEs is the OTMA XCF input exit. One AWE is requested for each input message, so the 1:1 ratio between AWEs gotten and transactions is the expected value.
The 1:5 ratio during the "bad" periods means that 4 out of 5 messages failed to get a DFSBCB AWE, and instead used z/OS STORAGE to obtain the AWE control block:
– DFSBCB AWEs are obtained from a queue of free AWEs (very fast).– When the queue is empty, additional AWEs are normally obtained (AWE expansion) -- however...– The OTMA input exit is running in an environment (SRB mode) where AWE expansion cannot be
done.– When no free AWEs are available:
• The OTMA input exit uses z/OS STORAGE instead (expensive, gets local lock - high local lock usage leads to contention and slowdowns).
• This situation persists until some other (non-SRB) process in IMS requests an AWE and triggers AWE pool expansion.
• The logger uses AWEs too, but keeps them in its own pool and only gets new ones when its pool is empty.– Few AWE users besides OTMA exit and logger lead to long periods where AWE expansion is not
done and STORAGE is used for AWEs.

© 2014 IBM Corporation
201427
Periodic Slowdowns due to AWE Pool Shortages…
Solution:
The OTMA input exit where we get the AWE (SRB mode) cannot expand the AWE pool. However, the code that frees the AWE (Task mode) can. When the freeing code receives an AWE that was gotten by z/OS STORAGE, it now:
– Issues a DFSBCB get for an AWE.– Issues a DFSBCB release for that same AWE– This drives AWE expansion, and provides more AWEs for future DFSBCB get calls in
the OTMA input exit, thus eliminating future z/OS STORAGE calls.
The IMS logger was also changed to release more AWEs back to DFSBCB, rather than holding on to them:
– Better storage utilization (these AWEs can be used by processes other than logger).– Logger will request AWEs more often, and can also aid in driving AWE expansion when
required.

© 2014 IBM Corporation
201428
Periodic Slowdowns due to AWE Pool Shortages…
Results:– With these changes in place, the severe transaction rate fluctuations were
eliminated.

© 2014 IBM Corporation
201429
IMS Storage Pool Manager - Storage Pool Tuning
Problem:– While looking into our measurement results, we consistently noticed high CPU
activity related to the IMS Storage Pool Manager. The IMS Storage Pool Manager is responsible for managing OTMA related storage pools such as DYNP, EMHB, LUMC, LUMP, etc
Pool Name Storage Type
Pool Description
DYNP Private Used for dynamic storage (working storage) for IMS modules – particularly LU 6.2 and OTMA processing modules.
EMHB Common Expedited Message Handler (EMH) Buffers. Used to contain input and output user message data for Fast Path EMH transactions
LUMC Common Used for dynamic storage (working storage) for IMS modules that execute in different address spaces (e.g. control region, DLI region, dependent region) or which execute in cross-memory mode.
LUMP Private Used for LU 6.2 and OTMA buffer storage, and also for working storage for some modules.

© 2014 IBM Corporation
201430
IMS Storage Pool Manager - Storage Pool Tuning…
Analysis:– To further examine the fixed storage pool usage, we referred to the IMSPA
Fixed Pool Usage Statistics report. As an example using the DYNP pool, there is not enough space in the primary extent for the buffer high water mark to avoid secondary extents. When this happens, the IMS storage manager obtains secondary blocks to provide the space for additional buffers. It takes longer for the storage manager to search secondary blocks for storage than it does for it to find space (when it is available) in the primary block.

© 2014 IBM Corporation
201431
IMS Storage Pool Manager - Storage Pool Tuning…

© 2014 IBM Corporation
201432
IMS Storage Pool Manager - Storage Pool Tuning…
Solution: – Our focus for tuning was to reduce CPU versus saving storage space. With
that in mind, each fixed storage pool was defined with enough space in the primary extent for the buffer high water mark to avoid secondary extents entirely.
– To tune the DYNP pool, we defined a new buffer size (4,304-bytes) to satisfy the average size requested and enough primary buffers to encompass the high water mark plus a little headroom to allow us to scale up (primary 1,100, secondary 50). We also set the initial allocation to “yes” to have IMS obtain the primary extent at IMS startup. • IMS Storage pool manager (DFSSPMxx)
– FPL=DYNP,(2048,16,8,Y),(4292,1100,50,Y),(8192,4,2,Y)
– FPL=LUMC,(3064,100,40,Y),(4096,200,50,Y)
– FPL=LUMP,(1024,600,100,Y),(4096,150,30,Y),(65536,30,4,Y)
– FPL=EMHB,(1024,8375,1000,Y)

© 2014 IBM Corporation
201433
IMS Storage Pool Manager - Storage Pool Tuning…
Results: After tuning each of the fixed storage pools, we observed less CPU activity
with the IMS Storage Pool Manger and an overall CPU improvement of about 5%.
© 2014 IBM Corporation
201434
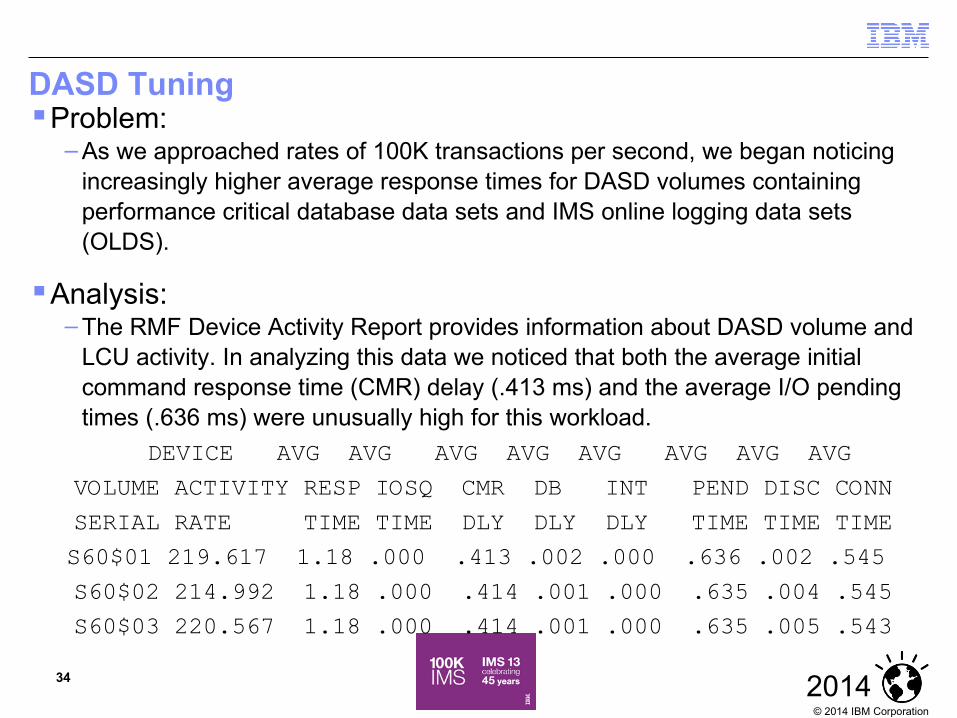
DASD Tuning Problem:
– As we approached rates of 100K transactions per second, we began noticing increasingly higher average response times for DASD volumes containing performance critical database data sets and IMS online logging data sets (OLDS).
Analysis:– The RMF Device Activity Report provides information about DASD volume and
LCU activity. In analyzing this data we noticed that both the average initial command response time (CMR) delay (.413 ms) and the average I/O pending times (.636 ms) were unusually high for this workload.
DEVICE AVG AVG AVG AVG AVG AVG AVG AVG
VOLUME ACTIVITY RESP IOSQ CMR DB INT PEND DISC CONN
SERIAL RATE TIME TIME DLY DLY DLY TIME TIME TIME
S60$01 219.617 1.18 .000 .413 .002 .000 .636 .002 .545
S60$02 214.992 1.18 .000 .414 .001 .000 .635 .004 .545
S60$03 220.567 1.18 .000 .414 .001 .000 .635 .005 .543

© 2014 IBM Corporation
201435
DASD Tuning…
Solution: – Originally eight - 8Gb FICON® channel paths were configured from our zEC12
to the DS8800 storage system. The team decided to double that to a total of 16 - 8Gb FICON® channel paths to help reduce delays in waiting for the channel subsystem to accept and process requests.
Results:– After reconfiguring to use a total of 16-channels paths we saw improvements of
~28% in overall average response time.

© 2014 IBM Corporation
201436
Conclusion
The IMS 13 100K project achieved a sustained average transaction rate of over 117,000 transactions per second on a single system, running on the most current IBM hardware (IBM System zEnterprise EC12TM mainframe processor, IBM System Storage® DS8870 and DS8800 DASD) and operating system software (z/OS 2.1).
IMS team identified and reduced or eliminated many performance bottlenecks in both IMS and z/OS software. These changes improve scalability, reduce contention, and provide enhanced efficiencies in core IMS and z/OS processing.
– Some of these changes are specific to IMS Fast Path EMH processing; others (such as XCF, OTMA, latching, and logging improvements) apply to many other IMS environments.

© 2014 IBM Corporation
201437
37
Thank You!
Your Feedback is Important to Us

© 2014 IBM Corporation
201438
Appendix

© 2014 IBM Corporation
201439
Appendix A: Further Reading
IMS 12 performance summary– http://public.dhe.ibm.com/software/data/sw-
library/ims/IMS_Version_12_Performance_Summary.pdf
IMS 13 Fast Path: High Volume Transaction process – http://www-01.ibm.com/common/ssi/cgi-bin/ssialias?
subtype=WH&infotype=SA&appname=SWGE_IM_IM_USEN&htmlfid=IML14384USEN&attachment=IML14384USEN.PDF
IMS 13 Performance Summary– http://www-01.ibm.com/common/ssi/cgi-bin/ssialias?
subtype=WH&infotype=SA&appname=SWGE_IM_IM_USEN&htmlfid=IML14383USEN&attachment=IML14383USEN.PDF
IMS Performance and Tuning Guide – http://www.redbooks.ibm.com/redbooks/pdfs/sg247324.pdf