in business for life - genentech · motivate everyone at genentech to do their part as we strive ....
TRANSCRIPT

In Business for LifeGenentech 2007 Annual Report

On Cover: Greg, Avastin® Patient
Everything we do at Genentech is driven by a desire to make
a difference in the lives of patients. Their individual stories
inspire our researchers to do groundbreaking science and
motivate everyone at Genentech to do their part as we strive
to provide new treatment options.
Satellite photo of Genentech campus in South San Francisco, California.

1
Our Mission
Genentech’s mission is to be the leading biotechnology
company, using human genetic information to discover,
develop, manufacture and commercialize biotherapeutics
that address significant unmet medical needs. The company
is committed to high standards of integrity in contributing
to the best interests of patients, the medical profession, our
employees and our communities, and to seeking significant
returns to our stockholders based on the continual pursuit
of scientific and operational excellence.

2
Letter to Stockholders
We are pleased with our performance in 2007, which was a year of growth and development across Genentech’s business. With a 26 percent increase in full-year operating revenues to $11.7 billion, 2007 was our tenth consecutive year of double-digit revenue growth. Only five years ago, our annual revenues barely exceeded $2.5 billion, so we are proud to achieve a greater than four-fold increase in such a relatively short time. Our non-GAAP earnings per share were $2.94 in 2007, up 32 percent from 2006, and our non-GAAP net income increased 31 percent to $3.1 billion.1
Our continued strong financial results fuel our important research and development efforts. As a company, Genentech’s paramount objective is to develop a strong pipeline of novel and important drugs that have the potential to make an impor-tant difference for patients suffering from significant diseases.
In support of this objective, last year we announced our plan to add a total of 30 new molecular entities into clinical development by the end of 2010, and we are encouraged by the progress we’ve made. In 2007, eight new molecules were added to the pipeline, and we now have 20 new molecules in development, most targeting novel mechanisms based on promising biology.
In 2008, we look forward to generating clinical data from our early pipeline and to moving new molecules into clinical trials. We will also continue to invest in possible line extensions for our commercial products, including Rituxan® in earlier-stage rheumatoid arthritis, multiple sclerosis and lupus; and Avastin® in metastatic breast cancer, renal cell carcinoma and glioblastoma multiforme (a form of brain cancer), as well as in combination with Tarceva® for advanced non-small cell lung cancer.
While we are proud of the caliber of our internal research organization, we recognize that Genentech is not the only place for great science, and therefore collaborations play an important role in our pipeline development. As one example, in collaboration with Curis, we are developing a small molecule antagonist of the hedgehog pathway, which could represent an important new approach to treating patients with solid tumors. In 2007, we entered into agreements for 64 collaborations, which included four molecules that are currently in clinical trials or expected to move into clinical trials in 2008. These four molecules are being developed in collaboration with Seattle Genetics, BioInvent and Abbott.
“ Never before have we had such talented
employees, insights into the biology of
so many diseases, powerful tools and
technologies, and extensive expertise and
resources to help us develop breakthrough
therapies to improve patients’ lives.”Arthur D. Levinson, Ph.D.Chairman and Chief Executive Officer
1 Our GAAP earnings per share for 2007 was $2.59, an increase of 31 percent compared to 2006, and our GAAP net income for 2007 was $2.8 billion, an increase of 31 percent compared to 2006. Our 2007 non-GAAP amounts exclude the effects of: (i) recurring charges related to the 1999 redemption of our Special Common Stock by Roche (Redemption) and our acquisition of Tanox, Inc. in the third quarter of 2007, which was $132 million on a pretax basis, (ii) litigation-related and similar special items for accrued interest and bond costs on the City of Hope judgment, which was $54 million on a pretax basis, (iii) employee stock-based compensation expense recognized under Statement of Financial Standards No. 123(R), “Share Based Payment” (FAS 123R), which was $403 million on a pretax basis, (iv) certain items related to the acquisition of Tanox, Inc. in 2007, including in-process research and development expenses of $77 million (a non-recurring expense in the third quarter of 2007), recurring recognition of deferred royalty revenue of $6 million on a pretax basis, and a gain pursuant to Emerging Issues Task Force Issue No. 04-1, “Accounting for Preexisting Relationships between the Parties to a Business Combination” (EITF 04-1), of $121 million on a pretax basis (a non-recurring gain in the third quarter of 2007), and (v) the related tax benefits on these items of $166 million. Our 2006 non-GAAP amounts exclude the effects of: (i) employee stock based compensation expense associated with FAS 123R of $309 million on a pretax basis, (ii) recurring amortization charges related to the Redemption, which was $105 million on a pretax basis, (iii), litigation-related and similar special items for accrued interest and associated bond costs on the City of Hope judgment, which was $54 million on a pretax basis, and (iv) the related income tax benefits on these items of $191 million. See pages 26-27 for the full reconciliation between our non-GAAP and GAAP amounts.

3
Letter to Stockholders
Our scientific accomplishments continue to translate into strong market success. Looking at our commercial perfor-mance in 2007, total net U.S. product sales were $8.5 billion, a 19 percent increase from 2006 sales. Avastin became our top-selling product for the first time in 2007 and, along with Rituxan, is now our second product to generate more than $2 billion in annual sales. We are pleased with the perfor-mance of our broad product portfolio and believe that we are well positioned in the marketplace; four of our oncology products have demonstrated overall survival improvement in multiple tumor types.
We made significant progress in other areas of the busi-ness in 2007. In product operations, we announced the construction and development of an E. coli manufacturing facility in Singapore for the production of bulk Lucentis® product. Additionally, in April we received U.S. Food and Drug Administration (FDA) licensure of 90,000 liters of capacity for the production of bulk Avastin product at our Oceanside, California, facility. In corporate developments in 2007, we completed the acquisition of Tanox, Inc., the first acquisition in our history, which supports the development of new treatments for patients with asthma and improves our Xolair® business.
Last year also brought challenges that highlight the complexi-ties and risks associated with our business. For example, data from the AVAiL study evaluating high and low doses of Avastin led to a decline in the use of high-dose Avastin in non-small cell lung cancer.
In August, we resubmitted the supplemental Biologic License Application for Avastin with chemotherapy in first-line metastatic breast cancer based on data from the E2100 trial. In February 2008, we were pleased to receive accelerated approval for Avastin in combination with paclitaxel for the treatment of patients who have not received chemotherapy for metastatic HER2-negative breast cancer.2 The accelerated approval program allows the FDA to approve products based on initial positive data from a surrogate endpoint, and we plan to provide additional trial data that may support full approval. Avastin is now approved for treatment of the three leading causes of cancer deaths in the United States.
As always, we remain dedicated to making all our medi- cines available to patients who need them and ensuring that price is not a barrier to access. In 2007, we launched several initiatives as part of our ongoing effort to improve our patient access, including the Avastin Patient Assistance Program,
“ As always, we remain dedicated to making all our
medicines available to patients who need them and
ensuring that price is not a barrier to access.”
2 On February 22, 2008, Genentech received accelerated approval for Avastin in combination with paclitaxel for the treatment of patients who have not received chemotherapy for metastatic HER2-negative breast cancer. The effectiveness of Avastin in metastatic breast cancer is based on an improvement in progression-free survival. Avastin is not indicated for patients with breast cancer that has progressed following anthracycline and taxane chemotherapy administered for metastatic disease. Currently, no data are available that demonstrate an improvement in disease-related symptoms or increased survival with Avastin in breast cancer.

4
Letter to Stockholders
which offers free Avastin to eligible patients once they have received 10,000 milligrams in a twelve-month period. Separately, the expansion of other existing programs helps address coverage gaps for eligible Tarceva patients enrolled in a Medicare Part D plan. We are also working with ophthalmology medical organizations to enhance programs that facilitate and expedite patient access and physician reimbursement for Lucentis. In total, Genentech has donated approximately $1 billion in free medicine since 1985 to uninsured patients through the Genentech® Access to Care Foundation and other product dona-tion programs. Additionally, we have donated more than $140 million since 2005 to independent non-profit organizations that provide financial assistance to eligible patients for co-pay costs.
Our employees’ passion for and dedication to helping patients is nurtured by our unique company culture. It is our belief that this culture makes Genentech a great place to work and allows us to recruit and retain highly talented and moti-vated people who can further our objective of developing first- and best-in-class therapies. We are focused on creat-ing an exceptional company where employees are excited about their work. We want all employees to know that their unique ways of thinking are welcome and that they can take the initiative to propose ideas and projects they believe can help drive the company’s success. We have been recognized externally for this focus; in 2007, Science magazine named us as a “top employer in the biotechnology, biopharmaceutical, pharmaceutical and related industries,” and in January 2008 Genentech was named one of FORTUNE magazine’s “100 Best Companies to Work For” for the tenth consecutive year.
Looking back, 2007 has been a year of significant growth and achievement. We are pleased that we are currently on track to meet all five of our Horizon 2010 goals (described in greater detail on page 5 of this report). Never before have we had such talented employees, insights into the biology of so many diseases, powerful tools and technologies, and extensive expertise and resources to help us develop breakthrough therapies to improve patients’ lives. We expect 2008 to be another active year for us as we anticipate clinical data from a number of important trials and news from other areas of our business.
We remain confident in our approach to running the business and will continue our focus on excellent science, planning and investing for the long term, disciplined execution against our aggressive goals, and a passionate commitment to patients and our employees. There are tremendous advances occurring in understanding the biological basis of many debilitating diseases, and these advances play to Genentech’s greatest strengths as we strive to translate the biology into new drugs. It is my hope, and my belief, that Genentech will continue to deliver important new therapies and make a meaningful difference in the lives of the patients we serve.
Arthur D. Levinson, Ph.D.Chairman and Chief Executive OfficerFebruary 25, 2008
“ Our employees’ passion for and dedication to helping
patients is nurtured by our unique company culture.”

5
Horizon 2010 Report Card
Our Horizon 2010 vision and goals will help ensure that we are solidly positioned to continue our 32-year mission of discovering, developing, manufacturing and commercializing life-enhancing and life-extending medicines for patients with unmet medical needs. Originally announced in March 2004, we provided an update to our Horizon 2010 goals in March 2006.
Utilize the science of biotechnology to become a leader in revolutionizing the treatment of patients with cancer,
immunological diseases and angiogenic disorders.
GOAl: TO brinG AT leAsT 20 new mOleCules inTO CliniCAl develOPmenT
Status: We added 15 new molecular entities into development from January 1, 2006 through December 31, 2007.
In March 2007, we announced that we plan to add a total of 30 new molecular entities into clinical development by the end of 2010.
GOAl: TO brinG AT leAsT 15 mAjOr new PrOduCTs Or indiCATiOns OnTO The mArkeT
Status: We received approval for one new product and 10 additional indications for existing products through February 2008.
GOAl: TO AChieve A COmPOund AnnuAl nOn-GAAP eArninGs Per shAre GrOwTh rATe Of 25 PerCenT1
Status: Our non-GAAP earnings per share compound annual growth rate was 52 percent through 2007.1
GOAl: TO AChieve CumulATive free CAsh flOw Of $12 billiOn2
Status: Our cumulative free cash flow was approximately $3.6 billion from January 1, 2006 through December 31, 2007.2
GOAl: TO beCOme The number One u.s. OnCOlOGy COmPAny in sAles
Status: We have been number one in U.S. oncology sales since the first quarter of 2006.
This Annual Report contains forward-looking statements regarding developing a small mole-cule antagonist of the hedgehog pathway; line extensions for Rituxan, Avastin and Tarceva; the potential of Avastin and Trastuzumab-DM1 in treating breast cancer; adding new molecules into clinical development by 2010; bringing new products/indications onto the market by 2010; becoming the number one U.S. oncology company in sales by 2010; and growth in non-GAAP earnings per share (EPS) and cumulative free cash flow by 2010. Such statements are predictions and involve risks and uncertainties such that actual results may differ materially. Among other factors, actual results could be affected by unexpected safety, efficacy or manufacturing issues, additional time requirements for biologic license application (BLA) or new drug application (NDA) preparation or decision making, need for additional data or clinical studies, FDA actions
or delays, the failure to obtain or maintain FDA approval, changes in dosing or duration of prod-uct use, competition, pricing, reimbursement, intellectual property or contract rights, the ability to supply product, product withdrawals, new product approvals and launches, product sales, contract revenues and royalties, cost of sales, R&D or MG&A expenses, stock-based compensa-tion expense, unanticipated expenses such as litigation or legal settlement expenses or equity securities write-downs, fluctuations in tax and interest rates, and changes in accounting or tax laws or the interpretation of such laws. Please also refer to Genentech’s Form 10-K for the period ended December 31, 2007, attached to this report. Genentech disclaims, and does not undertake, any obligation to update or revise any forward-looking statements in this report.
1 The non-GAAP EPS goal for 2006 through 2010 excludes the effects of redemption-related charges, litigation-related and similar special items, employee stock-based compensation expense, and certain items associated with the acquisition of Tanox, Inc., including an in-process research and development charge (a non-recurring charge in the third quarter of 2007), recurring recognition of deferred royalty revenue, recurring amortization of intangible assets, and a gain on acquisition pursuant to EITF 04-1 (a non-recurring item in the third quarter of 2007), together with the related tax benefits of excluding such items, as well as potential and similar special items related to existing or future litigation or its resolution or changes in or adoption of accounting principles, any of which may be significant. GAAP EPS for 2006 through 2010 would include the items described above. GAAP EPS growth rate (CAGR) from January 1, 2006 through December 31, 2007 was 48%. Our 2007 non-GAAP financial measures exclude the effects of: (i) recurring amortization charges related to the Redemption of our common stock by Roche Holdings, Inc. and our acquisition of Tanox, Inc. in the third quarter of 2007 of $132 million on a pretax basis, (ii) litigation-related and similar special items for accrued interest and associated bond costs on the City of Hope judgment of $54 million on a pretax basis, (iii) employee stock-based compensation expense of $403 million on a pretax basis, (iv) a non-recurring charge of $77 million related to the acquisition of Tanox, Inc. on a pretax basis (v) a non-recurring gain pursuant to application of EITF 04-1 to our acquisition of Tanox, Inc. of $121 million on a pretax basis, (vi) recognition of deferred royalty revenue of $6 million on a pretax basis resulting from our acquisition of Tanox, Inc. and (vii) the related net income tax effects of excluding these items of $166 million. Our 2006 non-GAAP financial measures exclude the effects of: (i) recurring amortization charges related to the Redemption of $105 million on a pretax basis, (ii) litigation-related and similar special items for accrued interest and associated bond costs on the City of Hope judgment of $54 million on a pretax basis, (iii) employee stock-based compensation expense of $309 million on a pretax basis, and (iv) the related income tax benefit on these items of $191 million.
2 Our free cash flow measure is defined as cash from ongoing operations less gross capital expenditures. Cash from ongoing operations is derived from the “net cash provided by operating activities” line in our consolidated statements of cash flows excluding the effect of changes in the trading portfolio, but this amount may be adjusted for items that would allow the measure to better reflect our operational perfor-mance. These adjustments include, for example, cash receipts or payments related to litigation settlements, investments in trading securities and other items, any of which may be significant. In 2007 and 2006, cash from ongoing operations represents net cash provided by operating activities, excluding the effect of changes in the trading portfolio of $360 million and $29 million, respectively.
OUR VISION
PROGRESS TOwARD OUR GOALS
As of February 25, 2008

6

7
Jordan, Nutropin AQ® Patient
Small at birth, Jordan consistently fell below the height and weight charts during his medical visits. Through the years, he was upset about always being the shortest in his classes at school, and his mother Rhonda became concerned. When Jordan’s doctor diagnosed him with growth hormone deficiency in November 2006, Jordan started treatment with Nutropin AQ. Now Jordan is no longer the shortest in his class, and he even meets the minimum height requirement at theme parks. Jordan likes to sing, play the piano and draw. He holds a black belt in Hapkido.
“ Being a black belt in Hapkido takes a lot of courage.
You have to prove yourself and practice a lot to reach
the next level.”
Individual results may vary.
8
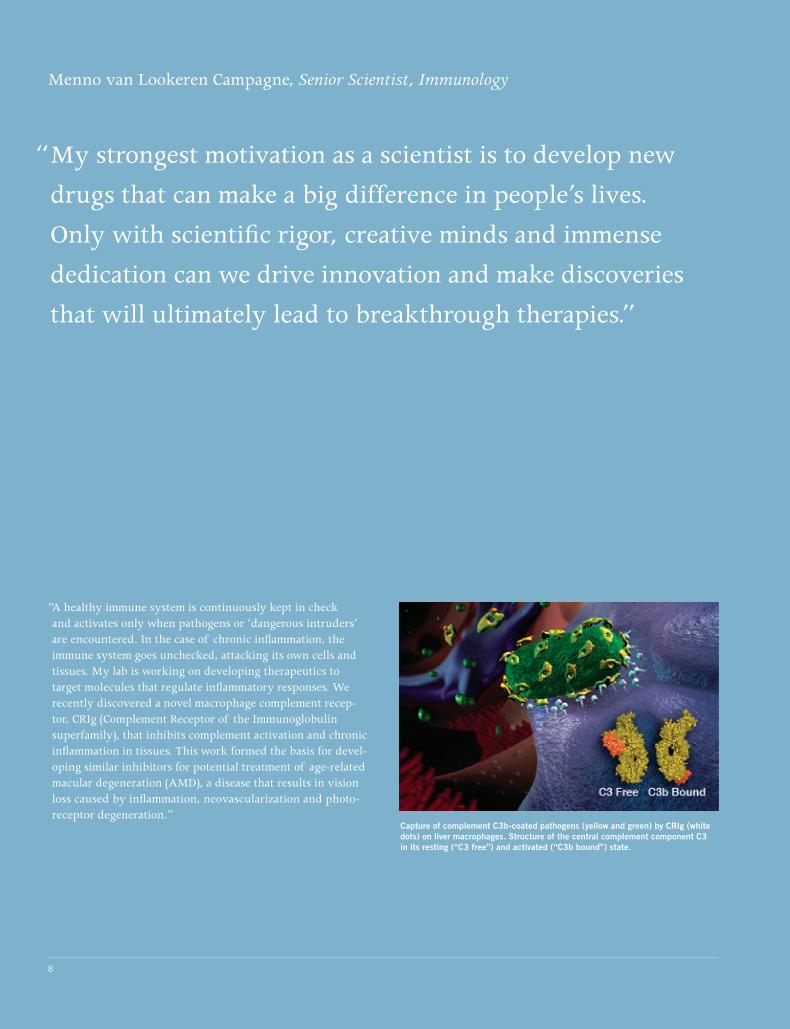
Capture of complement C3b-coated pathogens (yellow and green) by CRIg (white dots) on liver macrophages. Structure of the central complement component C3 in its resting (“C3 free”) and activated (“C3b bound”) state.
“A healthy immune system is continuously kept in check and activates only when pathogens or ‘dangerous intruders’ are encountered. In the case of chronic inflammation, the immune system goes unchecked, attacking its own cells and tissues. My lab is working on developing therapeutics to target molecules that regulate inflammatory responses. We recently discovered a novel macrophage complement recep-tor, CRIg (Complement Receptor of the Immunoglobulin superfamily), that inhibits complement activation and chronic inflammation in tissues. This work formed the basis for devel-oping similar inhibitors for potential treatment of age-related macular degeneration (AMD), a disease that results in vision loss caused by inflammation, neovascularization and photo-receptor degeneration.”
Menno van Lookeren Campagne, Senior Scientist, Immunology
“ My strongest motivation as a scientist is to develop new
drugs that can make a big difference in people’s lives.
Only with scientific rigor, creative minds and immense
dedication can we drive innovation and make discoveries
that will ultimately lead to breakthrough therapies.”

9

10
11
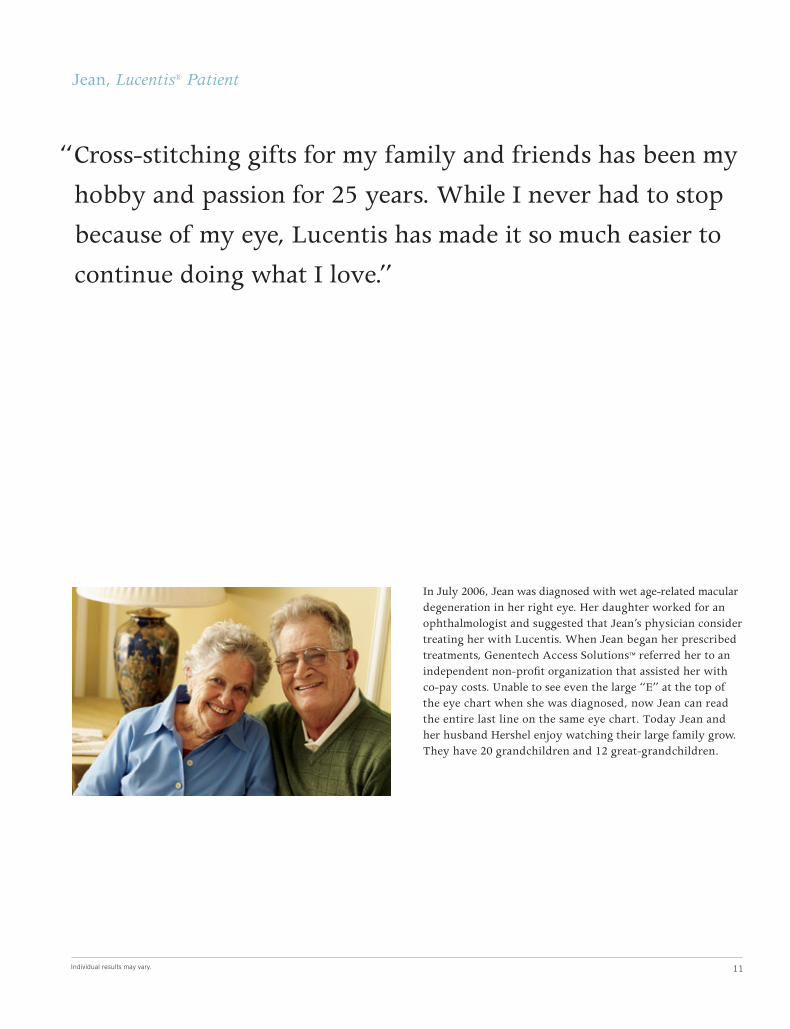
In July 2006, Jean was diagnosed with wet age-related macular degeneration in her right eye. Her daughter worked for an ophthalmologist and suggested that Jean’s physician consider treating her with Lucentis. When Jean began her prescribed treatments, Genentech Access Solutions™ referred her to an independent non-profit organization that assisted her with co-pay costs. Unable to see even the large “E” at the top of the eye chart when she was diagnosed, now Jean can read the entire last line on the same eye chart. Today Jean and her husband Hershel enjoy watching their large family grow. They have 20 grandchildren and 12 great-grandchildren.
“ Cross-stitching gifts for my family and friends has been my
hobby and passion for 25 years. While I never had to stop
because of my eye, Lucentis has made it so much easier to
continue doing what I love.”
Jean, Lucentis® Patient
Individual results may vary.

12
Development Pipeline
For more than 30 years, Genentech has excelled at transforming scientific discoveries into breakthrough therapies for patients. Today, Genentech’s development pipeline focuses on oncology, immunology, and disorders of tissue growth and repair.
Oncology
Immunology
Tissue Growth & Repair
3rd Generation Anti-CD202
ABT-263
Anti-CD40
IAP Antagonist
MEK Inhibitor
MetMAb
Rituxan® + Anti-CD40
New Molecular Entities (2)
Anti-Beta7 Anti-IFNalpha Anti-IL13 Anti-OX40L
Anti-oxLDL
Chronic Lymphocytic Leukemia Non-Hodgkin’s Lymphoma
Chronic Lymphocytic Leukemia Lymphoid Malignancies Small Cell Lung Cancer
Multiple Myeloma
Cancer Therapy
Cancer Therapy
Cancer Therapy
Diffuse Large B-cell Lymphoma Non-Hodgkin’s Lymphoma
Cancer Therapy
Ulcerative Colitis1
Systemic Lupus Erythematosus Asthma Asthma1
Secondary Prevention of Cardiovascular Events1
Oncology
Immunology
Tissue Growth & Repair
ABT-869
Anti-CD40
Apomab
Avastin®
Avastin® +/- Apomab
Pertuzumab
Apo2L/TRAIL +/- Avastin®
Rituxan® + Anti-CD40
Rituxan® +/- Apo2L/TRAIL
Rituxan® +/- Apomab
Systemic Hedgehog Antagonist
Trastuzumab-DM1
2nd Generation Anti-CD202
Raptiva®
Lucentis®
Hepatocellular Carcinoma Metastatic Breast Cancer1 Metastatic Colorectal Cancer1 Non-Small Cell Lung Cancer Renal Cell Carcinoma
Diffuse Large B-cell Lymphoma
Chondrosarcoma
Extensive Small Cell Lung Cancer Non-Squamous, Non-Small Cell Lung Cancer with Previously Treated CNS Metastases Relapsed Multiple Myeloma Relapsed Platinum-Sensitive Ovarian Cancer
Non-Small Cell Lung Cancer
Ovarian Cancer
Non-Small Cell Lung Cancer
Diffuse Large B-cell Lymphoma
Non-Hodgkin’s Lymphoma
Non-Hodgkin’s Lymphoma1
Solid Tumors1
HER2-Positive Metastatic Breast Cancer
Relapsing Remitting Multiple Sclerosis1
Renal Transplantation1
Diabetic Macular Edema
PhASE 1
PhASE 2

13
Development Pipeline
Oncology
Immunology
Tissue Growth & Repair
Avastin®
Avastin® +/- Tarceva®
Herceptin®
Herceptin® +/- Avastin®
Herceptin® +/- Pertuzumab
Rituxan® (Hematology/Oncology)
Rituxan® +/- Avastin®
Tarceva®
Tarceva® +/- Avastin®
2nd Generation Anti-CD202
Rituxan® (Immunology)
Xolair®
Lucentis®
TNKase®
1 Preparing for phase.2 Our collaborator Biogen Idec Inc. disagrees with certain of our development decisions under our 2003 collaboration agreement related to humanized anti-CD20 products. We continue to pursue a resolution
of our differences with Biogen Idec Inc. The disputed issues were submitted to arbitration in San Francisco, California. Resolution of the arbitration could require that both parties agree to certain development decisions before moving forward with humanized anti-CD20 antibody clinical trials, and possibly clinical trials of other collaboration products, including Rituxan, in which case we may have to alter or cancel planned trials in order to obtain Biogen Idec Inc.’s approval.
Oncology Avastin® First-Line Metastatic Renal Cell Carcinoma Relapsed Glioblastoma Multiforme
Oncology Herceptin® Adjuvant HER2-Positive Breast Cancer – Based on BCIRG-006 Data
FDA SUbmISSION PREP
AwAITING FDA ACTION
PhASE 3
As of February 25, 2008
Adjuvant Colon Cancer Adjuvant HER2-Negative Breast Cancer Adjuvant Non-Small Cell Lung Cancer First-Line Metastatic Breast Cancer First-Line Metastatic Glioblastoma Multiforme1 First-Line Metastatic Ovarian Cancer Gastrointestinal Stromal Tumors1 High Risk Carcinoid1 Hormone Refractory Prostate Cancer Metastatic Head and Neck Cancer1 Relapsed Platinum-Sensitive Ovarian Cancer Second-Line Metastatic Breast Cancer Second-Line Metastatic Colorectal Cancer
First-Line Metastatic Non-Squamous, Non-Small Cell Lung Cancer
Adjuvant HER2-Positive Breast Cancer (HERA Trial) HER2-Positive Ductal Carcinoma in Situ1
Adjuvant HER2-Positive Breast Cancer1 First-Line HER2-Positive Metastatic Breast Cancer
HER2-Positive Metastatic Breast Cancer1
Follicular Non-Hodgkin’s Lymphoma Relapsed Chronic Lymphocytic Leukemia
Diffuse Large B-cell Lymphoma
Adjuvant Non-Small Cell Lung Cancer First-Line Metastatic Non-Small Cell Lung Cancer
Second-Line Metastatic Non-Small Cell Lung Cancer
Lupus Nephritis1 Rheumatoid Arthritis Systemic Lupus Erythematosus
Active Rheumatoid Arthritis ANCA-Associated Vasculitis Lupus Nephritis Primary Progressive Multiple Sclerosis Systemic Lupus Erythematosus
Pediatric Asthma
Diabetic Macular Edema Retinal Vein Occlusion
Catheter Clearance

14

15
“My oncology research focuses on projects involving thera-peutic antibodies such as Herceptin, which are designed to track down and destroy cancer cells without harming normal cells. However, not all antibodies that target tumor cells can effectively destroy the tumor, and in some cases, despite successful treatment initially, the tumor becomes resistant to the antibody. Chemotherapy drugs, on the other hand, are very potent cell-killing agents, but they do not adequately distinguish tumor cells from normal cells; thus, these agents often have profound side effects. I am working with an exceptional team to develop antibodies to which we have attached potent cytotoxic drugs. These antibodies are known as antibody drug conjugates (ADCs). Our goal is to deliver the cell-killing agent directly to the tumor cells while avoiding exposure of the healthy tissues to the cyto-toxic drug. An example of an ADC developed by our team is Trastuzumab-DM1 (T-DM1). T-DM1 is a HER2 antibody drug conjugate comprised of Genentech’s trastuzumab antibody linked to DM1, a cell-killing agent developed by ImmunoGen. T-DM1 is now undergoing Phase II clinical trials to evaluate its efficacy and safety in HER2-positive metastatic breast cancer.”
“ Translating research ideas into effective therapies is
thrilling. As the T-DM1 clinical trials progress, for example,
I have high hope and expectation that our work will
enable clinicians to treat the most critically ill breast cancer
patients while sparing them the unpleasant side effects
associated with more traditional chemotherapy.”
Susan Spencer, Senior Project Manager, Translational Oncology
T-Dm1 binds to the hER2 receptor found on the surface of the tumor cell. After binding, the antibody drug conjugate is internalized inside the cell where the cytotoxic drug Dm1 is released, resulting in the death of the cancer cell.

16
At age 17, after a bout with rheumatic fever that left her joints swollen and painful, Natalie was diagnosed with rheu-matoid arthritis. Initially she decided not to take medication, but as time passed and her mobility decreased, Natalie researched treatment options. After trying anti-TNF therapy (for reducing joint inflammation), she began treatment with methotrexate and Rituxan, which lessened her joint stiff-ness and helped her from feeling as fatigued. Today Natalie enjoys her favorite activities–cooking, reading and spending time with family and friends.
“ I love cooking. I like spending time in the kitchen creating
something–it’s cathartic. You focus on what you’re doing,
and you do it with a lot of heart.”
Natalie, Rituxan® Patient
Individual results may vary.

17

18
19
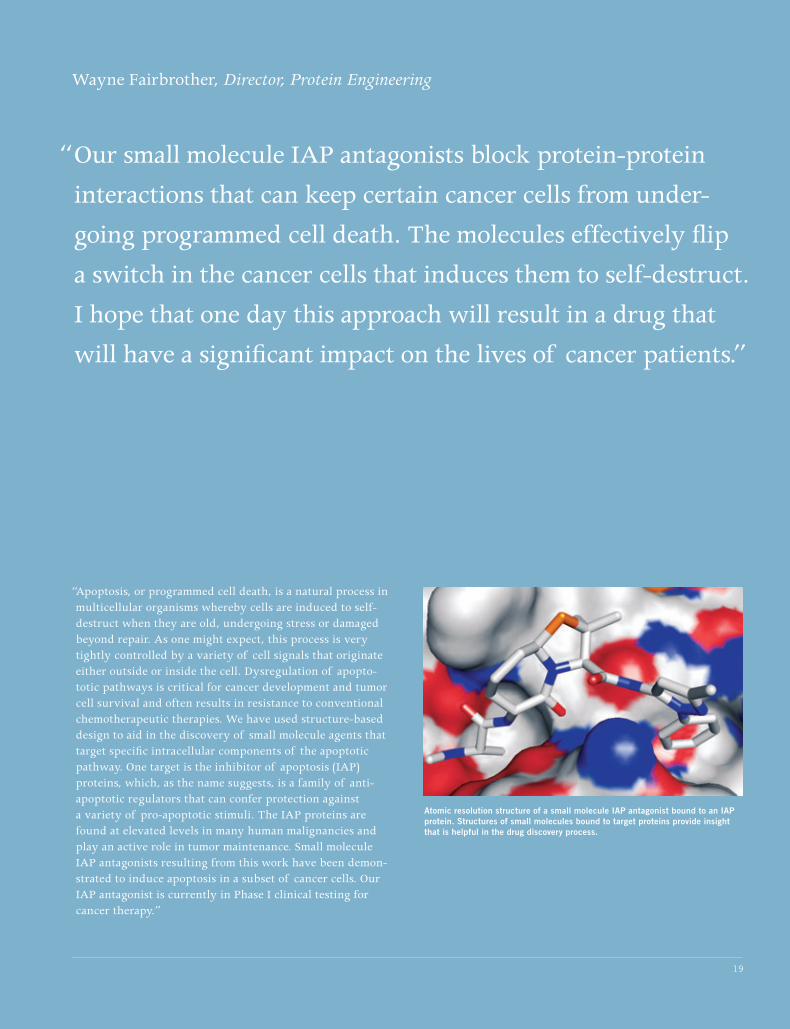
“ Our small molecule IAP antagonists block protein-protein
interactions that can keep certain cancer cells from under-
going programmed cell death. The molecules effectively flip
a switch in the cancer cells that induces them to self-destruct.
I hope that one day this approach will result in a drug that
will have a significant impact on the lives of cancer patients.”
“Apoptosis, or programmed cell death, is a natural process in multicellular organisms whereby cells are induced to self-destruct when they are old, undergoing stress or damaged beyond repair. As one might expect, this process is very tightly controlled by a variety of cell signals that originate either outside or inside the cell. Dysregulation of apopto-totic pathways is critical for cancer development and tumor cell survival and often results in resistance to conventional chemotherapeutic therapies. We have used structure-based design to aid in the discovery of small molecule agents that target specific intracellular components of the apoptotic pathway. One target is the inhibitor of apoptosis (IAP) proteins, which, as the name suggests, is a family of anti-apoptotic regulators that can confer protection against a variety of pro-apoptotic stimuli. The IAP proteins are found at elevated levels in many human malignancies and play an active role in tumor maintenance. Small molecule IAP antagonists resulting from this work have been demon-strated to induce apoptosis in a subset of cancer cells. Our IAP antagonist is currently in Phase I clinical testing for cancer therapy.”
Wayne Fairbrother, Director, Protein Engineering
Atomic resolution structure of a small molecule IAP antagonist bound to an IAP protein. Structures of small molecules bound to target proteins provide insight that is helpful in the drug discovery process.

20
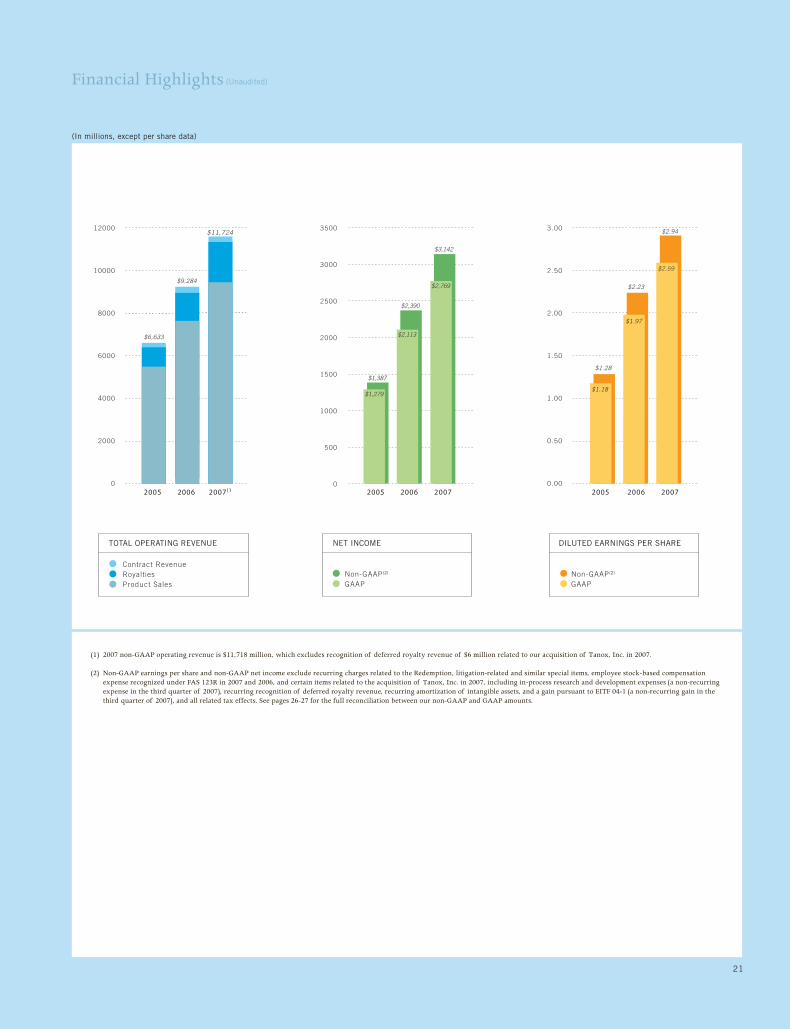
Financial Highlights (unaudited)
% Change from Preceding year
yeArs ended deCember 31, 2007 2006 2005 2007/2006 2006/2005
Product sales $ 9,443 $ 7,640 $ 5,488 24% 39%
Total operating revenue(1) 11,724 9,284 6,633 26 40
Cost of sales(2) 1,571 1,181 1,011 33 17
COS as a % of sales 17% 15% 18%
Research and development expenses(2) 2,446 1,773 1,262 38 40
R&D as a % of revenue 21% 19% 19%
Marketing, general and administrative expenses(2) 2,256 2,014 1,435 12 40
MG&A as a % of revenue 19% 22% 22%
Collaboration profit sharing 1,080 1,005 823 7 22
Write-off of in-process research and development
related to acquisition(3) 77 — — — —
Gain on acquisition(3) (121) — — — —
Recurring charges related to redemption
and acquisition(4) 132 105 123 26 (15)
Special items: litigation-related(5) 54 54 58 — (7)
Pretax operating income 4,229 3,152 1,921 34 64
Pretax operating margin 36% 34% 29%
Net income 2,769 2,113 1,279 31 65
Diluted earnings per share 2.59 1.97 1.18 31 67
Non-GAAP net income(6) $ 3,142 $ 2,390 $ 1,387 31% 72%
Non-GAAP net income as a % of revenue(6) 27% 26% 21%
Non-GAAP diluted earnings per share(6) 2.94 2.23 1.28 32 74
Shares used to compute diluted earnings per share 1,069 1,073 1,081 (0) (1)
Shares outstanding at year-end 1,052 1,053 1,054 (0) (0)
Stock price at year-end $ 67.07 $ 81.13 $ 92.50 (17) (12)
No cash dividends were paid
Cash, cash equivalents, short-term investments,
long-term marketable debt and equity securities
and equity hedge instruments $ 6,089 $ 4,375 $ 3,887 39 13
Property, plant and equipment, net 4,986 4,173 3,349 19 25
Total assets 18,940 14,842 12,147 28 22
Long-term debt(7),(8) 2,402 2,204 2,083 9 6
Total liabilities 7,035 5,364 4,677 31 15
Total stockholders’ equity 11,905 9,478 7,470 26 27
Capital expenditures(8) 977 1,214 1,400 (20) (13)
Number of employees at year-end 11,174 10,533 9,563 6 10
(in millions, except per share, stock price and employee data)
(1) Amount in 2007 includes recognition of deferred royalty revenue of $6 million related to our acquisition of Tanox, Inc. in 2007.(2) Amounts in 2007 and 2006 include employee stock-based compensation expense due
to our adoption of FAS 123R on January 1, 2006. In 2007, cost of sales, research and development, and marketing, general and administrative expenses include employee stock-based compensation expense of $71 million, $153 million and $179 million, respectively. In 2006, research and development, and marketing, general and administra-tive expenses include employee stock-based compensation expense of $140 million and $169 million, respectively. No employee stock-based compensation expense was recognized in cost of sales in any period ending prior to January 1, 2007.
(3) Represents non-recurring items related to our acquisition of Tanox, Inc. in 2007.(4) Represents the amortization of other intangible assets in 2007, 2006 and 2005, related to
the Redemption and the effects of push-down accounting, and our acquisition of Tanox, Inc. in 2007.
(5) Amounts in 2007 and 2006 include accrued interest and bond costs related to the City of Hope (COH) trial judgment. Amount in 2005 includes accrued interest and bond costs related to the COH trial judgment and net amounts paid related to other litigation settle-ments. For further information on these items, see the “Results of Operations” section of Item 7, “Management’s Discussion and Analysis of Financial Condition and Results of Operations,” in Part II of our 2007 Form 10-K on file with the Securities and Exchange Commission (SEC).
(6) Non-GAAP amounts exclude recurring charges related to the Redemption, litigation-related and similar special items, employee stock-based compensation expense recognized under FAS 123R in 2007 and 2006, and certain items associated with the acquisition of Tanox, Inc. in 2007, including in-process research and development expenses (a non-recurring expense in the third quarter of 2007), recurring recognition of deferred royalty revenue, recurring amortization of intangible assets, and a gain pursuant to EITF 04-1 (a non-recurring gain in the third quarter of 2007), and all related tax effects. GAAP net income as a percentage of operating revenues was 24 percent in 2007, 23 percent in 2006 and 19 percent in 2005. See pages 26-27 for the full reconciliation between our non-GAAP and GAAP amounts. For further information on these items, see the “Results of Opera-tions” section of Item 7, “Management’s Discussion and Analysis of Financial Condition and Results of Operations,” in Part II of our 2007 Form 10-K on file with the SEC.
(7) Includes approximately $2 billion related to our debt issuance in July 2005. For further information, see Note 8, “Leases, Commitments and Contingencies” in Part II, Item 8 of our 2007 Form 10-K on file with the SEC.
(8) Capital expenditures exclude approximately $203 million in 2007, $104 million in 2006 and $94 million in 2005 of capitalized costs related to our accounting for construction projects of which we are considered to be the owner during the construction period. We have recognized $399 million in 2007, $216 million in 2006 and $94 million in 2005 as a construction financing obligation in long-term debt.
12000
10000
8000
6000
4000
2000
0
3.00
2.50
2.00
1.50
1.00
0.50
0.002005 2006 2007�1
3500
3000
2500
2000
1500
1000
500
02005 2006 2007 2005 2006 2007
TOTAL OPERATING REVENUE
Contract RevenueRoyaltiesProduct Sales
NET INCOME
Non-GAAP (2)
GAAP
DILUTED EARNINGS PER SHARE
Non-GAAP (2)
GAAP
$11,724
$6,633
$9,284
$2,390
$2,113
$2.94
$2.59
$2.23
$1.97
$3,142
$2,769
$1,387
$1,279
$1.28
$1.18
21
Financial Highlights (unaudited)
(in millions, except per share data)
(1) 2007 non-GAAP operating revenue is $11,718 million, which excludes recognition of deferred royalty revenue of $6 million related to our acquisition of Tanox, Inc. in 2007.
(2) Non-GAAP earnings per share and non-GAAP net income exclude recurring charges related to the Redemption, litigation-related and similar special items, employee stock-based compensation expense recognized under FAS 123R in 2007 and 2006, and certain items related to the acquisition of Tanox, Inc. in 2007, including in-process research and development expenses (a non-recurring expense in the third quarter of 2007), recurring recognition of deferred royalty revenue, recurring amortization of intangible assets, and a gain pursuant to EITF 04-1 (a non-recurring gain in the third quarter of 2007), and all related tax effects. See pages 26-27 for the full reconciliation between our non-GAAP and GAAP amounts.
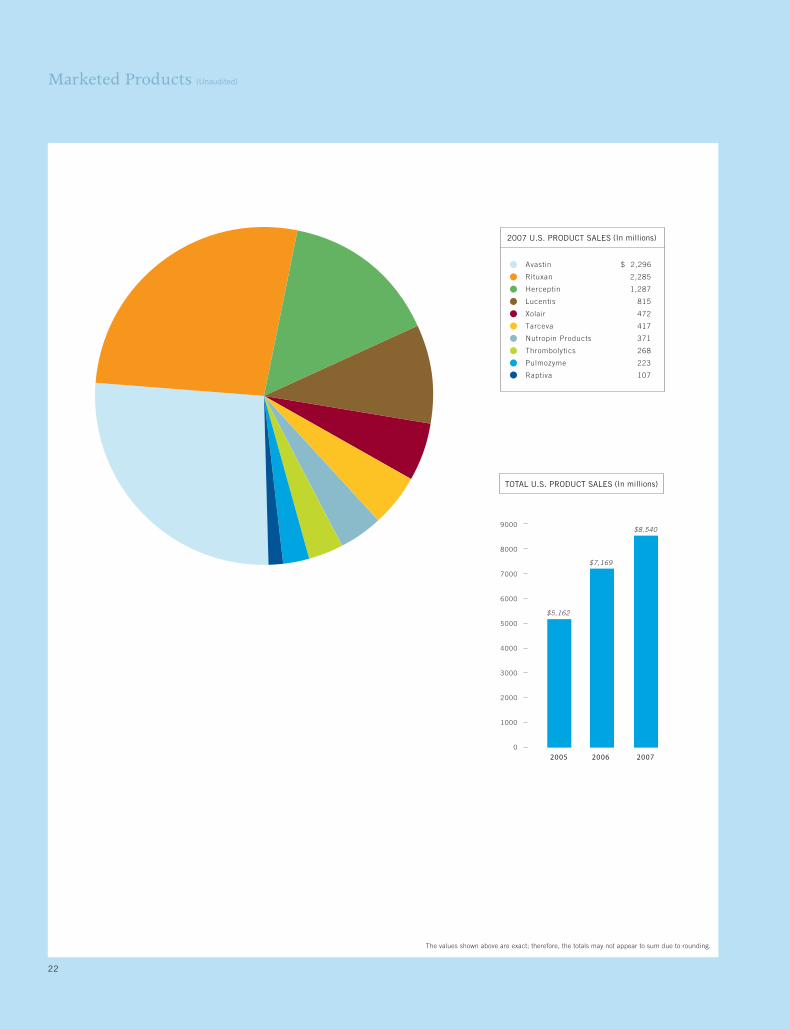
(In millions)2007 U.S. PRODUCT SALES
Avastin
Rituxan
Herceptin
Lucentis
Xolair
Tarceva
Nutropin Products
Thrombolytics
Pulmozyme
Raptiva
$ 2,296
2,285
1,287
815
472
417
371
268
223
107
9000
8000
7000
6000
5000
4000
3000
2000
1000
0
$5,162
$7,169
2005 2006
TOTAL U.S. PRODUCT SALES (In millions)
2007
$8,540
22
Marketed Products (unaudited)
The values shown above are exact; therefore, the totals may not appear to sum due to rounding.

Avastin
Tarceva
Rituxan
Nutropin Products
2500
1250
0
$2,296
$1,133
$1,746
2005 2006 2007
Herceptin
Thrombolytics
2005 2006 2007
1500
750
0
$1,287
$747
$1,234
2005 2006 2007
450
225
0
$417
$275
$402400
200
0
$371$370 $378
2005 2006 2007
Pulmozyme
250
125
0
$223
$186$199
2005 2006 2007
300
150
0
$268
$218
$243
2005 2006 2007
120
60
0
$107
$79
$90
2005 2006 2007
Lucentis
2006 2007
1000
500
0
$380
$815
Xolair
Raptiva
500
250
0
$472
$320
$425
2005 2006 20072005 2006 2007
2500
1250
0
$2,285
$1,832
$2,071
Tarceva® (erlotinib), which we commercialize with OSI Pharma-ceuticals, Inc., is a small-molecule tyrosine kinase inhibitor of the HER1/epidermal growth factor receptor signaling pathway. Tar-ceva is approved for the treatment of patients with locally advanced or metastatic non-small cell lung cancer after failure of at least one prior chemotherapy regimen. It is also approved, in combination with gemcitabine chemotherapy, for the first-line treatment of patients with locally advanced, unresectable or metastatic pancreatic cancer.
Nutropin® (somatropin [rDNA origin] for injection) and Nutropin AQ® are growth hormone prod-ucts approved for the treatment of growth hormone deficiency in children and adults, growth failure associated with chronic renal insufficiency prior to kid-ney transplantation, short stature associated with Turner syndrome and long-term treatment of idio-pathic short stature.
Activase® (alteplase, recombinant) is a tissue plasminogen activator (or t-PA) approved for the treat-ment of acute myocardial infarction (heart attack), acute ischemic stroke (blood clots in the brain) within three hours of the onset of symp-toms, and acute massive pulmonary embolism (blood clots in the lungs). TNKase® (tenecteplase) is a modi-fied form of t-PA approved for the treatment of acute myocardial infarction (heart attack). Cathflo® Activase® (alteplase, recombinant) is a t-PA approved in adult and pediatric patients for the restoration of function to central venous access devices that have become occluded due to a blood clot.
Pulmozyme® (dornase alfa, recom-binant) is an inhalation solution approved for the treatment of cys-tic fibrosis.
Raptiva® (efalizumab) is a human-ized anti-CD11a antibody approved for the treatment of chronic mod-erate-to-severe plaque psoriasis in adults age 18 or older who are can-didates for systemic therapy or phototherapy.
Avastin® (bevacizumab) is an anti-VEGF humanized antibody approved for use in combination with intravenous 5-fluorouracil-based chemotherapy as a treatment for patients with first- or second-line metastatic cancer of the colon or rectum. It is also approved for use in combination with carbopla-tin and paclitaxel chemotherapy for the first-line treatment of unresect-able, locally advanced, recurrent or metastatic non-squamous, non-small cell lung cancer and in combination with paclitaxel chemotherapy for the treatment of patients who have not received chemotherapy for meta-static HER2- negative breast cancer.1
Rituxan® (Rituximab) is an anti-CD20 antibody which we com-mercialize with Biogen Idec Inc. It is approved for several forms of CD20-positive, B-cell non-Hodg-kin’s lymphoma. Rituxan is also approved in combination with methotrexate for reducing signs and symptoms and slowing the progression of structural damage in adult patients with moderate-ly-to-severely active rheumatoid arthritis who have had an inade-quate response to one or more tumor necrosis factor antagonist therapies.
Herceptin® (Trastuzumab) is a humanized anti-HER2 antibody approved in combination with paclitaxel and as a single agent in second- and third-line therapy for patients with HER2-positive metastatic breast cancer. Her-ceptin is also approved as an adjuvant treatment in HER2-pos-itive, node-positive breast cancer in combination with doxorubicin, cyclophosphamide, and paclitaxel and HER2-overexpressing node-negative or node-positive breast cancer, following multi-modality anthracycline-based therapy.
Lucentis® (ranibizumab injection) is an anti-VEGF antibody fragment approved for the treatment of neo-vascular (wet) age-related macular degeneration.
Xolair® (Omalizumab) for Subcuta-neous Use is a humanized anti-IgE antibody which we commercialize with Novartis Pharma AG. Xolair is approved for adults and adoles-cents (12 years of age and above) with moderate-to-severe persis-tent asthma who have a positive skin test or in vitro reactivity to a perennial aeroallergen and whose symptoms are inadequately controlled with inhaled corticos-teroids.
U.S. PRODUCT SALES (in millions)
23
Marketed Products (unaudited)
1 On February 22, 2008, Genentech received accelerated approval for Avastin in combination with paclitaxel for the treatment of patients who have not received chemotherapy for metastatic HER2-negative breast cancer. The effectiveness of Avastin in metastatic breast cancer is based on an improvement in progression-free survival. Avastin is not indicated for patients with breast cancer that has progressed following anthracycline and taxane chemotherapy administered for metastatic disease. Currently, no data are available that demonstrate an improvement in disease-related symptoms or increased survival with Avastin in breast cancer.

24
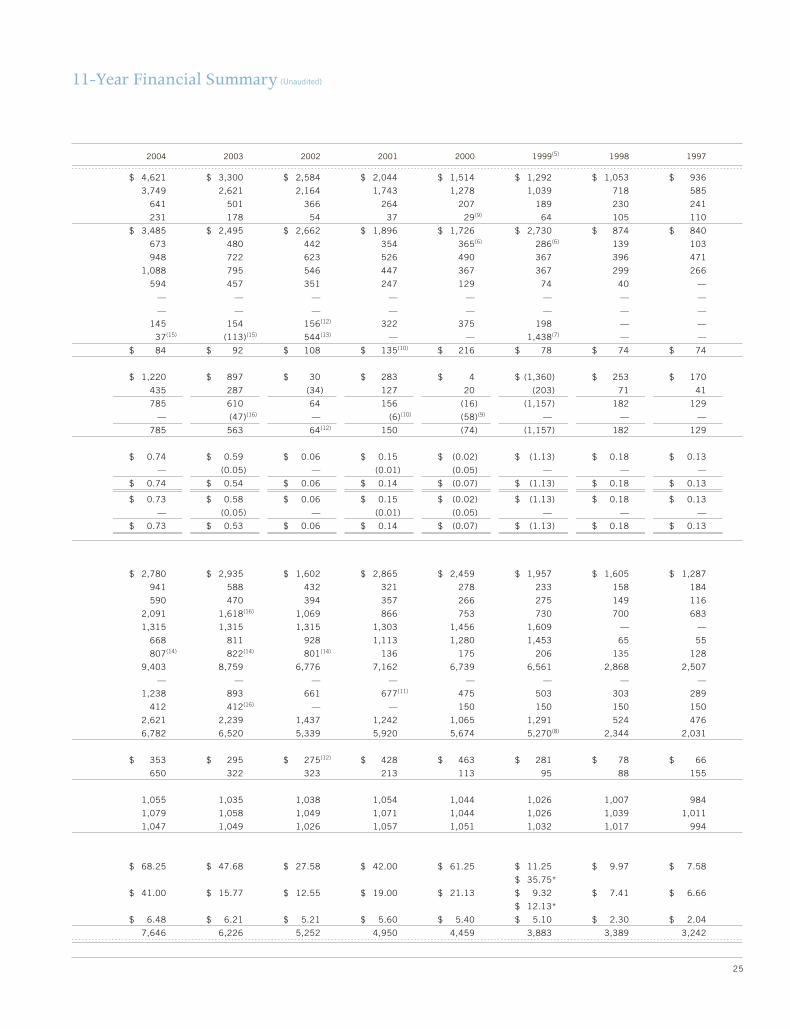
11-Year Financial Summary (unaudited)
(in millions, except per share, stock price and employee data)
yeArs ended deCember 31, 2007 2006 2005 2004 2003 2002 2001 2000 1999(5) 1998 1997
TOTAl OPerATinG revenue $ 11,724 $ 9,284 $ 6,633 $ 4,621 $ 3,300 $ 2,584 $ 2,044 $ 1,514 $ 1,292 $ 1,053 $ 936
Product sales 9,443 7,640 5,488 3,749 2,621 2,164 1,743 1,278 1,039 718 585
Royalties(1) 1,984 1,354 935 641 501 366 264 207 189 230 241
Contract revenue 297 290 210 231 178 54 37 29(9) 64 105 110
TOTAl COsTs And eXPenses $ 7,495 $ 6,132 $ 4,712 $ 3,485 $ 2,495 $ 2,662 $ 1,896 $ 1,726 $ 2,730 $ 874 $ 840
Cost of sales 1,571 1,181 1,011 673 480 442 354 365(6) 286(6) 139 103
Research and development 2,446 1,773 1,262 948 722 623 526 490 367 396 471
Marketing, general and administrative 2,256 2,014 1,435 1,088 795 546 447 367 367 299 266
Collaboration profit sharing 1,080 1,005 823 594 457 351 247 129 74 40 —
Write-off of in-process research and development related to acquisition(1) 77 — — — — — — — — — —
Gain on acquisition(1) (121) — — — — — — — — — —
Recurring charges related to redemption and acquisition(2) 132 105 123 145 154 156(12) 322 375 198 — —
Special items 54(15) 54(15) 58(15) 37(15) (113)(15) 544(13) — — 1,438(7) — —
Other income, net $ 197 $ 251 $ 92 $ 84 $ 92 $ 108 $ 135(10) $ 216 $ 78 $ 74 $ 74
inCOme (lOss) dATA
Income (loss) before taxes and cumulative effect of accounting change $ 4,426 $ 3,403 $ 2,013 $ 1,220 $ 897 $ 30 $ 283 $ 4 $ (1,360) $ 253 $ 170
Income tax provision (benefit) 1,657 1,290 734 435 287 (34) 127 20 (203) 71 41
Income (loss) before cumulative effect of accounting change 2,769 2,113 1,279 785 610 64 156 (16) (1,157) 182 129
Cumulative effect of accounting change, net of tax — — — — (47)(16) — (6)(10) (58)(9) — — —
Net income (loss) 2,769 2,113 1,279 785 563 64(12) 150 (74) (1,157) 182 129
eArninGs (lOss) Per shAre:
Basic: Earnings before cumulative effect of accounting change $ 2.63 $ 2.01 $ 1.21 $ 0.74 $ 0.59 $ 0.06 $ 0.15 $ (0.02) $ (1.13) $ 0.18 $ 0.13
Cumulative effect of accounting change, net of tax — — — — (0.05) — (0.01) (0.05) — — —
Net earnings per share $ 2.63 $ 2.01 $ 1.21 $ 0.74 $ 0.54 $ 0.06 $ 0.14 $ (0.07) $ (1.13) $ 0.18 $ 0.13
Diluted: Earnings before cumulative effect of accounting change $ 2.59 $ 1.97 $ 1.18 $ 0.73 $ 0.58 $ 0.06 $ 0.15 $ (0.02) $ (1.13) $ 0.18 $ 0.13
Cumulative effect of accounting change, net of tax — — — — (0.05) — (0.01) (0.05) — — —
Net earnings per share $ 2.59 $ 1.97 $ 1.18 $ 0.73 $ 0.53 $ 0.06 $ 0.14 $ (0.07) $ (1.13) $ 0.18 $ 0.13
seleCTed bAlAnCe sheeT dATA
Cash, cash equivalents, short-term investments, and long-term marketable debt and equity securities $ 6,065 $ 4,325 $ 3,814 $ 2,780 $ 2,935 $ 1,602 $ 2,865 $ 2,459 $ 1,957 $ 1,605 $ 1,287
Accounts receivable 1,766 1,666 1,050 941 588 432 321 278 233 158 184
Inventories 1,493 1,178 703 590 470 394 357 266 275 149 116
Property, plant and equipment, net 4,986 4,173 3,349 2,091 1,618(16) 1,069 866 753 730 700 683
Goodwill 1,577 1,315 1,315 1,315 1,315 1,315 1,303 1,456 1,609 — —
Other intangible assets 1,168 476 574 668 811 928 1,113 1,280 1,453 65 55
Other long-term assets 366(14) 1,342(14) 1,074(14) 807(14) 822(14) 801(14) 136 175 206 135 128
Total assets 18,940 14,842 12,147 9,403 8,759 6,776 7,162 6,739 6,561 2,868 2,507
Commercial paper 599(19) — — — — — — — — — —
Total current liabilities 3,918 2,010 1,660 1,238 893 661 677(11) 475 503 303 289
Long-term debt 2,402(17),(18) 2,204(17),(18) 2,083(17),(18) 412 412(16) — — 150 150 150 150
Total liabilities 7,035 5,364 4,677 2,621 2,239 1,437 1,242 1,065 1,291 524 476
Total stockholders’ equity 11,905 9,478 7,470 6,782 6,520 5,339 5,920 5,674 5,270(8) 2,344 2,031
OTher dATA
Depreciation and amortization expense $ 492 $ 407 $ 370 $ 353 $ 295 $ 275(12) $ 428 $ 463 $ 281 $ 78 $ 66
Capital expenditures 977(18) 1,214(18) 1,400(18) 650 322 323 213 113 95 88 155
shAre infOrmATiOn
Shares used to compute basic earnings per share 1,053 1,053 1,055 1,055 1,035 1,038 1,054 1,044 1,026 1,007 984
Shares used to compute diluted earnings per share 1,069 1,073 1,081 1,079 1,058 1,049 1,071 1,044 1,026 1,039 1,011
Shares outstanding at year-end 1,052 1,053 1,054 1,047 1,049 1,026 1,057 1,051 1,032 1,017 994
Per shAre dATA
Market price: High $ 89.73 $ 95.16 $ 100.20 $ 68.25 $ 47.68 $ 27.58 $ 42.00 $ 61.25 $ 11.25 $ 9.97 $ 7.58
$ 35.75*
Low $ 65.35 $ 75.58 $ 43.90 $ 41.00 $ 15.77 $ 12.55 $ 19.00 $ 21.13 $ 9.32 $ 7.41 $ 6.66
$ 12.13*
Book value $ 11.32 $ 9.00 $ 7.09 $ 6.48 $ 6.21 $ 5.21 $ 5.60 $ 5.40 $ 5.10 $ 2.30 $ 2.04
number Of emPlOyees AT yeAr-end 11,174 10,533 9,563 7,646 6,226 5,252 4,950 4,459 3,883 3,389 3,242
See pages 26-27 for footnotes to 11-Year Financial Summary.
25
11-Year Financial Summary (unaudited)
yeArs ended deCember 31, 2007 2006 2005 2004 2003 2002 2001 2000 1999(5) 1998 1997
TOTAl OPerATinG revenue $ 11,724 $ 9,284 $ 6,633 $ 4,621 $ 3,300 $ 2,584 $ 2,044 $ 1,514 $ 1,292 $ 1,053 $ 936
Product sales 9,443 7,640 5,488 3,749 2,621 2,164 1,743 1,278 1,039 718 585
Royalties(1) 1,984 1,354 935 641 501 366 264 207 189 230 241
Contract revenue 297 290 210 231 178 54 37 29(9) 64 105 110
TOTAl COsTs And eXPenses $ 7,495 $ 6,132 $ 4,712 $ 3,485 $ 2,495 $ 2,662 $ 1,896 $ 1,726 $ 2,730 $ 874 $ 840
Cost of sales 1,571 1,181 1,011 673 480 442 354 365(6) 286(6) 139 103
Research and development 2,446 1,773 1,262 948 722 623 526 490 367 396 471
Marketing, general and administrative 2,256 2,014 1,435 1,088 795 546 447 367 367 299 266
Collaboration profit sharing 1,080 1,005 823 594 457 351 247 129 74 40 —
Write-off of in-process research and development related to acquisition(1) 77 — — — — — — — — — —
Gain on acquisition(1) (121) — — — — — — — — — —
Recurring charges related to redemption and acquisition(2) 132 105 123 145 154 156(12) 322 375 198 — —
Special items 54(15) 54(15) 58(15) 37(15) (113)(15) 544(13) — — 1,438(7) — —
Other income, net $ 197 $ 251 $ 92 $ 84 $ 92 $ 108 $ 135(10) $ 216 $ 78 $ 74 $ 74
inCOme (lOss) dATA
Income (loss) before taxes and cumulative effect of accounting change $ 4,426 $ 3,403 $ 2,013 $ 1,220 $ 897 $ 30 $ 283 $ 4 $ (1,360) $ 253 $ 170
Income tax provision (benefit) 1,657 1,290 734 435 287 (34) 127 20 (203) 71 41
Income (loss) before cumulative effect of accounting change 2,769 2,113 1,279 785 610 64 156 (16) (1,157) 182 129
Cumulative effect of accounting change, net of tax — — — — (47)(16) — (6)(10) (58)(9) — — —
Net income (loss) 2,769 2,113 1,279 785 563 64(12) 150 (74) (1,157) 182 129
eArninGs (lOss) Per shAre:
Basic: Earnings before cumulative effect of accounting change $ 2.63 $ 2.01 $ 1.21 $ 0.74 $ 0.59 $ 0.06 $ 0.15 $ (0.02) $ (1.13) $ 0.18 $ 0.13
Cumulative effect of accounting change, net of tax — — — — (0.05) — (0.01) (0.05) — — —
Net earnings per share $ 2.63 $ 2.01 $ 1.21 $ 0.74 $ 0.54 $ 0.06 $ 0.14 $ (0.07) $ (1.13) $ 0.18 $ 0.13
Diluted: Earnings before cumulative effect of accounting change $ 2.59 $ 1.97 $ 1.18 $ 0.73 $ 0.58 $ 0.06 $ 0.15 $ (0.02) $ (1.13) $ 0.18 $ 0.13
Cumulative effect of accounting change, net of tax — — — — (0.05) — (0.01) (0.05) — — —
Net earnings per share $ 2.59 $ 1.97 $ 1.18 $ 0.73 $ 0.53 $ 0.06 $ 0.14 $ (0.07) $ (1.13) $ 0.18 $ 0.13
seleCTed bAlAnCe sheeT dATA
Cash, cash equivalents, short-term investments, and long-term marketable debt and equity securities $ 6,065 $ 4,325 $ 3,814 $ 2,780 $ 2,935 $ 1,602 $ 2,865 $ 2,459 $ 1,957 $ 1,605 $ 1,287
Accounts receivable 1,766 1,666 1,050 941 588 432 321 278 233 158 184
Inventories 1,493 1,178 703 590 470 394 357 266 275 149 116
Property, plant and equipment, net 4,986 4,173 3,349 2,091 1,618(16) 1,069 866 753 730 700 683
Goodwill 1,577 1,315 1,315 1,315 1,315 1,315 1,303 1,456 1,609 — —
Other intangible assets 1,168 476 574 668 811 928 1,113 1,280 1,453 65 55
Other long-term assets 366(14) 1,342(14) 1,074(14) 807(14) 822(14) 801(14) 136 175 206 135 128
Total assets 18,940 14,842 12,147 9,403 8,759 6,776 7,162 6,739 6,561 2,868 2,507
Commercial paper 599(19) — — — — — — — — — —
Total current liabilities 3,918 2,010 1,660 1,238 893 661 677(11) 475 503 303 289
Long-term debt 2,402(17),(18) 2,204(17),(18) 2,083(17),(18) 412 412(16) — — 150 150 150 150
Total liabilities 7,035 5,364 4,677 2,621 2,239 1,437 1,242 1,065 1,291 524 476
Total stockholders’ equity 11,905 9,478 7,470 6,782 6,520 5,339 5,920 5,674 5,270(8) 2,344 2,031
OTher dATA
Depreciation and amortization expense $ 492 $ 407 $ 370 $ 353 $ 295 $ 275(12) $ 428 $ 463 $ 281 $ 78 $ 66
Capital expenditures 977(18) 1,214(18) 1,400(18) 650 322 323 213 113 95 88 155
shAre infOrmATiOn
Shares used to compute basic earnings per share 1,053 1,053 1,055 1,055 1,035 1,038 1,054 1,044 1,026 1,007 984
Shares used to compute diluted earnings per share 1,069 1,073 1,081 1,079 1,058 1,049 1,071 1,044 1,026 1,039 1,011
Shares outstanding at year-end 1,052 1,053 1,054 1,047 1,049 1,026 1,057 1,051 1,032 1,017 994
Per shAre dATA
Market price: High $ 89.73 $ 95.16 $ 100.20 $ 68.25 $ 47.68 $ 27.58 $ 42.00 $ 61.25 $ 11.25 $ 9.97 $ 7.58
$ 35.75*
Low $ 65.35 $ 75.58 $ 43.90 $ 41.00 $ 15.77 $ 12.55 $ 19.00 $ 21.13 $ 9.32 $ 7.41 $ 6.66
$ 12.13*
Book value $ 11.32 $ 9.00 $ 7.09 $ 6.48 $ 6.21 $ 5.21 $ 5.60 $ 5.40 $ 5.10 $ 2.30 $ 2.04
number Of emPlOyees AT yeAr-end 11,174 10,533 9,563 7,646 6,226 5,252 4,950 4,459 3,883 3,389 3,242
See pages 26-27 for footnotes to 11-Year Financial Summary.

26
11-Year Financial Summary (unaudited)
reconciliation of GAAP to non-GAAP net income (unaudited) (in millions, except per share amounts)
yeArs ended deCember 31, 2007 2006 2005 2004 2003 2002 2001 2000 1999
GAAP net income (loss) $ 2,769 $ 2,113 $ 1,279 $ 785 $ 563 $ 64 $ 150 $ (74) $ (1,157)
Royalty revenue(1) (6) — — — — — — — —
Employee stock-based compensation expense(3) under
FAS 123R included in the following operating expenses:
Cost of sales 71 — — — — — — — —
Research and development 153 140 — — — — — — —
Marketing, general and administrative 179 169 — — — — — — —
Write-off of in-process research and development related to acquisition(1) 77 — — — — — — — —
Gain on acquisition(1) (121) — — — — — — — —
Recurring charges related to redemption and acquisition(2) 132 105 123 145 154 156(12) 322 375 198
Special items 54(15) 54(15) 58(15) 37(15) (113)(15) 544(13) — — 1,438(7)
Other Non-GAAP reconciling items — — — — — — (10)(10) 93(6) 93(6)
Income tax effect(4) (166) (191) (73) (73) (16) (280) (64) (127) (325)
Income before cumulative effect of accounting change 3,142 2,390 1,387 894 588 484 398 267 247
Cumulative effect of accounting change, net of tax — — — — 47(16) — 6(10) 58(9) —
Non-GAAP net income $ 3,142 $ 2,390 $ 1,387 $ 894 $ 635 $ 484 $ 404 $ 325 $ 247
Non-GAAP earnings per share:
Diluted $ 2.94 $ 2.23 $ 1.28 $ 0.83 $ 0.60 $ 0.46 $ 0.38 $ 0.30 $ 0.23
Non-GAAP weighted average shares used
to compute earnings per share:
Diluted 1,068(20) 1,074(20) 1,081 1,079 1,058 1,049 1,071 1,072 1,059
We have paid no dividends. We currently intend to retain all future income for use in the operation of our business and for future stock repurchases and, therefore, do not antici-pate paying any cash dividends in the foreseeable future.
Certain reclassifications of prior year amounts have been made to conform to the current year presentation.
All share and per share amounts reflect two-for-one stock splits of our Common Stock that were effected in 2004, 2000 and 1999.
* Common Stock began trading July 20, 1999; prior to that date, shares were Special Common Stock. On June 30, 1999, we redeemed all of our outstanding Special Com-mon Stock held by stockholders other than Roche (also known as the Redemption). Roche’s percentage ownership of our outstanding equity increased from 65 per-cent to 100 percent. On July 23, 1999, October 26, 1999, and March 29, 2000, Roche completed public offerings of our Common Stock. At December 31, 2007, Roche’s ownership percentage was 55.8 percent.
(1) Represents non-recurring items in 2007 and recurring recognition of deferred royalty revenue related to our acquisition of Tanox, Inc. in 2007.
(2) Primarily reflects amortization of other intangible assets in 1999 through 2007 and goodwill amortization in 1999 through 2001 related to the Redemption and push-down accounting, and the acquisition of Tanox, Inc. in 2007.
(3) Represents employee stock-based compensation expense associated with Genentech’s adoption of FAS 123R on January 1, 2006. No employee stock-based expense was rec-ognized in GAAP-reported cost of sales in any period ending prior to January 1, 2007.
(4) Reflects the income tax benefit on employee stock-based compensation expense under FAS 123R, recurring charges related to the Redemption, litigation-related and similar special items, items related to our acquisition of Tanox, Inc. and other non-GAAP reconciling items.
(5) GAAP 1999 results reflect the Redemption and push-down accounting and include the combined New Basis and Old Basis periods presented in the 1999 Consolidated Statements of Operations and Consolidated Statements of Cash Flows. Refer to our 2001 Form 10-K (Part II, Item 8) on file with the SEC.
(6) Includes costs related to the sale of inventory that was written up at the Redemption due to push-down accounting.
(7) Charges related to the Redemption and push-down accounting ($1,208 million) and legal settlements ($230 million).
(8) Reflects the effect of the Redemption and related push-down accounting of $5,202 million of excess purchase price over net book value, net of charges and accumu-lated amortization of goodwill and other intangible assets.
(9) Reflects the impact of the adoption of SAB 101 on revenue recognition effective January 1, 2000.
(10) Reflects the effect of the adoption of FAS 133 on Accounting for Derivative Instruments and Hedging Activities.
(11) The $150 million long-term debt was reclassified to current liabilities to reflect the March 27, 2002 maturity.
(12) We adopted FAS 141 on Business Combinations and FAS 142 on Goodwill and other Intangible Assets on January 1, 2002. In accordance with FAS 141 and 142, we dis-continued the amortization of goodwill and our trained and assembled workforce intangible asset, which resulted in an increase in reported net income by approxi-mately $158 million (or $0.15 per share) in 2002, as compared to the accounting prior to the adoption of FAS 141 and 142.
11-Year Financial Summary Footnotes

27
11-Year Financial Summary (unaudited)
yeArs ended deCember 31, 2007 2006 2005 2004 2003 2002 2001 2000 1999
GAAP net income (loss) $ 2,769 $ 2,113 $ 1,279 $ 785 $ 563 $ 64 $ 150 $ (74) $ (1,157)
Royalty revenue(1) (6) — — — — — — — —
Employee stock-based compensation expense(3) under
FAS 123R included in the following operating expenses:
Cost of sales 71 — — — — — — — —
Research and development 153 140 — — — — — — —
Marketing, general and administrative 179 169 — — — — — — —
Write-off of in-process research and development related to acquisition(1) 77 — — — — — — — —
Gain on acquisition(1) (121) — — — — — — — —
Recurring charges related to redemption and acquisition(2) 132 105 123 145 154 156(12) 322 375 198
Special items 54(15) 54(15) 58(15) 37(15) (113)(15) 544(13) — — 1,438(7)
Other Non-GAAP reconciling items — — — — — — (10)(10) 93(6) 93(6)
Income tax effect(4) (166) (191) (73) (73) (16) (280) (64) (127) (325)
Income before cumulative effect of accounting change 3,142 2,390 1,387 894 588 484 398 267 247
Cumulative effect of accounting change, net of tax — — — — 47(16) — 6(10) 58(9) —
Non-GAAP net income $ 3,142 $ 2,390 $ 1,387 $ 894 $ 635 $ 484 $ 404 $ 325 $ 247
Non-GAAP earnings per share:
Diluted $ 2.94 $ 2.23 $ 1.28 $ 0.83 $ 0.60 $ 0.46 $ 0.38 $ 0.30 $ 0.23
Non-GAAP weighted average shares used
to compute earnings per share:
Diluted 1,068(20) 1,074(20) 1,081 1,079 1,058 1,049 1,071 1,072 1,059
(13) Amount includes litigation-related special charges which comprised the City of Hope Medical Center litigation judgment in the second quarter of 2002, including accrued interest and costs related to obtaining a surety bond, and certain other liti-gation-related matters. For further information on these charges, see the “Results of Operations” section of Item 7, “Management’s Discussion and Analysis of Financial Condition and Results of Operations,” in Part II of our 2002 Form 10-K on file with the SEC.
(14) Includes approximately $788 million at December 31, 2006, $735 million at December 31, 2005, $682 million at December 31, 2004 and $630 million at each of December 31, 2003 and 2002 of restricted cash pledged to secure a bond for the City of Hope (COH) judgment. In 2007, the restricted cash balance of $788 million was reclassified as a short-term asset. For further information on the COH judgment, see Note 8, “Leases, Commitments and Contingencies” in Part II, Item 8 of our 2007 Form 10-K on file with the SEC.
(15) Litigation-related special items in 2007 and 2006 comprised accrued interest and bond costs related to the COH judgment, in 2005 it comprised accrued interest and bond costs related to the COH judgment and net amounts paid related to other litiga-tion settlements, in 2004 it comprised accrued interest and bond costs related to the COH judgment (net of a released accrual on a separate litigation matter), and in 2003 it comprised Amgen and Bayer litigation settlements (net of accrued interest and bond costs related to the COH litigation).
(16) Reflects the impact of the adoption of FIN 46, “Consolidation of Variable Interest Entities.” For more information, see the “Results of Operations” section of Item 7, “Management’s Discussion and Analysis of Financial Condition and Results of Operations,” in Part II of our 2003 Form 10-K on file with the SEC.
(17) Long-term debt in 2007, 2006 and 2005 includes approximately $2 billion related to our debt issuance in July 2005. For further information, see Note 7, “Debt,” in Part II, Item 8 of our 2007 Form 10-K on file with the SEC. Long-term debt in 2005 also reflects the repayment of $425 million to extinguish the consolidated debt and non-controlling interest related to a synthetic lease obligation. For further information, see Note 7, “Leases, Commitments and Contingencies” in Part II, Item 8 of our 2005 Form 10-K on file with the SEC.
(18) We capitalized costs in property, plant and equipment of approximately $203 mil-lion in 2007, $104 million in 2006 and $94 million in 2005 related to our accounting for construction projects for which we are considered to be the owner of the build-ings during the construction period. These costs have been excluded from 2007, 2006 and 2005 capital expenditures. We have also recognized $399 million, $216 mil-lion and $94 million as construction financing obligations in long-term debt as of December 31, 2007, 2006 and 2005, respectively, related to these projects. For further information, see Note 8, “Leases, Commitments and Contingencies” in Part II, Item 8 of our 2007 Form 10-K on file with the SEC.
(19) Represents amount outstanding under our commercial paper program started in the fourth quarter of 2007.
(20) Weighted average shares used to compute non-GAAP diluted earnings per share were computed exclusive of the methodology used to determine dilutive securities under FAS 123R.
For further information on the non-GAAP reconciling items presented above, see the “Results of Operations” section of Item 7, “Management’s Discussion and Analysis of Financial Condition and Results of Operations,” in Part II of our Form 10-K for the respective years on file with the SEC.

28
Executive Committee
From left to right: Stephen G. Juelsgaard, David A. Ebersman, Ian T. Clark, Arthur D. Levinson, Richard H. Scheller, Susan D. Desmond-Hellmann, Patrick Y. Yang
ARThUR D. LEVINSON, Ph.D.
Chairman and Chief Executive Officer
Dr. Levinson became chief executive officer of Genentech and joined the board of direc-tors in July 1995. He was named chairman of the board in 1999. Levinson joined the company in 1980 as a senior scientist and subsequently held the position of staff sci-entist. He was named senior vice president, Research and Development in 1993 and president in 1995. He has been a member of Genentech’s executive management team since 1990. Prior to his employment with Genentech, Levinson was a postdoctoral fel-low in the department of microbiology at the University of California, San Francisco.
SUSAN D. DESmOND-hELLmANN, m.D.,
m.P.h.
President, Product Development
Dr. Hellmann was named president, Product Development in 2004. She joined Genentech in 1995 as a clinical scientist and was named executive vice president, Develop-ment and Product Operations in 1999. Prior to joining Genentech, Hellmann was associate director of clinical cancer research at Bristol-Myers Squibb’s Pharmaceutical Research Institute. Trained as an oncolo-gist, Hellmann spent several years treating patients in the clinical setting.
IAN T. CLARK
Executive Vice President, Commercial
Mr. Clark joined Genentech’s executive committee in August 2005 as senior vice president, Commercial and was promoted to executive vice president, Commercial in December 2005. Clark first came to Genentech in January 2003 as senior vice president and general manager, BioOncol-ogy. Prior to joining Genentech, Clark served as president of Novartis Canada. Before assuming his post in Canada, Clark served as chief operating officer for Novartis United Kingdom.
DAVID A. EbERSmAN
Executive Vice President and Chief Financial Officer
Mr. Ebersman assumed the chief financial officer position in March 2005. He was promoted to executive vice president in December 2005. Ebersman joined Genen-tech in 1994 as a business development analyst. During the next several years, he was promoted to positions of increasing responsibility in Business Development, Product Development and Product Operations. Ebersman served as senior vice president, Product Operations and most recently, as senior vice president, Finance.
STEPhEN G. JUELSGAARD, D.V.m., J.D.
Executive Vice President, Secre-tary and Chief Compliance Officer
Mr. Juelsgaard was promoted to executive vice president in September 2002 and named chief compliance officer in 2005. He joined Genentech in 1985 as corporate counsel. In 1993 he became vice president, Corporate Law, and in 1994 he was named vice president and general counsel. He was named secretary in 1997 and senior vice president in 1998.
RIChARD h. SChELLER, Ph.D.
Executive Vice President, Research
Dr. Scheller was promoted to executive vice president, Research in September 2003 after joining Genentech in 2001 as senior vice president, Research. In addition to his work at Genentech, Scheller is an adjunct professor in the Department of Biochem-istry and Biophysics, School of Medicine, University of California, San Francisco. He is a member of the National Academy of Sciences and has published more than 200 papers in peer-reviewed scientific journals. Prior to joining Genentech, Scheller served as professor of Molecular and Cellular Physiology and of Biological Sciences at the Stanford University Medical Center and as an investigator with the Howard Hughes Medical Institute.
PATRICK Y. YANG, Ph.D.
Executive Vice President, Product Operations
Dr. Yang was promoted to executive vice president in December 2005. He joined Genentech in 2003 as vice president, South San Francisco Manufacturing and Engineer-ing and was named senior vice president, Product Operations in January 2005. He became a member of the Executive Commit-tee in July 2005. Prior to joining Genentech, Yang spent 11 years at Merck & Company in various leadership positions, including vice president, Supply Chain Management and vice president, Asia/Pacific Manufacturing Operations. Prior to Merck, Yang worked for General Electric for 12 years in engineering and manufacturing.

29
Directors, Officers and Distinguished Contributors
Arthur D. Levinson, Ph.D. Chairman and Chief Executive Officer, Genentech
Herbert W. Boyer, Ph.D. Co-founder of Genentech and Professor Emeritus of Biochemistry and Biophysics, University of California, San Francisco
William M. Burns Chief Executive Officer of the Pharmaceuticals Division and Member of the Corporate Executive Committee, The Roche Group
Erich Hunziker, Ph.D. Chief Financial Officer and Deputy Head of the Corporate Executive Committee, The Roche Group
Jonathan K. C. Knowles, Ph.D. Head of Group Research and Member of the Corporate Executive Committee, The Roche Group
Debra L. Reed President and Chief Executive Officer, San Diego Gas & Electric and Southern California Gas Company
Charles A. Sanders, M.D. Lead Director of Genentech and former Chairman and Chief Executive Officer, Glaxo, Inc.
bOARD OF DIRECTORS
Arthur D. Levinson, Ph.D.* Chairman and Chief Executive Officer
Susan D. Desmond-Hellmann, M.D., M.P.H.* President, Product Development
Ian T. Clark* Executive Vice President, Commercial
David A. Ebersman* Executive Vice President and Chief Financial Officer
Stephen G. Juelsgaard, D.V.M., J.D.* Executive Vice President, Secretary and Chief Compliance Officer
Richard H. Scheller, Ph.D.* Executive Vice President, Research
Patrick Y. Yang, Ph.D.* Executive Vice President, Product Operations
William N. Anderson Senior Vice President, Sales and Marketing, Immunology
Hal Barron, M.D. Senior Vice President, Development, and Chief Medical Officer
Andrew C. Chan, M.D., Ph.D. Senior Vice President, Immunology
Markus Gemuend Senior Vice President, Biochemical Manufacturing
Sean A. Johnston, J.D., Ph.D. Senior Vice President and General Counsel
Timothy L. Moore Senior Vice President, Global Supply Chain and Corporate Engineering
John Orwin Senior Vice President, Sales and Marketing, BioOncology
David Schenkein, M.D. Senior Vice President, Clinical Hematology/Oncology
Marc Tessier-Lavigne, Ph.D. Senior Vice President, Research Drug Discovery
Robert Andreatta Controller and Chief Accounting Officer
Vince Anicetti Vice President, Biochemical Quality
Philippe Bishop, M.D. Vice President, Clinical Development, Avastin
Glenn Brame Vice President, Global Supply Chain Quality
David F. Broad, Ph.D. Vice President, Biochemical Manufacturing, Oceanside
Charles Calderaro III Vice President and General Manager, Vacaville Product Operations
Peter A. Carberry, M.D. Vice President, Clinical Operations, Development Planning and Performance Analysis
Scott Carmer Vice President, Sales and Marketing, Rituxan Immunology
Christine Castro Vice President, Corporate Relations
Jennifer E. Cook Vice President, Product Portfolio Management
Frederic de Sauvage, Ph.D. Vice President, Research, Molecular Biology
Vishva Dixit, M.D. Vice President, Early Discovery Research
John Doyle Vice President, Finance and Corporate Planning
Khurem Farooq Vice President, Sales and Marketing, Xolair
Robert L. Garnick, Ph.D. Vice President, Ophthalmic Device Development
Odette Go Treasurer
Ashraf Hanna, M.D., Ph.D. Vice President, Alliance Management, Pipeline and Portfolio Planning
Gary Harbour, Ph.D. Vice President and General Manager, Oceanside Product Operations
Roy C. Hardiman, J.D. Vice President, Corporate Law, and Assistant Secretary
Susan Hershenson, Ph.D. Vice President, Pharmaceutical and Device Development
Kenneth J. Hillan, M.B., Ch.B. Vice President, Clinical Immunology, Tissue Growth and Repair
Chris Horan Vice President, Planning, Distribution and Logistics
Anthony P. Hurley Vice President, South San Francisco Production
Leonard Kanavy Vice President, Commercial Operations
Stephen Kelsey, M.D. Vice President, Clinical Hematology/ Oncology
Sara Kenkare-Mitra, Ph.D. Vice President, Development Sciences
Ann L. Lee, Ph.D. Vice President, Process Research and Development
Kent E. Lieginger, Pharm.D. Vice President, Managed Care and Customer Operations
Thomas G. Lyon Vice President, Business Services
Joseph S. McCracken, D.V.M. Vice President, Business Development
Ira Mellman, Ph.D. Vice President, Research, Oncology
James P. Miller Vice President and General Manager, Singapore Product Operations
Michael P. Miller Vice President, Sales and Marketing, HER Family1
Walter K. Moore Vice President, Government Affairs
Genesio Murano, Ph.D. Vice President, Regulatory Policy and Strategy
Varun Nanda Vice President, Sales and Marketing, Avastin
Philippa Norman Vice President, Manufacturing Collaborations
Quinton C. Oswald Vice President, Sales and Marketing, Tissue Growth and Repair
Todd Pierce Vice President, Corporate Information Technology
John R. Pinion Vice President, Quality and Compliance
Jon Reed Vice President, Corporate Engineering
Todd W. Rich, M.D. Vice President, Development Regulatory, Medical Information, Drug Safety and Quality Assurance
Corsee D. Sanders, Ph.D. Vice President, Design, Analysis, Technology and Administration (DATA) for Development Organization
Mary B. Sliwkowski, Ph.D. Vice President, Regulatory Chemistry Manufacturing and Controls and Information Systems
Denise Smith-Hams Vice President, Human Resources
John Snisarenko Vice President, Sales and Marketing, Lucentis
Michael D. Varney, Ph.D. Vice President, Small Molecule Drug Discovery
John M. Whiting Vice President, Finance, Treasury and Procurement
* Member of Executive Committee1 The HER Family includes the oncology products Herceptin and Tarceva
OFFICERS
GENENTECh FELLOw
Napoleone Ferrara, M.D. Research
SENIOR STAFF SCIENTISTS
Avi J. Ashkenazi, Ph.D. Research
Gwendolyn Fyfe, M.D. Development
STAFF SCIENTISTS
Thomas A. Bewley, Ph.D. Process Development
Stuart Bunting, Ph.D. Research
Frederic de Sauvage, Ph.D. Research
Vishva Dixit, M.D. Research
David Giltinan, Ph.D. Development
Paul Godowski, Ph.D. Research
Peter Jackson, Ph.D. Research
Paul Polakis, Ph.D. Research
Steve Shire, Ph.D. Process Development
Mark Sliwkowski, Ph.D. Research
Hergen Spits, Ph.D. Research
Richard Vandlen, Ph.D. Research
DISTINGUIShED ENGINEERS
Chung Hsu, Ph.D., P.E. Process Development
Brad Snedecor Process Development
Robert van Reis Process Development
Bradley Wolk Process Development
DISTINGUIShED PROGRAmmER ANALYST
Colin Watanabe Corporate Information Technology
As of February 25, 2008

30
Stockholder Information
hEADqUARTERS INVESTOR RELATIONS
Genentech1 DNA WaySouth San Francisco, CA 94080-4990(650) 225-1000www.gene.com
Genentech invites stockholders, security analysts, representatives of portfolio management firms and other interested parties to contact:
Katherine A. Littrell, Ph.D., R.N.Senior Director, Investor RelationsPhone: (650) 225-1034Fax: (650) [email protected]
STOCK LISTING AVAILAbLE INFORmATION
Genentech is listed on the New York Stock Exchange under the symbol DNA.
You may obtain a free copy of our annual reports on Form 10-K, quarterly reports on Form 10-Q and current reports on Form 8-K and amendments to those reports on the day of filing with the Securities and Exchange Commission on our website at www.gene.com, by calling the Genentech Investor Relations Department at (650) 225-4150, or by sending an email message to [email protected]. You may also direct requests for literature to our literature request line at (800) 488-6519.
TRANSFER AGENT INDEPENDENT REGISTERED PUbLIC ACCOUNTING FIRm
Communications concerning transfer requirements, lost certificates and change of address should be directed to Genentech’s stock transfer agent:
Computershare Trust Company, N.A.P.O. Box 43078Providence, RI 02940-3078 USAAttention: Shareholder Inquiries(800) 733-5001www.computershare.com/investor
Ernst & Young LLPPalo Alto, California
ANNUAL mEETING OThER INFORmATION
The annual meeting of stockholders will be held at 10:00 a.m. Pacific Time on April 15, 2008, at the Four Seasons Hotel, 2050 University Avenue, East Palo Alto, California. Detailed information about the meeting is contained in the Notice of Annual Meeting and Proxy Statement sent to each stockholder of record as of February 19, 2008.
Visit us on the web: www.gene.com.
Genentech has included as Exhibits 31.1 and 31.2 to its 2007 Annual Report on Form 10-K filed with the Securities and Exchange Commission certifications of the chief executive officer and chief financial officer of Genentech pursuant to Section 302 of the Sarbanes-Oxley Act of 2002, and Genentech filed with the New York Stock Exchange the Annual CEO Certification as required by Section 303A.12(a) of the New York Stock Exchange Listed Company Manual.
30


1 DNA WaySouth San Francisco, California94080-4990(650) 225-1000www.gene.com