in collaboration with the national league of cities
TRANSCRIPT
July 2002 • The Brookings Institution • Survey Series • Census 2000 1
Center on Urban & Metropolitan Policy
In Collaboration with The National League of Cities
“This survey
examines
demographic
trends in two
types of
medium-sized
cities and
reveals that
they are
experiencing
significant
change...”
■ Overall, medium-sized cities grewfaster in population than the largestcities during the 1990s. However,growth among the 100 medium-sizedcities analyzed was highly uneven.Twenty-eight medium-sized citiesgrew by more than 20 percent, while25 cities lost population or did notgrow at all.
■ The growth patterns of medium-sized cities reflect significantregional disparities. The fastest-growing medium-sized cities werefound largely in the South and West.The majority of cities with decliningor stagnating populations werelocated in the Northeast and indus-trial Midwest.
■ Medium-sized satellite cities grewfaster than their metro areas, whilemost medium-sized central citiesgrew much more slowly than theirmetro areas. The sharp disparitybetween central city and metro areagrowth in the Northeast, Midwest,and South underscores the significantdecentralization in these regions.
■ The growth of medium-sized citiesdepended largely on an influx ofnew Asian and Hispanic residents.Medium-sized cities, like the largestcities, lost non-Hispanic white resi-dents during the 1990s, resulting in asubstantial shift in their racial andethnic composition.
Findings
An analysis of Census 2000 population data for 100 medium-sized cities finds that:
Demographic Change in Medium-Sized Cities:Evidence from the 2000 CensusJennifer S. Vey and Benjamin Forman, Brookings Institution Center on Urban and Metropolitan Policy
I. Introduction
The 1990s brought dramatic changeto the metropolitan landscape. For anumber of central cities in theUnited States, the strong economy,
coupled with high levels of immigration,brought a resurgence in population and
stable fiscal conditions. Other cities,however, were unable to stem the flow of jobsand residents to the suburbs. Research by theBrookings Institution on the 100 largest citiesrevealed significant increases in the numberof Hispanics living in center cities, aconcomitant loss of white residents, and adominant pattern of decentralization.1
July 2002 • The Brookings Institution • Survey Series • Census 2000 2
A more complete understanding ofurban growth dynamics during thepast decade requires a look beyond thenation’s most populous cities.Medium-sized cities that serve as‘satellites’ to larger central cities—such as Scottsdale, AZ and Sunnyvale,CA—are home to an increasing frac-tion of the country’s metropolitanpopulation, particularly in the West.More traditional medium-sized centralcities have retained their significancein most regional economies, and manyhave become important immigrantmagnets. This survey examines demo-graphic trends in these two types ofmedium-sized cities and reveals thatthey are experiencing significantchange: Some cities are losing popula-tion, while others are coping withextreme growth; nearly all are moreracially and ethnically diverse than adecade ago. The competitiveness ofmedium-sized cities hinges on howwell they are able to confront the chal-lenges, and exploit the opportunities,these changes present.
II. Definitions and Methodology
This survey uses data from the2000 Census Summary File 1to describe 1990 to 2000population trends for
medium-sized cities in the UnitedStates. The analysis follows otherstudies by the Brookings Institution ofthe 100 largest American cities. Herewe define ‘medium-sized’ cities asthose ranked 101 through 200, basedon their population in 1990. As in theother analyses, the cities are measuredby their 1990 populations (as opposedto their 2000 populations) to avoidbiasing the analysis towards fast-growing cities. The populations ofthese medium-sized cities ranged from98,000 (Columbia, SC) to 170,000(Worcester, MA) in 1990. Their totalpopulation in 2000 was 13.8 million.
ClassificationsThe medium-sized cities in thisanalysis are categorized by region(Northeast, Midwest, South, andWest) using classifications determinedby the U.S. Census Bureau. The distri-bution of the cities studied here doesnot precisely match the distribution ofthe population at large. This isbecause these places are significantlyover-represented in the West, whichcontained 21 percent of the total U.S.population in 1990, but 38 percent ofmedium-sized cities. California, inparticular, has a large number ofmedium-sized cities; the state is hometo 28, half of which are located in justthree metro areas (Los Angeles, River-side-San Bernadino, and OrangeCounty). The Northeast, in contrast,has just 15 medium-sized cities.
Not all of the cities included in ourgroup conform with traditional notionsof what constitutes a “city.” “Boom-burbs”2—places like Santa Clarita, CAand Overland Park, KS—emerged ascities in the late 20th century and arenow the size of older core cities likeAnn Arbor, MI and Providence, RI.Typically satellites of larger centralcities, these rapidly growing cities aremore prevalent in the West, due inpart to the pervasiveness of master-planned community development, andthe benefits of forming large govern-mental structures around waterdistricts.3 To disaggregate the experi-ence of such satellite cities fromtraditional central cities we have clas-sified our group as follows:
Central CitiesThese are the largest cities in theirmetropolitan area. Fifty-four of themedium-sized cities studied fall intothis category. All but one of the North-eastern cities are central cities. A largeproportion of cities in the Midwestand South are also included in thiscategory: 14 of 20 and 15 of 27,respectively.
Satellite CitiesThe forty-six satellite cities are not thelargest cities in the metropolitan areasof which they are a part. While satel-lite cities are particularly prevalent inthe West, satellites exist in everyregion (although the Northeast onlyhas one: Elizabeth, NJ).4
III. Findings
A. Overall, medium-sized cities grewfaster in population than the largestcities during the 1990s.Population growth over the last decadebrought hopeful evidence of urbanrecovery. As a group, the 100 medium-sized cities grew 12.9 percent between1990 and 2000, outpacing the growthof the 100 largest cities by 4percentage points.
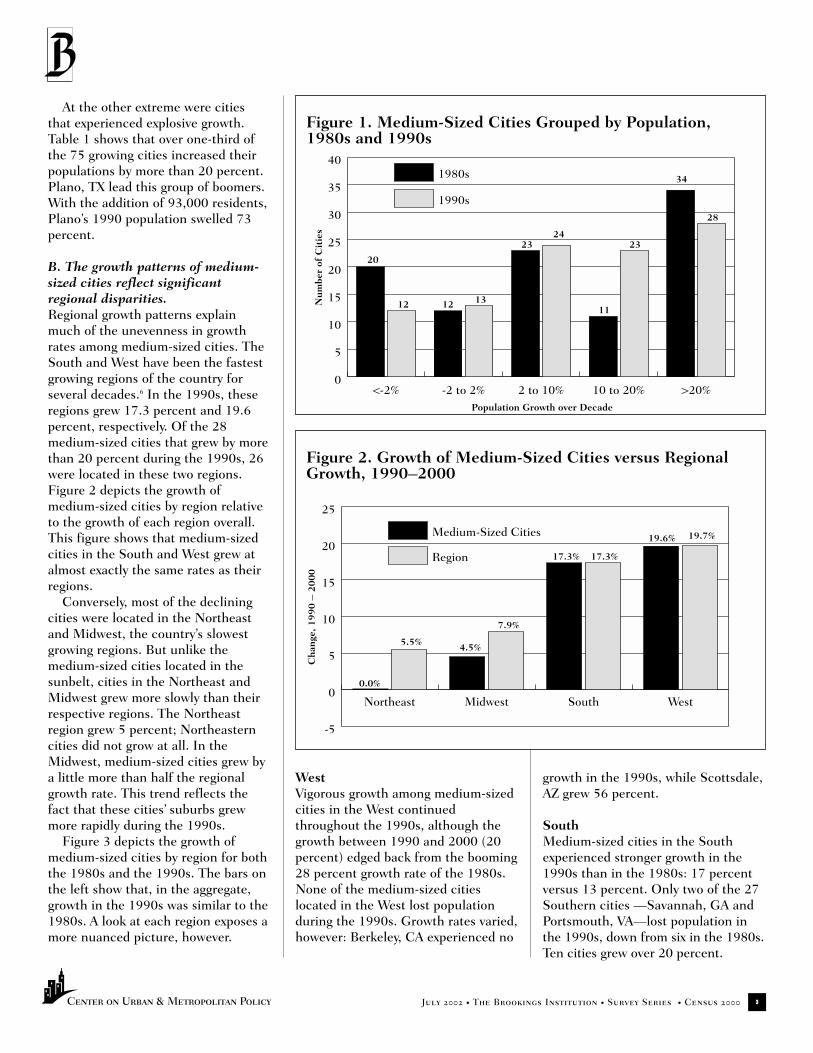
Only 12 medium-sized cities lostpopulation during the decade, downfrom 20 in the 1980s (Figure 1). Sixcities—South Bend, IN; Knoxville,TN; Chattanooga, TN; Fort Laud-erdale, FL; Columbia, SC; andPueblo, CO—experienced a true “turnaround,” meaning they went fromlosing population in the 1980s, togaining population in the 1990s(Appendix A). An additional fourcities—Cedar Rapids, IA; Hollywood,FL; Pasadena, TX; and Salt Lake City,UT—experienced flat growth in the1980s, but grew by more than 10percent during the last decade.Twenty-three cities experienced stronggrowth (10 to 20 percent) in the1990s, up from 11 in the 1980s.
Population growth was highlyuneven, however. One-quarter of themedium-sized cities analyzed eitherlost population or did not grow at allduring the 1990s. For a number ofolder industrial cities like Flint, MIand Syracuse, NY, the 1990s wasanother decade of serious populationloss.5 Several New England cities thatgrew in the 1980s—Springfield, MA;and Hartford, New Haven, and Water-bury, CT—lost population in the1990s (Appendix A).
At the other extreme were citiesthat experienced explosive growth.Table 1 shows that over one-third ofthe 75 growing cities increased theirpopulations by more than 20 percent.Plano, TX lead this group of boomers.With the addition of 93,000 residents,Plano’s 1990 population swelled 73percent.
B. The growth patterns of medium-sized cities reflect significantregional disparities.Regional growth patterns explainmuch of the unevenness in growthrates among medium-sized cities. TheSouth and West have been the fastestgrowing regions of the country forseveral decades.6 In the 1990s, theseregions grew 17.3 percent and 19.6percent, respectively. Of the 28medium-sized cities that grew by morethan 20 percent during the 1990s, 26were located in these two regions.Figure 2 depicts the growth ofmedium-sized cities by region relativeto the growth of each region overall.This figure shows that medium-sizedcities in the South and West grew atalmost exactly the same rates as theirregions.
Conversely, most of the decliningcities were located in the Northeastand Midwest, the country’s slowestgrowing regions. But unlike themedium-sized cities located in thesunbelt, cities in the Northeast andMidwest grew more slowly than theirrespective regions. The Northeastregion grew 5 percent; Northeasterncities did not grow at all. In theMidwest, medium-sized cities grew bya little more than half the regionalgrowth rate. This trend reflects thefact that these cities’ suburbs grewmore rapidly during the 1990s.
Figure 3 depicts the growth ofmedium-sized cities by region for boththe 1980s and the 1990s. The bars onthe left show that, in the aggregate,growth in the 1990s was similar to the1980s. A look at each region exposes amore nuanced picture, however.
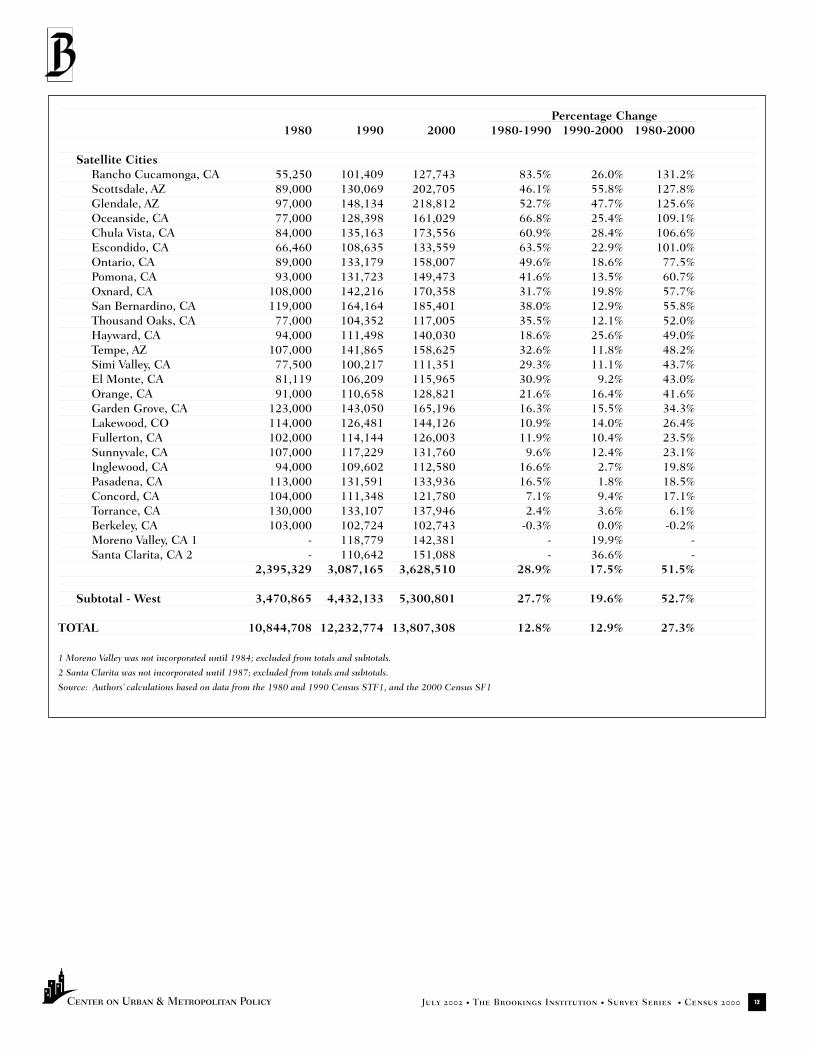
WestVigorous growth among medium-sizedcities in the West continuedthroughout the 1990s, although thegrowth between 1990 and 2000 (20percent) edged back from the booming28 percent growth rate of the 1980s.None of the medium-sized citieslocated in the West lost populationduring the 1990s. Growth rates varied,however: Berkeley, CA experienced no
growth in the 1990s, while Scottsdale,AZ grew 56 percent.
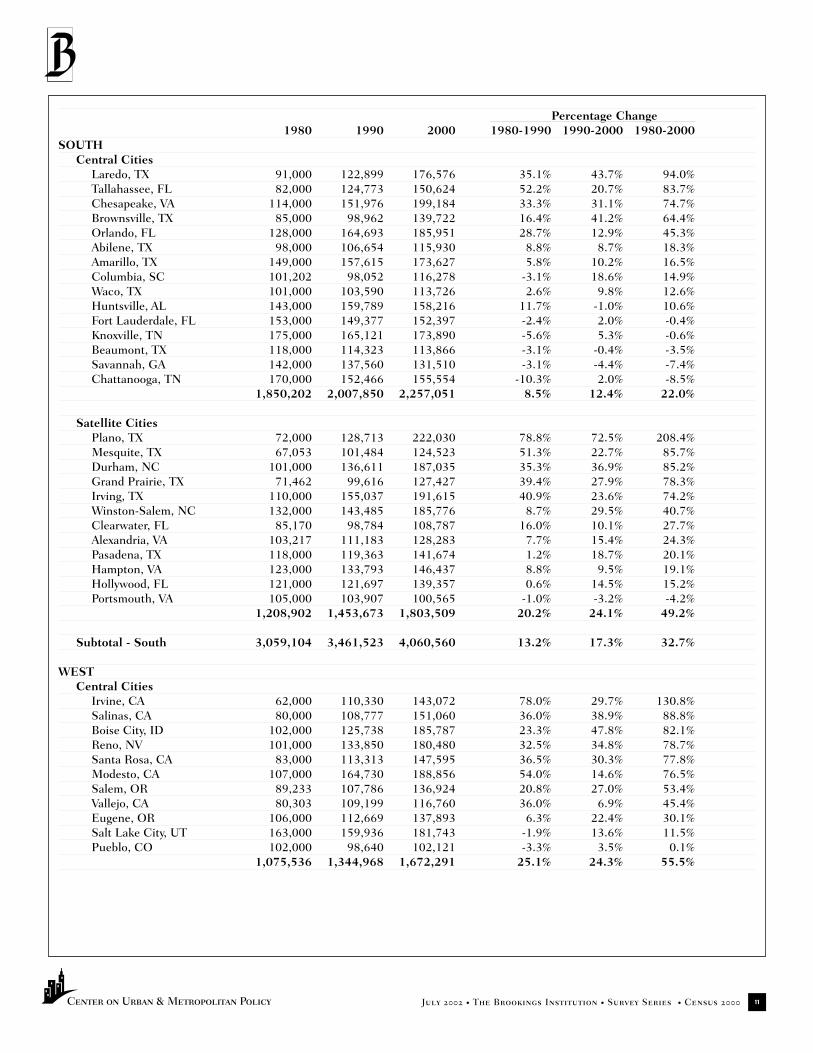
SouthMedium-sized cities in the Southexperienced stronger growth in the1990s than in the 1980s: 17 percentversus 13 percent. Only two of the 27Southern cities —Savannah, GA andPortsmouth, VA—lost population inthe 1990s, down from six in the 1980s.Ten cities grew over 20 percent.
July 2002 • The Brookings Institution • Survey Series • Census 2000 3
0
5
10
15
20
25
30
35
40
1990s
1980s
>20%10 to 20%2 to 10%-2 to 2%<-2%Population Growth over Decade
Nu
mbe
r of
Cit
ies
20
12 12 13
2324
11
23
34
28
-5
0
5
10
15
20
25
Region
Medium-Sized Cities
WestSouthMidwestNortheast
Ch
ange
, 19
90
– 2
00
0
0.0%
5.5% 4.5%
7.9%
17.3% 17.3%
19.6% 19.7%
Figure 1. Medium-Sized Cities Grouped by Population, 1980s and 1990s
Figure 2. Growth of Medium-Sized Cities versus RegionalGrowth, 1990–2000
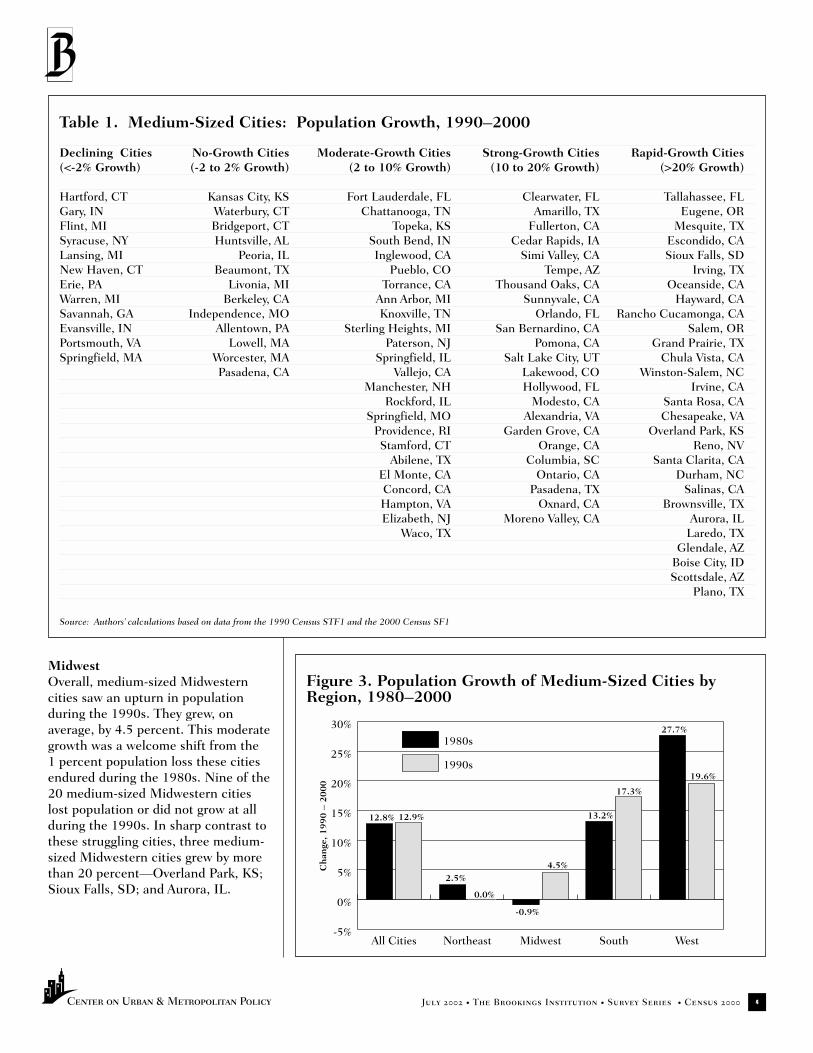
MidwestOverall, medium-sized Midwesterncities saw an upturn in populationduring the 1990s. They grew, onaverage, by 4.5 percent. This moderategrowth was a welcome shift from the 1 percent population loss these citiesendured during the 1980s. Nine of the20 medium-sized Midwestern citieslost population or did not grow at allduring the 1990s. In sharp contrast tothese struggling cities, three medium-sized Midwestern cities grew by morethan 20 percent—Overland Park, KS;Sioux Falls, SD; and Aurora, IL.
July 2002 • The Brookings Institution • Survey Series • Census 2000 4
Table 1. Medium-Sized Cities: Population Growth, 1990–2000
Declining Cities No-Growth Cities Moderate-Growth Cities Strong-Growth Cities Rapid-Growth Cities(<-2% Growth) (-2 to 2% Growth) (2 to 10% Growth) (10 to 20% Growth) (>20% Growth)
Hartford, CT Kansas City, KS Fort Lauderdale, FL Clearwater, FL Tallahassee, FLGary, IN Waterbury, CT Chattanooga, TN Amarillo, TX Eugene, ORFlint, MI Bridgeport, CT Topeka, KS Fullerton, CA Mesquite, TXSyracuse, NY Huntsville, AL South Bend, IN Cedar Rapids, IA Escondido, CALansing, MI Peoria, IL Inglewood, CA Simi Valley, CA Sioux Falls, SDNew Haven, CT Beaumont, TX Pueblo, CO Tempe, AZ Irving, TXErie, PA Livonia, MI Torrance, CA Thousand Oaks, CA Oceanside, CAWarren, MI Berkeley, CA Ann Arbor, MI Sunnyvale, CA Hayward, CASavannah, GA Independence, MO Knoxville, TN Orlando, FL Rancho Cucamonga, CAEvansville, IN Allentown, PA Sterling Heights, MI San Bernardino, CA Salem, ORPortsmouth, VA Lowell, MA Paterson, NJ Pomona, CA Grand Prairie, TXSpringfield, MA Worcester, MA Springfield, IL Salt Lake City, UT Chula Vista, CA
Pasadena, CA Vallejo, CA Lakewood, CO Winston-Salem, NCManchester, NH Hollywood, FL Irvine, CA
Rockford, IL Modesto, CA Santa Rosa, CASpringfield, MO Alexandria, VA Chesapeake, VA
Providence, RI Garden Grove, CA Overland Park, KSStamford, CT Orange, CA Reno, NV
Abilene, TX Columbia, SC Santa Clarita, CAEl Monte, CA Ontario, CA Durham, NCConcord, CA Pasadena, TX Salinas, CAHampton, VA Oxnard, CA Brownsville, TXElizabeth, NJ Moreno Valley, CA Aurora, IL
Waco, TX Laredo, TXGlendale, AZ
Boise City, IDScottsdale, AZ
Plano, TX
Source: Authors’ calculations based on data from the 1990 Census STF1 and the 2000 Census SF1
-5%
0%
5%
10%
15%
20%
25%
30%
1990s
1980s
WestSouthMidwestNortheastAll Cities
Ch
ange
, 19
90
– 2
00
0
12.8% 12.9%
2.5%
0.0%
-0.9%
4.5%
13.2%
17.3%
27.7%
19.6%
Figure 3. Population Growth of Medium-Sized Cities byRegion, 1980–2000

NortheastSigns of recovery remained elusive formuch of the Northeast. Cities in thisregion grew an average of 2.5 percentin the 1980s, but experienced nogrowth during the 1990s. Nearly halfof the 15 medium-sized cities in thisregion lost population. Only a fewmedium-sized cities in the Northeastwere able to benefit from robustregional economies. Among them wereStamford, CT, which grew by 8percent, and Elizabeth, NJ, whichgrew by 10 percent.
C. Medium-sized satellite cities grewfaster than their metro areas, whilemost medium-sized central citiesgrew much more slowly than theirmetro areas.On average, medium-sized centralcities grew by 9 percent during the1990s, while their metro areas grew bya faster 14 percent. Figure 4 showsthe relationship between the growth ofcentral cities and their metropolitanareas for each region. The growth gapwas apparent in the Northeast, wherethe population of medium-sizedcentral cities declined by 1 percent,while their metro areas grew by anaverage of more than 4 percent.Central cities in the Midwest grew by 1.5 percent, but they too wereoutpaced by their metro areas, whichgrew by 10 percent. Growth in theSouth was stronger overall, but herecentral cities added residents at halfthe rate of their metro areas (12.4percent versus 23.1 percent). Thispattern of decentralization is consis-tent with the growth patterns observedin the metropolitan areas of the 100largest cities. The 100 largest citiesgrew only half as fast as their suburbs.7
Western central cities were theexception. As a group, they actuallygrew at a faster rate than their metroareas. The most likely explanation isthat many of these cities are relativelyyoung, and have grown in size throughannexation. Irvine, CA, for example,had less than 65,000 residents when itwas incorporated in 1980; in the last
20 years, it has more than doubled itspopulation. Irvine also increased itsland area by almost 10 percent duringthe 1990s. In fact, Western centralcities in general added land aggres-sively to their boundaries. The medianWestern central city increased its land area by 4.2 percent; the medianWestern satellite city added only 0.5 percent.
In contrast, medium-sized satellitecities in every region of the countrygrew at faster rates than their metroareas (18.8 percent compared to 17.2percent overall). Satellites also grew atroughly double the rate of their prin-cipal cities (18.8 compared to 9.1percent). Figure 5 displays the rela-tionships between the growth ofsatellite cities and their metropolitan
July 2002 • The Brookings Institution • Survey Series • Census 2000 5
-5%
0%
5%
10%
15%
20%
25%
30%
MSAs
Central Cities
West (11)South (15)Midwest (14)Northeast (14)
Ch
ange
, 19
90
– 2
00
0
0.6%
4.3%
1.5%
9.8%
12.4%
23.1%24.3%
20.8%
0%
5%
10%
15%
20%
25%
30%
MSAs
Satellite Cities
West (27)South (12)Midwest (6)Northeast (1)
Ch
ange
, 19
90
– 2
00
0
9.6%
6.1%
11.8%
9.3%
24.1%
22.2%
17.5% 17.0%
Figure 4. Population Growth of Medium-Sized Central Citiesversus their MSAs, 1990–2000
Figure 5. Population Growth of Medium-Sized Satellite Citiesversus their MSAs, 1990–2000
areas for each of the regions. In theMidwest, satellite cities grew by anaverage of 11.8 percent while theirmetro areas grew 9.3 percent.Southern satellite cities grew by 24.1percent, outpacing their metro areas,which grew 22.2 percent. In the West,satellites grew 17.5 percent; theirmetro areas grew by a slightly slower17 percent. While we have notanalyzed migration trends in thesemetropolitan areas, these growthpatterns indicate that satellite citiesare absorbing population from theircore cities. New residents of thesemetro areas may also be choosing tolive in these satellite cities over otherparts of the region.
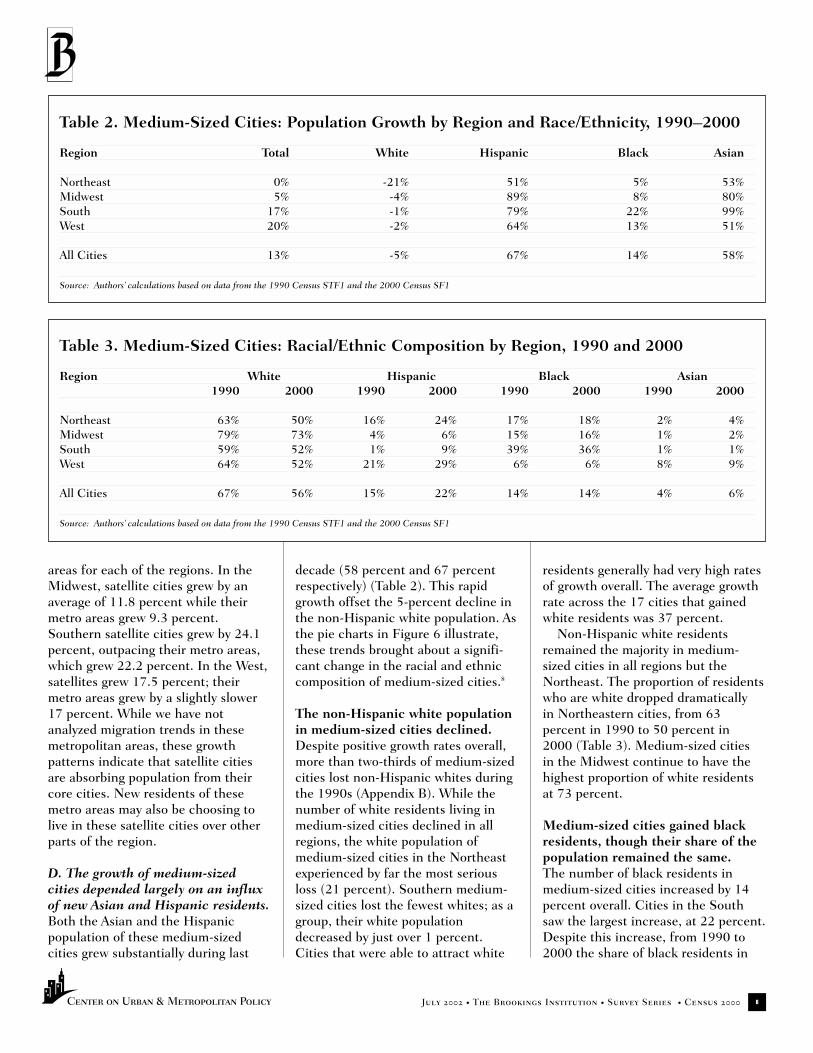
D. The growth of medium-sizedcities depended largely on an influxof new Asian and Hispanic residents.Both the Asian and the Hispanicpopulation of these medium-sizedcities grew substantially during last
decade (58 percent and 67 percentrespectively) (Table 2). This rapidgrowth offset the 5-percent decline inthe non-Hispanic white population. Asthe pie charts in Figure 6 illustrate,these trends brought about a signifi-cant change in the racial and ethniccomposition of medium-sized cities.8
The non-Hispanic white populationin medium-sized cities declined. Despite positive growth rates overall,more than two-thirds of medium-sizedcities lost non-Hispanic whites duringthe 1990s (Appendix B). While thenumber of white residents living inmedium-sized cities declined in allregions, the white population ofmedium-sized cities in the Northeastexperienced by far the most seriousloss (21 percent). Southern medium-sized cities lost the fewest whites; as agroup, their white populationdecreased by just over 1 percent.Cities that were able to attract white
residents generally had very high ratesof growth overall. The average growthrate across the 17 cities that gainedwhite residents was 37 percent.
Non-Hispanic white residentsremained the majority in medium-sized cities in all regions but theNortheast. The proportion of residentswho are white dropped dramatically in Northeastern cities, from 63percent in 1990 to 50 percent in 2000 (Table 3). Medium-sized cities in the Midwest continue to have thehighest proportion of white residentsat 73 percent.
Medium-sized cities gained blackresidents, though their share of thepopulation remained the same.The number of black residents inmedium-sized cities increased by 14percent overall. Cities in the Southsaw the largest increase, at 22 percent.Despite this increase, from 1990 to2000 the share of black residents in
July 2002 • The Brookings Institution • Survey Series • Census 2000 6
Table 3. Medium-Sized Cities: Racial/Ethnic Composition by Region, 1990 and 2000
Region White Hispanic Black Asian1990 2000 1990 2000 1990 2000 1990 2000
Northeast 63% 50% 16% 24% 17% 18% 2% 4%Midwest 79% 73% 4% 6% 15% 16% 1% 2%South 59% 52% 1% 9% 39% 36% 1% 1%West 64% 52% 21% 29% 6% 6% 8% 9%
All Cities 67% 56% 15% 22% 14% 14% 4% 6%
Source: Authors’ calculations based on data from the 1990 Census STF1 and the 2000 Census SF1
Table 2. Medium-Sized Cities: Population Growth by Region and Race/Ethnicity, 1990–2000
Region Total White Hispanic Black Asian
Northeast 0% -21% 51% 5% 53%Midwest 5% -4% 89% 8% 80%South 17% -1% 79% 22% 99%West 20% -2% 64% 13% 51%
All Cities 13% -5% 67% 14% 58%
Source: Authors’ calculations based on data from the 1990 Census STF1 and the 2000 Census SF1

medium-sized cities remained stagnantat 14 percent. Southern citiescontinue to be home to the largestshare (36 percent) of blacks.
The Hispanic population droveoverall population growth.Every medium-sized city but two—Gary, IN and Flint, MI—saw theirHispanic population increase. Onaverage, medium-sized cities experi-enced higher growth rates ofHispanics (67 percent) than the 100largest cities (43 percent ). Inmedium-sized cities, nearly 70 percentof the new net residents between 1990and 2000 were Hispanic.
A number of medium-sized citiesthat are not typically thought of asimmigrant destinations experiencedvery large increases in their Hispanicpopulation during the 1990s. In NorthCarolina, Winston-Salem and Durhamare notable for their remarkablegrowth from a very small base. InWinston-Salem, for example, the addi-tion of 15,000 Hispanic residentsduring the decade increased theirshare of the population to almost 9percent, up from 1 percent in 1990.Durham’s Hispanic population was
only 1,700 in 1990; by the end of thedecade, the city had more than 16,000Hispanic residents. Providence, RIand Allentown, PA were two Northerncities that saw significant growth intheir Hispanic populations. In 1990,Providence was less than 15 percentHispanic; by 2000, the share ofHispanic residents had more than
doubled. Allentown’s populationincreased by 1 percent during the1990s, but were it not for a 120percent increase in Hispanic popula-tion, the city would have actually lost12 percent of its residents over thedecade. Kansas City, KS and Salem,OR were also among the medium-sized cities that emerged as magnets
July 2002 • The Brookings Institution • Survey Series • Census 2000 7
Asian 4%
Black 14%
Hispanic 15%
White 67% White 56%
Asian 6%
Black 14%
Hispanic 22%
1990 2000
Source: Authors’ calculations based on data from the 1990 Census STF1 and the 2000 Census SF1
Figure 6. Racial and Ethnic Composition of Medium-Sized Cities, 1990 and 2000
0%
10%
20%
30%
40%
50%
60%
70%
80%
90%
100%
Medium-Sized CitiesLarge Cities
Asian 7%
Hispanic 23%
Black 24%
White 44%
Asian 6%Hispanic 22%
Black 14%
White 56%
Figure 7. Racial and Ethnic Composition of Large Citiesversus Medium-Sized Cities, 2000

for Latino residents, increasing theirHispanic populations from 10,000 to25,000 and from 6,000 to 20,000,respectively.
The proportion of residents that areHispanic increased in medium-sizedcities in all regions. Hispanic residentsnow make up, on average, approxi-mately one-quarter of all residents inNortheastern cities (up from 16percent in 1990) and nearly 30percent of residents in Western cities.
The Asian population increasedsignificantly.All but three medium-sized cities—Gary, IN; Flint, MI and Inglewood,CA—had gains in their Asian popula-tion. The Asian population in thesecities grew by 58 percent, outpacingthe 38 percent increase in the 100largest cities. Asians now make up 6 percent of medium-sized cities, upfrom 4 percent in 1990.
The two bars in Figure 7 contrastthe racial and ethnic composition ofmedium-sized cities to the top 100cities. Medium-sized cities havebecome nearly as diverse as the top100 cities in terms of the proportion ofresidents that are Hispanic and Asian.They are, however, less diverse overall.In comparison to the largest cities,non-Hispanic whites still comprise themajority (56 percent) of residents inmedium-sized cities. Medium-sizedcities are also home to proportionatelyfewer black residents than the top 100cities (14 percent versus 24 percentrespectively).
IV. Discussion of Trends
What drives the differencesin growth rates amongmedium-sized cities? Weanalyzed a number of
variables to see how the attributes of aparticular city actually influenced thegrowth of that city during the 1990s.
Demographic analysis of medium-sized cities shows that cities with alarge percentage of foreign-born resi-dents in 1990 tended to grow faster
during the decade than cities withmostly native-born residents. Citiesthat had a high proportion of residentswith bachelor’s degrees in 1990 alsogrew faster over the decade. As onemight expect, places with aging popu-lations generally grew more slowlyduring the 1990s.9
Growth patterns also appear toinfluence growth rates. Medium-sizedsatellite cities, for example, showed asignificant growth advantage during the1990s. They grew 18 percent overall,twice as fast medium-sized centralcities. There was some regional variationin this trend. Figure 8 illustrates thatsatellite cities in the West actually grewmore slowly than Western central cities.However, in both the Midwest and theSouth, satellites grew considerably fasterthan the medium-sized central cities.This trend may reflect the sprawlinggrowth patterns of these areas.10
Annexation of land also had a signif-icant impact on growth. All otherfactors being equal, a city thatannexed land in the 1990s was, notsurprisingly, considerably more likelyto gain population. In every regionexcept the Northeast, medium-sizedcities annexed a significant amount of
land during the 1990s; as a group, theland area encompassed by medium-sized cities increased by 11 percent.Central cities annexed more land rela-tive to satellite cities, 13 percentcompared to 8 percent. The medianincrease in land area was highest incities in the South (5 percent),followed by those in the Midwest (1.1percent) and the West (0.7 percent).11
V. Implications
The 2000 Census gives us abetter understanding of howsmaller cities in America faredduring the 1990s. The
evidence points to uneven patterns ofgrowth and decline, with some citieslosing residents, others postingmoderate growth, and a numberseeing rapid population increases.Medium-sized cities throughout thecountry experienced shifts in theirracial and ethnic compositions. Theindividual challenges these cities willface in the years ahead will dependlargely on these demographic trends.Among the challenges for medium-sized cities suggested by the trendspresented here are:
July 2002 • The Brookings Institution • Survey Series • Census 2000 8
0%
5%
10%
15%
20%
25%
30%
Satellite Cities
Central Cities
WestSouthMidwest
Ch
ange
, 19
90
– 2
00
0
1.5%
11.8% 12.4%
24.1% 24.3%
17.5%
Figure 8. Population Growth of Medium-Sized Central Citiesversus Satellite Cities by Region, 1990–2000

July 2002 • The Brookings Institution • Survey Series • Census 2000 9
■ Managing population loss. Citieslike Hartford, CT, which lost 54,000residents between 1950 and 2000,face an uphill battle againstcontinued disinvestment anddecline. The ability of these cities tostem the flow of businesses andresidents to the suburbs depends ontheir ability to create viable marketsin which a local economy canthrive. Abandoned housing andvacant lots —visible evidence ofpopulation loss and decreaseddensity—have become a persistentproblem in declining cities. Turningthese liabilities into opportunitiesfor growth and development—through land acquisition andassemblage—should be a highpriority for policymakers in Hartfordand other cities facing continuedpopulation loss.
■ Managing rapid growth. A largenumber of medium-sized cities inthe South and West must contendwith explosive growth. In Glendale,AZ, for instance, there are now16,000 more children under age 18than there were in 1990. Rapidgrowth presents immediate infra-structure demands—for schools,roads, utilities—that present phys-ical, as well as fiscal, challenges formunicipal governments. This willrequire urban leaders to look forequitable solutions that meet short-term needs without comprising thelong-term health of the city.
■ Responding to increasinglydiverse populations. The demo-graphic composition of manymedium-sized cities has changedmarkedly, with growing numbers ofHispanic and Asian residents andshrinking numbers of whites. Thiswill require cities to understand thehousehold structures of new popu-lations, many of which may beyounger and of larger size, anddevelop strategies that respond tochanging needs. City leaders mustwork to provide jobs, housing,schools, services, and amenities thatare appropriate and attractive tofamilies and individuals of varyingrace and ethnicity.
■ Promoting regional cooperation.Medium-sized cities in all areas of the country cannot operate inisolation from their metropolitanareas. For those cities in the North-east and Midwest that continue to lose population, for example, the ability to form coalitions witholder suburban areas to stimulatereinvestment and economic devel-opment is critical. And all cities—big and small—must work coopera-tively with one another to addresstraffic congestion, loss of openspace, and other issues associatedwith metropolitan growth andsuburban sprawl.

July 2002 • The Brookings Institution • Survey Series • Census 2000 10
Appendix A. Population Change for Medium Sized Cities, 1980–2000
Percentage Change1980 1990 2000 1980-1990 1990-2000 1980-2000
NORTHEASTCentral Cities
Manchester, NH 90,936 99,567 107,006 9.5% 7.5% 17.7%Stamford, CT 102,000 108,056 117,083 5.9% 8.4% 14.8%Lowell, MA 92,418 103,439 105,167 11.9% 1.7% 13.8%Providence, RI 157,000 160,728 173,618 2.4% 8.0% 10.6%Paterson, NJ 138,000 140,891 149,222 2.1% 5.9% 8.1%Worcester, MA 162,000 169,759 172,648 4.8% 1.7% 6.6%Waterbury, CT 103,000 108,961 107,271 5.8% -1.6% 4.1%Allentown, PA 104,000 105,090 106,632 1.0% 1.5% 2.5%Springfield, MA 152,000 156,983 152,082 3.3% -3.1% 0.1%New Haven, CT 126,000 130,474 123,626 3.6% -5.2% -1.9%Bridgeport, CT 143,000 141,686 139,529 -0.9% -1.5% -2.4%Hartford, CT 136,000 139,739 121,578 2.7% -13.0% -10.6%Erie, PA 119,000 108,718 103,717 -8.6% -4.6% -12.8%Syracuse, NY 170,000 163,860 147,306 -3.6% -10.1% -13.3%
1,795,354 1,837,951 1,826,485 2.4% -0.6% 1.7%
Satellite CitiesElizabeth, NJ 106,000 110,002 120,568 3.8% 9.6% 13.7%
Subtotal - Northeast 1,901,354 1,947,953 1,947,053 2.5% 0.0% 2.4%
MIDWESTCentral Cities
Sioux Falls, SD 86,332 100,814 123,975 16.8% 23.0% 43.6%Springfield, MO 133,000 140,494 151,580 5.6% 7.9% 14.0%Springfield, IL 100,033 105,227 111,454 5.2% 5.9% 11.4%Cedar Rapids, IA 110,000 108,751 120,758 -1.1% 11.0% 9.8%Rockford, IL 140,000 139,426 150,115 -0.4% 7.7% 7.2%Ann Arbor, MI 108,000 109,592 114,024 1.5% 4.0% 5.6%Topeka, KS 119,000 119,883 122,377 0.7% 2.1% 2.8%South Bend, IN 109,727 105,511 107,789 -3.8% 2.2% -1.8%Evansville, IN 130,000 126,272 121,582 -2.9% -3.7% -6.5%Lansing, MI 130,000 127,321 119,128 -2.1% -6.4% -8.4%Kansas City, KS 161,000 149,767 146,866 -7.0% -1.9% -8.8%Peoria, IL 124,000 113,504 112,936 -8.5% -0.5% -8.9%Flint, MI 160,000 140,761 124,943 -12.0% -11.2% -21.9%Gary, IN 152,000 116,646 102,746 -23.3% -11.9% -32.4%
1,763,092 1,703,969 1,730,273 -3.4% 1.5% -1.9%
Satellite CitiesOverland Park, KS 82,000 111,790 149,080 36.3% 33.4% 81.8%Aurora, IL 81,293 99,581 142,990 22.5% 43.6% 75.9%Sterling Heights, MI 109,000 117,810 124,471 8.1% 5.7% 14.2%Independence, MO 112,000 112,301 113,288 0.3% 0.9% 1.2%Livonia, MI 105,000 100,850 100,545 -4.0% -0.3% -4.2%Warren, MI 161,000 144,864 138,247 -10.0% -4.6% -14.1%
650,293 687,196 768,621 5.7% 11.8% 18.2%
Subtotal - Midwest 2,413,385 2,391,165 2,498,894 -0.9% 4.5% 3.5%
July 2002 • The Brookings Institution • Survey Series • Census 2000 1 1
Percentage Change1980 1990 2000 1980-1990 1990-2000 1980-2000
SOUTHCentral Cities
Laredo, TX 91,000 122,899 176,576 35.1% 43.7% 94.0%Tallahassee, FL 82,000 124,773 150,624 52.2% 20.7% 83.7%Chesapeake, VA 114,000 151,976 199,184 33.3% 31.1% 74.7%Brownsville, TX 85,000 98,962 139,722 16.4% 41.2% 64.4%Orlando, FL 128,000 164,693 185,951 28.7% 12.9% 45.3%Abilene, TX 98,000 106,654 115,930 8.8% 8.7% 18.3%Amarillo, TX 149,000 157,615 173,627 5.8% 10.2% 16.5%Columbia, SC 101,202 98,052 116,278 -3.1% 18.6% 14.9%Waco, TX 101,000 103,590 113,726 2.6% 9.8% 12.6%Huntsville, AL 143,000 159,789 158,216 11.7% -1.0% 10.6%Fort Lauderdale, FL 153,000 149,377 152,397 -2.4% 2.0% -0.4%Knoxville, TN 175,000 165,121 173,890 -5.6% 5.3% -0.6%Beaumont, TX 118,000 114,323 113,866 -3.1% -0.4% -3.5%Savannah, GA 142,000 137,560 131,510 -3.1% -4.4% -7.4%Chattanooga, TN 170,000 152,466 155,554 -10.3% 2.0% -8.5%
1,850,202 2,007,850 2,257,051 8.5% 12.4% 22.0%
Satellite CitiesPlano, TX 72,000 128,713 222,030 78.8% 72.5% 208.4%Mesquite, TX 67,053 101,484 124,523 51.3% 22.7% 85.7%Durham, NC 101,000 136,611 187,035 35.3% 36.9% 85.2%Grand Prairie, TX 71,462 99,616 127,427 39.4% 27.9% 78.3%Irving, TX 110,000 155,037 191,615 40.9% 23.6% 74.2%Winston-Salem, NC 132,000 143,485 185,776 8.7% 29.5% 40.7%Clearwater, FL 85,170 98,784 108,787 16.0% 10.1% 27.7%Alexandria, VA 103,217 111,183 128,283 7.7% 15.4% 24.3%Pasadena, TX 118,000 119,363 141,674 1.2% 18.7% 20.1%Hampton, VA 123,000 133,793 146,437 8.8% 9.5% 19.1%Hollywood, FL 121,000 121,697 139,357 0.6% 14.5% 15.2%Portsmouth, VA 105,000 103,907 100,565 -1.0% -3.2% -4.2%
1,208,902 1,453,673 1,803,509 20.2% 24.1% 49.2%
Subtotal - South 3,059,104 3,461,523 4,060,560 13.2% 17.3% 32.7%
WESTCentral Cities
Irvine, CA 62,000 110,330 143,072 78.0% 29.7% 130.8%Salinas, CA 80,000 108,777 151,060 36.0% 38.9% 88.8%Boise City, ID 102,000 125,738 185,787 23.3% 47.8% 82.1%Reno, NV 101,000 133,850 180,480 32.5% 34.8% 78.7%Santa Rosa, CA 83,000 113,313 147,595 36.5% 30.3% 77.8%Modesto, CA 107,000 164,730 188,856 54.0% 14.6% 76.5%Salem, OR 89,233 107,786 136,924 20.8% 27.0% 53.4%Vallejo, CA 80,303 109,199 116,760 36.0% 6.9% 45.4%Eugene, OR 106,000 112,669 137,893 6.3% 22.4% 30.1%Salt Lake City, UT 163,000 159,936 181,743 -1.9% 13.6% 11.5%Pueblo, CO 102,000 98,640 102,121 -3.3% 3.5% 0.1%
1,075,536 1,344,968 1,672,291 25.1% 24.3% 55.5%
July 2002 • The Brookings Institution • Survey Series • Census 2000 12
Percentage Change1980 1990 2000 1980-1990 1990-2000 1980-2000
Satellite CitiesRancho Cucamonga, CA 55,250 101,409 127,743 83.5% 26.0% 131.2%Scottsdale, AZ 89,000 130,069 202,705 46.1% 55.8% 127.8%Glendale, AZ 97,000 148,134 218,812 52.7% 47.7% 125.6%Oceanside, CA 77,000 128,398 161,029 66.8% 25.4% 109.1%Chula Vista, CA 84,000 135,163 173,556 60.9% 28.4% 106.6%Escondido, CA 66,460 108,635 133,559 63.5% 22.9% 101.0%Ontario, CA 89,000 133,179 158,007 49.6% 18.6% 77.5%Pomona, CA 93,000 131,723 149,473 41.6% 13.5% 60.7%Oxnard, CA 108,000 142,216 170,358 31.7% 19.8% 57.7%San Bernardino, CA 119,000 164,164 185,401 38.0% 12.9% 55.8%Thousand Oaks, CA 77,000 104,352 117,005 35.5% 12.1% 52.0%Hayward, CA 94,000 111,498 140,030 18.6% 25.6% 49.0%Tempe, AZ 107,000 141,865 158,625 32.6% 11.8% 48.2%Simi Valley, CA 77,500 100,217 111,351 29.3% 11.1% 43.7%El Monte, CA 81,119 106,209 115,965 30.9% 9.2% 43.0%Orange, CA 91,000 110,658 128,821 21.6% 16.4% 41.6%Garden Grove, CA 123,000 143,050 165,196 16.3% 15.5% 34.3%Lakewood, CO 114,000 126,481 144,126 10.9% 14.0% 26.4%Fullerton, CA 102,000 114,144 126,003 11.9% 10.4% 23.5%Sunnyvale, CA 107,000 117,229 131,760 9.6% 12.4% 23.1%Inglewood, CA 94,000 109,602 112,580 16.6% 2.7% 19.8%Pasadena, CA 113,000 131,591 133,936 16.5% 1.8% 18.5%Concord, CA 104,000 111,348 121,780 7.1% 9.4% 17.1%Torrance, CA 130,000 133,107 137,946 2.4% 3.6% 6.1%Berkeley, CA 103,000 102,724 102,743 -0.3% 0.0% -0.2%Moreno Valley, CA 1 - 118,779 142,381 - 19.9% -Santa Clarita, CA 2 - 110,642 151,088 - 36.6% -
2,395,329 3,087,165 3,628,510 28.9% 17.5% 51.5%
Subtotal - West 3,470,865 4,432,133 5,300,801 27.7% 19.6% 52.7%
TOTAL 10,844,708 12,232,774 13,807,308 12.8% 12.9% 27.3%
1 Moreno Valley was not incorporated until 1984; excluded from totals and subtotals.
2 Santa Clarita was not incorporated until 1987; excluded from totals and subtotals.
Source: Authors’ calculations based on data from the 1980 and 1990 Census STF1, and the 2000 Census SF1

App
endi
x B
. R
acia
l an
d E
thni
c C
ompo
siti
on o
f M
ediu
m S
ized
Cit
ies
by R
egio
n, 1
990
and
2000
Cit
y19
90 P
opul
atio
n20
00 P
opul
atio
nA
bsol
ute
Cha
nge
Per
cent
age
Cha
nge
Tota
lW
hite
His
pani
cB
lack
Asi
anTo
tal
Whi
teH
ispa
nic
Bla
ckA
sian
Tota
lW
hite
His
pani
cB
lack
Asi
anTo
tal
Whi
teH
ispa
nic
Bla
ckA
sian
Nor
thea
st
Alle
ntow
n, P
A10
5,09
086
,648
11,8
224,
882
1,51
410
6,63
268
,621
26,0
587,
284
2,42
41,
542
-18,
027
14,2
362,
402
910
1%-2
1%12
0%49
%60
%
Bri
dgep
ort,
CT
141,
686
65,7
1735
,840
36,4
382,
904
139,
529
43,1
5844
,478
40,9
744,
561
-2,1
57-2
2,55
98,
638
4,53
61,
657
-2%
-34%
24%
12%
57%
Eliz
abet
h, N
J11
0,00
244
,051
42,8
2619
,973
2,65
612
0,56
832
,338
59,6
2722
,329
2,76
310
,566
-11,
713
16,8
012,
356
107
10%
-27%
39%
12%
4%
Eri
e, P
A10
8,71
892
,501
2,34
713
,025
414
103,
717
81,6
054,
572
14,4
2079
3-5
,001
-10,
896
2,22
51,
395
379
-5%
-12%
95%
11%
92%
Har
tfor
d, C
T13
9,73
942
,867
43,3
7250
,695
1,90
712
1,57
821
,677
49,2
6043
,775
1,94
0-1
8,16
1-2
1,19
05,
888
-6,9
2033
-13%
-49%
14%
-14%
2%
Low
ell,
MA
103,
439
79,7
4710
,089
1,83
911
,419
105,
167
65,7
6014
,734
3,64
417
,314
1,72
8-1
3,98
74,
645
1,80
55,
895
2%-1
8%46
%98
%52
%
Man
ches
ter,
NH
99,5
6795
,105
2,14
284
11,
182
107,
006
95,5
814,
944
2,04
52,
501
7,43
947
62,
802
1,20
41,
319
7%1%
131%
143%
112%
New
Hav
en, C
T13
0,47
463
,890
16,3
5046
,257
3,18
212
3,62
643
,979
26,4
4344
,598
4,82
3-6
,848
-19,
911
10,0
93-1
,659
1,64
1-5
%-3
1%62
%-4
%52
%
Pate
rson
, NJ
140,
891
35,3
6857
,050
45,9
731,
804
149,
222
19,7
6574
,774
46,8
822,
784
8,33
1-1
5,60
317
,724
909
980
6%-4
4%31
%2%
54%
Pro
vide
nce,
RI
160,
728
104,
391
23,7
4420
,266
9,23
417
3,61
879
,451
52,1
4622
,103
10,3
8412
,890
-24,
940
28,4
021,
837
1,15
08%
-24%
120%
9%12
%
Spr
ingf
ield
, MA
156,
983
100,
305
25,6
4229
,011
1,28
015
2,08
274
,291
41,3
4329
,831
2,89
9-4
,901
-26,
014
15,7
0182
01,
619
-3%
-26%
61%
3%12
6%
Sta
mfo
rd, C
T10
8,05
676
,933
9,84
518
,804
2,21
211
7,08
371
,610
19,6
3517
,421
5,84
49,
027
-5,3
239,
790
-1,3
833,
632
8%-7
%99
%-7
%16
4%
Syr
acus
e, N
Y16
3,86
012
0,94
54,
177
32,6
393,
679
147,
306
91,9
287,
768
36,2
464,
983
-16,
554
-29,
017
3,59
13,
607
1,30
4-1
0%-2
4%86
%11
%35
%
Wat
erbu
ry, C
T10
8,96
180
,439
13,9
0213
,376
713
107,
271
62,4
0623
,354
16,3
351,
627
-1,6
90-1
8,03
39,
452
2,95
991
4-2
%-2
2%68
%22
%12
8%
Wor
cest
er, M
A16
9,75
914
1,87
015
,868
6,77
04,
323
172,
648
122,
211
26,1
5510
,762
8,38
42,
889
-19,
659
10,2
873,
992
4,06
12%
-14%
65%
59%
94%
1,94
7,95
31,
230,
777
315,
016
340,
789
48,4
231,
947,
053
974,
381
475,
291
358,
649
74,0
24-9
00-2
56,3
9616
0,27
517
,860
25,6
010%
-21%
51%
5%53
%
Mid
wes
t
Ann
Arb
or, M
I10
9,59
288
,618
2,62
99,
597
8,36
611
4,02
482
,975
3,81
49,
906
13,5
664,
432
-5,6
431,
185
309
5,20
04%
-6%
45%
3%62
%
Aur
ora,
IL
99,5
8164
,155
22,5
3411
,516
1,08
614
2,99
074
,457
46,5
5715
,389
4,34
143
,409
10,3
0224
,023
3,87
33,
255
44%
16%
107%
34%
300%
Ced
ar R
apid
s, I
A10
8,75
110
3,25
81,
032
3,07
71,
108
120,
758
109,
759
2,06
54,
425
2,19
812
,007
6,50
11,
033
1,34
81,
090
11%
6%10
0%44
%98
%
Eva
nsvi
lle, I
N12
6,27
211
2,59
855
211
,983
814
121,
582
104,
066
1,39
213
,209
913
-4,6
90-8
,532
840
1,22
699
-4%
-8%
152%
10%
12%
Flin
t, M
I14
0,76
168
,459
3,73
667
,022
773
124,
943
50,0
203,
742
66,2
3155
0-1
5,81
8-1
8,43
96
-791
-223
-11%
-27%
0%-1
%-2
9%
Gar
y, I
N11
6,64
616
,645
6,28
293
,386
138
102,
746
10,3
385,
065
85,7
0413
8-1
3,90
0-6
,307
-1,2
17-7
,682
0-1
2%-3
8%-1
9%-8
%0%
Inde
pend
ence
, MO
112,
301
107,
139
2,16
81,
514
743
113,
288
102,
040
4,17
52,
874
1,29
198
7-5
,099
2,00
71,
360
548
1%-5
%93
%90
%74
%
Kan
sas
Cit
y, K
S14
9,76
892
,914
10,3
3543
,698
1,53
114
6,86
671
,870
24,6
3943
,865
2,51
6-2
,902
-21,
044
14,3
0416
798
5-2
%-2
3%13
8%0%
64%
Lan
sing
, MI
127,
321
90,2
4510
,156
23,2
072,
079
119,
128
73,1
0511
,886
25,4
983,
361
-8,1
93-1
7,14
01,
730
2,29
11,
282
-6%
-19%
17%
10%
62%
Liv
onia
, MI
100,
850
97,9
491,
153
285
1,29
310
0,54
594
,651
1,73
194
51,
957
-305
-3,2
9857
866
066
40%
-3%
50%
232%
51%
Ove
rlan
d Pa
rk, K
S11
1,79
010
5,26
52,
320
1,71
22,
078
149,
080
131,
782
5,62
03,
729
5,73
837
,290
26,5
173,
300
2,01
73,
660
33%
25%
142%
118%
176%
Peor
ia, I
L11
3,50
485
,905
1,81
523
,782
1,71
311
2,93
677
,138
2,83
927
,783
2,63
4-5
68-8
,767
1,02
44,
001
921
-1%
-10%
56%
17%
54%
Roc
kfor
d, I
L13
9,42
611
0,66
85,
210
20,6
182,
376
150,
115
102,
678
15,2
7825
,822
3,30
110
,689
-7,9
9010
,068
5,20
492
58%
-7%
193%
25%
39%
Sio
ux F
alls
, SD
100,
814
97,2
2766
674
480
112
3,97
511
2,70
33,
087
2,19
81,
516
23,1
6115
,476
2,42
11,
454
715
23%
16%
364%
195%
89%
Sou
th B
end,
IN
105,
536
78,9
503,
455
21,9
7479
410
7,78
968
,202
9,11
026
,259
1,32
02,
253
-10,
748
5,65
54,
285
526
2%-1
4%16
4%20
%66
%
Spr
ingf
ield
, IL
105,
227
89,6
1879
813
,738
844
111,
454
89,5
101,
337
17,0
071,
642
6,22
7-1
0853
93,
269
798
6%0%
68%
24%
95%
Spr
ingf
ield
, MO
140,
494
133,
463
1,24
03,
326
1,25
415
1,58
013
7,14
03,
501
4,86
32,
157
11,0
863,
677
2,26
11,
537
903
8%3%
182%
46%
72%
Ste
rlin
g H
eigh
ts, M
I11
7,81
011
2,86
698
442
93,
093
124,
471
111,
743
1,66
51,
602
6,13
56,
661
-1,1
2368
11,
173
3,04
26%
-1%
69%
273%
98%
Tope
ka, K
S11
9,88
398
,528
6,53
912
,347
1,01
312
2,37
791
,869
10,8
4713
,941
1,34
32,
494
-6,6
594,
308
1,59
433
02%
-7%
66%
13%
33%
War
ren,
MI
144,
864
140,
236
1,02
993
31,
887
138,
247
124,
936
1,86
83,
676
4,26
8-6
,617
-15,
300
839
2,74
32,
381
-5%
-11%
82%
294%
126%
2,39
1,19
11,
894,
706
84,6
3336
4,88
833
,784
2,49
8,89
41,
820,
982
160,
218
394,
926
60,8
8510
7,70
3-7
3,72
475
,585
30,0
3827
,101
5%-4
%89
%8%
80%
July 2002 • The Brookings Institution • Survey Series • Census 2000 13

July 2002 • The Brookings Institution • Survey Series • Census 2000 14
Cit
y19
90 P
opul
atio
n20
00 P
opul
atio
nA
bsol
ute
Cha
nge
Per
cent
age
Cha
nge
Tota
lW
hite
His
pani
cB
lack
Asi
anTo
tal
Whi
teH
ispa
nic
Bla
ckA
sian
Tota
lW
hite
His
pani
cB
lack
Asi
anTo
tal
Whi
teH
ispa
nic
Bla
ckA
sian
Sou
th Abi
lene
, TX
106,
665
81,4
6216
,099
7,26
61,
338
115,
930
79,7
1222
,548
9,94
71,
555
9,26
5-1
,750
6,44
92,
681
217
9%-2
%40
%37
%16
%
Ale
xand
ria,
VA
111,
183
71,5
0810
,440
24,3
204,
607
128,
283
68,8
8918
,882
28,4
637,
299
17,1
00-2
,619
8,44
24,
143
2,69
215
%-4
%81
%17
%58
%
Am
arill
o, T
X15
7,61
512
1,69
322
,779
8,99
12,
741
173,
627
118,
821
37,9
4710
,067
3,52
616
,012
-2,8
7215
,168
1,07
678
510
%-2
%67
%12
%29
%
Bea
umon
t, T
X11
4,32
360
,281
5,07
546
,890
1,74
211
3,86
648
,595
9,02
851
,928
2,84
4-4
57-1
1,68
63,
953
5,03
81,
102
0%-1
9%78
%11
%63
%
Bro
wns
ville
, TX
98,9
629,
197
89,1
8673
286
139,
722
10,8
2612
7,53
527
671
940
,760
1,62
938
,349
203
433
41%
18%
43%
278%
151%
Cha
ttan
ooga
, TN
152,
488
98,3
7592
551
,254
1,34
515
5,55
491
,582
3,28
155
,874
2,46
73,
066
-6,7
932,
356
4,62
01,
122
2%-7
%25
5%9%
83%
Che
sape
ake,
VA
151,
976
106,
425
1,57
541
,566
1,79
419
9,18
413
1,20
04,
076
56,4
423,
730
47,2
0824
,775
2,50
114
,876
1,93
631
%23
%15
9%36
%10
8%
Cle
arw
ater
, FL
98,7
7386
,194
2,75
98,
524
975
108,
787
85,0
159,
754
10,3
611,
825
10,0
14-1
,179
6,99
51,
837
850
10%
-1%
254%
22%
87%
Col
umbi
a, S
C98
,052
52,0
492,
033
42,3
521,
336
116,
278
55,9
933,
520
53,0
522,
064
18,2
263,
944
1,48
710
,700
728
19%
8%73
%25
%54
%
Dur
ham
, NC
136,
594
69,5
641,
713
62,2
212,
676
187,
035
79,2
7716
,012
81,3
706,
840
50,4
419,
713
14,2
9919
,149
4,16
437
%14
%83
5%31
%15
6%
Fort
Lau
derd
ale,
FL
149,
377
96,2
0710
,574
41,0
251,
062
152,
397
87,5
7714
,406
43,4
411,
598
3,02
0-8
,630
3,83
22,
416
536
2%-9
%36
%6%
50%
Gra
nd P
rair
ie, T
X99
,613
66,3
6820
,249
9,66
32,
722
127,
427
60,1
1842
,038
16,9
485,
633
27,8
14-6
,250
21,7
897,
285
2,91
128
%-9
%10
8%75
%10
7%
Ham
pton
, VA
133,
793
76,9
462,
506
51,6
692,
258
146,
437
70,9
634,
153
64,7
952,
764
12,6
44-5
,983
1,64
713
,126
506
9%-8
%66
%25
%22
%
Hol
lyw
ood,
FL
121,
697
95,9
7114
,237
9,65
61,
573
139,
357
85,8
0831
,392
15,9
722,
799
17,6
60-1
0,16
317
,155
6,31
61,
226
15%
-11%
120%
65%
78%
Hun
tsvi
lle, A
L15
9,86
611
5,18
71,
988
38,7
363,
267
158,
216
100,
333
3,22
547
,453
3,57
8-1
,650
-14,
854
1,23
78,
717
311
-1%
-13%
62%
23%
10%
Irvi
ng, T
X15
5,03
711
0,68
124
,829
11,4
986,
902
191,
615
92,4
4559
,838
19,2
5415
,873
36,5
78-1
8,23
635
,009
7,75
68,
971
24%
-16%
141%
67%
130%
Kno
xvill
e, T
N16
5,12
113
6,18
498
625
,716
1,62
617
3,89
013
7,33
62,
751
28,0
152,
561
8,76
91,
152
1,76
52,
299
935
5%1%
179%
9%58
%
Lar
edo,
TX
122,
899
6,95
711
5,33
837
394
176,
576
8,89
116
6,21
627
678
853
,677
1,93
450
,878
239
394
44%
28%
44%
646%
100%
Mes
quit
e, T
X10
1,48
483
,535
8,76
45,
942
2,66
012
4,52
381
,388
19,5
0016
,422
4,69
623
,039
-2,1
4710
,736
10,4
802,
036
23%
-3%
123%
176%
77%
Orl
ando
, FL
164,
693
103,
740
14,1
2143
,718
2,41
218
5,95
194
,452
32,5
1048
,547
5,04
221
,258
-9,2
8818
,389
4,82
92,
630
13%
-9%
130%
11%
109%
Pasa
dena
, TX
119,
363
81,9
3034
,259
795
1,75
514
1,67
466
,923
68,3
482,
068
2,56
222
,311
-15,
007
34,0
891,
273
807
19%
-18%
100%
160%
46%
Pla
no, T
X12
8,67
911
0,33
37,
804
5,09
75,
062
222,
030
161,
543
22,3
5710
,989
22,6
0793
,351
51,2
1014
,553
5,89
217
,545
73%
46%
186%
116%
347%
Port
smou
th, V
A10
3,90
752
,591
1,42
748
,868
711
100,
565
45,4
031,
748
50,5
6982
2-3
,342
-7,1
8832
11,
701
111
-3%
-14%
22%
3%16
%
Sav
anna
h, G
A13
7,55
763
,815
1,73
770
,133
1,54
613
1,51
049
,903
2,93
874
,691
2,06
2-6
,047
-13,
912
1,20
14,
558
516
-4%
-22%
69%
6%33
%
Talla
hass
ee, F
L12
4,77
382
,549
3,87
835
,927
2,17
215
0,62
487
,047
6,30
951
,025
3,65
225
,851
4,49
82,
431
15,0
981,
480
21%
5%63
%42
%68
%
Wac
o, T
X10
3,59
061
,904
16,7
2223
,803
874
113,
726
58,0
9626
,885
25,4
771,
585
10,1
36-3
,808
10,1
631,
674
711
10%
-6%
61%
7%81
%
Win
ston
-Sal
em, N
C14
3,48
584
,642
1,02
656
,309
1,20
718
5,77
697
,420
16,0
4367
,648
2,12
642
,291
12,7
7815
,017
11,3
3991
929
%15
%14
64%
20%
76%
3,46
1,56
52,
186,
288
433,
029
772,
049
57,0
434,
060,
560
2,15
5,55
677
3,24
094
1,37
011
3,61
759
8,99
5-3
0,73
234
0,21
116
9,32
156
,574
17%
-1%
79%
22%
99%
Wes
t Ber
kele
y, C
A10
2,72
460
,395
7,98
918
,805
14,8
9610
2,74
356
,691
10,0
0113
,707
16,8
6119
-3,7
042,
012
-5,0
981,
965
0%-6
%25
%-2
7%13
%
Boi
se C
ity,
ID
125,
738
119,
275
3,38
570
31,
526
185,
787
167,
022
8,41
01,
363
4,09
360
,049
47,7
475,
025
660
2,56
748
%40
%14
8%94
%16
8%
Chu
la V
ista
, CA
135,
163
67,5
4449
,769
5,81
211
,103
173,
556
55,0
4286
,073
7,51
719
,293
38,3
93-1
2,50
236
,304
1,70
58,
190
28%
-19%
73%
29%
74%
Con
cord
, CA
111,
348
86,0
1112
,776
2,29
09,
221
121,
780
74,1
1926
,560
3,53
011
,815
10,4
32-1
1,89
213
,784
1,24
02,
594
9%-1
4%10
8%54
%28
%
El M
onte
, CA
106,
209
16,2
0276
,740
771
12,1
7511
5,96
58,
542
83,9
4564
021
,405
9,75
6-7
,660
7,20
5-1
319,
230
9%-4
7%9%
-17%
76%
Esc
ondi
do, C
A10
8,63
578
,038
24,9
841,
035
3,59
413
3,55
969
,305
51,6
932,
734
6,06
324
,924
-8,7
3326
,709
1,69
92,
469
23%
-11%
107%
164%
69%
Eug
ene,
OR
112,
669
103,
221
3,21
41,
350
3,84
613
7,89
311
8,56
36,
843
1,64
45,
156
25,2
2415
,342
3,62
929
41,
310
22%
15%
113%
22%
34%
Ful
lert
on, C
A11
4,14
473
,838
23,9
082,
070
13,6
3812
6,00
361
,420
38,0
142,
675
20,3
8111
,859
-12,
418
14,1
0660
56,
743
10%
-17%
59%
29%
49%
Gar
den
Gro
ve, C
A14
3,05
078
,398
32,5
492,
066
29,1
5216
5,19
653
,735
53,6
081,
873
51,7
9822
,146
-24,
663
21,0
59-1
9322
,646
15%
-31%
65%
-9%
78%
Gle
ndal
e, A
Z14
8,13
411
7,18
022
,162
4,25
23,
067
218,
812
141,
462
54,3
439,
818
6,09
070
,678
24,2
8232
,181
5,56
63,
023
48%
21%
145%
131%
99%
Hay
war
d, C
A11
1,49
857
,145
26,1
0310
,457
16,6
4614
0,03
040
,896
47,8
5014
,846
28,7
0028
,532
-16,
249
21,7
474,
389
12,0
5426
%-2
8%83
%42
%72
%
Ingl
ewoo
d, C
A10
9,60
29,
385
41,5
5355
,493
2,58
411
2,58
04,
628
51,8
2952
,260
1,56
22,
978
-4,7
5710
,276
-3,2
33-1
,022
3%-5
1%25
%-6
%-4
0%
Irvi
ne, C
A11
0,33
081
,567
6,81
81,
910
19,7
1114
3,07
281
,613
10,5
391,
977
42,6
8632
,742
463,
721
6722
,975
30%
0%55
%4%
117%
July 2002 • The Brookings Institution • Survey Series • Census 2000 15
Cit
y19
90 P
opul
atio
n20
00 P
opul
atio
nA
bsol
ute
Cha
nge
Per
cent
age
Cha
nge
Tota
lW
hite
His
pani
cB
lack
Asi
anTo
tal
Whi
teH
ispa
nic
Bla
ckA
sian
Tota
lW
hite
His
pani
cB
lack
Asi
anTo
tal
Whi
teH
ispa
nic
Bla
ckA
sian
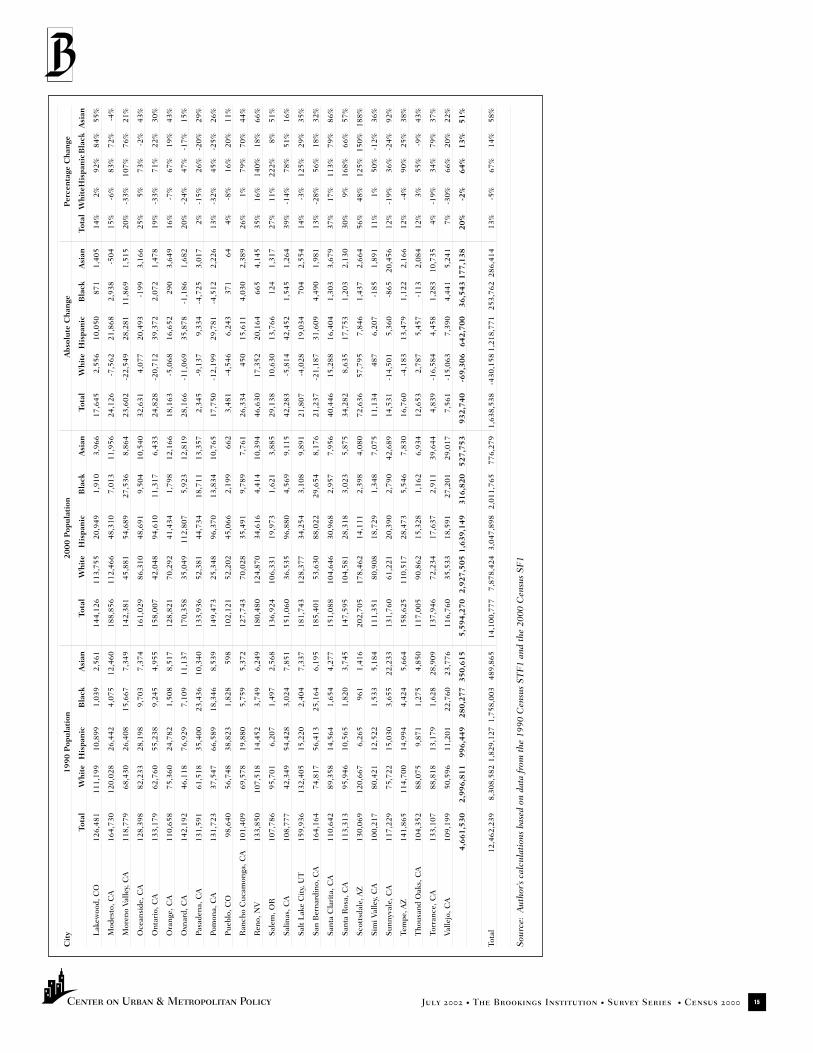
Lak
ewoo
d, C
O12
6,48
111
1,19
910
,899
1,03
92,
561
144,
126
113,
755
20,9
491,
910
3,96
617
,645
2,55
610
,050
871
1,40
514
%2%
92%
84%
55%
Mod
esto
, CA
164,
730
120,
028
26,4
424,
075
12,4
6018
8,85
611
2,46
648
,310
7,01
311
,956
24,1
26-7
,562
21,8
682,
938
-504
15%
-6%
83%
72%
-4%
Mor
eno
Valle
y, C
A11
8,77
968
,430
26,4
0815
,667
7,34
914
2,38
145
,881
54,6
8927
,536
8,86
423
,602
-22,
549
28,2
8111
,869
1,51
520
%-3
3%10
7%76
%21
%
Oce
ansi
de, C
A12
8,39
882
,233
28,1
989,
703
7,37
416
1,02
986
,310
48,6
919,
504
10,5
4032
,631
4,07
720
,493
-199
3,16
625
%5%
73%
-2%
43%
Ont
ario
, CA
133,
179
62,7
6055
,238
9,24
54,
955
158,
007
42,0
4894
,610
11,3
176,
433
24,8
28-2
0,71
239
,372
2,07
21,
478
19%
-33%
71%
22%
30%
Ora
nge,
CA
110,
658
75,3
6024
,782
1,50
88,
517
128,
821
70,2
9241
,434
1,79
812
,166
18,1
63-5
,068
16,6
5229
03,
649
16%
-7%
67%
19%
43%
Oxn
ard,
CA
142,
192
46,1
1876
,929
7,10
911
,137
170,
358
35,0
4911
2,80
75,
923
12,8
1928
,166
-11,
069
35,8
78-1
,186
1,68
220
%-2
4%47
%-1
7%15
%
Pasa
dena
, CA
131,
591
61,5
1835
,400
23,4
3610
,340
133,
936
52,3
8144
,734
18,7
1113
,357
2,34
5-9
,137
9,33
4-4
,725
3,01
72%
-15%
26%
-20%
29%
Pom
ona,
CA
131,
723
37,5
4766
,589
18,3
468,
539
149,
473
25,3
4896
,370
13,8
3410
,765
17,7
50-1
2,19
929
,781
-4,5
122,
226
13%
-32%
45%
-25%
26%
Pue
blo,
CO
98,6
4056
,748
38,8
231,
828
598
102,
121
52,2
0245
,066
2,19
966
23,
481
-4,5
466,
243
371
644%
-8%
16%
20%
11%
Ran
cho
Cuc
amon
ga, C
A10
1,40
969
,578
19,8
805,
759
5,37
212
7,74
370
,028
35,4
919,
789
7,76
126
,334
450
15,6
114,
030
2,38
926
%1%
79%
70%
44%
Ren
o, N
V13
3,85
010
7,51
814
,452
3,74
96,
249
180,
480
124,
870
34,6
164,
414
10,3
9446
,630
17,3
5220
,164
665
4,14
535
%16
%14
0%18
%66
%
Sal
em, O
R10
7,78
695
,701
6,20
71,
497
2,56
813
6,92
410
6,33
119
,973
1,62
13,
885
29,1
3810
,630
13,7
6612
41,
317
27%
11%
222%
8%51
%
Sal
inas
, CA
108,
777
42,3
4954
,428
3,02
47,
851
151,
060
36,5
3596
,880
4,56
99,
115
42,2
83-5
,814
42,4
521,
545
1,26
439
%-1
4%78
%51
%16
%
Sal
t L
ake
Cit
y, U
T15
9,93
613
2,40
515
,220
2,40
47,
337
181,
743
128,
377
34,2
543,
108
9,89
121
,807
-4,0
2819
,034
704
2,55
414
%-3
%12
5%29
%35
%
San
Ber
nard
ino,
CA
164,
164
74,8
1756
,413
25,1
646,
195
185,
401
53,6
3088
,022
29,6
548,
176
21,2
37-2
1,18
731
,609
4,49
01,
981
13%
-28%
56%
18%
32%
San
ta C
lari
ta, C
A11
0,64
289
,358
14,5
641,
654
4,27
715
1,08
810
4,64
630
,968
2,95
77,
956
40,4
4615
,288
16,4
041,
303
3,67
937
%17
%11
3%79
%86
%
San
ta R
osa,
CA
113,
313
95,9
4610
,565
1,82
03,
745
147,
595
104,
581
28,3
183,
023
5,87
534
,282
8,63
517
,753
1,20
32,
130
30%
9%16
8%66
%57
%
Sco
ttsd
ale,
AZ
130,
069
120,
667
6,26
596
11,
416
202,
705
178,
462
14,1
112,
398
4,08
072
,636
57,7
957,
846
1,43
72,
664
56%
48%
125%
150%
188%
Sim
i Val
ley,
CA
100,
217
80,4
2112
,522
1,53
35,
184
111,
351
80,9
0818
,729
1,34
87,
075
11,1
3448
76,
207
-185
1,89
111
%1%
50%
-12%
36%
Sun
nyva
le, C
A11
7,22
975
,722
15,0
303,
655
22,2
3313
1,76
061
,221
20,3
902,
790
42,6
8914
,531
-14,
501
5,36
0-8
6520
,456
12%
-19%
36%
-24%
92%
Tem
pe, A
Z14
1,86
511
4,70
014
,994
4,42
45,
664
158,
625
110,
517
28,4
735,
546
7,83
016
,760
-4,1
8313
,479
1,12
22,
166
12%
-4%
90%
25%
38%
Tho
usan
d O
aks,
CA
104,
352
88,0
759,
871
1,27
54,
850
117,
005
90,8
6215
,328
1,16
26,
934
12,6
532,
787
5,45
7-1
132,
084
12%
3%55
%-9
%43
%
Torr
ance
, CA
133,
107
88,8
1813
,179
1,62
828
,909
137,
946
72,2
3417
,637
2,91
139
,644
4,83
9-1
6,58
44,
458
1,28
310
,735
4%-1
9%34
%79
%37
%
Valle
jo, C
A10
9,19
950
,596
11,2
0122
,760
23,7
7611
6,76
035
,533
18,5
9127
,201
29,0
177,
561
-15,
063
7,39
04,
441
5,24
17%
-30%
66%
20%
22%
4,66
1,53
02,
996,
811
996,
449
280,
277
350,
615
5,59
4,27
02,
927,
505
1,63
9,14
931
6,82
052
7,75
393
2,74
0-6
9,30
664
2,70
036
,543
177,
138
20%
-2%
64%
13%
51%
Tota
l12
,462
,239
8,30
8,58
21,
829,
127
1,75
8,00
348
9,86
514
,100
,777
7,87
8,42
43,
047,
898
2,01
1,76
577
6,27
91,
638,
538
-430
,158
1,21
8,77
125
3,76
228
6,41
413
%-5
%67
%14
%58
%
Sou
rce:
Aut
hor’s
cal
cula
tion
s ba
sed
on d
ata
from
the
199
0 C
ensu
s S
TF
1 an
d th
e 20
00 C
ensu
s S
F1
July 2002 • The Brookings Institution • Survey Series • Census 2000 16
Endnotes:
1 Alan Berube, “Racial Change in the
Nation’s 100 Largest Cities: Evidence from
the 2000 Census.” Washington, D.C.: The
Brookings Institution, 2001. Available at
http://www.brookings.edu/dybdocroot/es/
urban/census/citygrowth.htm
Alan Berube, “Large City and Metropolitan
Change in the 1990s: Evidence from the
2000 Census.” Washington, D.C.: The
Brookings Institution, 2002 (forthcoming).
2 Used here, the word ‘boomburbs’ (coined
by Robert E. Lang and Patrick A.
Simmons) refers generally to large, rapidly
growing suburban cities that are not the
largest city in their metropolitan area. See
Robert E. Lang and Patrick A. Simmons,
“‘Boomburbs’: The Emergence of Large,
Fast-Growing Suburban Cities in the
United States.” Washington, D.C.: Fannie
Mae Foundation, 2001.
3 Lang and Simmons, 2001.
4 The average density of the 46 satellite
cities (3,285 persons per square mile) is
considerably higher than the average
density of the 54 central cities (2,261
persons per square mile). This results to a
large degree from the high densities of
satellite cities located in the Los Angeles
metropolitan area. Inglewood, CA, for
example, had a density of 12,317 persons
per square mile in 2000. This far exceeds
the densities of the older medium-sized
New England central cities in our study.
5 Flint has posted four consecutive decades
of population loss, having lost 37 percent
of its residents since its peak at 197,000 in
1960. After five consecutive decades of
negative growth, Syracuse has lost 28
percent of its residents. In 1950, it boasted
a population of 206,000.
6 Marc Perry and Paul Mackun, “Population
Change and Distribution,” U.S. Census
Bureau, April 2001. http://www.census.gov/
prod/2001pubs/c2kbr01-2.pdf
7 Berube, 2002.
8 Following conventional practice for
analyzing trends in U.S. population diver-
sity, this survey separates the populations
of the medium-sized cities into both racial
and ethnic categories. The Census Bureau
considers race and Hispanic origin to be
distinct concepts. All individuals who iden-
tified themselves as Spanish/Hispanic/
Latino are, for the purposes of this survey,
considered “Hispanic,” regardless of their
race. Other race categories discussed in
this survey—white, black, Asian/Native
Hawaiian/Pacific Islander, American
Indian, and some other race—include only
those individuals who did not identify
themselves as Hispanic. For the first time,
the 2000 Census gave respondents the
opportunity to classify themselves as being
of more than one race. This new option
potentially complicates efforts to compare
2000 Census population counts by
race/ethnicity to 1990 counts at a city
level. In this survey, the race categories
represent individuals who classified them-
selves as that race only; individuals who
classified themselves as being of more than
once race are grouped in a “multiracial”
category. Some unknown share of a given
city’s residents in 1990 could have reclassi-
fied themselves as multiracial in 2000; this
may introduce a degree of error into the
calculation of changes in the population of
that city’s other race/ethnicity groups. The
Census results, however, indicate that the
degree of error is likely small.
9 These findings were obtained using
multiple regression. Our basic model is as
follows: Growthi=6.70-1.41*Densityi+
0.45*ForeignBorni-0.73*Over65i+
0.59*Degreei+10.68*Annexi+7.09*
Satellitei.
GrowthI = 100*(Population in 2000 of city
i—Population in 1990 of city i)/(Population
in 1990 of city i). “Density” refers to the
population density of city i in 2000 divided
by 1,000; “Foreign Born” refers to the
percent of the population in city i that was
foreign-born in 1990; “Over65” refers to
the percent of the population of city i that
was over age 65 in 1990; “Degree” refers to
the percent of persons over age 25 in city i
with a bachelors degree or higher; “Annex”
is a variable that refers to whether city i
increased its land by more than 5 percent
over the decade by annexation; “Satellite”
is a variable that refers to whether city i is
a satellite city.
All of the coefficients in this formula were
statistically significant. The model was able
to explain 37.06 percent of the overall vari-
ation in growth rates in our sample of 100
medium-sized cities.
10 Robert Fulton, Rolf Pendall, Mai Ngueyn,
and Alicia Harrison, “Who Sprawls the
Most? How Growth Patterns Differ Across
the U.S.” Washington, D.C.: The Brook-
ings Institution, 2001. This is available at
http://www.brookings.edu/dybdocroot/es/ur
ban/fulton-pendall.htm. According to this
study, between 1982 and 1997, metropol-
itan areas in the Midwest grew by 7
percent; at the same time, urbanized land
area in the Midwest increased by more
than 32 percent. Similar growth patterns
were seen in the South, where metropol-
itan population grew by 22 percent and
urbanized land area increased by 60
percent.
11 Annexation was determined by comparing
land area values from 1990 Census geog-
raphy files to the land area values provided
in 2000 Census geography files.

July 2002 • The Brookings Institution • Survey Series • Census 2000 17
For More Information:
Brookings Center on Urban andMetropolitan PolicyPhone: 202-797-6139Website:www.brookings.edu/urban
Acknowledgements:
The Brookings Center on Urbanand Metropolitan Policy wouldlike to thank the John T. andCatherine D. MacArthur Foundation, the RockefellerFoundation, the Fannie MaeFoundation, and the SurdnaFoundation for their support of our work on city and metro-politan growth trends.