in copyright - non-commercial use permitted rights ...50023/... · diss. eth no. 23551 role of mdr3...
TRANSCRIPT

Research Collection
Doctoral Thesis
Role of MDR3 in drug-induced cholestatic liver injury
Author(s): Mahdi, Zainab
Publication Date: 2016
Permanent Link: https://doi.org/10.3929/ethz-a-010784145
Rights / License: In Copyright - Non-Commercial Use Permitted
This page was generated automatically upon download from the ETH Zurich Research Collection. For moreinformation please consult the Terms of use.
ETH Library
DISS. ETH NO. 23551
ROLE OF MDR3 IN DRUG-INDUCED CHOLESTATIC LIVER INJURY
A thesis submitted to attain the degree of
DOCTOR OF SCIENCES of ETH ZURICH
(Dr. sc. ETH Zurich)
presented by
ZAINAB MAHDI
MSc Pharmaceutical Sciences, ETH Zurich
born on 17.10.1984
citizen of Minusio, Ticino, Switzerland
accepted on the recommendation of
Prof. Dr. Kaspar Locher (examiner)
Prof. Dr. Bruno Stieger (co-examiner)
Prof. Dr. Sabine Werner (co-examiner)
2016


To my family


ABSTRACT .............................................................................................................................. 9
SOMMARIO ........................................................................................................................... 11
ACKNOWLEDGMENTS ..................................................................................................... 13
LIST OF ABBREVIATIONS ................................................................................................ 14
COPYRIGHT ......................................................................................................................... 16
1 INTRODUCTION ........................................................................................................ 17
1.1 The liver and its role in bile formation and drug disposition .......................................... 17
1.1.1 Overview ........................................................................................................................ 17
1.1.2 Structural organization ................................................................................................... 17
1.1.3 Bile formation ................................................................................................................ 19
1.1.4 ABC transporters ........................................................................................................... 20
1.1.5 Hepatic drug disposition ................................................................................................ 23
1.1.5.1 Hepatic uptake (Phase 0) ........................................................................................ 23
1.1.5.2 Biotransformation reactions (Phase I and II) .......................................................... 24
1.1.5.3 P450s enzymes ....................................................................................................... 25
1.1.5.4 Hepatic efflux (Phase III) ....................................................................................... 26
1.2 Drug-induced liver injury ................................................................................................... 27
1.2.1 Overview ........................................................................................................................ 27
1.2.2 Pathogenesis of DILI ..................................................................................................... 28
1.2.2.1 Oxidant and electrophilic stress .............................................................................. 28
1.2.2.2 Immune mechanisms .............................................................................................. 29
1.2.2.3 Mitochondrial toxicity ............................................................................................ 29
1.2.2.4 Interactions with/Inhibition of hepatic transporters ................................................ 30
1.2.3 Tools for the identification of drugs with cholestatic potential ..................................... 31
2 AIMS OF THE WORK ................................................................................................ 33

3 MATERIALS AND METHODS .................................................................................. 34
3.1 Materials ............................................................................................................................... 34
3.1.1 Eukaryotic cell lines ....................................................................................................... 34
3.1.2 Substrates for transport assays ....................................................................................... 34
3.1.3 Buffers and solutions for Western blot .......................................................................... 34
3.1.4 Tested drugs ................................................................................................................... 35
3.1.5 Primary antibodies ......................................................................................................... 36
3.1.6 Secondary antibodies ..................................................................................................... 36
3.2 Methods ................................................................................................................................ 37
3.2.1 Maintenance of LLC-PK1 cells ...................................................................................... 37
3.2.2 Maintenance of Caco-2 cells .......................................................................................... 37
3.2.3 Freezing and thawing of cells ........................................................................................ 37
3.2.4 Cell counting .................................................................................................................. 38
3.2.5 Culturing LLC-PK1 cells in the Transwell® system....................................................... 38
3.2.6 Lucifer yellow monolayer integrity test ......................................................................... 38
3.2.7 3H-taurocholate transport assay ..................................................................................... 39
3.2.8 Testing the effect of drugs on the bile salts transporters, BSEP and NTCP .................. 39
3.2.9 Cholesterol efflux assay ................................................................................................. 39
3.2.10 Phosphatidylcholine efflux assay ................................................................................... 40
3.2.11 Lipid extraction .............................................................................................................. 40
3.2.12 Lipid analysis by Thin-Layer-Chromatography ............................................................ 40
3.2.13 C6-NBD-PC efflux assay ............................................................................................... 41
3.2.14 Testing the effect of drugs on MDR3 function using the C6-NBD-PC efflux assay ..... 41
3.2.15 Validating the effect of drugs on MDR3 function using the 14C labelled choline ......... 41
3.2.16 Cytotoxicity assay .......................................................................................................... 42
3.2.17 Solubilization of cell monolayers .................................................................................. 42
3.2.18 Protein determination ..................................................................................................... 42
3.2.19 Isolation of cell membranes ........................................................................................... 43
3.2.20 Western Blotting ............................................................................................................ 43
3.2.21 Stripping of Western blots ............................................................................................. 44
3.2.22 Quantitative Real-Time qRT-PCR analysis ................................................................... 44
3.2.23 Immunofluorescence ...................................................................................................... 45
3.2.24 Confocal laser scanning microscopy ............................................................................. 45
3.2.25 Statistical Analysis ......................................................................................................... 45

4 RESULTS ...................................................................................................................... 46
4.1 Characterization of a model cell line for biliary lipid secretion ...................................... 46
4.1.1 Western blot analysis of cell lines.................................................................................. 46
4.1.2 Immunolocalization of BSEP, MDR3 and NTCP in polarized LLC-PK1 cells ............. 47
4.1.3 Assessment of integrity of the monolayers .................................................................... 49
4.1.4 Assessment of functionality of the bile salts transporters, NTCP and BSEP ................ 50
4.1.5 Assessment of functionality of the cholesterol transporter ABCG5/G8 ........................ 52
4.1.6 Assessment of functionality of the phosphatidylcholine transporter MDR3 ................. 54
4.1.7 Expression of endogenous MDRs in LLC-PK1 cells ..................................................... 58
4.1.8 Validation of model cell line for studying drug interactions with MDR3 ..................... 59
4.2 Application of the established in vitro model for testing drugs interactions .....................
with hepatobiliary transporters ......................................................................................... 60
4.2.1 Interaction of antifungals with MDR3 ........................................................................... 60
4.2.2 Interaction of antifungals with bile salt transporters ...................................................... 64
4.2.3 Interaction of additional hepatotoxic drugs with MDR3 ............................................... 65
4.2.4 Interaction of cholagogues with MDR3 ......................................................................... 67
4.2.5 Interaction of fibrates with MDR3 ................................................................................. 68
5 DISCUSSION ................................................................................................................ 69
5.1 Characterization of a model cell line for biliary lipid secretion ...................................... 69
5.1.1 Overview of the established in vitro model ................................................................... 69
5.1.2 Analysis of expression and localization of the transporters ........................................... 70
5.1.3 The bile salt transporters, NTCP and BSEP .................................................................. 71
5.1.4 The cholesterol transporter, ABCG5/G8 ....................................................................... 71
5.1.5 The phosphatidylcholine transporter, MDR3................................................................. 72
5.1.6 Endogenous transporters with the same substrate specificity ........................................ 73
5.1.7 Validation of the BNMG cell line for studying drug interactions with MDR3 ............. 74
5.2 Application of the established in vitro model for testing drugs interactions .....................
with hepatobiliary transporters ......................................................................................... 76
5.2.1 Effect of antifungal azoles on MDR3 and BSEP activities and comparison of ................
their structures ................................................................................................................ 76
5.2.2 Effect of antifungal azoles on MDR3 protein levels ...................................................... 78
5.2.3 Effect of additional hepatotoxic drugs on MDR3 activity ............................................. 79

5.2.4 Effect of cholagogues and fibrates on MDR3 activity ................................................... 80
5.2.5 Importance of transport proteins in drug development .................................................. 81
5.2.6 Perspective ..................................................................................................................... 82
6 REFERENCES .............................................................................................................. 83
7 APPENDIX .................................................................................................................... 95
7.1 Publications .......................................................................................................................... 95
7.2 Presentations at selected conferences ................................................................................ 95
Abstract
Bile formation is an important physiological process, coordinated by the concerted activity of
transmembrane proteins, localized at the canalicular membrane of hepatocytes, belonging to the
superfamily of ABC (ATP binding cassette) transporters. These transporters move the primary bile
constituents into the canaliculus, a tight intercellular space between apical membranes of adjacent
hepatocytes. BSEP (bile salts export pump) pumps bile salts; while MDR3 (multidrug resistance
protein 3) and ABCG5/G8 translocate phosphatidylcholine and cholesterol, respectively, making
them available for extraction by bile salts. Dysfunctions in the biliary bile salt, phospholipid and
cholesterol secretion lead to cholestasis or result in cholesterol crystallization followed by
cholelithiasis (gallstone disease). Several drugs may lead to cholestasis by functionally impairing the
activity of canalicular transporters. While drug-induced cholestasis due to the inhibition of BSEP is a
well investigated mechanism of acquired intrahepatic cholestasis, limited information on the
interaction of drugs with lipid transporters such as MDR3 exists, and the role of MDR3 in the
pathogenesis of drug-induced cholestasis is poorly understood. The aim of this project was to study
the interaction of drugs in a newly established polarized cell line system that expresses the key
players involved in canalicular secretion. In the first part of this work, the model LLC-PK1 cell line
stably transfected with human NTCP (Na+-taurocholate cotransporting polypeptide), BSEP, MDR3
and ABCG5/G8 and grown in the Transwell® system was functionally characterized. The established
cell line was shown to display vectorial bile salt transport and specific phosphatidylcholine secretion
into the apical compartment. Hence this model system simulates the in vivo situation at the
canaliculus. Subsequently, using the PC derivative C6-NBD-PC an assay for testing the effect of
compounds on MDR3 activity was established and validated. In the second part of this work, several
hepatotoxic as well as potential hepatoprotective (e.g. beneficial on biliary secretion or on bile ducts)
drugs were tested in our model system. Of the several hepatotoxic drugs tested, the antifungal azoles,
posaconazole, itraconazole and ketoconazole significantly inhibited MDR3-mediated phospholipid
secretion as well as BSEP-mediated bile salt secretion. Surprisingly, in parallel to MDR3 inhibition,
posaconazole and itraconazole induced MDR3 protein levels by an unknown mechanism. In contrast,
other hepatotoxic drugs such as co-amoxicillin, troglitazone and nefadozone did not affect MDR3
function suggesting that the hepatotoxicity of these compounds is not due to the inhibition of this
transporter. Similarly, also the potential hepatoprotective compounds tested did not affect MDR3
activity in our model. In conclusion, the generated in vitro model to study bile salt and phospholipid
secretion is functional and can be considered an inexpensive and reproducible system that facilitate
parallel screening for BSEP and MDR3 inhibitors, to study and predict drug-induced liver injury
caused by inhibition of hepatobiliary transporters.
Sommario
La formazione di bile è un importante processo fisiologico finemente coordinato a livello della
membrana canalicolare degli epatociti dall’azione di diverse proteine di transmembrana appartenenti
alla superfamiglia dei trasportarori ABC (ATP-binding cassette). Tali proteine trasportano i
costituenti della bile primaria nel canalicolo, uno spazio intercellulare delimitato, tra le membrane
apicali di epatociti adiacenti. BSEP (bile salt export pump) pompa i sali biliari; mentre MDR3
(multidrug resistance protein 3) e ABCG5/G8 traslocano fosfatidilcolina rispettivamente colesterolo,
rendendoli estraibili dai sali biliari nel canalicolo. Disfunzioni della secrezione biliare di sali biliari,
fosfolipidi o colesterolo possono causare la colestasi o, in seguito alla cristallizzazione del
colesterolo, la colelitiasi (calcoli biliari). Molti farmaci possono causare colestasi, alterando la
funzione dei trasportatori canalicolari. Mentre la colestasi-farmaco indotta, dovuta a inibizione di
BSEP, è un meccanismo ben studiato di colestasi intraepatica acquisita, studi concernenti interazioni
di farmaci con MDR3 e sul ruolo dei trasportatori di lipidi come MDR3 nell’eziopatogenesi della
colestasi farmaco indotta sono limitati. Lo scopo di questo progetto è stato di studiare l’interazione di
vari farmaci in un modello cellulare polarizzato co-esprimente i principali attori della secrezione
biliare. La prima parte del progetto si è focalizzata sulla caratterizzazione funzionale di un modello
cellulare costituito da cellule LLC-PK1 trasfettate stabilmente con NTCP, BSEP, MDR3 e
ABCG5/G8 e polarizzate su filtri Transwell®. Analogamente alla situazione fisiologica nel canalicolo,
il modello sviluppato esibiva sia trasporto vettoriale di sali biliari, che secrezione specifica di
fosfatidilcolina nel compartimento apicale. In seguito, usando un analogo della fosfatidilcolina, C6-
NBD-PC, é stato sviluppato e validato un sistema per testare l’effetto di composti e farmaci
sull’attività di MDR3. Per la seconda parte del progetto, una gamma di farmaci epatotossici o
epatoprotettivi sono stati selezionati per valutare il loro effetto nel modello. Tra i diversi composti
testati nel nostro modello cellulare gli azoli antifungini posaconazolo, itraconazolo e chetoconazolo
inibivano significativamente sia la secrezione di fosfatidilcolina mediata da MDR3 che la secrezione
di sali biliari mediata da BSEP. Inaspettatamente, l’effetto inibitorio di posaconazolo e itraconazolo
sul trasporto di fosfatidilcolina era accompagnato da un’induzione dei livelli di proteici di MDR3
attraverso un meccanismo ancora sconosciuto. Invece, altri farmaci epatotossici, come co-
amoxicillina, troglitazone e nefadozone non hanno avuto alcun effetto sul trasporto mediato da
MDR3. Questo suggerisce che l’epatotossicità di questi composti non è dovuta ad un’inibizione di
MDR3. Analogamente, anche i medicamenti potenzialmente epatoprotettivi testati, non hanno alterato
la funzione di MDR3. In conclusione, il modello in vitro generato per studiare la secrezione

canalicolare di sali biliari e fosfolipidi è funzionale e può essere considerato un sistema rapido,
economico e riproducibile per effettuare screening paralleli di inibitori di BSEP e MDR3 e quindi
studiare e predire colestasi farmaco-indotta dovuta a un’inibizione dei trasportatori epatobiliari.
Acknowledgments
My greatest thanks go to Bruno Stieger for giving me the great opportunity to pursue my PhD thesis
in his lab, for his constant support and guidance, for the interesting discussions, for his optimism and
high spirits which made very pleasant the work during the years. I enjoyed a lot all the scientific
discussions we had and I am very thankful for his confidence in me and in the project.
In addition, I want to thank the members of the Clinical Pharmacology and Toxicology for the
scientific inputs and discussions, technical or administrative support, and the good time we had in and
outside the lab: Angelo Torozi, Aylin Yoker, Christian Feuerstacke, Christian Hiller, Evelyn Krajnc,
Gai Zhibo, Gerd Kullak-Ublick, Jessica Mwinwy, Katrin Wlcek, Laura Schnyder, Lia Hofstetter,
Mayank Pururawa, Michele Visentin, Regina Krattinger, Rose Bosshard, Stephanie Bernhard and
Tatiana Claro da Silva.
I want to thank Lia Hofstetter for the technical support especially at the beginning of the project. I
will never forget the evenings in the Schönleinstrasse with Katrin Wlcek.
Furthermore, I want to thank the members of my PhD committee, Kaspar Locher and Sabine Werner,
for the support and suggestions during the yearly committee meetings.
Special thanks go to Kaspar Locher for his inputs during the preparation for the TransCure meetings
and in writing the manuscript.
I enjoyed a lot the scientific and non-scientific discussions with the colleagues and friends that I got
to know during the TransCure meetings and I appreciated a lot being part of this network.
Finally, I want to thank also the persons that have always supported me during the years, in every
moment and in every possible way; my husband Peter, my parents Fatin and Amir and my sisters
Miriam, May and Rim.

14
List of abbreviations
ABC: ATP-binding cassette
Alb: albumin
ALT: alanine aminotransferase
ALP: alkaline phosphatase
AP: apical
ATP: adenosine triphosphate
BAS: basolateral
BCRP: breast cancer resistance protein
BN: LLC-PK1 cell line transfected with BSEP and NTCP
BNMG: LLC-PK1 cell line transfected with BSEP, NTCP, MDR3 and ABCG5/G8
BS: bile salts
BSEP: bile salt export pump
cat. #: catalogue number
Caco-2: human colorectal adenocarcinoma cell line
CMV: cytomegalovirus
Co-amoxicillin: amoxicillin and clavulanic acid
C6-NBD-PC: 1-palmitoyl-2-{6-[(7-nitro-2-1,3-benzoxadiazol-4-yl)amino]hexanoyl}-
sn-glycero-3-phosphocholine
DILI: drug-induced liver injury
DMEM: Dulbecco’s modified Eagle’s medium
Fig.: Figure
γ-GTP: γ-glutamyltranspeptidase
HPTLC plate: high performance thin-layer chromatography plate
MEM: minimum essential medium
IC50: half maximal inhibitory concentration
LDH: lactate dehydrogenase
LLC-PK1: pig kidney epithelial proximal tubule cell line
MDR: multidrug resistance protein
MRP: multidrug resistance–associated protein
NBD: nucleotide-binding domain
NTCP: Na+-taurocholate cotransporting polypeptide
15
OATP: organic anion-transporting polypeptide
PBS: phosphate-buffered saline
P450: cytochromes P450 enzymes
PC: phosphatidylcholine
PCR: polymerase chain reaction
PFIC: progressive familial intrahepatic cholestasis
PSC833: Valspodar
SLC: solute carrier
Tc: taurocholate
TLC: thin-layer chromatography
TBS-T: tris-buffered saline/tween
TMD: transmembrane domain
WT: wild type
16
Copyright
Parts of this thesis have been published in following original article and were reprinted with
permission of the American Society for Pharmacology and Experimental Therapeutics. All rights
reserved.
Zainab M. Mahdi, Uta Synal-Hermanns, Aylin Yoker, Kaspar P.Locher, and Bruno Stieger,
Role of Multidrug Resistance Protein 3 in Antifungal-Induced Cholestasis,
Mol Pharmacol 2016, 90(1):23-34,
DOI: http://dx.doi.org/10.1124/mol.116.103390
17
1 Introduction
1.1 The liver and its role in bile formation and drug disposition
1.1.1 Overview
The liver is a vital organ and it represents, next to the skin, the largest organ in the body. In humans
the liver is separated macroscopically into 4 lobes (Roth and Ganey, 2010). The principal cell type of
the liver is the hepatocyte which accounts for 60% of the total cell population and 80% of the volume
of the organ (Roth and Ganey, 2010). In addition there are endothelial cells that line the vascularizing
vessels of the liver, stellate cells that store fat, Kupffer cells and lymphocytes that protect the liver.
Generally the functions of the liver are carried out by the hepatocytes and include: 1) nutrient
homeostasis (e.g. glucose and fatty acids synthesis); 2) protein synthesis (e.g. clotting factors and
albumin); 3) biotransformation of endogenous (e.g. bilirubin, steroid hormones) or exogenous
molecules (e.g. drugs and xenobiotics), also called detoxification and 4) bile formation (Klaassen,
2008).
1.1.2 Structural organization
Classically, the liver is divided into anatomical units called hepatic lobules (Klaassen and Watkins III,
2010). Hepatic lobules are hexagonal clusters of hepatocytes oriented around a hepatic central vein
(Fig. 1). At the corner of the lobules there are the portal triads consisting of branches of a bile duct,
portal vein, and hepatic artery (Klaassen and Watkins III, 2010). Venous blood from the stomach and
the gut flows through the portal vein to the liver. In the liver, arterial and venous blood is mixed in the
penetrating vessels, enters the sinusoids (small vascularizing vessels) and percolates along the cords
of hepatocytes (Klaassen, 2008). Finally the blood exits the liver via the central vein. Along the
portal-venous central-venous axis, hepatocytes display ultrastructural (e.g. mitochondria and smooth
endoplasmic reticulum) and metabolic (various enzymes activities) heterogeneity (Jungermann, 1987;
McCuskey, 2012). This results in a zonation of the hepatic lobule into regions with different cellular
functions known as centrolobular, midzonal and periportal zones or acini (Klaassen, 2008; Roth and
Ganey, 2010). For example biotransformation by oxidation reactions mediated by P450 enzymes are
mainly centrolobular functions whereas glucose uptake occurs mainly in the periportal zone.
Consequently also most pathological mechanisms have a certain degree of zonation.

Introduction 18
Fig. 1 The structural organization of the liver. (A) Schematic representation of the anatomical units of the liver
called hepatic lobules. Hepatic lobules consist of hepatocytes, a central vein and 3 to 6 portal triads located at the
corners of the structure. (B) 3D structure of a section of a hepatic lobule. Blood enters the liver from the portal veins
and hepatic arteries and flows, countercurrent to the bile, into the central vein. (C) Architecture of the hepatic blood
capillaries or sinusoids. Blood entering the liver from the portal veins and the hepatic arteries mixes in the sinusoids
and flows through fenestrated endothelial cells to the space of disse, next to the hepatocytes. (B) and (C) were
adapted by permission from Macmillan Publishers Ltd: Nat Rev Immunol, Adams and Eksteen, 2006, 6:244-51,
copyright 2006.

Introduction 19
1.1.3 Bile formation
One of the major functions of the liver is bile formation. Bile is a fluid constituted by bile salt (50%
of dry weight), phosphatidylcholine (25% of dry weight), cholesterol, proteins, glutathione and small
solutes and is important for the solubilisation and absorption of fats in the small intestine, for
protection of the small intestine from oxidative insult and for the excretion of several endogenous and
exogenous compounds (e.g. cholesterol, bilirubin and drugs) (Klaassen, 2008; Nicolaou et al., 2012).
Hepatocytes represent the starting point of bile formation. They transport bile salts, glutathione,
phosphatidylcholine and cholesterol into a space, between apical plasma membranes of adjacent
hepatocytes, sealed by tight junction, and called canaliculus. From the canaliculus (~1 μm in
diameter), primary bile, flows countercurrent to the direction of the portal blood flow, into the bile
ducts and is finally delivered via larger bile ducts and the common bile duct into the gallbladder
(Boyer, 2013).
At the molecular level the process of bile formation is coordinated by transport proteins expressed on
the apical or canalicular membranes of hepatocytes (Fig. 2 and Fig. 4) belonging to the ABC
transporter superfamily. Among the canalicular transporters, BSEP mediates the transport of
conjugated bile salts from the hepatocytes into the canaliculus, the rate determining step of bile
formation. MRP2 (multidrug resistance-associated protein 2) transports glutathione (GSH), as well as
sulfated and glucuronidated bile acids and bilirubin diglucuronide (Klaassen, 2008; Pauli-Magnus and
Meier, 2006). MDR3 and ABCG5/G8 translocate phosphatidylcholine and cholesterol, respectively,
from the cytoplasmic to the outer leaflet of the canalicular membrane. The bile salts in the canaliculus
facilitate the release of phosphatidylcholine from the outer leaflet of the canalicular membrane
forming mixed bile salts-phosphatidylcholine micelles (Small, 2003). Formation of mixed bile salt-
phosphatidylcholine micelles reduces the detergent activity of bile salts in the bile ducts (Trauner et
al., 2008) and is crucial for the complete solubilization of cholesterol. Impairment in the process of
bile secretion, as in the case of mutations of transporters such as BSEP, may result in the intracellular
accumulation of toxic bile constituents e.g. bile salts in the hepatocytes, causing a reduced bile flow
and hepatocellular damage, a condition called cholestasis (e.g. progressive familial intrahepatic
cholestasis 2 or PFIC2) (Stieger, 2010). Beside the increase of intracellular levels of cytotoxic
compounds, dysfunctions in the biliary cholesterol-bile salt-phospholipid secretion may lead to an
alteration in bile composition. Alterations leading to an increased ratio of cholesterol to bile salt or
phospholipids may result in cholesterol crystallization and finally in cholelithiasis, whereas
alterations of bile composition resulting in a decreased ratio of phospholipids to bile salts may lead to
“toxic bile” formation and subsequent hepatocellular and/or bile duct injury (Trauner et al., 2008).

Introduction 20
Fig. 2 Hypothesis of the molecular mechanisms underlying biliary lipid secretion. (A) BSEP pumps bile salts
(BS) in the canaliculus. (B) Bile salts in the canaliculus pick up translocated phosphatidylcholine (PC) and (C) form
PC-BS micelles. (D) PC-BS micelles incorporate cholesterol translocated by ABCG5/G8 and (E) form mixed BS-
PC-cholesterol micelles which move down the biliary tract into the gallbladder and intestine. Adapted from PNAS
(Small, 2003), Vol. 100, No. 1.
1.1.4 ABC transporters
ATP-binding cassette (ABC) transporters constitute the largest family of transmembrane transport
proteins and are present in all three kingdoms of life (Ellinger et al., 2013; Locher, 2016). These
proteins are primary active transporters moving a wide variety of substrates using ATP as energy
source (Ellinger et al., 2013). Depending on the direction of the transport, if into the cytosol
(inwardly) or out of the cytosol (out of the cell or into a cellular organelle), ABC transporters can be
divided into two subtypes: importers and exporters (Holland et al., 2003; Hollenstein et al., 2007).
ABC importers have been identified only in prokaryotes whereas ABC exporters are found in both
eukaryotes and prokaryotes (Holland et al., 2003; Hollenstein et al., 2007). In addition, there is a third
group of ABC transporters which does not seem to be directly involved in transport but rather in
cellular processes such as DNA repair or regulation of gene expression (Holland et al., 2003). All
ABC transporters share a basic structure consisting of two hydrophilic cytoplasmic nucleotide-
binding domains (NBDs), that bind and hydrolyze ATP, and two hydrophobic transmembrane
domains (TMDs) that form a translocation pathway for substrates across the membrane bilayer (Fig.
3). These four domains can be encoded as four independent polypeptides (mostly in bacterial
importers), as one single polypeptide (also called full transporters, mostly in eukaryotic exporters) or
as two multidomain polypeptides (halftransporters). The NBDs of all ABC transporters share
extensive amino acid sequence identity and several characteristic motifs such as P-loop and the
LSSGQ motif (Higgins and Linton, 2004; Locher, 2009). In contrast, the TMDs, which consist of
multiple membrane spanning α-helices arranged with an internal pseudo two-fold symmetry, can
contain different numbers of helices (6 to 11) and share little amino acid sequence identity (Higgins
and Linton, 2004). This may also explain the specific characteristics of ABC transporters as the large

Introduction 21
diversity of the transported substrates. Although many details are not known yet, a common general
mechanism of transport has been proposed. According to the current models, the “ATP-switch
model” and the “alternating-access model”, dimerization of the NBDs, upon binding of ATP,
translates into a conformational change of the TMDs. Alternation of the TMDs between inward and
outward facing conformation promotes transport. The direction of transport is determined by the
different binding affinity of the substrate for the TMDs conformations. However, recent data also
support that ABC-mediated transport can occur without an inward-facing opening of the transporter
(Perez et al., 2015).
Fig. 3 Models of the open (inward facing) and closed conformations (outward facing) of ABC transporters.
Dimerization of the NBDs upon binding of ATP is transmitted by coupling helices to the TMDs which change
conformations. Adapted from Microbiology and Molecular Biology Reviews (Cuthbertson et al., 2010), Vol. 74,
No. 3, Copyright 2010, American Society of Microbiology.
ABC transporter function can be altered by modulators/inhibitors. Most knowledge on direct
modulators of ABC protein derives from the drug interaction studies performed on ABCB1 which is
the multidrug-resistance protein 1 (MDR1, and most commonly known as P-glycoprotein). From
these studies, two general modes of inhibition of ABC transporters emerged: 1) Some inhibitors (e.g.
verapamil) may bind and compete for the same or overlapping binding sites of the substrates, in the
TMDs. In this case transport of a substrate is inhibited in a competitive manner; 2) Some modulators
may bind to the NBDs (e.g. flavonoids) and suppress the ATPase activity. In this case, the transport
of a substrate is inhibited in a non-competitive manner.
The human genome encode 48 genes for ABC transporters, most of which are thought to be
exporters. In humans, ABC proteins are either full transporters or dimers of half transporters. Based
on sequence similarity and the organization of the domains, the Human Genome Organization have
grouped these proteins into 7 families, from ABCA to ABCG (Dean, 2002). Since ABC transporters
defects have been implicated in several monogenetic diseases, in increased susceptibility to specific
complex disorders (Dean, 2002) and as cause of multidrug resistance (Wu et al., 2008) (Table 1), a
better molecular understanding of the function and structure of these proteins is of clinical importance
and may help in the development of specific modulators with potential beneficial medical effects or in
the design of safer drugs.

Introduction 22
Table 1 Classifications of ABC transporters and example of diseases associated with their loss of functions
mutations. Adapted from Dean (Dean, 2002).
Of the 48 members of the ABC superfamily that have been identified in humans, 14 have been
detected at the protein level in the liver (Wlcek and Stieger, 2014) and play a key role in bile
formation (see previous section). In the liver, mutations in the ABCB11 and in the ABCB4 genes
encoding BSEP and MDR3, respectively, have been linked to various hepatobiliary disorders such as
progressive familial intrahepatic cholestasis or susceptibility to intrahepatic cholestasis of pregnancy
(Trauner et al., 2007). Mutations of BSEP are characterized by increased intracellular levels of bile
salts and a decreased bile flow. The pathophysiological mechanisms underlying hepatocellular and
bile duct injury in patients with mutations of MDR3 are not fully understood but it has been suggested
that impairment of MDR3 may lead to the formation of “toxic bile” (Trauner et al., 2008). Consistent
with the concept of “toxic bile”, MDR3 knockout mice models develop bile duct injury with features
resembling those observed in human sclerosing cholangitis suggesting that formation of toxic bile
could also play an important role in the pathogenesis of various cholangiopathies in humans (Trauner
et al., 2008). Mutations in ABCC2 encoding MRP2 results in the Dubin-Johnson syndrome, a disease
characterized by conjugated hyperbilirubinemia. ABCG8 gene polymorphisms (p. D19H and p.
T400K) lead to increased cholesterol secretion into the bile and were linked to an increased risk of
gallstone disease in certain populations (Rudkowska and Jones, 2008). MDR1 or P-glycoprotein,
discovered as conferrer of multidrug resistance in tumor cells (Huang et al., 1998), mediates export of
Family Example Disease (loss of function)
ABCA
12 full transporters ABCA1 Tangier disease
ABCB
4 full transporters and 7 half transporters
ABCB11/BSEP
ABCB4/MDR3
PFIC2
PFIC3
ABCC
12 full transporters
ABCC7/CFTR Cystic fibrosis
ABCC2/MRP2
ABCC6
Dubin-Johnson syndrome
Pseudoxanthoma elasticum
ABCD
4 half transporters, all in peroxisomes ABCD1/ALD Adrenolekodystrophy
ABCE and ABCF
1 ABCE and 3 ABCF, no TMD only NBD
ABCE
ABCF1
ABCG
6 half transporters ABCG5/G8 Sitosterolemia

Introduction 23
drugs and hydrophobic substrates from the cells (International Transporter et al., 2010). The impact of
MDR1 polymorphisms on the liver is not clear; however it is conceivable that by increasing drug,
xenobiotic and metabolite concentration in the hepatocytes, it may lead to an increased risk for drug-
induced injury (Pauli-Magnus et al., 2010).
1.1.5 Hepatic drug disposition
Another major function of the liver is detoxification. The liver is a primary organ involved the
disposition of drugs, xenobiotic as well as endobiotic substances. After oral administration,
xenobiotics and drugs are absorbed across the intestinal wall and are delivered to the liver by the
portal hepatic system (Niemi, 2007). In the liver, xenobiotics and drugs flowing in the sinusoids cross
the interstitial space and are taken up mainly by carriers expressed at the basolateral membrane of
hepatocytes (Shugarts and Benet, 2009). In hepatocytes, endobiotics and xenobiotics are eventually
bio-transformed into water-soluble metabolites by Phase I and Phase II enzymes before being finally
secreted by efflux pumps either back into the blood through the basolateral membrane, or into in the
bile, through the canalicular membrane of hepatocytes. Classical drug disposition has been
considering only Phase I and Phase II reactions (Szakacs et al., 2008). However, in the last decades,
with the increasing recognition of the important role of transporters in drug uptake and elimination
and thus as determinants of drug pharmacokinetic and pharmacodynamics, the concept of drug
disposition has been extended to drug uptake or Phase 0 and drug efflux or Phase III (Vavricka et al.,
2002).
1.1.5.1 Hepatic uptake (Phase 0)
Hepatic uptake mechanisms determine how exogenous and endogenous solutes enter (Phase 0) the
hepatocytes. Phase 0 uptake is mediated by transporters belonging mainly to the SLCs superfamily
(Shugarts and Benet, 2009). The SLC superfamily members encompass a variety of transporters that
use different transport mechanisms (Shugarts and Benet, 2009). They can be passive (uniporters or
facilitative transporter) or secondary active transporters. Passive transporters move substrates down
their electrochemical gradient. In contrast, secondary active transporters move substrates against their
electrochemical gradient by coupling with another molecule that flows downhill its concentration
gradient. Secondary active transporters can be coupled/symporters or exchangers/antiporters (Dobson
and Kell, 2008). In the liver, the sodium-taurocholate co-transporting polypeptide (SLC10A1, NTCP)
and the organic anion transporting polypeptides (SLCO or SLC21A, OATPs) are SLCs transporters
expressed on the basolateral membrane of hepatocytes and play the predominant role in the uptake of
bile salts and drugs. NTCP is a secondary active, sodium-coupled transporter that mediates uptake of
conjugated bile salts into the hepatocytes and hence it is fundamental for the maintenance of the
enterohepatic cycle of bile salts. Its energy is derived from the sodium gradient which is maintained
by the ATP-dependent Na+/K+-ATPase which is also localized at the basolateral membrane (Boyer,

Introduction 24
2013). Currently, the role of this transporter in drug and xenobiotic uptake seems to be limited, as the
only known substrate is the HMG-CoA reductase inhibitor rosuvastatin (Ho et al., 2006). However, a
genetic polymorphism of NTCP found in asiatic population showed a gain for rosuvastatin transport
activity (Ho et al., 2006) suggesting that in certain cases NTCP could play a more important role in
drug disposition. Furthermore, various drugs have been reported to inhibit NTCP e.g. cyclosporin
(Stieger, 2011) and therefore NTCP may be relevant in drug interactions. In contrast, the mechanism
of substrate uptake by OATPs transporters is not completely understood but they are believed to act
as organic anions exchangers (Hagenbuch and Stieger, 2013), in which the cellular uptake of organic
anions is coupled to the efflux of neutralizing anions such as bicarbonate, glutathione or glutathione-
S-conjugates. However, the nature of the neutralizing ion remains unknown for human OATPs
(Niemi, 2007). Generally, OATPs have been detected in essentially every organ in epithelial or
endothelial cells. Some OATPs have a restricted expression and are therefore assumed to be organ
specific, while others are expressed ubiquitously (Hagenbuch and Stieger, 2013). OATP1B1 and
OATP1B3 are considered to be the liver-specific OATPs (Hagenbuch and Stieger, 2013; Obaidat et
al., 2012). OATP1B1 is expressed in hepatocytes throughout the lobule, while OATP1B3 is primarily
expressed around the central vein (Hagenbuch and Stieger, 2013). In contrast to NTCP, OATP1B1
and OATP1B3 contribute to a lesser extent to the uptake the bile salts, but play a major role in
transporting endobiotics, xenobiotics and drugs into the hepatocytes. Drug substrates of OATP1B1
include a large number of structurally diverse compounds, such as statins (atorvastatin, cerivastatin,
fluvastatin, pitavastatin, pravastatin, rosuvastatin and simvastatin acid), the endothelin receptor
antagonists atrasentan and bosentan, the antibiotics benzylpenicillin and rifampicin, the antifungal
agent caspofungin, the angiotensin-converting enzyme inhibitors enalapril and temocapril, the
angiotensin II receptor antagonists olmesartan and valsartan and many others (Niemi, 2007).
OATP1B3 transports several therapeutic drugs, with overlapping substrate specificity with OATP1B1
(Niemi, 2007). However, OATP1B3 is unique among hepatic OATPs in transporting digoxin,
docetaxel and paclitaxel (Niemi, 2007).
1.1.5.2 Biotransformation reactions (Phase I and II)
Biotransformation is the chemical conversion of endogenous or exogenous compounds into more
water-soluble compounds that can be more easily excreted by the body (Klaassen and Watkins III,
2010). Phase I biotransformation reactions of drugs and xenobiotics are carried out primarily by
cytochrome P450 enzymes and involve hydrolysis, reduction and oxidation reactions. These reactions
occur in the endoplasmic reticulum and usually expose or introduce a functional group (-OH, -NH2, -
SH or COOH) resulting in a small increase of hydrophilicity (Klaassen and Watkins III, 2010) and
most importantly producing a reactive site on the molecule suitable for conjugation reactions (Phase
II). As a consequence, these reactions can have both, protective or toxic effects as they may inactivate

Introduction 25
toxic chemicals to innocuous compounds or may also activate drugs to toxicants. By developing
“prodrugs” (inactive drugs) that are intracellularly activated to the pharmacologically active agent, the
pharmaceutical industry has exploited Phase I reactions to improve drug pharmacokinetics and
decrease drug toxicity. Phase II biotransformation reactions occur predominantly in the cytosol but
also in the endoplasmic reticulum and include glururonidation, sulfonation, acetylation, methylation,
conjugation with glutathione and conjugation with amino acids (Klaassen and Watkins III, 2010). The
substrates react with functional groups which are either present on the xenobiotic or introduced
during Phase I reactions. Generally, these reactions result in a large increase in hydrophilicity
enabling these substances to be secreted during Phase III.
1.1.5.3 P450s enzymes
The human genome contains 115 CYP genes, of which 57 are functional cytochrome P450 (CYP)
genes (Johansson and Ingelman-Sundberg, 2011; Zanger and Schwab, 2013) encoding heme-
containing enzymes. Based on sequence similarity (Kaplowitz and DeLeve, 2003) CYPs are divided
into families indicated by a number. CYP families can be categorized into 2 major groups: 1) CYP
families 4-51 are mainly involved in the biosynthesis and metabolism of endogenous compounds (e.g.
sterols, eicosanoids, fatty acids). They usually have high affinity for the substrates and are well
conserved during evolution; 2) CYP families 1-3 are involved in the metabolism of exogenous
compounds as drugs and xenobiotics. They have usually less affinity for their substrates, are less
conserved evolutionary and exhibit important genetic polymorphisms (Ingelman-Sundberg, 2004;
Johansson and Ingelman-Sundberg, 2011; Kaplowitz and DeLeve, 2003).
The second group (CYP families 1-3) is responsible for 75% of all Phase I dependent metabolism of
clinically used drugs (Johansson and Ingelman-Sundberg, 2011). Within this group, 6 isozymes have
been identified to play a predominant role in drug metabolism: CYP1A2, CYP2C19, CYP2C9,
CYP2D6, CYP2E1, and CYP3A4. Each isoenzyme can metabolize several drugs and many drugs can
be metabolized by more than one CYP/P450. This may lead to drug-drug interactions, when
combinations of 2 or more drugs being metabolized by the same isoenzyme are co-administered (as
metabolism of a drug would be competitively inhibited by the other). In addition, induction (increased
enzyme expression) or inhibition of P450 by drugs or xenobiotics can accelerate or slow drug
metabolism leading to a decreased therapeutic efficacy of a drug or drug-induced toxicities,
respectively. For example cyclosporin and simvastatin are substrates of CYP3A4. Co-administration
of these drugs with CYP3A4 inhibitors such as ketoconazole or grapefruit juice decreases cyclosporin
and simvastatin dosage requirement (Ogu and Maxa, 2000). This is not a problem if serum levels of
the drugs would be monitored and dosage would be adjusted. However, since for statins serum levels
are usually not measured, co-administration of a CYP3A4 inhibitor may increases the risk for toxic
drug effects such as rhabdomyolysis. On the other hand co-administration of cyclosporin and

Introduction 26
simvastatin drugs with CYP450 inducers such as St. John's wort or rifampicin may lead to increased
elimination of these drugs and subtherapeutic drug concentrations. For cyclosporin, this potentially
leads to transplant rejection (Barone et al., 2000). Finally, beside drug interactions, also genetic
polymorphisms affecting P450 may also alter P450 enzymes activities and therefore are very
important to understand interindividual variability in drug response (Fujikura et al., 2015).
1.1.5.4 Hepatic efflux (Phase III)
The efflux of endogenous or exogenous compounds, including drugs and their metabolites, from the
hepatocytes represents the last step of the hepatic disposition of drugs and is called Phase III. Phase
III is mediated by ABC transporters (Doring and Petzinger, 2014). ABC transporters are primary
active transporters that export compounds against their concentration gradient. Most ABC
transporters in the liver localize on the apical membrane of hepatocytes (Fig. 4) and their main
physiological function is the secretion of bile constituents for primary bile formation in the
canaliculus. In the canaliculus, one of the major determinants of drug disposition is MDR1 (Pauli-
Magnus and Meier, 2006). MRP2 mediates the transport of glucuronidated compounds into the bile
(e.g. bilirubin and drugs), whereas BCRP display a preference for sulfated conjugates (de Lima
Toccafondo Vieira and Tagliati, 2014). In addition, ABC transporters belonging to the family of
multidrug resistance-associated proteins (MRPs) are expressed on the basolateral membrane. These
move substrates back into the disse space (interstitial space) and thus into the blood. MRP3 and
MRP4 have been shown to play a protective role by mediating basolateral bile salts efflux when
intracellular levels of bile salts rise and are involved in the transport of the antiretroviral drugs
lamivudine, zidovudine and stavudine (de Lima Toccafondo Vieira and Tagliati, 2014).
Fig. 4 Bile and drugs transporters in human liver hepatocytes. SLCs transporters: round symbols; ABC
transporters: ovals symbols. Shown in colors (blue, green and red) are the key transporters involved in bile
formation.
Introduction 27
1.2 Drug-induced liver injury
1.2.1 Overview
As the first and main organ responsible for the uptake (Phase 0), metabolism (Phase I and II) and
excretion (Phase III) of the majority of drugs, xenobiotics and their metabolites as well as endogenous
compounds, the liver is particularly predisposed to drug toxicity. Indeed, factors affecting these
processes may increase the level of exposure of hepatocytes to exogenous molecules such as drugs
and/or their metabolites or alternatively, alter disposition of endogenous molecules, contributing to
the development of drug-induced liver injury (DILI). Although, because of underreporting and an
unknown denominator of persons assuming a drug, the true incidence of DILI is very difficult to
assess, about 10-20 cases per 100’000 persons have been estimated to occur each year (Bjornsson et
al., 2013; Leise et al., 2014). DILI represents an important clinical problem for the following major
reasons: 1) it accounts for more than 40% of hepatitis in adults (Pauli-Magnus and Meier, 2006) and
for most of the cases of acute liver failure both in the USA and Europe (Ramachandran and Kakar,
2009; Reuben et al., 2010; Wei et al., 2007); 2) it is a primary cause for withdrawal or labeling
changes of drugs after their approval, and is therefore a critical issue for the pharmaceutical industry
and for the drug regulatory agencies (Cheng et al., 2011; Corsini and Bortolini, 2013; Yang et al.,
2015), since the potential toxicity of many drugs is not evident during clinical phases (Kaplowitz and
DeLeve, 2003); 3) it encompasses a broad spectrum of liver injuries and can mimic all forms of liver
diseases and therefore represents a diagnostic challenge for physicians (Kaplowitz and DeLeve,
2003). DILI diseases can be nonidiosyncratic/predictable (high incidence and dose related e.g.
paracetamol overdose) or idiosyncratic/unpredictable (low incidence and only above a threshold dose-
related e.g. amoxicillin-clavulanate) (Chughlay et al., 2015; Leise et al., 2014). Generally, early
manifestations of toxicity, within a few days from starting drug exposure, is a characteristic of
predictable reactions, whereas unpredictable reactions usually occur with intermediate (1-8 weeks) or
long latency (up to 12 months) (Kaplowitz and DeLeve, 2003).
DILI is typically classified biochemically into three patterns of injury on the basis of the relative
changes of the serum enzymes: a hepatocellular pattern is characterized by a predominant increase in
alanine aminotransferase (ALT), a cholestatic pattern by a predominant increase of alkaline
phosphatase (ALP), and a mixed hepatocellular-cholestatic pattern by a moderate increase of ALT
and ALP where the latter is the most characteristic of DILI (Hussaini and Farrington, 2007;
LiverTox.nih.gov[2016]). The R ratio has been defined to assess the pattern of DILI (Table 1)
(Hussaini and Farrington, 2014).

Introduction 28
Table 2 Classification of drug-induced liver injury according to CIOMS (Council for International
Organizations of Medical Sciences). ALP: alkaline phosphatase; ALT: alanine aminotransferase; ULN: upper limit
of normal. Table adapted from Hussaini et. al. 2014.
Liver injury pattern R = (ALT/ULN)/ (ALP/ULN)
Hepatocellular R≥5
Mixed R>2 and <5
Cholestatic R≤2
If the biochemical changes are present since more than 3 months, a liver injury pattern is considered
chronic (Ramachandran and Kakar, 2009). In addition, several clinicopathological classifications of
DILI have been proposed (Lewis, 2000; Ramachandran and Kakar, 2009; Zimmerman, 2000).
Considering clinical features, laboratory and histological findings, clinicopathological classifications
categorize DILI into more specific categories or phenotypes (Farrell, 1994; LiverTox.nih.gov[2016]).
According to this approach DILI is categorized into: acute or chronic hepatitis, steatosis,
phospholipidosis or nonalcoholic fatty liver (all hepatocellular injuries), bland cholestasis, cholestatic
hepatitis, vascular disorders (sinusoidal dilatation, sinusoidal obstruction, peliosis hepatitis etc.) and
hepatic tumors (such as hepatic adenoma and hepatocellular carcinoma) (Farrell, 1994;
LiverTox.nih.gov[2016]). However, the limitation of this classification is that many drugs can
produce more than one type of clinicopathological syndrome (Farrell, 1994).
1.2.2 Pathogenesis of DILI
The pathogenesis of DILI is complex and not fully understood (Chughlay et al., 2015). Several
cellular mechanisms with multiple variable outcomes have been involved in the pathogenesis of DILI
(Fontana, 2014). One of the key challenges associated with DILI is why some drugs are well tolerated
by the majority of the patients while some patients are susceptible and develop liver injury (Roth and
Ganey, 2010). The prevailing opinion is that enhanced genetic susceptibility (e.g. polymorphisms of
P450 enzymes or transporters) and/or failure to adapt to a cellular drug response are key factors
leading to DILI (Klaassen, 2008). From the mechanistic point, although interconnected between each
other, four pathways of toxicity underlying the pathogenesis of DILI can be differentiated: 1)
oxidant/electrophilic stress; 2) immune mechanisms; 3) mitochondrial toxicity; 4) inhibition of
hepatic transporters (Roth and Ganey, 2010).
1.2.2.1 Oxidant and electrophilic stress
Metabolism of drugs by Phase I enzymes produces metabolites that are generally safely eliminated
from the body by conjugation reactions catalyzed by Phase II enzymes. However, under certain
circumstances such as genetic polymorphisms of Phase I (P450) or Phase II enzymes, induction of
Introduction 29
certain Phase I enzymes, or low expression of Phase II enzymes, reactive and potentially toxic
metabolites are generated (Kaplowitz and DeLeve, 2003) and may accumulate in the hepatocytes.
Briefly, a balance between Phase I and Phase II reactions determines whether the reactive metabolites
are safely detoxified (Klaassen, 2008). These reactive intermediates are electrophilic metabolites that
covalently bind to nucleophilic residues on proteins generating a complex (hapten) that may induce
an immune response (Fontana, 2014; Kaplowitz, 2004; Roth and Ganey, 2010). Alternatively, the
reactive metabolite may directly damage the cell by glutathione depletion, covalent binding to cellular
constituents such as protein, lipids or DNA or inducing lipid peroxidation (Kaplowitz, 2004).
1.2.2.2 Immune mechanisms
Innate and adaptive immune mechanisms may trigger DILI or may be activated by DILI triggered by
other mechanisms such as electrohilic stress or cholestasis. The observation of rash, fever,
eosinophilia after 1-8 week of drug treatment and the detection of antibodies against hepatic proteins
support the involvement of an adaptive immune response (Ju and Reilly, 2012). The main hypothesis
is that the drug or its metabolites covalently bind to a liver protein such as cytochrome P450 and act
as hapten (Yuan and Kaplowitz, 2013). Presentation of the processed drug-protein adducts by antigen
presenting cells triggers the adaptive immune response. Responses of the adaptive immunity can be
humoral or cellular (Roth and Ganey, 2010). Humoral responses are mediated by B-cells and involve
the generation of antibodies against the hapten or autoantibodies against physiological proteins such
as P450 enzymes. Alternatively, cellular responses may lead to CD8 cytotoxic T-cell activation (Yuan
and Kaplowitz, 2013). CD8 T cells express FasL, TNF-α, and perforin that mediate cell death of
hepatocytes. In addition, necrosis of hepatocytes leads to the activation of innate immune cells to
produce cytokines such as TNF-α, IFN-γ, and IL-1 (Yuan and Kaplowitz, 2013). This results in
inflammation (hepatitis). Hence, although the liver is known as a site of immune tolerance (Crispe
2014), the immune system can play an important role in different mechanisms of DILI.
1.2.2.3 Mitochondrial toxicity
Mitochondria are the most abundant organelles in the liver (Kaplowitz and DeLeve, 2013). The main
function of hepatic mitochondria is oxidative phosphorylation to generate ATP. For this, pyruvate
produced by glycolysis, acyl-CoA resulting from beta-oxidation of fatty acids and amino acids
obtained from the protein catabolism are oxidized through the citric acid cycle to yield NADH and
FADH2. The flow of electrons from NADH, through protein complexes in the mitochondrial
membrane, generates a proton gradient that leads to the synthesis of ATP during oxidative
phosphorylation. Mechanisms impairing mitochondrial function include inhibition of beta oxidation
of fatty acids (e.g. amiodarone, valproate) leading to fatty liver (steatosis) (Amacher and Chalasani,
2014), inhibition of oxidative phosphorylation (e.g. by NSAIDs such as nimesulide), depletion of
mitochondrial DNA and promotion of permeabilization of the inner mitochondrial membrane (e.g.
Introduction 30
troglitazone) (Labbe et al., 2008; Masubuchi et al., 2006). The impaired ability of mitochondria to
generate ATP could be implicated in the functional suppression of ABC-transporters during
cholestasis (Masubuchi et al., 2006).
1.2.2.4 Interactions with/Inhibition of hepatic transporters
Bile formation is a fundamental function of the liver. Failure of bile secretion or flow due to an
obstruction of the bile ducts or an impairment of uptake or efflux processes mediated by the
hepatocytes is a pathophysiologic process named cholestasis (Jaeschke et al., 2002; Roth and Ganey,
2010). Direct or indirect inhibition of hepatobiliary transporter proteins by parent drugs or
metabolites underlie these reactions (Pauli-Magnus and Meier, 2006). Certain drugs may either
directly inhibit transport proteins by non-competitive or by competitive (substrates of transport
proteins) interactions. Alternatively, hepatobiliary transporters may be indirectly inhibited for
example by downregulation of their expression. Retention of bile constituents such as bile salts within
the hepatocytes by inhibition of BSEP by drugs is an example for such a reaction. Cyclosporin A,
rifampicin, bosentan and glibenclamide are examples of drugs that are competitive inhibitors of
human BSEP and that lead to increased intracellular levels of bile salts within the hepatocytes
(Stieger, 2010). Elevated concentrations of bile salts trigger translocation of intracellular Fas bearing
vesicles to the plasma membrane where they self-aggregate (Jaeschke et al., 2002). Activated Fas
receptors complex on the plasma membrane causing caspase 8 activation and thus apoptosis
(Jaeschke et al., 2002). Alternatively, bile salts may activate pro-apoptotic kinases (PKC-δ and
JNK1/2) (Jaeschke et al., 2002). Consistent with the important role of BSEP in drug-induced
cholestasis, most drugs implicated in cholestatic injury are reported to inhibit BSEP and the list of
BSEP inhibitors is continuously growing (de Lima Toccafondo Vieira and Tagliati, 2014). Moreover,
several variant mutations of BSEP have been identified, of which the V444A polymorphism is
particularly associated with drug-induced cholestasis (Bhamidimarri and Schiff, 2013). Finally,
considering that MDR3 variants are also a susceptibility factor for DILI , that recently MRP4
inhibition has also been associated to DILI (Kock et al., 2014) and that prediction of DILI has been
reported to be improved by considering MRP2, MRP3 and MRP4 as compared to BSEP alone
(Morgan et al., 2013) it seems reasonable to believe that the role of transporters in the development of
DILI is even more important than what it has been thought.

Introduction 31
1.2.3 Tools for the identification of drugs with cholestatic potential
A better understanding and prediction of drug transporters interactions is crucial to design and
develop safer drugs. Therefore, several in vitro and in vivo models have been developed to assess
inhibition of transporters by drugs. In vivo models are mainly used in drug development to ensure that
drugs which enter clinical trials do not cause dose-dependent liver injury in humans, but they are of
limited value for the clarification of the mechanisms underlying rare idiosyncratic DILI (Greer et al.,
2010). This is due to several reasons, including: 1) their complexity: generally, if several mechanisms
or transporters are involved in the development of the liver injury it can be difficult to assess the
individual contribution of each one in an organism model. 2) Compensatory mechanisms can be
activated: for example, in genetically modified animals, loss of function of one transporter may result
in compensatory changes in other pathways (Yang et al., 2016). 3) Finally, there can be important
differences between human and animal homolog proteins: for example, expression levels, or
characteristics such as affinity to a drug or substrate can be very different. Therefore, in vitro assays
have been established to investigate drug transporter interactions. In vitro models are fast,
reproducible (de Lima Toccafondo Vieira and Tagliati, 2014), are well controlled and simplified
model systems, and can be used also in high-throughput screenings. The types of in vitro models that
have been developed include vesicle-based and cell-based models. Membrane vesicles are usually
prepared from organs such as the liver, which naturally expresses the transporters, or from transfected
cell lines such as baculovirus-infected insect cells or mammalian cells (Zhang et al., 2012). Vesicle-
based assays can be used for vesicular transport/uptake assays, where the amount of transported
labelled substrate is quantified, or for ATPase assays, where the amount of hydrolyzed ATP in the
presence of inhibitors or substrates is determined (de Lima Toccafondo Vieira and Tagliati, 2014).
ATPase assays indirectly give information on the nature of the interaction occurring (if inhibitory or
stimulatory) and their use is limited to ATP-dependent transporters. Vesicular transport assays can be
used to measure the transport mediated by both SLC and ABC transporters using labelled substrates.
For example, functional assessment of BSEP inhibition by drugs is commonly performed using
isolated membrane vesicles obtained from cells overexpressing BSEP (Stieger, 2010). This approach
is now widely used to either explain cholestatic events in retrospective (de Lima Toccafondo Vieira
and Tagliati, 2014) or to investigate the cholestatic potential of new chemical entities during drug
development (Thompson et al., 2012). Cell-based models include hepatocytes, sandwich cultured
hepatocytes and transfected cell models. Hepatocytes-based models can be especially useful if
contribution of P450-mediated drug metabolism in the development of DILI should be assessed
(Yang et al., 2016; Zhang et al., 2012). On the other hand, transfected cell models can be very
efficient to characterize drug interactions with a transporter, as they generally display a higher signal-
to-noise ratio for the studied transporter. Despite the efficiency of this model to characterize drug
interactions with a transporter and to make qualitative predictions, one should keep in mind that the

Introduction 32
levels of the transfected proteins may be very different from the in vivo situation. Therefore,
extrapolation from in vitro to in vivo should be carefully made. Transfected cell models can be both
non-polarized, e.g. HEK 293 (human embryonic kidney cells) and CHO cells (chinese hamster ovary
cells), or polarized as in the case of Caco-2, LLC-PK1 (pig kidney proximal tubule cells) and MDCK
(Madin-Darby canine kidney cells). An additional cell-based model is represented by Xenopus laevis
oocytes. Non-polarized cell models can be used for uptake assays, where at the end of the assays cells
are lysed and intracellular accumulation of a substrate is determined. Polarized cell models can be
cultured as tight monolayers in the Transwell® system to develop a two-compartment system and
therefore can be used to study transport across monolayers (e.g. mimicking intestinal absorption with
Caco-2 cells). The Transwell® system provides accessibility to both basolateral and apical domains
allowing drug, substrate and acceptor supplementation to both or only one compartment. However,
when polarized cell models are used to study efflux processes, they may require co-expression of
uptake transporters (Zhang et al., 2012). Cell-based models have the advantage over vesicle-based
models that the cells express other enzymes and co-factors that could be important for the function of
the studied transporter. However, as compared to vesicle-based models, cell-based models can be
more susceptible to cytotoxic effects of drugs (therefore it is not always possible to determine IC50
values). In summary, each of the in vitro methods presents its advantages and challenges in predicting
the cholestatic potential of drugs (de Lima Toccafondo Vieira and Tagliati, 2014) and it is very likely
that only a combination of different in vitro methods with in silico approaches and clinical available
data will improve predictability and understanding of complex diseases such as DILI.
33
2 Aims of the work
As outlined in the previous section, in vitro model systems are useful tools to predict and understand
the mechanisms underlying drug hepatotoxicity. Several tools have been already established for SLCs
and ABC transporters as OATPs, NTCP, MDR1, BSEP and MRP2. However, for biliary lipid
transporters, very little has been done. Considering the physiological role of MDR3 in reducing the
toxicity of bile in the bile ducts, and the effect of inherited mutation of MDR3 in patients it is
conceivable that also interactions with MDR3 may play a role in the mechanism underlying DILI.
Therefore, we aimed to: 1) Establish a polarized, in vitro model for canalicular lipid secretion,
expressing human MDR3, BSEP, ABCG5/G8 and NTCP, and displaying vectorial bile salt and lipid
transport in Transwells. Using Transwells we wanted to ensure direct experimental access to both
basolateral as well as apical compartments which allows testing different conditions as well as
preloading of the apical compartment with acceptor proteins to ensure solubility of the translocated
lipids into the apical medium; 2) Develop and validate sensitive and practical assays to measure
phospholipid and cholesterol secretion in the established model. To date MDR3-mediated
phospholipid secretion has been often studied using phospholipid precursors such as radioactively
labelled choline (Yoshikado et al., 2011) or fluorescent labelled diacylglycerol (van Helvoort et al.,
1996). However these approaches are susceptible to alterations of lipid biosynthesis. 3) Investigate
the impact of drugs/compounds on bile salt, phospholipid secretion and clarify whether inhibition of
MDR3 may be a potential mechanism contributing to the toxicity of drugs reported to induce
cholestatic DILI 4) Search in vitro for stimulators of canalicular lipid secretion that may have
beneficial effects on injured bile ducts in vivo.
3 Materials and methods
3.1 Materials
3.1.1 Eukaryotic cell lines
- LLC-PK1, pig kidney epithelial proximal tubule cell line (ATCC, Manassas, VA, USA).
- Caco-2, human colorectal adenocarcinoma cell line (ATCC, Manassas, VA, USA).
3.1.2 Substrates for transport assays
Table 3
Substrates Company and cat. # Conc. used
14C-cholesterol PerkinElmer, NEC018 1 µM, 0.5 µCi/ml
C6-NBD-PC Avanti Polar Lipids, 810130C 12.5 µM
3H-taurocholic acid PerkinElmer, NET322 0.429 µM, 0.2 µCi/ml
Taurocholic acid
Sigma, T4009 9.957 µM
3.1.3 Buffers and solutions for Western blot
- Electrode buffer: 192 mM glycine, 25 mM Trizma® base, 0.1% (w/v) SDS, dH2O
- Transfer buffer: 192 mM glycine, 25 mM Trizma® base, 0.1% (w/v) SDS, 20% (v/v) methanol,
dH2O
- 5x Loading buffer for Western Blot: 220 mM Trizma® base, 22.5 mM EDTA, 9% (w/v) SDS,
1.8 M sucrose, 0.12 mg/ml bromphenolblue, dH2O
- TBS-T: 150 mM NaCl, 0.1% (w/v) Tween 20, dH2O, pH adjusted to 7.6
- Resolving gel: 3.75 ml buffer A, 7.5 ml 30% acrylamide, 300 µl 10% SDS, 9 ml 2 M sucrose, 9
ml dH2O, 23 µl TEMED, 375 µl 25mg/ml APS
- Stacking gel: 1.875 ml buffer B, 1.875 ml 30% acrylamide, 150 µl 10% SDS, 3.75 ml 2 M
sucrose, 7 ml dH2O, 7.5 µl TEMED, 480 µl 25mg/ml APS
- Buffer A for resolving gel: 1M HCl, 3M Trizma® base, dH2O, pH adjusted to 8.9
- Buffer B for stacking gel: 1.75 ml 85% ortho-phosphoric acid, 470 mM Trizma® base, dH2O,
pH adjusted to 6.7

Materials and Methods 35
3.1.4 Tested drugs
Table 4
Substances Company and cat. # Conc. used
Amoxicillin Applichem Pancreac, A7680 300 µM
Bezafibrate Sigma, B7273 200 µM
Boldine Sigma, B3916 Fluka 10 µM
Bupropion Alfa Aesar, J61105 10 µM
Chlorpromazine Sigma, C8138 5 µM
Cyclosporin A Sigma, C1832 1 µM
Clavulanic acid Molekula, 8744048 100 µM
Cynarin Sigma, D8196 100 µM
Fenofibrate Sigma, F6020 200 µM
Fluconazole Sigma, PHR1160 10 µM
Itraconazole Sigma, I6657 10 µM
Ketoconazole Sigma, K1003 10 µM
Luteolin Sigma, L9283 10 µM
Nefadozone Alfa Aesar, J62793 10 µM
Octreotide Abbiotec, 350305 25 µM
Olanzapine Sigma, O1141 10 µM
Posaconazole Sigma, 32103 10 µM
PSC833 Tocris, 4042 4 µM
Verapamil Sigma, V4629 10 µM
Voriconazole Sigma, PZ0005 10 µM

Materials and Methods 36
3.1.5 Primary antibodies
Table 5
Antibodies Supplier and cat. # Host Clone Dilution*
α-ABCG5 Abcam, ab124965 rabbit monoclonal 1:1000 WB
α-alpha 1 Na-K-ATPase Abcam, ab7671 mouse monoclonal 1:100 IF
K36, α-hABCG8 Own lab rabbit polyclonal 1:2000 WB
K37, α-hBSEP Own lab rabbit polyclonal 1:500 WB
1:35 IF
K9, α-hNTCP Own lab rabbit polyclonal 1:1000 WB
1:300 IF
P-glycoprotein (P3II-26),
α-hMDR3 Enzo, ALX-801-028 mouse monoclonal
1:600 WB
1:35 IF
Pan Actin (ACTN05 C4) NeoMarkers, MA5-11869 mouse monoclonal 1:1600 WB
P-glycoprotein (C219), α-MDR1/3 Enzo, ALX-801-002 mouse monoclonal 1:100 WB
P-glycoprotein (C494), α-hMDR1 Enzo, ALX-801-003 mouse monoclonal 1:100 WB
*Dilutions are shown for immunofluorescence (IF) or Western Blotting (WB).
3.1.6 Secondary antibodies
Table 6
Antibodies Supplier and cat. # Host Clone Dilution*
Alexa Fluor® 488 conjugate
α-rabbit Life technologies, A11008 goat polyclonal 1:300 IF
Alexa Fluor® 568 conjugate
α-mouse Life technologies, A-11004 goat polyclonal 1:300 IF
ECL α-mouse IgG horseradish
peroxidase GE Healthcare, NA931V sheep polyclonal 1:3000 WB
Goat α-rabbit IgG horseradish
peroxidase GE Healthcare, RPN4301 goat 1:30000 WB
*Dilutions are shown for immunofluorescence (IF) or Western Blotting (WB).

Materials and Methods 37
3.2 Methods
3.2.1 Maintenance of LLC-PK1 cells
Wild type and stably transfected LLC-PK1 cell lines were already available in the laboratory of
Clinical Pharmacology and Toxicology at the start of the project. Transfection of the cell lines has
been described in our recent publication (Mahdi et al., 2016). LLC-PK1 cell lines (WT: wild type;
BN: NCTP, BSEP; BNMG: NCTP, BSEP, MDR3 and ABCG5/G8) were cultured in high glucose
(4.5g/L) Dulbecco's modified eagle's medium or DMEM (cat.# 21969035, Gibco, Paisley, UK),
supplemented with 5% (v/v) fetal calf serum or FCS of US origin (cat.# 26140079, Gibco, Paisley,
UK), 100 Units/ml penicillin, 100 µg/ml streptomycin (cat.# 15140122, Gibco, Grand Island, NY,
USA) and 2 mM L-glutamine (cat.# 25030024, Gibco, Paisley, UK) at 37°C in a 5% CO2 humidified
atmosphere. The medium of the transfected control cell line, BN, was additionally supplemented with
700 µg/ml geneticin sulfate G418 (cat.# 11811031, Gibco, Grand Island, NY, USA) and 2 µg/ml
puromycin (cat.# P7255, Sigma, MO, USA). The medium of the multi-transfected model cell line,
BNMG, was additionally supplemented with 700 µg/ml geneticin sulfate G418, 400 µg/ml
hygromycin B (cat.#14816600, Boehringer Ingelheim, Mannheim, Germany), 2 µg/ml puromycin and
20 µg/ml zeocin (cat.# 460509, Invitrogen, Carlsbad, CA, USA). Cells were passaged twice per week
once they reached 80% to 100% confluency in 10 cm cell dishes. To split cells, the growth medium
was removed and cells were washed once with 1x Dulbecco's Phosphate-Buffered Saline or PBS
(cat.# 14200067, Gibco, Paisley, UK) at room temperature. 1 ml trypsin-EDTA (cat.# 25300062,
Paisley, UK) was added and quickly removed. Cells were detached by adding 3 ml trypsin-EDTA and
incubating for 5 min, at 37°C. To stop the enzymatic reaction, 7 ml complete/standard growth
medium were added to the trypsin buffer. Cells were split at ratios ranging between 1:5 to 1:15 (WT:
1:10-1:15, BN and BNMG: 1:5-1:10).
3.2.2 Maintenance of Caco-2 cells
Caco-2 cells were cultured in high glucose DMEM (cat.# 11960044, Gibco, Paisley, UK),
supplemented with 5% (v/v) FCS of US origin and 100 Units/ml penicillin and 100 µg/ml
streptomycin. Cells were kept at 37°C in a 5% CO2 humidified atmosphere and passaged twice per
week once they reached 90% confluency.
3.2.3 Freezing and thawing of cells
Cells from an 80 to 100% confluent 10 cm dish were trypsinized and resuspended in
complete/standard growth medium. To remove the medium, cells were centrifuged at 250 g for 5 min
in an Eppendorf Centrifuge 5810R and the supernatant was aspirated using a sterile Pasteur pipette.
The cell pellet was dissolved into 3 ml freezing medium consisting of 20% FCS, 10% DMSO and

Materials and Methods 38
70% standard/complete growth medium and aliquoted into cryotubes (1 ml each). The cryotubes were
stored at -80°C into a freezing container to allow slow freezing. After 2-5 days the cryotubes were
transferred to a liquid nitrogen tank for long term storage.
Cells were quickly thawed by holding a cryotube in a water-bath at 37°C and successively
resuspended in 10 ml pre-warmed medium. The cell suspension was centrifuged at 250 g for 5 min.
and the supernatant was discarded to remove DMSO. Finally the cell pellet was resuspended in 10 ml
complete medium and plated on a 10 cm petri dish. 1 day later the growth medium was replaced to
remove residual DMSO.
3.2.4 Cell counting
10 μl of Trypan Blue stain 0.4% (cat.# T10282, Invitrogen, Eugene, OR, USA) were added to 10 μl of
cell suspension in an Eppendorf tube. After mixing, 10 μl of the sample mixture were pipetted into a
cell counting chamber slide (cat.# C10228, Invitrogen, Eugene, OR, USA). Cells were counted using
the CountessTM automated cell counter (Invitrogen, Eugene, OR, USA).
3.2.5 Culturing LLC-PK1 cells in the Transwell® system
To investigate vectorial transport of lipids and bile salts, LLC-PK1 cells were cultured on 12-wells
Transwell® plates (cat.# 3402, Corning, NY, USA) having polycarbonate membrane inserts with a
pore size of 3 µm. One day before cell seeding, Transwell® inserts were coated with 30 µl of a 1:4
diluted (in 50% ethanol) collagen R (cat.# 47254, SERVA, Heidelberg, Germany) solution and dried
at room temperature. Cells were seeded on Transwell® membrane inserts at densities of 1.5x10⁵ to
2x10⁵ cells/insert and grown for 10-11 days. The medium in both compartments (0.5 ml apical and
1.5 ml basolateral) was carefully replaced every 4 days taking care to not to harm the monolayers of
cells.
3.2.6 Lucifer yellow monolayer integrity test
One day prior performing transport experiments, the integrity of cell monolayers was tested using the
fluorescent compound Lucifer yellow (cat.#80015, Biotium, Hayward, CA, USA) (Stewart, 1978).
Apical and basolateral media were removed and replaced by a 100 µM Lucifer yellow solution (in
DMEM) in the basolateral/donor compartment and DMEM without Lucifer yellow solution in the
apical/acceptor compartment. Transwell® plates were slowly shaken and incubated for 1 h at 37°C in
the cell incubator. 200 µl media aliquots were collected from the apical compartments and the amount
of Lucifer yellow was determined by measuring the fluorescence in a Twinkle LB 970 Microplate
Fluorometer at λex 430 nm, λem 535 nm (Stewart, 1981). Permeability of Lucifer yellow was
calculated as percent of Lucifer yellow in the receiver apical compartment as compared to the control
(well containing only filters with no cell monolayer). Only monolayers with a permeability of less

Materials and Methods 39
than 5% were selected for experiments. After the integrity test, the medium was removed and
replaced with standard culture medium.
3.2.7 3H-taurocholate transport assay
Transport assays using the radioactively labelled bile salt taurocholate were performed to demonstrate
functionality of the bile salts transporters NTCP and BSEP. For this, DMEM solution containing 10
µM taurocholate (final concentration) was prepared by dissolving 3H-taurocholate (at 0.2 µCi/ml) and
unlabeled taurocholate in DMEM and pre-warmed in a water bath at 37°C. After removing the
standard growth medium in both compartments, the taurocholate containing DMEM was added either
to the basolateral or to the apical compartment and pre-warmed serum free DMEM was added to the
corresponding opposite/acceptor compartment. After 10, 20 and 30 min 50 µl aliquots were collected
from the acceptor compartments and transferred to scintillation vials. Moreover, to assess intracellular
accumulation of taurocholate, 50 µl aliquots of the solubilized monolayers (as described below) were
also transferred to scintillation vials. To each vial 4 ml of Filter-count liquid scintillation cocktail was
added. Radioactivity in the aliquots of medium or solubilized monolayers was determined by liquid
scintillation counting using a Canberra Packard Tri-Carb 2250CA liquid scintillation analyzer.
3.2.8 Testing the effect of drugs on the bile salts transporters, BSEP and NTCP
Overnight treatment of cell monolayers with drugs (10 µM azoles or 4 µM PSC833) was followed by
a taurocholate transport assay from the basolateral to the apical compartment (as previously
described). Cell monolayers were treated for 24 h with the drugs added to both compartments before
performing the taurocholate transport assay. Aliquots from both the apical medium and cell lysates
were analyzed for amount of 3H-taurocholate.
3.2.9 Cholesterol efflux assay
DMEM containing 1 µM 14C-cholesterol (0.5 µCi/ml) and 1 mM taurocholate and DMEM containing
50 mg/ml fatty acid free albumin were prepared and pre-warmed in a water bath at 37°C. Apical and
basolateral culture media were removed and replaced by 1.5 ml DMEM containing the radiolabeled
cholesterol in the basolateral/donor compartment and 0.5 ml DMEM containing 50 mg/ml fatty acid-
free bovine serum albumin in the apical/acceptor compartment to stimulate lipid efflux. After 24 h 50
µl aliquots were collected from the apical compartments and transferred to scintillation vials. To each
vial 3 ml of Filter-count liquid scintillation cocktail was added. Radioactivity in the aliquots of
medium or solubilized monolayers was determined by liquid scintillation counting using a Canberra
Packard Tri-Carb 2250CA liquid scintillation analyzer.
Materials and Methods 40
3.2.10 Phosphatidylcholine efflux assay
In order to check for functionality of MDR3, phosphatidylcholine efflux assays were performed. For
these, apical and basolateral culture media were removed and replaced by 1.5 ml DMEM containing 1
mM taurocholate in the basolateral/donor compartment, to mimic the physiological situation, and 0.5
ml DMEM containing 50 mg/ml fatty acid-free bovine serum albumin (cat.# A6003, Sigma, MO,
USA) in the apical/acceptor compartment to ensure solubility of the translocated lipids. After 24 h the
apical medium was collected and lipids were extracted (as described below). Extracted lipids were
loaded on HPTLC Silica gel plates and separated by Thin-Layer-Chromatography (TLC).
3.2.11 Lipid extraction
Lipids were extracted according to the Bligh and Dyer method (Bligh and Dyer, 1959) using a
chloroform/methanol/water ratio of 1:2:0.8. 400 µl of apical medium samples were pipetted in
extraction glass tubes and 1.5 ml methanol/chloroform 2:1 ml was added to each sample. After
shaking 20 min at 350 rpm and room temperature, samples were transferred to clean glass tubes to
remove precipitated proteins. Subsequently, 0.5 ml 0.1 M KCl was added to each tube and tubes were
shortly vortexed. Next, tubes were centrifuged 5 min at 3000 rpm (1810 g) in an Eppendorf
Centrifuge 5810R to separate the phases. After centrifugation two phases, the lower corresponding to
the chloroform-lipid phase and the upper corresponding to the methanol-water phase were clearly
visible.
For analysis of secreted phosphatidylcholine by TLC the upper phase was discarded, the lower-lipid
phase was evaporated using Nitrogen gassing in a warming block at 37°C and lipids were
resuspended in 125 µl chloroform. Samples were aliquoted in glass vials and stored at -20°C. For
analysis of secreted C6-NBD-PC 300 µl of the lower-lipid phase were directly used for assessing C6-
NBD-PC content by measuring fluorescence.
3.2.12 Lipid analysis by Thin-Layer-Chromatography
For analysis of the phospholipid or cholesterol content in the apical medium, extracted lipids were
loaded on HPTLC Silica gel 60 plates with concentrating zone (cat.# 113749, Merck KGaA,
Darmstadt, Germany) using an automated Camag TLC sampler ATS4 and separated by one-
dimensional Thin-Layer-Chromatography (TLC) as previously described (Gerloff et al., 1998). 30 ml
eluting solvent composed either of methylacetate, 1-propanol, chloroform, methanol and 0.5%
potassium chloride in a 25:25:25:10:9 (v/v) ratio for phospholipids, or of n-hexane, n-heptan,
diethylether and acetic acid in a 63:18.5:18.5:1 (v/v) ratio for the analysis of cholesterol, was poured
in a twin trough chamber (10 ml in the front and 20 ml in the back). A saturation pad was placed in
the back and the chamber was closed and saturated for 15 min. Next, the TLC plate was carefully
placed in the chamber with the solvent level below the level of the loaded samples. The plate was
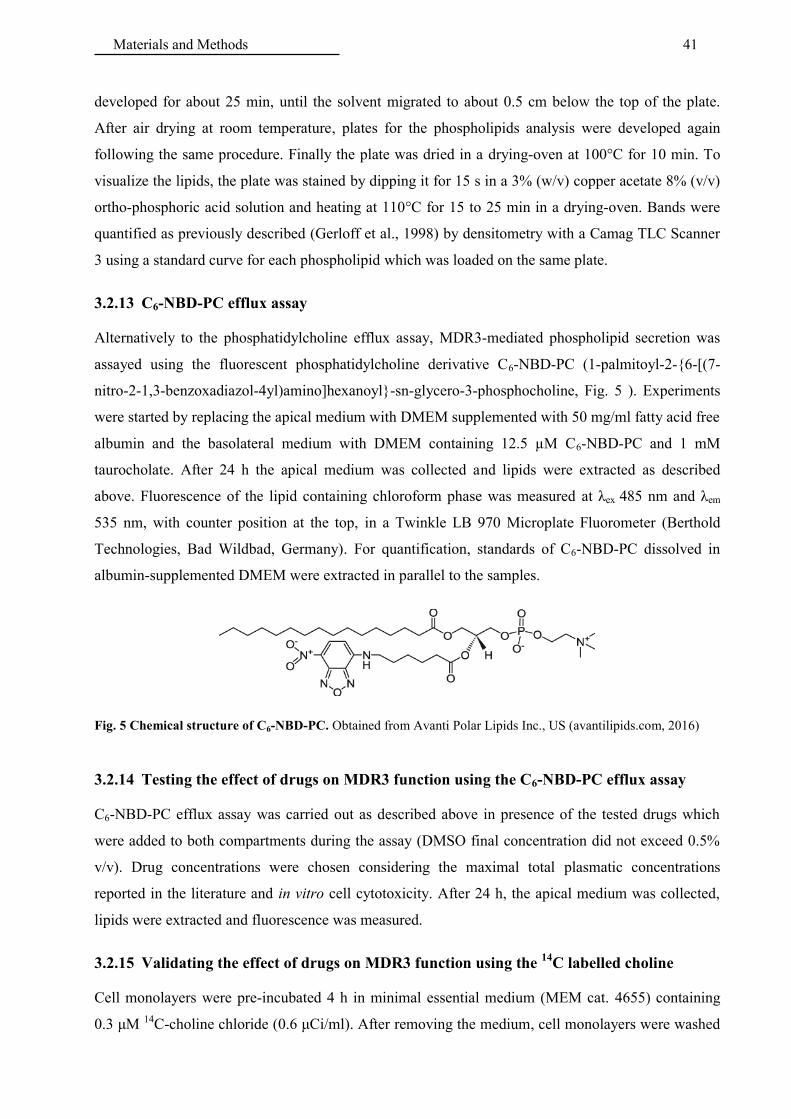
Materials and Methods 41
developed for about 25 min, until the solvent migrated to about 0.5 cm below the top of the plate.
After air drying at room temperature, plates for the phospholipids analysis were developed again
following the same procedure. Finally the plate was dried in a drying-oven at 100°C for 10 min. To
visualize the lipids, the plate was stained by dipping it for 15 s in a 3% (w/v) copper acetate 8% (v/v)
ortho-phosphoric acid solution and heating at 110°C for 15 to 25 min in a drying-oven. Bands were
quantified as previously described (Gerloff et al., 1998) by densitometry with a Camag TLC Scanner
3 using a standard curve for each phospholipid which was loaded on the same plate.
3.2.13 C6-NBD-PC efflux assay
Alternatively to the phosphatidylcholine efflux assay, MDR3-mediated phospholipid secretion was
assayed using the fluorescent phosphatidylcholine derivative C6-NBD-PC (1-palmitoyl-2-{6-[(7-
nitro-2-1,3-benzoxadiazol-4yl)amino]hexanoyl}-sn-glycero-3-phosphocholine, Fig. 5 ). Experiments
were started by replacing the apical medium with DMEM supplemented with 50 mg/ml fatty acid free
albumin and the basolateral medium with DMEM containing 12.5 µM C6-NBD-PC and 1 mM
taurocholate. After 24 h the apical medium was collected and lipids were extracted as described
above. Fluorescence of the lipid containing chloroform phase was measured at λex 485 nm and λem
535 nm, with counter position at the top, in a Twinkle LB 970 Microplate Fluorometer (Berthold
Technologies, Bad Wildbad, Germany). For quantification, standards of C6-NBD-PC dissolved in
albumin-supplemented DMEM were extracted in parallel to the samples.
Fig. 5 Chemical structure of C6-NBD-PC. Obtained from Avanti Polar Lipids Inc., US (avantilipids.com, 2016)
3.2.14 Testing the effect of drugs on MDR3 function using the C6-NBD-PC efflux assay
C6-NBD-PC efflux assay was carried out as described above in presence of the tested drugs which
were added to both compartments during the assay (DMSO final concentration did not exceed 0.5%
v/v). Drug concentrations were chosen considering the maximal total plasmatic concentrations
reported in the literature and in vitro cell cytotoxicity. After 24 h, the apical medium was collected,
lipids were extracted and fluorescence was measured.
3.2.15 Validating the effect of drugs on MDR3 function using the 14
C labelled choline
Cell monolayers were pre-incubated 4 h in minimal essential medium (MEM cat. 4655) containing
0.3 μM 14C-choline chloride (0.6 μCi/ml). After removing the medium, cell monolayers were washed

Materials and Methods 42
once with 1xPBS and incubated overnight in DMEM containing 1 mM taurocholate in the basolateral
compartment and DMEM containing 50 mg/ml fatty acid free albumin in the apical compartment.
The tested drug was added to both compartments (2 or 10 μM itraconazole). After overnight
incubation (10 h) the apical medium was extracted and the lipid phase was loaded on a HPTLC plate
and developed as previously described for the phospholipids. To visualize the radioactively labelled
phospholipids secreted in the apical compartment (14C-PC), an X-ray film was exposed to the HPTLC
plate in a tight, dark cassette for 8 days. The film was developed using a medical film processor
(Fujifilm). Finally to visualize all the phospholipids, including the standards, on plate, the HPLTC
plate was stained as described before by dipping in a 3% (w/v) copper acetate 8% (v/v) ortho-
phosphoric acid solution and heating for 15 to 25 min at 110°C in a drying-oven.
3.2.16 Cytotoxicity assay
Potential cytotoxicity of the drugs used was checked by measuring LDH release in the apical and
basolateral medium. This was performed 24 h after drug supplementation using a CytoTox96 Non-
Radioactive Assay Kit (cat.# G1780, Promega, Madison, WI, USA). 50 μl of basolateral, apical
medium and the cell lysate were pipetted into a well of a 96-well plate. As the LDH amount is
proportional to the amount of cells, the LDH released in the medium was normalized to the LDH in
the corresponding lysate. To each well 50 μl of reconstituted substrate mix were added. The plate was
incubated for 30 min at room temperature in the dark. Finally, 50 μl stop solution were pipetted to
each well and absorption at 490 nm was measured using a Bio-Rad Ultramark Microplate Reader.
3.2.17 Solubilization of cell monolayers
Transport assays were normalized to the amount of protein per monolayer. To solubilize cell
monolayers for protein determination, Transwell® filters were rinsed with PBS, cut out of the
Transwell® insert using a scalpel and transferred to labelled Eppendorf tubes containing 200 µl 1%
(w/v) Triton X-100 on ice. To detach the cells from the filters, the tubes were centrifuged at 4°C at
full speed for 40 min. in an Eppendorf Centrifuge 5417R (Hamburg, Germany).
3.2.18 Protein determination
The protein amount was determined by the bicinchinonic acid method (Smith et al., 1985) using the
BCA protein assay kit (Interchim, Montluçon, France). 25 µl of cell lysate was transferred to a 96-
well microplate and diluted with 25 µl of distilled water. In parallel, 25 µl of bovine serum albumin
standards (0, 0.025, 0.125, 0.25, 0.5, 0.75, 1, 1.5 mg/ml in water) were transferred on the same plate
and diluted with 25 µl of sample’s solvent (1% Triton X-100). 200 µl of a BCA kit reagent solution
was prepared and added to each well. After 30 min. incubation of the plate at 37°C, absorption at 550
nm was measured in a Bio-Rad Ultramark Microplate Reader (Hercules, CA, USA).
Materials and Methods 43
3.2.19 Isolation of cell membranes
To isolate the total membrane fraction of WT, BNMG and Caco-2 cells, 10 cm cell dishes at 100%
confluency were rinsed three times with 10 ml 0.9 % (w/v) NaCl and once with 10 ml 250 mM
sucrose. After completely aspirating the 250 mM sucrose solution, 3 ml of ice cold 5 mM sucrose
solution containing 5 mM PMSF and 1 g/ml antipain/leupeptin (protease inhibitors) was/were added
to each dish and cells were scraped with a rubber policeman. All the following steps were conducted
at 4°C to avoid protein degradation. The cell suspension was transferred into a tight fitting glass-
teflon potter on ice. Residual cells were collected by rinsing the dish again with 1 ml, 250 mM
sucrose and transferring the rinse to the suspension in the glass-teflon potter. The cell suspension in
the glass-teflon potter was homogenized with 20 strokes at full speed with a machine driven pestle.
The cell homogenate was transferred in the appropriate centrifuge tubes and centrifuged for 10 min at
2950 rpm (900 g) in a Sorvall RC5C centrifuge with a SS34 rotor. The resulting supernatant was
transferred to clean tubes and centrifuged again for 20 min at 9600 rpm (8500 g). Next, the resulting
supernatant was transferred to clean tubes and centrifuged for 1 h at 4°C at 38’200 rpm (100’000 g) in
a Centrikon T-1170 ultracentrifuge with a TFT 65.13 rotor. Finally, the supernatant was discarded
and the pellet was resuspended in 100 to 200 µl 250 mM sucrose using a 1 ml syringe with a thin
needle. Protein concentration of the isolated membranes was determined with the BCA assay. Isolated
membranes were stored at -80°C.
3.2.20 Western Blotting
To analyze protein samples by Western Blotting, proteins were separated by size using sodium
dodecyl sulfate polyacrylamide gel electrophoresis (SDS-PAGE). Isolated membranes or whole cell
lysates (of Transwell® monolayers or cells grown on 10 cm dishes) were denatured by adding 5X
SDS loading buffer containing freshly added 15mg/ml DTT and incubating the samples for 20 min at
40°C. The samples were then loaded on a 7.5% SDS-PAGE maxi-gel. In order to compare protein
expression levels, the same amount of protein was loaded for all samples on the same gel (60 to 100
µg/lane). The proteins were separated overnight in BioRad PROTEAN II xi Cell applying a potential
of 6 mA per gel. Next, the separated proteins were transferred to a nitrocellulose membrane. For
transferring the proteins, a cassette was assembled with sponges outside, followed by three Whatman
papers and a nitrocellulose membrane and the SDS-PAGE gel in the middle (sandwich). Sponges,
papers, and membrane were all pre-soaked in transfer buffer. The transfer was performed in a BioRad
Trans-Blot® Cell filled with transfer buffer at an applied current of 300 mA for 4 h. Membranes were
blocked 1 h in 5% (w/v) milk-TBS-T and then probed for human MDR3, BSEP, NTCP, ABCG5/G8,
porcine MDR1 and actin by incubation for 2 h at room temperature with the appropriate first antibody
diluted in 5% (w/v) milk-TBS-T. After washing three times in TBS-T for 10 min, blots were
incubated for 1 h at room temperature with the appropriate secondary antibody, either an anti-mouse
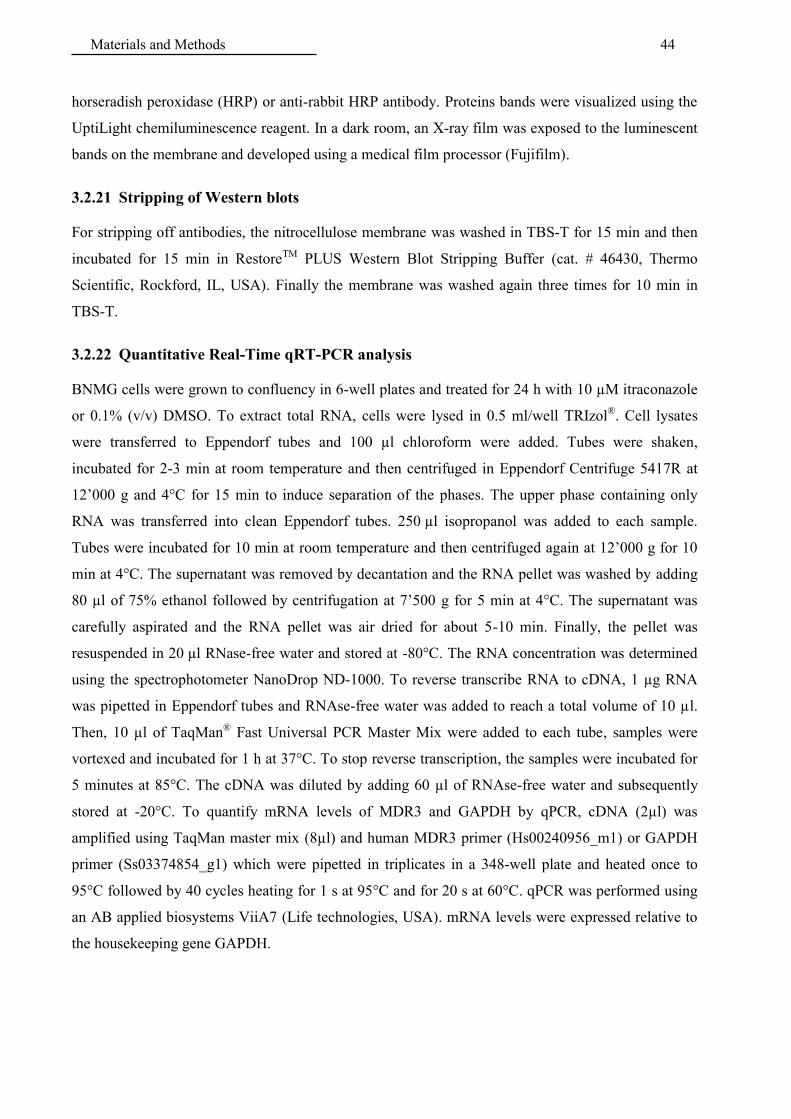
Materials and Methods 44
horseradish peroxidase (HRP) or anti-rabbit HRP antibody. Proteins bands were visualized using the
UptiLight chemiluminescence reagent. In a dark room, an X-ray film was exposed to the luminescent
bands on the membrane and developed using a medical film processor (Fujifilm).
3.2.21 Stripping of Western blots
For stripping off antibodies, the nitrocellulose membrane was washed in TBS-T for 15 min and then
incubated for 15 min in RestoreTM PLUS Western Blot Stripping Buffer (cat. # 46430, Thermo
Scientific, Rockford, IL, USA). Finally the membrane was washed again three times for 10 min in
TBS-T.
3.2.22 Quantitative Real-Time qRT-PCR analysis
BNMG cells were grown to confluency in 6-well plates and treated for 24 h with 10 µM itraconazole
or 0.1% (v/v) DMSO. To extract total RNA, cells were lysed in 0.5 ml/well TRIzol®. Cell lysates
were transferred to Eppendorf tubes and 100 µl chloroform were added. Tubes were shaken,
incubated for 2-3 min at room temperature and then centrifuged in Eppendorf Centrifuge 5417R at
12’000 g and 4°C for 15 min to induce separation of the phases. The upper phase containing only
RNA was transferred into clean Eppendorf tubes. 250 µl isopropanol was added to each sample.
Tubes were incubated for 10 min at room temperature and then centrifuged again at 12’000 g for 10
min at 4°C. The supernatant was removed by decantation and the RNA pellet was washed by adding
80 µl of 75% ethanol followed by centrifugation at 7’500 g for 5 min at 4°C. The supernatant was
carefully aspirated and the RNA pellet was air dried for about 5-10 min. Finally, the pellet was
resuspended in 20 µl RNase-free water and stored at -80°C. The RNA concentration was determined
using the spectrophotometer NanoDrop ND-1000. To reverse transcribe RNA to cDNA, 1 µg RNA
was pipetted in Eppendorf tubes and RNAse-free water was added to reach a total volume of 10 µl.
Then, 10 µl of TaqMan® Fast Universal PCR Master Mix were added to each tube, samples were
vortexed and incubated for 1 h at 37°C. To stop reverse transcription, the samples were incubated for
5 minutes at 85°C. The cDNA was diluted by adding 60 µl of RNAse-free water and subsequently
stored at -20°C. To quantify mRNA levels of MDR3 and GAPDH by qPCR, cDNA (2µl) was
amplified using TaqMan master mix (8µl) and human MDR3 primer (Hs00240956_m1) or GAPDH
primer (Ss03374854_g1) which were pipetted in triplicates in a 348-well plate and heated once to
95°C followed by 40 cycles heating for 1 s at 95°C and for 20 s at 60°C. qPCR was performed using
an AB applied biosystems ViiA7 (Life technologies, USA). mRNA levels were expressed relative to
the housekeeping gene GAPDH.
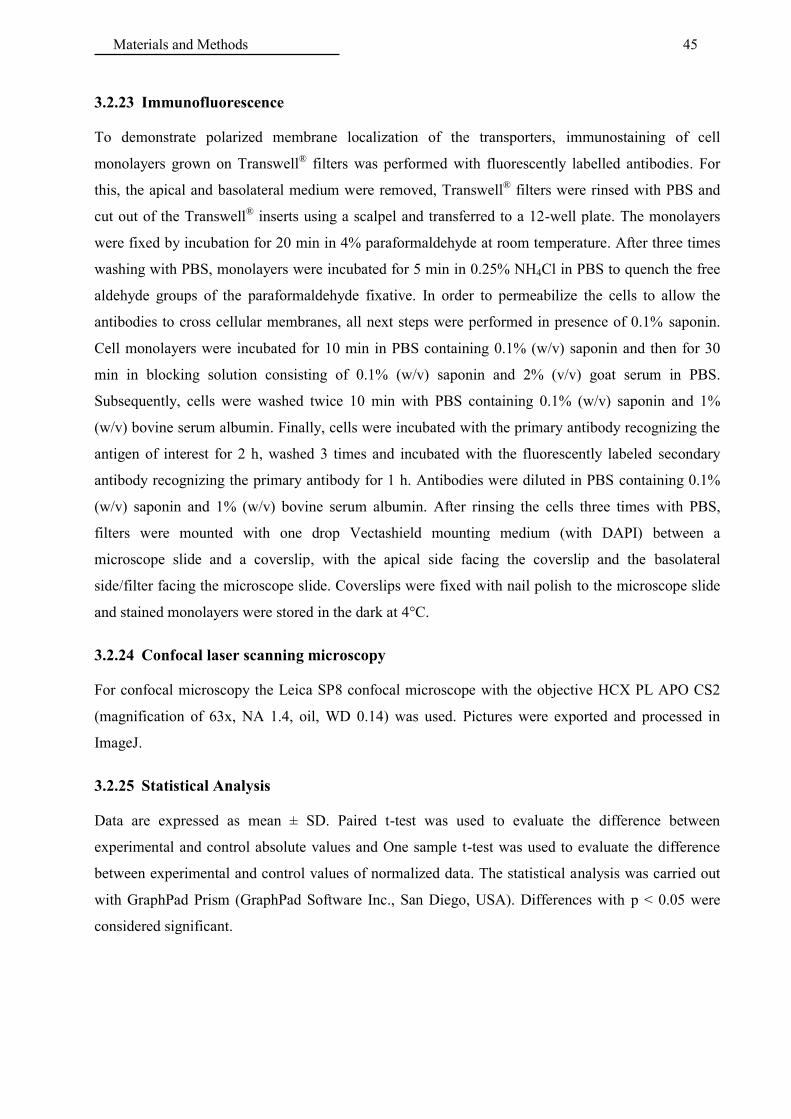
Materials and Methods 45
3.2.23 Immunofluorescence
To demonstrate polarized membrane localization of the transporters, immunostaining of cell
monolayers grown on Transwell® filters was performed with fluorescently labelled antibodies. For
this, the apical and basolateral medium were removed, Transwell® filters were rinsed with PBS and
cut out of the Transwell® inserts using a scalpel and transferred to a 12-well plate. The monolayers
were fixed by incubation for 20 min in 4% paraformaldehyde at room temperature. After three times
washing with PBS, monolayers were incubated for 5 min in 0.25% NH4Cl in PBS to quench the free
aldehyde groups of the paraformaldehyde fixative. In order to permeabilize the cells to allow the
antibodies to cross cellular membranes, all next steps were performed in presence of 0.1% saponin.
Cell monolayers were incubated for 10 min in PBS containing 0.1% (w/v) saponin and then for 30
min in blocking solution consisting of 0.1% (w/v) saponin and 2% (v/v) goat serum in PBS.
Subsequently, cells were washed twice 10 min with PBS containing 0.1% (w/v) saponin and 1%
(w/v) bovine serum albumin. Finally, cells were incubated with the primary antibody recognizing the
antigen of interest for 2 h, washed 3 times and incubated with the fluorescently labeled secondary
antibody recognizing the primary antibody for 1 h. Antibodies were diluted in PBS containing 0.1%
(w/v) saponin and 1% (w/v) bovine serum albumin. After rinsing the cells three times with PBS,
filters were mounted with one drop Vectashield mounting medium (with DAPI) between a
microscope slide and a coverslip, with the apical side facing the coverslip and the basolateral
side/filter facing the microscope slide. Coverslips were fixed with nail polish to the microscope slide
and stained monolayers were stored in the dark at 4°C.
3.2.24 Confocal laser scanning microscopy
For confocal microscopy the Leica SP8 confocal microscope with the objective HCX PL APO CS2
(magnification of 63x, NA 1.4, oil, WD 0.14) was used. Pictures were exported and processed in
ImageJ.
3.2.25 Statistical Analysis
Data are expressed as mean ± SD. Paired t-test was used to evaluate the difference between
experimental and control absolute values and One sample t-test was used to evaluate the difference
between experimental and control values of normalized data. The statistical analysis was carried out
with GraphPad Prism (GraphPad Software Inc., San Diego, USA). Differences with p < 0.05 were
considered significant.

4 Results
4.1 Characterization of a model cell line for biliary lipid secretion
In the first part of this project, the model LLC-PK1 cell line stably transfected with NTCP, BSEP,
MDR3 and ABCG5/G8, all under a constitutive CMV promoter was characterized. This cell line was
named BNMG and expression and function of the respective transporters were tested using various
assays.
4.1.1 Western blot analysis of cell lines
Expression of the transfected transporters in BNMG cells was assessed by Western Blotting Fig. 6).
NTCP, BSEP, MDR3 and ABCG8, as well as ABCG5 were detected in BNMG cells, but not in WT
cells. In the BN control cell line (stably transfected with BSEP and NTCP) only BSEP and NTCP
were detected.
Fig. 6 Western blot analysis of LLC-PK1 cell lines. Presence of (A) NTCP, (B) BSEP, (C) MDR3, (D) ABCG8;
(E) ABCG5 in BNMG cells was assessed by Western Blotting. In (A) to (D) lanes were loaded with 75 µg protein of
WT: wild type cells, BN: control cell line transfected with NTCP and BSEP and BNMG: model cell line transfected
with NTCP, BSEP, MDR3 and ABCG5/G8 total cell lysates. In (E) lanes were loaded with 70 µg of a total
membrane fraction isolated from WT, BNMG or Caco-2 cells.
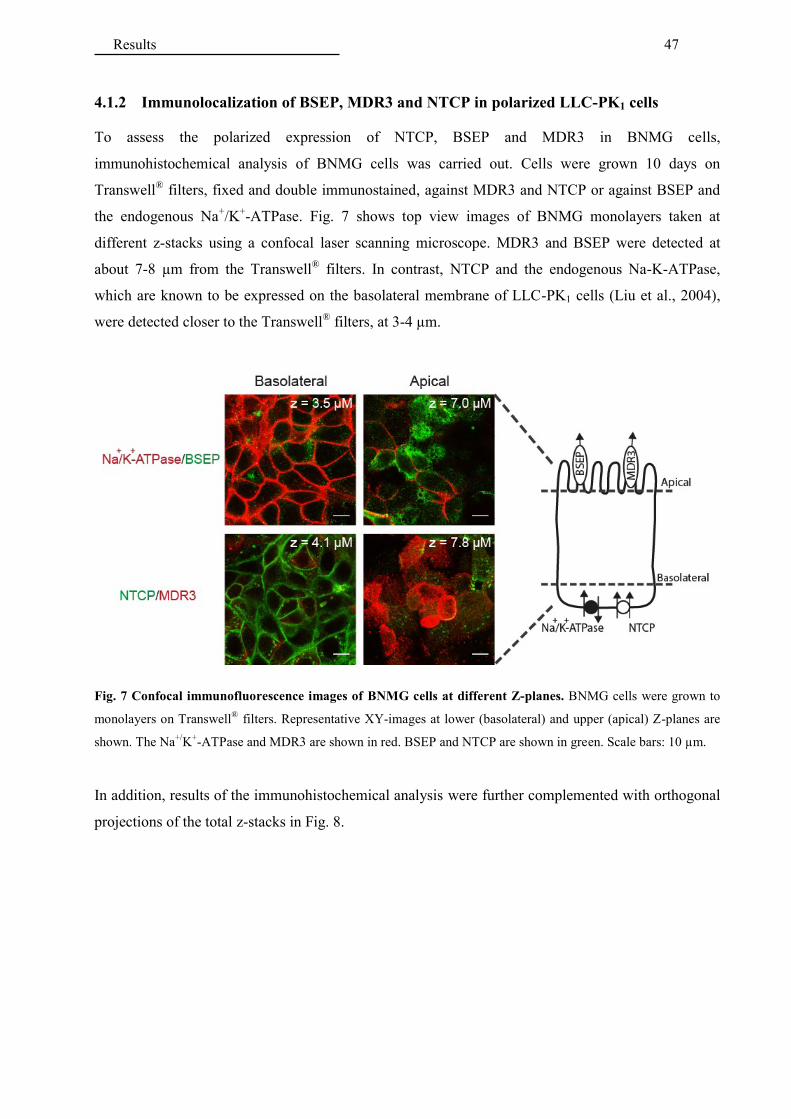
Results 47
4.1.2 Immunolocalization of BSEP, MDR3 and NTCP in polarized LLC-PK1 cells
To assess the polarized expression of NTCP, BSEP and MDR3 in BNMG cells,
immunohistochemical analysis of BNMG cells was carried out. Cells were grown 10 days on
Transwell® filters, fixed and double immunostained, against MDR3 and NTCP or against BSEP and
the endogenous Na+/K+-ATPase. Fig. 7 shows top view images of BNMG monolayers taken at
different z-stacks using a confocal laser scanning microscope. MDR3 and BSEP were detected at
about 7-8 µm from the Transwell® filters. In contrast, NTCP and the endogenous Na-K-ATPase,
which are known to be expressed on the basolateral membrane of LLC-PK1 cells (Liu et al., 2004),
were detected closer to the Transwell® filters, at 3-4 µm.
Fig. 7 Confocal immunofluorescence images of BNMG cells at different Z-planes. BNMG cells were grown to
monolayers on Transwell®
filters. Representative XY-images at lower (basolateral) and upper (apical) Z-planes are
shown. The Na+/
K+-ATPase and MDR3 are shown in red. BSEP and NTCP are shown in green. Scale bars: 10 µm.
In addition, results of the immunohistochemical analysis were further complemented with orthogonal
projections of the total z-stacks in Fig. 8.
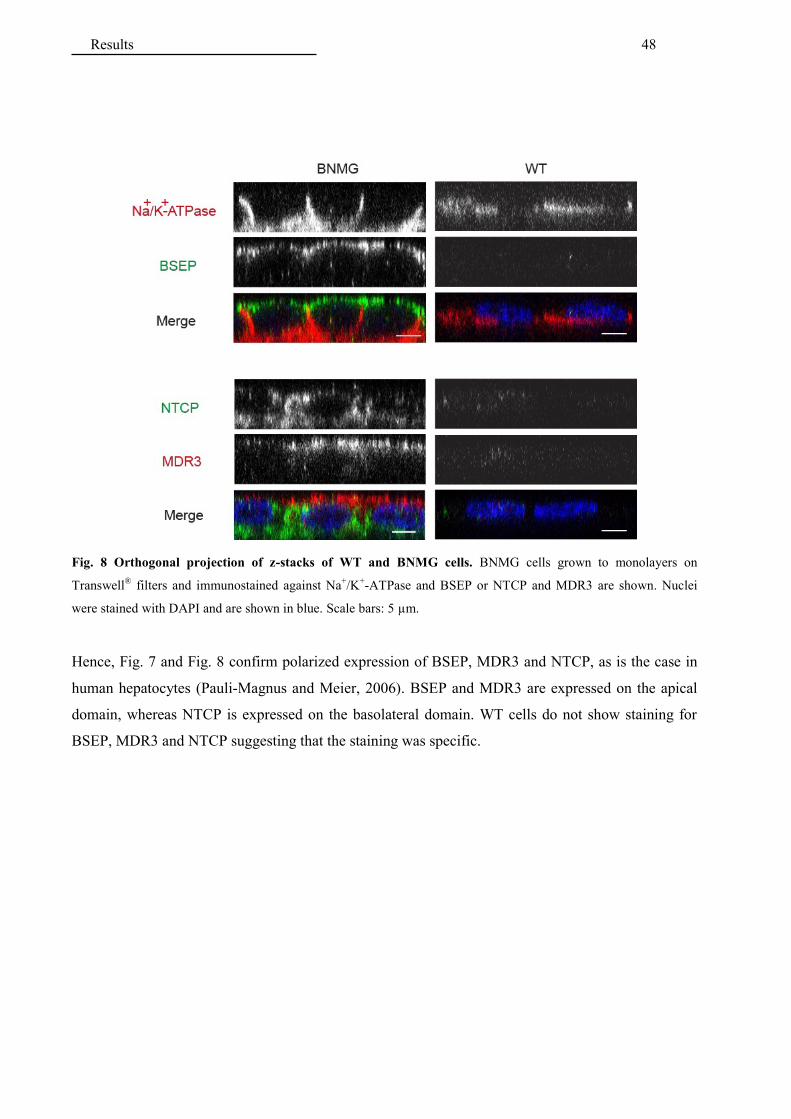
Results 48
Fig. 8 Orthogonal projection of z-stacks of WT and BNMG cells. BNMG cells grown to monolayers on
Transwell® filters and immunostained against Na
+/K
+-ATPase and BSEP or NTCP and MDR3 are shown. Nuclei
were stained with DAPI and are shown in blue. Scale bars: 5 µm.
Hence, Fig. 7 and Fig. 8 confirm polarized expression of BSEP, MDR3 and NTCP, as is the case in
human hepatocytes (Pauli-Magnus and Meier, 2006). BSEP and MDR3 are expressed on the apical
domain, whereas NTCP is expressed on the basolateral domain. WT cells do not show staining for
BSEP, MDR3 and NTCP suggesting that the staining was specific.

Results 49
4.1.3 Assessment of integrity of the monolayers
To assess protein-mediated transport across cell monolayers, an important prerequisite is that the
monolayers are tight; otherwise leakage would confound the measurements. Integrity of cell
monolayers on Transwell® inserts can be assessed by measuring the leakage of a non-transportable
fluorescent compound such as Lucifer yellow (Hidalgo et al., 1989). In preliminary experiments,
tightness of monolayers was assessed over 6 days. Data in Fig. 9 show that, as expected, after cell
seeding on Transwell® inserts, leakage of Lucifer yellow constantly decreased over 6 days, parallel to
cell growth. Moreover, leakage was similar from the basolateral to the apical compartment and from
the apical to the basolateral compartment, suggesting that the polarized transporters, expressed in
BNMG cells, did not transport Lucifer yellow. To perform transport experiments, the upper threshold
for Lucifer yellow permeability was set at 5%.
Fig. 9 Assessment of tightness of cell monolayers using Lucifer yellow. Lucifer yellow was added to a donor
compartment and leakage was determined by measuring fluorescence of the medium in the opposite compartment
after 1 h incubation. Permeability of Lucifer yellow was calculated as the ratio of the amount of Lucifer yellow in the
receiver compartment compared to the maximal possible amount of Lucifer yellow (measured in absence of cell
monolayers). (A) Lucifer yellow was added to the apical compartment and measured in the basolateral compartment.
(B) Lucifer yellow was added to the basolateral compartment and measured in the apical compartment. Results of
one experiment are shown.

Results 50
4.1.4 Assessment of functionality of the bile salts transporters, NTCP and BSEP
Functional polarity of the bile salt transporters was assessed by comparing transcellular transport of
the radioactively labelled bile salt taurocholate from the basolateral to the apical compartment with
the transport from the apical to basolateral compartment. Fig. 10A and B show that the transport rate
of taurocholate from the basolateral to the apical compartment is 56-fold higher than the transport
from the apical to basolateral compartment. The corresponding ratio for WT cells is one.
Fig. 10 Vectorial transport of taurocholate in BNMG cells. Transcellular transport of taurocholate in WT and
BNMG cells was assessed in the Transwell® system. (A) Transport of 10 µM taurocholate from the apical to the
basolateral or (B) from the basolateral to the apical compartment was assayed in WT and BNMG cells. Results are
shown as means of 3 independent experiments performed in triplicates ± SD.
Moreover, Fig. 11A illustrates that after 2 h the net intracellular amount of taurocholate was 3-fold
higher in BNMG cells as compared to WT cells and occurred exclusively if taurocholate was added to
the basolateral side. In addition Fig. 11B shows that within 30 min. after adding 10 µM taurocholate
in the basolateral compartment, there was no further increase of the intracellular taurocholate
suggesting that an equilibrium was reached. Taken together, the results of Fig. 10 and Fig. 11 indicate
that NTCP and BSEP are functionally active in BNMG cells and mediate vectorial transport of bile
salts through the basolateral and apical membrane.

Results 51
Fig. 11 Basolateral uptake of taurocholate in BNMG cells. (A) Intracellular accumulation of taurocholate was
assessed 2 h after addition of 10 µM taurocholate either to basolateral or to the apical compartment. Results are
shown as means of 2 independent experiments performed in triplicates ± SD. (B) The intracellular accumulation of
taurocholate was measured at 30 min and at 2 h after adding 10 µM taurocholate to basolateral compartment of
BNMG cells. Results of one experiment performed in duplicates are shown.

Results 52
4.1.5 Assessment of functionality of the cholesterol transporter ABCG5/G8
Several attempts were made to assess specific cholesterol transport in BNMG cells. Some
representative examples of the tested conditions are shown in Fig. 12. In brief, supplementation of 1
mM taurocholate either in the basolateral or in the apical compartment had a minor effect on
cholesterol secretion. In contrast, supplementation of 1 mM taurocholate to the basolateral and
albumin or apolipoprotein A1 as acceptors to the apical compartments clearly increased by
approximately 2-fold the amount of radioactively labelled cholesterol secreted in the apical
compartment. However no significantly higher cholesterol secretion was observed in BNMG cells,
suggesting the absence of ABCG5/G8-mediated cholesterol secretion. However no ABCG5/G8-
mediated transport of cholesterol was observed in BNMG or at least not in a reproducible manner
using these conditions.
Fig. 12 14
C-cholesterol secretion by BNMG cells. 14
C-cholesterol was added to the basolateral compartment and
after 24 h apical 14
C-cholesterol secretion of WT, BN and BNMG monolayers was assessed. Data were normalized to
the total amount of proteins per monolayer and presented in percent of WT (Tc/Alb). (A) 14
C-cholesterol secretion
was measured either in the presence of only 1 mM taurocholate (Tc) basolateral or 1 mM taurocholate basolateral
and 50 mg/ml albumin apical (Tc/Alb). Experiments are shown as means of 2 independent experiments performed in
triplicates ± SD. (B) Cholesterol secretion was measured in absence of any acceptor or taurocholate (-/-) or in the
presence of 1 mM taurocholate in the basolateral compartment and either 10 µg/ml ApoA1 or 50 mg/ml albumin to
the apical compartment. A representative experiment is shown as means of 3 technical replicates ± SD.
As LLC-PK1 cells endogenously synthesize cholesterol, we hypothesized that endogenous cholesterol
may have competed with the radiolabeled cholesterol and this may have decreased the secretion of the
labelled substrate. Therefore, we also analyzed chemically the endogenous cholesterol secreted into
the apical compartment with TLC (Fig. 13A). Similarly, as with the radiolabeled assay,
supplementation of taurocholate to the basolateral, and albumin to the apical compartment, increased
by approximately 2-fold endogenous cholesterol secretion. However, as shown in Fig. 13B

Results 53
densitometric quantification of the HPTLC plates, indicated that cholesterol secretion in BNMG cells
was not significantly higher than secretion by WT cells.
Fig. 13 Secretion of endogenous cholesterol by BNMG cells. Cell monolayers were treated with 1 mM
taurocholate in the basolateral and 50 mg/ml fatty acid free albumin in the apical compartment, respectively. After
incubation the apical medium was collected and processed to quantify the secreted cholesterol. (A) A representative
HPTLC plate used for quantification of apical secreted cholesterol is shown. Lanes 1-6: Cholesterol standards; Lanes
7-8: cholesterol secreted after 14 h; Lanes 9-10 cholesterol secreted after 24 h. (B) Densitometric quantification of
the secreted cholesterol after 24 h. Data are given as means of 2 independent experiments ± SD, *P < 0.05.

Results 54
4.1.6 Assessment of functionality of the phosphatidylcholine transporter MDR3
Smit and coworkers have shown that mice with a homozygous knockout of mdr2 (MDR3
homologous gene in mice) completely lack phospholipid in their bile and develop liver disease (Smit
et al., 1993). Subsequent experiments showed an increased appearance of C6-NBD-PC in the
exoplasmic leaflet of membranes of yeast expressing mdr2 (Ruetz and Gros, 1994) as well as an
increased secretion of 14C-PC in fibroblasts of transgenic mice expressing human MDR3, in the
presence of a phospholipid acceptor (PC- Transfer Protein or PC-TP) in the medium (Smith et al.,
1994). These data lead to the conclusion that MDR3 is a specific phosphatidylcholine (PC)
translocase. Therefore, to assess functionality of MDR3 in BNMG cells we chemically analyzed with
TLC, the phospholipids released into the apical compartment. To ensure the solubility and thus
stimulate the release of the phospholipids in the medium cells were treated with 1 mM taurocholate in
the basolateral and fatty acid free albumin in the apical compartment, respectively.
Fig. 14A shows that BNMG cells specifically secrete PC and that no other phospholipids could be
detected. In addition, this figure indicates that the lipid acceptor albumin contains endogenous
phosphatidylcholine, requiring correction of the secreted amount of PC. In Fig. 14B results of the
densitometric quantification of HPTLC plates are shown. These data demonstrate that as compared to
WT cells BNMG cells secrete a higher amount of PC into the apical compartment suggesting that
MDR3 may be functionally active.
Fig. 14 Secretion of endogenous phosphatidylcholine by BNMG cells. Cell monolayers were treated with 1 mM
taurocholate in the basolateral and 50 mg/ml fatty acid free albumin in the apical compartment, respectively. After
incubation the apical medium was collected and processed to quantify the secreted phosphatidylcholine (PC). (A) A
representative HPTLC plate used for quantification of apical secreted phospholipids is shown. Lanes 1-6:
Phospholipid standards; Lanes 7-8: Phospholipids secreted after 14 h; Lanes 9-10 phospholipids secreted after 24 h;
Lane 11: medium containing albumin. (B) Densitometric quantification of the secreted PC after 24 h. Data are
corrected for albumin-bound PC (blank) and given as means of 4 independent experiments ± SD, *P < 0.05.

Results 55
We next tested the apical secretion of the fluorescent PC derivative C6-NBD-PC, a known substrate
for MDR3 (Smith et al., 2000). As in the previous assay, samples of apical media were extracted but
quantification of C6-NBD-PC was performed by fluorescence measurements in a Microplate
Fluorimeter.
The result in Fig. 15A shows that C6-NBD-PC is secreted by BNMG cells. Moreover, the higher
specific signal detected (after subtraction of the background WT signal) suggests that the
fluorescence-based assay is more sensitive than the TLC-based assay (Fig. 14B) for assessing MDR3
activity. In addition, we also qualitatively analyzed the lipid extract to check for the presence of C6-
NBD-PC-metabolites. Fig. 15B suggests that C6-NBD-PC is not metabolized by the cells as no other
bands than the C6-NBD-PC band and the PC band appear in the analysis of the apical secreted C6-
NBD-PC by TLC. The PC band results primarily from PC contamination in the albumin used as
acceptor, as shown on the right plate in Fig. 15B.
Fig. 15 C6-NBD-PC secretion by BNMG cells. C6-NBD-PC was used as substrate and added exclusively to the
basolateral compartment in the presence of 1 mM taurocholate basolateral and 50 mg/ml albumin apical. After 24 h
the apical medium was collected and extracted. (A) Quantification of the apical secreted C6-NBD-PC by
fluorescence measurements. Results are shown as means of 10 independent experiments ± SD, ***P < 0.001.
(B) Extracted medium was analyzed by TLC to check for the presence of potential metabolites of C6-NBD-PC.
Lanes 1-2 and 8-9: Phospholipid standards (containing equal amounts of PC: phosphatidylcholine, PS:
phosphatidylserine, PI: phosphatidylinositol and PE: phosphatidylethanolamine); Lanes 3-6 Phospholipid and C6-
NBD-PC secreted after 24 h by WT or BNMG cells; Lane 7: medium containing C6-NBD-PC; Lanes 10-11; apical
medium containing albumin.
Moreover, as the release of translocated C6-NBD-PC into the medium is known to be enhanced by
albumin (van Helvoort et al., 1996), and PC secretion has been suggested to occur in a bile salt
dependent manner (Morita et al., 2007; Ruetz and Gros, 1995), we tested the effects of these two
compounds on C6-NBD-PC secretion to establish the best conditions to perform drug screening.
Fig. 16A shows that supplementation of only taurocholate, to the basolateral compartment did not
increase release of C6-NBD-PC by BNMG cells but supplementation of 50 mg/ml albumin to the

Results 56
apical compartment dramatically increased C6-NBD-PC secretion (10-fold) in BNMG cells (Fig.
16B). In addition, Fig. 16B shows that we were able to further increase C6-NBD-PC secretion by
combining these two compounds in our assay. By adding taurocholate to the basolateral compartment
and albumin in the apical compartment there was a further increase of secretion of about 29% as
compared to supplementation of only albumin. Whether this increase was mediated by a specific
interaction between taurocholate and MDR3 or it was only due to an improved solubility of C6-NBD-
PC in the basolateral medium is unclear.
Fig. 16 Effect of taurocholate and albumin on C6-NBD-PC secretion. (A) The effect of taurocholate on C6-NBD-
PC secretion was assessed by measuring C6-NBD-PC efflux in BNMG cells in the absence of taurocholate (-/-) and
in the presence of 1 or 2.5 mM taurocholate basolateral (Tc bas/-). (B) Effect of taurocholate and albumin on
secretion of C6-NBD-PC was assessed by measuring C6-NBD-PC efflux in absence of taurocholate and albumin (-/-),
in presence of 50 mg/ml albumin in the apical compartment (-/Alb ap), in presence of 1 or 2.5 mM taurocholate in
the basolateral compartment and 50 mg/ml albumin in the apical compartment (Tc bas/Alb ap). Results are shown as
means ± SD of 4 independent experiments performed in duplicates or triplicates, * P < 0.05, **P < 0.01 versus
secretion in absence of acceptor (-/-).
Having set the conditions for our assay, we next tested the functional polarity of MDR3 by comparing
transport of C6-NBD-PC from the basolateral to the apical compartment with the transport from the
apical to basolateral compartment. As shown in Fig. 17, in BNMG cells but not in WT cells, the
transport of C6-NBD-PC from the basolateral to the apical compartment was 3 to 4-fold higher than
the transport from the apical to the basolateral compartment and no specific apical to basolateral
secretion of C6-NBD-PC could be observed. This result is consistent with the previously shown
immunolocalization of MDR3 on the apical membrane of BNMG cells and suggests that in BNMG
cells, MDR3 was functionally active and mediated vectorial phosphatidylcholine transport into the
apical compartment.
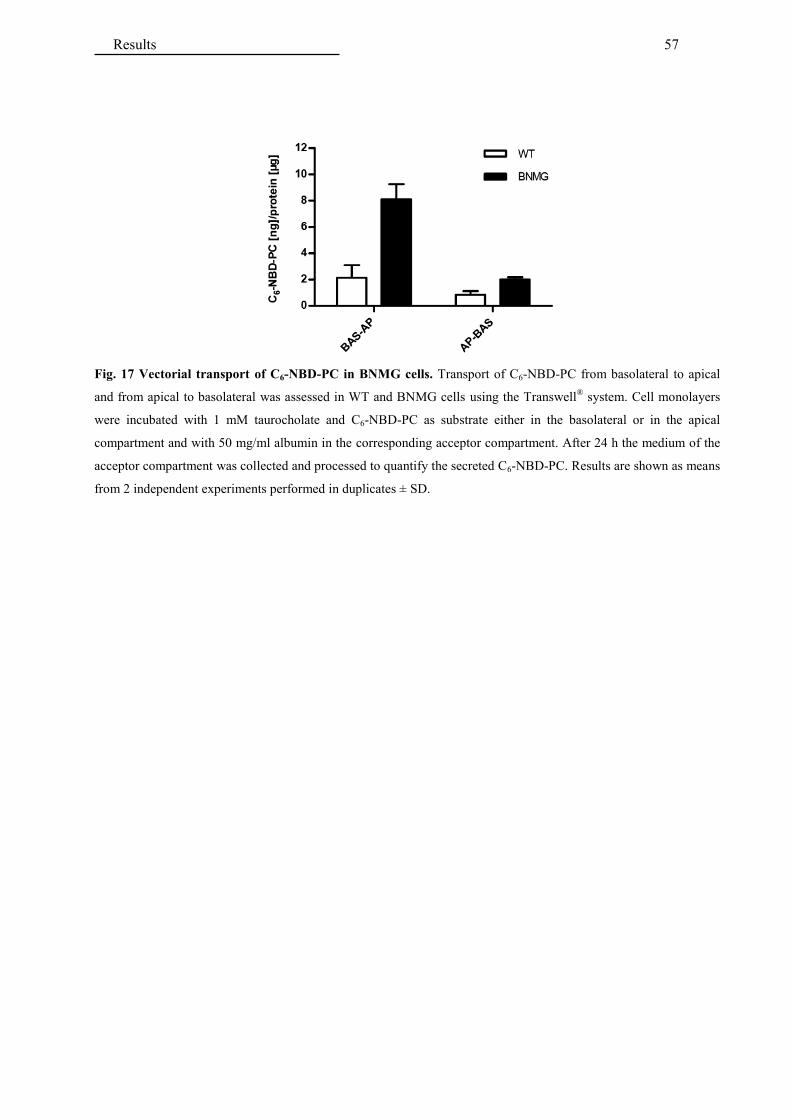
Results 57
Fig. 17 Vectorial transport of C6-NBD-PC in BNMG cells. Transport of C6-NBD-PC from basolateral to apical
and from apical to basolateral was assessed in WT and BNMG cells using the Transwell® system. Cell monolayers
were incubated with 1 mM taurocholate and C6-NBD-PC as substrate either in the basolateral or in the apical
compartment and with 50 mg/ml albumin in the corresponding acceptor compartment. After 24 h the medium of the
acceptor compartment was collected and processed to quantify the secreted C6-NBD-PC. Results are shown as means
from 2 independent experiments performed in duplicates ± SD.

Results 58
4.1.7 Expression of endogenous MDRs in LLC-PK1 cells
The minimal amount of C6-NBD-PC observed in the apical medium of WT cells in Fig. 16A and Fig.
17 could be MDR1-mediated, as previous experiments have shown that C6-NBD-PC can be
transported also by MDR1 (Smith et al., 2000). To rule out a significant role of this ABC-transporter
in apical C6-NBD-PC secretion in our model cell line, we analyzed our cell lines for the expression of
endogenous pMDR1. Using the antibody C219, reported to cross-react with porcine MDR1
(Crivellato et al., 1999) and known to recognize a common epitope on MDR1 and MDR3 (van Den
Elsen et al., 1999), practically no signal was observed in membranes isolated from WT cells, even
after treatment of cells with sodium butyrate (Fig. 18B), but the expected MDR3 signal (140 kDa)
was detected in membranes of BNMG cells. Membranes isolated from Caco-2 cells were used as
MDR1 positive control (Hosoya et al., 1996; Uchida et al., 2015) and displayed a band at the
predicted MDR1 size (170 kDa). Fig. 18A shows the corresponding blot with an antibody against
MDR3, known to not cross-react with MDR1 (Scheffer et al., 2000) and hence without signal in WT
and Caco-2 cells. These data indicate that expression of pMDR1 in our cell lines should have been
minimal. Hence, measuring C6-NBD-PC secretion into the apical compartment should reflect PC
transport by MDR3.
Fig. 18 Western blot analysis of MDR3 and MDR1. Total membranes of Caco-2 cells, and LLC-PK1 WT cells and
BNMG cells with/without overnight pretreatment with 5 mM sodium butyrate were isolated and analyzed for MDR1
and MDR3 expression by Western blotting. Lanes were loaded with 100 µg membrane proteins. (A) LLC-PK1 WT
cells and BNMG cells were probed for MDR3 using a specific MDR3 antibody. (B) LLC-PK1 WT cells and BNMG
cells with/without overnight pretreatment with 5 mM sodium butyrate were probed for endogenous MDR1 using an
antibody recognizing both MDR1 and MDR3 (C219). Caco-2 cells were loaded as MDR1 control.

Results 59
4.1.8 Validation of model cell line for studying drug interactions with MDR3
Smith and coworkers (Smith et al., 2000) demonstrated that MDR3 is inhibited by verapamil and by
PSC833. Therefore, we used these compounds to functionally validate our model cell line. Fig. 19A
shows that MDR3-mediated secretion of C6-NBD-PC was reduced by 40% by verapamil and by 52%
by PSC833. In addition, Fig. 19B shows that MDR3 protein levels were stable in BNMG cells treated
with verapamil o PSC833 suggesting that the reduction of C6-NBD-PC secretion was not due to a
reduction of MDR3 expression but rather to inhibition of MDR3. Hence, BNMG cells are suitable for
investigating the interaction of drugs with MDR3.
Fig. 19 Control for inhibition of MDR3-mediated C6-NBD-PC transport. (A) Apical C6-NBD-PC secretion, in
the presence of 1 mM taurocholate basolateral and 50 mg/ml albumin apical, was assessed in cells treated 24 h with
10 µM verapamil or 4 µM PSC833. Results are shown as means ± SD of 5 independent experiments performed in
triplicates, *P < 0.05 versus DMSO. (B) Western blotting of Transwell® monolayers of BNMG cells previously
treated 24 h with 10 µM verapamil and 4 µM PSC833 was performed. Lanes were loaded with 70 µg cell lysate
protein.
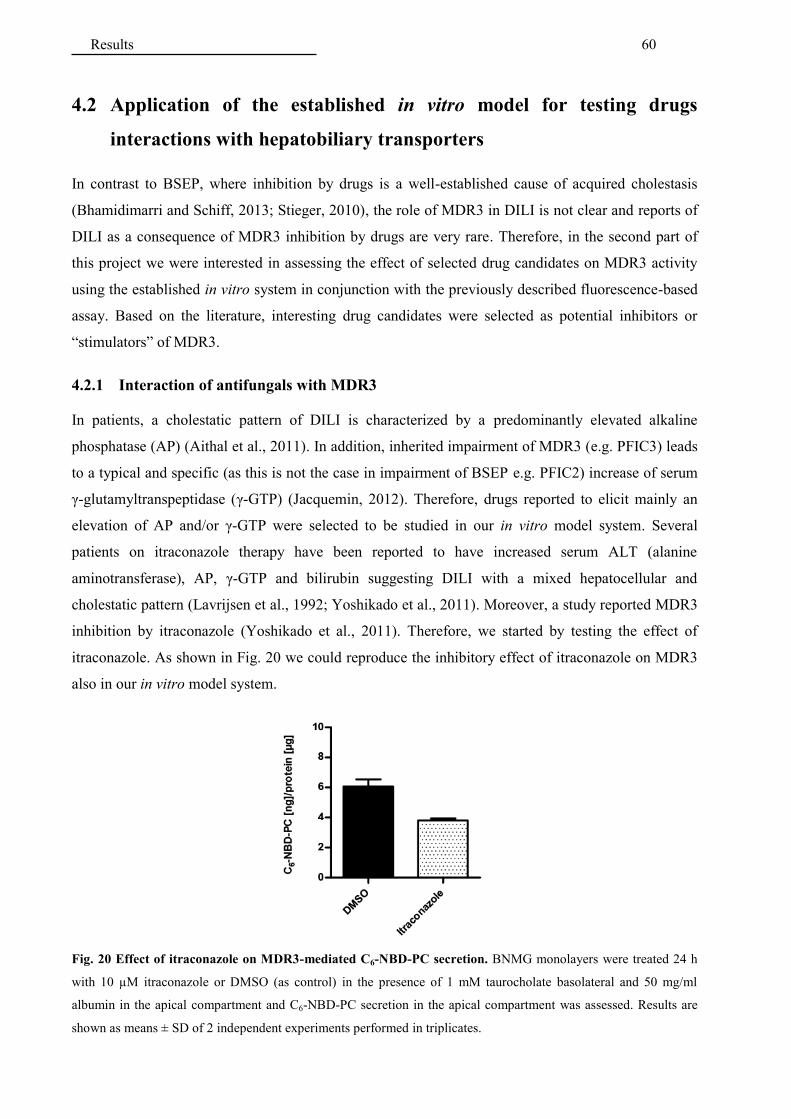
Results 60
4.2 Application of the established in vitro model for testing drugs
interactions with hepatobiliary transporters
In contrast to BSEP, where inhibition by drugs is a well-established cause of acquired cholestasis
(Bhamidimarri and Schiff, 2013; Stieger, 2010), the role of MDR3 in DILI is not clear and reports of
DILI as a consequence of MDR3 inhibition by drugs are very rare. Therefore, in the second part of
this project we were interested in assessing the effect of selected drug candidates on MDR3 activity
using the established in vitro system in conjunction with the previously described fluorescence-based
assay. Based on the literature, interesting drug candidates were selected as potential inhibitors or
“stimulators” of MDR3.
4.2.1 Interaction of antifungals with MDR3
In patients, a cholestatic pattern of DILI is characterized by a predominantly elevated alkaline
phosphatase (AP) (Aithal et al., 2011). In addition, inherited impairment of MDR3 (e.g. PFIC3) leads
to a typical and specific (as this is not the case in impairment of BSEP e.g. PFIC2) increase of serum
γ-glutamyltranspeptidase (γ-GTP) (Jacquemin, 2012). Therefore, drugs reported to elicit mainly an
elevation of AP and/or γ-GTP were selected to be studied in our in vitro model system. Several
patients on itraconazole therapy have been reported to have increased serum ALT (alanine
aminotransferase), AP, γ-GTP and bilirubin suggesting DILI with a mixed hepatocellular and
cholestatic pattern (Lavrijsen et al., 1992; Yoshikado et al., 2011). Moreover, a study reported MDR3
inhibition by itraconazole (Yoshikado et al., 2011). Therefore, we started by testing the effect of
itraconazole. As shown in Fig. 20 we could reproduce the inhibitory effect of itraconazole on MDR3
also in our in vitro model system.
Fig. 20 Effect of itraconazole on MDR3-mediated C6-NBD-PC secretion. BNMG monolayers were treated 24 h
with 10 µM itraconazole or DMSO (as control) in the presence of 1 mM taurocholate basolateral and 50 mg/ml
albumin in the apical compartment and C6-NBD-PC secretion in the apical compartment was assessed. Results are
shown as means ± SD of 2 independent experiments performed in triplicates.

Results 61
This result was further validated by measuring the effect of itraconazole on PC secretion. Cells were
pre-incubated in radioactively labelled 14C-choline as precursor of PC. Subsequently, cells were
treated with itraconazole and secretion of 14C-PC in the apical compartment was analyzed by TLC. As
shown in Fig. 21C, itraconazole leads to a remarkable decrease of secreted 14C-PC, confirming the
previous results showing inhibition of MDR3-mediated C6-NBD-PC secretion.
Fig. 21 Effect of itraconazole on MDR3-mediated 14
C-PC secretion. Cell monolayers were pre-incubated in MEM
medium containing 14
C-choline and subsequently treated overnight with itraconazole in the presence of 1 mM
taurocholate basolateral and 50 mg/ml albumin apical. Apical media were extracted and separated by TLC to assess
the secreted 14
C-PC. (A) Film exposed to HPLTC plate detecting 14
C-choline radiolabeled lipids. (B) Stained HPTLC
plate showing total phospholipids (C) Composite picture of right side of (A) and left side of (B) to compare the
migration of the radiolabeled peptides to the standards (not radioactively labelled). Lanes 1-4: phospholipid
standards (SM: sphingomyelin, PS: phosphatidylserine, PC: phosphatidylcholine, PI: phosphatidylinositol, PE:
phosphatidylethanolamine); Lanes 5-6: BNMG cells treated with DMSO (control); Lanes 7-8: BNMG cells treated
with 2 µM itraconazole; Lanes 9-10: BNMG cells treated with 10 µM itraconazole; Lanes 11-12: WT cells treated
with DMSO (control); Lanes 13-14: WT cells treated with 2 µM itraconazole; Lanes 15-16: WT cells treated with 10
µM itraconazole; Lane 17: albumin containing medium.
Based on clinical studies on DILI, many azoles have been associated with increased hepatic enzymes
and hepatotoxicity (Gearhart, 1994; Somchit et al., 2004; Yoshikado et al., 2011). Therefore, we next
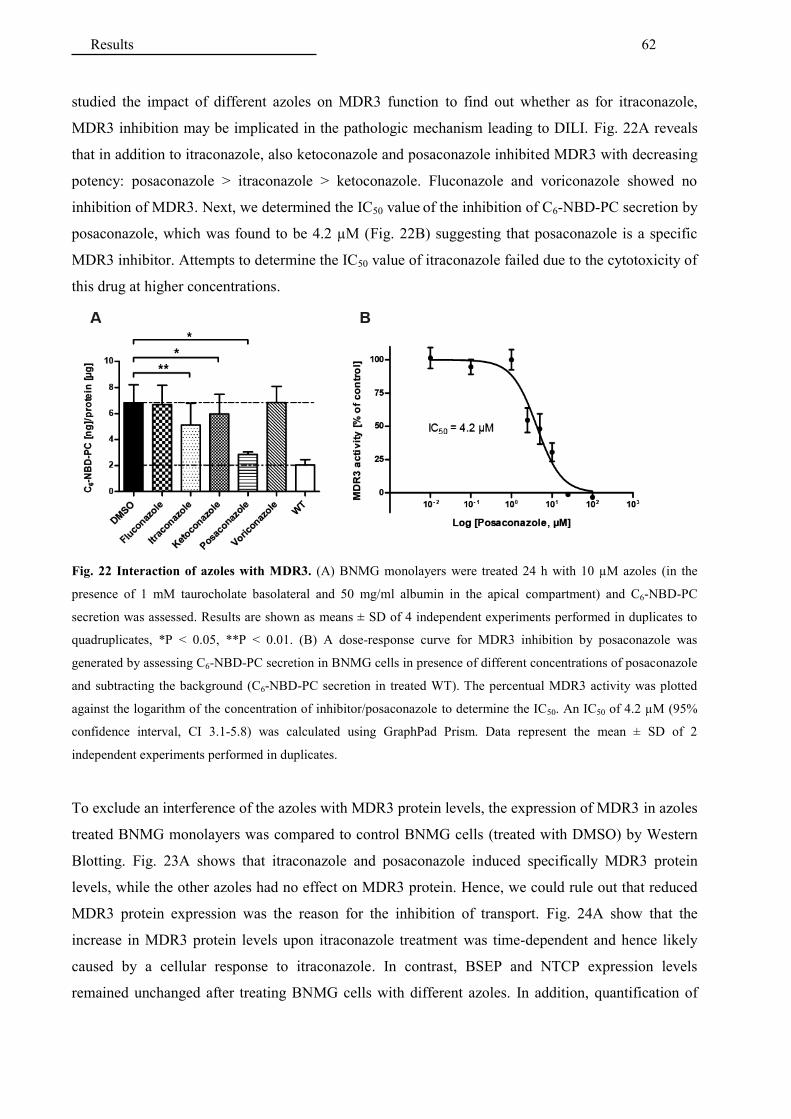
Results 62
studied the impact of different azoles on MDR3 function to find out whether as for itraconazole,
MDR3 inhibition may be implicated in the pathologic mechanism leading to DILI. Fig. 22A reveals
that in addition to itraconazole, also ketoconazole and posaconazole inhibited MDR3 with decreasing
potency: posaconazole > itraconazole > ketoconazole. Fluconazole and voriconazole showed no
inhibition of MDR3. Next, we determined the IC50 value of the inhibition of C6-NBD-PC secretion by
posaconazole, which was found to be 4.2 µM (Fig. 22B) suggesting that posaconazole is a specific
MDR3 inhibitor. Attempts to determine the IC50 value of itraconazole failed due to the cytotoxicity of
this drug at higher concentrations.
Fig. 22 Interaction of azoles with MDR3. (A) BNMG monolayers were treated 24 h with 10 µM azoles (in the
presence of 1 mM taurocholate basolateral and 50 mg/ml albumin in the apical compartment) and C6-NBD-PC
secretion was assessed. Results are shown as means ± SD of 4 independent experiments performed in duplicates to
quadruplicates, *P < 0.05, **P < 0.01. (B) A dose-response curve for MDR3 inhibition by posaconazole was
generated by assessing C6-NBD-PC secretion in BNMG cells in presence of different concentrations of posaconazole
and subtracting the background (C6-NBD-PC secretion in treated WT). The percentual MDR3 activity was plotted
against the logarithm of the concentration of inhibitor/posaconazole to determine the IC50. An IC50 of 4.2 µM (95%
confidence interval, CI 3.1-5.8) was calculated using GraphPad Prism. Data represent the mean ± SD of 2
independent experiments performed in duplicates.
To exclude an interference of the azoles with MDR3 protein levels, the expression of MDR3 in azoles
treated BNMG monolayers was compared to control BNMG cells (treated with DMSO) by Western
Blotting. Fig. 23A shows that itraconazole and posaconazole induced specifically MDR3 protein
levels, while the other azoles had no effect on MDR3 protein. Hence, we could rule out that reduced
MDR3 protein expression was the reason for the inhibition of transport. Fig. 24A show that the
increase in MDR3 protein levels upon itraconazole treatment was time-dependent and hence likely
caused by a cellular response to itraconazole. In contrast, BSEP and NTCP expression levels
remained unchanged after treating BNMG cells with different azoles. In addition, quantification of

Results 63
the induction of MDR3 protein levels by itraconazole over 48 h was performed using the blots shown
in Fig. 23B and Fig. 24A and confirmed these results (Fig. 24B).
Fig. 23 Effect of azoles on MDR3, BSEP and NTCP protein levels. (A) Western blotting of Transwell®
monolayers of BNMG cells previously treated 24 h with 10 µM azoles was performed. Lanes were loaded with 70
µg cell lysate protein. (B) Western blotting of cell lysates of BNMG cells cultured on 10 cm dishes and treated 24
and 48 h with 10 µM itraconazole, 200 µM bezafibrate or fenofibrate (PPRα agonists). Lanes were loaded with 70 µg
cell lysate protein. On both blots, β-actin was immunoblotted as loading control.
Fig. 24 Time-dependent induction of MDR3 protein levels by itraconazole. (A) Western blotting of cell lysates of
BNMG cells cultured on 10 cm dishes and treated 5, 24 and 48 h with 10 µM itraconazole, 100/300 µM co-
amoxicillin and 300 µM amoxicillin was performed. (B) Quantification of the effect of itraconazole on MDR3
protein levels over 48 h. Results were normalize d to DMSO and are shown as mean ± SD of 2 independent
experiments.
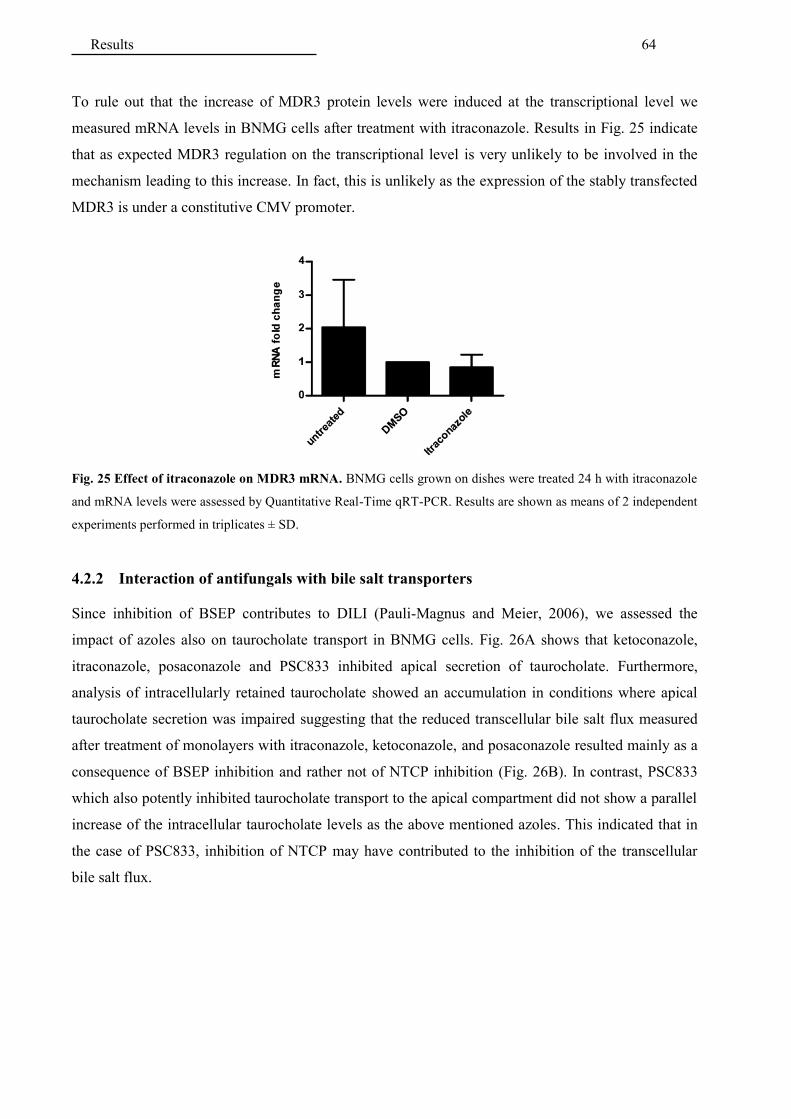
Results 64
To rule out that the increase of MDR3 protein levels were induced at the transcriptional level we
measured mRNA levels in BNMG cells after treatment with itraconazole. Results in Fig. 25 indicate
that as expected MDR3 regulation on the transcriptional level is very unlikely to be involved in the
mechanism leading to this increase. In fact, this is unlikely as the expression of the stably transfected
MDR3 is under a constitutive CMV promoter.
Fig. 25 Effect of itraconazole on MDR3 mRNA. BNMG cells grown on dishes were treated 24 h with itraconazole
and mRNA levels were assessed by Quantitative Real-Time qRT-PCR. Results are shown as means of 2 independent
experiments performed in triplicates ± SD.
4.2.2 Interaction of antifungals with bile salt transporters
Since inhibition of BSEP contributes to DILI (Pauli-Magnus and Meier, 2006), we assessed the
impact of azoles also on taurocholate transport in BNMG cells. Fig. 26A shows that ketoconazole,
itraconazole, posaconazole and PSC833 inhibited apical secretion of taurocholate. Furthermore,
analysis of intracellularly retained taurocholate showed an accumulation in conditions where apical
taurocholate secretion was impaired suggesting that the reduced transcellular bile salt flux measured
after treatment of monolayers with itraconazole, ketoconazole, and posaconazole resulted mainly as a
consequence of BSEP inhibition and rather not of NTCP inhibition (Fig. 26B). In contrast, PSC833
which also potently inhibited taurocholate transport to the apical compartment did not show a parallel
increase of the intracellular taurocholate levels as the above mentioned azoles. This indicated that in
the case of PSC833, inhibition of NTCP may have contributed to the inhibition of the transcellular
bile salt flux.

Results 65
Fig. 26 Interaction of azoles with transcellular taurocholate transport. Monolayers were treated with 10 µM
azoles or 4 µM PSC833 for 24 and transport experiments were started by adding 10 µM taurocholate to the
basolateral compartment. (A) The effect of azoles on taurocholate transport was assessed by measuring the amount
of taurocholate transported to the apical compartment after 30 min. The total taurocholate secreted in the apical
compartment was normalized to the total amount of protein per monolayer. Drugs-treated monolayers were
normalized to control monolayers treated with DMSO. Results are shown as means ± SD of 3 independent
experiments performed in duplicates, *P<0.05 versus DMSO. (B) The intracellular accumulation of taurocholate was
assessed as indicator for BSEP inhibition. After 2 h the monolayers were washed once with PBS and solubilized in
1% Triton X-100 and the intracellular retained taurocholate was assessed. Results were normalized to the protein’s
amount. Drug-treated monolayers were normalized to DMSO-treated monolayers. Results are shown as means ± SD
of 2 independent experiments performed in duplicates.
4.2.3 Interaction of additional hepatotoxic drugs with MDR3
In addition to the antifungal-azoles, several other drugs belonging to different pharmacological
classes have been associated with DILI. Therefore, additional selected drug candidates were tested for
a potential inhibition of MDR3 activity.
The antibiotic amoxicillin–clavulanate (co-amoxicillin) has been found to be the most common drug
associated with DILI (Bjornsson, 2015; Leise et al., 2014). Bupropion and nefadozone are
antidepressants drugs, both associated with DILI (Park and Ishino, 2013). Bupropion-induced
hepatotoxicity is not well defined as in most case reports patients were concomitantly taking other
drugs (Park and Ishino, 2013). In contrast, although the mechanism remains unknown, liver toxicity
associated with nefadozone is well-established and in 2001 the FDA issued a “black box” warning of
the potential irreversible liver failure induced by this drug (Park and Ishino, 2013). In the literature,
several cases of drug-induced cholestasis by the antipsychotic drug chlorpromazine are reported
(Derby et al., 1993). Olanzapine is an atypical antipsychotic drug associated to DILI (Devarbhavi et
al., 2010) and which has been shown to inhibit MDR1 (Wang et al., 2006). As MDR1 is the closest
homolog to MDR3 (van der Bliek et al., 1988), it is conceivable that olanzapine may also modulate

Results 66
MDR3 by recognizing common conserved domains (Morita et al., 2007). Troglitazone was a drug
used for treatment of type II diabetes and was withdrawn from the market because of the numerous
reports of liver failure. Multiple mechanism for troglitazone hepatotoxicity such as mitochondrial
injury and BSEP inhibition are discussed (Smith, 2003). Cyclosporin A is a well-established BSEP
inhibitor (Stieger, 2010) and has a very similar structure to PSC833. Finally, octreotide is used to treat
acromegaly, thyroid stimulating hormone secreting pituitary adenomas and neuroendocrine tumors
and about half of patients receiving octreotide have gallbladder stones (Dowling et al., 1992).
The results in Fig. 27A suggest that with the exception of cyclosporine A, none of the tested drugs
inhibited MDR3.
Fig. 27 Effect of hepatotoxic drugs on MDR3 activity. Cell monolayers were treated 24 h with 300 µM
amoxicillin, 10 µM bupropion, 5 µM chlorpromazine, 100 µM clavulanate, 1 µM cyclosporin A, 100/300 µM co-
amoxicillin (amoxicillin and clavulanate), 10 µM nefadozone , 25 µM octreotide, 10 µM olanzapine, and 10 µM
troglitazone to assess their effect on MDR3-mediated C6-NBD-PC secretion. Results are shown as means ± SD of 3
or 2 independent experiments performed in duplicates or triplicates. (B) Western blotting of the corresponding
Transwell monolayers of BNMG cells previously treated 24 h with the drugs was performed. Lanes were loaded with
70 µg cell lysate protein.

Results 67
4.2.4 Interaction of cholagogues with MDR3
In addition to drugs associated with hepatotoxicity and thus potential inhibitors of hepatobiliary
transporters, cynarin, boldine and luteolin were tested for a potential “stimulation” of MDR3 activity,
which would be beneficial to the bile ducts. These substances are the active ingredients of herbal
“cholagogues”. In traditional herbal medicine “cholagogues” are used against gastrointestinal
disorders to stimulate bile flow (choleresis). A well-known, old cholagogue used against
gastrointestinal and liver disorders is artichoke leaf extract (Cynara scolymus L.). Artichoke leaf
extract was reported to stimulate biliary secretion in humans (Kirchhoff et al., 1994; Matuschowski et
al., 1997) and to have lipid lowering properties (Adzet et al., 1987; Kraft, 1997; Wegener and
Fintelmann, 1999). The active ingredients in artichoke leaf extract are cynarin and luteolin (Salem et
al., 2015). Similarly, boldo leaf extract (Peumus boldus Mol.) with its active ingredient boldine is
used against liver ailments in South America (Speisky and Cassels, 1994) and reportedly stimulates
choleresis (O'Brien et al., 2006; Zagorova et al., 2015). Fig. 28A and Fig. 28B show that in our cell-
based model, these substances had no effect on MDR3 activity as well as on MDR3 protein levels.
Fig. 28 Effect of cholagogues on MDR3 activity. (A) Cell monolayers were treated 24 h with 10 µM luteolin, 10
µM boldine and 100 µM cynarin and their effect on C6-NBD-PC secretion was assessed. Results are shown as means
± SD of 3 independent experiments performed in duplicates or triplicates. (B) Western blotting of corresponding
Transwell®
monolayers of BNMG cells previously treated 24 h cholagogues was performed. Lanes were loaded with
70 µg cell lysate protein.

Results 68
4.2.5 Interaction of fibrates with MDR3
Fibrates have been reported to stimulate phosphatidylcholine secretion by a transactivation of MDR3
gene transcription (Ghonem et al., 2014). However, in the literature also other mechanisms leading to
increased phosphatidylcholine secretion such as redistribution of MDR3 in bile canaliculi (Shoda et
al., 2004; Shoda et al., 2007) have been described. Therefore, we were interested to test the effect of
these drugs in our in vitro model. As in our BNMG cells MDR3 is constutively expressed, MDR3
protein levels remained stable upon treatment with fibrates (Fig. 29B). Due to the higher variability of
the results, alterations of C6-NBD-PC secretion upon fibrates treatment were not statistically
significant (Fig. 29A).
Fig. 29 Effect of fibrates on MDR3 activity. (A) Cell monolayers were treated 24 h with 200 µM bezafibrate or
fenofibrate their effect on C6-NBD-PC secretion was assessed. Results are shown as means ± SD of 5 independent
experiments performed in duplicates or triplicates. (B) Western blotting of the corresponding Transwell® monolayers
of BNMG cells previously treated 24 h fibrates was performed. Lanes were loaded with 70 µg cell lysate protein.
5 Discussion
The established cell-based model system for canalicular bile salts and phosphatidylcholine secretion
is functional and was used to assess the effect of several hepatotoxic drugs as well as potential
hepatoprotective compounds on canalicular secretion. Of the several drugs tested, the azoles
posaconazole, itraconazole and ketoconazole, used to treat antifungal infections, inhibited both BSEP
and MDR3 to varying extents. This may explain one of the mechanisms of drug-induced liver injury
of this class of drugs. Furthermore, interestingly posaconazole and itraconazole, in parallel to
inhibiting MDR3, induced MDR3 protein levels. Other compounds did not alter MDR3 activity,
suggesting that their hepatotoxic or hepatoprotective effects are not caused by direct interactions with
MDR3.
5.1 Characterization of a model cell line for biliary lipid secretion
5.1.1 Overview of the established in vitro model
In the first part of this project, we constructed and characterized an in vitro model for canalicular
phospholipid secretion consisting of stably transfected LLC-PK1 cells, expressing functional NTCP,
BSEP and MDR3 that are cultured to tight monolayers in the Transwell® system (Fig. 30). This
model system allows testing for the interaction of drugs with canalicular lipid and bile salt secretion.
The established model cell system displays the following advantages as compared to other in vitro
models for studying biliary phospholipid and/or bile salts secretion: 1) direct experimental access to
the basolateral and apical plasma membranes, which is precluded in hepatocytes. This allows, if
desired, the supplementation of substrates to both compartments and the preloading of the apical
compartment with acceptor proteins to ensure solubility of the translocated lipids; 2) formation of a
tight epithelium with the possibility to generate transcellular fluxes for bile salts and lipids and hence
the reconstitution of trans-hepatocellular fluxes of cholephilic compounds; 3) the possibility to
simultaneously assess the impact of drugs on BSEP-mediated bile salts and MDR3-mediated lipid
secretion; 4) the availability of a control LLC-PK1 WT cell line without the added human transporters
(which is not available for. e.g. in hepatocytes-based models) and a high signal-to-noise ratio,
allowing a clean interpretation of the data and no bias in calculating specific transport; 5) a low
expression of drug metabolizing enzymes (Gonzalez and Tarloff, 2004) which can be helpful to
delineate the individual contribution of drug and metabolites to transporter inhibition by testing them
separately.

Discussion 70
Fig. 30 Overview of the established in vitro model system for canalicular lipid secretion. The upper part of the
picture represents the in vivo situation in human hepatocytes. The lower part of the picture depicts our established in
vitro model constituted of stably transfected and polarized LLC-PK1 cells grown on Transwell® filters. The cells
express NTCP on the basolateral domain and MDR3 and BSEP on the apical domain.
5.1.2 Analysis of expression and localization of the transporters
Western blot analysis of cell lysates and immunohistochemical analysis of cell monolayers
demonstrated expression and polarized localization of human NTCP, BSEP and MDR3 in the
transfected LLC-PK1 cell line named BNMG. Immunolocalization of the transporters was performed
with cells cultured on Transwell® filters using the same conditions as for the functional transport
assays. Therefore, the recorded pictures are representative for the cells used for the functional assays.
These data demonstrated that NTCP was expressed on the basolateral membrane, whereas BSEP and
MDR3 were expressed in the apical domain of LLC-PK1 suggesting that the BNMG cells mimics, at
least qualitatively, human hepatocytes (Buschman et al., 1992; Stieger, 2011). Absolute quantitative
data of the transporter protein levels and comparison with human hepatocytes would help to assess
the suitability of the developed model for in vitro to in vivo extrapolations. There have been studies
showing missorting of basolateral proteins in LLC-PK1 cells due to a lack of AP-1B expression (Cao
et al., 2012). AP-1B is a clathrin-associated adaptor protein expressed in various polarized epithelial
cell lines including MDCK and Caco-2 cells (Ohno et al., 1999). The fact, that NTCP was sorted
correctly to the basolateral domain in our BNMG cells suggests that the basolateral sorting of NTCP
does not require AP-1B but another sorting mechanism.

Discussion 71
5.1.3 The bile salt transporters, NTCP and BSEP
Functional polarity of the bile salt transporters was assessed by comparing the transcellular transport
and the intracellular accumulation of the radioactively labelled bile salt taurocholate after
supplementing it either to the basolateral or to the apical compartment. The bile salt transport rate and
the intracellularly accumulated bile salt were remarkably higher when taurocholate was added to the
basolateral compartment of BNMG cells suggesting that NTCP and BSEP mediated a vectorial
transport of bile salts through the basolateral and apical membrane and hence mimicked
hepatocellular bile salt flux.
Of notice, by measuring the intracellularly accumulated bile salt, it was possible to get insights on
whether a decreased bile salt flux was due to BSEP or NTCP inhibition by a drug.
5.1.4 The cholesterol transporter, ABCG5/G8
ABCG5/G8-mediated cholesterol secretion has been suggested to require bile salts (Vrins et al.,
2007). Therefore, cells were treated with different concentrations of taurocholate either in the
basolateral, in the apical or in both compartments to stimulate secretion of cholesterol. However, as
with concentration of taurocholate exceeding 2 mM we observed an increased LDH release and a
leakage in our monolayers (assessed by Lucifer yellow integrity test), both indicative of impacted cell
viability, we chose to perform our experiments with 1 mM taurocholate. Both transport of
radioactively labelled cholesterol as well as endogenous cholesterol secretion to the apical
compartment were measured. For both substrates, supplementation of albumin or apoA1 as acceptors
in the apical compartment resulted in an at least two-fold increase of cholesterol secretion. However,
the signal in the cells transfected with ABCG5/G8 was not significantly higher than WT cells. Hence
cholesterol secretion in our BNMG model cell line was not an ABCG5/G8-mediated process. This
raises the question whether the ABCG5/G8 heterodimer was functional and/or expressed at sufficient
level. In order to assess the expression levels of ABCG5/G8 we analyzed the total cell lysate of
BNMG cells and could detect a weak specific signal for ABCG8 in BNMG cells. However, for
ABCG5 we had to use extracted membrane fractions in order to see a specific signal. Moreover, when
comparing the signal of ABCG5 in BNMG cells to Caco-2 cells, which endogenously express
ABCG5 (Grenier et al., 2012), the signal in BNMG cells is much lower. Hence, these data suggest
that expression levels of ABCG5/G8 could be too low to detect a phenotype. Alternatively, the
expressed ABCG5/G8 might be non-functional possibly because they do not heterodimerize or
another unknown co-factor, needed for efficient ABCG5/G8 mediated cholesterol transport, could be
missing in BNMG cells. Finally, taurocholate may be able in our model system to unspecifically
extract cholesterol from the plasma membrane, which in turn could mask a potential contribution of
ABCG5/G8 to cholesterol release.
Discussion 72
5.1.5 The phosphatidylcholine transporter, MDR3
The predominant phospholipid in human bile is phosphatidylcholine (Alvaro et al., 1986; Phillips,
1960). Phosphatidylcholine secretion into bile is mediated by MDR3, a specific PC translocase.
Chemical analysis of the phospholipids secreted into the apical compartment, as well as transport
experiments with C6-NBD-PC, showed a significantly higher PC and C6-NBD-PC secretion in the
apical compartment of BNMG cells (than in WT cells) suggesting that MDR3 was functionally active
in BNMG cells. Furthermore, since an increased secretion of C6-NBD-PC was also measurable in the
absence of taurocholate (in Fig. 16B), it is unlikely that the increased C6-NBD-PC secretion was only
due to an indirect effect of the bile salt flux mediated by BSEP and NTCP in BNMG cells. Further
control experiments to exclude unspecific effects leading to an increased MDR3-independent
phospholipid secretion could include the analysis of phospholipid secretion in a BNG cell line
expressing BSEP, NTCP and ABCG5/G8 but not MDR3 or the analysis of phospholipid secretion
before and after the suppression of MDR3 with siRNA.
As compared to the quantification of endogenous PC secretion, a higher specific signal was detected
by the quantification of C6-NBD-PC secretion. This may be due to the following reasons:
1) contamination of albumin with PC were variable and generated a high background signal that
interfered with the signal of the PC secreted by the cells. This may has been a source of error in PC
quantification. Of notice is that analysis of different albumin lots and batches displayed different,
highly variable amounts and quality of lipids. Companies which sell fatty acid free albumin specify
only the maximal possible lipid content but do not define the exact amount or the types of lipid
contained; 2) Moreover, as compared to quantification of C6-NBD-PC, which is based on
fluorescence measurements of apical medium extracts, quantification of endogenous PC by TLC
involves additional technical steps such as loading, developing and staining the TLC plates which
may also contribute to the increase of the variability; 3) Finally, secretion of PC relies on the
endogenous pool of PC, which relies itself on the rate of PC biosynthesis. Biosynthesis of PC in LLC-
PK1 cells could be the limiting step of endogenous PC secretion. Hence, as the C6-NBD-PC based
assay was not only more sensitive but also faster and had a better reproducibility, we decided to use
this assay also for testing drug interactions with MDR3. In the literature only a few different
approaches to study drug interactions with MDR3 have been described: van Helvoort A and
coworkers used C6-NBD-PA as C6-NBD-PC precursor (van Helvoort et al., 1996), Yoshikado et al.
used 14C-choline as precursor of phosphatidylcholine (Yoshikado et al., 2011) and very recently He
et. al. published a method using choline-d9 as precursor and assessed deuterium (d9)-labelled PC
secretion by LC-MS/MS (He et al., 2015). As compared to these assays our C6-NBD-PC-based assay
display the following main differences: 1) C6-NBD-PC is not a precursor molecule and therefore
results are not influenced by alterations in the biosynthetic pathway as compared to the previous
methods; 2) Fluorescence is a sensitive, easy and cheap method to quantify lipid as compared to

Discussion 73
radioactivity measurements or LC-MS/MS based measurements; 3) C6-NBD-PC is a surrogate
substrate possessing a different chemical structure than PC and therefore a different KM for MDR3.
The different chemical structure of C6-NBD-PC could also explain why, in contrast to what has been
previously reported for PC (Morita et al., 2007), supplementation of only taurocholate did not
dramatically increase C6-NBD-PC secretion (Fig. 16A). Although, another possible explanation for
this could be that the amounts of taurocholate that from the basolateral compartment reached the
apical compartment were too low to enhance C6-NBD-PC secretion. To clarify this, additional
experiments, involving also supplementation of taurocholate directly to the apical compartment as
well as the determination of the apical concentration of taurocholate after its supplementation to the
basolateral compartment, would be required. As we knew that treating cells with taurocholate
concentrations above 2 mM increases LDH release, a sign of cell necrosis, we decided to keep
albumin as main acceptor in the apical compartment to avoid unspecific effects of taurocholate which
may alter apical membrane permeability. Therefore, we used throughout the work only 1 mM
taurocholate in the basolateral compartment. Interestingly, in both assays (with PC and C6-NBD-PC)
used to assess MDR3 function, supplementation of 50 mg/ml albumin in the apical compartment
dramatically increased phospholipids released in the apical compartment in BNMG cells. Albumin is
a much larger molecule than taurocholate. Therefore, these results, partially contradicts the model
proposed by Morita and coworkers, according to which bile salts (e.g. taurocholate) may bind PC still
in cavity or on the surface of MDR3 (Morita et al., 2007) and support rather the hypothesis that the
phospholipid acceptor, bile salt or albumin (in our assay), may increase the release of phospholipids
simply by enhancing the solubilisation of the phospholipids from the outer canalicular membrane into
the canaliculus.
Having set the conditions for our assay, we next tested the functional polarity of MDR3 by comparing
transport of C6-NBD-PC from the basolateral to the apical compartment with the transport from the
apical to basolateral compartment. We found MDR3-mediated C6-NBD-PC secretion exclusively in
the apical compartment. This result is consistent with the previously shown immunolocalization of
MDR3 on the apical membrane of BNMG cells. In conclusion, BNMG cells display vectorial
transport (from basolateral to apical) of bile salt and phosphatidylcholine and hence recapitulate in
vitro biliary phospholipid and bile salt secretion in vivo (Fig. 30).
5.1.6 Endogenous transporters with the same substrate specificity
Expression of endogenous transporters having the same substrate specificity as the tested transporters
can provide a potential bias for in vitro studies. In the literature it has been reported that transfection
of cells lines with transporters may alter endogenous MDR1 expression (Kuteykin-Teplyakov et al.,
2010; Raggers et al., 2002). As previous experiments have shown that C6-NBD-PC is also a substrate
of MDR1 (Smith et al., 2000) and LLC-PK1 cells have been reported to endogenously express little

Discussion 74
amounts of pMDR1 (Goh et al., 2002), we analyzed endogenous pMDR1 expression by Western
Blotting. Our results suggest that endogenous pMDR1 expression was minimal in WT LLC-PK1 cells
(Fig. 18), as compared with endogenous MDR1 expression in Caco-2 cells and that expression levels
were similar in WT and BNMG cells, demonstrating that the difference of C6-NBD-PC transport
between BNMG cells and WT cells should reflect MDR3-mediated transport. The small amount of
C6-NBD-PC observed in the apical medium of WT cells could have been partially MDR1-mediated
(by the very low amounts of pMDR1) and can partially be explained by the chemical properties of C6-
NBD-PC, which is more water soluble than PC. This partitioning into the aqueous phase is also
illustrated by the basolateral release of C6-NBD-PC in Fig. 17 and by the published observation that
C6-NBD-PC exchanges via the aqueous phase between artificial phospholipid vesicles (Elvington and
Nichols, 2007).
5.1.7 Validation of the BNMG cell line for studying drug interactions with MDR3
Finally, the model for studying drug interaction with MDR3 was functionally validated by treating
cells with two known reversal agents/inhibitors of MDR1 and MDR3 (Smith et al., 2000). Verapamil
and PSC833 modulate the efflux function of MDR1 by competing for the substrate binding sites in
the TMDs (Wu et al., 2008) and they have been shown to be extruded by MDR1. However, they do
not seem to be extruded MDR3 (Morita et al., 2013; Wu et al., 2008). As expected, transport of C6-
NBD-PC was sensitive to verapamil and PSC833 suggesting that MDR3 was indeed inhibited by
these drugs. However, a better demonstration that MDR3 inhibition was the reason for the decreased
C6-NBD-PC secretion, could have been provided by parallel treatment with verapamil and PSC833 of
a control cell line, not expressing MDR3 (e.g. a BNG cell line expressing only BSEP, NTCP and
ABCG5/G8).
The inhibition of MDR3 activity by PSC833 and verapamil was lower in our model system as
compared to previous publications (van Helvoort et al., 1996; Yoshikado et al., 2011). It is likely that
this difference is mainly due to the different experimental setup used.
Reasons that could underlie a lower inhibition in our model as compared to other models could
include the use of the surrogate substrate C6-NBD-PC having a lower affinity than the endogenous
substrate PC, the presence of endogenous PC that may compete with C6-NBD-PC and the way how
the drug treatment was performed. C6-NBD-PC possesses a different chemical structure and thus a
different affinity to MDR3 than PC. This may also lead to different inhibition potency. In addition, in
other assays drug treatment was performed by pre-incubating the cells before the start of the
experiment and not simultaneous as we did. On the other hand, the higher inhibition found in other
models could be due to perturbations of the biosynthetic pathway (when PC precursors were used as
substrates) and to a high endogenous expression of MDRs such as MDR1 with the same substrate
specificity. In the first case, perturbations of the biosynthetic pathways by the tested drug could result

Discussion 75
in a lower amount of PC secreted even though MDR3 activity would be unchanged. In contrast, C6-
NBD-PC is independent from the cell biosynthetic pathway and therefore alterations of C6-NBD-PC
secretion should directly reflect alteration of MDR3 activity. Finally, different expression levels of
endogenous transporters, or alteration of expression in transfected cell lines in other models may also
lead to bias in the results as explained in the previous section.

Discussion 76
5.2 Application of the established in vitro model for testing drugs
interactions with hepatobiliary transporters
5.2.1 Effect of antifungal azoles on MDR3 and BSEP activities and comparison of their
structures
Analysis of the FDA Adverse Event Reporting System database revealed that antimycotics are
involved in approximately 3% of all DILI cases (Raschi et al., 2014). Moreover, antifungal azoles
have been associated with an elevation of serum liver enzymes and liver injury leading in some cases
to liver failure (Adriaenssens et al., 2001; Chang et al., 2007; Gearhart, 1994; Hann et al., 1993).
Therefore, we tested the interaction of five clinically used antifungal azoles with MDR3: fluconazole,
itraconazole, ketoconazole, posaconazole, voriconazole. Posaconazole, itraconazole and ketoconazole
(with decreasing order) significantly inhibited MDR3-mediated phosphatidylcholine secretion and
BSEP-mediated taurocholate secretion, as indicated by the reduction of C6-NBD-PC secretion and the
increased intracellular accumulation of taurocholate, in our model cell line. Posaconazole strongly
inhibited MDR3 (83%, IC50 ~ 4.2 µM) and moderately inhibited BSEP (38%). This is, to our
knowledge, the first report on the inhibition of canalicular transporters, particularly MDR3, by
posaconazole. In clinics posaconazole-related elevation of liver enzymes or liver injury were rarely
reported and most available data are in the context of clinical trials (Courtney et al., 2005; Girmenia,
2009; Moton et al., 2009). The apparent discrepancy between our findings and the current literature
may have several reasons: 1) posaconazole was approved in 2006 and is the newest azole released
into the market about 20 years after ketoconazole and itraconazole. 2) Posaconazole has a rather
narrow indication, e.g. for the treatment of invasive fungal infections (e.g. aspergillosis, candidiasis)
in patients refractory to other antifungals (second line therapy) and for the prophylaxis of antifungal
infections in patients receiving chemotherapy and immunosuppressed patients after hematopoietic-
stem-cell-transplantation (Frampton and Scott, 2008). Hence, the patient population exposed to
posaconazole is limited and often is on polypharmacy. In such situations it is difficult to associate a
particular drug with a specific molecular pathway leading to the adverse reaction. Similarly to
posaconazole, also itraconazole significantly inhibited MDR3 (42%) and moderately inhibited BSEP
(26%). These results confirm previous studies (He et al., 2015; Yoshikado et al., 2011) and are
clinically supported by the numerous reports of hepatic liver injury present in the literature (Chang et
al., 2007; Hann et al., 1993; Hay, 1993) and in particular reports on a cholestatic pattern of liver
injury (Hann et al., 1993; Lavrijsen et al., 1992; Talwalkar et al., 1999; Yoshikado et al., 2011).
Interestingly, ketoconazole only weakly (20%) inhibited MDR3 but was in the present study the most
potent BSEP inhibitor (67% inhibition). This BSEP inhibition is in line with previous reports of
BSEP inhibition by ketoconazole (IC50 ~ 3 µM (Dawson et al., 2012)). Ketoconazole has been

Discussion 77
withdrawn from the European and Australian markets and underwent strict product relabeling in
Canada and US due to hepatotoxicity (Gupta et al., 2015). Although these adverse effects were
mainly attributed to the inhibition of CYP3A isoforms (Phase I enzymes) by ketoconazole, emerging
evidence (Dawson et al., 2012; Morgan et al., 2010) and our results suggest that inhibition of MDR3
in combination with BSEP in susceptible patients may aggravate ketoconazole-induced hepatotoxicity
similarly to troglitazone (Stieger, 2010). Fluconazole and voriconazole did neither affect MDR3-
mediated PC secretion nor BSEP in our model system. These results agree well with several
comparative in vitro and epidemiological studies suggesting that fluconazole is the safest azole
(Chang et al., 2007; Cronin and Chandrasekar, 2010; Somchit et al., 2002). In contrast, voriconazole
has been often associated to hepatotoxicity. However, its toxicity seems to correlate with CYP2C19
polymorphisms (Trubiano et al., 2015) and not to inhibition of hepatobiliary transporters.
Interestingly, the azoles showing an effect on the canalicular transporters have a structural
resemblance (Fig. 31). The MDR3 inhibitors posaconazole and itraconazole contain an extended
piperazine-phenyl-triazole moiety while ketoconazole contains a piperazine-phenyl moiety. In
contrast, voriconazole and fluconazole did not inhibit MDR3 and are structurally different
(voriconazole was developed by chemical manipulation of fluconazole). Therefore, it is tempting to
speculate that the piperazine-phenyl-triazole moiety is responsible for the interaction with MDR3.
Although additional experiments e.g. using vesicle-based studies (ATPase assay) would be required
to prove direct binding of these drugs to BSEP and MDR3, the parallel inhibition of these proteins by
posaconazole, itraconazole and ketoconazole could suggests that these azoles may bind conserved
domains of MDR3 and BSEP. A comparison of the primary amino acid sequence of BSEP and
MDR3 reveals nearly 50% sequence identity in the entire proteins but 65% sequence identity in the
NBDs. Hence, one could speculate that these drugs may inhibit the ATPase activity of BSEP and
MDR3. Structural information on MDR3 and BSEP will help to elucidate the nature (e.g. binding site
prediction) of this interaction at the molecular level. Furthermore, in the future (with the availability
of the protein structures), using a computational structure-based drug design approach, posaconazole
and itraconazole or the piperazine-phenyl-triazole moiety could be used as hit for the identification of
MDR3 modulators.

Discussion 78
Fig. 31 Chemical structures of the azoles tested in our in vitro model. Antifungal azoles act by inhibiting the
conversion of lanosterol to ergosterol, the main sterol in fungal cell membrane. Their chemical structure is
characterized by five-membered rings containing two (imidazoles) or three (triazoles) nitrogen atoms. Posaconazole,
itraconazole and ketoconazole share common structures. The piperazine-phenyl-triazole moiety of posaconazole and
itraconazole as well as the piperazine-phenyl moiety of ketoconazole are depicted in red. Similarly, fluconazole and
voriconazole share also several functional groups as depicted in blue.
5.2.2 Effect of antifungal azoles on MDR3 protein levels
Very interestingly, itraconazole and posaconazole led to a marked time-dependent increase in MDR3
protein levels in our model system. No significant change in BSEP and NTCP (Fig. 23A and Fig.
23B) protein levels was detected under the same condition. As we used cDNAs to generate our model
cell line, an upregulation of the transcription should not be the reason for this. This is also further
supported by the observation that the PPRα agonists fenofibrate and bezafibrate, known to stimulate
MDR3 promoter activity (Ghonem et al., 2014), did not lead to a change of MDR3 protein levels in
our model cell line (Fig. 23B). We did not see an increase of mRNA for MDR3 (Fig. 25), ruling out a
stabilization of the mRNA by these two drugs. In addition to the marked increase of MDR3 protein
levels, in the Western blots it is observable a slight lower MDR3 band in cells treated with
posaconazole and itraconazole, suggesting that the increase may involve the de-glycosylated form
MDR3. N-glycosylation has been demonstrated to play a critical role in many biological processes,
Discussion 79
e.g. in protein folding and in maintenance of stability, in the regulation of intracellular targeting of
proteins and also in apical targeting of membrane proteins (Draheim et al., 2010). In a study it has
been shown that treating hepatocytes with tunicamycin, an inhibitor of glycosylation, decreased N-
glycosylation and simultaneously impaired the trafficking of MRP2 to the canalicular membrane
(Zhang et al., 2005). This would lead to the speculation that similarly to tunicamycin, itraconazole
and posaconazole by inhibiting N-glycosylation, and impairing apical targeting of MDR3, may inhibit
MDR3-mediated C6-NBD-PC secretion as shown by our results. Another possible explanation for
these observations could be direct binding of posaconazole and itraconazole to MDR3 followed by
protein inhibition and stabilization. MDR3 stabilization may cause a reduction of its degradation with
a consequent intracellular accumulation of de-glycosylated MDR3. Finally, also an increased
translation rate may lead to the increased intracellular accumulation of de-glycosylated protein and a
general rise of MDR3 protein levels. Elucidation of the exact molecular mechanisms of these
observations would require additional studies.
5.2.3 Effect of additional hepatotoxic drugs on MDR3 activity
Several additional drugs associated with cholestatic DILI were tested in our model system and
showed no effect (with exception of cyclosporin A). Of these drugs, co-amoxicillin (amoxicillin–
clavulanate), chlorpromazine and nefadozone have been implicated in liver failures and in several
cases of DILI in at least 3 countries registries (Spanish, Swedish and American) (Suzuki et al., 2010).
Amoxicillin–clavulanate is among the most commonly prescribed antibiotics worldwide and it is the
drug which has been most implicated with DILI (1 case out of 2300 users have been estimated)
(Bjornsson, 2015). The lack of effect of this drug on MDR3-mediated phospholipid secretion is
consistent with the immunoallergic pathogenic mechanism proposed for this drug. Co-amoxicillin-
induced liver injury manifests generally as cholestatic hepatitis, together with fever, rash and
eosinophilia. Similarly to co-amoxicillin, chlorpromazine induced hepatotoxicity has been associated
with an immunoallergic reaction (LiverTox.nih.gov[2016]). On the mechanism leading to
nefadozone-induced hepatotoxicity, less is known, but as nefadozone is extensively metabolized by
P450 enzymes generation of toxic metabolites may be involved. This illustrates the complexity and
the multifactorial nature of DILI. In addition, the inhibition by drugs detected in our in vitro model
system seems to be specific and suggests that our in vitro setup does not render MDR3 susceptible to
pathophysiological irrelevant inhibitions by drugs as a consequence of a lipid and protein
environment different from the canalicular membrane.
Discussion 80
5.2.4 Effect of cholagogues and fibrates on MDR3 activity
Cholagogues are traditionally used to enhance bile secretion and fibrates have been reported to
enhance MDR3-mediated transport, therefore we tested in our in vitro model if these compounds may
enhance MDR3-mediated C6-NBD-PC secretion. Molecular mechanisms underlying such an
enhancement could possibly involve 1) transcriptional upregulation of transporter expression,
2) protein stabilization on the membrane 3) cellular re-distribution of the transporter/apical sorting of
the transporter 4) reduction of protein turnover/protein degradation. Considering that our in vitro
model constitutively expresses MDR3, it is clear that is not possible to examine transcriptional
regulation of MDR3 in our BNMG cell line. However, the other mechanisms could be examined. In
our model system neither cholagogues nor fibrates enhanced MDR3-mediated C6-NBD-PC secretion.
The little reproducibility of the fibrates results could be due to a solubility problem as after adding the
stock solution (in DMSO) to the medium, formation of precipitates was observed under the
microscope. However, it is not clear from the literature how this technical issue was managed in
previous in vitro studies. It may be possible that the precipitation resulted from an interaction with a
specific component of the medium used for BNMG cells.

Discussion 81
5.2.5 Importance of transport proteins in drug development
In the last decades, the role of transporters as determinants of drug pharmacokinetic and drug-drug
interactions, in addition to drug metabolizing enzymes, has been increasingly recognized by the
regulatory agencies and the pharmaceutical industry (Brouwer et al., 2013; International Transporter
et al., 2010; Konig et al., 2013). As illustrated in this thesis, inhibition of drug transporters might not
only play a significant role on drug pharmacokinetic and drug efficacy of multimorbid and
polymedicated patients (such as elderly patients) but may also affect the fate of endogenous
molecules such as lipids, bilirubin and bile salts, posing significant potential safety liabilities (Funk,
2008). Accordingly, in both new drug-drug interactions guidelines issued by FDA and EMA there is
an increased emphasis on transporter based drug-drug interaction evaluations, and in both guidelines
the list of transporters considered as clinical relevant and recommended for in vitro inhibition studies
has grown (Prueksaritanont et al., 2013). In this context, many in vitro tools have been and are being
developed to study and predict drug transporters interactions or to clarify the mechanism of
unexpected interactions observed in vivo. However, to date only few studies have addressed the
question of the role of lipid transporters in drug interactions. In this work, we identified among the
clinically used drugs that were tested a potent inhibitor of phospholipid secretion. Future work is
required to understand the clinical significance or impact of this interaction in humans.
Discussion 82
5.2.6 Perspective
In this thesis an in vitro assay to study selected transporters implicated in DILI and their inhibition by
different drugs has been tested. Studying the interaction of drugs with transporters in our in vitro
model, we found that parallel inhibition of BSEP and MDR3 may underlie ketoconazole, itraconazole
and posaconazole induced liver injury. In addition, based on the literature, generation of toxic
metabolites is also implicated in itraconazole- and ketoconazole- induced liver injury (Somchit et al.,
2004). Similarly to this case, troglitazone-induced liver injury has been attributed to an inhibition of
BSEP, as well as to mitochondrial dysfunction by induction of oxidative stress. These examples show
that the pathogenesis of DILI is complex and that DILI may results by the interplay of several
simultaneous pathological mechanisms that can be sequentially not linked between each other (Roth
and Ganey, 2010). This complexity is also supported by the difficulty of diagnosing DILI. This
diagnosis is made by exclusion (e.g. other potential causes leading to liver disease are excluded).
Therefore, better diagnostic markers for the different types of DILI would be important to classify
patients and to guide future clinical research. In addition, a computational biology-based approach
aiming to integrate qualitative and quantitative data generated from in vitro/vivo models and/or
human clinical data (when available) into a comprehensive mechanistic model, that explains the
contribution of different pathological pathways to DILI, could be helpful to improve our
understanding and prediction of DILI (de Lima Toccafondo Vieira and Tagliati, 2014).
Besides progress in the direction of better clinical and mechanistic understanding of the disease, a
better molecular understanding of the underlying drug-protein interactions, leading to the activation
of pathological pathways, would be crucial to develop safer drugs. A prerequisite for this would be a
better structural understanding of the involved proteins e.g. ABC transporters. Currently no structure
is available for MDR3 and BSEP. Recently a structure for ABCG5/G8 has been published (Lee et al.,
2016). With structural information available, a computational structure-based approach could then be
used to design and finally develop safer drugs and/or modulators that could be used for future
research.
6 References
Adriaenssens B, Roskams T, Steger P and Van Steenbergen W (2001) Hepatotoxicity related to
itraconazole: report of three cases. Acta clinica Belgica 56(6): 364-369.
Adzet T, Camarasa J and Laguna JC (1987) Hepatoprotective Activity of Polyphenolic Compounds
from Cynara-Scolymus against Ccl4 Toxicity in Isolated Rat Hepatocytes. Journal of Natural
Products 50(4): 612-617.
Aithal GP, Watkins PB, Andrade RJ, Larrey D, Molokhia M, Takikawa H, Hunt CM, Wilke RA,
Avigan M, Kaplowitz N, Bjornsson E and Daly AK (2011) Case definition and phenotype
standardization in drug-induced liver injury. Clinical pharmacology and therapeutics 89(6):
806-815.
Alvaro D, Cantafora A, Attili AF, Ginanni Corradini S, De Luca C, Minervini G, Di Biase A and
Angelico M (1986) Relationships between bile salts hydrophilicity and phospholipid
composition in bile of various animal species. Comparative biochemistry and physiology B,
Comparative biochemistry 83(3): 551-554.
Amacher DE and Chalasani N (2014) Drug-induced hepatic steatosis. Seminars in liver disease 34(2):
205-214.
avantilipids.com (2016) Avanti Polar Lipids, Inc., AL, USA
Barone GW, Gurley BJ, Ketel BL, Lightfoot ML and Abul-Ezz SR (2000) Drug interaction between
St. John's wort and cyclosporine. The Annals of pharmacotherapy 34(9): 1013-1016.
Bhamidimarri KR and Schiff E (2013) Drug-induced cholestasis. Clinics in liver disease 17(4): 519-
531, vii.
Bjornsson ES (2015) Drug-induced liver injury: an overview over the most critical compounds.
Archives of toxicology 89(3): 327-334.
Bjornsson ES, Bergmann OM, Bjornsson HK, Kvaran RB and Olafsson S (2013) Incidence,
presentation, and outcomes in patients with drug-induced liver injury in the general
population of Iceland. Gastroenterology 144(7): 1419-1425, 1425 e1411-1413; quiz e1419-
1420.
Bligh EG and Dyer WJ (1959) A rapid method of total lipid extraction and purification. Canadian
journal of biochemistry and physiology 37(8): 911-917.
Boyer JL (2013) Bile formation and secretion. Comprehensive Physiology 3(3): 1035-1078.
Brouwer KL, Keppler D, Hoffmaster KA, Bow DA, Cheng Y, Lai Y, Palm JE, Stieger B, Evers R
and International Transporter C (2013) In vitro methods to support transporter evaluation in
drug discovery and development. Clinical pharmacology and therapeutics 94(1): 95-112.

References 84
Buschman E, Arceci RJ, Croop JM, Che M, Arias IM, Housman DE and Gros P (1992) mdr2 encodes
P-glycoprotein expressed in the bile canalicular membrane as determined by isoform-specific
antibodies. The Journal of biological chemistry 267(25): 18093-18099.
Cao X, Surma MA and Simons K (2012) Polarized sorting and trafficking in epithelial cells. Cell Res
22(5): 793-805.
Chang CH, Young-Xu Y, Kurth T, Orav JE and Chan AK (2007) The safety of oral antifungal
treatments for superficial dermatophytosis and onychomycosis: a meta-analysis. The
American journal of medicine 120(9): 791-798.
Cheng F, Theodorescu D, Schulman IG and Lee JK (2011) In vitro transcriptomic prediction of
hepatotoxicity for early drug discovery. Journal of theoretical biology 290: 27-36.
Chughlay M, Blockman M and Cohen K (2015) A clinical approach to drug-induced liver injury.
Current Allergy & Clinical Immunology 28(4).
Corsini A and Bortolini M (2013) Drug-induced liver injury: the role of drug metabolism and
transport. Journal of clinical pharmacology 53(5): 463-474.
Courtney R, Sansone A, Smith W, Marbury T, Statkevich P, Martinho M, Laughlin M and Swan S
(2005) Posaconazole pharmacokinetics, safety, and tolerability in subjects with varying
degrees of chronic renal disease. Journal of clinical pharmacology 45(2): 185-192.
Crivellato E, Candussio L, Rosati AM, Decorti G, Klugmann FB and Mallardi F (1999) Kinetics of
doxorubicin handling in the LLC-PK1 kidney epithelial cell line is mediated by both vesicle
formation and P-glycoprotein drug transport. The Histochemical journal 31(10): 635-643.
Cronin S and Chandrasekar PH (2010) Safety of triazole antifungal drugs in patients with cancer. The
Journal of antimicrobial chemotherapy 65(3): 410-416.
Cuthbertson L, Kos V and Whitfield C (2010) ABC transporters involved in export of cell surface
glycoconjugates. Microbiol Mol Biol Rev 74(3): 341-362.
Dawson S, Stahl S, Paul N, Barber J and Kenna JG (2012) In vitro inhibition of the bile salt export
pump correlates with risk of cholestatic drug-induced liver injury in humans. Drug
metabolism and disposition: the biological fate of chemicals 40(1): 130-138.
de Lima Toccafondo Vieira M and Tagliati CA (2014) Hepatobiliary transporters in drug-induced
cholestasis: a perspective on the current identifying tools. Expert opinion on drug metabolism
& toxicology 10(4): 581-597.
Dean M (2002) The Human ATP-Binding Cassette (ABC) Transporter Superfamily. National Center
for Biotechnology Information, US.
Derby LE, Gutthann SP, Jick H and Dean AD (1993) Liver disorders in patients receiving
chlorpromazine or isoniazid. Pharmacotherapy 13(4): 353-358.

References 85
Devarbhavi H, Dierkhising R, Kremers WK, Sandeep MS, Karanth D and Adarsh CK (2010) Single-
Center Experience With Drug-Induced Liver Injury From India: Causes, Outcome, Prognosis,
and Predictors of Mortality. American Journal of Gastroenterology 105(11): 2396-2404.
Dobson PD and Kell DB (2008) Carrier-mediated cellular uptake of pharmaceutical drugs: an
exception or the rule? Nature reviews Drug discovery 7(3): 205-220.
Doring B and Petzinger E (2014) Phase 0 and phase III transport in various organs: combined concept
of phases in xenobiotic transport and metabolism. Drug metabolism reviews 46(3): 261-282.
Dowling RH, Hussaini SH, Murphy GM, Besser GM and Wass JA (1992) Gallstones during
octreotide therapy. Metabolism: clinical and experimental 41(9 Suppl 2): 22-33.
Draheim V, Reichel A, Weitschies W and Moenning U (2010) N-glycosylation of ABC transporters
is associated with functional activity in sandwich-cultured rat hepatocytes. European journal
of pharmaceutical sciences : official journal of the European Federation for Pharmaceutical
Sciences 41(2): 201-209.
Ellinger P, Kluth M, Stindt J, Smits SH and Schmitt L (2013) Detergent screening and purification of
the human liver ABC transporters BSEP (ABCB11) and MDR3 (ABCB4) expressed in the
yeast Pichia pastoris. PloS one 8(4): e60620.
Elvington SM and Nichols JW (2007) Spontaneous, intervesicular transfer rates of fluorescent, acyl
chain-labeled phosphatidylcholine analogs. Biochimica et biophysica acta 1768(3): 502-508.
Farrell GC (1994) Drug-induced liver disease. Longman Singapore Publishers, Singapore.
Fontana RJ (2014) Pathogenesis of idiosyncratic drug-induced liver injury and clinical perspectives.
Gastroenterology 146(4): 914-928.
Frampton JE and Scott LJ (2008) Posaconazole : a review of its use in the prophylaxis of invasive
fungal infections. Drugs 68(7): 993-1016.
Fujikura K, Ingelman-Sundberg M and Lauschke VM (2015) Genetic variation in the human
cytochrome P450 supergene family. Pharmacogenetics and genomics 25(12): 584-594.
Funk C (2008) The role of hepatic transporters in drug elimination. Expert opinion on drug
metabolism & toxicology 4(4): 363-379.
Gearhart MO (1994) Worsening of liver function with fluconazole and review of azole antifungal
hepatotoxicity. The Annals of pharmacotherapy 28(10): 1177-1181.
Gerloff T, Meier PJ and Stieger B (1998) Taurocholate induces preferential release of
phosphatidylcholine from rat liver canalicular vesicles. Liver 18(5): 306-312.
Ghonem NS, Ananthanarayanan M, Soroka CJ and Boyer JL (2014) Peroxisome proliferator-
activated receptor alpha activates human multidrug resistance transporter 3/ATP-binding
cassette protein subfamily B4 transcription and increases rat biliary phosphatidylcholine
secretion. Hepatology 59(3): 1030-1042.

References 86
Girmenia C (2009) New generation azole antifungals in clinical investigation. Expert opinion on
investigational drugs 18(9): 1279-1295.
Goh LB, Spears KJ, Yao D, Ayrton A, Morgan P, Roland Wolf C and Friedberg T (2002)
Endogenous drug transporters in in vitro and in vivo models for the prediction of drug
disposition in man. Biochemical pharmacology 64(11): 1569-1578.
Gonzalez RJ and Tarloff JB (2004) Expression and activities of several drug-metabolizing enzymes in
LLC-PK1 cells. Toxicology in vitro : an international journal published in association with
BIBRA 18(6): 887-894.
Greer ML, Barber J, Eakins J and Kenna JG (2010) Cell based approaches for evaluation of drug-
induced liver injury. Toxicology 268(3): 125-131.
Grenier E, Garofalo C, Delvin E and Levy E (2012) Modulatory role of PYY in transport and
metabolism of cholesterol in intestinal epithelial cells. PloS one 7(7): e40992.
Gupta AK, Daigle D and Foley KA (2015) Drug safety assessment of oral formulations of
ketoconazole. Expert opinion on drug safety 14(2): 325-334.
Hagenbuch B and Stieger B (2013) The SLCO (former SLC21) superfamily of transporters.
Molecular aspects of medicine 34(2-3): 396-412.
Hann SK, Kim JB, Im S, Han KH and Park YK (1993) Itraconazole-Induced Acute Hepatitis. Brit J
Dermatol 129(4): 500-501.
Hay RJ (1993) Risk/benefit ratio of modern antifungal therapy: focus on hepatic reactions. Journal of
the American Academy of Dermatology 29(1): S50-54.
He K, Cai L, Shi Q, Liu H and Woolf TF (2015) Inhibition of MDR3 Activity in Human Hepatocytes
by Drugs Associated with Liver Injury. Chemical research in toxicology 28(10): 1987-1990.
Hidalgo IJ, Raub TJ and Borchardt RT (1989) Characterization of the human colon carcinoma cell
line (Caco-2) as a model system for intestinal epithelial permeability. Gastroenterology 96(3):
736-749.
Higgins CF and Linton KJ (2004) The ATP switch model for ABC transporters. Nature structural &
molecular biology 11(10): 918-926.
Ho RH, Tirona RG, Leake BF, Glaeser H, Lee W, Lemke CJ, Wang Y and Kim RB (2006) Drug and
bile acid transporters in rosuvastatin hepatic uptake: function, expression, and
pharmacogenetics. Gastroenterology 130(6): 1793-1806.
Holland IB, Cole SPC, Kuchler K and Higgins CF (2003) ABC Proteins: From Bacteria to Man.
Academic Press, London.
Hollenstein K, Dawson RJ and Locher KP (2007) Structure and mechanism of ABC transporter
proteins. Curr Opin Struct Biol 17(4): 412-418.
Hosoya KI, Kim KJ and Lee VH (1996) Age-dependent expression of P-glycoprotein gp170 in Caco-
2 cell monolayers. Pharmaceutical research 13(6): 885-890.

References 87
Huang L, Hoffman T and Vore M (1998) Adenosine triphosphate-dependent transport of estradiol-
17beta(beta-D-glucuronide) in membrane vesicles by MDR1 expressed in insect cells.
Hepatology 28(5): 1371-1377.
Hussaini SH and Farrington EA (2007) Idiosyncratic drug-induced liver injury: an overview. Expert
opinion on drug safety 6(6): 673-684.
Hussaini SH and Farrington EA (2014) Idiosyncratic drug-induced liver injury: an update on the 2007
overview. Expert opinion on drug safety 13(1): 67-81.
Ingelman-Sundberg M (2004) Human drug metabolising cytochrome P450 enzymes: properties and
polymorphisms. Naunyn-Schmiedeberg's archives of pharmacology 369(1): 89-104.
International Transporter C, Giacomini KM, Huang SM, Tweedie DJ, Benet LZ, Brouwer KL, Chu
X, Dahlin A, Evers R, Fischer V, Hillgren KM, Hoffmaster KA, Ishikawa T, Keppler D, Kim
RB, Lee CA, Niemi M, Polli JW, Sugiyama Y, Swaan PW, Ware JA, Wright SH, Yee SW,
Zamek-Gliszczynski MJ and Zhang L (2010) Membrane transporters in drug development.
Nature reviews Drug discovery 9(3): 215-236.
Jacquemin E (2012) Progressive familial intrahepatic cholestasis. Clinics and research in hepatology
and gastroenterology 36 Suppl 1: S26-35.
Jaeschke H, Gores GJ, Cederbaum AI, Hinson JA, Pessayre D and Lemasters JJ (2002) Mechanisms
of hepatotoxicity. Toxicological sciences : an official journal of the Society of Toxicology
65(2): 166-176.
Johansson I and Ingelman-Sundberg M (2011) Genetic polymorphism and toxicology--with emphasis
on cytochrome p450. Toxicological sciences : an official journal of the Society of Toxicology
120(1): 1-13.
Ju C and Reilly T (2012) Role of immune reactions in drug-induced liver injury (DILI). Drug
metabolism reviews 44(1): 107-115.
Jungermann K (1987) Metabolic zonation of liver parenchyma: significance for the regulation of
glycogen metabolism, gluconeogenesis, and glycolysis. Diabetes Metab Rev 3(1): 269-293.
Kaplowitz N (2004) Drug-induced liver injury. Clinical infectious diseases : an official publication of
the Infectious Diseases Society of America 38 Suppl 2: S44-48.
Kaplowitz N and DeLeve LD (2003) Drug-induced liver disease. New York: Marcel Dekker.
Kaplowitz N and DeLeve LD (2013) Drug-induced liver disease. Third edition ed. Academic Press.
Kirchhoff R, Beckers C, Kirchhoff GM, Trinczek-Gartner H, Petrowicz O and Reimann HJ (1994)
Increase in choleresis by means of artichoke extract. Phytomedicine 1(2): 107-115.
Klaassen C (2008) Casarett & Doull's Toxicology: the basic science of poison. Seventh ed.
Klaassen CD and Watkins III JB (2010) Casarett & Doull's Essentials of Toxicology. Second ed.
McGraw-Hill.

References 88
Kock K, Ferslew BC, Netterberg I, Yang K, Urban TJ, Swaan PW, Stewart PW and Brouwer KL
(2014) Risk factors for development of cholestatic drug-induced liver injury: inhibition of
hepatic basolateral bile acid transporters multidrug resistance-associated proteins 3 and 4.
Drug metabolism and disposition: the biological fate of chemicals 42(4): 665-674.
Konig J, Muller F and Fromm MF (2013) Transporters and drug-drug interactions: important
determinants of drug disposition and effects. Pharmacological reviews 65(3): 944-966.
Kraft K (1997) Artichoke leaf extract - Recent findings reflecting effects on lipid metabolism, liver
and gastrointestinal tracts. Phytomedicine 4(4): 369-378.
Kuteykin-Teplyakov K, Luna-Tortos C, Ambroziak K and Loscher W (2010) Differences in the
expression of endogenous efflux transporters in MDR1-transfected versus wildtype cell lines
affect P-glycoprotein mediated drug transport. British journal of pharmacology 160(6): 1453-
1463.
Labbe G, Pessayre D and Fromenty B (2008) Drug-induced liver injury through mitochondrial
dysfunction: mechanisms and detection during preclinical safety studies. Fundamental &
clinical pharmacology 22(4): 335-353.
Lavrijsen AP, Balmus KJ, Nugteren-Huying WM, Roldaan AC, van't Wout JW and Stricker BH
(1992) Hepatic injury associated with itraconazole. Lancet 340(8813): 251-252.
Lee JY, Kinch LN, Borek DM, Wang J, Wang J, Urbatsch IL, Xie XS, Grishin NV, Cohen JC,
Otwinowski Z, Hobbs HH and Rosenbaum DM (2016) Crystal structure of the human sterol
transporter ABCG5/ABCG8. Nature 533(7604): 561-564.
Leise MD, Poterucha JJ and Talwalkar JA (2014) Drug-induced liver injury. Mayo Clinic
proceedings 89(1): 95-106.
Lewis JH (2000) Drug-induced liver disease. Med Clin North Am 84(5): 1275-1311, x.
Liu J, Kesiry R, Periyasamy SM, Malhotra D, Xie Z and Shapiro JI (2004) Ouabain induces
endocytosis of plasmalemmal Na/K-ATPase in LLC-PK1 cells by a clathrin-dependent
mechanism. Kidney international 66(1): 227-241.
LiverTox.nih.gov[2016] LiverTox: Clinical and Research Information on Drug-Induced Liver Injury,
NIH, U.S National Library of Medicine NLM and NIDDK, National Institute of Diabetes and
Digestive and Kidney Diseases
Locher KP (2009) Review. Structure and mechanism of ATP-binding cassette transporters. Philos
Trans R Soc Lond B Biol Sci 364(1514): 239-245.
Locher KP (2016) Mechanistic diversity in ATP-binding cassette (ABC) transporters. Nature
structural & molecular biology 23(6): 487-493.
Mahdi ZM, Synal-Hermanns U, Yoker A, Locher KP and Stieger B (2016) Role of Multidrug
Resistance Protein 3 (MDR3) in Antifungal-Induced Cholestasis. Molecular pharmacology.

References 89
Masubuchi Y, Kano S and Horie T (2006) Mitochondrial permeability transition as a potential
determinant of hepatotoxicity of antidiabetic thiazolidinediones. Toxicology 222(3): 233-239.
Matuschowski P, Gumbinger HG and Winterhoff H (1997) Influence of Cynara scolymus L on bile
flow and bile acid production in the isolated perfused rat liver. N-S Arch Pharmacol 355(4):
398-398.
McCuskey R (2012) Pathophysiology of the Liver, Chapter: Anatomy of the Liver, in Zakim and
Boyer's Hepatology: A Textbook of Liver Disease (Boyer TD, Manns MP and Sanyal AJ eds),
Elsevier.
Morgan RE, Trauner M, van Staden CJ, Lee PH, Ramachandran B, Eschenberg M, Afshari CA,
Qualls CW, Jr., Lightfoot-Dunn R and Hamadeh HK (2010) Interference with bile salt export
pump function is a susceptibility factor for human liver injury in drug development.
Toxicological sciences: an official journal of the Society of Toxicology 118(2): 485-500.
Morgan RE, van Staden CJ, Chen Y, Kalyanaraman N, Kalanzi J, Dunn RT, 2nd, Afshari CA and
Hamadeh HK (2013) A multifactorial approach to hepatobiliary transporter assessment
enables improved therapeutic compound development. Toxicological sciences : an official
journal of the Society of Toxicology 136(1): 216-241.
Morita SY, Kobayashi A, Takanezawa Y, Kioka N, Handa T, Arai H, Matsuo M and Ueda K (2007)
Bile salt-dependent efflux of cellular phospholipids mediated by ATP binding cassette protein
B4. Hepatology 46(1): 188-199.
Morita SY, Tsuda T, Horikami M, Teraoka R, Kitagawa S and Terada T (2013) Bile salt-stimulated
phospholipid efflux mediated by ABCB4 localized in nonraft membranes. Journal of lipid
research 54(5): 1221-1230.
Moton A, Krishna G and Wang Z (2009) Tolerability and safety profile of posaconazole: evaluation
of 18 controlled studies in healthy volunteers. Journal of clinical pharmacy and therapeutics
34(3): 301-311.
Nicolaou M, Andress EJ, Zolnerciks JK, Dixon PH, Williamson C and Linton KJ (2012) Canalicular
ABC transporters and liver disease. The Journal of pathology 226(2): 300-315.
Niemi M (2007) Role of OATP transporters in the disposition of drugs. Pharmacogenomics 8(7):
787-802.
O'Brien P, Carrasco-Pozo C and Speisky H (2006) Boldine and its antioxidant or health-promoting
properties. Chemico-biological interactions 159(1): 1-17.
Obaidat A, Roth M and Hagenbuch B (2012) The expression and function of organic anion
transporting polypeptides in normal tissues and in cancer. Annu Rev Pharmacol Toxicol 52:
135-151.
Ogu CC and Maxa JL (2000) Drug interactions due to cytochrome P450. Proceedings 13(4): 421-
423.

References 90
Ohno H, Tomemori T, Nakatsu F, Okazaki Y, Aguilar RC, Foelsch H, Mellman I, Saito T, Shirasawa
T and Bonifacino JS (1999) Mu1B, a novel adaptor medium chain expressed in polarized
epithelial cells. FEBS letters 449(2-3): 215-220.
Park SH and Ishino R (2013) Liver injury associated with antidepressants. Curr Drug Saf 8(3): 207-
223.
Pauli-Magnus C and Meier PJ (2006) Hepatobiliary transporters and drug-induced cholestasis.
Hepatology 44(4): 778-787.
Pauli-Magnus C, Meier PJ and Stieger B (2010) Genetic determinants of drug-induced cholestasis
and intrahepatic cholestasis of pregnancy. Seminars in liver disease 30(2): 147-159.
Perez C, Gerber S, Boilevin J, Bucher M, Darbre T, Aebi M, Reymond JL and Locher KP (2015)
Structure and mechanism of an active lipid-linked oligosaccharide flippase. Nature
524(7566): 433-438.
Phillips GB (1960) The lipid composition of human bile. Biochimica et biophysica acta 41: 361-363.
Prueksaritanont T, Chu X, Gibson C, Cui D, Yee KL, Ballard J, Cabalu T and Hochman J (2013)
Drug-drug interaction studies: regulatory guidance and an industry perspective. The AAPS
journal 15(3): 629-645.
Raggers RJ, Vogels I and van Meer G (2002) Upregulation of the expression of endogenous Mdr1 P-
glycoprotein enhances lipid translocation in MDCK cells transfected with human MRP2.
Histochemistry and cell biology 117(2): 181-185.
Ramachandran R and Kakar S (2009) Histological patterns in drug-induced liver disease. Journal of
clinical pathology 62(6): 481-492.
Raschi E, Poluzzi E, Koci A, Caraceni P and Ponti FD (2014) Assessing liver injury associated with
antimycotics: Concise literature review and clues from data mining of the FAERS database.
World journal of hepatology 6(8): 601-612.
Reuben A, Koch DG, Lee WM and Acute Liver Failure Study G (2010) Drug-induced acute liver
failure: results of a U.S. multicenter, prospective study. Hepatology 52(6): 2065-2076.
Roth RA and Ganey P (2010) Volume 9: Hepatic Toxicology, in Comprehensive Toxicology,
Elsevier.
Rudkowska I and Jones PJ (2008) Polymorphisms in ABCG5/G8 transporters linked to
hypercholesterolemia and gallstone disease. Nutr Rev 66(6): 343-348.
Ruetz S and Gros P (1994) Phosphatidylcholine translocase: a physiological role for the mdr2 gene.
Cell 77(7): 1071-1081.
Ruetz S and Gros P (1995) Enhancement of Mdr2-mediated phosphatidylcholine translocation by the
bile salt taurocholate. Implications for hepatic bile formation. The Journal of biological
chemistry 270(43): 25388-25395.
References 91
Salem MB, Affes H, Ksouda K, Dhouibi R, Sahnoun Z, Hammami S and Zeghal KM (2015)
Pharmacological Studies of Artichoke Leaf Extract and Their Health Benefits. Plant foods for
human nutrition.
Scheffer GL, Kool M, Heijn M, de Haas M, Pijnenborg AC, Wijnholds J, van Helvoort A, de Jong
MC, Hooijberg JH, Mol CA, van der Linden M, de Vree JM, van der Valk P, Elferink RP,
Borst P and Scheper RJ (2000) Specific detection of multidrug resistance proteins MRP1,
MRP2, MRP3, MRP5, and MDR3 P-glycoprotein with a panel of monoclonal antibodies.
Cancer research 60(18): 5269-5277.
Shoda J, Inada Y, Tsuji A, Kusama H, Ueda T, Ikegami T, Suzuki H, Sugiyama Y, Cohen DE and
Tanaka N (2004) Bezafibrate stimulates canalicular localization of NBD-labeled PC in
HepG2 cells by PPARalpha-mediated redistribution of ABCB4. Journal of lipid research
45(10): 1813-1825.
Shoda J, Okada K, Inada Y, Kusama H, Utsunomiya H, Oda K, Yokoi T, Yoshizato K and Suzuki H
(2007) Bezafibrate induces multidrug-resistance P-Glycoprotein 3 expression in cultured
human hepatocytes and humanized livers of chimeric mice. Hepatology research : the official
journal of the Japan Society of Hepatology 37(7): 548-556.
Shugarts S and Benet LZ (2009) The role of transporters in the pharmacokinetics of orally
administered drugs. Pharmaceutical research 26(9): 2039-2054.
Small DM (2003) Role of ABC transporters in secretion of cholesterol from liver into bile.
Proceedings of the National Academy of Sciences of the United States of America 100(1): 4-6.
Smit JJ, Schinkel AH, Oude Elferink RP, Groen AK, Wagenaar E, van Deemter L, Mol CA,
Ottenhoff R, van der Lugt NM, van Roon MA and et al. (1993) Homozygous disruption of the
murine mdr2 P-glycoprotein gene leads to a complete absence of phospholipid from bile and
to liver disease. Cell 75(3): 451-462.
Smith AJ, Timmermans-Hereijgers JL, Roelofsen B, Wirtz KW, van Blitterswijk WJ, Smit JJ,
Schinkel AH and Borst P (1994) The human MDR3 P-glycoprotein promotes translocation of
phosphatidylcholine through the plasma membrane of fibroblasts from transgenic mice. FEBS
letters 354(3): 263-266.
Smith AJ, van Helvoort A, van Meer G, Szabo K, Welker E, Szakacs G, Varadi A, Sarkadi B and
Borst P (2000) MDR3 P-glycoprotein, a phosphatidylcholine translocase, transports several
cytotoxic drugs and directly interacts with drugs as judged by interference with nucleotide
trapping. The Journal of biological chemistry 275(31): 23530-23539.
Smith MT (2003) Mechanisms of troglitazone hepatotoxicity. Chemical research in toxicology 16(6):
679-687.
References 92
Smith PK, Krohn RI, Hermanson GT, Mallia AK, Gartner FH, Provenzano MD, Fujimoto EK, Goeke
NM, Olson BJ and Klenk DC (1985) Measurement of Protein Using Bicinchoninic Acid.
Analytical biochemistry 150(1): 76-85.
Somchit N, Hassim SM and Samsudin SH (2002) Itraconazole- and fluconazole-induced toxicity in
rat hepatocytes: a comparative in vitro study. Human & experimental toxicology 21(1): 43-48.
Somchit N, Norshahida AR, Hasiah AH, Zuraini A, Sulaiman MR and Noordin MM (2004)
Hepatotoxicity induced by antifungal drugs itraconazole and fluconazole in rats: a
comparative in vivo study. Human & experimental toxicology 23(11): 519-525.
Speisky H and Cassels BK (1994) Boldo and boldine: an emerging case of natural drug development.
Pharmacol Res 29(1): 1-12.
Stewart WW (1978) Functional connections between cells as revealed by dye-coupling with a highly
fluorescent naphthalimide tracer. Cell 14(3): 741-759.
Stewart WW (1981) Lucifer dyes--highly fluorescent dyes for biological tracing. Nature 292(5818):
17-21.
Stieger B (2010) Role of the bile salt export pump, BSEP, in acquired forms of cholestasis. Drug
metabolism reviews 42(3): 437-445.
Stieger B (2011) The role of the sodium-taurocholate cotransporting polypeptide (NTCP) and of the
bile salt export pump (BSEP) in physiology and pathophysiology of bile formation.
Handbook of experimental pharmacology(201): 205-259.
Suzuki A, Andrade RJ, Bjornsson E, Lucena MI, Lee WM, Yuen NA, Hunt CM and Freston JW
(2010) Drugs associated with hepatotoxicity and their reporting frequency of liver adverse
events in VigiBase: unified list based on international collaborative work. Drug safety 33(6):
503-522.
Szakacs G, Varadi A, Ozvegy-Laczka C and Sarkadi B (2008) The role of ABC transporters in drug
absorption, distribution, metabolism, excretion and toxicity (ADME-Tox). Drug discovery
today 13(9-10): 379-393.
Talwalkar JA, Soetikno RE, Carr-Locke DL and Berg CL (1999) Severe cholestasis related to
intraconazole for the treatment of onychomycosis. The American journal of gastroenterology
94(12): 3632-3633.
Thompson RA, Isin EM, Li Y, Weidolf L, Page K, Wilson I, Swallow S, Middleton B, Stahl S, Foster
AJ, Dolgos H, Weaver R and Kenna JG (2012) In vitro approach to assess the potential for
risk of idiosyncratic adverse reactions caused by candidate drugs. Chemical research in
toxicology 25(8): 1616-1632.
Trauner M, Fickert P, Halilbasic E and Moustafa T (2008) Lessons from the toxic bile concept for the
pathogenesis and treatment of cholestatic liver diseases. Wiener medizinische Wochenschrift
158(19-20): 542-548.
References 93
Trauner M, Fickert P and Wagner M (2007) MDR3 (ABCB4) defects: a paradigm for the genetics of
adult cholestatic syndromes. Seminars in liver disease 27(1): 77-98.
Trubiano JA, Crowe A, Worth LJ, Thursky KA and Slavin MA (2015) Putting CYP2C19 genotyping
to the test: utility of pharmacogenomic evaluation in a voriconazole-treated haematology
cohort. The Journal of antimicrobial chemotherapy 70(4): 1161-1165.
Uchida Y, Ohtsuki S, Kamiie J, Ohmine K, Iwase R and Terasaki T (2015) Quantitative targeted
absolute proteomics for 28 human transporters in plasma membrane of Caco-2 cell monolayer
cultured for 2, 3, and 4 weeks. Drug metabolism and pharmacokinetics 30(2): 205-208.
van Den Elsen JM, Kuntz DA, Hoedemaeker FJ and Rose DR (1999) Antibody C219 recognizes an
alpha-helical epitope on P-glycoprotein. Proceedings of the National Academy of Sciences of
the United States of America 96(24): 13679-13684.
van der Bliek AM, Kooiman PM, Schneider C and Borst P (1988) Sequence of mdr3 cDNA encoding
a human P-glycoprotein. Gene 71(2): 401-411.
van Helvoort A, Smith AJ, Sprong H, Fritzsche I, Schinkel AH, Borst P and van Meer G (1996)
MDR1 P-glycoprotein is a lipid translocase of broad specificity, while MDR3 P-glycoprotein
specifically translocates phosphatidylcholine. Cell 87(3): 507-517.
Vavricka SR, Van Montfoort J, Ha HR, Meier PJ and Fattinger K (2002) Interactions of rifamycin SV
and rifampicin with organic anion uptake systems of human liver. Hepatology 36(1): 164-172.
Vrins C, Vink E, Vandenberghe KE, Frijters R, Seppen J and Groen AK (2007) The sterol
transporting heterodimer ABCG5/ABCG8 requires bile salts to mediate cholesterol efflux.
FEBS letters 581(24): 4616-4620.
Wang JS, Zhu HJ, Markowitz JS, Donovan JL and DeVane CL (2006) Evaluation of antipsychotic
drugs as inhibitors of multidrug resistance transporter P-glycoprotein. Psychopharmacology
187(4): 415-423.
Wegener T and Fintelmann V (1999) [Pharmacological properties and therapeutic profile of artichoke
(Cynara scolymus L.)]. Wiener medizinische Wochenschrift 149(8-10): 241-247.
Wei G, Bergquist A, Broome U, Lindgren S, Wallerstedt S, Almer S, Sangfelt P, Danielsson A,
Sandberg-Gertzen H, Loof L, Prytz H and Bjornsson E (2007) Acute liver failure in Sweden:
etiology and outcome. Journal of internal medicine 262(3): 393-401.
Wlcek K and Stieger B (2014) ATP-binding cassette transporters in liver. BioFactors 40(2): 188-198.
Wu CP, Calcagno AM and Ambudkar SV (2008) Reversal of ABC drug transporter-mediated
multidrug resistance in cancer cells: evaluation of current strategies. Curr Mol Pharmacol
1(2): 93-105.
Yang K, Guo C, Woodhead JL, St Claire RL, 3rd, Watkins PB, Siler SQ, Howell BA and Brouwer
KL (2016) Sandwich-Cultured Hepatocytes as a Tool to Study Drug Disposition and Drug-
Induced Liver Injury. Journal of pharmaceutical sciences 105(2): 443-459.

References 94
Yang K, Pfeifer ND, Kock K and Brouwer KL (2015) Species differences in hepatobiliary disposition
of taurocholic acid in human and rat sandwich-cultured hepatocytes: implications for drug-
induced liver injury. The Journal of pharmacology and experimental therapeutics 353(2):
415-423.
Yoshikado T, Takada T, Yamamoto T, Yamaji H, Ito K, Santa T, Yokota H, Yatomi Y, Yoshida H,
Goto J, Tsuji S and Suzuki H (2011) Itraconazole-Induced Cholestasis: Involvement of the
Inhibition of Bile Canalicular Phospholipid Translocator MDR3/ABCB4. Molecular
pharmacology 79(2): 241-250.
Yuan L and Kaplowitz N (2013) Mechanisms of drug-induced liver injury. Clinics in liver disease
17(4): 507-518, vii.
Zagorova M, Prasnicka A, Kadova Z, Dolezelova E, Kazdova L, Cermanova J, Rozkydalova L,
Hroch M, Mokry J and Micuda S (2015) Boldine attenuates cholestasis associated with
nonalcoholic fatty liver disease in hereditary hypertriglyceridemic rats fed by high-sucrose
diet. Physiological research / Academia Scientiarum Bohemoslovaca 64 Suppl 4: S467-476.
Zanger UM and Schwab M (2013) Cytochrome P450 enzymes in drug metabolism: regulation of
gene expression, enzyme activities, and impact of genetic variation. Pharmacology &
therapeutics 138(1): 103-141.
Zhang D, Luo G, Ding X and Lu C (2012) Preclinical experimental models of drug metabolism and
disposition in drug discovery and development Acta Pharmaceutica Sinica B 2(6): 549–561.
Zhang P, Tian X, Chandra P and Brouwer KL (2005) Role of glycosylation in trafficking of Mrp2 in
sandwich-cultured rat hepatocytes. Molecular pharmacology 67(4): 1334-1341.
Zimmerman HJ (2000) Drug-induced liver disease. Clinics in liver disease 4(1): 73-96, vi.

7 Appendix
7.1 Publications
Mahdi ZM, Synal-Hermanns U, Yoker A, Locher KP and Stieger B (2016). Role of Multidrug
Resistance Protein 3 (MDR3) in Antifungal-Induced Cholestasis. Molecular Pharmacology. 90(1):
23-34
Stieger B, Mahdi ZM, Jäger W (2017). Intestinal and Hepatocellular Transporters: Therapeutic
Effects and Drug Interactions of Herbal Supplements. Annual Review of Pharmacology and
Toxicology. [2016, Epub ahead of print]
7.2 Presentations at selected conferences
2015 Biomedical Transporter Conference, Lugano (poster)
2015 Day of Day of Clinical Research, University Hospital Zurich (poster)
2015 Deuel Conference on Lipids, Monterey, California (poster)
2014 7th SFB35 Transmembrane transporters in health and disease (talk and poster)
2014 13th Hepatobiliary and Gastrointestinal Research Retreat, Vulpera (talk)
2013 Biomedical Transporter Conference, St. Moritz (poster)
2013 Hepatobiliary Transport, Bile Acids and Liver Disease, Mariahof, Austria (talk)
2013 12th Hepatobiliary and Gastrointestinal Research Retreat, Vulpera (talk)