in europe - hay group · please speak to your local hay group consultant or email execrewardeurope@...
TRANSCRIPT

Non–executive
directorsin EuropePay practices, structures and diversity of leading European companies
This review provides a detailed snapshot of the background, experiences and pay of the individuals responsible for the governance of Europe’s companies.
February 2013

Contact usFor more information or to discuss this report further, please speak to your local Hay Group consultant or email [email protected]

Contents
European overview
Remuneration
Board structure
Independence
4
5
8
10
11
12
19
20
22
26
28
30
32
34
36
38
40
42
45
46
48
50
51
54
Multi-chair responsibility
Diversity
Country analysis – Europe
Austria
Belgium
France
Germany
Italy
Netherlands
Norway
Spain
Sweden
Switzerland
UK
Regional analysis – outside Europe
US
Asia
Brazil
Methodology
Sample
24 Finland

Non–executive directors in Europe4
©2013 Hay Group. All rights reserved
European overview
The role of non-executive directors (we will call them ‘directors’ for the purposes of this report) continues to evolve. Improvements are being made to the composition and competency of company boards and we are beginning to see directors coming onto the board with a more diverse set of skills and experience. Whilst our data shows that there continues to be a wide range of pay practices for directors across Europe, we are still anticipating that this range will narrow as the search for talent moves deeper into the international arena.
Board structures have not changed much compared to last year. European boards have a median of nine directors, with a median as high as 15 on Spanish boards. The vast majority of companies in our sample also have separate audit and remuneration committees, with many also having a nominations committee, and a few having a risk committee. Each committee has director members selected from the population of the broader board.
This study also provides a commentary on director trends in the US, Asia and Brazil, which can be found at the end of the report.
Our approach
This study is designed to provide a comparison of board composition and remuneration for major companies across Europe. We looked at the constituent companies of the major indices for 12 European countries (a full list of these companies is provided at the back of the report). The data we collected is from the most recently filed public documentation, primarily annual reports. The data covers non-executive directors elected by general meeting, thus excluding all executive management and employee representatives.
We have reported on both the policy pay information and the actual pay information for each organisation. Policy pay data represents the typical pay that each director expects to receive for service on the main board and committees, including meeting fees (per meeting) if applicable. Actual pay data is the amount paid to each individual director as reported in the audited annual reports. This figure will be affected by factors such as the specific number of committees an individual sits on, how many meetings they attended and, if any form of variable pay is involved, the performance of the company.
We have chosen to report most figures as median (rather than average) as this minimises the impact of extreme or unusual results and is more representative of the ‘true’ picture. Throughout the report we also refer to the concept of ‘median average’. This refers to how we calculated the actual awards – we calculated an incumbent average for each company and then took the median of those averages.
All European values have been converted to Euros taking the exchange rate as of 31 December 2011.

www.haygroup.com
Remuneration
Director remuneration and fee policy varies widely across Europe. Board fees typically include fixed and variable pay components, the latter usually in the form of meeting fees. The median basic policy fee paid to directors across Europe is €58,100, with fees for Austrian directors being the lowest at €15,000 and for Swiss directors highest at €197,500.
Most companies across Europe pay their fees wholly in the form of cash but equity awards are made in a few cases. Seven per cent of companies in our sample part pay their NEDs in equity and this is particularly prevalent in countries such as Finland and Switzerland. German director pay differs in that most German companies part pay their directors in the form of variable cash.
99 per cent of companies in the survey have an audit committee, where the basic median committee fee is an additional €14,000 for director members and an additional €23,000 for the committee chair. 96 per cent of companies have a committee which handles remuneration of the board, where the median basic committee fee across Europe is an additional €11,100 for members and an additional €17,000 for the chair. In over a quarter of companies, the board non-executive chair also chairs the remuneration committee.
Policy feesPolicy fee figures represent the rates of pay the company has stated it will pay directors for service on the main board and committees. In addition to these fees may be attendance fees and, in some countries, variable pay linked to company performance.
Disclosure on risk committee directors was insufficient this year to provide country medians for all countries other than the UK. In the UK the risk committee chair earns €34,600 at the median and the risk committee members earn €13,830 at the median.
Table 1: Median policy fees by country
Austria € 30,000 € 15,000 - - - - - -
Belgium € 60,000 € 31,500 € 15,000 € 6,900 € 15,000 € 7,500 - -
Finland € 82,000 € 45,900 € 14,300 - - - - -
France € 425,000 € 20,000 € 20,000 € 14,000 € 15,000 € 10,000 € 15,000 € 9,200
Germany € 150,000 € 62,000 € 40,000 € 20,000 € 40,000 € 20,000 € 30,000 € 18,800
Italy € 240,000 € 50,000 € 30,000 € 22,500 € 25,000 € 20,000 € 17,500 € 15,800
Netherlands € 72,500 € 50,000 € 12,000 € 8,000 € 9,000 € 6,000 € 9,000 € 5,000
Norway € 70,500 € 38,500 € 15,500 € 9,900 - - - -
Spain - € 100,000 € 60,000 € 30,000 € 44,100 € 25,000 € 57,500 € 42,500
Sweden € 174,400 € 56,800 € 20,600 € 12,800 € 11,100 € 11,100 - -
Switzerland € 845,400 € 197,500 € 77,200 € 40,600 € 69,100 € 28,500 € 48,800 € 24,400
UK € 402,400 € 70,900 € 23,100 € 11,600 € 18,900 € 11,500 € 12,400 € 8,600
European median € 232,600 € 58,100 € 23,000 € 14,000 € 17,300 € 11,100 € 15,000 € 10,000
Median additional committee retainersCountry
Median basic board fees
Non-executive chair
Director
Chair
Member
Chair
Member
Chair
Member
Audit Remuneration Average other

Non–executive directors in Europe6
©2013 Hay Group. All rights reserved
€0 €100,000 €200,000 €300,000 €400,000 €500,000 €600,000 €700,000 €800,000 €900,000 €1,100,000€1,000,000
Switzerland
Spain
Italy
UK
France
Germany
Sweden
Belgium
Netherlands
Finland
Norway
Austria
European median
Median market cap (x100,000) Average directors’ totalNon-executive chair total
Actual payActual pay is the amount paid to each individual director, as reported in the audited annual report. This figure will be affected by the number of committees an individual sits on, how many meetings they attended and, if any form of variable pay is involved, the performance of the company.
Our figures for actual pay show the total fees paid to directors and non-executive chairs for services throughout the year, including fees for meetings attended. Most companies require a time commitment of between 11 and 14 board and committee meetings a year. The median fee earned for non-executive chairs across Europe was €214,800 during the year, down from €237,900 last year, with Swiss non-executive chairs continuing to earn the most at €1,077,100 and Austrian non-executive chairs earning the least at €51,600. The median received by other directors across Europe was €75,200, up from €71,500 last year, with Swiss directors continuing to earn the most at €251,200 and Austrian directors still earning the least at €20,500.
Table 2: Median actual pay by country
Year-on-year pay movementsThe median year-on-year movements in director policy pay was zero per cent in all countries except Sweden where director pay increased by five per cent. To arrive at a year-on-year movement, we have only considered companies whose data was captured both in last and this year’s study. New companies to this year’s study along with companies whose data we have not gathered this year (such as the company falling out of the index) are not included in the year-on-year summary.

Italy
UK
Switzerland
Sweden
Germany
France
Belgium
Finland
Norway
Austria
Netherlands
0 1 2 3 4 5 6
European median
Comparing director pay to chair payOne factor that varied widely across Europe was the differential between average director pay and the pay of the chair of the board. Chairs of Italian companies are the most highly paid compared to other board directors, earning over five times the amount, influenced by the number of former chief executives or senior members of family-dominated companies who act as chairs. Chairs of companies based in the Netherlands, by contrast, earn just 1.3 times as much as other directors.
www.haygroup.com
Table 3: Multiple between pay of board chair and the average director pay

Non–executive directors in Europe8
©2013 Hay Group. All rights reserved
8
Board structure
As part of our study we examined board structure and the committees responsible for the most typical functional areas (audit, remuneration, risk and nominations). Most boards will also cover additional functional areas which can be more specific to their industry or line of operation and are, as a result, difficult to aggregate. We have included these functional areas as ‘other’. Since it is not unusual for one committee to cover more than one area, we have concentrated on the functional area of each, rather than on the specific name.
Most European countries have mandated the formation of an audit committee and 99 per cent of the companies we reviewed across Europe had a committee in place to cover audit, up from 97 per cent last year. While this report is specifically aimed at the supervisory board (or non-executive members of the unitary board) elected at the Annual General Meeting, it is worth mentioning that 83 per cent of the Italian companies we reviewed had a ‘statutory audit committee’ in addition to the internal audit committee of the supervisory board. The statutory audit committee (Collegio Sindacale) is required in Italy by law for companies with a unitary board structure. For companies adopting a dual board structure the statutory audit committee functions are taken over by the supervisory board. The statutory audit committee is composed by external certified professional experts in accounting and business law. The statutory audit committee monitors compliance with the law and corporate governance codes, the observance of the principles of correct administration, the adequacy of the company’s organisational structure and internal control systems.
Unlike the audit committee, most countries have not specifically mandated the creation of a remuneration committee. Despite this, prevalence of remuneration committees is increasing with 96 per cent of the companies we reviewed employing a committee, up from 94 per cent last year. All companies from the UK, Switzerland, Spain, Netherlands and Finland in the study had a remuneration committee while, at the other end of the scale, only 80 per cent of Norwegian companies had a remuneration committee.
81 per cent of companies across Europe have put in place a committee whose responsibilities include the nomination of new directors for approval. Nomination varies widely from country to country. All companies from the UK, Spain, Netherlands and Germany employ a committee to carry out nomination, but no such committee exists on any Swedish or Norwegian supervisory boards, where the practice is to have an external nominations committee.

www.haygroup.com
Nomination committees are also relatively rare practice in Italy where only 35 per cent of companies operate one, mainly because Italian remuneration committees often assume the responsibility of the nomination committee.
The prevalence of a committee covering risk is much lower across Europe at 19 per cent overall. Risk committees tend to be more prevalent in industries which have inherent risk built into the business model, such as financial services and pharmaceuticals. As a result, the highest incidence of risk committees is in the UK, Switzerland and Germany: countries with heavy representation from these sectors.
Table 4: Prevalence of board committees
Austria 3 100% 85% 5% 75% 50%
Belgium 3 100% 95% 11% 79% 68%
Finland 2 96% 100% 17% 75% 25%
France 4 100% 95% 18% 95% 87%
Germany 5 100% 96% 41% 100% 96%
Italy 3 100% 95% 0% 38% 65%
Netherlands 3 100% 100% 18% 100% 55%
Norway 2 100% 80% 0% 8% 28%
Spain 3 100% 100% 13% 100% 83%
Sweden 3 100% 96% 19% 100% 27%
Switzerland 4 100% 100% 30% 60% 80%
UK 4 100% 100% 28% 100% 59%
European prevalence 3 99% 96% 19% 81% 61%
CountryMedian
number of boards
Prevalence of board committees that cover functional areas
Audit Remuneration Risk Nomination Other

Non–executive directors in Europe10
©2013 Hay Group. All rights reserved
10
Independence
While director independence is a well-established governance principle across much of Europe, each country has established its own definition of independence. For the purposes of this study, independent directors are those declared as such by their companies. Overall, a median of 83 per cent of directors in the Europe-wide sample are declared as independent.
Board structure and the concept of independence tend to vary quite significantly from country to country across Europe. In Germany, board structure is strictly regulated and, unless they operate as an Societas Europaea (SE), German companies must operate a two-tier board with a supervisory board of legally independent members. Conversely, directors in Sweden may be declared to be independent but the Swedish definition of independence is much more relaxed and would be unlikely to meet the stricter requirements of many other countries, such as the UK.
While it is useful to see the median number of directors on each board who have been declared independent, it is equally interesting to see how many companies have declared all of their directors as independent. There is a wide range across Europe, from Germany and Spain where not a single company has declared 100 per cent of its directors to be independent to the Netherlands where as many as 73 per cent of companies have stated that each and every one of their non-executive directors is independent.
20% 40% 60% 80% 100%
Finland
Switzerland
Sweden
Netherlands
Austria
UK
Norway
Italy
France
Belgium
Spain
Germany
0
European median
Table 5: Company-declared independent directors (median percentage of board)

www.haygroup.com
Multi-chair responsibility
The prevalence of the chair of the board also acting as chair of one or more board committees varies significantly from country to country. In Austria board chairs typically chair two committees while in France and Italy it is relatively unusual from a board chair to also chair a committee. Board chairs are much less likely to chair the audit committee and, in some jurisdictions, are prevented from doing so by the local corporate governance codes. There are fewer specific rules around when or whether the board chair can also chair the remuneration committee, and this is much more prevalent. Since last year we have observed a reduction in additional committee chairmanship roles for board chairs, especially with regard to the audit committee.
Austria
Finland
Germany
Sweden
Norway
Belgium
Netherlands
Switzerland
France
Italy
Spain
UK
0% 20% 40% 60% 80% 100%
Board chairs who chair both audit and remuneration committees
Board chairs who chair remuneration committee
Board chairs who chair audit committee
European median
Table 7: Committee chairs held by board chair
Netherlands
Finland
Austria
Switzerland
Sweden
UK
Italy
Norway
Belgium
France
0 80%70%60%50%40%30%20%10%
European median
Table 6: Prevalence of boards where all non-executive directors are declared independent

Non–executive directors in Europe12
©2013 Hay Group. All rights reserved
12
Finland
Austria
Germany
France
Sweden
Belgium
Netherlands
Switzerland
0 20% 40% 60% 80% 100%
Same country Outside EUWithin EU
European median
Nationality
As part of our research we collected data around the diversity of directors in each company and found that the results varied significantly from country to country. Across Europe, an average of 69 per cent of directors are from the country in which they serve, 19 per cent are of other EU nationality and only 12 per cent hold nationality from outside EU borders. The most internationally diverse countries are Switzerland, Belgium and the Netherlands. These figures reveal little change on last year.
Table 8: Average nationality mix
Diversity
The European Commission (EC) published a Green Paper in April 2011 on the future framework of corporate governance in the EU. The EC’s paper highlighted the advantages of board diversity in terms of gender, professional experience and geographical experience. The EC argued that since the board of directors is expected to challenge executive management, a board made up of directors of different nationalities, genders and experiences would provide an effective way of avoiding ‘group-think’, while helping to generate new ideas. More diversity, said the EC, leads to better discussion, greater monitoring and more challenges in the boardroom.

www.haygroup.com
International experience
The diversity of international career experience mirrors that of nationality. Across Europe, an average of 59 per cent of directors have spent the majority of their career experience in the same country in which they serve as a director. 22 per cent of directors have experience from within other EU countries and 19 per cent, on average, have spent most of their career in a more international setting. These figures reveal little change on last year.
0 20% 40% 60% 80% 100%
Austria
Italy
Finland
Germany
Norway
Sweden
UK
Netherlands
France
Belgium
Switzerland
Same country Outside EUWithin EU
European median
Table 9: Average main career geographic experience mix

Non–executive directors in Europe14
©2013 Hay Group. All rights reserved
Gender
Gender diversity has become a subject of heated debate in many EU countries over the last year, with several countries, namely Italy, the Netherlands, Norway, Belgium (to be implemented in 2016) and France (to be implemented in 2014) introducing a quota system for female directors. The results of the study show that countries are beginning to make headway but many companies still have a long way to go in meeting the quota targets.
At a European level, the EC has decided not to introduce a mandatory proportion of female directors, but is working to encourage more women into executive and director positions. A number of national governments or regulatory/governance bodies are similarly committed to increasing the number of women on boards.
Across Europe, 83 per cent of directors are male. However, we are seeing a noticeable uptick in female representation on boards compared to last year. This year only one out of the 12 countries surveyed, Italy, had a 90 per cent or greater male presence on the board. In comparison, last year seven out of 12 countries exceeded the 90 per cent mark for male domination. Notwithstanding, when looking at the top non-executive position, no improvement has been made on last year with only two per cent of non-executive chairs across Europe being held by women.
Scandinavia leads the way in gender diversity with the highest proportion of female directors on boards. Yet the reasons behind this regional trend differ at a country level. Legislation was introduced in Norway in 2003 which required listed companies to meet a 40 per cent quota for female directors within five years. Our survey shows that 38 per cent of Norwegian directors are now women. But Sweden and Finland, which have no legal requirement or quota, have seen the proportion of female directors increase in recent years to 28 per cent in both cases purely as a result of public pressure and companies recognising the advantages of diversity.

www.haygroup.com
European companies are harbouring a distinct gender pay gap at the board level resulting mainly from a tendency not to appoint female directors to board committees. Underrepresentation of women on the strategically important board committees has translated into women board members being paid significantly less than men. In some countries we have seen a widening of the gender pay gap on last year. The pay gap varies from country to country but male non-executive directors in Europe receive 9 per cent more in total fees than their female counterparts, excluding chairs, at the median. This gap broadens to as much as 22 per cent in Italy.
20% 40% 60% 80%
Male Female
0 100%
Italy
Belgium
Austria
Switzerland
Spain
Germany
UK
Netherlands
France
Finland
Sweden
Norway
European median
Table 10: Average gender mix

Non–executive directors in Europe16
©2013 Hay Group. All rights reserved
More telling is the number of companies that do not have any female representation at all on their board committees. Although this is still common, the position is improving. The number of audit and remuneration committees across Europe with no female presence has diminished from almost two-thirds last year to 49 per cent in the audit committee and 58 per cent in the remuneration committee.
Italy
France
Germany
Belgium
Switzerland
UK
Netherlands
Spain
Sweden
Finland
Norway
Austria
-5%-10% 0% 5% 10% 15% 20% 25%
European median
Table 11: Median gender pay gap

www.haygroup.com
Table 12: Gender representation in board roles
Role Male Female
Non-executive chair 98% 2%
Executive chair 100% 0%
Deputy chair/ SID 91% 9%
Audit chair 89% 11%
Remuneration chair 90% 10%
Risk chair 89% 11%
Table 13: Prevalence of committees without female members
Prevalence of committees without female members Audit committee
Remuneration committee
Austria 80% 72%
Belgium 68% 61%
Finland 22% 38%
France 39% 61%
Germany 85% 91%
Italy 78% 86%
Netherlands 50% 41%
Norway 14% 41%
Spain 40% 45%
Sweden 35% 52%
Switzerland 65% 85%
UK 34% 46%
European prevalence 49% 58%

Non–executive directors in Europe18
©2013 Hay Group. All rights reserved
Netherlands
France
Switzerland
UK
Germany
Italy
Belgium
Finland
Sweden
Austria
Norway
40 45 50 55 60 65 70
Female directors BoardMale directors
European median
Table 14: Median average board age
Age
There is less variation in the age of directors across countries than with other aspects of diversity. The youngest median average director age was 57 in Norway and Austria, while the oldest median average age was 62, in the Netherlands. However, some marked gender differences in age can be observed across the European sample. The largest age gap was in the Netherlands, where female directors have a median average age of 55 and male directors a median average age of 64. The smallest gaps were in Finland, with a three year age gap between female and male directors.
Two per cent of companies in the European sample have a median average director age of under 50, which increases to eight per cent when looking at a median average age of under 55. The proportion of companies whose directors have a median average age of under 55 is 31 per cent of our Norwegian sample, dropping to six per cent of our UK sample and three per cent of our French sample.
To calculate the median director age, we first calculated the median age of directors per company provided that a minimum of five data points were available. We then calculated the overall country median provided that a minimum of five company medians were available. There were not enough data points available to provide a median female director age for Italy.

www.haygroup.com
Country analysis – Europe
In this section, Hay Group consultants provide country-by-country analyses and comparisons of board composition and remuneration trends, as well as a typical director profile for each country.
To discuss these findings further, please contact the relevant Hay Group consultant.

Non–executive directors in Europe20
©2013 Hay Group. All rights reserved
William Eggerst: +49 69 50 50 55 133e: [email protected]
Nora Dublankat: +49 6 50 50 55 324 e: [email protected]
Austria
All Austrian companies operate a two-tier board structure. There are typically eight directors per company who meet five times a year. Board chairs will typically also chair two committees, the highest in Europe, making their low remuneration even more surprising. In 72 per cent of cases the board chair also chairs the audit and remuneration committees. Companies typically run three committees. All companies in our sample have committees which cover audit, 85 per cent cover remuneration, 75 per cent cover nomination and five per cent cover risk.
The works councils of listed companies in Austria have the right to nominate one employee representative for every two shareholder representatives. If the works council wants to have employee representatives on the board, the company is obliged to accept the representatives. Employee representatives do not receive any fees, but are reimbursed for expenses.
Austrian companies maintain a very high level of independence, with companies, audit and remuneration committees declaring themselves 100 per cent independent at the median. The Austrian Corporate Governance Code recommends that most committees should be independent, meaning that directors cannot have worked for the company in the last five years, have any significant business relationships or have audited the company in the last three years.
Director pay in Austria remains the lowest in Europe, with board chairs now earning €51,600 at the median in actual fees and other directors earning €20,500 at the median average. Directors in Austria receive their fees in cash, although there continues to be some public discussion around introducing some variable pay components into the mix. Director fees are split into base, committee and meeting fees.

www.haygroup.com
In 2010 a diversity charter was introduced. However, only a limited number of companies have signed this to date, most of which are foreign-owned companies.
Directors in Austria are still not as international as the business might require. On average 83 per cent are Austrian nationals, ten per cent have EU nationality, and seven per cent are from outside the EU. In terms of international experience, on average 70 per cent of directors have gained the bulk of their experience from Austria (down from 77 per cent last year), 25 per cent from within the EU and six per cent from outside the EU.
We are seeing a gradual increase in the number of female directors. On average 88 per cent of directors are male and 12 per cent female (from 93 per cent male and seven per cent female last year). Companies with a state ownership have set a target to have 25 per cent female directors by 2013, increasing to 35 per cent by 2018.
The median age for directors in Austria remains joint lowest in Europe at 57.
Element Median fee Companies
Policy fee and structure prevalence
Non-executive chair basic fee € 30,000 15
Non-executive director basic fee € 15,000 15
Board meeting attendance fee € 500 9
Additional* fee for deputy chair € 8,800 14
Audit committee meeting attendance fee € 1,000 7
Remuneration committee meeting attendance fee € 1,000 5
Actual fee received
Non-executive chair total fee € 51,600 10
Average non-executive director total fee € 20,500 13
* in addition to non-executive director basic fee
Typical non-executive director profile in Austria
Age 57
Gender Male in 88 per cent of instances
Nationality Austrian in 83 per cent of instances
Most significant work experience Gained within Austria in 77 per cent of instances
Board and committee meetings attended 5

Non–executive directors in Europe22
©2013 Hay Group. All rights reserved
Belgium
Most Belgian companies run a single-tier management board structure, with only 16 per cent in our sample running a two-tier board. The board consists of 12 directors at the median who meet 11 times per year (increasing to 15 times in the case of board chairs). Employee representatives are not present on Belgian boards.
There are typically three committees per company. All companies in our sample have committees which cover audit, 95 per cent cover remuneration and 79 per cent cover nomination. 44 per cent of board chairs also chair the remuneration committee, and only five per cent also chair the audit committee.
Directors in Belgian companies are not bound to any shareholding requirements, nor are there any shareholding guidelines for them to follow. However, it is typical practice for companies to draft a governance charter. The charter will in most cases provide insight in director requirement.
Corporate governance guidelines recommend that companies employ a sufficient number of independent directors (including the remuneration committee chair), but in reality independent directors are few and far between. Belgian companies in our sample have declared themselves to be 55 per cent independent at the median, down from 63 per cent last year.
Director pay levels in Belgium are fairly moderate by international standards, and the internationalisation of directors is gradually pushing pay up. As a result both board chairs and other directors have benefited from an increase in actual fees.
The pay ratio between board chairs and other directors is 2.00, about middle of the range in the European sample. Policy pay in Belgium is made up of a basic fee, a committee retainer as well as meeting fees.
Walter Janssenst: +32 2 333 74 56 e: [email protected]

www.haygroup.com
The requirement to have a minimum number of female directors on boards is regarded as a fair challenge for many Belgian boards. Company associations tend to be against the gender quota but recognise that without the quota, little progress would be made in terms of improving gender diversity. By 2016 board members must be at least one third female. Despite this, gender diversity has only marginally improved on last year and on average 89 per cent of directors are male. The gender pay gap has also widened from 12 per cent last year to 15 per cent this year at the median. This is partly explained by the fact that there are hardly any female chairs.
Belgium continues to show strong diversity in terms of directors’ international experience. Belgium is a small country with a very open economy, which has more or less forced companies into employing directors with solid international experience. On average 41 per cent of directors have gained their main career experience within Belgium, 41 per cent have worked the majority of their career within the EU and 18 per cent have obtained their main work experience from outside the EU, similar figures to last year. On average 59 per cent are Belgian nationals, 32 per cent have EU nationality and nine per cent come from outside the EU.
The median age for directors in Belgium is 59.
Element Median fee Companies
Policy fee and structure prevalence
Non-executive chair basic fee € 60,000 15
Non-executive director basic fee € 31,500 16
Board meeting attendance fee € 2,500 11
Additional* fee for audit committee chair € 15,000 9
Additional* fee for audit committee members € 6,900 8
Audit committee meeting attendance fee € 1,500 10
Additional* fee for remuneration committee chair € 15,000 7
Additional* fee for remuneration committee members € 7,500 7
Remuneration committee meeting attendance fee € 1,500 10
Actual fee received
Non-executive chair total fee € 110,000 17
Average non-executive director total fee € 71,100 19
* in addition to non-executive director basic fee
Typical non-executive director profile in Belgium
Age 59
Gender Male in 89 per cent of instances
Nationality Belgian in 59 per cent of instances
Most significant work experience Gained within Belgium in 41 per cent of instances
Board and committee meetings attended 11

Non–executive directors in Europe24
©2013 Hay Group. All rights reserved
Finland
In practice only a few companies in Finland run a supervisory board. There are seven directors per company at the median (joint lowest in Europe with the Netherlands and Norway) who meet 14 times per year. No employee representatives sit on Finnish boards.
Finland has a very high rate of independence and companies (as well as audit and remuneration committees) declare their directors to be 100 per cent independent from companies at the median.
Finnish companies typically run two committees. All companies have committees which cover remuneration, 96 per cent cover audit and 75 per cent cover nomination. Non-executive chairs typically also chair at least one other committee, normally the remuneration committee (in 79 per cent of cases).
63 per cent of companies in our Finnish sample disclose shareholding guidelines, but no companies in the sample impose any shareholding requirements.
Director pay in Finland is relatively modest by European standards, paying third lowest in our sample of European countries (though slightly higher than Austria and Norway) both in terms of non-executive chair fees and fees for other directors. The pay differential between non-executive chairs to other directors is relatively low, with a median ratio of just 1.81.
Pay policy in Finland is typically comprised of basic fees and meeting attendance fees. About one third of the companies in our sample also pay for committee membership. Basic fees in Finland are most frequently paid in basic cash as well as in equity, with approximately 30 – 40 per cent of their total fees being delivered in equity. Committee fees are not particularly prevalent in Finland.
Juhani Ruuskanent: +358 94 133 6614e: [email protected]

www.haygroup.com
In terms of diversity, Finland employs the third highest proportion of female directors in our sample after Norway and Sweden and on average there are 28 per cent female directors on Finnish boards. On average, 36 per cent of committee members in the audit committee and 22 per cent of members in the remuneration committee are female.
Finland does not rank very high with regards to international diversity. On average 90 per cent of directors are Finns, eight per cent come from within the EU, and two per centcome from outside the EU. Likewise, the vast majority of director work experience has been gained from inside Finland (69 per cent on average), and only four per cent of directors have gained the bulk of their work experience from outside the EU.
Finland does better in terms of age, having a median director age of 58, one year under the European median. The median age for male directors is 58 against a median age of 55 for female directors.
Element Median fee Companies
Policy fee and structure prevalence
Non-executive chair basic fee € 82,000 24
Non-executive director basic fee € 45,900 24
Board meeting attendance fee € 600 17
Additional* fee for deputy chair € 13,000 23
Additional* fee for audit committee chair € 14,300 8
Audit committee meeting attendance fee € 600 17
Remuneration committee meeting attendance fee € 600 17
Actual fee received
Non-executive chair total fee € 90,400 21
Average non-executive director total fee € 52,000 23
* in addition to non-executive director basic fee
Typical non-executive director profile in Finland
Age 58
Gender Male in 72 per cent of instances
Nationality Finnish in 90 per cent of instances
Most significant work experience Gained within Finland in 69 per cent of instances
Board and committee meetings attended 14

Non–executive directors in Europe26
©2013 Hay Group. All rights reserved
France
Unitary boards are prevalent in French listed companies, with only 18 per cent of our sample running a two-tier board. Most board chairs in our French sample are executive chairs. At the median there are 13 directors per company (second highest in Europe after Spain) who meet for board and committee meetings 12 times per year.
French companies typically have four committees. All companies in our sample cover audit, and 95 per cent cover remuneration and nomination. It is unusual for board chairs to also chair other committees and no board chairs from our sample chair the audit committee and only eight per cent also chair the remuneration committee.
Under French law, companies may nominate employees to sit on the board, but this number must not exceed one third of the total number of directors. In listed companies where employees hold at least three per cent of the share capital, companies are legally required to nominate at least one employee director.
Shareholding requirements for directors are very rare in France with only one company in our French sample imposing any ownership guidelines.
Independence is becoming more prevalent in France. Companies in our French sample have declared 62 per cent of their directors to be independent at the median.
Non-executive board chairs in France receive actual median pay of €253,000. However, most board chairs in France are executive chairs and their median actual pay comes to €2,900,000, the highest level in Europe amongst executive board chairs. This high level of pay is influenced by the fact that many former chief executives move into the position of board chair and generally keep the same level of remuneration for the first two years of their chairmanship. Other directors do not fare so well and receive relatively low levels of pay with a median average of €56,400.
With regards to pay policy, director pay in France is comprised of basic fees and committee retainer fees. Around three quarters of the companies in our sample also pay for meeting attendance.
Caroline Robardt: +33 170 361 164 e: [email protected]
Sophie Moisant: +33 633 512 286e: [email protected]

www.haygroup.com
Diversity is treated seriously in France. In a recommendation published in July 2012, the Autorité des marchés financiers (AMF) recommended that companies act on their stated objectives to diversify their boards in terms of nationality and international experience. International experience has improved from last year and an average of 55 per cent of directors have gained their main career experience in France, down from 70 per cent last year. However, in terms of nationality, France still holds a relatively poor record for employing non-French nationals. In our sample, 72 per cent of directors are French and only 11 per cent come from outside the EU.
Gender diversity is on the rise. By 2014 companies are legally required to have at least 20 per cent female directors on boards, which rises to 40 per cent in 2017. France has been quick to comply with the gender requirement, with the average number of female directors increasing from 14 per cent last year to 20 per cent this year.
The median director age in France has decreased from 61 last year to 60 this year. This decrease can be attributed to incoming female directors who have an average age of 56. The number of directors aged over 70 is not allowed to exceed one third of a company’s director population in French companies.
Element Median fee Companies
Policy fee and structure prevalence
Non-executive chair basic fee € 425,000 9
Non-executive director basic fee € 20,000 28
Board meeting attendance fee € 3,000 25
Additional* fee for deputy chair € 27,500 8
Additional* fee for audit committee chair € 20,000 26
Additional* fee for audit committee members € 14,000 17
Audit committee meeting attendance fee € 2,800 18
Additional* fee for remuneration committee chair € 15,000 24
Additional* fee for remuneration committee members € 10,000 15
Remuneration committee meeting attendance fee € 2,500 17
Actual fee received
Non-executive chair total fee € 252,900 9
Average non-executive director total fee € 56,400 37
* in addition to non-executive director basic fee
Typical non-executive director profile in France
Age 60
Gender Male in 81 per cent of instances
Nationality French in 72 per cent of instances
Most significant work experience Gained within France in 55 per cent of instances
Board and committee meetings attended 12

Non–executive directors in Europe28
©2013 Hay Group. All rights reserved
Germany
German companies typically run a two-tier board structure. Companies operate five committees at the median, with 100 per cent of companies in our sample covering audit, 96 per cent covering remuneration, 100 per cent covering nomination, and 41 per cent covering risk. Directors in Germany attend an average of nine meetings per year, the second lowest in Europe after Austria. The board chair typically also chairs one committee, and in 78 per cent of cases it is the remuneration committee.
Companies employing over 500 employees in Germany must elect employee representatives to serve on the supervisory board. Both the representatives elected by the shareholders and those elected by employees are equally obliged to act in the company’s best interests.
Shareholding is not a requirement in German companies, with no companies in our sample setting any guidelines.
Regarding the independence of directors, the German Corporate Governance Code recommends that no more than two former members of the management board sit on the supervisory board. As a general rule, management board members wishing to move over into the supervisory board must undertake a two year cooling-of period. At the median companies are declared 42 per cent independent. Audit committees are 100 per cent independent and the remuneration committees are 50 per cent independent at the median.
The actual pay received by board chairs has decreased slightly from last year and now stands at a median of €249,000 (down from €251,500). Conversely other directors’ actual pay is up on last year, at a median average of €115,000 from €105,600. Policy pay is based on a basic fee, a committee retainer as well as meeting fees in the majority of cases. The basic fee component is typically split between a fixed portion and a variable component. The variable component is most often delivered in variable cash and is usually based on dividends or profits, rather than on a defined target cash amount, thus differentiating non-executive director pay from executive pay. Committee fees are usually based on the disclosed total basic fee. Despite the fact that most companies use a variable component in the basic fees, we are only able to calculate committee fees based on the guaranteed fixed basic fee component, since the variable component is very variable. This accounts for the lower policy figures when compared to the actual data. Stricter government regulation coupled with a greater focus on sustainable management is pushing companies to restrict the variable component. Consequently some companies have removed the variable component altogether. A reduction in variable fees is inevitably accompanied by an increase in the fixed basic fee.
William Eggerst: +49 69 50 50 55 133e: [email protected]
Nora Dublankat: +49 6 50 50 55 324 e: [email protected]

www.haygroup.com
In terms of policy pay there has been little change on last year with the fixed cash portion of director pay remaining at €122,500. Committee retainer fees have not moved from last year, with audit and remuneration committee chairs earning a median fee of €40,000 and audit and remuneration committee members earning a median of €20,000. Often members and chairs of the nomination committee as well as other non-mainstream committees do not receive additional committee fees.
Board diversity remains an ardent topic in Germany. Particular emphasis is placed on having a good gender mix both within the management and supervisory boards. Currently no quota has been adopted for women on supervisory boards. Public opinion is split between companies voluntarily committing themselves to recruiting more women onto the supervisory board versus a legal enforcement of women into these positions. There has been a year-on-year improvement in gender diversity and on average 87 per cent of directors are male and 13 per cent are female (versus last year’s statistics of 90 per cent male directors and ten per cent female directors).
Germany appears to be less concerned over the internationalisation of their directors. On average 76 per cent of directors are German, 15 per cent come from the EU and 9 per cent are of non-EU nationality. International experience is still fairly uncommon despite the German Corporate Governance Code recommending companies to give greater consideration to their international activities and apply them in the recruitment of directors who have a strong international background. On average, 68 per cent of directors have obtained their main career experience inside Germany, 21 per cent within the EU and 11 per cent from outside the EU.
Element Median fee Companies
Policy fee and structure prevalence
Non-executive chair basic fee € 150,000 26
Non-executive director basic fee € 62,000 26
Board meeting attendance fee € 1,000 17
Additional* fee for deputy chair € 30,000 25
Additional* fee for audit committee chair € 40,000 23
Additional* fee for audit committee members € 20,000 23
Audit committee meeting attendance fee € 1,000 16
Additional* fee for remuneration committee chair € 40,000 18
Additional* fee for remuneration committee members € 20,000 18
Remuneration committee meeting attendance fee € 1,000 14
Actual fee received
Non-executive chair total fee € 249,000 23
Average non-executive director total fee € 115,000 27
* in addition to non-executive director basic fee
Typical non-executive director profile in Germany
Age 60
Gender Male in 87 per cent of instances
Nationality German in 76 per cent of instances
Most significant work experience Gained within Germany in 68 per cent of instances
Board and committee meetings attended 9
Non–executive directors in Europe30
©2013 Hay Group. All rights reserved
Italy
The vast majority of Italian companies have a unitary board. Only 15 per cent of companies in our sample operate a two-tier structure. There are 11 directors per company who meet 15 times per annum at the median. No employee representatives sit on the board.
Italian companies typically have three committees. 100 per cent of our sample cover audit, 95 per cent cover remuneration and 38 per cent cover nomination.
Increasing shareholder activism has brought about an increasing number of independent directors entering onto Italian boards. On remuneration committees in particular the number of independent directors is increasing. Boards declare themselves to be 63 per cent independent at the median (up from 58 per cent last year), with audit committees declaring themselves 100 per cent independent and remuneration committees declaring themselves 78 per cent independent.
Italian directors enjoy a high level of pay. Board chairs receive a median total remuneration of €576,500 in actual pay (ranking second most highly paid in Europe) and other directors receive a median average of €80,400 in actual pay (ranking fifth out of 12 in Europe). Italy has the highest non-executive chair to other director pay differential, with board chairs earning 5.12 times that of other directors.
Pay policy is changing in Italy. Director pay is increasingly driven by time commitment in terms of more board and committee meetings. As a result directors in Italy have to restrict the number of directorships to fewer companies than they had previously served on.
Italian companies are increasingly paying for committee membership on top of meeting fees. Equity payment is frowned upon in Italy so directors tend to receive all payment in cash.
Matteo Fiocchit: +39 02 7716 209e: [email protected]

www.haygroup.com
The number of female directors in Italy is increasing, albeit slowly. Italian directors are on average 94 per cent male and six per cent female, a slight improvement on 97 per cent male and three per cent female last year. Notwithstanding, Italy still has the poorest record in terms of gender diversity on boards. The introduction of the law on ‘Gender balance on the boards of listed companies’, which became effective in July 2011, will see the number of female directors increase rapidly over the next few years.
Board diversity in terms of international work experience is still limited despite the effects that globalisation is having on Italian companies. Globalisation has affected the composition of management to a greater extent than it has done non-executive directors. We have observed a slight improvement on last year in terms of career background. On average 70 per cent of directors have obtained their main work experience in Italy, 20 per cent have gained it from within the EU and 11 per cent have gained it from outside the EU.
Element Median fee Companies
Policy fee and structure prevalence
Non-executive chair basic fee € 240,000 23
Non-executive director basic fee € 50,000 40
Board meeting attendance fee € 800 12
Additional* fee for deputy chair € 77,500 12
Additional* fee for audit committee chair € 30,000 32
Additional* fee for audit committee members € 22,500 32
Audit committee meeting attendance fee € 1,500 12
Additional* fee for remuneration committee chair € 25,000 32
Additional* fee for remuneration committee members € 20,000 31
Remuneration committee meeting attendance fee € 2,000 11
Actual fee received
Non-executive chair total fee € 576,500 11
Average non-executive director total fee € 80,400 38
* in addition to non-executive director basic fee
Typical non-executive director profile in Italy
Age 59
Gender Male in 94 per cent of instances
Most significant work experience Gained within Italy in 70 per cent of instances
Board and committee meetings attended 15

Non–executive directors in Europe32
©2013 Hay Group. All rights reserved
The Netherlands
91 per cent of Dutch companies in our sample operate a two-tier board. At the median there are seven directors sitting on Dutch boards who meet 12 times per year. According to the Dutch Corporate Governance Code, board chairs are not supposed to chair the audit committee or the remuneration committee, though 14 per cent also chair the remuneration committee. All companies in the Netherlands have audit, remuneration and nomination committees, and 18 per cent of companies also have a risk committee.
Although employee representatives are allowed to sit on the supervisory board, they remain uncommon. A Dutch Bill on management and supervision was enforced in January 2012, which has limited the number of supervisory board positions a director may hold in large companies to five. A large company is defined as one with assets greater than €17.5 million, a net turnover of €35 million, and more than 250 employees.
Dutch companies do not impose any share ownership requirements for directors.
The level of independence in Dutch companies is high. At the median, the board, audit committee and remuneration committee are declared to be 100 per cent independent. The Dutch Corporate Governance Code does allow for a maximum of one board member not to be independent.
Director fees in the Netherlands are set at relatively low levels by European standards. The typical policy fee for supervisory board members consists of a fixed annual fee, at a median of € 72,500 for the chair and € 50,000 for members. The board chair typically earns 1.30 times the amount of other non-executive directors, making the Netherlands the country with the lowest pay differential in Europe.
Although equity based payments to directors are not forbidden, almost all Dutch listed companies pay their directors entirely in cash. Director remuneration in the Netherlands consists of basic and committee retainer fees. Occasionally members also receive a fee for each meeting they attend.
Eric Engesaetht: +31 88 8 929 611 e: [email protected]

www.haygroup.com
Typical non-executive director profile in Netherlands
Age 62
Gender Male in 82 per cent of instances
Nationality Dutch in 59 per cent of instances
Most significant work experience Gained within Netherlands in 57 per cent of instances
Board and committee meetings attended 12
Companies are actively looking for female directors. The aforementioned Bill on management and supervision includes provisions on a well-balanced participation of men and women in both the management and supervisory boards of listed companies. Specifically it requires that at least 30 per cent of the seats are held by women. This year the proportion of female non-executive directors has increased to an average of 18 per cent (from 15 per cent last year), as opposed to female executive directors which has remained steady. Notwithstanding, the gender pay gap has widened from a median of zero per cent last year to eight per cent this year.
Directors in the Netherlands remain the oldest in Europe, aged 62 at the median. Female directors are younger, with a median average age of 55.
In terms of international background, Dutch companies look to take on other nationalities where supported by the strategy and business case. The proportion of non-executive Dutch nationals is relatively low at 59 per cent on average. 23 per cent of directors come from the EU and 18 per cent come from outside the EU. On average, 57 per cent of directors have gained their main career experience from the Netherlands, 27 per cent have gained it from within the EU and 16 per cent from outside the EU.
Element Median fee Companies
Policy fee and structure prevalence
Non-executive chair basic fee € 72,500 20
Non-executive director basic fee € 50,000 22
Additional* fee for deputy chair € 10,000 14
Additional* fee for audit committee chair € 12,000 19
Additional* fee for audit committee members € 8,000 20
Additional* fee for remuneration committee chair € 9,000 19
Additional* fee for remuneration committee members € 6,000 20
Actual fee received
Non-executive chair total fee € 95,600 18
Average non-executive director total fee € 68,400 21
* in addition to non-executive director basic fee

Non–executive directors in Europe34
©2013 Hay Group. All rights reserved
Norway
Norwegian companies have seven directors at the median, who meet 11 times per year. Companies typically only operate a couple of committees. In our sample all companies cover audit, 80 per cent cover remuneration. No Norwegian companies in our sample have a risk committee and nomination is covered by an external committee.
Norwegian law demands that all companies employing a workforce of over 200 employees elect employees onto the board. Employee representatives are equal to other directors and typically sit on both the audit and remuneration committees.
By law no executives are allowed to sit on the supervisory board of Norwegian companies. The exception to the rule occurs when the company is only listed in Norway but has its headquarters overseas. There are no shareholding requirements to which directors must abide.
At the median boards are declared 63 per cent independent, while audit committees are 100 per cent independent and remuneration committees are 67 per cent independent at the median.
No board chairs also chair the audit committee in our sample. On the contrary 53 per cent of board chairs are also the chair of the remuneration committee.
In terms of pay, directors in Norway rank second in our European sample. As might be expected with lower earning directors, the pay differential between the non-executive chair and other directors is also low at 1.78.
In terms of pay policy, director fees in Norway are comprised of a basic annual fee and a committee retainer fee and fees are delivered on a fixed cash basis. Only a few of companies also pay for attendance at meetings.
Juhani Ruuskanent: +358 94 133 6614e: [email protected]

www.haygroup.com
Norwegian boards are legally required to consist of at least 40 per cent women. As a consequence, Norway has the highest number of female directors on boards, with an average of 62 per cent male directors and 38 per cent female directors, up from 68 per cent and 32 per cent respectively last year. Our figures show that committees have high percentages of female directors. Audit committees have an average of 55 per cent women and remuneration committees are made up of an average of 30 per cent women. The gender pay gap remains at minus two per cent at the median.
The median age of directors in Norway is relatively low at 57, with the overall median age being pushed down by the younger female directors, aged 52 at the median .
In terms of international background of directors, an average of 67 per cent of directors in Norway have gained their principal career experience within the country, 27 per cent have gained it within the EU and six per cent from outside the EU. There is a requirement that the board chair plus 50 per cent of all other directors live in Norway.
Element Median fee (€)
Median fee (NOK) Companies
Policy fee and structure prevalence
Non-executive chair basic fee € 70,500 NOK 456,000 9
Non-executive director basic fee € 38,500 NOK 275,000 9
Additional* fee for audit committee chair € 15,500 NOK 117,000 6
Additional* fee for audit committee members € 9,900 NOK 77,000 7
Actual fee received
Non-executive chair total fee € 74,500 NOK 477,000 17
Average non-executive director total fee € 42,700 NOK 288,300 21
* in addition to non-executive director basic fee
Typical non-executive director profile in Norway
Age 57
Gender Male in 62 per cent of instances
Most significant work experience Gained within Norway in 67 per cent of instances
Board and committee meetings attended 11

Non–executive directors in Europe36
©2013 Hay Group. All rights reserved
Spain
The majority of Spanish listed companies run a unitary board, with just one company in the sample operating a two-tier board. Spain employs the highest number of directors in our European sample. At the median there are 15 directors per company who meet 13 times per year. Spanish companies usually operate three committees. All companies in the sample cover audit, remuneration and nomination and 13 per cent also cover risk.
Employee representatives are only required to sit on the boards of savings banks. (More and more savings banks in Spain are getting turned into banks following the restructure of the financial sector and new core capital requirements.)
No shareholding requirements are used in our Spanish sample of companies.
There is greater call for independent boards in Spain, however independence is legislated locally and is recommended rather than mandated. Independent directors are generally paid 50 per cent higher than directors who come in as major shareholders. This is primarily because independent directors are recognised as experts with a high level of individual competence, and secondly because the local corporate governance concept of ‘independent’ has been linked to represent the interest of minor shareholders.
Spain offers highly competitive director fees with the median average actual pay for other directors standing at €147,500. Spain pays the second highest in Europe (after Switzerland) . The vast majority of board chairs are executives who earn a median fee of €1,100,000 (and therefore outside the scope of this report).
Sergio Perezt: +34 93 209 27 44 e: [email protected]

www.haygroup.com
In terms of policy fees, director pay is normally made up of basic annual fees and committee fees, and is almost always paid entirely in cash. Only occasionally are additional meeting fees paid.
As of February 2012 banks, or savings banks, which fall under control of the central bank as well as those which receive public funds are legally required to limit director pay, We therefore predict that in the future director pay in Spain will become more modest.
Gender considerations are most obviously taken into account when recruiting new independent directors. Spain now has an average of 88 per cent male directors and 12 per cent female directors, which is about middle of the range in our European sample. We notice a slightly higher proportion of women working in the audit and remuneration committees, with averages of 17 per cent and 14 per cent respectively. The gender pay gap is at seven per cent, which is slightly below the European median of 8.6 per cent.
Typical non-executive director profile in Spain
Gender Male in 88 per cent of instances
Board and committee meetings attended 13
Element Median fee Companies
Policy fee and structure prevalence
Non-executive director basic fee € 100,000 17
Additional* fee for deputy chair € 56,000 6
Additional* fee for audit committee chair € 60,000 11
Additional* fee for audit committee members € 30,000 11
Additional* fee for remuneration committee chair € 44,100 11
Additional* fee for remuneration committee members € 25,000 11
Actual fee received
Average non-executive director total fee € 147,500 21
* in addition to non-executive director basic fee

Non–executive directors in Europe38
©2013 Hay Group. All rights reserved
Sweden
Swedish companies are structured around what is effectively a two-tier board. At the median there are eight directors sitting on Swedish boards, who meet 14 times per year, with the number of meetings increasing to 17 for board chairs. Swedish companies typically have three committees. All companies in the sample cover audit, 96 per cent cover remuneration and 19 per cent cover risk. Nomination is not a duty which is undertaken by directors in Swedish companies as practice is to have an external nominations committee, as is the case in Norway.
Board chairs in Sweden typically chair one committee. In 72 per cent of cases board chairs also chair the remuneration committee and in only four per cent of cases do they also chair the audit committee.
There are typically no share ownership requirements in Sweden.
All boards have employee representatives who are chosen by the Swedish trade unions. They sit as full members of the board but are not remunerated as such (rather they are paid as trade union representatives). Some companies not only inform employee representatives of the decisions made by the various committees, but have employee representation on the audit and remuneration committees.
Interestingly, what is not as yet a topic for discussion is the independence of directors. Swedish companies note whether directors are independent of the company and its management. They also note whether they are independent of major shareholders. However, little attention is paid to connections to suppliers, customers and overlapping memberships on other corporate boards. Given that large ownership stakes through investment vehicles is a significant feature of Swedish corporate governance, many directors serve on a number of boards. At the median Swedish companies, audit committees and remuneration committees are declared 100 per cent independent.
Director fees continue to increase with some rising dramatically during the year, in some instances causing shareholder protest. There is a lot of commonality in how the fees are increased among companies in the same ‘sphere’ of a strong owner. In terms of actual pay, board chairs in Sweden earned a median of €171,700 this year (up from €160,000 last year), with other directors earning a median average of €64,500 (up from €56,600) in actual fees. The pay differential between the two is calculated at a multiple of 2.54.
Carl Sjostromt: +44 20 7856 7066 e: [email protected]
Pierre Ottebrattt: +46 0 70 999 56 78e: [email protected]

www.haygroup.com
Director pay in Sweden is built on a basic annual fee and a committee fee. No companies in our sample pay for meeting attendance. The median amount of basic policy fees earned by board chairs is €174,400 and the median amount of basic fees earned by other directors is €56,800. Basic fees are generally paid as a fixed cash amount. Only one company in the Swedish sample provided partial equity payment for their directors. That said, Investor AB, which is controlled by the Wallenberg family and has significant stakes in many large Swedish companies, has promoted the introduction of voluntary synthetic share awards for directors at some of their portfolio companies.
Sweden does relatively well by European standards in terms of gender diversity, with an average of 28 per cent female directors on boards, a statistic only to be topped by Norway. The gender pay gap has come down from 11 per cent last year to 6 per cent at the median this year, again one of the lowest figures in Europe. At the median male directors earn €65,900 and female directors earn €61,000.
International experience is not a requirement but many Swedish companies, who in general tend to rely on exports and international operations, have a significant international presence on their boards. There is no pay differentiation between domestic and foreign non-executive directors. On average 63 per cent of directors have gained their main career experience in Sweden, 24 per cent from within the EU and 13 per cent have gained it outside the EU. A similar picture is painted with regards to non-executive director nationality. On average 66 per cent of directors are Swedish, 22 per cent are of European origin and 11 per cent come from outside the EU.
The average age for directors in Sweden is 58, which is at the lower end of the European sample.
Typical non-executive director profile in Sweden
Age 58
Gender Male in 72 per cent of instances
Nationality Swedish in 66 per cent of instances
Most significant work experience Gained within Sweden in 63 per cent of instances
Board and committee meetings attended 14
Non-executive director basic fee Median fee (€)
Median fee (SEK) Companies
Policy fee and structure prevalence
Non- executive chair basic fee € 174,400 SEK 1,425,000 25
Non-executive director basic fee € 56,800 SEK 500,000 26
Additional* fee for deputy chair € 13,800 SEK 120,000 9
Additional* fee for audit committee chair € 20,600 SEK 185,900 26
Additional* fee for audit committee members € 12,800 SEK 107,500 26
Additional* fee for remuneration committee chair € 11,100 SEK 100,000 24
Additional* fee for remuneration committee members € 11,100 SEK 100,000 25
Actual fee received
Non- executive chair total fee € 171,700 SEK 1,550,000 23
Average non-executive director total fee € 64,500 SEK 572,800 26
* in addition to NED basic fee

Non–executive directors in Europe40
©2013 Hay Group. All rights reserved
Switzerland
The majority of companies (70 per cent of the sample) has a two-tier board. The Swiss Code of Best Practice for Corporate Governance recommends that the majority of board members be independent. The code requires that directors are not to have been members of executive management for at least three years, nor are they allowed to have business ties to the company. At the median all companies in our sample as well as the audit, remuneration and risk committees have declared themselves to be fully independent.
There are typically a total of 11 directors per company who attend 11 meetings per year. At the median Swiss companies have four committees. All companies in our sample have an audit and remuneration committee, 60 per cent have a nomination committee and 30 per cent have a risk committee.
Employee representation in Swiss companies is unusual. However, there are some discussions of incorporating employee representatives onto Swiss boards in an attempt to control top executive pay and, by the same token, introduce more diversity onto the boards.
65 per cent of companies in our Swiss sample have set out shareholding guidelines for directors. This is the highest figure in Europe.
Overlap exists between the same incumbent holding board chairmanship and committee chairmanship: 17 per cent of board chairs also chair the risk committee and ten per cent chair both the audit and remuneration committees’ simultaneously. The proportion of overlap is even larger when looking at deputy chairs, with 25 per cent also chairing the remuneration committee, 17 per cent also chair the risk committee and ten per cent also chair the audit committee.
Non-executive director fees in Switzerland continue to far exceed those of any other country in Europe. Median fees for non-executive chairs have now exceeded €1 million in actual pay (€1,077,100) while the median average for other directors is at €251,200.
William Eggerst: t: +49 69 50 50 55 133e: [email protected]
Nora Dublankat: +49 6 50 50 55 324 e: [email protected]

www.haygroup.com
Typical non-executive director profile in Switzerland
Age 60
Gender Male in 88 per cent of instances
Nationality Swiss in 45 per cent of instances
Most significant work experience Gained within Switzerland in 27 per cent of instances
Board and committee meetings attended 11
Directors in Switzerland typically receive a remuneration package consisting of cash and equity based components, with the cash part being larger than the equity granted in most cases. Few companies reward stock options to their directors as options are considered to reduce the independence of directors by putting directors at risk of taking decisions which conflict with the long-term sustainable growth of the company. Policy pay in Switzerland is usually made up of basic fees and committee fees, with only three companies in the index also paying on an attendance basis.
Switzerland is one of the few countries in Europe where a strong diversity in terms of nationality and work experience is observed. Switzerland has the lowest percentage of directors with local nationality and the lowest number of directors who have gained the bulk of their work experience from within the country. On average 45 per cent of directors are Swiss, 32 per cent are of EU nationality and 23 per cent are from outside Europe. There is a near equal split with regards to where the directors have gained their main work experience with an average of 27 per cent gaining it from within the country, 42 per cent gaining it within the EU and 30 per cent gaining it outside Europe.
However, Switzerland is not so successful when it comes to gender diversity, having an average of 88 per cent male directors.
Element Median fee (€)
Median fee (CHF) Companies
Policy fee and structure prevalence
Non-executive chair basic fee € 845,400 CHF 1,040,000 11
Non-executive director basic fee € 197,500 CHF 243,000 12
Additional* fee for deputy chair € 109,700 CHF 135,000 7
Additional* fee for audit committee chair € 77,200 CHF 95,000 12
Additional* fee for audit committee members € 40,600 CHF 50,000 11
Additional* fee for remuneration committee chair € 69,100 CHF 85,000 11
Additional* fee for remuneration committee members € 28,500 CHF 35,000 10
Actual fee received
Non-executive chair total fee € 1,077,100 CHF 1,325,000 15
Average non-executive director total fee € 251,200 CHF 280,800 19
* in addition to NED basic fee

Non–executive directors in Europe42
©2013 Hay Group. All rights reserved
The United Kingdom
UK companies typically operate a unitary board, where non-executive directors sit alongside executive directors. In FTSE 350 companies (which include the FTSE 100 surveyed here) at least half of the board (excluding the chairman) should be independent directors, as set out in the 2012 UK Corporate Governance Code. All members of the audit and remuneration committees are required to be fully independent.
The only employee representatives who sit on this main board are executive employees, typically the chief executive officer and the chief financial officer, and possibly one or two of the most senior operational roles such as a divisional managing director. Although there have been some calls for greater employee participation in the board’s decision-making processes, the structure of the main board is not expected to change in the near future.
The median number of directors per company in the FTSE 100 has increased by one to eight this year. At the median, directors in the UK (including committee meetings) meet a total of 17 times per year, the highest average number of meetings in Europe. Committee prevalence in this index is at 100 per cent for the audit, remuneration and nomination committees, with 28 per cent of FTSE 100 companies also having a separate risk committee.
Board chairs seldom chair the major committees as it is considered to be against best practice. As a consequence there has been a noticeable clampdown on multiple chairmanships within the same company over the years. This year only two per cent of board chairs also chair the remuneration committee, and no board chairs also chair the audit or risk committees. These figures are down from last year when seven per cent of board chairs also chaired the risk committee.
At a policy level director pay in the UK is generally made up of basic fees and committee retainer fees. The fee for the board chair is typically all-encompassing and includes any ‘premium’ for undertaking any additional responsibilities. The vast majority of directors receive all payment in cash. While part paying directors in shares is acceptable to investors, the use of more leveraged equity instruments such as options, as well as any performance-related pay, is deemed inappropriate as they compromise their independence and is very unusual as a matter of practice, particularly in large companies.
Peter Borehamt: +44 20 7856 7146 e: [email protected]
Simon Garrettt: +44 20 7856 7113e: [email protected]

www.haygroup.com
In terms of actual pay, directors in the FTSE 100 now earn median average fees of €89,900 and board chairs earn €399,500. Remuneration chairs and members have seen their pay increase and is catching up with fees for their counterparts in the audit committee. In a local study of non-executive directors carried out by Hay Group in the UK, 77 per cent of directors said that being on the remuneration committee is becoming evermore challenging in part due to the burden of compliance. Furthermore they believed that members of the remuneration committee now have a tougher role than members of the audit committee.
The pay differential between the board chairs versus other directors remains the second highest in Europe after Switzerland, with board chairs earning 4.69 times the amount of other directors at the median.
UK boards are more internationally diverse than the European average, with an average of 60 per cent gaining their main work experience within the UK, 28 per cent from outside the EU, and 11 per cent from within the EU. Last year’s analysis showed a similar picture.
Typical non-executive director profile in UK
Age 60
Gender Male in 83 per cent of instances
Most significant work experience Gained within UK in 60 per cent of instances
Board and committee meetings attended 17
Element Median fee (€)
Median fee (£) Companies
Policy fee and structure prevalence
Non-executive chair basic fee € 402,400 £350,000 90
Non-executive director basic fee € 70,900 £63,000 95
Additional* fee for deputy chair € 23,100 £20,000 77
Additional* fee for audit committee chair € 23,100 £20,000 90
Additional* fee for audit committee members € 11,600 £10,000 46
Additional* fee for remuneration committee chair € 18,900 £16,800 89
Additional* fee for remuneration committee members € 11,500 £10,000 45
Additional* fee for risk committee chair € 34,600 £27,500 15
Additional* fee for risk committee members € 13,800 £12,000 13
Actual fee received
Non-executive chair total fee € 399,500 £349,000 84
Average non-executive director total fee € 89,900 £82,000 99
* in addition to non-executive director basic fee

Non–executive directors in Europe44
©2013 Hay Group. All rights reserved

www.haygroup.com
Regional analysis – outside Europe

Non–executive directors in Europe46
©2013 Hay Group. All rights reserved
US
In the US, legislative and regulatory reforms in the past decade (namely the Sarbanes-Oxley Act of 2002, and more recently, the Dodd-Frank legislation) have resulted in an expansion of the duties and responsibilities for directors at publicly-traded companies. Factors such as increased time commitments, potential exposure to liability and a reduced pool of candidates with the necessary levels of independence, experience and expertise, have all contributed to the continuing growth of directors’ total compensation.
In 2011 director pay at most companies increased 6-8 per cent despite forecasts calling for higher growth. The lower-than-expected increase in director pay can be explained by the sputtering economy. Directors remain reluctant to significantly raise their compensation while unemployment remains high and employee wages stagnate. As the economy recovers, we expect to see larger increases to director pay commensurate with the increases in director workloads, accountabilities and qualifications.
Director pay has commonly been linked with company size, with larger companies awarding higher cash retainers and total remuneration to directors. While total remuneration levels differ by company size and industry, the compensation package for directors at publicly-traded companies has traditionally included basic fees, committee fees, meeting fees, and is also made up of equity pay. Board chairs also receive benefits/perquisites such as supplemental insurance and matching charitable gifts.
Tony Wut: +1 201 557 8431 e: [email protected]
Bryan Kligmant: +1 201 557 8441 e: [email protected]

www.haygroup.com
As part of its 2011 annual compensation study, Hay Group analysed director pay and benefits of the largest 300 US public companies to file a definitive proxy statement. The median annual cash retainer for directors of these firms was €58,000, while median total equity granted was €96,600. Assuming the typical director is a non-chair member of the audit and remuneration committees, median total director compensation was €175,700.
In terms of board composition, public firms are increasingly moving toward a ‘declassified’ board structure in which directors serve one-year terms. Board size and composition is often correlated with company size. Median board size ranges from eight directors in small sized companies to 12 directors in the Top 200 category.
Regarding board independence, both the NYSE and NASDAQ exchanges require that public boards be comprised of a majority of independent directors. Given this requirement, and the decreased prevalence of the combined chief executive officer and chairman role, it is not uncommon for public companies to have independent directors comprising 75 per cent or more of the board.
Gender diversity continues to be limited, with few companies employing more than two female directors.
Over the past few years we have observed several trends in the structure and delivery of director pay. Companies continue to eliminate director meeting fees, shifting that value to retainers at both the board and committee level. This results in a simplified compensation structure (i.e. there is no longer a need to define what constitutes an official ‘meeting’ for fee payment purposes). Mirroring the executive pay trend, director remuneration packages have increasingly moved toward full-value awards (restricted shares or common stock) to deliver equity-based pay with the use of stock options becoming a less prevalent practice. The prevailing vesting schedule of equity awards is one year or less which helps align the vesting term with the directors’ annual service (typically one year terms).
In terms of director pay package changes, more companies are now adopting formalised director stock ownership policies which require directors to accumulate and hold a fixed level of equity throughout their tenure. Companies are also permitting directors to elect to receive additional equity awards in lieu of cash retainers/fees (often through a long-term cash deferral program), which helps directors to achieve their stock ownership guidelines and further strengthens the alignment between director and shareholder interests.

Non–executive directors in Europe48
©2013 Hay Group. All rights reserved
Asia
Corporate governance is a continuing challenge for developed and developing economies in Asia. In order to increase the competitiveness of companies to tap into domestic and international capital, countries in Asia continue to improve their corporate governance standards and have achieved significant progress in the past year. Singapore issued a revised Code of Corporate Governance in May 2012, based on the results of one year’s public consultation; Hong Kong also amended its Code of Corporate Governance and associated listing rules at the beginning of 2012; China, represented by the China Securities Regulatory Commission, published its Corporate Governance self-assessment report through engaging a policy dialogue with OECD for over one year. In Malaysia, the securities commission unveiled its five year corporate governance blueprint to raise the standards of corporate governance in July 2011; other South Asia countries including Thailand and India also improved their regulatory framework and enforcement. A more open corporate culture in the companies in these countries is taking shape.
The new code in Singapore strengthened the independence of non-executive directors from the substantial shareholders and advocates director training and board development. In addition, the new code reinforced a pay-for-performance relationship for executive remuneration, and made explicit the directors’ role in risk management. The changes demonstrate a strong government leadership in the corporate governance reform in Singapore. Its practice is ranked as number one among eleven Asian countries, according to the recent research by the Asian Corporate Governance Association.
Oliver Ricaillet: +65 6323 1668 e: [email protected]

www.haygroup.com
Similarly, the revised code in Hong Kong focuses on issues of more transparent disclosure on executive remuneration and shareholder rights. It also emphasises developing the capabilities and responsibilities of the board of directors in performing their monitoring and advisory roles through training, access to information and board meeting attendance and so on.
The corporate governance framework in China is developing and adapting to the country’s economic transformation. Based on its self-assessment report, its current priority areas for attention include: curbing abusive related party transactions, enhancing the quality of boards, improving shareholder protection and curbing market abuse.
The blueprint of Malaysia is organised around six themes of corporate governance: shareholder rights; the roles of multiple stakeholders; disclosure and transparency; and public and private enforcement. It adopts a broad based approach to encapsulate a wider range of accountabilities and expectations that seek to integrate principles, ethics and sustainability in the business decision making.
Along with more accountability, visibility and efforts required of being on the board of directors, non-executive director fees have risen over the past year. In Chinese A-share companies, the median annual fees paid to a director in 2011 was €9,300. The median fees paid to Hong Kong directors was €27,100, based on a survey of the largest 200 companies listed in Hong Kong1. Directors in Chinese and Hong Kong listed companies mainly receive a fixed remuneration in the form of annual fees. Hay Group’s recent survey of the largest 100 companies listed in Singapore revealed that the median directors’ fee was €44,800. We found that 14 companies out of the 100 offered their directors share-based remuneration, which accounted for an average of 28 per cent of the directors’ total remuneration.
Despite the refining regulatory framework of corporate governance in Asian countries, the all-important issue remains over how to improve effective implementation and enforcement. We observed that compliance to the rules and codes is still poor for the majority of the companies in this region. Only the large blue chips are able to comply in full gear.
1Ernst & Young, 2011 Mainland China and Hong Kong executive compensation report

Non–executive directors in Europe50
©2013 Hay Group. All rights reserved
Henri Barochelt: +55 11 35 25 6125e: [email protected]
Brazil
In contrast to Europe, only 72 per cent of the publicly traded Brazilian companies reviewed by Hay Group had an administration board with director representation. These companies are under the supervision of an official government body CVM (Comissão de Valores Imobiliários) which, since its inception, has been developed to ensure good corporate governance practices. With this, directors’ fees are becoming a growing priority item for organisations. Interestingly, 17 per cent of the private companies had an administration board with director representation.
Of the companies that did have director representation, an analysis of their board structures shows that the median board size is seven members. Board members can be categorised, similar to European board members, as executive/inside members, independent/outside members or shareholders. Independent directors are considered to have no tangible ties to the organisation and are hired through formal procedures, whereas outside directors may be former employees or even directors of a controlling business group. The breakdown of directors’ classification for those companies reviewed is 20 per cent shareholders, 51 per cent independent, 22 per cent outside directors and seven per cent executive directors.
The time commitment required of a Brazilian director varies greatly depending on the organisation and the efficiency of the management structure. Directors of companies with stable management (representing 44 per cent of our sample) will typically need to attend less than one meeting per month, whereas other companies require greater time commitment.
Pay for service on the board typically varies between shareholders and non-shareholders board members. The median pay for shareholder members in Brazil is €273,600 and non-shareholder members €61,560. A small minority of companies, approximately seven per cent, also offered a form variable remuneration with a median value equivalent to 75 per cent of the basic fee.
Leonardo Salgadot: +55 11 35 25 6156 e: [email protected]

www.haygroup.com
Methodology

Non–executive directors in Europe52
©2013 Hay Group. All rights reserved
SampleThis study examined disclosures covering non-executive directors at 390 companies in 12 countries across Europe. A full list of these companies is provided at the end of the report. These companies represent the constituents of the major investment index for each country and all data has been collected from publicly filed sources, most commonly the annual report.
Data collectedOur data collection focused on the remuneration levels paid to non-executive directors elected by general meeting for services on the supervisory board and its committees. Throughout the report we differentiate between board chairs and all other non-executive directors. We did not collect information about any management board members for companies who have a two-tier board structure and data on employee representatives are excluded. The data collected represents the policy amount that the company intends to pay each director for specific services rendered, as well as an aggregate total amount paid to each individual for the prior year’s service.
In our charts and tables we have only included countries where there has been a sufficient sample size to provide an accurate picture.
We did not include data on directors who left mid-year. We did, however, include diversity data on new joiners to the board who joined mid-year while excluding them from the actual pay calculations.
Policy feesPolicy fees represent the disclosed fee paid to each specific role on the board. We have examined the following elements to policy fees.
Basic fee – this is the fee paid for service on the supervisory board and can include a fixed retainer fee or a variable (often profit share-based) component. The amount paid to the chair of the board is collected independently of the amount paid to regular members of the board.
Committee retainer – this is the fee paid for service on a committee of the supervisory board. We have differentiated between the fee paid for chairing a committee versus that paid for being a member of the committee.
Meeting fees – where applicable we have collected the policy for fees paid for meeting attendance. We have collected these on a per meeting basis for both board and committee meetings separately as well as chair versus members meeting fees.

www.haygroup.com
Actual payActual pay has been collected as the value awarded to each individual for service on the supervisory board, as disclosed by the company in the annual report. This value will include payments for service on the board as well as any applicable committee retainers, meeting fees or variable pay awarded. Typically, this figure is disclosed as an aggregate value and we are therefore not able to break it out into the same categorisation as the policy figures.
StatisticsThis report focuses on median values so as to minimise the effect of outliers in the data. Throughout the report we also refer to median average figures. When calculating the actual pay data, our approach was to calculate the average pay amongst the individuals at a company and then report on the median of those averages for country level statistics. A minimum of five data points were required for us to provide a median figure for a country or for Europe.
Foreign exchangeAll values have been represented in Euros (€). For values which were disclosed in a currency other than Euros we have converted these values using the exchange rate on 31 December 2011.
DiversityAll diversity figures including age, gender, nationality and work experience have been collected from each company, when such information was disclosed, and interpreted by Hay Group.
Out of the 390 companies surveyed, 32 per cent disclosed the full range and 67 per cent disclosed some but not all of the diversity information we were collecting (gender, age, nationality and international experience).

Non–executive directors in Europe54
©2013 Hay Group. All rights reserved
Sample

www.haygroup.com
Austria
Organisation Market cap*(€000,000)
Andritz AG 3,429
CA Immobilien Anlagen AG 963
Conwert Immobilien Invest SE 903
Erste Group Bank AG 10,655
Evn AG 2,089
Immofinanz AG 2,935
Lenzing AG 2,208
Mayr-Melnhof Karton AG 1,507
Oesterreichische Post AG 1,502
OMV AG 8,746
Raiffeisen Bank International 6,207
RHI AG 816
Schoeller-Bleckmann Oilfield Equipment AG 981
Strabag SE 2,464
Telekom Austria AG 3,992
Verbund AG 9,136
Vienna Insurance Group AG 4,516
Voestalpine AG 5,010
Wienerberger AG 1,360
Zumtobel AG 788
*Average market cap over the respective company’s fiscal year

Non–executive directors in Europe56
©2013 Hay Group. All rights reserved
Belgium
Organisation Market cap*(€000,000)
Ackermans & Van Haaren NV 2,057
Ageas SA 4,419
Anheuser-Busch Inbev NV 65,499
Befimmo S.C.A. 996
Bekaert NV 3,277
Belgacom SA 8,274
Cofinimmo NV/SA 1,396
Colruyt SA 5,859
Delhaize Group 5,215
D'Ieteren SA/NV 2,605
Elia System Operator SA/NV 1,764
Groupe Bruxelles Lambert SA 9,610
Kbc Groep NV 7,988
Mobistar SA 2,772
Nyrstar NV 1,358
Solvay SA 7,161
Telenet Group Holding NV 3,363
UCB SA 5,508
Umicore SA 4,105
*Average market cap over the respective company’s fiscal year

www.haygroup.com
Finland
Organisation Market cap*(€000,000)
Amer Sports Oyj 1,192
Cargotec Oyj 1,843
Elisa Oyj 2,576
Fortum Oyj 17,766
Kemira Oyj 1,629
Kesko Oyj 2,888
Kone Oyj 10,465
Konecranes Oyj 1,513
Metso Oyj 4,991
Neste Oil Oyj 2,652
Nokia Oyj 19,529
Nokian Renkaat Oyj 3,678
Nordea Bank AB 28,711
Orion Oyj 2,273
Outokumpu Oyj 1,642
Outotec Oyj 1,660
Pohjola Bank Plc 2,756
Rautaruukki Oyj 1,826
Sampo Oyj 11,699
Sanoma Oyj 2,015
Stora Enso Oyj 5,248
Upm-Kymmene Oyj 5,946
Wartsila Oyj Abp 4,567
Yit Oyj 2,046
*Average market cap over the respective company’s fiscal year

Non–executive directors in Europe58
©2013 Hay Group. All rights reserved
France
Organisation Market cap*(€000,000)
Accor SA 6,225
Air Liquide SA 26,234
Alcatel-Lucent SA 6,666
Alstom SA 10,376
AXA SA 29,938
BNP Paribas 52,375
Bouygues SA 10,418
Cap Gemini SA 5,288
Carrefour SA 17,103
Compagnie De Saint-Gobain SA 20,294
Credit Agricole SA 20,591
Danone SA 30,734
EADS NV 17,598
EDF SA 47,134
Essilor International SA 11,262
France Telecom SA 37,594
GDF Suez SA 54,416
Lafarge SA 10,647
Legrand SA 7,159
L'Oreal 49,067
LVMH Moet Hennessy Louis Vuitton SA 57,384

www.haygroup.com
Michelin SCA 9,847
Pernod-Ricard SA 17,577
Peugeot SA 5,587
PPR SA 14,370
Publicis Groupe SA 6,972
Renault SA 10,406
Safran SA 10,642
Sanofi SA 68,147
Schneider Electric SA 27,516
Societe Generale SA 25,360
Technip SA 7,691
Total SA 91,400
Unibail-Rodamco SA 13,290
Vallourec SA 8,088
Veolia Environnement Ve SA 8,423
Vinci SA 21,752
Vivendi SA 22,464
*Average market cap over the respective company’s fiscal year

Non–executive directors in Europe60
©2013 Hay Group. All rights reserved
Germany
Organisation Market cap*(€000,000)
Adidas AG 10,256
Allianz SE 39,748
Basf SE 52,385
Bayer AG 42,145
Bayerische Motoren Werke AG 37,333
Beiersdorf AG 10,723
Commerzbank AG 9,954
Daimler AG 47,167
Deutsche Bank AG 33,416
Deutsche Boerse AG 9,630
Deutsche Lufthansa AG 5,952
Deutsche Post AG 14,549
Deutsche Telekom AG 42,504
E.On AG 38,800
Fresenius Medical Care AG & Co KGAA 14,857
Heidelbergcement AG 7,526
Infineon Technologies AG 7,491
K+S AG 9,435
Linde AG 19,005
Man SE 11,316
Metro AG 13,377
Muenchener Rueckver AG 18,730
RWE AG 21,150
SAP AG 50,921
Siemens AG 77,093
Thyssenkrupp AG 13,629
Volkswagen AG 53,380
*Average market cap over the respective company’s fiscal year

www.haygroup.com
Italy
Organisation Market cap*(€000,000)
A2A SpA 3,183
Ansaldo STS SpA 1,103
Assicurazioni Generali SpA 21,520
Atlantia SpA 8,455
Autogrill SpA 2,274
Azimut Holding SpA 928
Banca Monte dei Paschi di Siena SpA 4,893
Banca popolare dell’Emilia Romagna 1,980
Banca Popolare di Milano 888
Banco Popolare Scarl 2,835
Buzzi Unicem SpA 1,370
Davide Campari-Milano SpA 3,004
DiaSorin SpA 1,654
Enel Green Power SpA 8,668
Enel SpA 36,547
Eni SpA 63,877
EXOR SpA 4,559
Fiat Industrial SpA. 9,831
Fiat SPA 7,179
Finmeccanica SpA 3,985
IMPREGILO SpA 858
Intesa Sanpaolo SpA 23,980
Lottomatica SpA 2,089
Luxottica Group SpA 10,039

Non–executive directors in Europe62
©2013 Hay Group. All rights reserved
Mediaset SpA 3,992
Mediobanca SpA 5,642
Mediolanum SpA 2,333
Parmalat SpA 3,514
Pirelli & C. SpA 3,069
Prysmian S.p.A 2,695
Saipem SpA 14,960
Salvatore Ferragamo SpA 1,874
Snam SpA 13,389
STMicroelectronics N.V. 6,068
Telecom Italia SpA 17,347
Tenaris S.A. 17,297
Terna SpA 6,063
Tods SpA 2,408
UBI Banca S.c.p.A. 3,387
UniCredit SpA 25,062
*Average market cap over the respective company’s fiscal year

www.haygroup.com
The Netherlands
Organisation Market cap*(€000,000)
Aegon N.V 7,898
Air France-KLM 2,710
AkzoNobel 9,862
Aperam 1,539
Arcelormittal 31,535
ASML Holding N.V 12,227
Boskalis Westminster N.V 3,082
Corio N.V 3,853
Furgo N.V-CVA 4,085
Heineken N.V 21,514
Ing Groep N.V-CVA 27,810
Koninklijke Ahold N.V 10,738
Koninklijke DSM N.V 7,266
Koninklijke KPN N.V 15,678
Koninklijke Philips Electronics N.V 18,089
PostNL N.V 3,679
Ranstad Holding N.V 5,266
SBM Offshore N.V 2,862
TNT Express N.V 3,451
TomTom 1,036
Unibail-Rodamco SE 13,290
Wolters Kluwer 4,397
*Average market cap over the respective company’s fiscal year

Non–executive directors in Europe64
©2013 Hay Group. All rights reserved
Norway
Organisation Market cap*(€000,000)
Aker Solutions ASA 3,214
Algeta ASA 826
Cermaq ASA 964
DNB ASA 15,194
DNO International ASA 908
Fred Olsen Energy ASA 1,786
Frontline Ltd 809
Gjensidige Forsikring ASA 4,104
Golar LNG LTD 1,718
Marine Harvest 2,033
Norsk Hydro ASA 9,370
Orkla ASA 6,424
Petroleum Geo-Services 2,104
Prosafe SE 1,200
Renewable Energy Corporation ASA 1,495
Royal Caribbean Cruises Ltd 5,348
Schibsted ASA 2,132
Seadrill LTD 11,094
Statoil ASA 57,076
Statoil Fuel & Retail ASA 1,954
Storebrand ASA 2,356
Subsea 7 SA 5,743
Telenor ASA 19,056
TGS-NOPEC Geophysical Company ASA 1,799
Yara International ASA 10,462
*Average market cap over the respective company’s fiscal year

www.haygroup.com
Spain
Organisation Market cap*(€000,000)
Abengoa SA 1,731
Abertis Infraestructuras SA 10,095
Acciona SA 4,333
Acerinox SA 2,862
Acs Actividades Cons Y Serv SA 9,334
Amadeus IT Holding SA 6,074
Banco Bilbao Vizcaya Argenta 34,382
Banco de Sabadell SA 3,921
Banco Popular Espanol SA 5,215
Banco Santander SA 61,339
Bankia SA 6,264
Bankinter SA 2,116
Bolsas y Mercados Espanoles 1,722
CaixaBank 15,099
Enagas SA 3,578
Endesa SA 20,927
Ferrovial SA 6,391
Fomento de Construcciones y Contratas SA 2,535
Gamesa Corp Technologica SA 1,231
Gas Natural SDG SA 12,300
Grifols SA 3,237
Iberdrola SA 32,415
Inditex 37,516
Indra Sistemas SA 2,104
Mapfre SA 7,646
Obrascon Huarte Lain SA 2,218
Red Electrica Corporacion SA 4,990
Repsol YPF SA 26,926
Sacyr Vallehermoso SA 2,546
Telefonica SA 72,703
*Average market cap over the respective company’s fiscal year

Non–executive directors in Europe66
©2013 Hay Group. All rights reserved
Sweden
Organisation Market cap*(€000,000)
Alfa Laval AB 5,937
ASSA ABLOY AB 6,702
Atlas Copco AB 19,819
Boliden AB 3,324
Electrolux AB 4,738
LM Ericsson 28,057
Getinge AB 4,211
Hennes & Mauritz AB 38,831
Investor AB 11,504
Lundin Petroleum AB 3,658
Modern Times Group AB 2,867
Nordea Bank AB 28,692
Sandvik AB 13,474
Scania AB 11,120
Securitas AB 2,620
Skandinaviska Enskilda Banken AB 11,670
Skanska AB 5,243
SKF AB 8,170
SSAB AB 2,854
Svenska Cellulosa AB 7,354
Svenska Handelsbanken AB 13,382
Swedbank AB 12,599
Swedish Match AB 5,242
Tele2 AB 6,662
TeliaSonera AB 23,261
Volvo AB 22,384
*Average market cap over the respective company’s fiscal year

www.haygroup.com
Switzerland
Organisation Market cap*(€000,000)
Abb Ltd-Reg 36,808
ACTELION LTD-REG 4,324
Adecco Sa-Reg 7,614
Cie Financiere Richemont SA 23,495
Credit Suisse Group AG 30,283
Givaudan SA 6,479
Holcim Ltd 15,777
Julius Baer Group Ltd 6,029
Nestle SA 141,770
Novartis AG 111,843
Roche Holding AG 99,365
SGS SA 9,831
Swatch Group AG/THE 16,473
Swiss Re AG 14,470
Swisscom AG 16,014
Syngenta AG 21,205
Synthes Inc 13,620
Transocean Ltd 14,664
UBS AG 43,476
Zurich Insurance Group AG 25,773
*Average market cap over the respective company’s fiscal year
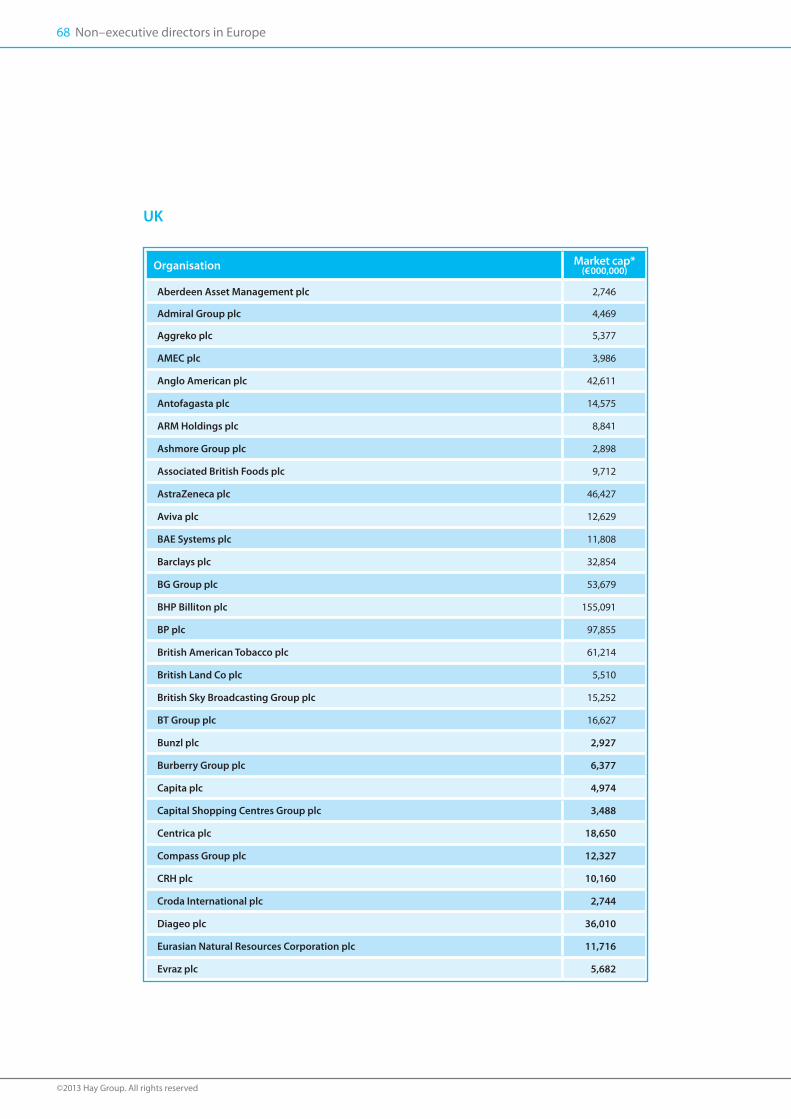
Non–executive directors in Europe68
©2013 Hay Group. All rights reserved
UK
Organisation Market cap*(€000,000)
Aberdeen Asset Management plc 2,746
Admiral Group plc 4,469
Aggreko plc 5,377
AMEC plc 3,986
Anglo American plc 42,611
Antofagasta plc 14,575
ARM Holdings plc 8,841
Ashmore Group plc 2,898
Associated British Foods plc 9,712
AstraZeneca plc 46,427
Aviva plc 12,629
BAE Systems plc 11,808
Barclays plc 32,854
BG Group plc 53,679
BHP Billiton plc 155,091
BP plc 97,855
British American Tobacco plc 61,214
British Land Co plc 5,510
British Sky Broadcasting Group plc 15,252
BT Group plc 16,627
Bunzl plc 2,927
Burberry Group plc 6,377
Capita plc 4,974
Capital Shopping Centres Group plc 3,488
Centrica plc 18,650
Compass Group plc 12,327
CRH plc 10,160
Croda International plc 2,744
Diageo plc 36,010
Eurasian Natural Resources Corporation plc 11,716
Evraz plc 5,682

www.haygroup.com
Experian plc 8,954
Fresnillo plc 13,191
G4S plc 4,295
GKN plc 3,604
GlaxoSmithKline plc 76,410
Glencore International plc 34,692
Hammerson plc 3,500
Hargreaves Lansdown plc 2,955
HSBC Holdings plc 121,562
ICAP plc 3,492
IMI plc 3,338
Imperial Tobacco Group plc 24,511
Intercontinental Hotels Group plc 3,986
International Power plc 17,860
Intertek Group plc 3,557
International Consolidated Airlines Group LN 4,303
ITV plc 3,113
Johnson Matthey plc 4,628
Kazakhmys plc 7,395
Kingfisher plc 6,961
Land Securities Group plc 6,545
Legal & General Group plc 7,411
Lloyds Banking Group plc 35,951
Man Group plc 4,834
Marks & Spencer Group plc 6,342
Meggitt plc 3,160
National Grid plc 24,409
Next plc 4,668
Old Mutual plc 7,827
Pearson plc 10,442
Petrofac Ltd 5,711
Polymetal International plc 4,483
Prudential plc 19,626
Randgold Resources Ltd 5,997

Reckitt Benckiser Group plc 27,712
Reed Elsevier plc 7,441
Resolution Ltd 4,499
Rexam plc 3,603
Rio Tinto plc 91,668
Rolls-Royce Holdings plc 13,863
Royal Bank of Scotland Group plc 42,369
Royal Dutch Shell plc 157,231
RSA Insurance Group plc 5,050
SABMiller plc 39,931
The Sage Group plc 4,207
J Sainsbury plc 7,044
Schroders plc 4,930
Serco Group plc 3,041
Severn Trent plc 4,032
Shire plc 12,340
Smith & Nephew plc 6,575
Smiths Group plc 5,107
SSE plc 13,920
Standard Chartered plc 41,517
Standard Life plc 5,579
Tate & Lyle plc 3,281
Tesco plc 36,678
Tullow Oil plc 13,655
Unilever plc 69,300
United Utilities Group plc 4,689
Vedanta Resources plc 5,463
Vodafone Group plc 100,564
The Weir Group plc 4,471
Whitbread plc 3,333
WM Morrison Supermarkets plc 8,784
Wolseley plc 6,306
WPP plc 10,354
Xstrata plc 41,859
*Average market cap over the respective company’s fiscal year

Have you seen?Top executive compensation in Europe This is a summary of the key trends and developments in European executive pay over the last 12 months, as set out in Hay Group’s study of Top executive compensation in Europe 2012.
Corporate governance and executive rewardBased on in-depth interviews with companies, investorsand regulators conducted across 17 countries, this studycaptures the priorities and identifies the key concerns ofleading players in the governance debate today.
To purchase the full study, or for moreinformation on local country reports, pleasespeak to your local Hay Group contact or [email protected]

AfricaCape TownJohannesburgPretoria
AsiaBangkokBeijingHo Chi Minh CityHong KongJakartaKuala LumpurMumbaiNew DelhiSeoulShanghaiShenzhenSingaporeTokyo
EuropeAmsterdamAthensBarcelonaBerlinBilbaoBirminghamBratislavaBrusselsBucharestBudapestDublinEnschede
FrankfurtGlasgowHelsinkiIstanbulKievLilleLisbonLondonMadridManchesterMilanMoscowOsloParisPragueRomeStockholmStrasbourgViennaVilniusWarsawZeistZurich
Latin AmericaBogotáBuenos AiresCaracasLimaMexico CitySan JoséSantiagoSão Paulo
Middle EastDubaiRiyadh
North AmericaAtlantaBostonCalgaryChicagoDallasEdmontonHalifaxKansas CityLos AngelesMontrealNew York MetroOttawaPhiladelphiaReginaSan FranciscoTorontoVancouverWashington DC Metro
PacificAucklandBrisbaneMelbournePerthSydneyWellington
Hay Group is a global management consulting firm that works with leaders to transform strategy into reality. We develop talent, organise people to be more effective and motivate them to perform at their best. Our focus is on making change happen and helping people and organisations realise their potential.
We have over 2600 employees working in 85 offices in 48 countries. Our clients are from the private, public and not-for-profit sectors, across every major industry. For more information please contact your local office through www.haygroup.com