in focus - der weinbau-online 2018 · in focus the foss group online magazine ... and agricultural...
TRANSCRIPT

2
Taking the next step in dairy process control
Fat analysis in perspective
Clear NIR
In FocusThe FOSS Group online magazine covering analysis in food, dairy
and agricultural industries, Vol. 36, No. 2 2012

2
Torben LadegaardCEO, FOSS
The food industry is under tremendous pressure and this is probably going to continue into the foreseeable future.
Caught between lower sales prices and increasing costs, the food industry faces a number of challenges. The global economic climate is affecting the behavior of especially, European consumers who are seeking lower priced yet quality products on the supermarket shelves. At the same time, we are seeing raw material prices rocketing to levels comparable to the so-called food crisis in 2008. We are in a time of profit warnings and consolidation.
Unfortunately, we cannot increase global agricultural production overnight and we are thereby prey to natural disasters such as the recent drought in North America and Black Sea. In addition, agricultural production will continue to struggle to match the demand from an ever-growing middle class in emerging economies. Regardless of these difficult conditions, we must continue to improve quality while ensuring sustainability in the food value chain. Something we can do is to take action to reduce waste and to make the most of valuable raw materials. With this action, we can contribute to a growing and sustainable supply of food to a demanding world.
At FOSS, we are proud to do this through our dedicated analytical solutions.
Every second of the clock, FOSS solutions are helping to evaluate, segregate and quantify valuable raw materials. And this edition of In Focus includes several examples. For instance, real-time results from in-line analysis systems are helping to improve yield in dairy produc-tion. Other gains are being found by heading off the effects of ketosis in the dairy herd, by optimizing the fat content in meat products or by ensuring that the resources put into the latest grape harvest will result in quality wines living up to their full potential.
Whatever the example we choose to highlight, it is good to see that concrete action is being taken to tackle tight margins and the ever-increasing pressure on our food supply.
Squeezed margins call for action

3
An eye for quality Page 4
Wine analyser helps to make the best of great grapes Page 7
Transfer of power Page 8
Fat analysis in perspective Page 10
New finished wine measurements available for OenoFoss™ Page 13
Status on Ketosis Screening Page 14
Accelerated test for hygienic quality of milk Page 17
Clear NIR Page 18
Can NIR & Chemometrics be more accurate than the reference method? Page 21
Get in-line – how to take advantage of new dairy process analysis solutions Page 22
Taking the next step in dairy process control Page 24
Contents
In FocusThe FOSS Group online magazine covering analysis in food, dairy and ag-ricultural industries. Published by FOSS. Edited by Richard Mills ([email protected]). © All rights reserved FOSS 2012. Cover picture by Susann Balser-Hahn.

4
Clean and fresh and all under one roof – nothing gets missed at the meat production facility at Dovecote Park.
Retail production director, David Redman describes how the facility has an abattoir, a boning hall and retail plant giving total control from kill to pack. “This enables us to maintain quality and pass it on to our customers,” he says. “We are a primary supplier for a major supermarket and we encourage our staff to look at quality and only take on people we trust.”
But quality is not just in the hands of the experienced people working in production.
From X-ray to near infraredMeat trimmings coming out of the boning hall are ana-lysed on a FOSS MeatMaster which looks and works the same as an airport security scanner, but instead of check-ing your hand baggage for suspect items it performs X-ray analysis of entire batches of meat. It measures the fat content of all the meat while also checking for foreign objects.
The meat either goes into a maturation stock from where it is pulled out into the DoveCote Park retail or burger production or it is sold on to affiliated suppliers. The fat analysis has multiple benefits.
An eye for qualityFrom slaughter to retail release, every step in the meat production process at Dovecote Park in Yorkshire is under the watchful eye of seasoned experts. Why then do they need no less than three different analytical instruments to track the content of fat and other parameters in products on their way to the supermarket shelves?

5
For affiliated suppliers it gives a reliable, documented reference that also avoids discussions about fat content. “Since we installed the MeatMaster about a year ago, we’ve only had one claim and we could look back at the records and prove that it was ok,” says Redman.
The X-ray analysis also helps to give feedback to the butchers in the boning hall about the fat/lean mix in the trimmings they are supplying. And heading downstream in the burger and retail process, it gives a complete and accurate picture of the raw material. Redman explains: “You can also do your own recipe. Say you are putting 40 trays through you can mix and match to get the right fat content in the batch.”
In the burger and retail area, the job of routine analysis is taken over by two easy-to-use benchtop analysers based on near infrared (NIR) analytical technology – the MeatScan for rapid fat analysis close to the burger pro-duction and a FoodScan for measuring fat, moisture, salt and collagen in the plant control room.
Unlike the X-ray technology that measures everything on a conveyor belt, the NIR instruments measure a sample taken from the production line. This is presented in a sample cup and a specific form of NIR technology called near infrared transmission is used to measure fat and other parameters. The light is transmitted through the sample and the instrument measures what comes out the other side using a calibration supplied with the in-struments. Ground meat is not very homogeneous and a very reliable calibration is required that can account for the natural variations in samples. FOSS has there-fore spent many years working with the meat industry
to develop ready-to-use calibrations based on literally thousands of samples from different types of meat and from around the world. The calibration has received ap-proval from the AOAC in the United States of America and other national quality organisations.
The instruments are connected to the internet using FOSS mosaic software. This allows measurement results to be monitored remotely from the control room.
What the eye can’t seeThe MeatScan and FoodScan instruments are kept pretty busy, for example, a typical 800 kg batch will be tested about four times an hour. It is used by operatives and QA staff and any out of spec results need to be flagged to supervisors. This part of the process is under the watch-ful eye of Primary process technical controller, Haruna Adama who describes how anything that goes through the blender is measured before it goes out. “We are required to meet the beef labelling standards, so if it says 10% fat on the label, we’ve got to make sure it is 10% fat,” he says.
The FoodScan is used for a pre-release check. Adama explains how it is all about getting the balance right. If the product is too lean it affects the taste and bite that their customers expect. And, if the fat level is too high they will be breaching legal requirements.
“Without the instruments it would be very difficult. You have got experts working on the line who have been working with these products for maybe ten years, but to be able to visually assess the product – you physically can’t do it. You can guess, but it is not always right,” he
The FoodScan is used for a final, pre-release check testing for fat, salt, moisture and collagen in a single measurement taking less than a minute.
Fast fat analysis: this robust and easy-to-use MeatScan is situated close to the burger production.

6
says with a smile. “These instruments are just brilliant tools. You can hit your targets and many of our custom-ers are using the same tools, so whatever results you get, they are on a par with the others. This equipment is essential to us in aiding our process.”
Quality and consistency While meat producers have been making quality prod-ucts for centuries without the aid of modern technology, recent developments in routine analysis technology make it an obvious pre-requisite for consistent quality products. “Quality is paramount” says David Redman. “With the MeatMaster it is usually within 0.2% of targets, so if we are going for 20% fat, we can get around 19.8%. Without those instruments you are most probably going out too lean or too fat. It also picks up bone and foreign objects which is a plus.”
Likewise, the MeatScan and FoodScan provide an ac-curate measurement in the production process and the FoodScan is used for the final check on fat, salt, moisture and collagen. “Our customers require this and without the FoodScan we would not be able to measure these parameters,” he says. “Also we have regular customer audits and the test information is passed on.”
A good relationship with FOSS and ongoing support are important elements of the overall routine analysis solu-tion. “The support is second to none and the equipment is among the best, otherwise we would not be with them,” says Redman. Referring to the whole routine analysis system, he concludes: “It’s a must, you should have such a system in place. Without this equipment you don’t know where you are because even the most expert person cannot say exactly what the fat content is in the product.”
By Richard Mills, [email protected]
Learn more about FOSS meat solutions here.
Measuring it all: the MeatMaster tracks the fat content in trimmings from the boning hall to within 0.2% of targets.
7
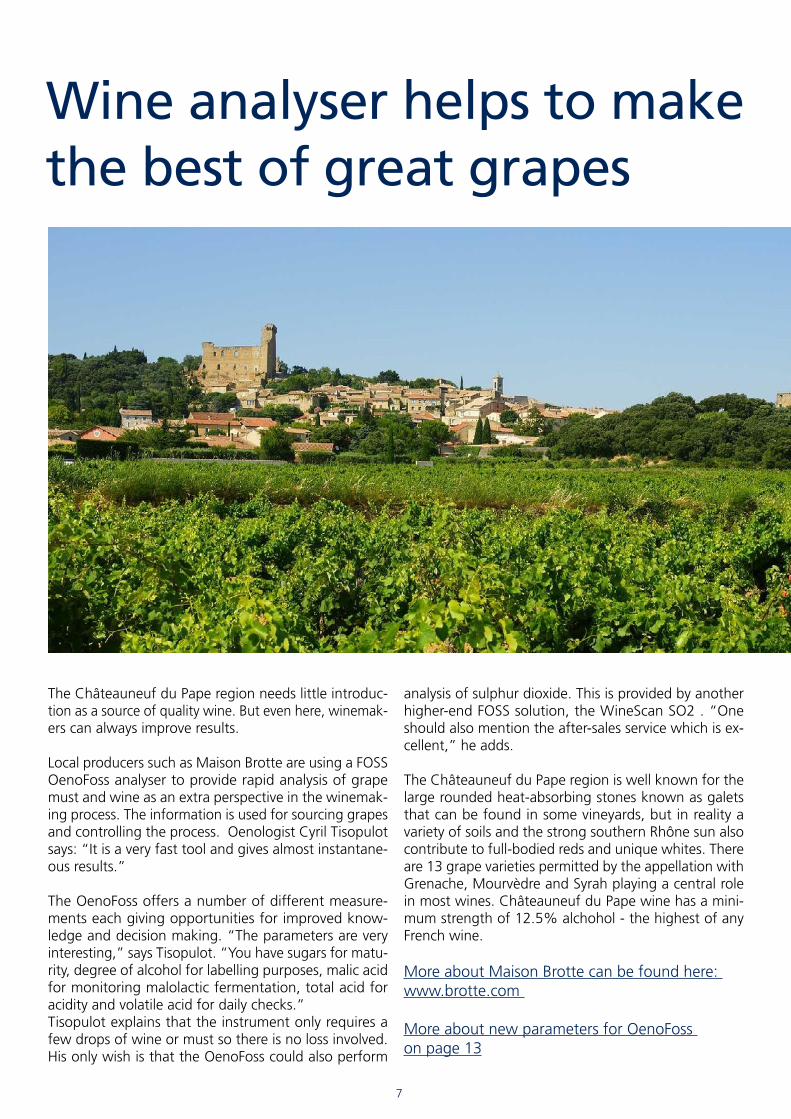
The Châteauneuf du Pape region needs little introduc-tion as a source of quality wine. But even here, winemak-ers can always improve results.
Local producers such as Maison Brotte are using a FOSS OenoFoss analyser to provide rapid analysis of grape must and wine as an extra perspective in the winemak-ing process. The information is used for sourcing grapes and controlling the process. Oenologist Cyril Tisopulot says: “It is a very fast tool and gives almost instantane-ous results.”
The OenoFoss offers a number of different measure-ments each giving opportunities for improved know-ledge and decision making. “The parameters are very interesting,” says Tisopulot. “You have sugars for matu-rity, degree of alcohol for labelling purposes, malic acid for monitoring malolactic fermentation, total acid for acidity and volatile acid for daily checks.”Tisopulot explains that the instrument only requires a few drops of wine or must so there is no loss involved. His only wish is that the OenoFoss could also perform
analysis of sulphur dioxide. This is provided by another higher-end FOSS solution, the WineScan SO2 . “One should also mention the after-sales service which is ex-cellent,” he adds.
The Châteauneuf du Pape region is well known for the large rounded heat-absorbing stones known as galets that can be found in some vineyards, but in reality a variety of soils and the strong southern Rhône sun also contribute to full-bodied reds and unique whites. There are 13 grape varieties permitted by the appellation with Grenache, Mourvèdre and Syrah playing a central role in most wines. Châteauneuf du Pape wine has a mini-mum strength of 12.5% alchohol - the highest of any French wine.
More about Maison Brotte can be found here: www.brotte.com
More about new parameters for OenoFoss on page 13
Wine analyser helps to make the best of great grapes

8
“We have 15 years of samples in the system and we have a very good calibration line for our products and raw materials” says Quality manager Dirk van Korven. “If a truck comes and the material does not meet the specs we can send them away without any doubts about the NIR.”
Standing on this solid ground you might think that the company would be wary of moving to a new instrument platform, but van Korven explains how transferring the calibrations from their trusty NIRS System II 5000 instru-ment to their new NIRS DS 2500 feed analyser was quite simple and reliable.
A support engineer from FOSS visited and made a stand-ardisation with the old samples. “For me it was very easy,” says van Korven. “There was only some valida-tion work to check that everything works. It took about one day and even for samples of ash, which are quite difficult, the result was ok.”
Historical data This ability to re-use calibration with minimal effort and no re-sampling was a crucial issue due to the number of samples already in the calibration database. “If it is one sample at a cost of around 100 Euro it is no prob-lem, but if you have a thousand – you can calculate the cost,” says van Korven who also explains the historical aspect of calibration development that money cannot buy. “Besides the cost, it takes you years to get the good samples in a calibration,” he says. “From summer and winter and from harvest to harvest – you need it all. History is great for predicting the future.”
The two instruments have been running alongside each other and to date, no issues have been found.
Best of the old with advantages of the new Among the new aspects to enjoy with the new instru-ment is the ability to connect it to the internet using Mosaic networking software, so it’s possible for anyone
After using a FOSS System II near infrared (NIR) analyser for many years, Jonker Petfood in the Netherlands decided to make a generation shift to a new in-strument offering new usability features and a unique signal to noise ratio. Quality manager Dirk van Korven explains how making the step to the new platform has been simple and reliable with the transfer of valuable calibration data based on thousands of samples taking just one day.
Transfer of power

9
at the plant to log in from anywhere to see the results and check what is going on. “If you have some issue with the results you can contact FOSS and they can see online what is happening,” says van Korven. “You always have access to results – it’s like reading email from your mobile.”
On a normal day, about 80 tests are performed. With the NIRS System II instrument, this involved packing a sample holder. Now, with the NIRS DS2500, the sample is just poured into a cup and placed in the instrument. This is made possible by measurement from below us-ing a unique light exposure system that avoids poten-tial interference from stray beams. A special slurry cup also allows liquid samples to be measured if and when the quality control team needs to take advantage of it. “Filling of the cup is a big difference,” says van Kor-ven. “With the old one it was complicated and messy. With the new one, it is cleaner and for the operator it is easier to use.”
He also reports that the software is easy to work with and that the instrument is robust with nothing to break down. “It stands in a production area and everyone can work with it without worries,” he says. “It’s not about being a research lab, but knowing that you are steering your process in the best possible way and knowing that the results you get are always reliable.”
Ready for the futureBesides the usability aspects, a number of hardware features, from a sealed encloser protecting against dust and moisture to a water-cooled lamp, contribute to make the new unit extremely stable. The stability enables a high signal strength and low noise across a broad meas-urement spectrum making it a versatile platform for a broad range of analytical tests. “You don’t know what is coming in the future, but we have the opportunity to test amino acids, fatty acids, starch and such like,” says
van Korven. “With the new one you have more oppor-tunities as long as you have the right calibration behind it - dry, liquids, unground samples – it’s no problem.”
There are a growing number of valid options for feed producers to choose from when considering a new NIR solution, but Dirk van Korven describes how their choice was quite simple. “We have had a good working rela-tionship with FOSS for the past 15 years. Everything was reliable and in the future you have more opportunities.” he says. “Of course, everyone can take their old calibra-tions with them, but FOSS knows the system and you can transfer your calibrations with hardly any new sampling work and it is running perfectly.”
By Richard Mills, [email protected]
Dirk van Korven: “It’s not about being a research lab, but knowing that you are steering your process in the best possible way.”
Simple transfer: FOSS has complete control of the NIRS System II master. When moving to the NIRS DS2500 platform, a standardisa-tion is performed that matches exactly. Users are then up and run-ning on an ultimate NIR platform re-using existing calibration data.

10
Due to their high physiological energy value, lipids are an important energy source in human and animal nutri-tion. In addition, they supply essential fatty acids and fat soluble vitamins. On the other hand it is known that dietary fat intake does affect obesity. Consumers are concerned and the fat content has to be declared in food and feed labeling.
Lipids are not a uniform group of compounds. Fatty acids are the simplest lipids. There are more than 500 different fatty acids, most of them have an even number of C-atoms, between 12-20. We differentiate between saturated (no double bonds; most abundant: Palmitic acid C16:0, and Stearic acid C18:0), and unsaturated fatty acids, which have one or several double bonds. In nature, the cis isomeric forms dominate.
Fatty acids are easily extracted in organic solvents and determined by traditional or e.g. gas-chromatographic methods.
Fats and oils are composed of glycerol, esterified with three fatty acids, and are also called triglycerides. Oil is a triglyceride that is liquid at room temperature and gener-ally contains unsaturated fatty acids, with the exception of tropical oils (coconut, palm oils) which also contain low molecular weight saturated fatty acids. Fat is a tri-glyceride that is solid or semi-solid at room temperature and that generally contains saturated fatty acids.
Triglycerides are not always easily extracted using an organic solvent. They are not very volatile and need e.g. hydrolysis and re-esterification to FAME (fatty acid methyl esters) before gas-chromatographic analysis.
The second most abundant lipids are phospholipids. They occur exclusively in plant and animal cell membranes and are comprised of glycerol esterified with two molecules of fatty acids, and one molecule of phosphoric acid. Naturally occurring phospholipids like soy-lecithin or egg-lecithin are often used as emulsifiers in the food industry.
Fat analysis in perspectiveWith many methods designed to determine fat content and some 60 standards within ISO alone, it’s not always easy to select the appropriate method and to relate nutritional measures to a reported fat content. In Focus asked laboratory consultant and former FOSS laboratory manager, Dr. Jürgen Möller to give a much needed overview including definitions, analytical methods, standards and trends relating to fat analysis today.

11
Other important membrane lipids include galacto-lipids (plant cells) and sphingolipids, where the fatty acid is bound via an amide bond and that have important im-munological properties.
Further, lipids may include waxes, sterols and other sub-stances.
Analytics and regulationTraditionally, extractable matter, commonly referred to as fat, has been defined by the analytical method used. Depending on the extraction method and conditions, i.e. solvent, extraction time, hydrolysis etc., different results are obtained. Table 1 gives an example of re-sults obtained after direct diethyl ether extraction and after acid hydrolysis according to Schmid - Bondzynski – Ratzlaff (1, 2). Cereals like wheat and barley contain considerable amounts of phospholipids that are only extractable after acid hydrolysis. In soymeal, most of the oil has already been extracted but there are lipids left in the cell membranes that do have a nutritional value.
With some 30 AOAC methods designed to determine the fat content and some 60 ISO standards related to the fat content it is not always an easy task to select the appropriate method and to relate nutritional measures to a reported fat content.
This problem has (partly) been addressed by regulation. Since the US Food and Drug Administration’s (FDA) Nutritional Labeling and Education Act (NLEA) from the 1990’s, total fat has been defined as the fatty acids obtained from a total lipid extract of the food matrix expressed as triglycerides. The analytical method includes hydrolysis and re-esterification to FAME (fatty acid methyl esters) before gas-chromatographic analysis (3). This approach not only gives the total fat content, but also the fatty acid composition.
Regulations of the European Union are of importance as they are generally in agreement with Codex Alimentarius and as they also apply to products for export outside the European Union.
Table I: Fat content after direct Soxhlet extraction with Di-Ethyl-Ether (DEE) and after acid hydrolysis (SBR= Schmid - Bondzynski - Ratzlaff) with subsequent Petroleum ether (PE) extraction.
SBR, Schmid-Bondzynski-Ratzlaff meth-od (also: Werner Schmid method)
Involves hydrolysis with 8 M HCl and extraction with PE and DEE including addition of ethanol; is used e.g. for determina-tion of total fat in meat and meat products (NMKL 131) or milk products with low lactose content (ISO 1735).
Weibull-Berntrop (WB) method Acid hydrolysis method (4 M HCl) with subsequent PE extrac-tion (e.g. ISO 8262). Is used for milk based foods.
Röse-Gottlieb (RG) method Alkaline (ammonia) hydrolysis method to strip the fat from pro-tein. Alkohol for transistion of fats into the organic phase and PE and DEE for extraction of the fat.Used for milk.
Mojonnier method Alkaline hydrolysis similar to RG. A special Mojonnier extraction flask is used.
Weibull Stoldt (WS)Acid Hydrolysis Method
Classical acid hydrolysis method for most food samples. Sample is hydrolysed with hydrochloric acid to liberate fat that may be bound to protein or other polar compounds. Fat in dried residue is extracted into solvent using PE or DEE (e.g. ISO 1443 and BS 4401:part4:Method A).
Sample Diethyl ehterExtraction [%]
SBR acid hydrolysis [%]
Wheat 1,51 2,94
Barley 1,58 3,20
Soy meal 0,69 3,18
Maize 4,89 5,99
Fish meal 8,64 12,3
Broiler mash 5,75 7,03
Table II: Hydrolysis methods.

12
Of special interest is the Council Directive 90/496/EEC of 24 September 1990 on nutrition labeling for foodstuffs. The directive states rules for nutrition labeling and lists fat as one of the ‘‘big 4’’. Fat is defined as total lipids including phospholipids, but no specific method is given. Such a definition implies that hydrolysis is to be used to release bound forms of fat.
Many food authorities are using acid hydrolysis methods according to Weibull Stoldt. The British Food Standards Agency has recently carried out a survey to determine the nutrient composition of a wide range of pasta and pasta sauces using the standard BS 4401: part 4, Method A, which is equivalent to ISO 1443.
Table II shows some common hydrolysis methods. Note that the SBR method, using the strongest acid concentra-tion, is often used for wet samples. The Röse-Gottlieb method is used for milk and most milk products, but not for cheese and cheese products as they do not dissolve readily in ammonia. Also free fatty acids e.g. in ripen-ing cheeses, are not extracted in ammoniacal solutions.
For animal feed, the COMMISSION REGULATION (EC) No 152/2009 of 27 January 2009 laying down the meth-ods of sampling and analysis for the official control of feed actually specifies a method for the determination of fat and oils in feed ingredients and compound feed. Procedure A (Fat A) for directly extractable crude oils and fats is applicable to feed materials of plant origin. Procedure B (Fat B) for total crude oils and fats involves a hydrolysis step and is applicable to feed materials of animal origin and to all compound feeds. It is to be used for all materials from which the oils and fats cannot be completely extracted without prior hydrolysis. In all cases where a higher result is obtained by using Procedure B than by Procedure A, the result obtained by Procedure B shall be accepted as the true value.
The EU method described in the regulation is equiva-lent to the ISO standards 6492 (5) and 11085 (6). The method ISO 11085 is using the FOSS Soxtec system in combination with acid hydrolysis, reducing the extrac-tion times from 6 hours to 40 min boiling and 20 min rinsing, whilst keeping the hydrolysis time still at 1 hour. A white paper regarding the validation of this method is available from FOSS.
ConclusionsAlthough it has a more solid scientific foundation, the definition of total fat as the fatty acids obtained from a
total lipid extract of the food matrix expressed as triglyc-erides could not replace traditional, i.e. solvent extrac-tion based gravimetric methods for the determination of fat during the past 20 years. It is expected that both approaches will continue to exist in parallel. What has come more into focus is total fat, especially after acid hydrolysis. The European directive 90/496/EEC is presently under revision and the European Commis-sion launched a consultation among Member States and stakeholders in view of preparing a proposal amending the directive. A summary of results for the consultation has recently been published. On top of the priority list was total fat (7).
By Dr. Jürgen Möller
References(1) NMKL method no 131: Fat – according to SBR (Schmid - Bondzynski – Ratzlaff) in meat and meat products
(2) ISO 1375:2004 Cheese and processed cheese products - Determination of fat content - Gravi metric method (Reference method)
(3) AOAC Official Method 996.06, Fat (Total, saturated, and unsaturated) in Foods – Hydrolytic Extraction Gas Chromatographic Method
(4) ISO 1443:1973 Meat and meat products - Determination of total fat content
(5) ISO 6492:1999 Animal feeding stuffs - Determination of fat content
(6) ISO 11085:2008 Cereals, cereal-based products and animal feeding stuffs - Determination of crude fat and total fat content by the Randall extraction method
(7) http://ec.europa.eu/food/food/labellingnutrition/ betterregulation/lab_cons_summary.pdf

13
Glucose, fructose and lactic acid measurements are now available for the OenoFoss wine analyser.
The lactic acid option will give OenoFoss users a more complete picture of the conversion of malic to lactic acid, giving an indication of how malolactic fermentation is progressing according to the goals of the winemaker in terms of quality and style. The ability to measure glucose and fructose will help OenoFoss users to check if fermentation is complete or if there is any danger of fermentation restarting after bottling.
The new measurement options complement the exist-ing OenoFoss range of parameters such as malic acid, volatile acid, pH and many more.
Wine industry manager, Morten Olander said: “We have over 500 OenoFoss users around the world and it is great to be able to offer these additional finished wine options to users who want extra information at the crucial finished wine stage.”
The new parameters can be purchased as a finished wine package for the OenoFoss.
More information about OenoFoss here
More about the use of OenoFoss here
New finished wine measurements available for OenoFoss™Extra parameters improve pre-bottling checks and control of malolactic fermentation

14
Currently, four laboratories are using the screening tool. In Europe it is Qlip in the Netherlands, Analis in France and Milk Control Station Flandern in Belgium. In Canada it is Valacta, the lab covering the eastern part of Canada. The data now being sent to farmers is based solely on the FTIR results without reconfirmation from the direct method. This does not mean that laboratories are turn-ing their back on the more precise direct method, but more of an acknowledgement of the FTIR screening as a faster and affordable ‘indication’ of the condition in the dairy herd.
Up and running in Europe and CanadaIn Europe, MCC Flanders in Belgium and QLIP in the Netherlands started off with similar procedures. Until spring this year, both were only using results from the acetone prediction model. All results above a certain limit (in MCC Flanders 0.1 mmol/l and in Qlip the 4% highest results) were reconfirmed with the direct method
before any results were forwarded to CRV*. Since May 1st (MCC) and June 1st (QLIP) 2012 both labs have been forwarding results for both acetone and BHB to CRV. The labs no longer perform reconfirmation tests, saving both time and money. And, after evaluating large amounts of data, both labs have concluded that the new procedure provides results which are as good, if not even better than the previous procedure did. In Canada, a study comparing results between the in-frared method and the direct method revealed that on regular DHI samples, hardly any positive samples were detected to be high in acetone. This was probably due to
Status on Ketosis ScreeningIt is over a year since the launch of a new analytical tool which allows labs to screen milk recording samples for signs of ketosis as part of the conventional testing. Interest in the new parameter is growing, but there are questions too about how it should be implemented. Consultant Tove Asmussen gives an update on progress with the FTIR based screening tool and discusses the main considerations for new users.
“Losses due to subclinical ketosis are estimated by the Valacta laboratory to be 273 euro per case under Canadian conditions.”

15
the sample handling procedure. Therefore it was decided to go for BHB alone.
Following evaluation of the prediction models, the direct method has only been used for monitoring performance of the prediction model. Before the routine screening started, advisors were invited to participate in education and discussions. Brochures were sent to all dairy farm-ers and the service was offered free, for three months. Today, approximately 65 % are requesting screening results and the number is increasing every month.
Things to consider in the upstart phase There are a number of considerations when starting up, including how to communicate results, monitoring the performance of the prediction model, whether acetone or BHB should be selected and which preservatives can be used without affecting the results.
Communicating resultsIn Canada, results reported to dairy farmers show de-velopment in a herd over time - split up between 1st lactation and later lactation cows. Results for each cow are displayed month by month and listed within three groups; those being positive, above 0.2 mmol/liter, those being suspects and those below 0.15 mmol/liter.
This fits with existing practice for reporting in Europe where labs in Switzerland and France show the sever-ity of the ketosis/acetone result for individual cows on a scale where level 1 indicates normal status and the higher the number, the more severe is the indication for ketosis.
In the Dutch and Canadian reporting, an additional over-view of the situation and development of the entire herd is offered too. Given that ketosis is typically a herd
problem, popping up periodically, this seems extremely appropriate for a diagnostic tool. Taking the precision into account it also seems appropriate to offer the result as an index between 1 and 5.
Reference analysis?Performance can be verified by analyzing samples in parallel with a direct method onsite or by shipping the frozen, analyzed samples to a laboratory possessing the equipment. The samples must be analyzed on the Milko-Scan before they are frozen.
However, there are challenges verifying performance. As we are operating at a rather low level of concentration, it may be difficult to gather samples with high con-centrations of acetone and BHB. So a more pragmatic method for adjustment of the prediction models may prove beneficial.
When analyzing large amounts of routine milk recording samples, most of these samples will contain no acetone at all and no or very low contents of BHB. Studies from the Netherlands and in Canada show that from 0 - 60 days after calving, a maximum of 30 % of all cows have elevated levels of acetone and BHB, and for entire lacta-tion it is hard to imagine a percentage of elevated sam-ples above 10%. This knowledge can be used to do a very pragmatic but, it seems, also very precise intercept adjustment of the prediction models.
Because we know the true value of the 50% lowest samples is 0 for acetone and approximately 0, - say 0.02 for BHB, the 50% fractile of the analyzed samples can be adjusted to zero for acetone and 0.02 for BHB. This is done by calculating the difference between 0/0.02 and the 50% fractile determined for each parameter. To check the 0-level for BHB from time to time and to
Example report showing the number of affected animals compared to same time last year for early lactation cows and all cows. Finally the specific cows affected are displayed also with infor-mation about lactation no and stage, actual yield compared to expected.

16
check this procedure in general, it is recommended to take 50-100 random samples that have already been analyzed on a MilkoScan for analysis with the direct method at another laboratory.
Acetone or BHB?Cows suffering from subclinical ketosis have, by defini-tion, a concentration of acetone above 0.15 mmol/liter. For BHB the limit is 0.1 mmol/liter. In a study made at Qlip in the Netherlands back in 2005 it was found that prediction models for these two parameters could be made using FTIR.
Subsequently, we have seen that prediction of acetone in particular may be lower than expected, whereas the prediction of BHB is as expected on the same samples. This is probably due to the fact that acetone is more volatile than BHB.
Depending on local conditions, the prediction for BHB alone may detect most of the ketosis samples that would otherwise be detected in the lab. Thus it may seem nat-ural to use the BHB prediction model only. However, samples high in acetone may not be high in BHB, so if the sample quality allows screening for acetone as well, this is the optimum solution.
Preservatives?Studies indicate that the prediction model for acetone is not influenced by any of the preservatives in the test whereas the prediction model for BHB seems to be slightly influenced by sodium azide and to some extent by azidiol as well. If the concentration of these pre-servatives in the milk samples is constant, this can be compensated for.
Growing interestFor years, dairy farmers have known that ketosis can be a very costly disease and many have had a feeling that clinical cases were only the tip of the iceberg. In a Cana-dian study it was found that, on average, 30 % of early lactation cows in Canadian herds suffer from subclinical ketosis. Based on this paper and other publications, the losses due to subclinical ketosis are estimated by the Valacta laboratory to be 273 euro per case under Ca-nadian conditions. Losses are due to lower milk produc-tion, more days open, increased risk of culling or death. With this knowledge in mind it is obvious that interest in integrating this parameter into routine milk recording services is increasing.
Three labs are now up and running, using FTIR, with well documented performance and good results. Many les-sons have been learned along the way and now future users can start benefitting from all the experiences. A number of labs are already in the test phase and judging by the interest, others will soon join them.
By Tove Asmussen
The direct method There is no universally accepted reference method for the direct (chemical) method referred to in this article, but this description taken from the Journal of Dairy Science Vol. 90 No. 4, 2007, gives an excellent summary of a commonly used chemical method. “Chemical analyses were executed with segmented flow methods, applying SAN++ equipment (Skalar, Breda, the Netherlands). Acetone was determined through separation from the sample by gas diffu-sion through a Teflon membrane. The subsequent reaction with hydroxylamine resulted in a pH shift, which was measured photometrically at 520 nm using methyl orange as an indicator (Skalar method, catalog number 110-363). Executed validation studies revealed a limit of detec-tion of 0.06 mmol/L and a repeatability r of 0.06 mmol/L in the range up to 1.5 mmol/L. For the measurement of AcAc, the sample was preheated by placing a sealed container in a water bath at 100°C during 35 min. After mixing, the total amount of Ac and AcAc was determined according to the de-scribed procedure for the determination of Ac. The difference between the 2 values corresponded to the AcAc concentration.The BHBA was determined by dialyzing a buffered milk sample against a Tris buffer solution (pH = 9). In the presence of 3-hydroxybutyrate dehydrogenase, BHBA was oxidized by NAD to AcAc and NADH.The amount of NADH was measured photometri-cally at 340 nm (Skalar method, catalog number 388-301). The limit of detection was 0.04 mmol/L, whereas for the repeatability a value of 0.03 mmol/L was obtained in the range up to 0.6 mmol/L. Add-ing BHBA stock solutions to milk samples showed a recovery of 110%.”
“It may seem natural to use the BHB prediction model only. However, samples high in acetone may not be high in BHB, so if the sample quality allows screen-ing for acetone as well, this is the optimum solution.”
17
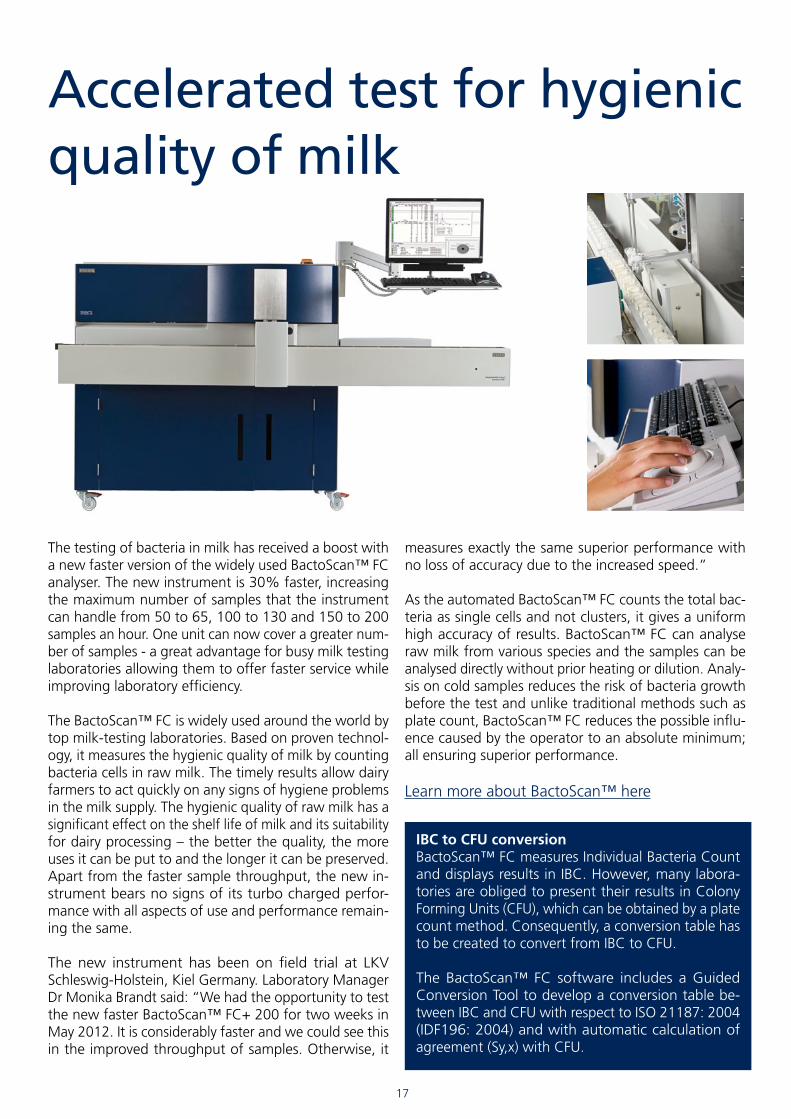
The testing of bacteria in milk has received a boost with a new faster version of the widely used BactoScan™ FC analyser. The new instrument is 30% faster, increasing the maximum number of samples that the instrument can handle from 50 to 65, 100 to 130 and 150 to 200 samples an hour. One unit can now cover a greater num-ber of samples - a great advantage for busy milk testing laboratories allowing them to offer faster service while improving laboratory efficiency.
The BactoScan™ FC is widely used around the world by top milk-testing laboratories. Based on proven technol-ogy, it measures the hygienic quality of milk by counting bacteria cells in raw milk. The timely results allow dairy farmers to act quickly on any signs of hygiene problems in the milk supply. The hygienic quality of raw milk has a significant effect on the shelf life of milk and its suitability for dairy processing – the better the quality, the more uses it can be put to and the longer it can be preserved. Apart from the faster sample throughput, the new in-strument bears no signs of its turbo charged perfor-mance with all aspects of use and performance remain-ing the same.
The new instrument has been on field trial at LKV Schleswig-Holstein, Kiel Germany. Laboratory Manager Dr Monika Brandt said: “We had the opportunity to test the new faster BactoScan™ FC+ 200 for two weeks in May 2012. It is considerably faster and we could see this in the improved throughput of samples. Otherwise, it
measures exactly the same superior performance with no loss of accuracy due to the increased speed.”
As the automated BactoScan™ FC counts the total bac-teria as single cells and not clusters, it gives a uniform high accuracy of results. BactoScan™ FC can analyse raw milk from various species and the samples can be analysed directly without prior heating or dilution. Analy-sis on cold samples reduces the risk of bacteria growth before the test and unlike traditional methods such as plate count, BactoScan™ FC reduces the possible influ-ence caused by the operator to an absolute minimum; all ensuring superior performance.
Learn more about BactoScan™ here
Accelerated test for hygienic quality of milk
IBC to CFU conversionBactoScan™ FC measures Individual Bacteria Count and displays results in IBC. However, many labora-tories are obliged to present their results in Colony Forming Units (CFU), which can be obtained by a plate count method. Consequently, a conversion table has to be created to convert from IBC to CFU.
The BactoScan™ FC software includes a Guided Conversion Tool to develop a conversion table be-tween IBC and CFU with respect to ISO 21187: 2004 (IDF196: 2004) and with automatic calculation of agreement (Sy,x) with CFU.

18
If it works, leave it alone – it is a tempting thought, es-pecially for those who have spent several years carefully developing valuable calibration data for testing various feed ingredients on their trusty instruments such as the NIRSsystem II (6500 and 5000 models). In the twenty years or so since System II units took the stage, however, NIR analytical technology has evolved rapidly offering real and significant advantages for feed producers.
There are a growing number of valid options to choose from when considering a new NIR analyser, but the NIRS DS2500 in particular gives two key advantages for any feed producer considering a new solution. Firstly, it of-fers unique signal strength and low noise across a broad measurement spectrum making it consistently accurate and extremely versatile. And secondly, developers have
also thought about the vital issue of assuring a safe and smooth calibration transfer.
So how exactly is the new NIRS DS2500 different from its NIRSystem II predecessor? In some respects it is the same, for example, with the same detector technol-ogy for generating the NIR spectra. This helps when transferring calibrations. In other respects there are major improvements. These also contribute to calibra-tion transferability while giving the new platform great performance through a unique signal to noise ratio.
Performance gives clarity across the entire measurement spectrumThe signal is great and the noise is lower across the whole wavelength range of 400 – 2500 nm. This al-
Clear NIR In 2011 FOSS released a new high performance NIR feed analyser called the NIRS DS2500. But why do users in the feed industry need such an instrument when existing NIR instruments are still performing adequately and even then, how can valuable calibration data built up over years of NIR analysis be reused on the new platform?

19
lows users to study and predict new parameters with absorption peaks laying at the extremes – below 600 nm and above 2200 nm, for example, colour pigments in the range of 400 – 700 nm or fibre and amino acids up to 2400nm.
The instrument is also highly stable. If we compare the NIRS DS2500 to a rifle firing at a target it would give great grouping. Even for the most finely tuned rifle, there is a little spread, but that spread is always consist-ent and predictable – you don’t need to keep adjusting the sights.
The rock solid performance of the NIRS DS2500 is aug-mented by factory standardization. When a unit is made, it is set up to a defined and traceable spectra position according to its internal standard. Because the design is so solid, the units can be relied on to measure all the same (same spectra position). So the grouping of the units coming off the production line will match that of the master unit. In comparison, NIRS System II units require adjustment (standardization) to consistently hit the same spot as the master instrument.
An internal standard (Internal wavelength standard (NIST SRN1920A) and external standards (ERC cup) allow the instrument performance to be monitored and brought back to the original factory standardization to the master instrument image, for example, if this is necessary after a lamp change or repair. In other words, the NIRS DS2500 calibrations will still be safe and sound.
Consistency makes calibration transfer simpleThe ‘all measuring the same’ aspect pays dividends when transferring calibrations from one NIRS DS2500 unit to another – there is nothing to worry about because units can be relied on to measure the same right out of the box. And it makes the unit highly compatible compared
to the System II instruments because it is straightforward to standardize the NIRS DS2500 master to multiple other instruments, for example, when transferring a calibra-tion from multiple NIRSystem II units to a NIRS DS2500.
No new samples requiredThe optical foundation or ‘bench’ on which the NIRS DS2500 is based is very similar to the System II instru-ment. This gives a great starting point for transferring calibrations. So when moving to the DS 2500 platform, a standardization is performed that matches exactly. Users who have made the step report that it is quick and no new sampling work to speak of is required. Then you are up and running on the new NIR platform re-using your valuable calibration data.
For other cases where the optical bench is not so closely matched to the NIRSystem II, there will always be a dif-ference that needs to be accounted for when re-using calibrations developed on NIRS System II platforms. In practice, this means new standardization work towards the new instrument and new sampling. But how many samples are required - will 15 be enough or should it be 30? Most would say the latter, but consider then how many calibrations you want to transfer and the cost and time involved in doing that sampling work. And why do it anyway, when a high performance NIR platform is a simple step away?
A combination of features As shown in table 1 below, a number of features com-bine to create the performance and compatibility of the new NIRS DS2500.
Among these the physical enclosure, the fittings the lamp mounting and cooling and such like give great sta-bility for a strong signal and low noise across the broad spectrum. Others add to convenience and ease of use,
Signal strength coupled with low noise across the entire spectrum gives clarity for a range of measurements.
Consistency of measurement can be compared to a rifle firing at a target.

20
for example with a larger sample cup and capability to measure pellets in unground form. Software features such as the Mosaic internet networking functionality make it easy for experts to monitor and control multiple units from a central location. Units can also be updated with new calibration data at the click of a mouse button.
Future proof Sometimes it seems that technology developers only complicate things, but in the case of the NIRS DS2500 they have managed to make the increasingly important task of routine NIR simpler and more accessible. The NIRS DS2500 is a synthesis of the latest and best in NIR analytical technology. And perhaps most importantly, it offers a reliable, quick and convenient transition to new NIR offering crystal clear NIR across a broad spectrum.
By Richard Mills, [email protected]
Learn more about NIRS™ DS2500 here
Feature Improvement over System II and other instruments
Enclosed box Protection of optical components against dust and moisture improves flexibility for use closer to the action in the feed mill
Internal lamp mounted directly on monochromator
Avoids need for slit to external source and so avoids concerns about bandwidth variations - important for performance and calibration trans-ferability
Liquid cooling of lamp Maintains perfect temperature – no variations that could create noise
Solid monochromator mounting with attention to every detail, includ-ing choice of metals and vibration dampening in feet
It never moves. Stability ensures performance and repeatability
Internal wavelength standard (NIST SRN1920A)
The audit trail to an internationally recognized NIR standard. Makes it quicker to handle re-standardisation, eg after lamp change
External standard (ERC cup) Easy and quick to use, to put unit exactly back where it was when it left the factory. Aids calibration transfer and stable performance
Glass in the sample cup is made from the perfect quartz for the job
Avoids noise from spectral defects (no variations)
Measurement from below using unique light exposure system
No need to cover sample to avoid evaporation or absorption of moisture. Good for unground samples, just ensure enough is in the cup to fill the base, measurement area reduces sample handling.
Eight sub sampling positions (default)
Gives a great representation for lower sampling error
Easy to use sample cup and dedicated slurry cup
It’s cleaner and quicker – just pour and measure or also measure liquid samples
Top loading of sample with light exposure from below means no packing is needed and no light interference.

21
While reference analysis will always play a central role in calibration modeling, developments in chemometrics are allowing rapid NIR methods to take the burden of routine testing with measurements as good as, and often even better than reference methods. But how can we prove that the NIR and chemometrics based prediction is as good or more accurate than the reference analysis result?
In this paper, chemometricians from FOSS use multiple laboratory results from a ring test study and ANN calibra-tions for whole grain analysis to demonstrate how the concept can be proven.
Download the paper here
CHEMOMETRIC CORNER
Can NIR & Chemometrics be more accurate than the reference method?
A review of global ANN calibrations for whole grain analysis
Download white paper

22
Q: What exactly do we mean by ‘in-line’ analysis?Sievers: In-line means that we measure directly in the process line, no sampling or bypass is needed, to get real time process data.
Q: How does in-line analysis add value to the dairy process? Sievers: With real-time process results, you can detect trends in your process and reduce variations. This allows you to move your production targets closer to the specifi-cation, to increase your yield and to improve your quality.
Another aspect is the 100 % traceability. If you know what is happening in your process at any one time you detect process malfunctions, like a blocked valve or a leaking membrane, and react on it.
With an analyser in the lab, you’ll only measure once an hour, so the production can be out of specification for a whole hour. Another consideration is that there is always a certain margin of error due to measurement error and sampling error. Of course, you still have this margin of error with in-line analysis, but because you get an averaged result every 15 - 30 seconds, it reduces the overall margin of error. For instance, if you are produc-ing butter, with the classical laboratory setup you’ll get one result per hour and you can achieve a variation in moisture down to 0,20 %. With in-line process analysis, you get 120 results per hour and you can reduce the variation to below 0,10 %.
Here’s a real example from the field. A producer was making about 4.000 tons of butter per year and had a variation of about 0,25 % in the process. To be on the safe side, he set a target of 15,65 vs a spec of 16.00 %
moisture. But with in-line analysis he could reduce the variation by 0,08 % allowing him to move his target up to 15,85. His yield grew by 15.000 kg per year - an extra profit of about 40.000.You can say this customer was able to turn 15.000 kg of water into butter.
Q: Can you give an overview of the in-line options available to dairy producers today?Sievers: Looking at the FOSS portfolio there are four options for dairy production with the ProFoss line: for butter, whey powder concentrate, fresh cheese and milk powder. Beside the NIR- based ProFoss, there is the Pro-cesScan for liquid milk using Fourier transform Infrared. Q: How does the NIR solution measure different sample types directly in the process stream?Sievers: In-line measurement is all about revealing trends in the process, so you must measure directly in the pro-cess stream. Some solutions on the market involve a bypass flow, but here you lose all the benefits of true in-line analysis because you cannot detect trends.
To measure in-line you need a dedicated sample interface and the right form of NIR technology. For powder, near infrared reflectance works fine, but for semi-solid prod-ucts like butter, Greek yoghurt, quark etc, transmission is the right form as the near infrared light penetrates deep into the sample to get a representative measurement.
One interface we have developed is the so called Lateral Transmission Probe. It is a NIR transmittance probe and is especially good for measuring fresh cheese, butter and whey protein concentrate (WPC). The probe improves greatly on the classical transmission setup which, in our
Get in-line – how to take advantage of new dairy process analysis solutions
Options for process control with in-line near infrared analysis are improving every day. In focus caught up with FOSS process analysis expert Michael Sievers for an overview of recent technology developments and the considerations to be made before getting into in-line analysis.

23
experience, was difficult to implement, for example, a tailor-made flow cell was required. In contrast, the lateral transmission probe is a standard setup and as a result, people are often astonished at how easy it is to install a ProFoss.
Another dedicated interface is the powder probe. This is mounted in the process pipe and has a spoon to catch samples of powder. The sample is blown off the spoon automatically between measurements to ensure the in-tegrity of each measurement.
Q: How do I know if in-line process analysis is for me, for example, why not stick to benchtop analy-sis?Sievers: It is really not very complicated. In-line process analysis is not so much about scale of production, but more about the amount of variation in the process. Get-ting a significant reduction in such variation is the key to the payoff.
We have created a simple check list to analyse each in-dividual business case. If we know the current variation, the yearly production, the targets and the product speci-fications, we can easily calculate a profit improvement proposal. We have been implementing these process analysis solutions for many years so you can gain from our collective experience. You don’t need to think about setting up a long and expensive development project just to find out if process analysis is worthwhile.
Q: What are the typical steps involved in installing a system?Sievers: The first thing is to use the check list to figure out the return on investment. If there is a business case
we then make a commissioning plan defining the share of responsibilities.
The installation is quite easy as we use standard dairy Interfaces. In most cases, all that is required is some welding where the interface is to be inserted. Normally, this can be done during a normal stop in the produc-tion. The next step is to make it work according to the demands of the individual businesses. This includes cali-bration development, integration into a PLC and training. We aim for handover within four weeks.
In the past, calibration development was particularly resource-intensive. Now the user just carries on using their existing set up, for example a FoodScan instrument, but each time they run a sample they select a software option that records the data. We then use this data to check the calibration supplied with the ProFoss.
Q: Once it is in, how can producers keep it running just right? Sievers: This is something we have thought a lot about because users need a solution, not just a sensor. A train-ing and support package is included and there is the option of a preventative maintenance agreement, in which case there is nothing for the user to do to keep the instrument running in terms of the hardware. With respect to calibration, the same procedures known from laboratory instruments are used and our “auto calibra-tion” system ISIcal makes it easy to update the calibra-tion.
By Richard Mills, [email protected]

24
Taking the next step in dairy process control German dairy cooperative Berchtesgaden decided to take advantage of new technology and opted for a measuring solution to help them optimise yield and control key quality parameters in their butter and cheese production. Us-ing a near infrared, in-line analysis solution to control a broad range of natural products, guarantees them a consistent final product quality while making optimal use of raw materials.

25
Berchtesgaden is a medium-sized company based on a cooperative of dairy farmers from around Piding in Ber-chtesgarden, formed in 1927. The company produces high quality butter, yoghurt, cream, cottage cheese and other products, using only the best raw materials for optimal taste. The secret behind their dairy products is the great care with which they are made, with a focus on hygiene and international management systems ac-cording to the highest international standards. In cor-respondence with production level, a similarly high level of attention is focused on process analysis.
Making the moveThe partnership with FOSS goes back decades. Many traditional Pidinger milk laboratories have been using FOSS MilkoScan as a fast and reliable solution to meas-ure parameters such as fat, protein, lactose, sucrose, total dry mass, fat-free dry mass, density and acids for years. Based on this collaboration and a new goal to upgrade production control, switching to continuous in-line analysis seemed like a natural step.
The dairy plant produces a large variety of dairy prod-ucts, necessitating frequent grade changes on produc-tion lines. In 2011 an in-line system was integrated into the quark line. Standardising dry matter and getting the protein content just right, has made it possible to increase yield and save on costly raw materials, while improving product quality. Additionally, the capacity of the production line has been improved and compared to conventional laboratory measurement control; continu-ous in-line analysis has significantly reduced variation in final products.
Based on the positive experiences in the quark line, a ProFoss system was installed in the butter churn in 2012. The ProFoss measures water and fat-free dry matter content, ensuring that these parameters are optimised, standardised and documented according to legal require-ments. With more precise control and understanding of the production process it is possible to make timely adjustments and ensure optimum yield without overus-ing expensive raw materials.
“With our product structure and the large variety of products we are able, thanks to the new systems, to trace all transactions accurately for faster and better control,” says quality manager Lorenz Engeljähringer about the benefits of in-line analysis.
Through continuous monitoring, the Berchtesgaden dairy cooperative is able to maintain their own high quality standards, which in turn is rewarded by satisfied customers. The implementation of in-line monitoring has also resulted in the establishment of best practice rou-tines throughout the Berchtesgaden dairy cooperative.
Real-time measurements for improved controlThe ProFoss system uses high resolution diode array technology with no bypass for non-destructive analysis of food in the process line. The system is installed at the appropriate point in the production area and data is transmitted to the control room. ProFoss is easy to install and complies with all health and safety requirements of the food industry such as IP 69 and EHEDG.Results can also be sent to an external control system for automatic regulation. This system is just as precise as ordinary lab analysis, but with continuous, real-time pro-cess analysis it is possible to immediately identify out of spec variations and make adjustments when necessary.
“For us as a medium-sized dairy plant, the investment in in-line process control is definitely worth it,” says pro-duction manager Bernard Staller of the Berchtesgaden milk plant. “So far we’ve had hourly samples brought to our lab for analysis. In between measurements we had basically no precise information about our products. With the new system we get real-time production data and can intervene directly in the process. Now we know every ounce of our final butter and cheese products, so to speak, and can take immediate action when we detect even the smallest changes in production. In the event that we receive a complaint, we can retrieve all traceable data with the press of a button.”
Translated from an article by Susann Balser-Hahn
Calculation example: For an annual production of 4500 tons of butter, for example, an increase in the water content of 0.2 percent amounts to an annual saving of around Euro 40,000, guaranteeing a return on investment in two years. In comparison to manual sampling, control costs and loss of time are reduced as is the potential for production errors. Measurement results can be in-corporated into existing ERP systems and meet with existing documentation requirements.