in general, the international experience has …...• unemployment fellby more than two-fifths; •...
TRANSCRIPT

This report is organised as follows:- the Introduction traces the evolution of the Irish labourmarket since 1993 as a precursor to discussing Irish unemployment indicators. Section Oneexamines international approaches to the measurement of unemployment. Section Two then looksat the three principal sources of information on Irish unemployment: quarterly labour forcesurveys, the Live Register of unemployment benefit claimants, and the FAS Job-Seekers' Register.Section Three assesses the composition of the Live Register and enumerates its deficiencies as ameasure of unemployment. Section Four charts the development of both domestic and EuropeanUnion policies aimed at helping the unemployed back to work and traces out some of theoperational implications for domestic labour market agencies. The report ends with a set ofconclusions.
Rapid and sustained economic growth over the past five years has resulted in a sharpimprovement in demographic and labour market performance. Between 1993 and 1998:-
• the population of working age increased by 8% to almost 2.9m.;• the labour force expanded by 15.5%;• employment rose by over one-quarter to 1.5m people;• unemployment fell by more than two-fifths;• the unemployment rate was more than halved.
The continuing strength of the economy indicates that employment will continue growing, andunemployment declining, through 1999. As a result of the sustained expansion of employment,labour is becoming scarce. In these conditions cutting unemployment not only improves the livingstandards of those gaining work but it alleviates labour shortages, so removing a potential barrierto the continuance of growth into the future.
Most developed countries compile three types of data that yield information about unemployment.These are:-
regular labour force surveys;counts of recipients of unemployment payments;counts of job seekers registering with the public employment service.
Report Prepared by:Tansey Webster Stewart & Company Limited

In general, the international experience has identified the labour force survey approach asproviding the most accurate measure of unemployment. In such surveys, the preferred definitionof unemployment is that formulated by the International Labour Organisation (ILO). It definesunemployed people as those who are not in work, are available for work and are actively seekingwork.
Reflecting the international experience, Ireland produces three types of information onunemployment: -
• regular labour force surveys in the form of the Quarterly National Household Survey(QNHS), now produced every three months by the Central Statistics Office. In these surveys,unemployment is measured in conformity with ILO definitions. In consequence, the resultsare comparable with surveys conducted in other European Union members. This is seen asthe most reliable indicator of actual unemployment in Ireland;
• the monthly Live Register, published by the CSO, enumerating those receiving unemploymentpayments and those signing on for credited contributions. The Live Register is seen as aninaccurate guide both to the level of unemployment and to short-run changes in the numbersout of work;
• the Job-Seekers Register, compiled by FAS. Registration is voluntary and once on, jobseekers are not deleted unless they have made no contact with FAS for six months and areknown not to be on the Live Register. As a result, the Job-Seekers register is not deemed toreflect accurately the numbers searching for work.
It is concluded that regular labour force surveys of the QNHS type provide the best availablemeasure of the level of, and trends over time in, Irish unemployment. While they are inaccurateguides to the numbers out of work, both the Live Register and the Job-Seekers Register areextremely important from a policy perspective since they are comprised of real, identifiableindividuals.
The past decade has witnessed a growing divergence between unemployment as measured bylabour force surveys and the numbers on the Live Register. In 1988, the gap between the two wasjust 25,000; by 1998, it had widened to over 100,000.
Report Prepared by:Tansey Webster Stewart & Company Limited

The Live Register is an administrative count of benefit claimants and those signing for creditedcontributions. For any given underlying level of unemployment, the numbers on the Live Registerwill change where:-
i) the coverage of the unemployment benefit system is altered through the inclusion or exclusionof certain population segments. Thirty such administrative and policy changes were recordedbetween 1970 and 1995;
ii) the statutory conditions governing eligibility for benefit, and the interpretation of thoseeligibility conditions, are varied. Particularly important are the interpretations of the'availability for work' and 'genuinely seeking employment' conditions;
To take an example: in September 1996, the CSO published an ll..-O analysis of a sample ofpersons on the Live Register. In summary, it revealed that of the adjusted sample, 21.4% wereat work, full- or part-time, 24.6% were not economically active, 4.5% were marginally attachedto the labour force and 49.5% were unemployed. The publication of the results occasioned muchpublic controversy. DSCFA procedures were codified and reaffirmed. The 'announcement' effectsprompted many to sign off the Register. As a result, the CSO found that on publication of thesample survey results in September 1996, "the Live Register began to fall steeply and the steepestfallon record was for October 1996".
The reduction of unemployment is a central objective of national economic policy and acornerstone of 'Partnership 2000'. At a European level, the Treaty of Amsterdam and thesubsequent Luxembourg Jobs Summit of 1997 established a new European Employment Strategy(EES). The four pillars supporting the employment strategy are Employability, Entrepreneurship,Adaptation and Equal Opportunities.
The EES has required member-states to draw up National Action Plans on Employment toimplement specific policy guidelines under each of the four pillars. Preventing the drift into long-term unemployment has been the key strategic policy thrust under the Employability pillar.
Since September 1998, the implementation of Guideline 1 of the National Action Plan onEmployment has required 'systematic engagement' with the young unemployed at risk to long-term unemployment.

Under the guideline, those aged under 25 who are approaching six months on the Live Registerare referred by DSCFA to FAS for interview and subsequent placement. Such systematic andintensive face-to-face interaction with the unemployed is a relative novelty in Ireland, though ithas long been a feature of policy in other European countries.
The results to date are encouraging. Amongst all DSCFA referrals since September 1998, 47%had left the Live Register by end-November. Of all those who left the LR, two out offive werein work and a further one in four were enrolled in FAS programmes or the education system.Amongst referrals interviewed by FAS, more than four out of five were at work or on FASprogrammes. The caseworking approach adopted in the implementation of Guideline 1 offers thebest hope for helping those on the Live Register in the future.
i) Sustained employment growth since 1993 is now giving rise to incipient labour shortagesacross the skills spectrum. Reintegrating unemployed people into the workforce can bothraise their living standards while also helping to alleviate labour scarcity.
ii) The Quarterly National Household Survey published by the Central Statistics Officeprovides the best and most accurate measure ofIrish unemployment.
iii) The Live Register is a count of claimants As such, it is neither an accurate barometer ofunemployment nor a reliable indicator of short-run trends in unemployment.
iv) The divergence between the LR and survey measures of unemployment arises becauseeach is measuring a different event. It is thus unlikely that a full reconciliation between thetwo sets of figures can be achieved.
v) In these circumstances, there is a strong case for switching the emphasis to ensuring thatthe unemployed on the Live Register are helped back to work by the state.
vi) Ireland has a poor record of helping the unemployed on an individual basis back intoemployment. The case-based approach, pioneered under Guideline 1 of the NationalAction Plan on Employment, offers the best hope of reintegrating those on the LR backinto work.
vii) Even when fully operational, the National Action Plan on Employment will engagesystematicallywith only a minority of those on the Live Register, namely those at risk tolong-term unemployment. The existing stock oflong-term unemployed are thus largelyexcluded from the current activation process.
Report Prepared by:Tansey Webster Stewart & Company Limited

viii) In furtherance of existing policies to combat unemployment, and especially long-termunemployment, we would propose that consideration be given to the introduction ofsystematic and regular labour market interviews with all of those who have passed a givenduration threshold on the Live Register.
ix) The role, functioning and efficiency of the Local Employment Service (LES) in assistingthe unemployed back to work requires further examination.
x) It is difficult to justify the availability of Unemployment Assistance (UA) to 18 year-oldswho have neither worked nor availed of the array of state education, training, placementor work experience interventions specifically targeted at improving the employability ofyoung people.
Report Prepared by:Tansey Webster Stewart & Company Limited

I. Structure and Methodologyll. Deriving the Labour ForceIll. Labour Force Growth Since 1993IV. The Composition of UnemploymentV. Regional Trends in Employment and UnemploymentVI. The Links Between Growth and JobsVII. Future Labour Market Trends
IIIillVVIIIXIX
SECTION 1: INTRODUCTION: INTERNATIONAL APPROACHESTO THE MEASUREMENT OF UNEMPLOYMENT
1.1. Survey Measures1.2. Counts of Claimants for Unemployment Payments1.3. Registration with the Employment Service1.4. Summary
2.1. Labour Force Survey/Quarterly National Household Survey2.1.1. Sample Design2.1.2. Data Collection2.1.3. Defining Unemployment in the QNHS2.1.4. Similarities/Differences between the LFS and the QNHS2.1.5. Comprehensive Picture of the Population2.1.6. Conclusion
2.2. The Live Register2.2.1. Underlying source and methodology2.2.2. Categories of persons included in the LR who are not unemployed2.2.3. Estimated of numbers involved in these categories2.2.4. Unemployed persons not included in the LR2.2.5. Lack of Comparability Over Time2.2.6. Conclusion

2.3. Job Seekers Registered with FAS 152.3.1. FAS' approach to the job-broking function 152.3.2. Implications of the FAS Job Seekers' Register 162.3.3. Relationship between the FAS Register and the LR 172.3.4. Conclusion 172.4. Conclusions on available Irish Information Sources 182.4.1. Preferred Measure of Unemployment 182.4.2. Potential Use of Other Information Sources 182.4.3. Identifying False Claims 18
SECTION 3: COMPOSITION OF THE LIVE REGISTER: ITS DEFICIENCIESAS A MEASURE OF UNEMPLOYMENT 20
3.1. The Live Register as a Count of Claimants 203.2. Young People and the Live Register 223.3. The Mechanics of the Live Register 223.4. Deficiencies in the LR as a Measure of Unemployment 243.5. Long-Run Trends in the Live Register 253.6. The Live Register and rr,O Unemployment Compared 263.7. The Effect of Administrative Changes on the LR 283.8. 'Announcement' Effects and Recent Policy Changes 313.9. Summary Conclusions 33Appendix A 3.1. 34
4. 1. The Management of the Live Register 354.2. National Policy Objectives 384.3. European Union Policy Objectives 404.4. The Impact of the New Measures 414.5. The Role ofthe Local Employment Service 454.6. Implications of the New Measures 47
Report Prepared By:Tansey Webster Stewart & Company Ltd

The purpose of this introduction is to provide a broad overview of the way in which the Irishlabour force, including both employment and unemployment, has evolved since 1993.
The data presented is drawn from annual Labour Force Surveys conducted by the CentralStatistics Office each April for the years 1993 through 1997 and subsequently from the QuarterlyNational Household Survey (QNHS).
2. ECONOMICALLY INACTIVE POPULATION OVER 15(i.e. not in the labour force)
From this configuration, it follows that the labour force consists of those who are at work andthose who are unemployed but available for, and actively seeking, work.
In categorising employment, unemployment and the thus the size of the labour force, widely-accepted International Labour Office (ILO) definitions are used throughout.
i) Those 'In Employment' are defined as persons who worked for an hour or more forpayment or profit in the week preceding the survey, including those working on familyfarms or in familybusinesses. Those who held a job but were not at work due to holidaysor illness in the period covered by the survey are treated as employed;
Report Prepared By:Tansey Webster Stewart & Company Ltd

ii) The 'Unemployed' are defined as those persons who, in the week before the survey, wereout of work, were available for work and had taken specific steps to find work in the fourweeks preceding the survey;
iii) The 'Labour Force' is derived by adding together those 'In Employment' and theViJ.emp!oyed~
iv) The 'Inactive Population', those over 15 years of age but not in the labour force, comprisesall other persons. Amongst others, this includes students, those engaged on home dutiesand retired people.
TABLE ATHE POPULATION AND THE IRISH LABOUR FORCE 1993-1998
Figures each April/Spring in 'OOOsof people
YEAR POPULATION POPULATION ECONOMICALLY LABOURTOTAL OVER 15 INACTIVE FORCE
1993 3,574 2,657 1,254 1,4031994 3,586 2,687 1,256 1,4321995 3,601 2,723 1,264 1,4591996 3,626 2,767 1,259 1,5081997 3,661 2,815 1,276 1,5391998* 3,705 2,870 1,249 1,621
Change 1993-98 +3.7% +8.0% -0.4% +15.5%
SOURCES: 'Population and Migration Estimates April 1998', Central Statistics Office, November1998, Table 1; 'Quarterly National Household Survey - First and Second Quarters 1998', CSO,November 1998, Table 9.
Table A shows that the national population increased by 3.7% to just over 3.7 million in the fiveyears to April 1998. However, reflecting the peaking of the birth rate in 1980 and the replacementof net emigration by net immigration during the 1990s, the population aged over 15 increased by8% between 1993 and 1998. Thus, over the past five years, the population over 15 years of agehas risen more than twice as fast as the national population.
Report Prepared By:Tansey Webster Stewart & Company Ltd

Moreover, all of the expansion in the population aged 15 and over flowed into the labour force.As Table A shows, and allowing for changes in survey methodology, the economically inactivepopulation was broadly the same size in absolute terms in 1998 as in 1993.
In consequence, the labour force itself - consisting of the employed and the unemployed -exhibited particularly rapid growth over the past five years. The numbers in the labour forceincreased by 218,000 over the five year span, representing a rise of 15.5%. Put another way, since1993, the Irish labour force has been expanding at an annual average rate in excess of3%.
Since the labour force consists of those at work and those unemployed who are seeking work,Table B shows the contribution of both elements to labour force growth.
s 0 people eac pnngYEAR LABOUR FORCE AT WORK UNEMPLOYED UNEMPLOYED
RATE%*
1993 1,403 1,183 220 15.71994 1,432 1,221 211 14.71995 1,459 1,282 177 12.21996 1,508 1,329 179 11.91997 1,539 1,380 159 10.3
1998** 1,621 1,495 127 7.8Change 1993-98 +15.5% +26.4% -42.3% -50.3%
TABLEBTHE COMPONENTS OF LABOUR FORCE GROWTH 1993 - 1998
In '000 f I h S .
** The switch to the QNHS in 1998 is estimated by the CSO to have raised the numbers employed and the numbersin the labour force by 20,000 due to changes in methodology. These changes are not assessed as having any impact onthe numbers unemployed.
As Table B indicates, the underlying increase in the numbers at work amounted to almost 300,000people in the five years to April 1998. This represents an employment gain of one-quarter in thespace of five years.
Conversely, the numbers unemployed declined by almost 100,000 - from 220,000 in 1993 to127,000 in 1998. Thus, total unemployment has fallen by more than two-fifths since 1993. Theunemployment rate - those out of work as a percentage of the labour force - has halved in the pastfive years.
Report Prepared By:Tansey Webster Stewart & Company Ltd

In broad terms, Ireland's labour market experience over the past five years can be summarisedbriefly as follows:
the total at work advanced by 312,000. With the labour force expanding by 218,000, this causedunemploYment to drop by almost 94,000.
Not all of the gains in emplOYmentrepresented full-time jobs. The distribution of emplOYmentadvances between full- and part-time jobs since 1993 is shown in Table C.
TABLECDISTRIBUTION OF EMPLOYMENT GAINS 1993 - 1998
In 'OOOsof people each Spring
YEAR TOTAL FULL TIME PART TIME PART TIME ASEMPLOYMENT EMPLOYMENT EMPLOYMENT OfoTOTAL
1993 1,183 1,056 127 10.81994 1,221 1,083 137 11.21995 1,282 1,128 154 12.01996 1,329 1,176 152 11.41997 1,380 1,210 170 12.3
1998* 1,495 1,245 250 16.7
NOTE: Data may not add to exact totals due to rounding.* Data influenced by switch from LFS to QNHS
In broad terms, of the 312,000 job gains registered between 1993 and 1998, additional full-timejobs accounted for 189,000 with part-time emplOYmentcontributing the remaining 123,000 jobscreated. By April 1998, one in every six of those at work was engaged in part-time emplOYment.
However, the vast majority of those working part-time are not looking for full-time jobs. Of the249,600 people found to be working part-time in the Spring 1998 QNHS, 239,400 were describedas "not under-employed". Only 10,300 were categorised as working part-time but under-employed.
Report Prepared By:Tansey Webster Stewart & Company Ltd

Many of those who are out of work have suffered prolonged spells of unemployment. The long-term unemployed are defined as those who have been out of work for a year or more but are stillactively seeking jobs. Unemployment by duration is shown in Table D for the years since 1993.
TABLEDTHE DURATION OF UNEMPLOYMENT IN IRELAND 1993-98 ('OOOs)
In 'OOOsof people each Spring
YEAR UNEMPLOYMENT OF WHICH LONG URATE LTURATETOTAL TERM UNEMPLOYMENT 0/0 0/0
1993 220.1 125.4 15.7 8.91994 211.0 128.2 14.7 9.01995 177.4 103.3 12.2 7.11996 179.0 103.3 11.9 6.91997 159.0 86.3 10.3 5.61998* 126.6 63.5 7.8 3.9
NOTES: URATE = all unemployed as a % of the labour forceLTU RATE = long-term unemployed as % of the labour force.* Switch from LFS to QNHS database
Total unemployment has declined from 220,100 in 1993 to 126,600 in 1998. Since 1994, thedecline in long-term unemployment (LTV) has been faster than the fall in total unemployment.From its peak at 128,200 in 1994, LTU had been reduced by more than one-half, to 63,500, by1998.
The rate of long-term unemployment rate in 1994, at 9.0%, was higher than the total 7.8%unemployment rate in 1998. By 1998, the long-term unemployment rate had been reduced to just3.9% of the national labour force.
As a result, long-term unemployment's share in total unemployment has declined from 57.0% in1993 to 50.2% ofa much-smaller national total by 1998.
Report Prepared By:Tansey Webster Stewart & Company Ltd

As emphasised earlier, the ILO definition of unemployment encompasses only those who are outof work and are actively seeking jobs. However, where long-term unemployment has beenextensive for prolonged periods, many amongst the LTV may have given up the search for jobs.Once unemployed individuals cease active job searches, they are no longer classified as membersof the labour force.
To gain a clearer picture of the composition of unemployment, Table E presents a more completeprofile both of the unemployed and those marginally attached to the labour force over the past fiveyears.
THE COMPOSITION OF IRISH UNEMPLOYMENT 1993 - 1998 ('OOOs)CATEGORY 1993 1994 1995 1996 1997 1998Short Term U(up to 1 year) 94.7 82.8 74.1 75.7 72.7 63.1
Long Term U(over 1 year) 125.4 128.2 103.3 103.3 86.3 63.5Total Unemployed 220.1 211.0 177.4 179.0 159.0 126.6DiscouragedWorkers * 20.3 19.1 16.4 13.6 16.9 14.1Passive JobSeekers* 11.9 10.6 11.1 6.6 8.3 5.6Total UnemployedAnd MarginallyAttached to theLabour Force 252.3 240.7 204.9 199.2 184.2 146.2
This wider interpretation of unemployment shows that the numbers out of work but available foremployment has fallen from over one-quarter of a million in 1993 to under 150,000 by 1998.Amongst those groups marginally attached to the labour force, the numbers of discouragedworkers have fallen by 30% while passive jobseekers have declined by more than half over thepast five years.
In summary, every component of unemployment - short-term, long-term, discouraged workers,passive jobseekers - has registered a significant decline over the past five years. Since the Springof 1998, the national level of unemployment has fallen further, to 7.0% by January 1999. At thislevel, it stands well below the average rate of unemployment throughout the European Union,which remains in double digits.
Report Prepared By:Tansey Webster Stewart & Company Ltd
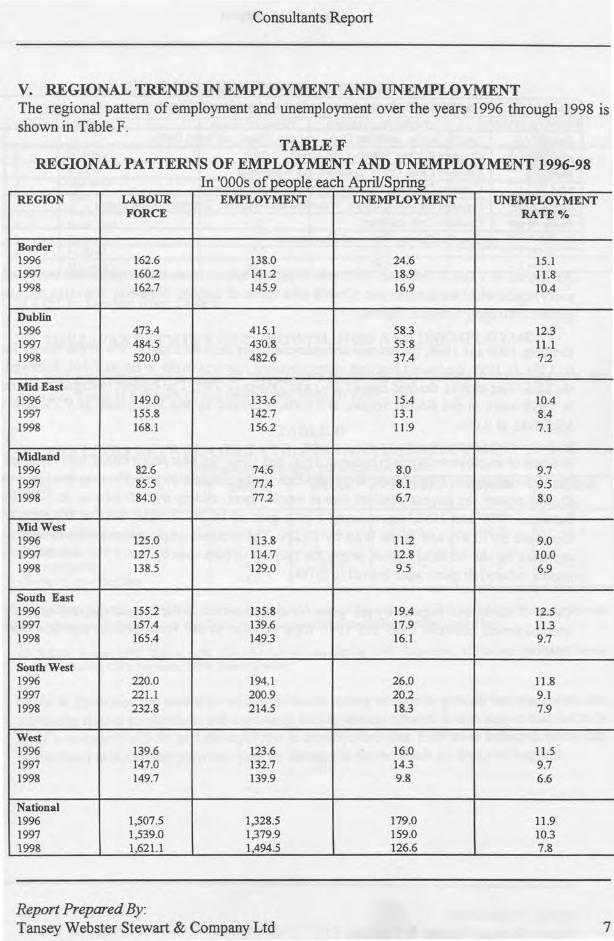
v. REGIONAL TRENDS IN EMPLOYMENT AND UNEMPLOYMENTThe regional pattern of employment and unemployment over the years 1996 through 1998 isshown in Table F.
TABLEFREGIONAL PATTERNS OF EMPLOYMENT AND UNEMPLOYMENT 1996-98
I '000 f 1 h A ·VS .n so· peopJe eac ~pn spnngREGION LABOUR EMPLOYMENT UNEMPLOYMENT UNEMPLOYMENT
FORCE RATE %
Border1996 162.6 138.0 24.6 15.11997 160.2 141.2 18.9 11.81998 162.7 145.9 16.9 10.4
Dublin1996 473.4 415.1 58.3 12.31997 484.5 430.8 53.8 ILl1998 520.0 482.6 37.4 7.2
Mid East1996 149.0 133.6 15.4 10.41997 155.8 142.7 13.1 8.41998 168.1 156.2 11.9 7.1
Midland1996 82.6 74.6 8.0 9.71997 85.5 77.4 8.1 9.51998 84.0 77.2 6.7 8.0
MidWest1996 125.0 113.8 11.2 9.01997 127.5 114.7 12.8 10.01998 138.5 129.0 9.5 6.9
South East1996 155.2 135.8 19.4 12.51997 157.4 139.6 17.9 11.31998 165.4 149.3 16.1 9.7
South West1996 220.0 194.1 26.0 11.81997 221.1 200.9 20.2 9.11998 232.8 214.5 18.3 7.9
West1996 139.6 123.6 . 16.0 11.51997 147.0 132.7 14.3 9.71998 149.7 139.9 9.8 6.6
National1996 1,507.5 1,328.5 179.0 11.91997 1,539.0 1,379.9 159.0 10.31998 1,621.1 1,494.5 126.6 7.8
Report Prepared By:Tansey Webster Stewart & Company Ltd

DublinMidEastMidlandMidWestSouth EastSouth WestWest
KEY TO REGIONS SHOWN IN TABLES F AND G:Counties Cavan, Donegal, Leitrim, Louth, Monaghan and Sligo
As shown in Table F, between 1996 and 1998, the labour force and employment increased inevery region while the numbers out of work also fell in all regions. However, the rates of changediffered markedly between regions.
Between 1996 and 1998, the national unemployment rate declined from 11.9% of the labour forceto 7.8%. In 1998, the lowest regional unemployment rate was in the West, at 6.6%, followed bythe Mid-West (6.9%), the Mid-East (7.1%) and Dublin (7.2%). The highest unemployment ratesin 1998 were in the Border region, at 10.4%, followed by the South-East at 9.7% and theMidlands, at 8.0%.
In terms of employment growth between 1996 and 1998, the best performance was reported bythe Mid-East region. Employment in the Mid-East region advanced by 16.9% over the two years.Dublin posted the largest absolute rise in em?loyment, adding 67,500 jobs to its workforcebetween 1996 and 1998, representing a jobs gain of 16.3%. Employment in the Mid-Westincreased by 13.4% and in the West by 13.2%. The weakest employment performances werereported by the Midland region, where the number of jobs rose by just 3.5%, and the Borderregion, where job gains were limited to 5.7%.
Table G ranks the regions by job gains. It also shows that the biggest percentage cuts inunemployment between 1996 and 1998 were effected in the West, Dublin and South WestregIOns.
Report Prepared By:Tansey Webster Stewart & Company Ltd

EMPLOYMENT GROWTH BY REGION 1996-98 (pERCENTAGE CHANGES)RANK REGION EMPLOYMENT UNEMPLOYMENT UNEMPLOYMENT
0/0 LEVEL RATE1 Mid East +16.9 -22.7 -3.3 points2 Dublin + 16.3 -35.8 -5.1 points3 Mid West +13.4 -15.2 -2.1 points4 West +13.2 -38.8 -4.9 points5 South West +10.3 -29.6 -3.9 points6 SouthEast +9.9 -17.0 -2.8 points7 Border +5.7 -31.3 -4.7 points8 Midland +3.5 -16.3 -1.7 points
National +7.5 -29.3 -4.1 points
The links between economic growth, employment expansion and changes in unemployment areshown in Table H for each of the years 1993 through 1998.
TABLERTHE LINKS BETWEEN GROWTH, JOBS AND UNEMPLOYMENT 1993-98
P h btw thercentage c anges e een e yearsITEM 1993/94 1994/95 1995/96 1996/97 1997/98
% % % % %Real GNP +7.8 +8.8 +6.9 +7.7 +8.5Employment Expansion +3.2 +5.0 +3.7 +3.7 +6.9Change in ll.-OUnemployment -4.1 -15.9 +0.9 -11.2 -20.4Change in Live Register -4.0 -1.6 +0.5 -8.9 -12.9
NOTES: Changes in economic growth and Live Register are for calendar years; changes iri ILO employment and unemploymentare for years to April. The change in the LR for 1997/98 is calculated as December 1998/December 1997.
SOURCES: Budget 1999, Budget 1998, Economic Review and Outlook 1997, Department of Finance; Quarterly NationalHousehold Survey, CSO, November 1998; Table 3.2 above.
Table H illustrates the extent to which sustained strong economic growth has translated intosubstantialrises in employment and continuing falls in unemployment. It also shows that both thesurge in economic activity and the rapid rise in employment after 1993 were reflected more fullyby the trend in ILO unemployment than by changes in the numbers on the Live Register.
Report Prepared By:Tansey Webster Stewart & Company Ltd

In the year to Spring 1998, the total numbers at work increased from 1.380 million to 1.495million.Allowing for changes in survey methodology, underlying employment rose by 95,000 or6.9% between 1997 and 1998.
Despite the scale of national job gains over the past five years, employment is forecast to advancefurther in the years to 2001. The 1999 Budget forecasts for economic growth and employmentexpansion are presented in Table 1.
TABLEJOFFICIAL ECONOMIC FORECASTS FOR THE YEARS TO 2001
YEAR REALGDP% REAL GNP % JOBS GROWTII* (OOOs)1998 +9.5 +8.5 +65,0001999 +6.7 +6.0 +45,0002000 +6.4 +5.7 +35,0002001 +5.8 +5.2 +27,000
While economic growth is expected to slow somewhat from the peaks achieved in recent years,it is still forecast to remain well above the long-run historic trend. In concert, the pace of netemployment expansion is forecast to moderate, though a further 172,000 jobs are expected to beadded to the Irish workforce by the Spring of 2002.
The employment forecasts for the year to Spring 1999 have been supported by FAS. In its 'LabourMarket Review', published in December, 1998, FAS anticipates that net additions to employmentwill amount to 65,000 in the twelve months to Spring, 1999. As a result, it expects a further fallof20,000 in the level of unemployment.
Large annual additions to the numbers at work and continuing falls in unemployment are causingthe labour market to tighten. Labour is becoming scarce. Such scarcity could threaten thesustainability of the Irish boom. If unrelieved, it would exert upward pressure on wages whileacting as a deterrent to further inflows of foreign direct investment. Reintegrating the unemployedinto the national workforce would relieve labour market pressures. Thus, reducing unemploymentis not only a central goal of social policy, but a necessary element of economic policy for thefuture.
Report Prepared By:Tansey Webster Stewart & Company Ltd

SECTION ONE: INTRODUCTION: INTERNATIONAL APPROACHES TO THEMEASUREMENT OF UNEMPLOYMENT.
Vutuallyall countries in the world make some attempt to measure the level of unemployment ona regular and systematic basis. Essentially, there are three main approaches to the collection andpresentation of unemployment information:
the survey approach, which may generate unemployment data based on national definitionsor on a set of agreed international definitions (the "ll.D basis")counts of the numbers claiming unemployment-related income supportcounts of registrants with the Public Employment Service (ES).
Across most of the developed world, the principal method used to measure unemployment is bymeans of labour force surveys.l These use broadly comparable questionnaires, and follow agreedprocedures (known as the "ILO definitions") for using the questionnaire returns to identifyrespondents as being employed, unemployed, or outside the labour force. Essentially, the ILOclassification treats a person as unemployed where s/he a) is not in work b) is available for workand c) has taken specific actions to seek work in the recent past.
Some countries also use the surveys to generate parallel estimates of employment andunemployment based on long-standing national definitions (in Ireland's case, the PrincipalEconomic Status or PES approach). However, use of the ILO definitions is now almost universalin international discussion and research on unemployment, and more and more countries are alsoadopting the ILO approach as their domestic "headline" unemployment measure. As discussedfurther below, official Irish figures also now follow the ILO approach. Distinctions between theILO and PES approaches are discussed in more detail in a later section of this report.
Because these surveys measure employment as well as unemployment, they provide a basis forcalculating the unemployment rate rather than simply reporting the absolute number of joblesspeople.iii The first Irish Labour Force Survey was in 1975, and there has been an annual LFS since1983. Since mid-1997, the relevant data are being collected on a quarterly basis as part of theCSO's new Quarterly National Household Survey (QNHS).
1 See Murphy and Walsh, p71iii Using Murphy and Walsh's notation, if E = numbers employed and U = numbers unemployed, theunemployment rate is 100 times U/(E+U).
Report Prepared By:Tansey Webster Stewart & Company Ltd

There has been a general trend internationally to move from annual to quarterly surveys; in somecountries, notably the USA and Sweden, a labour force survey is now carried out and publishedon a monthly basis.
A final point about labour force surveys is that they are carried out on a sample basis, interviewingonly a section of the population, which has been carefully chosen to be representative of thepopulation as a whole. Results are, however, usually "grossed-up", presenting estimates of theactual total numbers in the population who are employed and unemployed. The reliability of theseestimates depends on:
the size of the sample,how representative the sample really is, andthe reliability of the underlying total population estimates.
Most countries have some form of insurance system, under which people who have a sufficientrecord of employment and have made financial contributions to the system can receiveunemployment benefit for a specified period if they become unemployed. In addition, unemployedpeople who do not have entitlement to such benefits, or have exhausted their entitlement, areusually eligible to receive welfare payments under an unemployment assistance scheme. Somecountries produce data at regular intervals on the numbers of people receiving such benefit orassistance. The Irish monthly Live Register figures are generated in this way.
Payment-based counts are rarely used in international comparisons. The principal reason is thatthey reflect wide differences between the systems of social protection in different countries.Duration of entitlement to unemployment benefit varies widely, for example. Moreover, not allcountries have a general social assistance payment on which those who have exhaustedunemployment can fall back (e.g. the USA). Where social assistance exists it may be severelylimited (e.g. in France it is not payable to persons under 25 years unless they have had some workexperience). Unemployment compensation mayor may not be paid to part-time or casual workersfor days not worked.
As a result of these differences, payment-based counts greatly exceed unemployment as measuredin national surveys in some countries, and fall well below the survey measure in others.
Report Prepared By:Tansey Webster Stewart & Company Ltd

Most developed countries have some kind of Public Employment Service (ES) which acts as abroker in the jobs market, puttingjob seekers and potential employers in contact with each other.iv
FAs is the main body responsible for this function in Ireland.v The way the ES approaches its taskvaries widely across countries. In some cases an attempt is made to cover vacancies and job-seekers at all occupational levels, whereas elsewhere the focus is on semi-skilled and unskilledvacancies and on the unemployed to the exclusion of job-changers. Some public employmentservices systematically match all vacancies against registered job seekers, while others use apredominantly self-service approach (simply displaying details of notified vacancies in localoffices). Use of the service mayor may not be compulsory for both employers and forunemployed welfare recipients.
Data are usually available on the number of job seekers on the ES register. The quality andrelevance of these data depends largely on which of the above approaches characterises theoperation of the ES concerned. Data from this source are rarely used in international comparisonsof unemployment.
The principal ways of approaching the measurement of unemployment are by means of labourforce surveys, counts of unemployment payment recipients, or counts of job seekers registeredwith the public employment service. In general, international experience has identified the surveyapproach as being the best of these and most countries now compile their unemployment data onthis basis. The preferred definition of unemployment within these surveys is that based on theagreed ILO classification - i.e. a person is unemployed when s/he is not in work, is available forwork, and is actively seeking work.
iv It mayor may not be integrated with the agency responsible for administering unemployment payments.v Job-broking services are also provided through the Local Employment Service (controlled by AreaPartnerships) in some 17 partnership areas throughout the country. Specialist agencies (e.g. those dealingwith people with disabilities) also engage in placement work.
Report Prepared By:TanseyWebster Stewart & Company Ltd

As already noted, the annual LFS carried out annually since 1983 was replaced, as and from mid1997, by the new QNHS. What follows is a description of the main features of the QNHS - interms of survey design, sampling approach, data analysis etc. Insofar as unemployment isconcerned, the main elements of the approach are similar as between the two surveys. Wheredifferences do exist, these will be noted at the relevant point in the text.
The QNHS covers 39,000 households each quarter-year. This represents about 3.3% of allhouseholds in the State. These households are chosen as follows:
The State is first broken down into about 12,000 "blocks", with the typical block containing 75dwellings. These blocks are divided into eight strata, classified by population density (e.g. largeurban area, small urban area, rural area etc.)
From this total a first-stage sample of2,600 blocks is chosen. This sample of blocks is fixed fora five-year period. Sampling is carried out at county level, and is designed to give proportionalrepresentation to each of the population-density strata within each county.
Within each sample block, 15 households are surveyed each quarter, giving a total quarterlysample of39,000 households, containing over 130,000 people.
In "grossing-up" to provide national estimates of the survey results, the sample returns areweighted to agree with independent national population estimates broken down by age, sex andregion. These estimates have been compiled and published annually by CSO for some years, andare now being updated on a quarterly basis.
These procedures mean that the QNHS performs well on each of the data-reliability criteriaidentified in Section 1.1 above. The QNHS sample is large,vi and is selected on a random basiswithin each of a large number of "strata" as described above. Even with these advantages, reliable
vi Typically, the sample for labour force surveys in other Ell member states covers about 0.5% of households.The Irish sample, as noted in the text, contains 3.3% of all households
Report Prepared By:Tansey Webster Stewart & Company Ltd

estimates of employment and unemployment are available only down to regional level. Below this(e.g. for counties or smaller areas), survey-type data are available only from the less-frequentCensus of Population. Regarding the reliability of the estimates ofthe total population, Irelandis unusual and fortunate in that a full census is carried out every five years as opposed to theinternational norm of every ten years. This reduces the possibility of the population estimates forinter-censal years developing cumulative errors.w
Information is collected continuously, with 3,000 households being surveyed each weekthroughout the quarter. All results are presented as relating to the typical situation of thepopulation over the relevant quarter.
Households are asked to participate in the survey for five successive quarters, then replaced byother households in the same block. There is thus an overlap of 80% between the samples forconsecutive quarters, and a 20% overlap between the same quarter in consecutive years.
Interviewers collect the information on laptop computers, using computer-assisted personalinterview (CAPI) software. The main questions of relevance to labour force issues relate to:
Whether the person worked in the week prior to the survey, together with questions on thenature of this work (employee/self-employed, hours worked, occupation, employer's businessif an employee, etc.)Whether the person is looking for work, and has taken specific job-search actions in thepreceding four weeksWhether the person is available to take up work within the next two weeksWhether the person, even if not seeking work, is interested in working.
In addition, respondents are asked one question on how they themselves would describe their"principal economic status" in the week prior to the survey.
vii A frequent full census is particularly significant for Ireland, because migration (which is not generallysubject to administrative regulation because it is intra-EU) has a major impact on population trends. Thispoint was illustrated by the experience of the 1970s, when the 1976 census was cancelled. Although LabourForce surveys were carried out in 1975 and 1977, it transpired that the employment estimates they producedwere seriously understated because the underlying population estimates were wrong. The availability of the1979 census results indicated that the population, and employment, had been growing much more quickly, inthe mid-1970s, than had been thought.
Report Prepared By:Tansey Webster Stewart & Company Ltd

People are assigned to different "ILO" labour force categories based on their responses to thequestions described in the preceding section.
Persons in employment are those who, in the preceding week, worked for one hour or more forpayment or profit (including work on the family farm) and all persons who had a job but wereabsent due to illness or holiday.
Unemployed persons are those who, in the preceding week, were without work, were availablefor work, and had taken specific action, at some stage in the preceding four weeks, to look forwork.
The labour force (sometimes described as the "active population") comprises persons employedplus unemployed. The unemployment rate is the number of unemployed, shown as a percentageof the labour force.
The principal economic status question in the QNHS asks respondents to describe their "usualsituation with regard to employment". They must assign themselves to one of the followingresponse categories:
At workUnemployed after loss of a job or after a period out of the labour forceUnemployed (seeking first regular job)StudentEngaged on home dutiesUnable to work due to permanent disability or illnessRetiredOther
Again, the labour force comprises those employed and unemployed (i.e. the first three categories)and the remaining categories are the inactive population.
Report Prepared By:Tansey Webster Stewart & Company Ltd

Employment and unemployment data from the LFS series that commenced in 1975 were generallypresented on the PES basis. However the questions necessary for compiling ILO-type data havebeen included in the LFS questionnaire since 1983, and ILa results have been included, assupplementary information, in the published LFS results since 1988. From this year, coincidingwith the move from LFS to QNHS, the ILa data have been given primacy in the published results.The changeover followed on from a recommendation by the National Economic and SocialForum. This change has been made for several reasons.
A strength of the ILa approach is that it builds up a profile of the entire adult population on thebasis offactual questions about work, availabilityfor work, and job-seeking activities. It thereforeallows the production of more detailed additional information on each of the three main labourforce categories. Thus, for example, among those in employment it is possible to identifY full-timeand part-time workers separately. Part-time workers, in turn, can be broken down into those whoare under-employed (i.e. seeking full-time work or additional part-time hours) and those who arenot. The unemployed can be broken down into those who are seeking full-time jobs and thosewho are only seeking, and available for, part-time employment. The ILa approach also providesinformation on the duration of unemployment. Finally, additional information is also provided onthe inactive population, which can be used to give an indication of the potential supply of workersfrom outside the existing labour force. For example, it is possible to identifY "discouragedworkers" - those who say they want work but say they are not seeking it because they believeno jobs are available for someone with their skills. Equally, it is possible to identifY people whosay they want work, but are currently unavailable because they have to complete their studies orbecause they have family caring responsibilities.
The ILO definitions thus provide relatively sophisticated information on the full-time/part-timeavailabilityof those currently in the workforce, (both employed and unemployed) and on potentialsupply from people currently outside the workforce who might be available for work under certainconditions. This kind of information can be extremely important for economic planning purposes.
The strength of the PES data is their continuity, with a time-series available since 1975. The PEScategories are also widely perceived as meaningful.However, a number of weaknesses in the PESapproach have become apparent over time. One is the fact that the PES data are not readilycomparable with employment and unemployment statistics from other countries. A second is thatthey are based on subjective self-classificationby respondents, rather than on responses to factualquestions as with the ILO data. Finally, the PES approach automatically consigns groups such asstudents, the retired, and housewives to "inactivity". It therefore fails to capture the growingcomplexityof modem labour markets where many people, who would see their "principal" statusas being in one of these groups, are available for or already engaged in part-time work.

The positive "refinement" impact on part-time employment is considered to have been greaterthan 20,000. The change is considered to have impacted negatively on reported full-timeemployment. Further analysis of the size of this impact will have to await QNHS data forsubsequent quarters.
In the context of the present report, the most important point of note in this discussion is the CSOassessment that the changes have not affected the estimates of actual numbers unemployed.However, because the overall labour force estimate is affected, this has some small effect on thereported unemployment rate. This is given as 7.8% for Spring 1998 in the published QNHS, butwould be 7.9% if the labour force were corrected for the CSO's estimate ofthe discontinuity inthe measurement of the labour force.
One important feature shared by the LFS and the QNHS is that they provided for the uniqueassignment of every individual in the sample (and through them the population they represent) toone or other ofthe labour force categories used in the survey. This is particularly clear in the ILOapproach. Each respondent is unambiguously employed, unemployed or inactive, depending onthe answers s/he provides to the questions on work, availability and job search.ix This may seemstraightforward, but carries important advantages over data from administrative sources thatcover only part of the population, such as the Live Register. The survey approach thus generatesestimates of employment and unemployment that are internally consistent. This allows meaningfulcalculation of the unemployment rate, and of other important ratios such as the labour forceparticipation rate. Because additional data on age, education, marital status etc. are also collectedin respect of each respondent, these rates can be calculated for a wide variety of sub-groups ofthe population. The surveys therefore provide vital information on the structure of employmentand unemployment. We know, for example, that the unemployment rate is particularly high amongunqualified youth, but very low among middle-aged graduates. We can examine whether labour-force participation is lower among mothers of pre-school children than among whose children areall of school-going age.
A second strength of the survey approach is that it establishes clearly the situation of eachrespondent at a given moment in time - the data is collected instantaneously. Again, this hasimportant advantages over data from administrative sources. In the latter, there can be significantlags between the actual occurrence of an event and its being recorded. People may be retained inan administrative count ot: for example, claimants for unemployment benefits, for some time aftertheir underlying situation has changed.
ix The PES approach is more ambiguous, as it refers to "principalH status rather than to the individual'ssituation at a particular time. Moreover it forces respondents to select one from a pre-set range ofalternatives (e.g. a housewife who also works part-time must decide whether to classify herself aseither "at work" or "engaged in home duties". Two respondents whose objective situations were identical mightclassify themselves quite differently under this approach (as might the same individual at different times).
Report Prepared By:Tansey Webster Stewart & Company Ltd

The LFS/QNHS series, particularly with the move to using the ll..O definitions, producesmeaningful estimates of underlying employment, unemployment and inactivity. These areconsistent over time, as well as being internationally comparable. The former series based on thePES definitions, although no longer given primacy in the published results, continues to beproduced and can provide useful supplementary information.
While some discontinuity is involved in the move from the LFS to QNHS, the impact is small andhas no affect on the comparability of the estimates of the numbers unemployed over time. Inaddition, the move to the QNHS will improve the timeliness and frequency of the survey results.
Perhaps the single most important point that needs to be made about the Live Register is carriedon the front page of all relevant CSO statistical releases:
The reasons for this statement will become clear in the following description of the LR and itscomponents.
The Live Register is a monthly administrative count of three categories of persons who sign onregularly at offices of the Department of Social Community and Family Affairs (DSCFA):
those claiming Unemployment Benefit (VB), excluding persons working under systematicshort-time arrangements introduced by their employer for economic reasons, who claim foronly part of each week
those applying for Unemployment Assistance (VA) excluding small-holders and self-employedpersons claiming on grounds oflow income from their tradethose who, while not having an entitlement to either of these payments, sign on for "creditedcontributions" or "Credits" which maintain the continuity of their social insurance contributionrecord for pension purposes.
Report Prepared By:Tansey Webster Stewart & Company Ltd
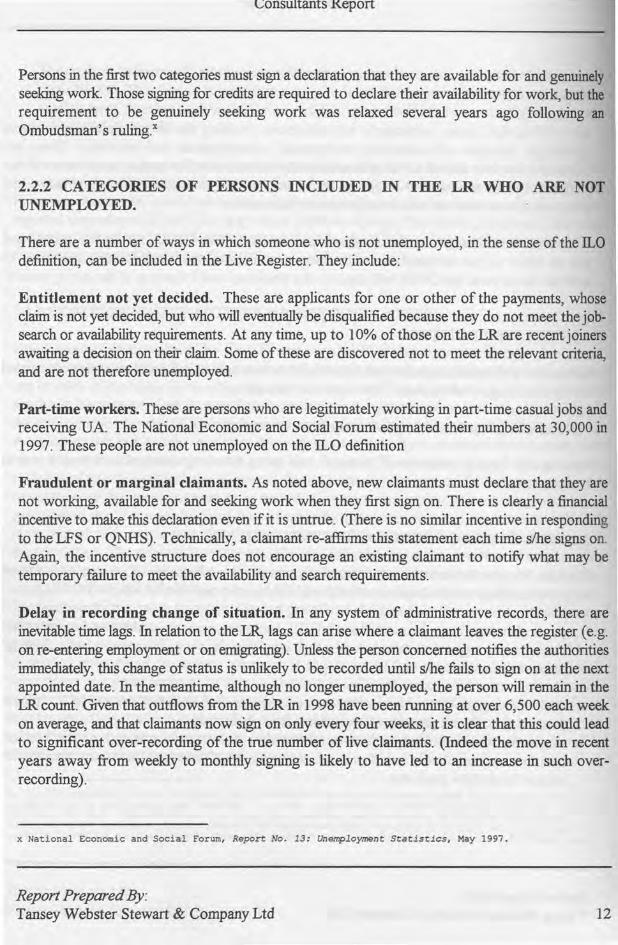
Persons in the first two categories must sign a declaration that they are available for and genuinelyseeking work. Those signing for credits are required to declare their availability for work, but therequirement to be genuinely seeking work was relaxed several years ago following anOmbudsman's ruling.x
2.2.2 CATEGORIES OF PERSONS INCLUDED IN THE LR WHO ARE NOTUNEMPLOYED.
There are a number of ways in which someone who is not unemployed, in the sense of the !LOdefinition, can be included in the Live Register. They include:
Entitlement not yet decided. These are applicants for one or other of the payments, whoseclaim is not yet decided, but who will eventuallybe disqualified because they do not meet the job-search or availabilityrequirements. At any time, up to 10% of those on the LR are recent joinersawaiting a decision on their claim. Some of these are discovered not to meet the relevant criteria,and are not therefore unemployed.
Part-time workers. These are persons who are legitimately working in part-time casual jobs andreceiving UA. The National Economic and Social Forum estimated their numbers at 30,000 in1997. These people are not unemployed on the ~O definition
Fraudulent or marginal claimants. As noted above, new claimants must declare that they arenot working, available for and seeking work when they first sign on. There is clearly a financialincentive to make this declaration even if it is untrue. (There is no similar incentive in respondingto the LFS or QNHS). Technically, a claimant re-affirms this statement each time s/he signs on.Again, the incentive structure does not encourage an existing claimant to notify what may betemporary failure to meet the availability and search requirements.
Delay in recording change of situation. In any system of administrative records, there areinevitable time lags. In relation to the LR, lags can arise where a claimant leaves the register (e.g.on re-entering employment or on emigrating). Unless the person concerned notifies the authoritiesimmediately, this change of status is unlikely to be recorded until s/he fails to sign on at the nextappointed date. In the meantime, although no longer unemployed, the person will remain in theLR count. Given that outflows from the LR in 1998 have been running at over 6,500 each weekon average, and that claimants now sign on only every four weeks, it is clear that this could leadto significant over-recording of the true number of live claimants. (Indeed the move in recentyears away from weekly to monthly signing is likely to have led to an increase in such over-recording).
Report Prepared By:Tansey Webster Stewart & Company Ltd

Credits. Given the relaxation of the job-search rule for those claiming credits, it is likely that asignificant proportion of this group would not now be classified as unemployed under theinternational definitions.
Administrative records themselves can provide little guidance on the size of these groups. Part-time worker claimants, of course, can be identified, as evidenced by the NESF estimate quotedabove (although there are no regular published data showing changes in their number over time).However, it is impossible to determine what proportion of those on credits, or those awaitingdetermination of their entitlement, currently fail to meet the job-search and availability criteria forunemployment. Statistics on currently open fraudulent claims are by definition unavailable, sincefraud continues only if undetected by the authorities.
A once-off study carried out by the CSO in 1996xi did however produce an estimate of the overallnumbers on the LR who do not meet the standard unemployment criteria. This involved theinclusion, in the annual LFS for that year, of a sample of those on the LR at the relevant time.These people's responses to the LFS questionnaire were specially tabulated and reported onseparately in the September 1996 report. The results are set out in Table 1 overleaf, with data onthe overall population of working age shown for comparison.
According to the study, slightly fewer than 50% of those on the LR at that time actually met theILO unemployment criteria. Just over 20% were working, and half of these were working full-time. The remaining 29% were "inactive". A minority of this last group had a marginal labourforce attachment (mainly "discouraged workers"), but the majority had not even a marginalattachment.
xi Unemployment Statistics: Study of the Differences between the Labour Force Survey (LFS) Estimates ofUnemployment and the Live Register. eso, September 1996.
Report Prepared By:Tansey Webster Stewart & Company Ltd

TABLE 1: ILO STATUS OF THE WORKING-AGE POPULATION, 1996
All persons aged15-64 ThoseonLR
('000) (%) ('000) (%)
Working Total 1295.5 55.1% 60.0 21.4%
Full-time 1147.6 48.8% 32.0 11.4%Part-time not underemployed 124.4 5.3% 20.5 7.3%Part-time underemployed 23.5 1.0% 7.5 2.7%
Unemployed Total 177.3 7.5% 138.7 49.5%-seeking Full-time 150.0 6.4% #NA #NA-seeking Part-time 27.5 1.2% #NA #NA
Labour force 1472.8 62.6% 198.7 71.0%
Inactive Total 879.7 37.4% 81.3 29.0%Marginally attached to lIlbour 19.3 0.8% 12.6 4.5%Not attached 860.4 36.6% 68.7 24.5%
Total DODulation 2352.8 100.0% 280.0 100.0%
For Live Registrants, Monthly Live Register Statement April 1996; registrants are distributed across categoriesbased on the sample results in the September 1996 report.
The table gives some indication of the numbers in at least some of the non-unemployed categorieson the LR, identified at 2.2.2 above. The number of Live Registrants reported as working part-time, for example, accords reasonably closely with the NESF estimate of this group based onadministrative sources. Equally, the full CSO report noted that about a quarter of those shownas working full-time (or about 3% of the LR overall) had only entered employment in the lastmonth. These are probably cases where there has been an administrative delay in recording theirchange of status.
However, there was a further number of full-time workers (8% of the LR) who had been in theirjobs for over one month. In addition, only part of the number reported as being "unattached tothe labour force" can be accounted for by those signing for credits. About three-quarters of thisinactive group (accounting for almost 20% of the LR overall) indicated that they were neitherlookingfor nor wanted work. The size of these ''unaccounted-for'' groups suggests that, by 1996,there was a substantial body of people on the LR who were failingto meet the stated requirementsfor receipt of unemployment payments.
Report Prepared By:Tansey Webster Stewart & Company Ltd

For many years prior to the recent tightening of the labour market, public comment tended toconcentrate not so much on those on the LR who were not strictly unemployed but rather on thepossible numbers of "real" unemployed who were not included. The table also sheds some lighton this issue. The 1996 LFS identified 177,000 people as unemployed on the ILO definitions. Ofthese, 27,000 were seeking part-time work only, and would not therefore be eligible forunemployment payments.xii Unemployed persons seeking full-time work numbered 150,000, andthe results of the special report indicate that 139,000 of these were actually included in the LR.Although exact figures are unavailable, it is likely that three groups account for the bulk of thisdifference:
Several thousand of the ILO unemployed are aged under 18 years and would not thereforebe eligible for unemployment paymentsxiii
The ILO figure would include persons on FAs and other short-term training courses forunemployed people, if they met the availability and job search conditions. However, thesepeople receive FAs training allowances rather than unemployment payments, and are thus notincluded in the LR. xiv
DSCF A provides a payment known as the Pre-retirement Allowance, separate fromUnemployment Benefit and Assistance, to almost 12,000 workers approaching retirement agewho have been unemployed for some time. The stated job-search requirements for thispayment are less strict than for UA and VB, and recipients are not included in the LR. It ishowever probable that at least some of those involved continue to meet the ILO criteria andwould therefore be identified as unemployed in the LFS.
On balance, therefore, it appears that there were few if any fully unemployed persons aged over18 years in 1996 who were not in fact included in the LR at that time.
The foregoing discussion sheds light on the weaknesses of the LR as a measure of the level ofunemployment at a particular time. But a measure which is inaccurate in this way couldnonetheless be useful as a trend indicator provided that it met certain conditions:
The measure itself would need to be compiled consistently over time (so that it was fairlycomparable between time-periods)
xii Most of this group were housewives or full-time students.xiii There were about 16,000 persons aged under 20 unemployed in the 1996 LFS. While no further break-downis published, perhaps one-third of these would have been aged under 18 years.xiv The number of participants on relevant FAS courses in April 1996 was approximately 12,000. The numberof these who were recorded as unemployed on the 1LO definition in the 1996 LFS is not known.
Report Prepared By:Tansey Webster Stewart & Company Ltd

It would also need to show a consistent relationship, over time, with the variable it was beingused to track(in this case, underlying unemployment)
Unfortunately, the LR does not meet these conditions. As discussed in Section 3, the regime ofsocial welfare payments that underlies the LR has been subject to a large number of changes overthe years. Many of these have had a significant effect on the numbers and categories of peoplewho are included in the LR count.
For example, it is noted above that current evidence suggests that the vast majority of unemployedpeople are now included in the LR. But this was not always the case - the review of past trendsin Section 3 indicates that large numbers of such people were excluded from the LR up to theearly 1980s. Some of the changes over time can be allowed for, but many cannot.
Nor is this a problem which arises only over the long term; the trend in the LR has failed to tracktrends in underlying unemployment even over relatively short periods. This is illustrated by therecent experience of the CSO in using the LR as a trend indicator over the months betweensuccessive annual Labour Force Surveys. Each month, the LR statement contains, apart from theraw LR figures, a table showing the "Standardised Unemployment Rate" (SUR). The SUR for thecurrent month is calculated by taking the underlying (ILO) rate of unemployment from the mostrecent available LFS, and assuming that, since the survey, underlying unemployment has movedin line with the trend in the LR. However, this estimation system has not performed well in recentyears. For example, using the (known) LFS unemployment rate of 10.3% in April 1997 and theLR trend in the subsequent twelve months, the CSO estimated the SUR for April 1998 at 9.4%.In fact, the results ofthe Spring 1998 QNHS indicate that unemployment had actually fallen to7.8% by that date.
The discussion in this section lends overwhelming support to the CSO view quoted at the outset.The Live Register statistics provide neither an accurate measure of the current level ofunemployment nor a reliable indicator of the trend in unemployment over time. The high profilethese statistics achieve, mainly due to their frequency of publication, makes little contribution topublic and political debate on the issues surrounding unemployment; indeed it lends confusion tothat debate. It is to be hoped that this profile will recede as more regular survey-basedunemployment data become available from the ongoing QNHS.
To say that the LR is an unreliable statistical source is not to deny that information generatedthrough the social welfare system is entirely without worth. One important feature of the registeris that it is made up of individuals who are identifiable by the public authorities and come intoregular contact with those authorities. This is clearly not the case with data from surveys, basedas they are on samples and subject to confidentiality. The register, which is increasingly
Report Prepared By:Tansey Webster Stewart & Company Ltd

computerised, can thus be used to target policy interventions and supports directly at knownindividuals. And, while it clearly includes many additional people who are not unemployed, thediscussion above indicates that the LR also now contains the vast majority of those who are in factunemployed. It should therefore be possible, having used survey data to identify groups orcategories of unemployed people encountering severe labour-market problems, to use the LR asa an operational means of targeting assistance on individuals within those groups or categories.There may also be a sound public policy case for directing interventions at some individualsamong the non-unemployed on the LR (e.g. the inactive, part-time workers), particularly at a timewhen labour supply is emerging as a potential constraint on economic growth.These potential uses of the underlying information in the LR will be addressed further in theoverall conclusions and recommendations of this report.
As noted in Section 1, public employment services in different countries range across a spectrumin terms of how they approach their job-broking function. They vary in terms of:
Occupational coverage of vacanciesDegree of integration with the benefit system,Whether they concentrate solely on benefit recipients among the unemployed, or also try toserve other groups such as job-changersWhether they try to fill vacancies primarily by matching against their existing register of job-seekers, or by the "self-service" approach.
Against these criteria, the main features of the current operations of the FAs Employment Servicecan be summarised as follows:
Coverage: Although there is no specific policy on the issue, the activities of the FAs ES tend tobe defacto concentrated at the lower-to-middle end of the employment market. Up to the end ofNovember 1998, approximately 61,500 vacancies were notified to the ES. Of these, 4% wereprofessional and managerial, 17% were secretarial/clerical, 20% were skilled manual, and 58%were semi-skilled and unskilled manual.
Integration with the benefit system. Unlike the situation in the UK, for example, the FAs EShas no involvement in the administration and payment of unemployment benefit or assistance.Nor, in general, is registration with FAs a condition for receipt of unemployment payments.However, practical integration of systems between FAs and the Department of Social Communityand Family Affairs (DSCF A) has developed significantly in recent years, particularly throughsharing of computerised data. The FASIDSCF A relationship is now entering a further phase ofdevelopment under the National Employment Action Plan (see below).
Report Prepared By:Tansey Webster Stewart & Company Ltd
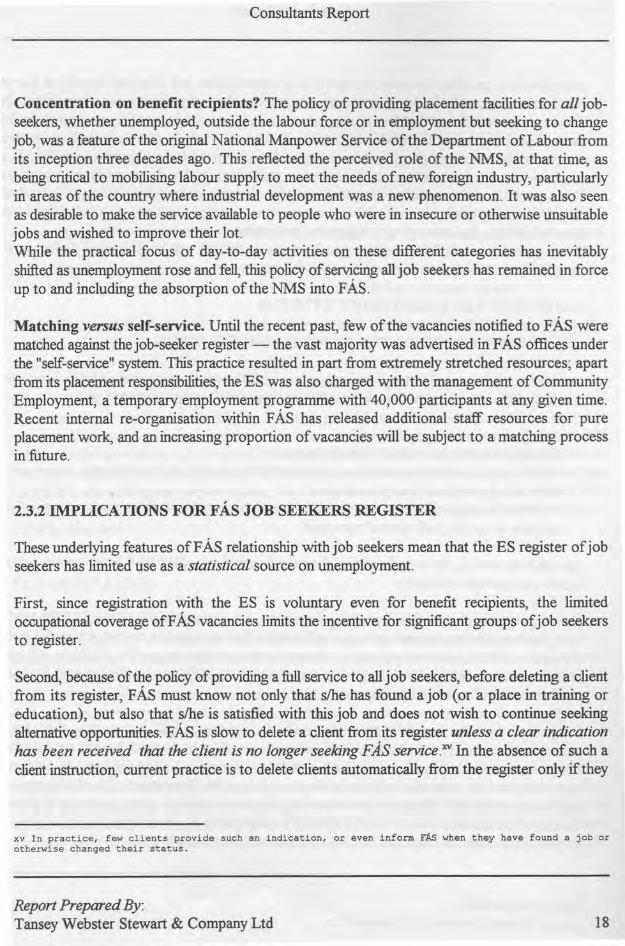
Concentration on benefit recipients? The policy of providing placement facilities for all job-seekers, whether unemployed, outside the labour force or in employment but seeking to changejob, was a feature of the original National Manpower Service of the Department of Labour fromits inception three decades ago. This reflected the perceived role of the NMS, at that time, asbeing critical to mobilising labour supply to meet the needs of new foreign industry, particularlyin areas of the country where industrial development was a new phenomenon. It was also seenas desirable to make the service available to people who were in insecure or otherwise unsuitablejobs and wished to improve their lot.While the practical focus of day-to-day activities on these different categories has inevitablyshifted as unemployment rose and fell, this policy of servicing all job seekers has remained in forceup to and including the absorption of the NMS into FAs.
Matching versus self-service. Until the recent past, few of the vacancies notified to FAs werematched against the job-seeker register - the vast majority was advertised in FAs offices underthe "self-service" system. This practice resulted in part from extremely stretched resources; apartfrom its placement responsibilities, the ES was also charged with the management of CommunityEmployment, a temporary employment programme with 40,000 participants at any given time.Recent internal re-organisation within FAs has released additional staff resources for pureplacement work, and an increasing proportion of vacancies will be subject to a matching processin future.
These underlying features ofF As relationship with job seekers mean that the ES register of jobseekers has limited use as a statistical source on unemployment.
First, since registration with the ES is voluntary even for benefit reCIpIents, the limitedoccupational coverage ofF As vacancies limits the incentive for significant groups of job seekersto register.
Second, because of the policy of providing a full service to all job seekers, before deleting a clientfrom its register, FAs must know not only that s/he has found a job (or a place in training oreducation), but also that s/he is satisfied with this job and does not wish to continue seekingalternative opportunities. FAs is slow to delete a client from its register unless a clear indicationhas been received that the client is no longer seeking FAs service. xv In the absence of such aclient instruction, current practice is to delete clients automatically from the register only if they
xv In practice, few clients provide such an indication, or even inform rAs when they have found a job orotherwise changed their status.
Report Prepared By:Tansey Webster Stewart & Company Ltd

have had no contact with the ES over a period of six monthsand
are known not to be on the DSCF A LR.
Inevitably, therefore, much of the information on current employment status of FAs clients is outof date.
The first of these factors would tend to depress the FAs register while the second would tend toinflate it, as compared with any measure of underlying unemployment. In practice, the secondeffect appears greater, and the numbers registered with FAs are in fact much greater than eitherthe LR or the numbers of unemployed as identifiedby surveys. At the end of November 1998, forexample, the number of people who have registered with FAs and are currently reported as"active" was 285,000. xvi The database contains a wealth oflabour-market relevant informationon these individuals - age, education, work history, preferred occupation, willingness to take upwork on a shift or part-time basis, etc.
As part of the developing relationship between the two organisations, each week FAs receivesfrom DSCFA a computer file containing limited details of individuals who are on the LR. Theintention is that people on the LR, even where they have not registered with FAs, can be matchedagainst, and informed of, opportunities arising on programmes such as Community Employmentwhich are specifically targeted at those on the LR. The file does not cover the complete LR. Itexcludes those Live Registrants who are casual or part-time workers. It also relates only toregistrants at DSCFA offices that are computerised (although the number excluded in this wayis now small and continues to decline). At end-November, the number of people on the file wasjust under 177,000, out of a total LR of 207,000 at that date. The existence of this file allowssome cross-comparison between the FAs active register and the LR.
From a Live Register perspective, this comparison indicates that 93,000 (53%) of the 177,000people on the selective LR file are also registered fully with FAs.From the perspective of the FAs register of285,000:
93,000 (33%) are also on the LR file104,000 (36%) have been on the LR file at some stage but are no longer on itthe remaining 88,000 (31%) are not recorded as ever having been on the LR file.xvii
xvi This compares with the November 1998 LR figure of 207,000 and the most recent QNHS figure (Spring 1998)of 127,000.xvii A proportion of this last group may be signing on, or have signed on the LR at some stage, but in oneof the categories excluded from the file supplied to FAS - i.e. as part-time workers or at non-computerisedDSCFA offices.
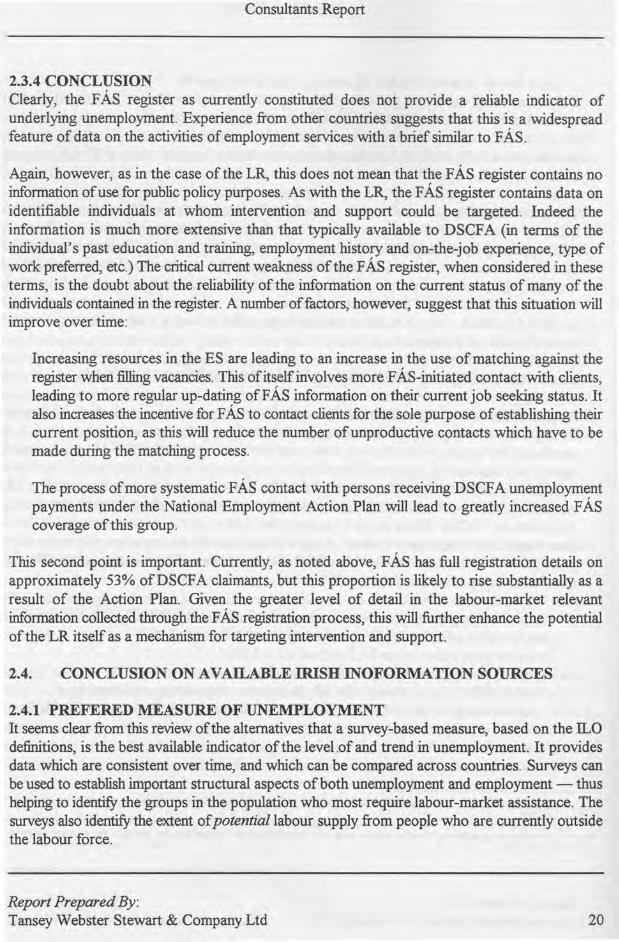
2.3.4 CONCLUSIONClearly, the FAs register as currently constituted does not provide a reliable indicator ofunderlying unemployment. Experience from other countries suggests that this is a widespreadfeature of data on the activities of employment services with a brief similar to FAs.
Again, however, as in the case of the LR, this does not mean that the FAs register contains noinformation of use for public policy purposes. As with the LR, the FAs register contains data onidentifiable individuals at whom intervention and support could be targeted. Indeed theinformation is much more extensive than that typically available to DSCF A (in terms of theindividual's past education and training, employment history and on-the-job experience, type ofwork preferred, etc.) The critical current weakness of the FAs register, when considered in theseterms, is the doubt about the reliability of the information on the current status of many of theindividuals contained in the register. A number offactors, however, suggest that this situation willimprove over time:
Increasing resources in the ES are leading to an increase in the use of matching against theregister when fillingvacancies. This of itself involves more FAS-initiated contact with clients,leading to more regular up-dating of FAs information on their current job seeking status. Italso increases the incentive for FAs to contact clients for the sole purpose of establishing theircurrent position, as this will reduce the number of unproductive contacts which have to bemade during the matching process.
The process of more systematic FAs contact with persons receiving DSCF A unemploymentpayments under the National Employment Action Plan will lead to greatly increased FAscoverage of this group.
This second point is important. Currently, as noted above, FAs has full registration details onapproximately 53% ofDSCFA claimants, but this proportion is likely to rise substantially as aresult of the Action Plan. Given the greater level of detail in the labour-market relevantinformation collected through the FAs registration process, this will further enhance the potentialof the LR itself as a mechanism for targeting intervention and support.
2.4.1 PREFERED MEASURE OF UNEMPLOYMENTIt seems clear from this review of the alternatives that a survey-based measure, based on the ILOdefinitions, is the best available indicator of the level.of and trend in unemployment. It providesdata which are consistent over time, and which can be compared across countries. Surveys canbe used to establish important structural aspects of both unemployment and employment - thushelping to identifYthe groups in the population who most require labour-market assistance. Thesurveys also identify the extent of potentia/labour supply from people who are currently outsidethe labour force.
Report Prepared By:Tansey Webster Stewart & Company Ltd

In the light of this, the decision, commencing with the first publication of the QNHS, to presentthe !LO data as the primary measure of unemployment, seems entirely appropriate. It is alsowelcome that the QNHS publication includes summary measures of potential labour supply, whichinclude discouraged workers and others on the margins of the labour force in addition to the ILOunemployed.
This review confirms the unreliability of the LR and of the FAs register as indicators of the leveland trend of unemployment. However, it has indicated the potential strength of these databasesas mechanisms for targeting assistance and support on individuals within the priority groupsidentified under the survey approach. Some of this potential is now being exploited under theNational Employment Action Plan; further measures in this direction will be proposed in the finalsection of this report.
Clearly, the LFS/QNHS survey data have the potential to provide broad estimates of the extentof dubious claims in the in the system of social welfare payments for unemployed people.However, as the CSO report of September 1996 showed, this potential could only be exploitedwhen a specific identifiable sub-sample of persons known to be on the LR is included in thesample for the LFS. Even then, as shown at 2.2.3 above, true comparison between a survey, basedon the situation of individuals at a particular point in time, and an administrative count based onthe accumulation of records over a long period, remains difficult:
In this sense, it would be unwise to suggest regular use of the survey approach as a means oftrying to identifYthe scale and nature of possible welfare fraud. Establishing the presence of fraudis a semi-judicial process in which rules of evidence apply and where individual claimants have theright of appeal. No survey, even if individual respondents were identifiable, could meet these tests.In actual fact, the whole basis on which labour force surveys are carried out is that the individualresponses remain confidential, and this confidentiality has been shown, in international experience,to be critical to public co-operation and the reliability of the survey results.
Rather, the approach to improving control of fraud and dubious claims should be rooted in adetailed examination of the current administration and control systems. Which elements of thecurrent approach (e.g. frequency of signing, requiring of evidence of job search, etc.) seem mostlikelyto ensure compliance with the conditions for receipt of unemployment payments? How doesthe approach to these elements differ from that in other countries, and what is the effect of thesedifferences? These issues will be discussed further in the final section of the report.
Report Prepared By:Tansey Webster Stewart & Company Ltd

SECTION 3: THE COMPOSITION OF THE LIVE REGISTER: ITS DEFICIENCIESAS A MEASURE OF UNEMPLOYMENT
In Section 2.2, it was emphasised that the Live Register is neither a useful indicator of theabsolute level of unemployment in Ireland nor of short-run trends in unemployment. As noted inSection 2.2.5, the continuing and pervasive use'ofthe LR as a measure of unemployment by themedia, pressure groups and politicians confuses rather than clarifies the substantive debate onunemployment. For these reasons, the composition of the LR, its trend over time and its growingdeviations from more accurate measures of unemployment are examined extensively in thissection.
3.1. THE LIVE REGISTER AS A COUNT OF CLAIMANTSThe Live Register does not measure, nor does it purport to measure, the absolute level of Irishunemployment. As the Central Statistics Office restated in its written submission to the Commi~teeon Public Accounts:-
"The CSO has always emphasised that the Live Register does not provide a measure oj theabsolute level of unemployment. On the one hand, some persons who are clearly unemployedmay not be included on the Live Register because they do not comply with the statutory andadministrative regulations (e.g. contribution requirements, income level) for receipt ofUnemployment Assistance or Unemployment Benefit. On the other hand, there are personsqualifying under the regulations (and therefore counted on the Register) who are employedExamples includepart-time (working up to 3 days per week), seasonal and casual workers" (17).
This view was reiterated in evidence given to the Committee on Public Accounts by the Director-General and the Director of Demographic and Social Statistics of the Central Statistics Office inJune 1998 (18).,
The Live Register is an administrative count of unemployment benefit claimants and applicantsfor credited contributions. It comprises a monthly enumeration of benefit claimants and applicantsfor benefits and credits under three headings:-
i) All claimants for Unemployment Benefit (DB) excluding systematic short-time workers;ii) Applicants for Unemployment Assistance (UA) excluding smallholders and self-employedpersons;iii) Others, including applicants for credited Social Welfare contributions, but excluding thoseinvolved in industrial disputes.
(17) 'Note to Public Accounts Committee, Central Statistics Office, May 1998, page 6.
(18) Committee on Public Accounts, Vote No 5: Central Statistics Office, June 4 1998, especially pps 11-17.
Report Prepared By:.Tansey Webster Stewart & Company Ltd

TABLE 3.1.COMPOSITION OF LIVE REGISTER AT DECEMBER 1997
CATEGORY NUMBER % OF TOTAL
Unemployment Benefit Current ClaimsMale 33,009 13.3Female 36,992 14.9
Total UB 70,001 28.3
Unemployment Assistance Current ApplicationsMale 114,192 46.1Female 45,633 18.4
Total UA 159,825 64.5
Others on the live RegisterMale 3,779 1.5Female 14,125 5.7
Total Others 17,904 7.2
TOTAL LIVE REGISTER 247,730 100.0
Unemployment Benefit (VB) is an entitlement based on prior social insurance contributions.Continuous eligibility spans 15 months. For the year from 27 May 1998, the personal VB rate is£70.50 per week (19). A further weekly payment of £41.20 is made in respect of a qualified adultdependent where that dependant is earning less than £60 per week (20). Further, a weekly paymentof £13.20 is made for each dependant child where the unemployed spouse's earnings remain below£60 per week.
Unemployment Assistance (VA) is means-tested. The maximum short-term personal VA rateamounts to £68.40 per week. The long-term rate, which applies after 390 days, amounts to£70.50. Again, where the applicant's spouse is earning less than £60 weekly, a weekly adultdependant allowance of £41.20 is payable. Where the maximum personal rate of VA is paid, childdependant allowances of £13.20 may be payable for each child where spouses are earning lessthan £60 per week. Unlike many other countries, access to UA is open-ended in terms of duration,once applicants continue to satisfy the means test requirements.
The vast majority of the 'Other' category on the LR are persons, mainly women, signing on forcredited social welfare contributions.
(19) 'Social Welfare Rates of Payment 1998/99', DSCFA, 1998, pps 9, 27.
(20) An escalating 'clawback' operates where spouses' incomes range between £60 and £90 per week. Above £90 per week,entitlement to the dependant allowance ceases.
Report Prepared By:Tansey Webster Stewart & Company Ltd

Thus, of the 231,327 on the Live Register at April 1998, some 38,000 were either part-timeworkers or were signing on for credits. At that date, the number of part-time workers on theRegister was estimated at 22,000 while those signing for credits were estimated at 16,000. (21)
3.2. YOUNG PEOPLE ON THE LIVE REGISTEROf the 247,730 people on the Register at December 1997, shown in Table 3.1, some 53,035 or21.4% were aged under 25. Amongst the under 25s on the Register at that date, 30,399 (57.3%)were men and 22,636 (42.7%) were women.
Young people gain eligibility for Unemployment Benefit on having paid 39 PRSI contributionsfrom the time of entry to the workforce and a further 39 contributions in the governing year.Young people must have attained the age of 16 years before they can make PRSI contributions.
Those applying for Unemployment Assistance must be at least 18 years of age. UnemploymentAssistance is means-tested. In the case of unemployed 18 year olds living at home, eligibility forUA is governed by 'benefit and privilege' rules. The value of board and lodgings provided byparents to a claimant was capped at 17% of net parental income in 1995. Net parental income iscalculated as gross income less income tax, PRSI, health and VHI contributions, union dues,expenses incurred travelling to and from work and rent and mortgage payments in respect ofchildren.
At present levels ofUA (£68.40 a week), where net parental income, calculated as above, is £400a week or less, then children aged 18 and over would meet the means test criterion for anUnemployment Assistance payment. Amongst this group, all of those deemed eligible for VA onmeeting the statutory conditions are now entitled to a minimum weekly payment of £25 a week.
Thus, on reaching 18, young people residing at home, where gross parental income could beapproaching £30,000 a year, would meet the means test criterion for a minimum weekly VApayment of £25. Assuming other VA eligibilityconditions are met, and UA payments commence,there is no requirement for such young people to register initially with the FASemployment/placement service.
3.3. THE MECHANICS OF THE LIVE REGISTERRegistration and payments are administered through 58 local Department of Social Communityand Family Affairs (DSCF A) offices and 80 branch employment offices arrayed across thecountry.
Standard control procedures are used to ensure that a client meets and continues to meet theconditions of being unemployed, available for and genuinely seeking work. These include:-
i) measures to verify the identities and addresses of new claimants;(21) 'Note to Public Accounts Committee', CSO, 1998, p8.
ii) at the registration stage, claimants are made aware of the conditions of benefitreceipt, the need to fulfil eligibility on a continuing basis and the consequences ofmaking false declarations. The means of new UA claimants are assessed either bydesk interview or home visit. Decisions on applications for benefit are made byDeciding Officers, who assess whether new claimants fulfil the statutoryconditions.
iii) at the payments stage, identity checks are made using the social services card andthe verification of claimants' signatures. Benefit claimants are no longer requiredto 'sign on' the Live Register on a weekly basis. While signing frequency is at thediscretion of the local office, it has become general practice for claimants to signon once every four weeks. (22)
The benefit payments system is now operated by An Post. Payments are disbursed principallythrough local post offices. In late 1998, provision was made for new VB claims to be paid directlyinto claimants' bank accounts.
"1 hereby declare ...that, since my previous declaration of unemployment, 1was unemployed,capable oj, and available for and gerruinelyseeking, but unable to obtain suitable employment".
Existing claims are examined on an ongoing basis by the External Control Unit (ECD) in localoffices to ensure that claimants are available for work and seeking employment on a continuingbasis. The ECU may interview clients at local offices, at signing centres or at home.
The Special Investigation Unit (SIU) investigates clients where fraud or abuse is suspected.Special investigations may be targeted on specific industries, occupational groups or geographiclocations.
procedures to detect fraud at an early stage and to target areas ofgreatest risk; and
procedures to ensure that claimants and the broader public areaware of the risks and penalties".
(22) 'Signing Arrangements', DSCFA Circular, 21/4/1998.
(23) 'Note for Information on Fraud/Abuse of Live Register Payments', DSCFA, 1998.
Report Prepared By:Tansey Webster Stewart & Company Ltd

The deficiencies of the Live Register as a barometer of unemployment have been spelled outclearly by Professor Brendan Walsh and Mr Anthony Murphy ofDCn (24):_
"It is generally recognised that the LR -numbers are strongly influenced by administrativeconsiderations and consequently they are a poor indicator oj the level and trend ojunemployment...Thefollowing is a summary of the shortcomings of the LRfrom this viewpoint:-
" Although those claiming UA and UB are required to make a declaration affirming theiravailability jor, and interest in, employment, the LR is not designed to measure unemploymentin the sense of the numbers actually seeking employment and available for work. It provides nodirect information on individuals' interest in, and availability for, employment, and noinformation onjob search.
"It is difficult to construct a consistent time series from the LR returns for past years. Eligibilityfor UB and UA and the coverage oj the LR have been affected by thirty administrative changessince 1970....Numerous categories of individuals have been affected, including those in the olderage groups, women, short"'"timeworkers, farmers and the self-employed.
"Due to the differences in social insurance schemes between countries, the LR cannot be usedfor international co.mparisons.
" There is a large and growing discrepancy between the LR total and the level of unemploymentshown in LFS (Labour Force Survey) returns ... "
"Recent research undertaken by the CSO has demonstrated major anomalies in the LR data. Thefollowing is the distribution by ILO (International Labour Office) labour force status of a sampleof 1,496 individuals who were on the LR and traced for interview at the time of the 1996 LFS(weighted results): ..
Employed (full- or part-time)UnemployedEconomically inactive
21.4%49.5%29.1%"
In short, the numbers on the Live Register are determined not only by the state of the labourmarket, but by the administrative conditions governing registration and the efficiency of controlsystems. All have played a role in determining the actual numbers on the Live Register.
(24) 'Aspectsof Employment and Unemployment in Ireland',Anthony Murphy and Brendan Walsh, Department of Economics, UeD,Appendix in 'Unemplo)ment Statistics', Forum Report No 13, NESF, May 1997, page 77.
Report Prepared By:Tansey Webster Stewart & Company Ltd

In the first instance, the Live Register has, over time, effectively developed an existenceindependent of current economic conditions. This can be seen by examining the long-run trendin the Live Register shown in Table 3.2 and assessing it against prevailing economic conditions.
TABLE 3.2LONG-RUN TRENDS IN LIVE REGISTER (LR) UNEMPLOYMENT
Annual averages in 'OOOsof people, except as specified
YEAR LR CLAIMANTS1979 89.61980 101.51981 127.91982 156.61983 192.71984 214.21985 230.61986 236.41987 247.31988 241.41989 231.61990 224.71991 253.91992 283.11993 294.31994 282.41995 277.81996 279.21997 254.41998* 231.3
1998** 215.8
Report Prepared By:Tansey Webster Stewart & Company Ltd

As Table 3.2 shows, the average annual numbers on the Live Register passed 100,000 for the firsttime in 1980 and 200,000 in 1984. The very steep rise in the numbers on the Live Registerthrough the first half of the 1980s at least coincided with a sharp and perceptible deterioration inIrish economic conditions.
Economic activity began to pick up from 1987 and at an accelerating pace from 1993 onwards.Initially, higher activity levels were slow to be reflected in the labour market. But from 1993,employment levels and ILO unemployment mirrored the pick-up in activity. The LR, however,manifestly failed to reflect these trends.
Trends in the labour force, employment and unemployment as captured in labour force surveys(ILO basis) are shown in Table 3.3.
TABLE 3.3THE LABOUR FORCE, EMPLOYMENT AND UNEMPLOYMENT (lLO BASIS)
In 'OOOsof persons each Spring
YEAR LABOUR FORCE EMPLOYMENT UNEMPLOYMENT1987 1,337 1,111 2261988 1,328 1,111 2171989 1,308 1,111 1971990 1,332 1,160 1721991 1,354 1,156 1981992 1,372 1,165 2071993 1,403 1,183 2201994 1,432 1,221 2111995 1,459 1,282 1771996 1,508 1,329 1791997 1,539 1,380 1591998* 1,621 1,495 127
CHANGE1987-98 +21.2% +34.6% -43.8%
* Quarterly National Household Survey (QNHS) result for March-May 1998. Change in survey methodology isestimated to have added 20,000 to employment levels and the size of the labour force. Adjusting for this, the increasein the numbers at work since 1987 is 364,000 or 32.8%.
SOURCES: Tabulations from 1997 Labour Force Survey,CSO; Quarterly National Household Survey First and SecondQuarters 1998, CSO, November 1998, Tables 8, 13.
Report Prepared By:Tansey Webster Stewart & Company Ltd

As can be seen from Table 3.3,on a survey basis, between 1987 and 1998,the labour force hasrisen by one-fifth and the total numbers at work by one-third. Most importantly, on an ILO basis,unemployment has declined by almost 100,000or by well over two-fifths.
These changes are simply not reflected in the Live Register, shown in Table 3.2. As can be seen,the Live Register average annual total for 1997 was 7,000higher than it had been in 1987.
Put another way, those depending solely on the LR to inform their view of unemployment wouldhave been forced to the conclusion that unemployment in 1997 was higher than in 1987.
The failure of the Live Register to reflect labour market changes detected in labour force surveyshas led to a widening gap between the Live Register and survey measures of unemployment. Thisgap is charted in Table 3.4 with data being shown for April each year.
TABLE 3.4THE WIDENING GAP BETWEEN THE LR AND SURVEY UNEMPLOYMENT
Figures for April each year in 'OOOs
YEAR LIVE REGISTER ILOSURVEY VARIANCE VARIANCEUNEMPLOYMENT %
1988 242 217 +25 +11.51989 233 197 +36 +18.21990 221 172 +49 +28.51991 248 198 +50 +25.31992 281 207 +74 +35.71993 295 220 +75 +34.11994 285 211 +74 +35.11995 276 177 +99 +55.91996 281 179 +102 +57.01997 255 159 +96 +60.41998* 231 127* +104 +81.9
NOTE: The variance measures the amount by which the LR exceeds ILO in each year. The VAR % shows thepercentage variance and is calculated: (LR - ILO)/ILO x 100.
Report Prepared By:Tansey Webster Stewart & Company Ltd
As shown in Table 3.4, the failure of the LR to respond to positive changes in labour marketconditions has led to a widening gap between the LR and ILO unemployment.
In 1988, the gap between the two figures amounted to just 25,000, with the LR exceeding ILOunemployment by 11.5%. By 1993, the Live Register was 75,000 higher than ILO unemploymentand the variance had risen to more than one-third. In 1998, the numbers on the Live Registerexceeded ILO unemployment by more than 100,000. At Spring 1998 levels, there were almost82% more Live Register claimants than persons conforming with ILO definitions ofunemployment.
3.7. THE EFFECT OF ADMINISTRATIVE CHANGES ON THE LRIt has been emphasised throughout this paper that the numbers on the Live Register at any timerepresent, in the main, an enumeration of those qualifying for registration at that date.Additionally, the numbers may be inflated by the failure, in some cases, of the Register to reflectaccurately the current labour market status of some registrants.
In other words, the numbers on the Live Register are determined by a combination of theconditions governing eligibility, the control procedures in operation and the vigour with whichthey are enforced.
It follows that the numbers on the Live Register will be particularly sensitive to changes in theadministrative regulations governing registration. If such changes were few and narrow in scope,they would be of little import. However, they have been numerous and extensive in range. Asnoted earlier by Walsh and Murphy, 30 administrative changes were introduced between 1970 and1995. There have been further substantial changes since 1995.
In documenting the administrative changes in the LR introduced between 1970 and 1995, Aislingo Brolchain identified seven categories of persons affected (25):_
i) Women working in domestic service or farming; single women and widows; marriedwomen. The Equality legislation of the 1980s led to a gradual relaxation of the specialconditions relating to women's eligibility to claim UB and to apply for UA.
ii) Men residing in rural areas without dependants or occupying land over a set value. Thesecategories were excluded from receipt ofUA, and from the LR, by Employment PeriodOrders during 1970 and 1971. Thereafter, they rejoined the LR.
iii) Persons over 65 years of age. Following the gradual reduction in the qualifying age fora state old age pension from 70 to 66 between 1973 and 1977, those over 65 wereremoved from the LR in January 1980.
(25) 'Changes in the Live Register Since 1970', Aisling 0 Brolchain, FAS Labour Market Review, Volume 5, No 2, Winter 1995,pps 19-38.
Report Prepared By:Tansey Webster Stewart & Company Ltd

iv) Systematic short-time workers. Those working a three-day week were excluded from theLR in January 1980. In May 1992, this was extended to those working a 'week on, weekoff basis who had worked 50% or more of their normal working days over the previousfour weeks. The number of systematic short-time workers registered but excluded fromthe LR stood at 4,416 at December 1997.
v) The pre-retirement age cohorts. The Pre-Retirement Allowance (PRETA) and Pre-Retirement Credit Schemes (FRECS) were both introduced in 1990. Initially, people over60 who made a declaration that they had retired from the labour force qualified for theseschemes but were excluded from the LR as a result. The qualifying age for both schemeswas reduced to 55 years in 1992. At December 1997, there were 18,081 persons under65 on PRET A and PRECS excluded from the Live Register.
vi) The self-employed in receipt of VA. Certain groups of self-employed individuals, mostnotably fishermen and shop-keepers, were in receipt of full or partial VA. In 1992, it wasdecided to treat such groups in a similar fashion to smallholders. In consequence, whilecontinuing to receive VA, they were excluded from the LR. The total number ofsmallholder and self-employed applicants for VA excluded from the LR at December 1997was 11,833.
vii) Claimants residing with their parents. The value of board and lodgings provided by parentsto a claimant was capped at 17% of net parental income as of 1995. The value of suchbenefits is assessable in determining eligibility for means-tested income supports such asVA. From 1992 onwards, minimumVA payments of £5 weekly were introduced for thosepassing the means test. This minimum VA payment had risen to £25 weekly by 1995.
Second, from 1970 to the mid-1980s, changes on balance increased the LR. From 1986 to 1995,the position was more complicated. While the majority of ,statistical' changes have acted to reducethe LR, "further changes in the social welfare code together with the cumulative effect of the'equality' changes in the mid-1980s have operated in the opposite direction" (26).
Report Prepared By:Tansey Webster Stewart & Company Ltd

In seeking to explain the widening gap between the LR and survey measures of unemployment,the CSO in its submission to the Public Accounts Committee stated:-
"Themain factors likely to have impacted on the level and composition of the Live Register andcontri buting to the increasing divergence are listed below in the approximate chronologicalorder in which they occurred:-
The Social Welfare (No 2) Act 1985 (implementing EU Social Welfare provisions) whichresulted in an increased number of women signing on, without any change in their actuallabour force status;
The introduction of 'signing on' as an eligibility requirement for subsequent participationin employment or training schemes;
The increasing number of part-time and occasional workers (other than those onsystematic short-time) who sign on in respect of days when they are not employed;
Changes in the rules and practices in relation to means testing (e.g. for unemployedpersons resident with parents);
"Thesefactors tended, in the main, to exert an upward influence on the Live Register. It is not,however, possible to quantify the exact contribution of anyone of these factors to the growth ofthe divergence between the LFS and the Live Register" (27)
Thus, the numbers on the Live Register reflect the administrative criteria governing eligibility atany given time. Changes in those criteria will cause changes in the numbers on the Live Registereven where labour market conditions themselves remain unaltered.
Nor should the cumulative effects of increased employment - and thus an increased insuredpopulation - on LR numbers be discounted. As Walsh and Murphy concluded:
"Among women, wefound the influence of previous employment on the incidence of signing onto be very strong. It is likely that the number of women claiming UB will continue to increase(regardless of the 'true' level of female unemployment) as more women acquire a record of(insured) employment". (28)
(27) 'Note to Public Accounts Committee', CSO, May 1998, pages 8-9.
(28) Murphy and Walsh (1997) op. cit., page 88.

3.8. 'ANNOUNCEMENT' EFFECTS AND RECENT POLICY CHANGESThe LR is essentially an administrative count of those signing on for benefits or for credits. Thisprovides the first part of the explanation for the growing disparity between the LR andunemployment as measured by official surveys of the labour force.
Second, there may have been significant numbers on the LR who were not currently fulfilling allof the conditions necessary for valid benefit claims. As noted in Section 3.3, the declarationrequires claimants to affirmthat they are unemployed, capable of, and available for work and thatthey are genuinely seeking suitable employment.
The CSO's Labour Force Survey analysis of a sample from the LR at April 1996 was referred tobriefly in Section 3.4. In seeking to explain the widening gap between the LR and surveyunemployment, the CSO selected a sample of2,672 people from the LR and sought to identifytheir ILO economic activity status. The sample was weighted towards the short-term unemployed.Some 2,414 usable responses were collected.
However, of these, 679 were not listed as usual residents at the addresses they had given. Afurther 161 were found to have left the LR while 78 fell into categories not included in the LRcount, including those on systematic short-time working. In all, 918 people were excluded fromfurther investigation, reducing the available sample for additional analysis to 1,496. The resultsof that analysis are shown in Table 3.5.
TABLE 3.5.ECONOMIC ACTIVITY STATUS OF A SAMPLE OF PERSONS ON THE LR
A A "I1996 S 1 1 496t ~pn ample SIZe: ,ILO CATEGORY SAMPLE RESULTS WEIGHTED RESULTS
PERSONS % PERSONS %Employed Full Time 220 14.7 167 11.4Employed Part Time 162 10.8 146 10.0Total Employed 382 25.5 313 21.4
Unemployed 664 44.4 724 49.5
Marginally Attached to LabourForce 64 4.3 66 4.5Not Economically Active/Others 386 25.8 359 24.6
Total 1,496 100.0 1,462* 100.0
SOURCE: 'Unemployment Statistics: Study of the Differences between the Labour Force Survey Estimates ofUnemployment and the Live Register', Central Statistics Office, September 1996, derived from Tables 1 and 2.
Report Prepared By:Tansey Webster Stewart & Company Ltd

The raw results show that of the sample drawn from the LR in April 1996, one-quarter ofrespondents were working full- or part-time, one-quarter were economically inactive while wellunder one-half were unemployed using ILO definitions.
The sample was then re-weighted to reflect the profile of all on the LR and to allow for a smalloutflow. The re-weighted results showed that over one fifthwere in full- or part-time jobs, almostone-quarter were inactive while just under one-half were unemployed using standard internationaldefinitions of unemployment.
Unsurprisingly, the publication of these results by the CSO in September 1996 provoked muchcontroversy. It also subsequently induced accelerated outflows from the LR. The gross outflowfrom the LR averaged more than 9,000 each week during September and October 1996, levelsnot approached during any other month in 1996 or 1997 (29).
Commenting on these results, the CSO has stated:-"While the sole purpose of the study was statistical quality control, its publication provoked aheated debate on the administration of the Live Register. Following its publication in September1996, the Live Register began to fall steeply and the steepest fall on record was for October1996" (30).
While it cannot be established conclusively, it would appear a reasonably safe deduction that theannouncement effects of the CSO's LR unemployment analysis prompted an increased incidenceof 'signing off the LR during the Autumn of 1996.
Similar'announcement' effects were in evidence amongst the unemployed under 25 following thelaunch in September 1998 of the National Action Plan on Employment (31). The numbers under25 on the LR fell sharply as a result.
However, 'announcement' effects are, of their nature, transitory. Unless they are buttressed bystrong control procedures and effective enforcement - subject to due process and adherence tothe rules of natural justice - 'announcement' effects are likely to lose their impetus over time.
Tentative evidence for this can be derived from the relative performance of the LR and ILOunemployment between April 1997 and April 1998. Over this period, the Live Register totaldeclined from 255,500 to 231,300. From this trend, the CSO calculated that the StandardisedUnemployment Rate (SUR) had declined from 10.3% in April 1997 to 9.4% by April 1998.
However, when the QNHS survey data for Spring 1998 became available, the unemployment ratewas shown to have fallen from 10.3% in April 1997 to just 7.8% in the Spring of 1998. Thegrowth in the labour force over this twelve months can explain about one-half of a percentagepoint of the difference, reducing the LR-derived SUR to 8.9% for April 1998.
(29) 'Statistical Bulletin', March 1998, Table 16, p 216.
(30) 'Note to the Public Accounts Committee', Central Statistics Office, May 1998, page 9.
(31) See Part 4 of this report, especially Table 4.1(c).
Report Prepared By:Tansey Webster Stewart & Company Ltd

However, even adjusting for the size of the labour force, there still remained a gap of more thana full percentage point between the adjusted SUR of 8.9% and the QNHS unemployment rate of7.8% for the Spring of 1998. Thus, in the year to Spring 1998, movements in the LR had onceagain failed to track movements in actual unemployment. This suggests not only that the LR isan inaccurate guide to the level of real unemployment, but that it is a poor predictor even of short-run fluctuations in the unemployment rate.
In turn, this raises the question as to why the LR is not fully reflecting changes in the economy'sshort-run underlying unemployment performance.
I. The Live Register is an administrative count of those signing on for benefits or credits. Assuch, it is neither an accurate guide to the absolute level of unemployment nor to short-runtrends in unemployment.
II. Surveys of unemployment, most notably the new Quarterly National Household Survey(QNHS), based on internationally-accepted ILO definitions, provide a much more accurateassessment of the numbers out of work.
ill. Through the 1990s, the divergence between the Live Register and survey indicators ofunemployment widened. In essence, this reflects the fact that each measures a different event.The LR counts the numbers claiming benefits or signing on for credited contributions;surveys measure the unemployed who were willing, able and actively seeking work.
IV. Policy changes and changes in the rules governing eligibility clearly affect the numbers on theLR, irrespective of the underlying trend in unemployment. 'Announcement' effects alsoinfluence the numbers signing on the LR.
V. The numbers on the LR are also a function of the control mechanisms in place and theeffectiveness of their enforcement.
VI. Young people residing at home can meet the means test criterion for UnemploymentAssistance payments where net parental income ranges as high as £400 per week, equivalentto a gross income of up to £30,000 annually. Subject to meeting the statutory conditions, ayoung person in these circumstances would be entitled to a minimum weekly UA paymentof£25.
VII. The fact that the LR is an inaccurate indicator of unemployment does not detract from itsmany other uses. Its great strength is the data it possesses on the labour market experienceof real, identifiable individuals. As a result, it is an ideal platform for active labour marketinterventions targeted at delivering counselling, education, training, work experience and jobsto the most disadvantaged in Irish society.
Report Prepared By:Tansey Webster Stewart & Company Ltd

"1. I hereby declare in respect of each day marked X in the period ending on the date shownbelow against which my signature or mark or initials is/are inserted, that, since my previousdeclaration of unemployment, I was unemployed, capable of, available for and genuinelyseeking, but unable to obtain suitable employment.
"2. I declare that, aside from those changes which I have notified to my Local Office, there hasbeen no other change whatsoever in my, or my spouselpartner's income /means or othercircumstances since I first claimed
"3. I am continuing to claim increases in respect of my qualified adult and child dependants asalready notified
Report Prepared By:Tansey Webster Stewart & Company Ltd

4.1 THE MANAGEMENT OF THE LIVE REGISTER: PAST PERFORMANCETraditionally, the principal labour market focus of the Department of Social, Community andFamily Affairs has been the proper management, administration and policing of the unemploymentbenefit payments system.
Broadly, up to a decade ago, the Department primarily operated passive labour market policies,delivering income support payments to the registered unemployed, who signed on weekly. Nosignificantefforts were made to deliver other labour market supports to the unemployed. It wasessentially a payments-based approach.
In itself, the proper delivery of income support payments constituted no small task. There isextensive traffic through the Live Register each year, with a throughput of as many as 600,000individuals annually. Managing the weekly unemployment queues, the paperwork and theassociated flows of weekly payments effectively precluded the initiation of other services. Whilepolicing and anti-fraud controls were always in place, it is conceded that a relatively smallpercentage of claimants were in practice challenged for evidence that they had unsuccessfullysought employment.
In 1988, ILO unemployment stood at 217,000 while the numbers on the Live Register averaged241,000. Employment that year was lower than in had been in 1980. In these depressed labourmarket conditions, the corporate culture prevailing within DSCF A at the time implicitly acceptedthat there was little point in exerting severe pressure on the unemployed to pursue jobs that werenot there.
The introduction of the 'Job Search' scheme in 1987 signalled a more a9tive stance. TheDepartment's major active labour market intervention to date has been the Back To WorkAllowance Scheme (BTWAS). This scheme is targeted on reintegrating the long-termunemployed over the age of 23 back into the workforce. Those returning to work under thescheme can retain their primary and secondary social welfare entitlements on a sliding scale forthree years, subject to a weekly earnings limit.
At present, some 28,000 people are now at work under the auspices of the scheme. This makesit the second-largest programme intervention in the Irish labour market after CommunityEmployment, on which almost 40,000 people are participating*. In furtherance of this more activeapproach, 32 'Jobs Facilitators' have been appointed at DSCFA local (unemployment) offices.
ii) Payments and 'signing on' procedures have changed* The numbers on CE are due to fall to 37,500 this year.
Report Prepared By:Tansey Webster Stewart & Company Ltd

Through 1993/94, a number of important administrative procedures were changed, driven largelyby increases in the numbers on the Live Register. Their net effect was to divorce signing frompayment.
Progressively, claimants were required to 'sign on' once every four weeks rather than every week.The post offices became the primary location for disbursing unemployment benefit payments.
In our view, these changes have yielded both positive and negative results. On the credit side,reduced attendance requirements, the transfer of the payments system to post offices coupled withthe decline in the numbers on the Live Register since 1993 have increased the amount of time thatcan now be allocated to individual claimants. On the debit side, actual contacts with those on theLive Register have diminished, potentially weakening the control function.
As noted earlier, a 1996 ILO analysis of a sample of Live Register claimants conducted by theCSO showed that over one-fifth of those sampled on the register were in full- or part-time work,roughly one-quarter were economically inactive using ILO definitions and just under one-halfwere unemployed (32). These findings provoked much public controversy and raised questionsabout the DSCF A's information systems, management and control of the Live Register.Subsequent to publication of these findings, the regulations governing eligibility forunemployment benefits have been codified and reaffirmed.
Regulations introduced by the Minister for Social, Community and Family Affairs in 1998 definewith greater clarity the conditions that must be met by claimants for unemployment benefits.
The regulations require that the claimant be available for employment. Availability isacknowledged where the claimant can show that:-
"s/he is willing and able at once to take up an offer of suitable full-time employment and doesnot impose unreasonable restrictions on the nature and terms of the employment" (33).
Claimantsmust also demonstrate that they are genuinely seeking employment. This requires thata claimant:-
"can demonstrate that sIhe has taken reasonable steps which offer him or her the best prospectsof obtaining employment. The steps set out in the regulations provide for making applicationsfor employment, seeking information on the availability of employment, availing of reasonableopportunities for training, acting on advice received concerning the availability of employmentand taking steps towards establishing him/herself in self-employment". (34)
(32) See pps 31-32 above for discussion of the findings
(33) Social Welfare (Consolidated Payments Provisions) (Amendment No 4) (Availability and Genuinely Seeking EmploymentConditions) Regulations 1998, Explanatory Note(34) Social Welfare Regulations 1998, Explanatory Note.
Report Prepared By:Tansey Webster Stewart & Company Ltd

dependent spouses of those claiming long-term unemployment benefits and other means-testedpayments;
unemployed persons under 18 years;lone parents;persons in receipt of Disability Allowance.
"The development of an effective public employment service, especially through the LocalEmployment Service (IESj, is essential to address the needs of the unemployed and particularlythe long-term unemployed" (39).
Report Prepared By:Tansey Webster Stewart & Company Ltd

The Treaty of Amsterdam, signed in October 1997, recognises, through its Title on Employment,that the attainment of high levels of employment is one of the fundamental objectives of theEuropean Union. The Treaty created a framework within which employment policies throughoutthe EU could be co-ordinated and monitored and within which annual employment guidelines forthe member-states could be established.
The Luxembourg Jobs Summit of November 1997 paved the way for the adoption in mid-December 1997 of the first co-ordinated guidelines on employment policies in the member-states.This new European Employment Strategy (EES) is founded on four pillars:-
i) Employability. The approach here centres on the adoption of active labour market policiesaimed at preventing both young and older people slipping into long-term unemployment;
ii) Entrepreneurship. Encouraging enterprise by reducing administrative and tax impositionson business and by fostering the growth of self-employment;
iii) Adaptation. Creating more education and training opportunities for those at workto facilitate adaptation to industrial change and to structural changes in the labour market;
iv) Equal Opportunities. Facilitating the participation of women and otherdisadvantaged groups in the labour market.
To support these pillars, all member-states were required to prepare, adopt and implementNational Action Plans (NAPs) on Employment, outlining how they intended to implement theGuidelines.The key strategic orientation under the Employability pillar is the adoption of a strongpreventative strategy through early and systematic intervention with unemployed people with aview to preventing their drifting into long-term unemployment. Particularly in the context of thenext round of structural funds, the European Social Fund (ESF) has been earmarked as the keyfinancialinstrument at the European level to support member states in the implementation of theirNational Action Plans.
The Irish NAP was approved and published by the Government in April 1998 and duly submittedto the European authorities. The key strategic issue identified for Ireland in its Action Plan wasthe finding of a balance between the adoption of the preventative approach while ensuring at thesame time that the needs of those who were already long-term unemployed continued to beaddressed. Consequently, a phased approach to the preventative strategy was adopted(recognising that the Guidelines themselves allow for a five year timeframe within which toimplement the strategy).

The Employment Action Plan requires the public authorities to engage systematically, individuallyand intensively with those on the Live Register who stand at risk to long-term unemployment.Initially, interventions have centred on the young unemployed in danger of slipping into long-termunemployment. Subsequently, such interventions will be extended progressively to the adultunemployed approaching twelve months out of work.
This active case management approach, which concentrates on addressing the individual labourmarket needs of those threatened by long-term unemployment, represents a signal departure fromthe relatively impersonal passive income support traditionally provided to those on the LiveRegister.
This substantive change from passive to active measures has necessitated much closer co-operation and co-ordination between those government departments and agencies which deal withthe unemployed.
The Live Register is administered and managed by the Department of Social, Community andFamily Affairs. The employment service function - guidance, counselling and placement servicesfor the unemployed coupled with the matching of job seekers with job vacancies - is primarily butnot exclusively the responsibility ofF AS, operating under the Department of Enterprise, Tradeand Employment.
The exchange of timely and up-to-date data between DSCF A and FAS/DETE is the key toimplementing the new strategy successfully. At present, it requires the referral of young peopleat risk to long-term unemployment by the DSCF A to FAS, the maintenance of individual caserecords on those referred, whether or not they attend subsequent interviews with FAS and thecontinuous tracking of labour market outcomes for FAS interviewees.
To date, operational co-operation and co-ordination on the implementation of the new strategybetween the relevant government departments and agencies is reported to be good by alldepartments and agencies involved.
Addressing the individual labour market needs of those on the Live Register is substantially moreresource-intensive than the straightforward management and control of an unemploymentpayments system.
In response, FAS has doubled its front-line placement staff and case officers to over 420, aidedby internal staff redeployment and additional budgetary provisions.
Guideline 1 of the 1998 Employment Action Plan requires that young people under the age of25who are approaching six months on the Live Register must be offered a fresh start, in the formof training, retraining, education, work experience, ajob or other employability support.
Report Prepared By:Tansey Webster Stewart & Company Ltd

Most new entrants to the Live Register leave again within six months. In planning for theimplementation of Guideline 1, it was estimated that 70% of new registrants under the age of25would have left again within six months. The remaining 30% were expected to give rise to a flowof30,000 young people approaching six months on the Register in the course ofa year. (40)
Guideline 1 was introduced from September 1, 1998. It operates as follows. When young peopleinitially register as unemployed, they are advised by the DSCF A to register also with the FASEmployment Service. However, they cannot be compelled to do so. As they reach five monthson the Live Register, an appointment with FAS is arranged for them three weeks ahead.
At this initial interview with FAS, those who have not previously registered with the employmentservice are required to do so. They are then interviewed by a FAS placement officer. Theinterview, which can be lengthy, seeks to identify the young person's needs, aspirations and labourmarket options. Efforts are initially directed at placing the young people in employment, orimproving their job seeking skills, or identifyingappropriate places on FAS programmes or, whereintensive and extended support is required, referring young people to the Local EmploymentService.
Where young unemployed people fail to attend their FAS interview, they are referred back to theirDSCFA local office where they called for a control interview. Renewed efforts are made toencourage them to participate in the FAS placement process. If they refuse, the question of their .continued eligibility for unemployment payments may be raised.
In the case of those who attend the FAS interview, are placed subsequently either in work ortraining and then drop out, the only issue to be determined is why they should continue to qualifyfor unemployment payments.
In both cases, any decisions to disallow benefit are subject, as always, to due process and the rulesof natural justice.
The early impact of the implementation of Guideline 1 of the Employment Action Plan can be seenfrom Table 4.1. In interpreting these early programme indicators, it should be borne in mind thatmany of those referred had only been interviewed very recently.
Report Prepared By:Tansey Webster Stewart & Company Ltd

TABLE 4.1 (a)EMPLOYMENT ACTION PROGRAMME: GUIDELINE 1 OUTCOMES
At end-November for all referrals since September 1 1999
CATEGORY NUMBER % TOTAL
Referred by DSCFA to FAS 1,616 100Of whom:Interviewed by FAS 842 52Did not attend interview 657 41
- (still on Live Register) (283) (18)- (Left Live Register) (374) (23)
Active in Local Employment Service 51 4FAS Interview Pending 56 3
4.1 (b)OUTCOMES FOR THOSE INTERVIEWED BY FAS
CATEGORY NUMBER % TOTAL
Interviewed by FAS 842 100Of whom:Placed in jobs/training 258 31Left Live Register 129 15
= Total placed plus 387 46Signed Off
Still on Live Register 455 54
Of whom:Referred to Training 69 8Continuing with FAS Support 207 25Not Progression-Ready 61 7Dropped Out 109 13Other Inactive 9 1
Report Prepared By:Tansey Webster Stewart & Company Ltd

TABLE 4.1 (c)TOTAL NUMBERS LEAVING THE LIVE REGISTER
Those not attending FAS interviews 374 23%*Those attending FAS interviews 387 24%*Totalleavers 761 47%*
SOURCE: Employment Action Plan, Monthly Progress Report No 2, November 1998,Department of Enterprise, Trade and Employment.
Table 4.1 (a) shows that in the first two months of Guideline l's operation, 1,616 young peopleapproaching six months on the Live Register were referred by the DSCFA to FAS.
Of all DSCF A referrals, 41% failed to present for interview on the dates arranged, 52% wereinterviewed by FAS and the remainder were either awaiting interview or were active in the LES.
Of the 657 young people who failed to attend their interviews, 374 had left the Live Register and283 remained on it. Amongst the latter group, 72 or over one-quarter had their unemploymentbenefits suspended.
Table 4.1 (b) shows the outcomes for those who attended their FAS interviews. Of the total 842interviewees in September and October, almost one-third (31%) were placed either in jobs ortraining. A further 15% left the Live Register without placement. Thus, almost one-half (46%)of those interviewed departed from the Live Register, either because they were placed in jobs ortraining or because they had signed off the Register.
Table 4 .1 (c) shows the total impact of Guideline 1 on the Live Register during September andOctober 1998. Of all 1,616 referrals from the DSCFA to FAS, 761 or 47% left the Live Register.
Table 4.2 shows the destinations of those leaving the Live Register by end-November, whetheror not they had been interviewed by FAS.
Of all those leaving the Live Register, more than three in five (62%) were either at work orengaged in FAS programmes. A further sixth (16%) had not signed on or had been classified asnot entitled to unemployment benefits. The remainder had either entered the education system,gone abroad, transferred to other benefit schemes or their destinations were unknown.
Report Prepared By:Tansey Webster Stewart & Company Ltd

Outcomes varied depending on whether DSCF A referrals had attended the FAS interviewsarranged for them or not. Amongst those attending scheduled FAS interviews, a very highproportion - more than four out of five (81%) - were either in work or had been placed on FASprogrammes.
Amongst those who did not turn up for their interviews, just two out of five (42%) were at workor enrolled in FAS programmes. Of non-attenders, 19% did not sign on while a further 9% wereassessed as not entitled to benefits.
TABLE 4.2DESTINATIONS OF THOSE LEAVING THE LIVE REGISTER (N = 761)
Referrals to end-October who left the LR by end-November
DESTINATION DID NOT ATTEND INTERVIEWED BY TOTALON LEAVING INTERVIEW BY FAS FAS LEAVERSLRTOTAL 374 100% 387 100% 761 100%
At Work 145 39% 183 47% 328 43%FAS 10 3% 131 34% 141 19%Education 25 7% 19 5% 44 6%Other Benefits 11 3% 5 1% 16 2%Not Entitled 32 9% 6 2% 38 5%Gone Abroad 24 6% 5 1% 29 4%Did not Sign On 71 19% 13 3% 84 11%Other/Unknown 56 15% 25 6% 81 11%
SOURCE: Employment Action Plan, Progress Report No 2, November 1998, Department ofEnterprise, Trade and Employment.
The status and role of the Local Employment Service was defined thus in the 1997 White Paperon Human Resource Development:-
"The Local Employment Service (LES) and the FAS Employment Service constitute the twostrands oj the Public Employment Service. The LES has been established to provide a tailor-made response to targeted groups oj unemployed at local level in areas oj particulardisadvantage" (41).
Report Prepared By:Tansey Webster Stewart & Company Ltd

The budgets of the two strands of the Public Employment Service were almost equal in 1998. TheLES, operating in 18 areas last year, had a budgetary allocation of some £10.7 million.Expenditure at the FAS Employment Service during 1998 was budgeted at £10.6 million. TheFAS Employment Service operated through a network of some 70 FAS offices nationwide.
The LES has expanded very rapidly in recent years, indicating the priority accorded to developingthe service in 'Partnership 2000'. During 1999, provision has been made to increase by seven thenumber of areas in which the LES will be operating, bringing the total to 25. In recognition of thisexpansion, the LES budget has been raised to some £14 million for 1999.
Given its assigned role, it might have been expected that the LES would have played an integraland active part in planning and preparing for the implementation of Guideline 1 of the NationalAction Plan on Employment.
However, this does not appear to have proved the case. While, as Table 4. 1(a) shows, some 4%ofDSCF A referrals to end-November have become active in the LES, there appears to have beena marked reluctance on the part of individual Local Employment Schemes to engage in co-ordinated preparation and planning for the implementation of Guideline 1 with other labourmarket agencies.
This may point to a deeper systemic malfunction in the co-ordination of policy for the publicemployment service. Commenting on the relationship between the local and national employmentservices in 1997, the White Paper on Human Resource Development noted:-
"The present organisational arrangements are anomalous and give rise to some confusion ofroles and uncertain lines of demarcation between the formulation and direction of policy andits execution. The result is a danger of poor utilisation of limited resources and a diminution inthe effectiveness of an overall Employment Service. It is critically important that there iseffective co-ordination between the general and local strands of the Employment Service in theperiod ahead given the Government's commitment to a strengthened Employment Service as akey instrument of labour market policy" (42)
This view was echoed by the GECD in a 1998 evaluation of the constituents of the Irish PublicEmployment Service:-
"there is now a striking contrast between the large client flows handled by FAS using self-servicemethods and the resource intensiveness of LES work. Unless the LES can attract more clientsor have DSW (Department of Social Welfare) or FAS make more referrals to it on a voluntarybasis, the viability of the initiative, evaluated against the criterion of efficient use of limitedresources, will remain questionable".

The National Competitiveness Council in its 'Statement on Skills' stated in December 1998 that:-''Improved client services and operating economies could be achieved by combining theLocal Employment Services (LES) and the FAS Placement Services" (43).
"The Employment Services functions should be strengthened by integrating the FAS and LESoperations". (44)
4.6. IMPLICATIONS OF THE NEW MEASURESNotwithstanding the caveats entered in Section 4.5, the thrust of the unemployment-preventingmeasures contained in the new Employment Action Plan have much to recommend them, and forfour reasons:-
i) The new initiatives have strengthened operational co-operation and co-ordination betweenthe unemployment payments system, managed by DSCF A, and the employment service,administered by FAS. Only through systematic linkages between the payments and placementsystems pioneered under the EAP to date can those out of work be offered genuineopportunities for escaping unemployment or improving their chances of finding work in thefuture.
At the same time, closer co-ordination of payments and placement services tests theavailability for, and commitment to, finding work amongst those on the Live Register;
ii) While limited at present, the coverage of the new measures will increase over time. Guideline1, targeted on under 25s approaching six months on the Register, took effect only fromSeptember 1998. The first stage of Guideline 2, targeted on those aged 25 to 34 approachingtwelve months on the Register, is scheduled for introduction in May, 1999. The scope ofGuideline 2 will be extended progressively to all those over 25 who are approaching 12months on the Register;
iii) The case-based approach adopted - intensive efforts aimed at enhancing the employability ofthose at risk to long-term unemployment on an individual basis - is relatively novel in Ireland,though widely practised elsewhere in Europe. Such systematic and intensive engagement witha progressively larger share of those on the Register who are at risk to long-termunemployment wilI:-
a) improve their chances of gaining employment, through direct job placement or theprovision of relevant training, education or counselling;
b) identify those who are unavailable for work or who are not genuinely seeking eitheremployment or an enhancement of their employability;
(43) 'Statement on Skills', National Competitiveness Council, December 1998, page 7.(44) 'Statement on Skills' (1998) op. cit., page 17.
Report Prepared By:Tansey Webster Stewart & Company Ltd

c) cause those who are making unemployment claims that will not stand up to scrutiny tosign off.
iv) As the reach of the activation process extends over time, it will yield a much fuller profile ofthe circumstances and characteristics of those who are unemployed and long-termunemployed. In turn, this will assist in shaping policies and interventions that fit the needs ofthe unemployed.
It is concluded that a case-based approach, centred on the needs and abilities of individuals, notonly offers the best prospects of activating those at risk to long-term unemployment, but ofensuring that the Live Register reflects to a greater extent those who are available for andgenuinely seeking work.
Proposals to extend the scope of the case-based approach to all of those on the Live Register overa certain duration are made in the conclusions. Such an extension would assist in enhancing theemployabilityoflong-duration LR claimants while at the same time reducing the incidence of falseclaims.
Report Prepared By:Tansey Webster Stewart & Company Ltd
1. The numbers at work in Ireland advanced by more than one-quarter to almost 1.5 millionover the past five years. As a result, it is becoming harder to recruit employees. Reintegratingunemployed people into the national workforce would both raise their living standards whilehelping to alleviate labour scarcity.
2. The Quarterly National Household Survey, published every three months by the CentralStatistics Office, provides the best measure of Irish unemployment. It is derived using a largesample of households and conforms to International Labour Office (ILO) definitions ofunemployment. It is comparable to labour force survey data produced in other EuropeanUnion member-states.
3. The Live Register is not an accurate barometer of Irish unemployment. It does not measurethe numbers out of work who are availablefor employment and actively seeking jobs. Rather,it is a register of those claiming unemployment benefits and those signing on for creditedcontributions towards future benefits.
4. The divergence between the numbers unemployed on an ILO survey basis and the numberson the Live Register arises because each is measuring a different event. ILO surveyunemployment is measuring labour market status while the Live Register figures measurebenefit status. Thus, changes in the regulations governing benefit eligibility can result inchanges in the numbers on the Live Register without any underlying changes in the labourmarket. The numbers on the Live Register also reflect the efficacy of control procedures andthe efficiency of their enforcement.
5. A 1996 Labour Force Survey of Live Register claimants revealed that over one-fifth of thesample were at work, full- or part-time while just under one-half were unemployed on ILOdefinitions. Since then, the DSCFA rules governing eligibilityfor unemployment benefits havebeen codified and reaffirmed.
6. 'Unemployment Traps' - actual or perceived - and the uncertainty of many low-paidemployments are amongst the principal economic impediments to the unemployed re-enteringthe workforce. Income tax cuts for the low-paid in recent budgets and the increased numbersrecruited on programmes such as the Back to Work Allowance Scheme have helped to offsetobjective 'unemployment traps'.
7. Ireland has a poor record of assisting the unemployed on an individual basis back intoemployment. In the past, the payments-based unemployment benefit system focusedprimarily, though not exclusively, on delivering income support to those out of work. Findingajob was largely the responsibility of the unemployed themselves.
Report Prepared By:Tansey Webster Stewart & Company Ltd

8. Recent initiatives, most notably the National Action Plan on Employment, have adopted acasework approach to helping the unemployed back to work. This represents a major policydeparture and has required much greater co-operation and co-ordination between the benefitsystem (DSFCA) and the placement system (DETE/F AS).
9. The casework approach treats those on the Live Register as individuals and through aninterview process provides counselling, guidance, education and placement in jobs or intraining for those who attend. At present, it is confined to young people approaching sixmonths on the Live Register, but it will gradually be extended over 5 years to all those at riskto long-term unemployment.
10. This casework approach has resulted in significant flows off the Live Register amongst thetarget population. These outflows have resulted from a high placement rate amongst thoseattending interviews and significant levels of signing off amongst those who have notappeared for interview.
11. Given that ILO unemployment and numbers of Live Register claimants differ in essence andthat changes in each are shaped by different forces, it is unlikely that a full reconciliationbetween the two sets of figures will be achieved. In these circumstances, a more appropriateobjective would be to ensure that benefit claimants on the Live Register meet, on acontinuing basis, the statutory conditions for eligibility.
12. The casework approach embedded in the National Action Plan on Employment, even whenfullyoperational, will apply to a relatively small proportion of those on the Live Register. Ittargets only those at risk to long-term unemployment. However, the interview-basedapproach it has pioneered is susceptible to more general application.
13. To improve the chances of escape from unemployment for those on the Live Register, andparticularly for the long-term unemployed, we recommend the following proposal.Consideration should be given to the introduction of systematic and regular labour marketinterviews with all of those who have passed a given duration threshold on the Live Register.If the selected duration threshold were six months on the Live Register, then the proposalwould entail regular interviews with all of those on the LR for more than six months. Suchinterviews would focus on job search, work placements, improving employability andidentifyingappropriate supports for the unemployed person from the array of state training,placement and education interventions.
Report Prepared By:Tansey Webster Stewart & Company Ltd

14. This proposal represents an enhancement of, not a departure from, present policies. Inessence, it would build on the existing process by extending to the long-term unemployed thebenefits of the National Action Plan on Employment at present targeted only on those at riskto long-term unemployment. It would also meet the stated Government objective of
"finding a balance between the adoption of the preventative approach and at the same timeensuring that the needs of those who are already long-term unemployed continue to beaddressed".
15. The adoption of the proposal would have implications for resource allocation and for thestructure of the public employment service. Clearly, resources would need to be reallocatedto the deployment of additional caseworkers/placement staff and to the provision ofadditional training and education places for those seeking employability supports. With theextension to the longer-term unemployed, it would also require much closer co-operation andco-ordination between the two strands of the public employment service - the LES and FAS.Furthermore, the implementation of Guideline 1 of the National Action Plan suggests that theintroduction of systematic and regular interviews with those on the Live Register would yieldsavings to the Exchequer from increased LR outflows, many of them resulting from transfersto employment. The sharp falls in the numbers on the LR in the recent past now make theintroduction of such systematic and regular interviews a feasible proposition on a phasedbasis over a number of years.
16. It is difficult to justify the fact than an 18 year old can claim Unemployment Assistancewithout first having worked or having been required to avail of any of the education, training,work experience or job placement programmes specifically targeted at improving theemployability of young people.
Report Prepared By:Tansey Webster Stewart & Company Ltd