in lesson 3.1.1, you wrote rules for patterns found in x y x€¦ · in lesson 3.1.1, you wrote...
TRANSCRIPT
In Lesson 3.1.1, you wrote rules for patterns found in x → y tables. In this lesson, you will focus on using
variables to write algebraic rules for patterns and contextual situations. You will use a graph to help predict the
output for fractional x-values and will then use a rule to predict the output when the input is too large and does
not appear on the graph.
While working today, focus on these questions:
How can you write the rule without words?
What does x represent?
How can you make a prediction?
3-9. SILENT BOARD GAME
During Lesson 3.1.1, you created written rules for patterns
that had no tiles or numbers. You will now write algebraic
rules using a table of jumbled in/out numbers. Focus on
finding patterns and writing rules as you play the Silent Board
Game. Your teacher will put an incomplete x → y table on the
overhead or board. Study the input and output values and look
for a pattern. Then write the rule in words and symbols that
finds each y-value from its x-value.

3-10. JOHN'S GIANT REDWOOD, Part One
John found the data in the table below about his favorite redwood
tree. He wondered if he could use it to predict the height of the tree
at other points of time. Consider this as you analyze the data and
answer the questions below. Be ready to share (and justify) your
answers with the class.
a. How tall was the tree 2 years after it was planted? What
about 7 years after it was planted? How do you know?
b. How tall was the tree the year it was planted?
c. Estimate the height of the tree 50 years after it was planted.
How did you make your prediction?
3-11. John decided to find out more about his favorite redwood tree
by graphing the data.
a. On the Lesson 3.1.2B Resource Page provided by your
teacher, plot the points that represent the height of the tree
over time. What does the graph look like?
b. Does it make sense to connect the points? Explain your thinking.
c. According to the graph, what was the height of the tree 1.5 years after it was planted?
d. Can you use your graph to predict the height of the redwood tree 20 years after it was planted?
Why or why not?
3-12. John is still not satisfied. He wants to be able to predict the height
of the tree at any time after it was planted.
a. Find John's table on your resource page and extend it to include
the height of the tree in the 0th
year, 1st year, 2
nd year, and 6
th
year.
b. If you have not already, use the ideas from the Silent Board
Game to write an algebraic rule for the data in your table. Be
sure to work with your team and check that the rule works for all
of the data.
c. Use your rule to check your prediction in part (c) of problem 3-
10 for how tall the tree will be in its 50th
year. How close was
your prediction?
Number of Years after Planting 3 4 5
Height of Tree (in feet) 17 21 25
In the last two lessons, you examined several patterns and learned how to represent the patterns in a table and
with a rule. For the next few days, you will learn a powerful new way to represent a pattern and make
predictions.
As you work with your team today, use these focus questions to help direct your discussion:
What is the rule?
How can you represent the pattern?
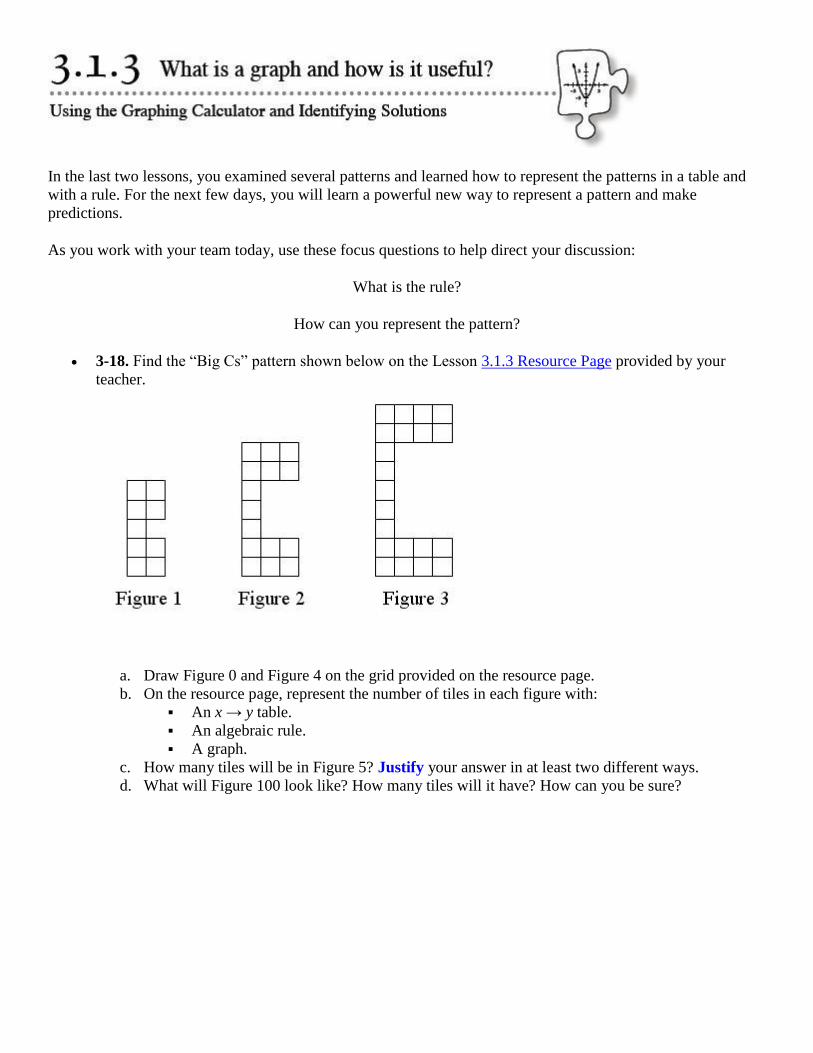
3-18. Find the “Big Cs” pattern shown below on the Lesson 3.1.3 Resource Page provided by your
teacher.
a. Draw Figure 0 and Figure 4 on the grid provided on the resource page.
b. On the resource page, represent the number of tiles in each figure with:
An x → y table.
An algebraic rule.
A graph.
c. How many tiles will be in Figure 5? Justify your answer in at least two different ways.
d. What will Figure 100 look like? How many tiles will it have? How can you be sure?
In Chapter 3 you studied different ways to represent patterns. You organized information into tables, graphed
information about patterns, and learned how to find the rules that govern specific patterns.
Starting today and continuing throughout this chapter, you will find connections between different
representations of the same pattern, explore each representation more deeply, and learn shorter ways to go from
one representation to another. By the end of this chapter, you will have a deeper understanding of many of the
most powerful tools of algebra.
4-1. TILE PATTERN TEAM CHALLENGE
Your teacher will assign your team a tile pattern (one of the patterns labeled
(a) through (e) on the next page). Your team's task is to create a poster
showing every way you can represent your pattern and highlighting all of the
connections between the representations that you can find. For this activity,
finding and showing the connections are the most important parts. Clearly presenting the connections between representations on your poster
will help you convince your classmates that your description of the pattern
makes sense.
Pattern Analysis:
o Extend the pattern: Draw Figures 0, 4, and 5. Then describe Figure 100. Give as much
information as you can. What will it look like? How will the tiles be arranged? How many tiles
will it have?
o Generalize the pattern by writing a rule that will give the number of tiles in any figure in the
pattern. Show how you got your answer.
o Find the number of tiles in each figure. Record your data in a table and on a graph.
o Demonstrate how the pattern grows using color, arrows, labels, and other math tools to help you
show and explain. Show growth in each representation.
o What connections do you see between the different representations (graph, figures, and x → y
table)? How can you show these connections?
Presenting the Connections: As a team, organize your work into a large poster that clearly shows each representation of your pattern,
as well as a description of Figure 100. When your team presents your poster to the class, you will need
to support each statement with a reason from your observations. Each team member must explain
something mathematical as part of your presentation.

In Lesson 4.1.1, you looked at four different ways of representing patterns and began to find connections
between them.
Throughout this chapter you will explore connections and find shortcuts between the representations. Today,
you will look for specific connections between geometric patterns and equations. As you work today, keep these
questions in mind:
How can you see growth in the rule?
How do you know your rule is correct?
What does the representation tell you?
What are the connections between the representations?
At the end of this lesson, put your work from today in a safe place,
because you will need to use it during Lesson 4.1.3!
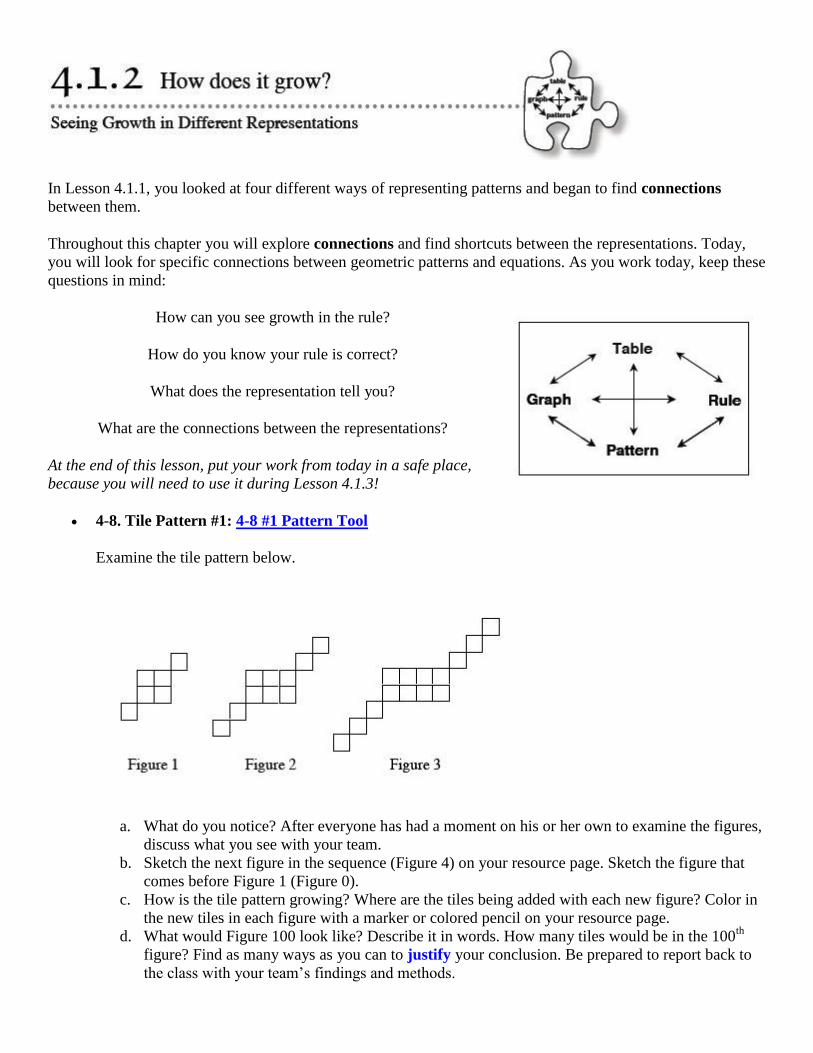
4-8. Tile Pattern #1: 4-8 #1 Pattern Tool
Examine the tile pattern below.
a. What do you notice? After everyone has had a moment on his or her own to examine the figures,
discuss what you see with your team.
b. Sketch the next figure in the sequence (Figure 4) on your resource page. Sketch the figure that
comes before Figure 1 (Figure 0).
c. How is the tile pattern growing? Where are the tiles being added with each new figure? Color in
the new tiles in each figure with a marker or colored pencil on your resource page.
d. What would Figure 100 look like? Describe it in words. How many tiles would be in the 100th
figure? Find as many ways as you can to justify your conclusion. Be prepared to report back to
the class with your team’s findings and methods.

4-9. Answer questions (a) through (d) from problem 4-8 for each of the patterns below. Use color to
shade in the new tiles on each pattern on your resource page. Choose one color for the new tiles in part
(a) and a different color for the new tiles in part (b).
a. Tile Pattern #2: 4-9 #2 Pattern Tool
b. Tile Pattern #3: 4-9 #3 Pattern Tool
4-10. PUTTING IT TOGETHER
Look back at the three different tile patterns in problems 4-8 and 4-9 to answer these questions.
a. What is the same and what is different between these three patterns? Explain in a few sentences.
b. Write an equation (rule) for the number of tiles in each pattern.
c. What connections do you see between your equations and the tile pattern? Show and explain
these connections.
d. Imagine that the team next to you created a new tile pattern that grows in the same way as the
ones you have just worked with, but they refused to show it to you. What other information
would you need in order to predict the number of tiles in Figure 100? Explain your reasoning.
In Lessons 4.1.2 and 4.1.3, you investigated connections between tile patterns, x → y tables, graphs, and rules
(equations). Today you will use your observations about growth and Figure 0 to write rules for linear patterns
and to create new tile patterns for given rules.
4-26. UNDERSTANDING y = mx + b
With your team, list some of the equations you have been working with in the past two lessons.
a. What do all of these rules have in common?
Rules for linear patterns can all be written in the form y = mx + b, where x and y represent
variables, but m and b represent constants (numbers that stay the same in the equation after they
are chosen). Discuss these questions with your team:
b. What does m tell you about the pattern?
c. What does b tell you about the pattern?
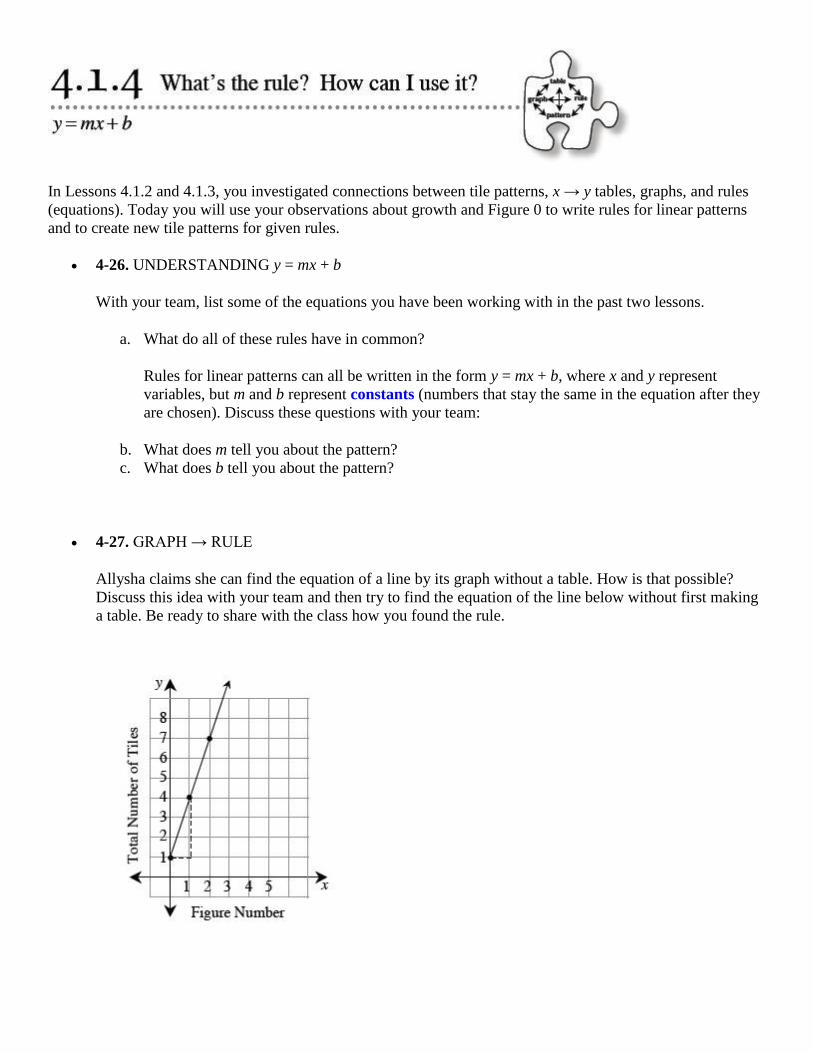
4-27. GRAPH → RULE
Allysha claims she can find the equation of a line by its graph without a table. How is that possible?
Discuss this idea with your team and then try to find the equation of the line below without first making
a table. Be ready to share with the class how you found the rule.
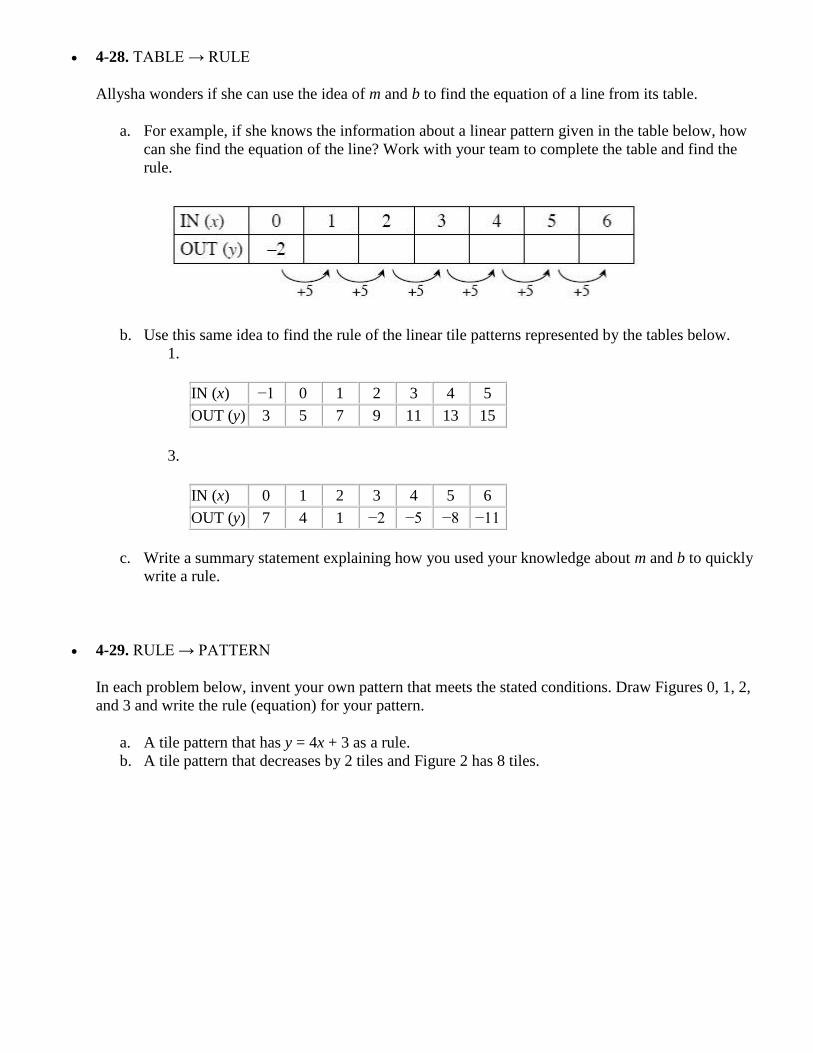
4-28. TABLE → RULE
Allysha wonders if she can use the idea of m and b to find the equation of a line from its table.
a. For example, if she knows the information about a linear pattern given in the table below, how
can she find the equation of the line? Work with your team to complete the table and find the
rule.
b. Use this same idea to find the rule of the linear tile patterns represented by the tables below.
1.
IN (x) −1 0 1 2 3 4 5
OUT (y) 3 5 7 9 11 13 15
3.
IN (x) 0 1 2 3 4 5 6
OUT (y) 7 4 1 −2 −5 −8 −11
c. Write a summary statement explaining how you used your knowledge about m and b to quickly
write a rule.
4-29. RULE → PATTERN
In each problem below, invent your own pattern that meets the stated conditions. Draw Figures 0, 1, 2,
and 3 and write the rule (equation) for your pattern.
a. A tile pattern that has y = 4x + 3 as a rule.
b. A tile pattern that decreases by 2 tiles and Figure 2 has 8 tiles.
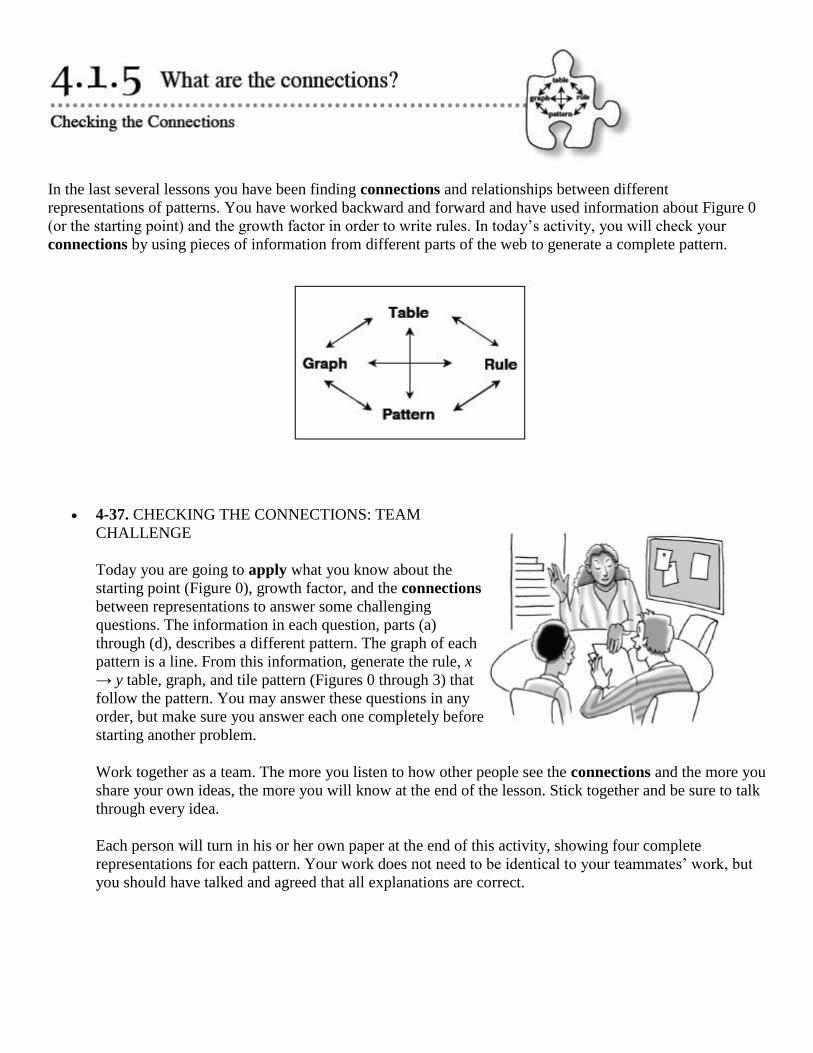
In the last several lessons you have been finding connections and relationships between different
representations of patterns. You have worked backward and forward and have used information about Figure 0
(or the starting point) and the growth factor in order to write rules. In today’s activity, you will check your
connections by using pieces of information from different parts of the web to generate a complete pattern.
4-37. CHECKING THE CONNECTIONS: TEAM
CHALLENGE
Today you are going to apply what you know about the
starting point (Figure 0), growth factor, and the connections
between representations to answer some challenging
questions. The information in each question, parts (a)
through (d), describes a different pattern. The graph of each
pattern is a line. From this information, generate the rule, x
→ y table, graph, and tile pattern (Figures 0 through 3) that
follow the pattern. You may answer these questions in any
order, but make sure you answer each one completely before
starting another problem.
Work together as a team. The more you listen to how other people see the connections and the more you
share your own ideas, the more you will know at the end of the lesson. Stick together and be sure to talk
through every idea.
Each person will turn in his or her own paper at the end of this activity, showing four complete
representations for each pattern. Your work does not need to be identical to your teammates’ work, but
you should have talked and agreed that all explanations are correct.
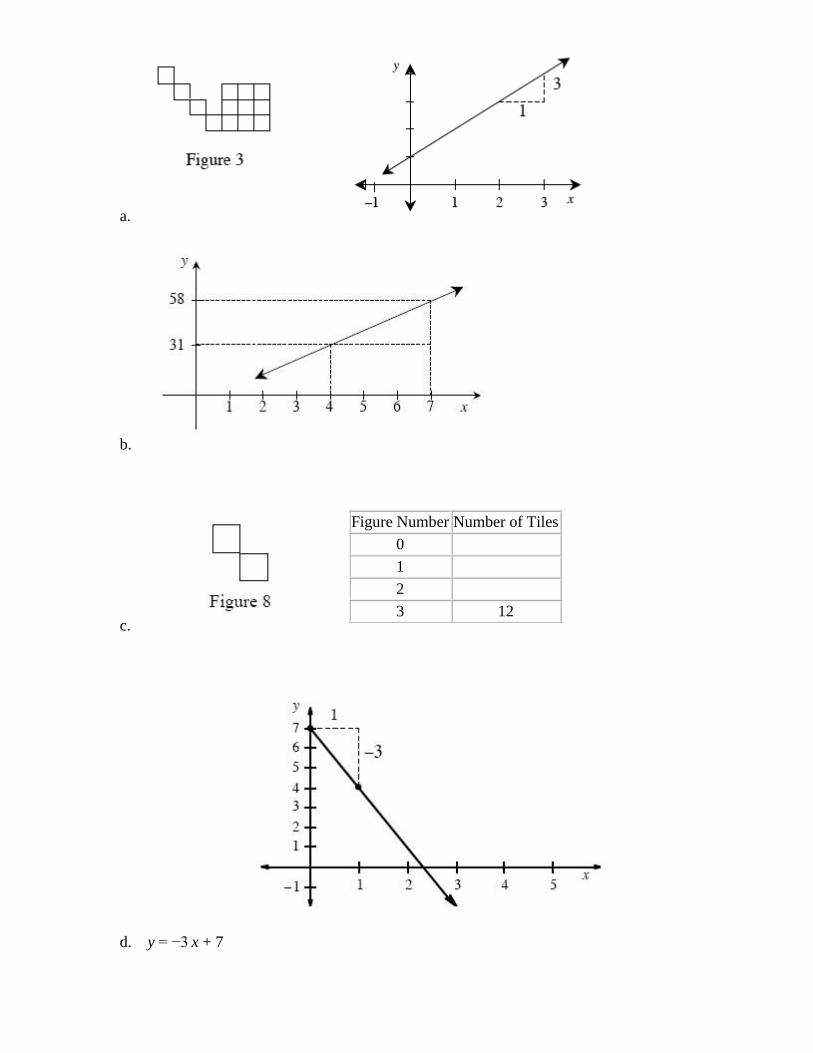
a.
b.
c.
d. y = −3 x + 7
Figure Number Number of Tiles
0
1
2
3 12
In Lesson 4.2.1, you discovered that the point of intersection of two lines or curves can have an important
meaning. Finding points of intersection is another strategy you can use to solve problems, especially those with
two quantities being compared.
Analyze the following situations using the multiple tools you have studied so
far.
4-76. BUYING BICYCLES
Latanya and George are saving up money because they both want to
buy new bicycles. Latanya opened a savings account with $50. She just
got a job and is determined to save an additional $30 a week. George
started a savings account with $75. He is able to save $25 a week.
Your Task: Use at least two different ways to find the time (in weeks)
when Latanya and George will have the same amount of money in their
savings accounts. Be prepared to share your methods with the class.