in millions of € unless otherwise specified · in millions of € unless otherwise specified 6...
TRANSCRIPT


2
in millions of € unless otherwise specified
6 months 2017 6 months 2016 Change in % Change in % cc1
Sales Revenue and Order Intake
Sales revenue 546.7 508.8 7.5 6.7
Order intake 583.0 558.8 4.3 3.5
Results
EBITDA2 147.4 136.4 8.1
EBITDA margin2 in % 27.0 26.8
Net profit3 89.7 83.5 7.4
Financial Data Share
Earnings per share3 0.97 0.91 7.4
June 30, 2017 December 31, 2016
Balance Sheet | Financials
Balance sheet total 1,341.7 1,195.8
Equity 803.5 763.6
Equity ratio in % 59.9 63.9
Net debt 166.9 67.6
Ratio of net debt to underlying EBITDA 0.6 0.2
Key Figures for the Second Quarter of 20174
in millions of € unless otherwise specified
2nd Quarter 2017 2nd Quarter 2016 Change in % Change in % cc1
Sales Revenue and Order Intake
Sales revenue 277.9 263.0 5.7 5.7
Order intake 280.9 284.7 –1.3 –1.6
Results
EBITDA2 75.5 71.8 5.2
EBITDA margin2 in % 27.2 27.3
Net profit3 45.7 44.1 3.8
Financial Data Share
Earnings per share3 0.50 0.48 3.7
1 cc = in constant currencies 2 Underlying EBITDA = earnings before interest, taxes, depreciation and amortization, and adjusted for extraordinary items 3 Underlying net profit = net profit after non-controlling interest; adjusted for extraordinary items, amortization and based on
a normalized financial result and tax rate 4 Figures are not audited or reviewed
Key Figures for the First Half of 2017
3
Sector EnvironmentThe Sartorius Stedim Biotech Group serves customers mainly in the biopharmaceutical industry. Thus, the development of this industry provides important impulses to the Group’s business performance.
Continued Positive Sector Development
The international market research institute IMS Health estimates that the global pharmaceutical market has grown annually by around 6% on average over the past five years. The main growth drivers were the availability of innovative new medications, improved access to healthcare – in part through the expansion of state healthcare systems – besides the continuously growing and aging world population.
The market for medications manufactured using biotech methods has been expanding overproportionately for many years within the global pharmaceutical market. This is primarily attributable to a high number of new drug approvals and additional market penetration by existing biologics. Overall, the share sales revenue generated by medications manufactured using biotech methods relative to total pharmaceuticals market rose from around 20% in 2012 to approximately 25% in 2016.
Biosimilars, or biological copycat medications, have played only a minor role to date in the growth of the biotechnology market. However, the industry has recently made significant progress in the important U.S. market, which develops somewhat delayed compared to the biosimilars markets in Europe and Asia. So far, five biosimilars have been approved by the FDA, the U.S. health authority, following the first market authorization of a biosimilar in 2015 based on an abbreviated approval procedure.
Sources: IMS Health: Outlook for Global Medicines through 2021,
December 2016; EvaluatePharma: World Preview 2017, Outlook to
2022, June 2017; www.biologicsblog.com, May 19, 2017.
4
– Robust development in light of normalized market growth
– Portfolio further enhanced through acquisition of Umetrics
– Forecast for the full year of 2017 confirmed
Robust Performance Given Normalized Market Growth
In the period under review, dynamics of the market served by the Sartorius Stedim Biotech Group returned to normal rates as expected, after two years of extraordinarily strong, above-average growth.
Sales Revenue and Order Intake
in millions of € 6 months 2017
6 months 2016
in % Δ in % cc1
Sales revenue 546.7 508.8 7.5 6.7
Order intake 583.0 558.8 4.3 3.5
1 cc= in constant currencies
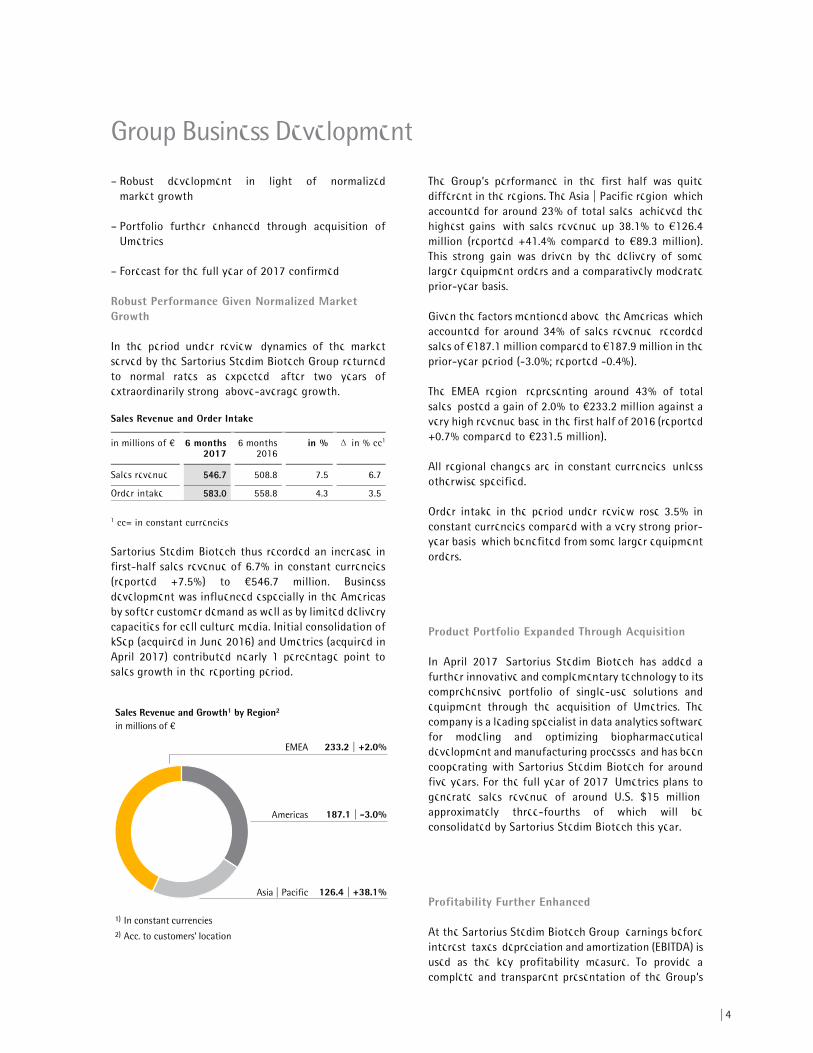
Sartorius Stedim Biotech thus recorded an increase in first-half sales revenue of 6.7% in constant currencies (reported +7.5%) to €546.7 million. Business development was influenced especially in the Americas by softer customer demand as well as by limited delivery capacities for cell culture media. Initial consolidation of kSep (acquired in June 2016) and Umetrics (acquired in April 2017) contributed nearly 1 percentage point to sales growth in the reporting period.
The Group’s performance in the first half was quite different in the regions. The Asia | Pacific region, which accounted for around 23% of total sales, achieved the highest gains, with sales revenue up 38.1% to €126.4 million (reported +41.4% compared to €89.3 million). This strong gain was driven by the delivery of some larger equipment orders and a comparatively moderate prior-year basis.
Given the factors mentioned above, the Americas, which accounted for around 34% of sales revenue, recorded sales of €187.1 million compared to €187.9 million in the prior-year period (-3.0%; reported -0.4%).
The EMEA region, representing around 43% of total sales, posted a gain of 2.0% to €233.2 million against a very high revenue base in the first half of 2016 (reported +0.7% compared to €231.5 million).
All regional changes are in constant currencies, unless otherwise specified.
Order intake in the period under review rose 3.5% in constant currencies compared with a very strong prior-year basis, which benefited from some larger equipment orders.
Product Portfolio Expanded Through Acquisition
In April 2017, Sartorius Stedim Biotech has added a further innovative and complementary technology to its comprehensive portfolio of single-use solutions and equipment through the acquisition of Umetrics. The company is a leading specialist in data analytics software for modeling and optimizing biopharmaceutical development and manufacturing processes, and has been cooperating with Sartorius Stedim Biotech for around five years. For the full year of 2017, Umetrics plans to generate sales revenue of around U.S. $15 million, approximately three-fourths of which will be consolidated by Sartorius Stedim Biotech this year.
Profitability Further Enhanced
At the Sartorius Stedim Biotech Group, earnings before interest, taxes, depreciation and amortization (EBITDA) is used as the key profitability measure. To provide a complete and transparent presentation of the Group’s
Group Business Development

5
profitability, SSB reports earnings adjusted for extraordinary items (underlying EBITDA).
In the first half of 2017, Sartorius Stedim Biotech’s underlying EBITDA increased by 8.1% from €136.4 million to €147.4 million. Driven by economies of scale, the Group’s earnings margin rose from 26.8% to 27.0%.
Reconciliation between EBIT and underlying EBITDA
in millions of € 6 months 2017
6 months 2016
Δ in %
EBIT 115.6 110.3 4.8
Extraordinary items 6.9 4.8 44.0
Depreciation & Amortization 24.8 21.2 16.9
Underlying EBITDA 147.4 136.4 8.1
Extraordinary items for the reporting period amounted to -€6.9 million (H1 2016 -€4.8 million) and were related to various corporate projects. Consolidated EBIT, including extraordinary items, depreciation and amortization, grew from €110.3 million to €115.6 million; the EBIT margin reached 21.2% compared to 21.7% a year earlier.
The financial result of the Sartorius Stedim Biotech Group was -€2.6 million in the first half of 2017 relative to -€2.1 million a year earlier. This change was mainly driven by higher interest expenses as a result of the recent acquisition.
In the period under review, the net profit attributable to shareholders of Sartorius Stedim Biotech S.A. rose by 4.8% from €75.7 million to €79.4 million.
Underlying Net Profit up by 7.4%
The underlying net profit after non-controlling interest increased by 7.4% from €83.5 million to €89.7 million. This profit figure is calculated by adjusting for extraordinary items, eliminating non-cash amortization and valuation adjustments from hedging instruments, and is based on the normalized financial result, as well as the corresponding tax effects for each of these items. Underlying earnings per share correspondingly rose to €0.97 from €0.91.
in millions of € 6 months 2017
6 months 2016
EBIT (operating result) 115.6 110.3
Extraordinary effects 6.9 4.8
Amortization | IFRS 3 8.1 7.0
Normalized financial result1) –3.3 –2.9
Normalized income tax (2017: 28%, 2016: 29%)2) –35.7 –34.6
Underlying net result 91.7 84.6
Non-controlling interest –2.1 –1.1
Underlying net result after non-controlling interest 89.7 83.5
Underlying earnings per share (in €) 0.97 0.91
1) Financial result excluding fair value adjustments of hedging instruments, as well as currency effects from foreign currency loans
2) Underlying income tax, based on the underlying profit before taxes and non-cash amortization
Robust Cash Flow Performance
In the first half of 2017, the Sartorius Stedim Biotech Group reported a net cash flow from operating activities of €56.0 million relative to €43.3 million a year ago. This gain was primarily driven by higher earnings and lower tax payments compared to the previous year. The increase in net working capital was largely driven by sales growth.
Net cash flow from investing activities was -€49.0 million, up from the year-earlier figure of -€32.1 million, as planned. This increase mainly reflects investments for the expansion of our Yauco plant for single-use bags and filters as well as additional membrane casting capacities at the Goettingen site. Thus, the Sartorius Stedim Biotech Group financed its operational investments entirely from operating cash flows. The ratio of capital expenditures relative to sales in the first half of 2017 rose to 10.8% (previous year: 6.6%).
Net cash flow from investing activities and acquisitions was -€117.1 million compared with the prior-year figure of -€32.1 million, reflecting the acquisition of Umetrics in April 2017.
Financial Position Remains Very Strong
The balance sheet total for the Sartorius Stedim Biotech Group rose to €1,341.7 million as of the period ended June 30, 2017, from €1,195.8 million as of December 31, 2016. This rise was primarily due to the acquisition of Umetrics and investments into our manufacturing capacities.

6
Equity increased from €763.6 million to €803.5 million between December 31, 2016, and the reporting date. At 59.9%, the equity ratio remained at a comfortable level (63.9% as of December 31, 2016).
Gross debt rose from €102.3 million as of December 31, 2016, to €199.9 million as of June 30, 2017, largely due to the acquisition mentioned above. Net debt amounted to €166.9 million relative to €67.6 million as of December 31, 2016.
The ratio of net debt to underlying EBITDA based on the past 12 months was at 0.6 compared with 0.2 at year-end 2016.
Personnel Further Increased
As of June 30, 2017, the Sartorius Stedim Biotech Group employed a total of 4,975 people worldwide. Compared with December 31, 2016, headcount thus rose by 250 or around 5%. This figure includes 34 people from the acquisition of Umetrics. From a regional perspective, the strongest increase was attributed to the Americas region, where the Group increased its staff by around 7%.

7
The opportunities and risk situation of the Sartorius Stedim Biotech Group has not materially changed since the publication of its 2016 Annual Report. For this reason, please refer to a detailed description of the opportunities and risks as well as the risk management system for the Sartorius Stedim Biotech Group on pp. 53 et seq. of the Annual Report called Reference Document 2016.
Forecast Report
Continued Positive Sector Environment
The trends described on pages 62-63 of our 2016 Annual Report have remained unchanged with respect to their impacts on the development of the Sartorius Stedim Biotech Group.
Most recent estimates project that the global pharmaceutical market will grow at a compound annual growth rate of 4% to 7% during the period of 2016 to 2021. For the biopharma sub-segment, market observers continue to expect above-average annual growth of around 9% on average. This growth will be driven largely by the increasing penetration of biopharmaceuticals already approved and an expansion of their indications, as well as by strong research and development pipelines.
Sources: IMS Health: Outlook for Global Medicines through
2021, December 2016; May 2017; EvaluatePharma: World
Preview 2017, Outlook to 2022, June 2017
Full-Year 2017 Guidance Confirmed
Management of the Sartorius Stedim Biotech Group confirms its forecast for the full year of 2017.
Sales revenue is thus forecasted to increase by about 8% to 12% in constant currencies, which includes a good 1 percentage point of growth related to the acquisitions of kSep and Umetrics. With regard to delivery capacities for cell culture media, the company assumes that the supply situation will normalize in the course of the third quarter of 2017.
The underlying EBITDA margin is still expected to rise about 0.5 percentage points in constant currencies compared with the prior-year figure of 27.5%.
Sartorius Stedim Biotech continues to plan on investing about 10% to 13% of sales in the current year, mainly in the expansion of production capacities.
Regarding its financial position, the Group expects that the ratio of net debt to underlying EBITDA at the end of 2017, including the acquisition of Umetrics, will be slightly above the level of 0.2 reported for year-end 2016. Any potential further acquisitions are not reflected in this guidance.
Report on Subsequent Events
No material events occurred after the end of the first half of 2017.
Opportunity and Risk Report

8
2nd quarter 2017
¤ in mn1
2nd quarter 2016
€ in mn1
6 months 2017
¤ in mn
6 months 2016
€ in mn
Sales revenue 277.9 263.0 546.7 508.8
Cost of sales –138.8 –131.7 –270.3 –252.0
Gross profit on sales 139.2 131.3 276.4 256.8Selling and distribution costs –49.6 –47.1 –98.7 –92.8
Research and development costs –13.6 –12.5 –26.5 –24.1
General administrative expenses –15.5 –13.4 –31.6 –26.8
Other operating income and expenses –2.6 1.1 –4.0 –2.8
Earnings before interest & taxes (EBIT) 57.9 59.5 115.6 110.3
Financial income 1.4 1.4 2.3 5.0
Financial expenses –2.7 –4.8 –4.8 –7.1
Financial result –1.3 –3.4 –2.6 –2.1
Profit before tax 56.6 56.1 113.1 108.2Income taxes –15.8 –16.3 –31.7 –31.4
Net profit for the period 40.7 39.8 81.4 76.9
Attributable to:
Shareholders of Sartorius Stedim Biotech 39.6 39.3 79.4 75.7
Non-controlling interest 1.1 0.5 2.1 1.1
Earnings per share (€) 0.43 0.43 0.86 0.82
Diluted earnings per share (€) 0.43 0.43 0.86 0.82
1) Data not audited or reviewed
Statement of Profit or Loss and Other Comprehensive Income
9
2nd quarter 2017
¤ in mn1
2nd quarter 2016
€ in mn1
6 months 2017
¤ in mn
6 months 2016
€ in mn
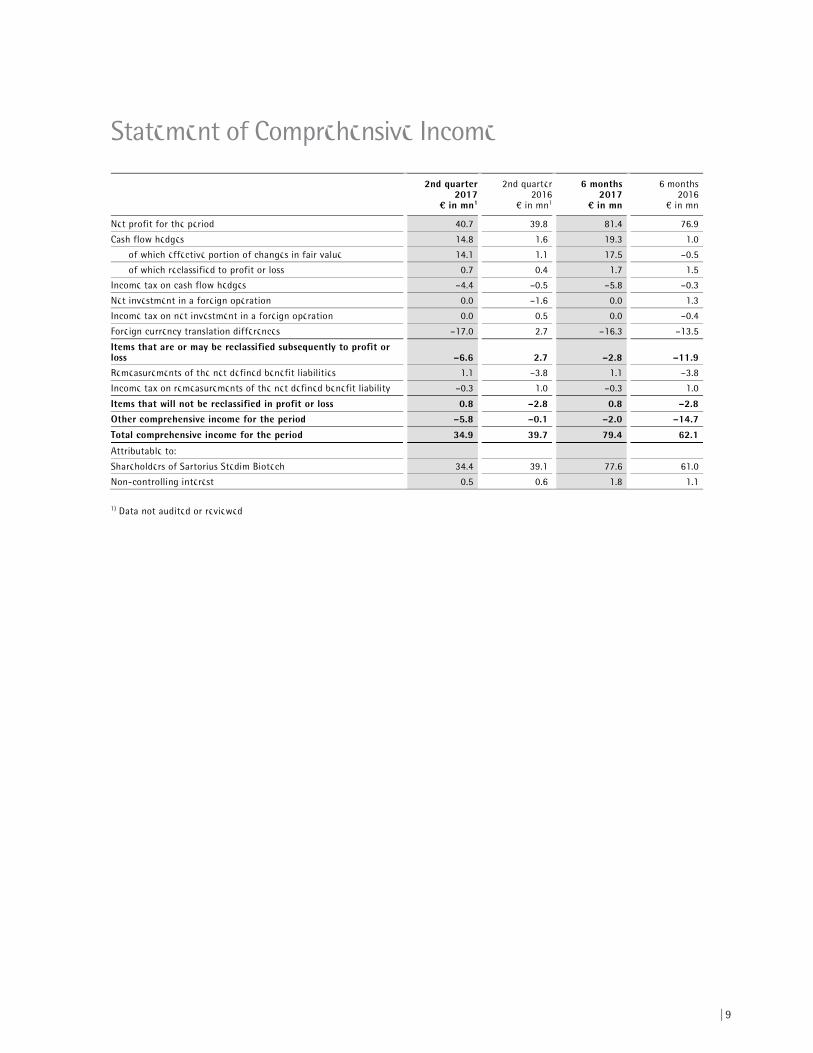
Net profit for the period 40.7 39.8 81.4 76.9
Cash flow hedges 14.8 1.6 19.3 1.0
of which effective portion of changes in fair value 14.1 1.1 17.5 –0.5
of which reclassified to profit or loss 0.7 0.4 1.7 1.5
Income tax on cash flow hedges –4.4 –0.5 –5.8 –0.3
Net investment in a foreign operation 0.0 –1.6 0.0 1.3
Income tax on net investment in a foreign operation 0.0 0.5 0.0 –0.4
Foreign currency translation differences –17.0 2.7 –16.3 –13.5
Items that are or may be reclassified subsequently to profit or loss –6.6 2.7 –2.8 –11.9Remeasurements of the net defined benefit liabilities 1.1 –3.8 1.1 –3.8
Income tax on remeasurements of the net defined benefit liability –0.3 1.0 –0.3 1.0
Items that will not be reclassified in profit or loss 0.8 –2.8 0.8 –2.8Other comprehensive income for the period –5.8 –0.1 –2.0 –14.7
Total comprehensive income for the period 34.9 39.7 79.4 62.1
Attributable to:
Shareholders of Sartorius Stedim Biotech 34.4 39.1 77.6 61.0
Non-controlling interest 0.5 0.6 1.8 1.1
1) Data not audited or reviewed
Statement of Comprehensive Income
10
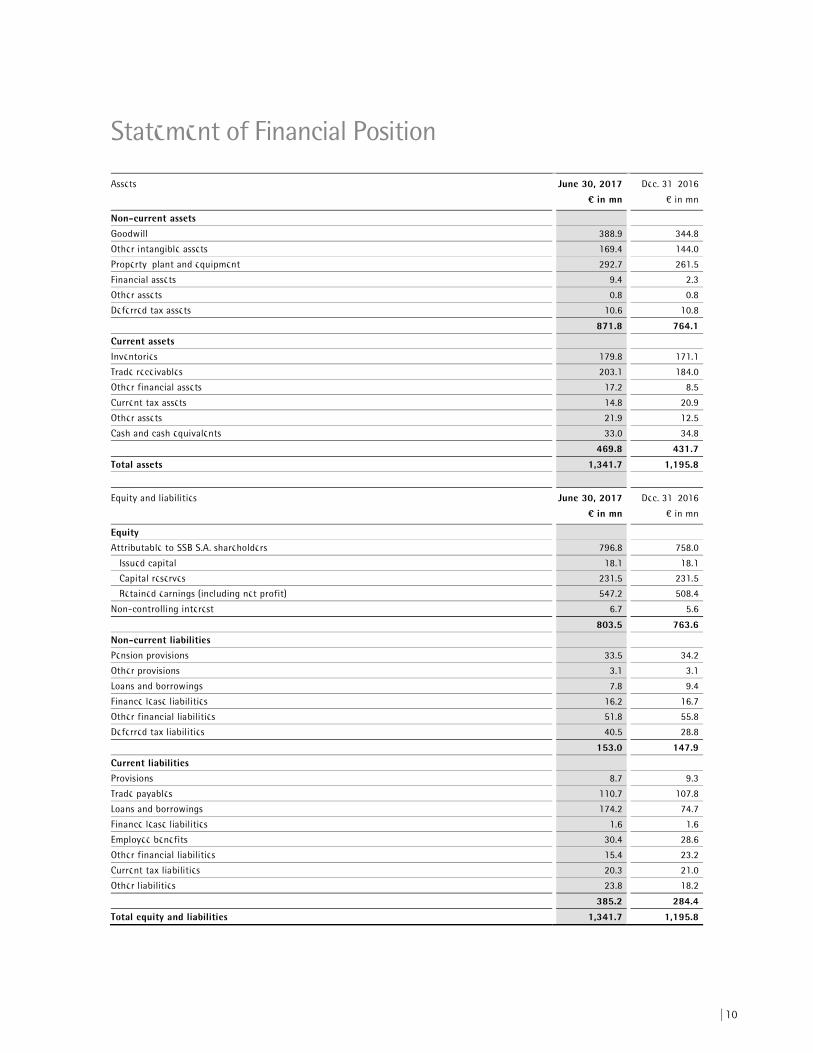
Assets June 30, 2017 Dec. 31, 2016
¤ in mn € in mn
Non-current assets
Goodwill 388.9 344.8
Other intangible assets 169.4 144.0
Property, plant and equipment 292.7 261.5
Financial assets 9.4 2.3
Other assets 0.8 0.8
Deferred tax assets 10.6 10.8
871.8 764.1Current assets Inventories 179.8 171.1
Trade receivables 203.1 184.0
Other financial assets 17.2 8.5
Current tax assets 14.8 20.9
Other assets 21.9 12.5
Cash and cash equivalents 33.0 34.8
469.8 431.7
Total assets 1,341.7 1,195.8
Equity and liabilities June 30, 2017 Dec. 31, 2016
¤ in mn € in mn
Equity Attributable to SSB S.A. shareholders 796.8 758.0
Issued capital 18.1 18.1
Capital reserves 231.5 231.5
Retained earnings (including net profit) 547.2 508.4
Non-controlling interest 6.7 5.6
803.5 763.6Non-current liabilities Pension provisions 33.5 34.2
Other provisions 3.1 3.1
Loans and borrowings 7.8 9.4
Finance lease liabilities 16.2 16.7
Other financial liabilities 51.8 55.8
Deferred tax liabilities 40.5 28.8
153.0 147.9
Current liabilities Provisions 8.7 9.3
Trade payables 110.7 107.8
Loans and borrowings 174.2 74.7
Finance lease liabilities 1.6 1.6
Employee benefits 30.4 28.6
Other financial liabilities 15.4 23.2
Current tax liabilities 20.3 21.0
Other liabilities 23.8 18.2
385.2 284.4
Total equity and liabilities 1,341.7 1,195.8
Statement of Financial Position
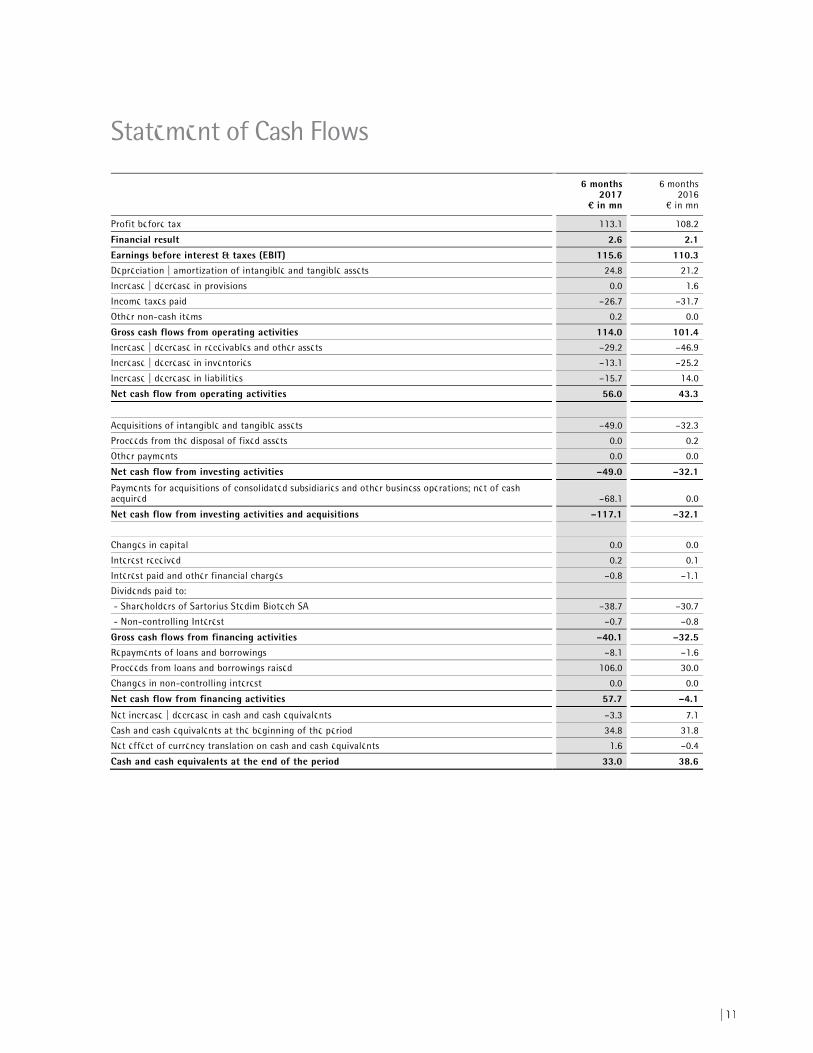
11
6 months 2017
¤ in mn
6 months 2016
€ in mn
Profit before tax 113.1 108.2
Financial result 2.6 2.1
Earnings before interest & taxes (EBIT) 115.6 110.3Depreciation | amortization of intangible and tangible assets 24.8 21.2
Increase | decrease in provisions 0.0 1.6
Income taxes paid –26.7 –31.7
Other non-cash items 0.2 0.0
Gross cash flows from operating activities 114.0 101.4Increase | decrease in receivables and other assets –29.2 –46.9
Increase | decrease in inventories –13.1 –25.2
Increase | decrease in liabilities –15.7 14.0
Net cash flow from operating activities 56.0 43.3
Acquisitions of intangible and tangible assets –49.0 –32.3
Proceeds from the disposal of fixed assets 0.0 0.2
Other payments 0.0 0.0
Net cash flow from investing activities –49.0 –32.1
Payments for acquisitions of consolidated subsidiaries and other business operations; net of cash acquired –68.1 0.0
Net cash flow from investing activities and acquisitions –117.1 –32.1
Changes in capital 0.0 0.0
Interest received 0.2 0.1
Interest paid and other financial charges –0.8 –1.1
Dividends paid to:
- Shareholders of Sartorius Stedim Biotech SA –38.7 –30.7
- Non-controlling Interest –0.7 –0.8
Gross cash flows from financing activities –40.1 –32.5Repayments of loans and borrowings –8.1 –1.6
Proceeds from loans and borrowings raised 106.0 30.0
Changes in non-controlling interest 0.0 0.0
Net cash flow from financing activities 57.7 –4.1
Net increase | decrease in cash and cash equivalents –3.3 7.1
Cash and cash equivalents at the beginning of the period 34.8 31.8
Net effect of currency translation on cash and cash equivalents 1.6 –0.4
Cash and cash equivalents at the end of the period 33.0 38.6
Statement of Cash Flows

12
Statement of Changes in Equity
€ in millions Issued
capitalCapital
reservesHedging reserves
Pension reserves
Retained earnings
Foreign currency
trans-lation
reservesGroup equity
Non-control-
ling interest
Total equity
Balance at Jan. 1, 2016 15.4 235.2 –3.3 –9.5 367.9 35.7 641.4 5.8 647.2Net profit for the period 0.0 0.0 0.0 0.0 75.7 0.0 75.7 1.1 76.9
Cash flow hedges 0.0 0.0 1.0 0.0 0.0 0.0 1.0 0.0 1.0
Remeasurements of the net defined benefit liabilities 0.0 0.0 0.0 –3.8 0.0 0.0 –3.8 0.0 –3.8
Foreign currency translation differences 0.0 0.0 0.0 0.0 0.0 –13.5 –13.5 0.0 –13.5
Net investment in a foreign operation 0.0 0.0 0.0 0.0 1.3 0.0 1.3 0.0 1.3
Deferred taxes 0.0 0.0 –0.3 1.0 –0.4 0.0 0.3 0.0 0.3
Other comprehensive income for the period 0.0 0.0 0.7 –2.8 0.9 –13.5 –14.7 0.0 –14.7Total comprehensive income for the period 0.0 0.0 0.7 –2.8 76.6 –13.5 61.0 1.1 62.1Stock options 0.0 0.0 0.0 0.0 0.0 0.0 0.0 0.0 0.0
Dividends 0.0 0.0 0.0 0.0 –30.7 0.0 –30.7 –0.8 –31.5
Capital Increase 2.9 –3.7 0.0 0.0 0.0 0.0 –0.8 0.0 –0.8
Other changes in equity 0.0 0.0 0.0 0.0 0.1 0.0 0.1 0.0 0.1
Balance at June 30, 2016 18.3 231.5 –2.6 –12.4 413.9 22.3 671.0 6.1 677.2
Balance at Jan. 1, 2017 18.1 231.5 –7.0 –11.0 490.3 36.1 758.0 5.6 763.6Net profit for the period 0.0 0.0 0.0 0.0 79.4 0.0 79.4 2.1 81.4
Cash flow hedges 0.0 0.0 19.3 0.0 0.0 0.0 19.3 0.0 19.3
Remeasurements of the net defined benefit liabilities 0.0 0.0 0.0 1.1 0.0 0.0 1.1 0.0 1.1
Foreign currency translation differences 0.0 0.0 0.0 0.0 0.0 –16.1 –16.1 –0.2 –16.3
Deferred taxes 0.0 0.0 –5.8 –0.3 0.0 0.0 –6.1 0.0 –6.1
Other comprehensive income for the period 0.0 0.0 13.5 0.8 0.0 –16.1 –1.8 –0.2 –2.0
Total comprehensive income for the period 0.0 0.0 13.5 0.8 79.4 –16.1 77.6 1.8 79.4Dividends 0.0 0.0 0.0 0.0 –38.7 0.0 –38.7 –0.7 –39.4
Balance at June 30, 2017 18.1 231.5 6.5 –10.2 530.9 20.0 796.8 6.7 803.5
13
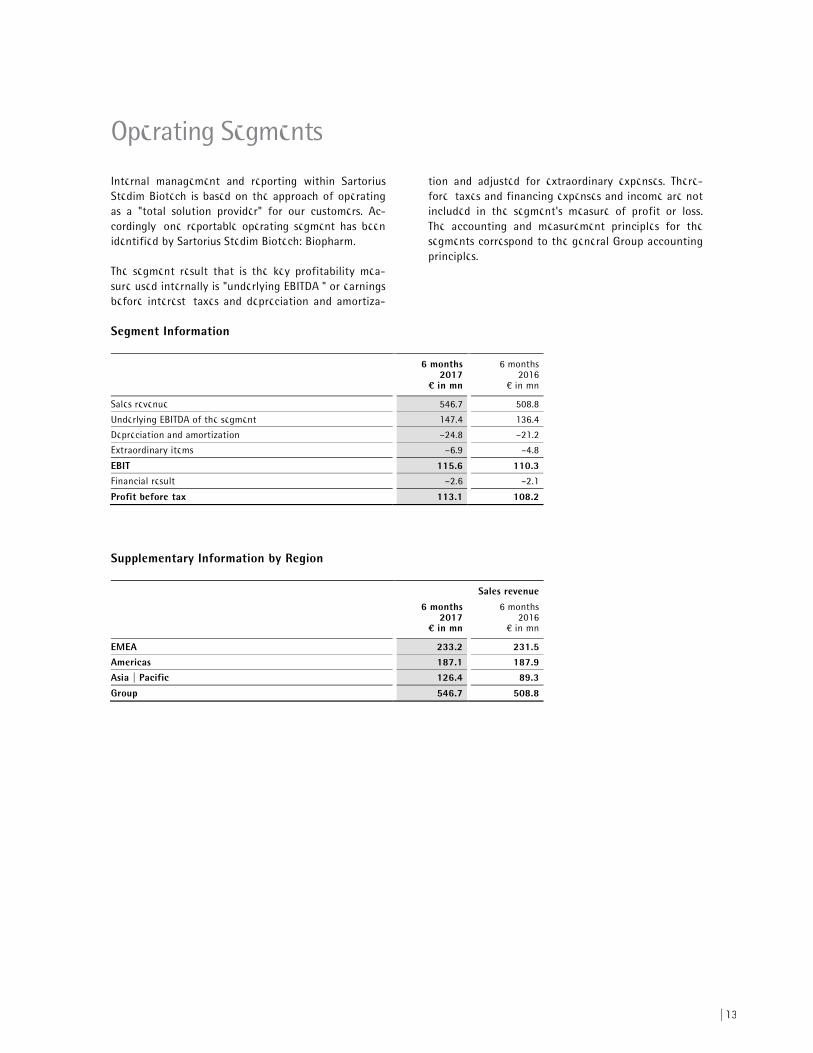
Internal management and reporting within Sartorius Stedim Biotech is based on the approach of operating as a "total solution provider" for our customers. Ac-cordingly, one reportable operating segment has been identified by Sartorius Stedim Biotech: Biopharm.
The segment result that is the key profitability mea-sure used internally is "underlying EBITDA," or earnings before interest, taxes and depreciation and amortiza-
tion and adjusted for extraordinary expenses. There-fore, taxes and financing expenses and income are not included in the segment's measure of profit or loss. The accounting and measurement principles for the segments correspond to the general Group accounting principles.
Segment Information
6 months 2017
¤ in mn
6 months 2016
€ in mn
Sales revenue 546.7 508.8
Underlying EBITDA of the segment 147.4 136.4
Depreciation and amortization –24.8 –21.2
Extraordinary items –6.9 –4.8
EBIT 115.6 110.3Financial result –2.6 –2.1
Profit before tax 113.1 108.2
Supplementary Information by Region
Sales revenue
6 months 2017
¤ in mn
6 months 2016
€ in mn
EMEA 233.2 231.5Americas 187.1 187.9Asia | Pacific 126.4 89.3
Group 546.7 508.8
Operating Segments
14
1. Reporting Entity
Sartorius Stedim Biotech is a leading provider of cutting-edge equipment and services for the development, quality assurance and production processes of the pharmaceutical industry. Its integrated solutions covering fermentation, filtration, purification, fluid manage-ment, cell culture media and lab technologies are supporting the biopharmaceutical industry around the world to develop and produce drugs safely, timely and economically. For next-generation processes, Sartorius Stedim Biotech focuses on single-use technologies and added-value services to meet and define the rapidly changing technology requirements of the industry it serves. Strongly rooted in the scientific community and closely allied with customers and technology partners, the company is dedicated to its philosophy of “Turning science into solutions.”
Headquartered in Aubagne, France, Sartorius Stedim Biotech is listed on the Euronext Paris (ISIN code: FR 0013154002).
The interim condensed consolidated financial statements of the Group for the period from January 1, 2017, to June 30, 2017, were authorized for issue by the Board of Directors on July 18, 2017.
2. Basis of Accounting
The interim consolidated financial statements of the Sartorius Stedim Biotech Group for the period ended June 30, 2017, were prepared in accordance with IAS 34 "Interim financial reporting.” They do not in-clude all the information required for a complete set of IFRS financial statements and must be read in rela-tion to the consolidated annual financial statements of the Sartorius Stedim Biotech Group for the year ended December 31, 2016. However, selected explana-tory notes are included to explain events and transac-tions that are significant to an understanding of the changes in the Group's financial position and perfor-mance since the last annual consolidated financial statements for the year ended December 31, 2016.
The accounting principles retained for preparing the consolidated half-year statements are in conformity with the IFRS Standards and Interpretations as adopted by the European Union on June 30, 2017, and are available on the website:
https://ec.europa.eu/commission/index_fr
The accounting principles applied are identical to those used to prepare the annual consolidated financial statements for the year ended December 31, 2016.
The Reference Document 2016 provides a list of sub-sidiaries (see page 130). Sartorius Stedim Data Analyt-ics AB was included in the scope of consolidation as of April 3, 2017. This addition is a result of an acquisition, which is described in Section 5.
For calculation of income tax expenses, the provisions of IAS 34.30c) were adopted; i.e., the best estimate of the weighted average annual income tax rate expected for the full financial year was applied (28%).
3. Use of Judgments and Estimates
In preparing these interim financial statements, man-agement has made judgments, estimates and assump-tions that affect the application of accounting policies and the reported amounts of assets and liabilities, income and expenses. Actual results may differ from these estimates.
The significant judgments made by management in applying the Group's accounting policies and the key sources of estimation uncertainty were the same as those applied to the consolidated financial statements for the year ended December 31, 2016.
4. Initial Application of New Standards
The Group did not yet apply the following new ac-counting rules that were not yet mandatory for the reporting period:
– Annual Improvements to IFRSs 2014-2016 Cycle – Amendments to IFRS 12
– Amendments to IAS 12, Recognition of Deferred Tax Assets for Unrealised Losses
– Amendments to IAS 7, Disclosure Initiative
The initial application of the standards is not expected to have a material impact on the Group's financial statements.
The following amendments will be applicable in 2018 and 2019, respectively:
Notes to the Interim Financial Statements

15
IFRS 15, Revenue from Contracts with Customers, defines a comprehensive framework for determining whether, in which amount and at which point in time revenue is to be recognized. This standard replaces the existing guidance for revenue recognition, including IAS 18, Revenue; IAS 11, Construction contracts; and IFRIC 13, Customer Loyalty Programmes.
The Group is currently conducting a project to analyze the effects of the application of the new standard in the future. At this time, the Group does not expect any material changes regarding the amount and tim-ing of revenue for the major part of the Group's busi-ness. However, especially in the case of construction contracts that are currently accounted for under IAS 11, the timing of revenue recognition may change as a result of the new criteria of IFRS 15 for revenue recognition over time.
At the current stage of analysis, the Group does not expect full retrospective application of the new stand-ard. Instead, the Group plans to recognize the cumula-tive effect of applying IFRS 15 at the date of initial application as an adjustment to the opening balance of equity. Furthermore, at initial application, the Group expects to apply IFRS 15 only to contracts that are not considered completed contracts at the date of initial application.
IFRS 9, Financial Instruments, replaces the existing guidelines in IAS 39, Financial instruments: recognition and measurement. IFRS 9 includes revised guidelines for classification and measurement of financial in-struments, including a new model of expected credit losses for the calcuation of impairments of financial assets, as well as the new general guidelines for hedge accounting. This standard also adopts the guidance of IAS 39 for recognition and derecognition of financial instruments.
The Group is currently conducting a project to analyze the effects of application of the new standard in the future. At the current stage of analysis, there are no findings that are contrary to the information provided in the Notes to the Consolidated Finanical Statements for the year ended December 31, 2016.
The application of IFRS 16, Leases, is mandatory for periods from 2019 onwards. IFRS 16 introduces a standardized accounting model according to which leases are generally to be recognized on the lessee's balance sheet. A lessee recognizes a right-of-use asset representing its right to use a lease asset, as well as a liability resulting from the lease, which represents its obligation to make lease payments. There are exemp-tions for short-term leases and leases of low-value assets. Accounting for the lessor is comparable to that
of the current standard; i.e., lessors continue to classi-fy leases as financial or operating leases.
The Group has started to analyze the effects of this new standard and does not plan to apply the standard earlier than 2019. At the current stage of analysis, the Group plans to use the exemptions for short-term leases and leases of low-value assets and to recognize the corresponding lease payments as an expense gen-erally on a straigt-line basis over the particular lease term.
IFRS 16 will likely lead to an increase in fixed assets and financial liabilities. Based on its present level of knowledge, the Group does not expect any significant impact overall on its most important key figures, such as equity ratio or underlying EBITDA. For example, on the basis of the Group's future financial obligations in relation to operating leases as reported on December 31, 2016, the equity ratio would be reduced by about 1%.
With regard to all new standards described above, analysis of their impact has not yet been completed. The information provided above can be regarded as an update to the information provided in the last annual consolidated financial statements for the year ended December 31, 2016. Therefore, the information provid-ed should be read in conjunction with the information disclosed in the Notes to those annual consolidated financial statements.
5. Acquisition of Umetrics
On April 3, 2017, the Group acquired 100% of the shares in the Swedish company MKS Instruments AB (Umetrics) based in Umeå, Sweden. In the meantime, the company has been renamed "Sartorius Stedim Data Analytics AB." In addition to these shares, the Group acquired further related intangible assets through asset deals as part of the business combination.
Umetrics is a globally leading provider of data analyt-ics software for modeling and optimizing development and manufacturing processes, especially in the bio-pharmaceutical industry. The company employs ap-proximately 50 people and is expected to generate sales revenue of about $15 million in 2017.
The determination of the acquisition date fair values of the assets acquired and liabilities assumed has not yet been completed. Therefore, the purchase price allocation is preliminary based on the current knowledge of management:
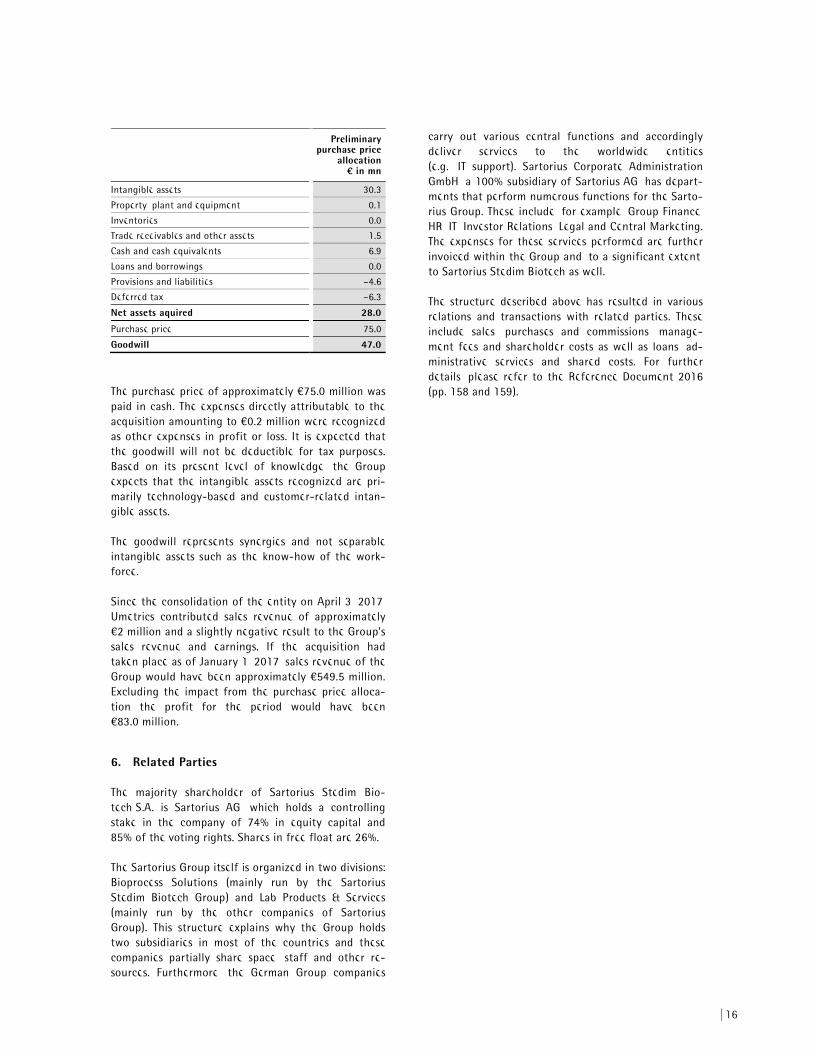
16
Preliminary purchase price
allocation ¤ in mn
Intangible assets 30.3
Property, plant and equipment 0.1
Inventories 0.0
Trade receivables and other assets 1.5
Cash and cash equivalents 6.9
Loans and borrowings 0.0
Provisions and liabilities –4.6
Deferred tax –6.3
Net assets aquired 28.0
Purchase price 75.0
Goodwill 47.0
The purchase price of approximately €75.0 million was paid in cash. The expenses directly attributable to the acquisition amounting to €0.2 million were recognized as other expenses in profit or loss. It is expected that the goodwill will not be deductible for tax purposes. Based on its present level of knowledge, the Group expects that the intangible assets recognized are pri-marily technology-based and customer-related intan-gible assets.
The goodwill represents synergies and not separable intangible assets such as the know-how of the work-force.
Since the consolidation of the entity on April 3, 2017, Umetrics contributed sales revenue of approximately €2 million and a slightly negative result to the Group's sales revenue and earnings. If the acquisition had taken place as of January 1, 2017, sales revenue of the Group would have been approximately €549.5 million. Excluding the impact from the purchase price alloca-tion the profit for the period would have been €83.0 million.
6. Related Parties
The majority shareholder of Sartorius Stedim Bio-tech S.A. is Sartorius AG, which holds a controlling stake in the company of 74% in equity capital and 85% of the voting rights. Shares in free float are 26%.
The Sartorius Group itself is organized in two divisions: Bioprocess Solutions (mainly run by the Sartorius Stedim Biotech Group) and Lab Products & Services (mainly run by the other companies of Sartorius Group). This structure explains why the Group holds two subsidiaries in most of the countries and these companies partially share space, staff and other re-sources. Furthermore, the German Group companies
carry out various central functions and accordingly deliver services to the worldwide entities (e.g., IT support). Sartorius Corporate Administration GmbH, a 100% subsidiary of Sartorius AG, has depart-ments that perform numerous functions for the Sarto-rius Group. These include, for example, Group Finance, HR, IT, Investor Relations, Legal and Central Marketing. The expenses for these services performed are further invoiced within the Group and, to a significant extent, to Sartorius Stedim Biotech as well.
The structure described above has resulted in various relations and transactions with related parties. These include sales, purchases and commissions, manage-ment fees and shareholder costs as well as loans, ad-ministrative services and shared costs. For further details, please refer to the Reference Document 2016 (pp. 158 and 159).

17
7. Financial Instruments
Carrying Amounts and Fair Values
€ in millions Categories
June 30, 2017
Carrying amount
June 30, 2017
Fair value
Dec. 31, 2016Carrying amount
Dec. 31, 2016Fair value
Financial assets Available for sale 1.9 1.9 1.9 1.9
Derivative financial instruments Held for trading 0.0 0.0 0.2 0.2
Derivative financial instruments designated as hedging instruments n/a 7.5 7.5 0.1 0.1
Financial assets (non-current) 9.4 9.4 2.3 2.3Trade receivables Loans and receivables 203.1 203.1 184.0 184.0
Receivables and other assets Loans and receivables 14.5 14.5 8.3 8.3
Derivative financial instruments Held for trading 0.0 0.0 0.0 0.0
Derivative financial instruments designated as hedging instruments n/a 2.6 2.6 0.3 0.3
Other financial assets (current) 17.2 17.2 8.5 8.5
Cash and cash equivalents Loans and
receivables 33.0 33.0 34.8 34.8
Loans and borrowings Financial liabilities at
cost 182.1 182.7 84.1 84.9
Finance lease liabilities IAS 17 17.9 28.7 18.3 29.4
Trade payables Financial liabilities at
cost 72.6 72.6 68.0 68.0
Trade payables | payments received for orders n/a 38.2 38.2 39.8 39.8
Trade payables 110.7 110.7 107.8 107.8Derivative financial instruments Held for trading 3.9 3.9 3.1 3.1
Derivative financial instruments designated as hedging instruments n/a 0.8 0.8 10.3 10.3
Other financial liabilities Financial liabilities at
cost 57.0 62.1 59.7 66.5
Other financial liabilities Fair value through
profit or loss 5.5 5.5 5.8 5.8
Other financial liabilities 67.1 72.2 79.0 85.8
For the equity investments measured at acquisition cost (financial assets), it is not possible to determine fair values reliably due to the absence of active mar-kets. This applies mainly to shares in non-consolidated subsidiaries. These are mainly linked to sales affiliates of the Group; the calculation of fair values for these activities would therefore not be relevant for the economic decisions of the users. Currently, it is not planned to sell these assets.
The fair values of the financial instruments were de-termined on the basis of the market information avail-able on the reporting date and are to be allocated to one of the three levels of the fair value hierarchy in accordance with IFRS 13.
Level 1 financial instruments are calculated on the basis of prices quoted on active markets for identical assets
and liabilities. In Level 2, financial instruments are calcu-lated on the basis of input factors which are derivable from observable market data or on the basis of market prices for similar instruments. Level 3 financial instru-ments are calculated on the basis of input factors that cannot be derived from observable market data.
The financial instruments to be recognized at fair value on the reporting date are exclusively derivatives in the form of forward contracts and interest rate swaps. They were measured on the basis of their quot-ed exchange rates and market yield curves (Level 2).
The fair values to be disclosed for financial liabilities recognized at amortized cost, especially liabilities to banks and finance leases, were measured on the basis of the market interest rate, taking the current indica-tive credit spreads into account (Level 2).

18
The liability for phantom stock units related to the acquisition of the non-controlling interest in AllPure has been recognized at the present value of the ex-pected future payments. These payments are derived from the expected revenues of the AllPure business at the time of the purchase, taking into consideration a risk-adjusted discount rate (Level 3).
The fair values of the remaining financial assets and liabilities to be disclosed approximate the carrying amounts on account of their predominantly short-term maturity.
Measurement of Fair Values
The Group recognizes transfers between the levels of the fair value hierarchies at the end of the reporting period during which the change has occurred. In the current reporting period, there were no transfers be-tween the levels.
The valuation of the Level 3 liability is based on a discounted cash flow technique, taking into considera-tion the expected future payments discounted using a risk-adjusted discount rate. The expected payments are determined by considering possible developments of future revenue and the amounts to be paid under each scenario. The significant unobservable input in this calculation is future revenue which was projected at a growth rate of 15 - 20% per year on average.
The carrying amount of the liability can be reconciled as follows:
2017¤ in mn
2016€ in mn
Balance at January 1 5.8 5.4
Changes in fair value 0.0 0.0
Financial expenses 0.1 0.1
Payments 0.0 0.0
Translation effects –0.4 –0.1
Balance at June 30 5.5 5.4
An increase (decrease) in sales revenue by 10% in each of the following years would lead to an increase (de-crease) in liability by €0.5 million (€0.5 million).
8. Other Disclosures
Impairment Test
As of June 30, 2017, we have not identified any asset impairment. Generally, impairment tests need to be performed for goodwill and other assets with indefi-nite useful lives.
Earnings Reporting
Sartorius Stedim Biotech uses the indicator "underly-ing EBITDA" as the key figure for measuring earnings. The key indicator "EBITDA" refers to earnings before interest, taxes, depreciation and amortization. The key indicator "underlying EBITDA" corresponds to the key indicator EBITDA adjusted for extraordinary expenses recorded during the relevant period.
Material Events after the Reporting Date
No material events occurred after the reporting date.
Dividend
In the reporting period, Sartorius Stedim Biotech S.A. paid a total dividend of €38.7 million.
Audit
Level of audit procedures:
– December 31, 2016: audit
– June 30, 2017: limited review
– Quarterly information: not audited; not reviewed

19
This is a free translation into English of the statutory auditors’ review report on the half-yearly financial information issued in French and is provided solely for the convenience of English-speaking users. This report includes information relating to the specific verifica-tion of information given in the Group’s half-yearly management report. This report should be read in conjunction with, and construed in accordance with, French law and professional standards applicable in France.
SARTORIUS STEDIM BIOTECH S.A.
Société Anonyme
Z.I. Les Paluds - Avenue de Jouques
C.S. 91051
13781 Aubagne cedex
To the Shareholders,
In compliance with the assignment entrusted to us by your Shareholders’ meeting and in accordance with the requirements of article L. 451-1-2 III of the French Monetary and Financial Code ("Code monétaire et financier"), we hereby report to you on:
– the review of the accompanying condensed half-yearly consolidated financial statements of Sartorius Stedim Biotech S.A., for the period from January 1, 2017, to June 30, 2017,
– the verification of the information presented in the half-yearly management report.
These condensed half-yearly consolidated financial statements are the responsibility of the Board of Di-rectors. Our role is to express a conclusion on these financial statements based on our review.
I. Conclusion on the financial statements
We conducted our review in accordance with profes-sional standards applicable in France. A review of interim financial information consists of making in-quiries, primarily of persons responsible for financial and accounting matters, and applying analytical and other review procedures. A review is substantially less in scope than an audit conducted in accordance with professional standards applicable in France and conse-quently does not enable us to obtain assurance that we would become aware of all significant matters that might be identified in an audit. Accordingly, we do not express an audit opinion.
Based on our review, nothing has come to our atten-tion that causes us to believe that the accompanying condensed half-yearly consolidated financial state-ments are not prepared, in all material respects, in accordance with IAS 34 - standard of the IFRSs as adopted by the European Union applicable to interim financial information.
II. Specific verification
We have also verified the information presented in the half-yearly management report on the condensed half-yearly consolidated financial statements subject to our review. We have no matters to report as to its fair presentation and consistency with the condensed half-yearly consolidated financial statements.
Marseille, July 20, 2017
The statutory auditors
KPMG Audit Deloitte & Associés
Division of KPMG S.A.
John Evans Christophe Perrau
Partner Partner
Statutory Auditors' Review Report on the 2017 Half-yearly Financial Information

20
Declaration of Responsibility for the First-Half Financial Report
I certify, to the best of my knowledge, that the con-densed financial statements for the first half ended June 30, 2017, have been prepared in accordance with the applicable accounting standards and give a fair view of the assets, the financial position and the re-sults of the company and of the group of companies included in the consolidation, and that the first-half financial report on pages 2 to 18 presents a fair review of the important events that occurred during the first six months of the financial year, including their effects on the accounts, and of the major transactions between the related parties, as well as of the description of the main risks and uncertainties for the remaining six months of the financial year.
Joachim Kreuzburg CEO of the Sartorius Stedim Biotech Group
Information on the First-Half Financial Report

21
Sartorius Stedim Biotech S.A. Z.I. Les Paluds Avenue de Jouques C.S. 91051 13781 Aubagne Cedex, France
Phone +33.442.84 56.00 Fax +33.442.84 56.19 www.sartorius-stedim.com
Corporate Communications
Petra Kirchhoff Vice President Phone +49.551.308 1686 [email protected]
Investor Relations
Andreas Theisen Director Phone +49.551.308 1668 [email protected]
August 29, 2017
Commerzbank Sector Conference Week | Frankfurt am Main, Germany
September 6, 2017
Goldman Sachs European Medtech Conference | London, UK
September 12, 2017
Morgan Stanley Global Healthcare Conference | New York, USA
September 18-19, 2017
Berenberg German Corporate Conference | Munich, Germany
October 24, 2017
Publication of nine-month figures for 2017
November 28, 2017
German Equity Forum | Frankfurt am Main, Germany
December 5, 2017
Berenberg European Conference | London, UK
January 2018
Publication of preliminary results for fiscal 2017
April 3, 2018
Annual General Shareholders' Meeting | Aubagne, France
April 2018
Publication of first-quarter figures for 2018
This is a translation of the original French-language first-half financial report "Rapport financier semestriel." Sartorius Stedim Biotech
S.A. shall not assume any liability for the correctness of this translation. The original French interim report is the legally binding version.
Furthermore, Sartorius Stedim Biotech S.A. reserves the right not to be responsible for the topicality, correctness, completeness or
quality of the information provided. Liability claims regarding damage caused by the use of any information provided, including any
kind of information which is incomplete or incorrect, will therefore be rejected.
Forward-looking Statements Contain Risks
This report contains various statements concerning the Sartorius Stedim Biotech Group’s future performance. These statements are
based on assumptions and estimates. Although we are convinced that these forward-looking statements are realistic, we cannot guar-
antee that they will actually apply. This is because our assumptions harbor risks and uncertainties that could lead to actual results
diverging substantially from the expected ones. It is not planned to update our forward-looking statements. Throughout the entire
report, differences may be apparent as a result of rounding during addition.
Contacts Financial Schedule