(in pln thousand) selected financial datain pln thousand) 2 selected financial data selected...
TRANSCRIPT
This document is a translation of a document originally issued in Polish. The only binding version is the original Polish ver
Consolidated Consolidated Consolidated Consolidated
of of of of the the the the Powszechna Kasa Oszczędności BPowszechna Kasa Oszczędności BPowszechna Kasa Oszczędności BPowszechna Kasa Oszczędności B
Spółka AkcyjnaSpółka AkcyjnaSpółka AkcyjnaSpółka Akcyjna
This document is a translation of a document originally issued in Polish. The only binding version is the original Polish ver
Consolidated Consolidated Consolidated Consolidated Financial StatementFinancial StatementFinancial StatementFinancial Statementssss
Powszechna Kasa Oszczędności BPowszechna Kasa Oszczędności BPowszechna Kasa Oszczędności BPowszechna Kasa Oszczędności Bank Polski ank Polski ank Polski ank Polski
Spółka AkcyjnaSpółka AkcyjnaSpółka AkcyjnaSpółka Akcyjna GroupGroupGroupGroup for the for the for the for the yearyearyearyear endedendedendedended
33331111 December December December December 2020202011111111
This document is a translation of a document originally issued in Polish. The only binding version is the original Polish version.
ank Polski ank Polski ank Polski ank Polski
endedendedendedended
This document is a translation of a document originally issued in Polish. The only binding version is the original Polish version.
Consolidated Financial Statements of the Powszechna Kasa Oszczędności Bank Polski Spółka Akcyjna Group
for the year ended 31 December 2011 (in PLN thousand)
2
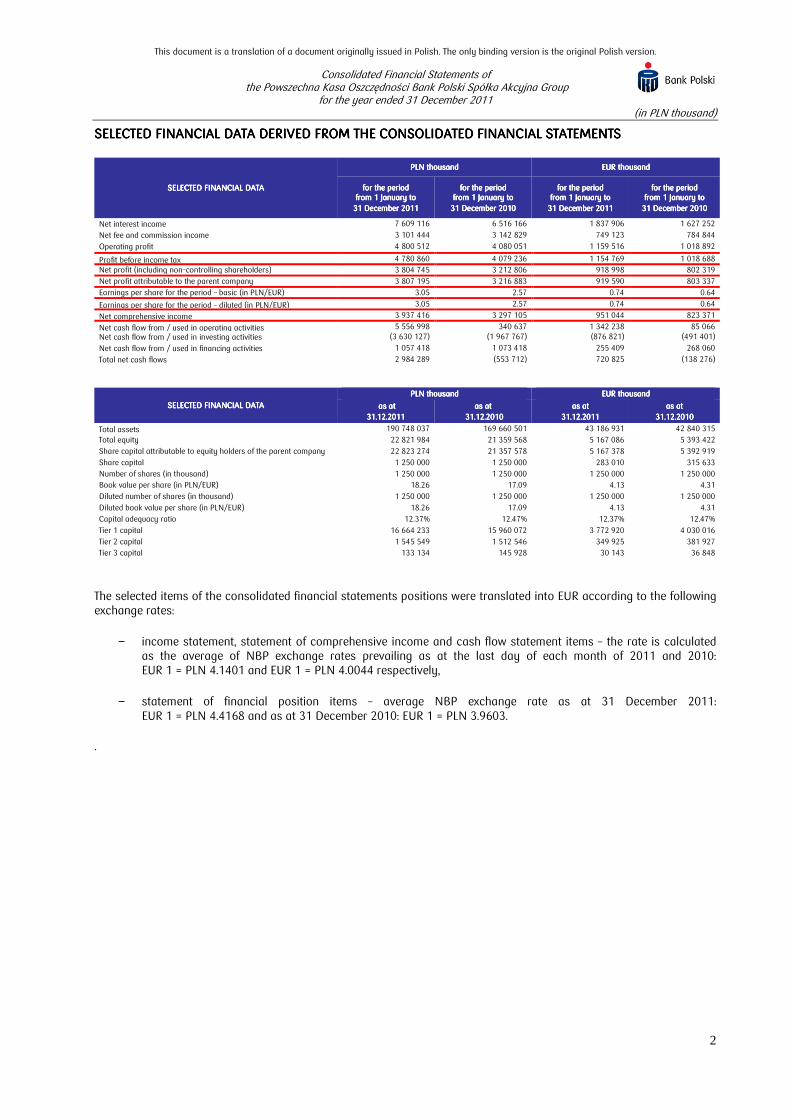
SELECTED FINANCIAL DATASELECTED FINANCIAL DATASELECTED FINANCIAL DATASELECTED FINANCIAL DATA DERIVED FROM THE DERIVED FROM THE DERIVED FROM THE DERIVED FROM THE CONSOLIDATED CONSOLIDATED CONSOLIDATED CONSOLIDATED FINANCIAL FINANCIAL FINANCIAL FINANCIAL STATEMENTSSTATEMENTSSTATEMENTSSTATEMENTS
SELECTED FINANCIAL DATASELECTED FINANCIAL DATASELECTED FINANCIAL DATASELECTED FINANCIAL DATA
PLN thousandPLN thousandPLN thousandPLN thousand EUR thousandEUR thousandEUR thousandEUR thousand
for the period for the period for the period for the period from from from from 1 January to1 January to1 January to1 January to
31 December 31 December 31 December 31 December 2012012012011111
for the period for the period for the period for the period from from from from 1 January to1 January to1 January to1 January to
31 December 2031 December 2031 December 2031 December 2010101010
for the period for the period for the period for the period from from from from 1 January to1 January to1 January to1 January to
31 December 20131 December 20131 December 20131 December 2011111
for the period for the period for the period for the period from from from from 1 January to1 January to1 January to1 January to
31 31 31 31 December 20December 20December 20December 2010101010
Net interest income 7 609 116 6 516 166 1 837 906 1 627 252
Net fee and commission income 3 101 444 3 142 829 749 123 784 844
Operating profit 4 800 512 4 080 051 1 159 516 1 018 892
Profit before income tax 4 780 860 4 079 236 1 154 769 1 018 688
Net profit (including non-controlling shareholders) 3 804 745 3 212 806 918 998 802 319
Net profit attributable to the parent company 3 807 195 3 216 883 919 590 803 337
Earnings per share for the period – basic (in PLN/EUR) 3.05 2.57 0.74 0.64
Earnings per share for the period – diluted (in PLN/EUR) 3.05 2.57 0.74 0.64
Net comprehensive income 3 937 416 3 297 105 951 044 823 371
Net cash flow from / used in operating activities 5 556 998 340 637 1 342 238 85 066 Net cash flow from / used in investing activities (3 630 127) (1 967 767) (876 821) (491 401)
Net cash flow from / used in financing activities 1 057 418 1 073 418 255 409 268 060
Total net cash flows 2 984 289 (553 712) 720 825 (138 276)
SELECTED FINANCIAL DATASELECTED FINANCIAL DATASELECTED FINANCIAL DATASELECTED FINANCIAL DATA
PLN thousandPLN thousandPLN thousandPLN thousand EUR thousandEUR thousandEUR thousandEUR thousand
as atas atas atas at
31.12.20131.12.20131.12.20131.12.2011111
as atas atas atas at
31.12.2031.12.2031.12.2031.12.2010101010
as atas atas atas at
31.12.20131.12.20131.12.20131.12.2011111
as atas atas atas at
31.12.2031.12.2031.12.2031.12.2010101010
Total assets 190 748 037 169 660 501 43 186 931 42 840 315
Total equity 22 821 984 21 359 568 5 167 086 5 393 422
Share capital attributable to equity holders of the parent company 22 823 274 21 357 578 5 167 378 5 392 919
Share capital 1 250 000 1 250 000 283 010 315 633
Number of shares (in thousand) 1 250 000 1 250 000 1 250 000 1 250 000
Book value per share (in PLN/EUR) 18.26 17.09 4.13 4.31
Diluted number of shares (in thousand) 1 250 000 1 250 000 1 250 000 1 250 000
Diluted book value per share (in PLN/EUR) 18.26 17.09 4.13 4.31
Capital adequacy ratio 12.37% 12.47% 12.37% 12.47%
Tier 1 capital 16 664 233 15 960 072 3 772 920 4 030 016
Tier 2 capital 1 545 549 1 512 546 349 925 381 927
Tier 3 capital 133 134 145 928 30 143 36 848
The selected items of the consolidated financial statements positions were translated into EUR according to the following exchange rates:
− income statement, statement of comprehensive income and cash flow statement items – the rate is calculated as the average of NBP exchange rates prevailing as at the last day of each month of 2011 and 2010: EUR 1 = PLN 4.1401 and EUR 1 = PLN 4.0044 respectively,
− statement of financial position items – average NBP exchange rate as at 31 December 2011: EUR 1 = PLN 4.4168 and as at 31 December 2010: EUR 1 = PLN 3.9603.
.
This document is a translation of a document originally issued in Polish. The only binding version is the original Polish version.
Consolidated Financial Statements of the Powszechna Kasa Oszczędności Bank Polski Spółka Akcyjna Group
for the year ended 31 December 2011 (in PLN thousand)
3
Table of contentsTable of contentsTable of contentsTable of contents PagePagePagePage
CONSOLIDATED INCOME CONSOLIDATED INCOME CONSOLIDATED INCOME CONSOLIDATED INCOME STATEMENTSTATEMENTSTATEMENTSTATEMENT 4444
CONSOLIDATED STATEMECONSOLIDATED STATEMECONSOLIDATED STATEMECONSOLIDATED STATEMENT OF COMPREHENSIVE NT OF COMPREHENSIVE NT OF COMPREHENSIVE NT OF COMPREHENSIVE INCOMEINCOMEINCOMEINCOME 4444
CONSOLIDATED STATEMECONSOLIDATED STATEMECONSOLIDATED STATEMECONSOLIDATED STATEMENT OF FINANCIAL POSINT OF FINANCIAL POSINT OF FINANCIAL POSINT OF FINANCIAL POSITIONTIONTIONTION 5555
CONSOLIDATED STATEMECONSOLIDATED STATEMECONSOLIDATED STATEMECONSOLIDATED STATEMENT OF CHANGES IN EQUNT OF CHANGES IN EQUNT OF CHANGES IN EQUNT OF CHANGES IN EQUITYITYITYITY 6666
CONSOLIDATED CASH FLCONSOLIDATED CASH FLCONSOLIDATED CASH FLCONSOLIDATED CASH FLOW STATEMENTOW STATEMENTOW STATEMENTOW STATEMENT 7777
NOTES TO THE CONSOLINOTES TO THE CONSOLINOTES TO THE CONSOLINOTES TO THE CONSOLIDATED FINANCIAL STATDATED FINANCIAL STATDATED FINANCIAL STATDATED FINANCIAL STATEMENTSEMENTSEMENTSEMENTS 8888
This document is a translation of a document originally issued in Polish. The only binding version is the original Polish version.
Consolidated Financial Statements of the Powszechna Kasa Oszczędności Bank Polski Spółka Akcyjna Group
for the year ended 31 December 2011 (in PLN thousand)
Notes on pages 11 to 156 are an integral part of these Consolidated Financial Statements
4
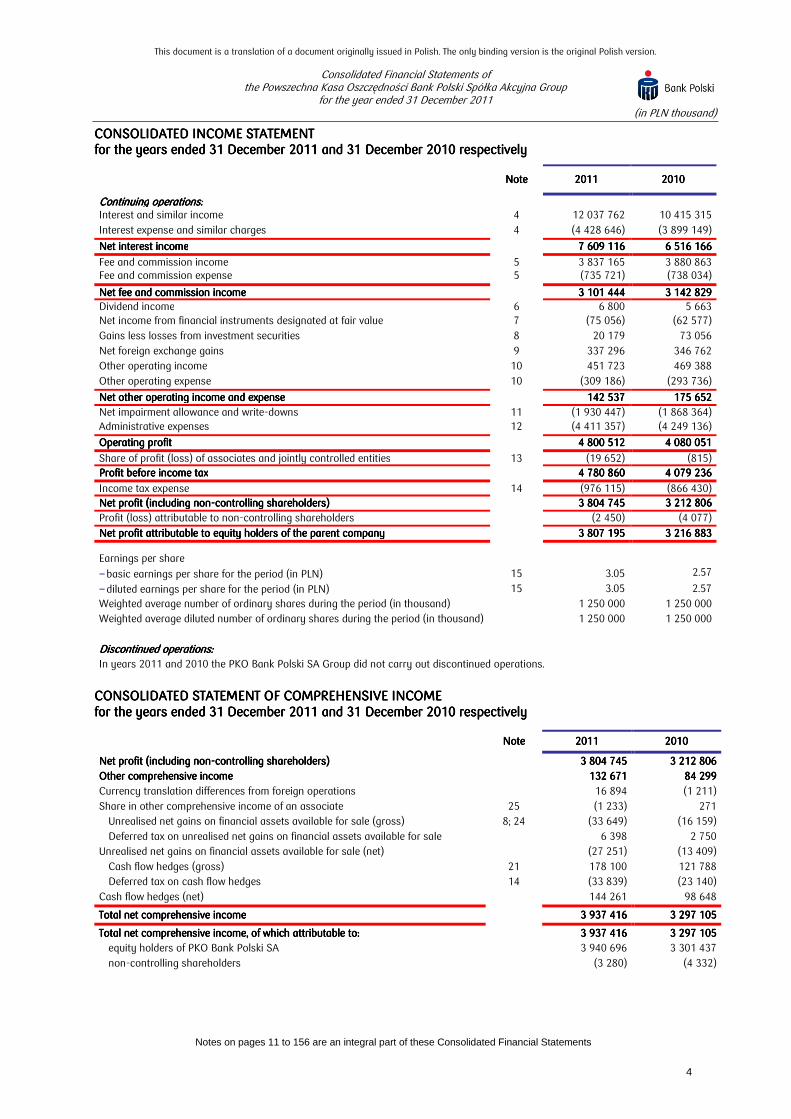
CONSOLIDATED CONSOLIDATED CONSOLIDATED CONSOLIDATED INCOME STATEMENTINCOME STATEMENTINCOME STATEMENTINCOME STATEMENT for the for the for the for the yearsyearsyearsyears ended 3ended 3ended 3ended 31111 December December December December 2012012012011111 and and and and 31 December 31 December 31 December 31 December 2020202010101010 respectivelyrespectivelyrespectivelyrespectively
NoteNoteNoteNote 2020202011111111 2020202010101010
ContinuingContinuingContinuingContinuing operations:operations:operations:operations: Interest and similar income 4 12 037 762 10 415 315
Interest expense and similar charges 4 (4 428 646) (3 899 149)
Net interest incomeNet interest incomeNet interest incomeNet interest income 7 609 116 7 609 116 7 609 116 7 609 116 6 516 166 6 516 166 6 516 166 6 516 166
Fee and commission income 5 3 837 165 3 880 863 Fee and commission expense 5 (735 721) (738 034)
Net fee and commission incomeNet fee and commission incomeNet fee and commission incomeNet fee and commission income 3 101 444 3 101 444 3 101 444 3 101 444 3 142 829 3 142 829 3 142 829 3 142 829 Dividend income 6 6 800 5 663 Net income from financial instruments designated at fair value 7 (75 056) (62 577)
Gains less losses from investment securities 8 20 179 73 056
Net foreign exchange gains 9 337 296 346 762
Other operating income 10 451 723 469 388
Other operating expense 10 (309 186) (293 736)
Net other operating income and expenseNet other operating income and expenseNet other operating income and expenseNet other operating income and expense 142 537 142 537 142 537 142 537 175 652 175 652 175 652 175 652
Net impairment allowance and write-downs 11 (1 930 447) (1 868 364) Administrative expenses 12 (4 411 357) (4 249 136)
Operating profitOperating profitOperating profitOperating profit 4 800 512 4 800 512 4 800 512 4 800 512 4 080 051 4 080 051 4 080 051 4 080 051
Share of profit (loss) of associates and jointly controlled entities 13 (19 652) (815) Profit before income taxProfit before income taxProfit before income taxProfit before income tax 4 780 860 4 780 860 4 780 860 4 780 860 4 079 236 4 079 236 4 079 236 4 079 236
Income tax expense 14 (976 115) (866 430) Net profit (inNet profit (inNet profit (inNet profit (including noncluding noncluding noncluding non----controlling shareholderscontrolling shareholderscontrolling shareholderscontrolling shareholders) ) ) ) 3 804 745 3 804 745 3 804 745 3 804 745 3333 212 806212 806212 806212 806
Profit (loss) attributable to non-controlling shareholders (2 450) (4 077)
Net profit attributable to equity holders of the parent company Net profit attributable to equity holders of the parent company Net profit attributable to equity holders of the parent company Net profit attributable to equity holders of the parent company 3 807 195 3 807 195 3 807 195 3 807 195 3 216 883 3 216 883 3 216 883 3 216 883
Earnings per share
− basic earnings per share for the period (in PLN) 15 3.05 2.57 − diluted earnings per share for the period (in PLN) 15 3.05 2.57
Weighted average number of ordinary shares during the period (in thousand) 1 250 000 1 250 000
Weighted average diluted number of ordinary shares during the period (in thousand) 1 250 000 1 250 000
Discontinued operations:Discontinued operations:Discontinued operations:Discontinued operations:
In years 2011 and 2010 the PKO Bank Polski SA Group did not carry out discontinued operations.
CONSOLIDATED CONSOLIDATED CONSOLIDATED CONSOLIDATED STATEMENT OF COMPREHENSIVE INCOMESTATEMENT OF COMPREHENSIVE INCOMESTATEMENT OF COMPREHENSIVE INCOMESTATEMENT OF COMPREHENSIVE INCOME for for for for the years ended 31 December 20the years ended 31 December 20the years ended 31 December 20the years ended 31 December 2011111111 and 31 December 20and 31 December 20and 31 December 20and 31 December 2010101010 respectivelyrespectivelyrespectivelyrespectively
NoteNoteNoteNote 2011201120112011 2010201020102010
Net profit Net profit Net profit Net profit (in(in(in(including noncluding noncluding noncluding non----controllingcontrollingcontrollingcontrolling shareholdersshareholdersshareholdersshareholders)))) 3 804 745 3 804 745 3 804 745 3 804 745 3 212 806 3 212 806 3 212 806 3 212 806
OtherOtherOtherOther comprehensive incomecomprehensive incomecomprehensive incomecomprehensive income 132 671 132 671 132 671 132 671 84 299 84 299 84 299 84 299
Currency translation differences from foreign operations 16 894 (1 211)
Share in other comprehensive income of an associate 25 (1 233) 271
Unrealised net gains on financial assets available for sale (gross) 8; 24 (33 649) (16 159)
Deferred tax on unrealised net gains on financial assets available for sale 6 398 2 750
Unrealised net gains on financial assets available for sale (net) (27 251) (13 409)
Cash flow hedges (gross) 21 178 100 121 788
Deferred tax on cash flow hedges 14 (33 839) (23 140)
Cash flow hedges (net)
144 261 98 648
Total net comprehensive incomeTotal net comprehensive incomeTotal net comprehensive incomeTotal net comprehensive income 3 937 416 3 937 416 3 937 416 3 937 416 3 297 105 3 297 105 3 297 105 3 297 105
Total Total Total Total net net net net comprehensive income, of which attributable to:comprehensive income, of which attributable to:comprehensive income, of which attributable to:comprehensive income, of which attributable to: 3 937 416 3 937 416 3 937 416 3 937 416 3 297 105 3 297 105 3 297 105 3 297 105
equity holders of PKO Bank Polski SA 3 940 696 3 301 437
non-controlling shareholders (3 280) (4 332)
This document is a translation of a document originally issued in Polish. The only binding version is the original Polish version.
Consolidated Financial Statements of the Powszechna Kasa Oszczędności Bank Polski Spółka Akcyjna Group
for the year ended 31 December 2011 (in PLN thousand)
Notes on pages 11 to 156 are an integral part of these Consolidated Financial Statements
5
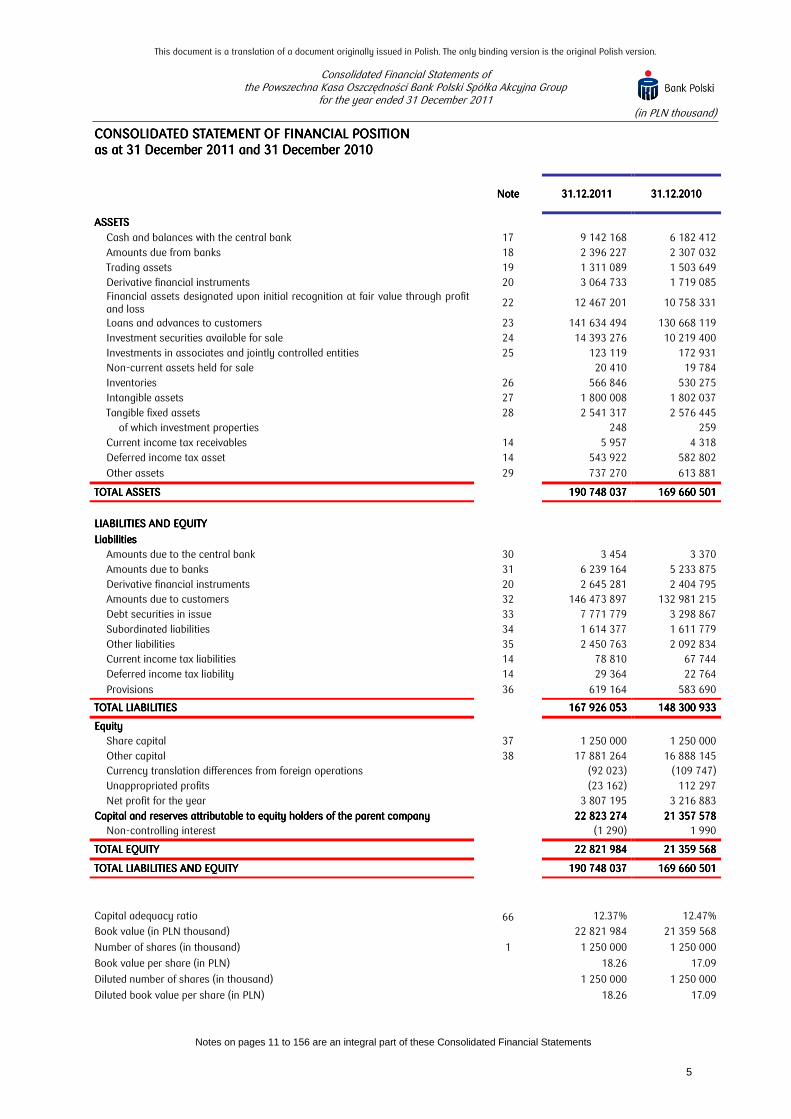
CONSOLIDATED CONSOLIDATED CONSOLIDATED CONSOLIDATED STATEMENT OF FINANCIAL POSITIONSTATEMENT OF FINANCIAL POSITIONSTATEMENT OF FINANCIAL POSITIONSTATEMENT OF FINANCIAL POSITION as atas atas atas at 31 December 31 December 31 December 31 December 2020202011111111 and 3and 3and 3and 31111 DecemberDecemberDecemberDecember 2020202010101010
NoteNoteNoteNote 31.1231.1231.1231.12.20.20.20.2011111111 31.12.2031.12.2031.12.2031.12.2010101010
ASSETSASSETSASSETSASSETS
Cash and balances with the central bank 17 9 142 168 6 182 412
Amounts due from banks 18 2 396 227 2 307 032
Trading assets 19 1 311 089 1 503 649
Derivative financial instruments 20 3 064 733 1 719 085 Financial assets designated upon initial recognition at fair value through profit and loss
22 12 467 201 10 758 331
Loans and advances to customers 23 141 634 494 130 668 119
Investment securities available for sale 24 14 393 276 10 219 400
Investments in associates and jointly controlled entities 25 123 119 172 931
Non-current assets held for sale 20 410 19 784
Inventories 26 566 846 530 275
Intangible assets 27 1 800 008 1 802 037
Tangible fixed assets 28 2 541 317 2 576 445
of which investment properties 248 259
Current income tax receivables 14 5 957 4 318
Deferred income tax asset 14 543 922 582 802
Other assets 29 737 270 613 881
TOTAL ASSETSTOTAL ASSETSTOTAL ASSETSTOTAL ASSETS 190 748 037 190 748 037 190 748 037 190 748 037 169 660 501 169 660 501 169 660 501 169 660 501
LIABILITIES AND EQUITYLIABILITIES AND EQUITYLIABILITIES AND EQUITYLIABILITIES AND EQUITY
LiabilitiesLiabilitiesLiabilitiesLiabilities
Amounts due to the central bank 30 3 454 3 370
Amounts due to banks 31 6 239 164 5 233 875
Derivative financial instruments 20 2 645 281 2 404 795
Amounts due to customers 32 146 473 897 132 981 215
Debt securities in issue 33 7 771 779 3 298 867
Subordinated liabilities 34 1 614 377 1 611 779
Other liabilities 35 2 450 763 2 092 834
Current income tax liabilities 14 78 810 67 744
Deferred income tax liability 14 29 364 22 764
Provisions 36 619 164 583 690
TOTAL LIABILITIESTOTAL LIABILITIESTOTAL LIABILITIESTOTAL LIABILITIES 167 926 053 167 926 053 167 926 053 167 926 053 148 300 933 148 300 933 148 300 933 148 300 933
EquityEquityEquityEquity
Share capital 37 1 250 000 1 250 000
Other capital 38 17 881 264 16 888 145
Currency translation differences from foreign operations (92 023) (109 747)
Unappropriated profits (23 162) 112 297
Net profit for the year 3 807 195 3 216 883
Capital and reserves attributable to equity holders of the parent companyCapital and reserves attributable to equity holders of the parent companyCapital and reserves attributable to equity holders of the parent companyCapital and reserves attributable to equity holders of the parent company 22 823 274 22 823 274 22 823 274 22 823 274 21 357 578 21 357 578 21 357 578 21 357 578
Non-controlling interest (1 290) 1 990
TOTAL EQUITYTOTAL EQUITYTOTAL EQUITYTOTAL EQUITY 22 821 984 22 821 984 22 821 984 22 821 984 21 359 568 21 359 568 21 359 568 21 359 568
TOTAL TOTAL TOTAL TOTAL LIABILITIES AND EQUITYLIABILITIES AND EQUITYLIABILITIES AND EQUITYLIABILITIES AND EQUITY 190 748 037 190 748 037 190 748 037 190 748 037 169 660 501 169 660 501 169 660 501 169 660 501
Capital adequacy ratio 66 12.37% 12.47%
Book value (in PLN thousand) 22 821 984 21 359 568
Number of shares (in thousand) 1 1 250 000 1 250 000
Book value per share (in PLN) 18.26 17.09
Diluted number of shares (in thousand) 1 250 000 1 250 000
Diluted book value per share (in PLN) 18.26 17.09

This document is a translation of a document originally issued in Polish. The only binding version is the original Polish version.
Consolidated Financial Statements of the Powszechna Kasa Oszczędności Bank Polski Spółka Akcyjna Group
for the year ended 31 December 2011 (in PLN thousand)
Notes on pages 11 to 156 are an integral part of these Consolidated Financial Statements
6
CONSOLIDATED CONSOLIDATED CONSOLIDATED CONSOLIDATED STATEMENT OF CHANGES STATEMENT OF CHANGES STATEMENT OF CHANGES STATEMENT OF CHANGES ININININ EQUITYEQUITYEQUITYEQUITY for thefor thefor thefor the yearsyearsyearsyears ended ended ended ended 31 December31 December31 December31 December 2012012012011111 and 3and 3and 3and 31111 DecemberDecemberDecemberDecember 2020202010101010 respectivelyrespectivelyrespectivelyrespectively
for the year ended 31 for the year ended 31 for the year ended 31 for the year ended 31 December 201December 201December 201December 2011111 Share Share Share Share capitalcapitalcapitalcapital
Other capitalOther capitalOther capitalOther capital
Currency Currency Currency Currency translation translation translation translation differences differences differences differences
from foreign from foreign from foreign from foreign operationsoperationsoperationsoperations
Unappropriated Unappropriated Unappropriated Unappropriated
profitsprofitsprofitsprofits
Net profit for Net profit for Net profit for Net profit for the periodthe periodthe periodthe period
Total equity Total equity Total equity Total equity attributable to attributable to attributable to attributable to equity holders equity holders equity holders equity holders of the parent of the parent of the parent of the parent
companycompanycompanycompany
NonNonNonNon----controllingcontrollingcontrollingcontrolling
interestinterestinterestinterest
Total Total Total Total equityequityequityequity Reserve Reserve Reserve Reserve
capitalcapitalcapitalcapital Other Other Other Other
reservesreservesreservesreserves
General General General General banking banking banking banking risk fundrisk fundrisk fundrisk fund
Share in other Share in other Share in other Share in other comprehensive comprehensive comprehensive comprehensive
income of income of income of income of an associatean associatean associatean associate
Financial Financial Financial Financial assets assets assets assets
available available available available for salefor salefor salefor sale
Cash Cash Cash Cash flow flow flow flow
hedgeshedgeshedgeshedges
Total Total Total Total other other other other
capitalcapitalcapitalcapital
NoteNoteNoteNote 37373737 38383838 38383838 38383838 38383838 38383838 38383838 38383838
As at 1 January 2011As at 1 January 2011As at 1 January 2011As at 1 January 2011 1 250 000 1 250 000 1 250 000 1 250 000 12 212 177 12 212 177 12 212 177 12 212 177 3 412 239 3 412 239 3 412 239 3 412 239 1 070 000 1 070 000 1 070 000 1 070 000 976 976 976 976 (25 171)(25 171)(25 171)(25 171) 217 924 217 924 217 924 217 924 16 888 145 16 888 145 16 888 145 16 888 145 (109 747)(109 747)(109 747)(109 747) 112 297 112 297 112 297 112 297 3 216 883 3 216 883 3 216 883 3 216 883 21 357 578 21 357 578 21 357 578 21 357 578 1 990 1 990 1 990 1 990 21 359 568 21 359 568 21 359 568 21 359 568 Transfer of net profit from previous years - - - - - - - ---- - 3 216 883 (3 216 883) ---- - ----
Total comprehensive income, of which: - - - - (1 233) (27 251) 144 261 115 777 115 777 115 777 115 777 17 724 - 3 807 195 3 940 696 3 940 696 3 940 696 3 940 696 (3 280) 3 937 416 3 937 416 3 937 416 3 937 416
Net profit - - - - - - ---- - - 3 807 195 3 807 195 3 807 195 3 807 195 3 807 195 (2 450) 3 804 745 3 804 745 3 804 745 3 804 745
Other comprehensive income - - - - (1 233) (27 251) 144 261 115 777 115 777 115 777 115 777 17 724 - - 133 501 133 501 133 501 133 501 (830) 132 671 132 671 132 671 132 671
Transfer from unappropriated profits - 829 213 48 129 - - - - 877 342 877 342 877 342 877 342 - (877 342) - ---- - ----
Dividends paid - - - - - - - ---- - (2 475 000) - (2 475 000)(2 475 000)(2 475 000)(2 475 000) -
(2 475 000)(2 475 000)(2 475 000)(2 475 000)
As at 31 December 2011As at 31 December 2011As at 31 December 2011As at 31 December 2011 1 250 000 1 250 000 1 250 000 1 250 000 13 041 390 13 041 390 13 041 390 13 041 390 3 460 368 3 460 368 3 460 368 3 460 368 1 070 000 1 070 000 1 070 000 1 070 000 (257)(257)(257)(257) (52 422)(52 422)(52 422)(52 422) 362 185 362 185 362 185 362 185 17 881 264 17 881 264 17 881 264 17 881 264 (92 023)(92 023)(92 023)(92 023) (23 162)(23 162)(23 162)(23 162) 3 807 195 3 807 195 3 807 195 3 807 195 22 823 274 22 823 274 22 823 274 22 823 274 (1 290)(1 290)(1 290)(1 290) 22 821 984 22 821 984 22 821 984 22 821 984
for the year ended 31 December 2010for the year ended 31 December 2010for the year ended 31 December 2010for the year ended 31 December 2010 Share Share Share Share capitalcapitalcapitalcapital
Other capitalOther capitalOther capitalOther capital
Currency Currency Currency Currency translation translation translation translation differences differences differences differences
from foreign from foreign from foreign from foreign operationsoperationsoperationsoperations
Unappropriated Unappropriated Unappropriated Unappropriated
profitsprofitsprofitsprofits
Net profit for Net profit for Net profit for Net profit for the periodthe periodthe periodthe period
Total equity Total equity Total equity Total equity attributable to attributable to attributable to attributable to equity holders equity holders equity holders equity holders of of of of the parent the parent the parent the parent
companycompanycompanycompany
NonNonNonNon----controllingcontrollingcontrollingcontrolling
interestinterestinterestinterest
Total Total Total Total equityequityequityequity Reserve Reserve Reserve Reserve
capitalcapitalcapitalcapital Other Other Other Other
reservesreservesreservesreserves
General General General General banking banking banking banking risk fundrisk fundrisk fundrisk fund
Share in other Share in other Share in other Share in other comprehensive comprehensive comprehensive comprehensive
income of income of income of income of an associatean associatean associatean associate
Financial Financial Financial Financial assets assets assets assets
available available available available for for for for salesalesalesale
Cash Cash Cash Cash flow flow flow flow
hedgeshedgeshedgeshedges
Total Total Total Total other other other other
capitalcapitalcapitalcapital
NoteNoteNoteNote 37373737 38383838 38383838 38383838 38383838 38383838 38383838 38383838
As at 1 January 2010As at 1 January 2010As at 1 January 2010As at 1 January 2010 1 250 000 1 250 000 1 250 000 1 250 000 12 149 682 12 149 682 12 149 682 12 149 682 3 405 087 3 405 087 3 405 087 3 405 087 1 070 000 1 070 000 1 070 000 1 070 000 705 705 705 705 (11 762)(11 762)(11 762)(11 762) 119 276 119 276 119 276 119 276 16 732 988 16 732 988 16 732 988 16 732 988 (108 791)(108 791)(108 791)(108 791) 248 806 248 806 248 806 248 806 2 305 538 2 305 538 2 305 538 2 305 538 20 428 541 20 428 541 20 428 541 20 428 541 7 329 7 329 7 329 7 329 20 435 870 20 435 870 20 435 870 20 435 870 Transfer of net profit from previous years - - - - - - - ---- - 2 305 538 (2 305 538) ---- - ----
Total comprehensive income, of which:Total comprehensive income, of which:Total comprehensive income, of which:Total comprehensive income, of which: ---- ---- ---- ---- 271 271 271 271 (13 409)(13 409)(13 409)(13 409) 98 648 98 648 98 648 98 648 85 510 85 510 85 510 85 510 (956)(956)(956)(956) ---- 3 216 883 3 216 883 3 216 883 3 216 883 3 301 437 3 301 437 3 301 437 3 301 437 (4 332)(4 332)(4 332)(4 332) 3 297 105 3 297 105 3 297 105 3 297 105
Net profit - - - - - - - ---- - - 3 216 883 3 216 883 3 216 883 3 216 883 3 216 883 (4 077) 3 212 806 3 212 806 3 212 806 3 212 806
Other comprehensive income - - - - 271 (13 409) 98 648 85 510 85 510 85 510 85 510 (956) - - 84 554 84 554 84 554 84 554 (255) 84 299 84 299 84 299 84 299
Transfer from unappropriated profits - 62 495 7 152 - - - - 69 647 69 647 69 647 69 647 - (69 647) - ---- - -
Dividends paid - - - - - - - ---- - (2 375 000) - (2 375 000)(2 375 000)(2 375 000)(2 375 000) - (2 375 000)(2 375 000)(2 375 000)(2 375 000) Acquisition of shares issue of a subsidiary by non-controlling shareholders
- - - - - - - ---- - - - ---- 204 204 204 204 204
Increase in interest by acquisition of shares of a subsidiary
- - - - - - - ---- - 1 493 - 1 493 1 493 1 493 1 493 (1 493) ----
Additional payment to equity for non-controlling shareholders
- - - - - - - ---- - - ---- ---- 352 352 352 352 352
Disposal of a subsidiary - - - - - - - ---- - 1 107 - 1 107 1 107 1 107 1 107 (70) 1 037 1 037 1 037 1 037
As at 31 December 2010As at 31 December 2010As at 31 December 2010As at 31 December 2010 1111 250 000250 000250 000250 000 12 212 177 12 212 177 12 212 177 12 212 177 3 412 239 3 412 239 3 412 239 3 412 239 1 070 000 1 070 000 1 070 000 1 070 000 976 976 976 976 (25 171)(25 171)(25 171)(25 171) 217 924 217 924 217 924 217 924 16 888 145 16 888 145 16 888 145 16 888 145 (109 747)(109 747)(109 747)(109 747) 112 297 112 297 112 297 112 297 3 216 883 3 216 883 3 216 883 3 216 883 21212121 357 578357 578357 578357 578 1 990 1 990 1 990 1 990 21 359 568 21 359 568 21 359 568 21 359 568

This document is a translation of a document originally issued in Polish. The only binding version is the original Polish version.
Consolidated Financial Statements of the Powszechna Kasa Oszczędności Bank Polski Spółka Akcyjna Group
for the year ended 31 December 2011 (in PLN thousand)
Notes on pages 11 to 156 are an integral part of these Consolidated Financial Statements
7
CONSOLIDATED CONSOLIDATED CONSOLIDATED CONSOLIDATED CASH FLOWCASH FLOWCASH FLOWCASH FLOW STATEMENTSTATEMENTSTATEMENTSTATEMENT for the for the for the for the yearyearyearyearssss ended ended ended ended 31 December 31 December 31 December 31 December 2011201120112011 and 31 Decemberand 31 Decemberand 31 Decemberand 31 December 2020202010101010 respectivelyrespectivelyrespectivelyrespectively
NoteNoteNoteNote 2012012012011111 2020202010101010
Net cash flow from operating activitiesNet cash flow from operating activitiesNet cash flow from operating activitiesNet cash flow from operating activities
Profit before income tax
4 780 860 4 079 236
Adjustments:
776 138 (3 738 599)
Amortisation and depreciation
520 161 512 319
(Gains) losses from investing activities 43 (7 330) (3 947)
Interest and dividends 43 (423 475) (413 827)
Change in amounts due from banks 43 (68 549) 72 433 Change in trading assets and financial assets designated upon initial recognition at fair value through profit and loss
(1 516 310) 2 311 665
Change in derivative financial instruments (asset)
(1 345 648) 310 037
Change in loans and advances to customers 43 (11 767 948) (15 015 080) Change in other assets
(160 586) 78 412
Change in amounts due to banks 43 1 199 747 67 853
Change in derivative financial instruments (liability)
240 486 860 425
Change in amounts due to customers 43 13 548 699 7 499 314
Change in debt securities in issue
78 094 (158 733)
Change in impairment allowances and provisions 43 868 375 923 148
Change in other liabilities and subordinated liabilities 43 518 496 648 133
Income tax paid
(946 199) (1 178 323)
Other adjustments 43 38 125 (252 428)
Net cash from / used in operating activitiesNet cash from / used in operating activitiesNet cash from / used in operating activitiesNet cash from / used in operating activities
5 556 998 5 556 998 5 556 998 5 556 998 340 637 340 637 340 637 340 637
Net Net Net Net cash flow from investing activitiescash flow from investing activitiescash flow from investing activitiescash flow from investing activities
Inflows from investing activitiesInflows from investing activitiesInflows from investing activitiesInflows from investing activities
8 294 680 8 294 680 8 294 680 8 294 680 8 669 411 8 669 411 8 669 411 8 669 411
Disposal of shares in a subsidiary, net of cash disposed
- 32
Proceeds and interest from sale of investment securities
8 271 568 8 643 928
Repurchase of securities held to maturity
- 10 050
Proceeds from sale of intangible assets and tangible fixed assets
16 584 9 990
Other investing inflows (dividends)
6 528 5 411
Outflows from investing activitiesOutflows from investing activitiesOutflows from investing activitiesOutflows from investing activities
(11 924 807)(11 924 807)(11 924 807)(11 924 807) (10 637 178)(10 637 178)(10 637 178)(10 637 178)
Purchase of a subsidiary, net of cash acquired
(1 482) -
Purchase of investment securities available for sale
(11 426 990) (10 017 463)
Purchase of securities held to maturity
- -
Purchase of intangible assets and tangible fixed assets
(496 335) (619 715)
Net cash from / used in investing activitiesNet cash from / used in investing activitiesNet cash from / used in investing activitiesNet cash from / used in investing activities
(3 630 127)(3 630 127)(3 630 127)(3 630 127) (1 967 767)(1 967 767)(1 967 767)(1 967 767)
Net cash flow from financing activitiesNet cash flow from financing activitiesNet cash flow from financing activitiesNet cash flow from financing activities Proceeds from debt securities in issue
5 925 568 3 168 240
Redemption of debt securities in issue
(1 951 454) -
Repayment of interest from issued debt securities
(108 743) (82 590)
Dividends paid to equity holders of the parent company
(2 475 000) (2 375 000)
Long-term borrowings
969 487 1 084 130
Repayment of long-term borrowings
(1 302 440) (721 362)
Net cash Net cash Net cash Net cash generated from financing activitiesgenerated from financing activitiesgenerated from financing activitiesgenerated from financing activities
1 057 418 1 057 418 1 057 418 1 057 418 1 073 418 1 073 418 1 073 418 1 073 418
Net cash inflow/(outflow)Net cash inflow/(outflow)Net cash inflow/(outflow)Net cash inflow/(outflow)
2 984 289 2 984 289 2 984 289 2 984 289 (553 712)(553 712)(553 712)(553 712)
of which currency translation differences
347 178 19 005
Cash and cash equivalents at the beginning of the period
8 438 681 8 992 393
Cash and cash equivalents at the end of the periodCash and cash equivalents at the end of the periodCash and cash equivalents at the end of the periodCash and cash equivalents at the end of the period 43 11 422 970 11 422 970 11 422 970 11 422 970 8 438 681 8 438 681 8 438 681 8 438 681
of which restricted 40 3 923 6 950

This document is a translation of a document originally issued in Polish. The only binding version is the original Polish version.
Consolidated Financial Statements of the Powszechna Kasa Oszczędności Bank Polski Spółka Akcyjna Group
for the year ended 31 December 2011 (in PLN thousand)
8
NOTES TO THE NOTES TO THE NOTES TO THE NOTES TO THE CONSOLIDATED CONSOLIDATED CONSOLIDATED CONSOLIDATED FINANCIAL STATEMENTSFINANCIAL STATEMENTSFINANCIAL STATEMENTSFINANCIAL STATEMENTS
NOTES TO NOTES TO NOTES TO NOTES TO THE CONSOLIDATED FINTHE CONSOLIDATED FINTHE CONSOLIDATED FINTHE CONSOLIDATED FINANCIAL STATEMENTSANCIAL STATEMENTSANCIAL STATEMENTSANCIAL STATEMENTS 8
NOTES TO THE CONSOLINOTES TO THE CONSOLINOTES TO THE CONSOLINOTES TO THE CONSOLIDATED FINANCIAL STATDATED FINANCIAL STATDATED FINANCIAL STATDATED FINANCIAL STATEMENTSEMENTSEMENTSEMENTS 11
1. General information 11
2. Summary of significant accounting policies and estimates and judgements 15
3. Information on the segments of activities 48
NOTES TO THE CONSOLIDATED INCOME STATEMENTNOTES TO THE CONSOLIDATED INCOME STATEMENTNOTES TO THE CONSOLIDATED INCOME STATEMENTNOTES TO THE CONSOLIDATED INCOME STATEMENT 51515151
4. Interest income and expense 51
5. Fee and commission income and expense 52
6. Dividend income 53
7. Net income from financial instruments designated at fair value 53
8. Net gains/(losses) on investment securities 53
9. Net foreign exchange gains 54
10. Other operating income and expense 54
11. Net impairment allowance and write-downs 55
12. Administrative expenses 57
13. Share of profit (loss) of associates and jointly controlled entities 57
14. Income tax expense 58
15. Earnings per share 60
16. Dividends paid (in total and per share) on ordinary shares and other shares 60
NOTES TO THE CONSOLIDATED STATEMENT OF FINANCIAL POSITIONNOTES TO THE CONSOLIDATED STATEMENT OF FINANCIAL POSITIONNOTES TO THE CONSOLIDATED STATEMENT OF FINANCIAL POSITIONNOTES TO THE CONSOLIDATED STATEMENT OF FINANCIAL POSITION 60606060
17. Cash and balances with the central bank 60
18. Amounts due from banks 61
19. Trading assets 61
20. Derivative financial instruments 64
21. Derivative hedging instruments 67
22. Financial assets designated upon initial recognition at fair value through profit and loss 71
23. Loans and advances to customers 73
24. Investment securities available for sale 75
25. Investments in jointly controlled entities and associates 78
26. Inventories 80
27. Intangible assets 80
28. Tangible fixed assets 82
29. Other assets 84
30. Amounts due to the Central Bank 85
31. Amounts due to banks 85

This document is a translation of a document originally issued in Polish. The only binding version is the original Polish version.
Consolidated Financial Statements of the Powszechna Kasa Oszczędności Bank Polski Spółka Akcyjna Group
for the year ended 31 December 2011 (in PLN thousand)
9
32. Amounts due to customers 85
33. Debt securities in issue 86
34. Subordinated liabilities 86
35. Other liabilities 87
36. Provisions 87
37. Share capital 88
38. Other capital 89
OTHER NOTESOTHER NOTESOTHER NOTESOTHER NOTES 89898989
39. Transferred financial assets which do not qualify for derecognition from consolidated statement of financial position 89
40. Pledged assets 89
40.1. Liabilities from negative valuation of financial instruments 89
40.2. Liabilities from sell-buy-back transactions (SBB) 89
40.3. Bank deposit guarantee fund 89
40.4. Guarantee Fund for the Settlement of Stock Exchange Transactions 89
41. Contingent liabilities 90
42. Legal claims 91
43. Supplementary information to the consolidated cash flow statement 93
44. Transactions with the State Treasury and related entities 95
45. Related party transactions 98
46. Personal related party transactions 98
47. Remuneration – PKO Bank Polski SA key management 98
48. Changes to the entities of the Group, jointly controlled entities and associates 99
49. Fair value of financial assets and financial liabilities 104
49.1. Categories of valuation at fair value of financial assets and liabilities measured at fair value in the statement of financial position 104
49.2. Financial assets and liabilities not presented at fair value in the statement of financial position 108
50. Fiduciary activities 109
51. Sale of impaired loan portfolios 109
52. Differences between previously published financial statements and these financial statements 110
53. Influence of macroeconomic situation on the Group’s results 110
OBJECTIVES AND PRINCIPLES OF RISK MANAGEMENT RELATED TO FINANCIAL INSTRUMENTSOBJECTIVES AND PRINCIPLES OF RISK MANAGEMENT RELATED TO FINANCIAL INSTRUMENTSOBJECTIVES AND PRINCIPLES OF RISK MANAGEMENT RELATED TO FINANCIAL INSTRUMENTSOBJECTIVES AND PRINCIPLES OF RISK MANAGEMENT RELATED TO FINANCIAL INSTRUMENTS 111111111111
54. Risk management in the Group 111
55. Credit risk management 116
56. Interest rate risk management 133
57. Currency risk management 135
58. Liquidity risk management 138
59. Management of price risk of equity securities 144

This document is a translation of a document originally issued in Polish. The only binding version is the original Polish version.
Consolidated Financial Statements of the Powszechna Kasa Oszczędności Bank Polski Spółka Akcyjna Group
for the year ended 31 December 2011 (in PLN thousand)
10
60. Other price risk 144
61. Management of derivative instruments risk 144
62. Operational risk management 145
63. Compliance risk management 147
64. Strategic risk management 148
65. Reputation risk management 149
66. Capital adequacy 149
INFORMATION ON THE ENTITY AUTHORISED TO AUDIT FINANCIAL STATEMENTS AND EVENTS AFTER THE INFORMATION ON THE ENTITY AUTHORISED TO AUDIT FINANCIAL STATEMENTS AND EVENTS AFTER THE INFORMATION ON THE ENTITY AUTHORISED TO AUDIT FINANCIAL STATEMENTS AND EVENTS AFTER THE INFORMATION ON THE ENTITY AUTHORISED TO AUDIT FINANCIAL STATEMENTS AND EVENTS AFTER THE REPORTING PERIODREPORTING PERIODREPORTING PERIODREPORTING PERIOD 155155155155
67. Information on the entity authorised to audit financial statements 155
68. Events after the reporting period 155
This document is a translation of a document originally issued in Polish. The only binding version is the original Polish version.
Consolidated Financial Statements of the Powszechna Kasa Oszczędności Bank Polski Spółka Akcyjna Group
for the year ended 31 December 2011 (in PLN thousand)
11
NOTES TO THENOTES TO THENOTES TO THENOTES TO THE CONSOLIDATED CONSOLIDATED CONSOLIDATED CONSOLIDATED FINANCIAL FINANCIAL FINANCIAL FINANCIAL STATEMENTSSTATEMENTSSTATEMENTSSTATEMENTS
1.1.1.1. General informationGeneral informationGeneral informationGeneral information
Consolidated financial statements of the Powszechna Kasa Oszczędności Bank Polski SA Group (‘the PKO Bank Polski SA Group’, ‘the Group’) have been prepared for the year ended 31 December 2011 and include comparative data for the year ended 31 December 2010. Data has been presented in PLN thousand unless indicated otherwise.
The parent company of the Powszechna Kasa Oszczędności Bank Polski Spółka Akcyjna Group is Powszechna Kasa Oszczędności Bank Polski Spółka Akcyjna (‘PKO Bank Polski SA’, ‘the parent company’, ‘the Bank’).
The parent company was established in 1919 as the Pocztowa Kasa Oszczędnościowa. Since 1950 the parent company operated as the Powszechna Kasa Oszczędności State-owned bank. Pursuant to the Decree of the Council of Ministers dated 18 January 2000 (Journal of Laws No. 5, item 55 with subsequent amendments) Powszechna Kasa Oszczędności (a State-owned bank) was transformed into a state-owned joint-stock company, Powszechna Kasa Oszczędności Bank Polski Spółka Akcyjna with its head office in Warsaw, Puławska 15, 02-515 Warsaw, Poland.
On 12 April 2000, Powszechna Kasa Oszczędności Bank Polski Spółka Akcyjna was entered into the Register of Companies by the District Court for the capital city of Warsaw, Commercial Court XVI Registration Department. At present, the appropriate Court of Registration is the District Court for the capital city of Warsaw, XIII Economic Department of the National Court Register. The Bank was registered under entry No. KRS 0000026438 and was granted a statistical REGON No. 016298263. The Bank's paid share capital amounts to PLN 1 250 000 thousand.
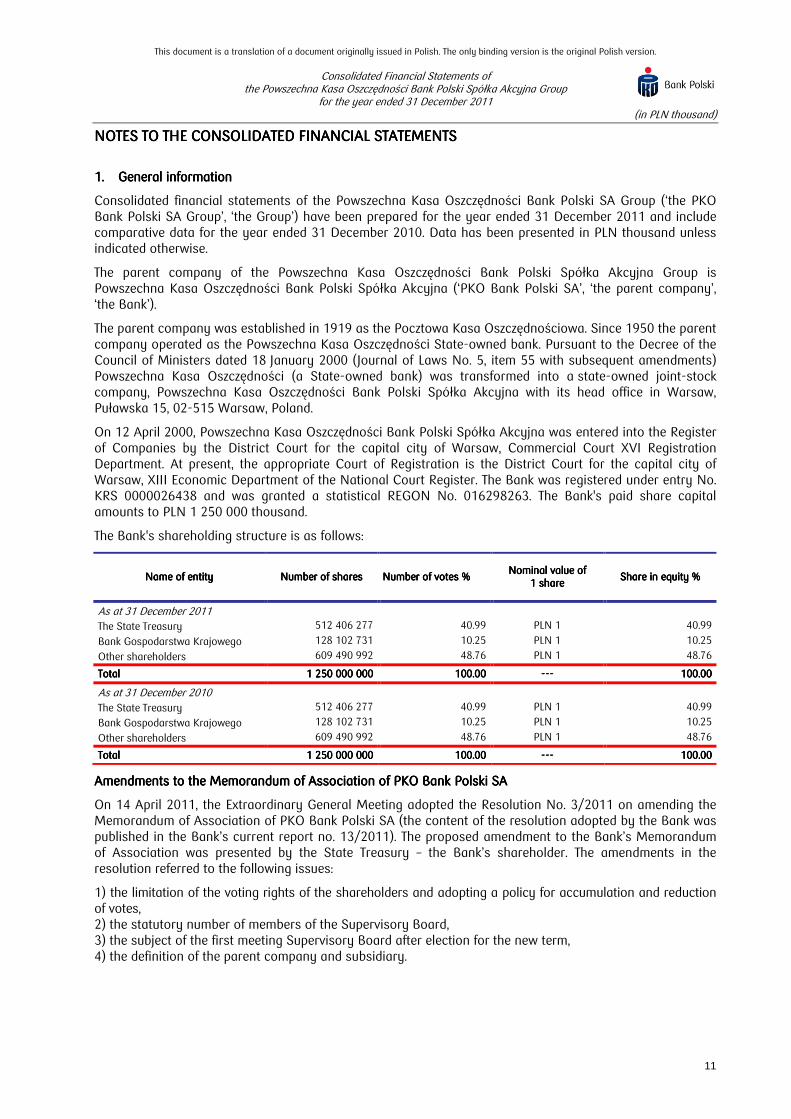
The Bank's shareholding structure is as follows:
Name of entityName of entityName of entityName of entity Number of sharesNumber of sharesNumber of sharesNumber of shares Number of votesNumber of votesNumber of votesNumber of votes %%%% Nominal value of Nominal value of Nominal value of Nominal value of
1111 shareshareshareshare Share in equityShare in equityShare in equityShare in equity %%%%
As at 31 December 2011 The State Treasury 512 406 277 40.99 PLN 1 40.99
Bank Gospodarstwa Krajowego 128 102 731 10.25 PLN 1 10.25
Other shareholders 609 490 992 48.76 PLN 1 48.76
TotalTotalTotalTotal 1 250 000 0001 250 000 0001 250 000 0001 250 000 000 100.00100.00100.00100.00 ------------ 100.00100.00100.00100.00
As at 31 December 2010 The State Treasury 512 406 277 40.99 PLN 1 40.99
Bank Gospodarstwa Krajowego 128 102 731 10.25 PLN 1 10.25
Other shareholders 609 490 992 48.76 PLN 1 48.76
TotalTotalTotalTotal 1 250 000 0001 250 000 0001 250 000 0001 250 000 000 100.00100.00100.00100.00 ------------ 100.00100.00100.00100.00
Amendments to the Amendments to the Amendments to the Amendments to the MemorandumMemorandumMemorandumMemorandum of Association of PKO Bank Polski SAof Association of PKO Bank Polski SAof Association of PKO Bank Polski SAof Association of PKO Bank Polski SA
On 14 April 2011, the Extraordinary General Meeting adopted the Resolution No. 3/2011 on amending the Memorandum of Association of PKO Bank Polski SA (the content of the resolution adopted by the Bank was published in the Bank’s current report no. 13/2011). The proposed amendment to the Bank’s Memorandum of Association was presented by the State Treasury – the Bank’s shareholder. The amendments in the resolution referred to the following issues:
1) the limitation of the voting rights of the shareholders and adopting a policy for accumulation and reduction of votes, 2) the statutory number of members of the Supervisory Board, 3) the subject of the first meeting Supervisory Board after election for the new term, 4) the definition of the parent company and subsidiary.

This document is a translation of a document originally issued in Polish. The only binding version is the original Polish version.
Consolidated Financial Statements of the Powszechna Kasa Oszczędności Bank Polski Spółka Akcyjna Group
for the year ended 31 December 2011 (in PLN thousand)
12
The amendments to the Memorandum of Association of PKO Bank Polski SA referred to above, implemented by the Extraordinary General Meeting of the Bank on 14 April 2011, were registered with the National Court Register by the District Court for the capital city of Warsaw, the XIII Economic Department of the National Court Register
As an effect of the above amendments, the announced decrease in share of the State Treasury in the equity of PKO Bank Polski SA, which may reoccur in subsequent years (although the share will not drop below 25%), will not lead to limiting the control of the State Treasury over the Bank’s strategic decisions.
The Bank is a listed company on the Warsaw Stock Exchange. According to the Warsaw Stock Exchange Bulletin (Ceduła Giełdowa), the Bank is classified under the macro-sector ‘Finance’, sector ‘Banks’.
Business activitiesBusiness activitiesBusiness activitiesBusiness activities of the Groupof the Groupof the Groupof the Group
PKO Bank Polski SA is a commercial bank offering services to both domestic and foreign retail, corporate and other clients. PKO Bank Polski SA is licensed to hold foreign exchange and currencies and sell/buy them, as well as perform a full range of foreign exchange services, open and hold bank accounts abroad and to deposit foreign exchange in these accounts.
In addition, through its subsidiaries, the Group conducts activities relating to leasing, factoring, investment funds, pension funds, Internet banking as well as servicing and settlement of card transactions and real estate development. The scope of activities of each of the Group entities is set out in this note, in the table ‘Structure of the PKO Bank Polski SA Group’.
The Group operates in the Republic of Poland and through its subsidiaries, KREDOBANK SA, Finansowa Kompania ‘Prywatne Inwestycje’ Sp. z o.o. and UKRPOLINWESTYCJE Sp. z o.o. – in Ukraine and through its subsidiary PKO Finance AB in Sweden.

This document is a translation of a document originally issued in Polish. The only binding version is the original Polish version.
Consolidated Financial Statements of the Powszechna Kasa Oszczędności Bank Polski Spółka Akcyjna Group
for the year ended 31 December 2011 (in PLN thousand)
13
Structure of the Structure of the Structure of the Structure of the PKO Bank Polski SAPKO Bank Polski SAPKO Bank Polski SAPKO Bank Polski SA GrouGrouGrouGroupppp
The PKO Bank Polski SA Group consists of the following entities:
Parent Company
Direct subsidiaries
Indirect subsidiaries
Indirect subsidiaries
Indirect subsidiaries
Qualia Development Sp. z o.o.1,2
(real estate development, Warsaw)
100.00*
100.00**
PKO BANK POLSKI SA
Bankowy Fundusz Leasingowy SA (leasing services, Łódź)
100.00
100.00**
Centrum Elektronicznych Usług Płatniczych 'eService' SA (servicing and settlement of card transactions, Warsaw)
100.00
100.00*
Centrum Finansowe Puławska Sp. z o.o. -inliquidation (Warsaw)
100.00*
100.00**
Bankowe Towarzystwo Kapitałowe SA (financial services, Warsaw)
100.00*
100.00**
Fort Mokotów Inwestycje Sp. z o.o.6
(real estate development, Warsaw)
99.9885*
99.9885**
Inteligo Financial Services SA (internet banking, Warsaw)
100.00*
100.00**
KREDOBANK SA (financial services, Lviv, Ukraine)
99.5655*
99.5655**
PKO BP BANKOWY Powszechne Towarzystwo Emerytalne SA(pension fund management, Warsaw)
100.00*
100.00**
PKO BP Finat Sp. z o.o.10
(intermediary financial services, Warsaw)
100.00*
-**
PKO Finance AB (financial services, Stockholm, Sweden)
100.00*
100.00**
PKO Towarzystwo Funduszy Inwestycyjnych SA (investment fund management, Warsaw)
100.00*
100.00**
Finansowa Kompania 'Prywatne Inwestycje' Sp. z o.o. (factoring, Kiev, Ukraine)
100.00*
-**
Qualia Sp. z o.o. (general partner in limited partnerships of the Qualia Development Group entities, Warsaw)
100.00*
-**
Qualia spółka z ograniczoną odpowiedzialnością - Neptun Park Sp. k. 3
(real estate development, Warsaw)
99.9975*
99.9975**
Qualia spółka z ograniczoną odpowiedzialnością - Nowy Wilanów Sp. k. 5
(real estate development, Warsaw)
99.9750*
99.9750**
Qualia spółka z o.o. - Sopot Sp. k. (real estate development, Warsaw)
99.9787*
-**
Qualia spółka z ograniczoną odpowiedzialnością - Pomeranka Sp. k.(real estate development, Warsaw)
50.00*
-**
Qualia spółka z ograniczoną odpowiedzialnością - Projekt 1 Sp. k. (real estate development, Warsaw)
50.00*
-**
Qualia - Rezydencja Flotylla Sp. z o.o.8
(real estate development, Warsaw)
100.00*
100.00**
Sarnia Dolina Sp. z o.o. 9
(real estate development, Warsaw)
56.00*
56.00**
Fort Mokotów Sp. z o.o. - in liquidations(Warsaw)
51.00*
51.00**
UKRPOLINWESTYCJE Sp. z o.o. (real estate development, Kiev, Ukraine)
55.00*
55.00**
Qualia - Residence Sp. z o.o. (real estate development, Warsaw)
100.00*
-**
Qualia Hotel Management Sp. z o.o.11
(real estate development, Warsaw)
99.90*
-**
Bankowy Leasing Sp. z o.o. (leasing services, Łódź)
100.00*
99.9978**
BFL Nieruchomości Sp. z o.o. 4
(leasing services, Łódź)
-*
99.9952**
PKO BP Faktoring SA 7
(factoring, Warsaw)
99.9889*
99.9867**
* % share in equity as at 31.12.2011 ** % share in equity as at 31.12.2010
1) the previous name PKO BP Inwestycje Sp. z o.o. 2) in limited partnerships of Qualia Development Group the limited partner is Qualia Development Sp. z o.o. and the general partner is Qualia Sp. z o.o.;
in the position of share capital, the total contributions made by the limited partner is presented 3) the Company was established as a result of transformation of the company PKO BP Inwestycje - Neptun Park Sp. z o.o. 4) the Company was removed from the National Court Register as a result of the merger with Bankowy Leasing Sp. z o.o. 5) the Company was established as a result of transformation of the company PKO BP Inwestycje - Nowy Wilanów Sp. z o.o. 6) the second shareholder of the entity is Qualia Development Sp. z o.o. 7) PKO Bank Polski SA holds 1 share in the Entity 8) the previous name of the entity was PKO BP Inwestycje – Rezydencja Flotylla Sp. z o.o. 9) the previous name of the entity was PKO BP Inwestycje – Sarnia Dolina Sp. z o.o. 10) formerly the subsidiary of Inteligo Financial Services SA 11) the second shareholder of the entity is Qualia Sp. z o.o.
This document is a translation of a document originally issued in Polish. The only binding version is the original Polish version.
Consolidated Financial Statements of the Powszechna Kasa Oszczędności Bank Polski Spółka Akcyjna Group
for the year ended 31 December 2011 (in PLN thousand)
14
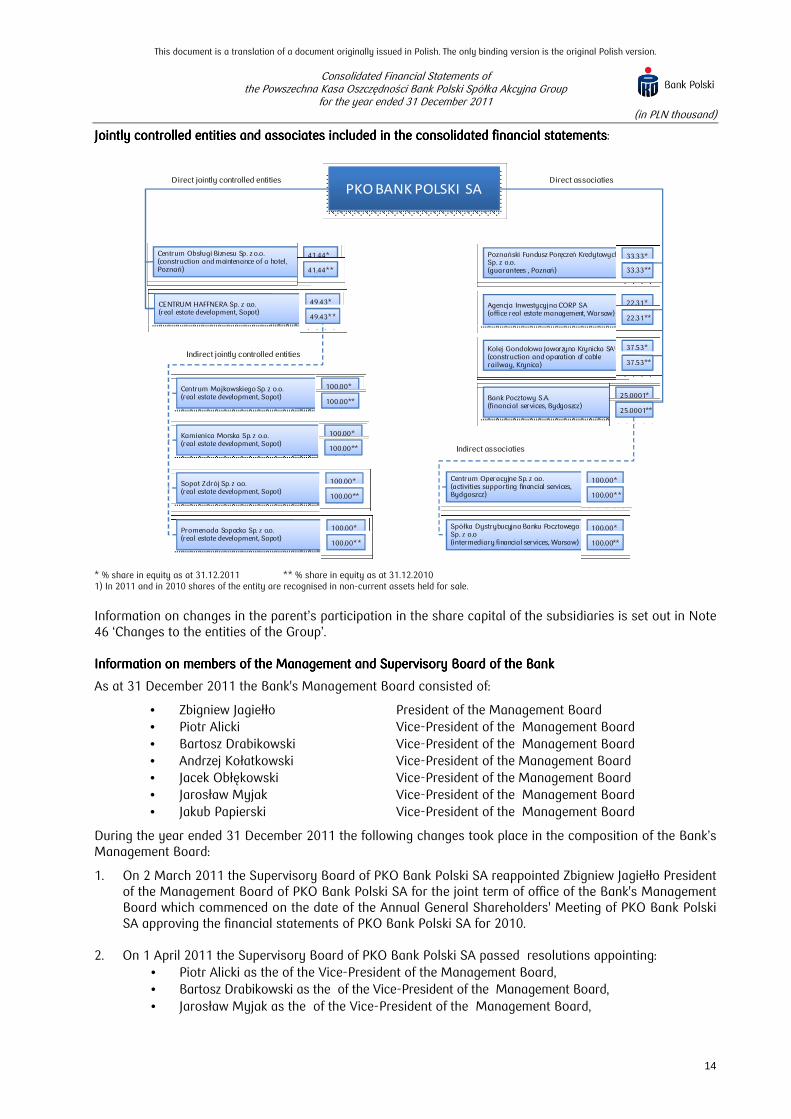
Jointly Jointly Jointly Jointly controlled entities and associates included in the consolidated financial statementscontrolled entities and associates included in the consolidated financial statementscontrolled entities and associates included in the consolidated financial statementscontrolled entities and associates included in the consolidated financial statements:
Direct jointly controlled entities
Indirect jointly controlled entities
Indirect associaties
Direct associaties
PKO BANK POLSKI SA
Centrum Obsługi Biznesu Sp. z o.o. (construction and maintenance of a hotel, Poznań)
41.44*
41.44**
CENTRUM HAFFNERA Sp. z o.o.(real estate development, Sopot)
49.43*
49.43**
Kolej Gondolowa Jaworzyna Krynicka SA1
(construction and oparation of cable railway, Krynica)
37.53*
37.53**
Agencja Inwestycyjna CORP SA(office real estate management, Warsaw)
22.31*
22.31**
Poznański Fundusz Poręczeń Kredytowych Sp. z o.o. (guarantees , Poznań)
33.33*
33.33**
Centrum Majkowskiego Sp. z o.o.(real estate development, Sopot)
100.00*
100.00**Bank Pocztowy S.A.(financial services, Bydgoszcz)
25.0001*
25.0001**
Centrum Operacyjne Sp. z o.o.(activities supporting financial services, Bydgoszcz)
100.00*
100.00**
Spółka Dystrybucyjna Banku PocztowegoSp. z o.o(intermediary financial services, Warsaw)
100.00*
100.00**
Kamienica Morska Sp. z o.o.(real estate development, Sopot)
100.00*
100.00**
Sopot Zdrój Sp. z o.o.(real estate development, Sopot)
100.00*
100.00**
Promenada Sopocka Sp. z o.o.(real estate development, Sopot)
100.00*
100.00**
* % share in equity as at 31.12.2011 ** % share in equity as at 31.12.2010 1) In 2011 and in 2010 shares of the entity are recognised in non-current assets held for sale.
Information on changes in the parent’s participation in the share capital of the subsidiaries is set out in Note 46 ‘Changes to the entities of the Group’.
Information on members of the ManagemeInformation on members of the ManagemeInformation on members of the ManagemeInformation on members of the Management and Supervisory Board of nt and Supervisory Board of nt and Supervisory Board of nt and Supervisory Board of the Bankthe Bankthe Bankthe Bank
As at 31 December 2011 the Bank's Management Board consisted of:
• Zbigniew Jagiełło President of the Management Board • Piotr Alicki Vice-President of the Management Board • Bartosz Drabikowski Vice-President of the Management Board • Andrzej Kołatkowski Vice-President of the Management Board • Jacek Obłękowski Vice-President of the Management Board • Jarosław Myjak Vice-President of the Management Board • Jakub Papierski Vice-President of the Management Board
During the year ended 31 December 2011 the following changes took place in the composition of the Bank’s Management Board:
1. On 2 March 2011 the Supervisory Board of PKO Bank Polski SA reappointed Zbigniew Jagiełło President of the Management Board of PKO Bank Polski SA for the joint term of office of the Bank's Management Board which commenced on the date of the Annual General Shareholders' Meeting of PKO Bank Polski SA approving the financial statements of PKO Bank Polski SA for 2010.
2. On 1 April 2011 the Supervisory Board of PKO Bank Polski SA passed resolutions appointing: • Piotr Alicki as the of the Vice-President of the Management Board, • Bartosz Drabikowski as the of the Vice-President of the Management Board, • Jarosław Myjak as the of the Vice-President of the Management Board,

This document is a translation of a document originally issued in Polish. The only binding version is the original Polish version.
Consolidated Financial Statements of the Powszechna Kasa Oszczędności Bank Polski Spółka Akcyjna Group
for the year ended 31 December 2011 (in PLN thousand)
15
• Jacek Obłękowski as the of the Vice-President of the Management Board, • Jakub Papierski as the of the Vice-President of the Management Board.
In accordance with the resolutions passed, the above-mentioned persons were appointed to the specified positions at PKO Bank Polski SA for the joint term of office of the Bank’s Management Board which commenced on the date of the Annual General Shareholders' Meeting of PKO Bank Polski SA approving the financial statements of PKO Bank Polski SA for 2010.
3. On 16 May 2011, the Supervisory Board of PKO Bank Polski SA passed a resolution appointing Andrzej Kołatkowski the Vice-President of the Bank's Management Board responsible for risk and debt collection area for the joint term of office of the Bank's Management Board, which commenced on the date of the Annual General Shareholders’ Meeting of PKO Bank Polski SA approving the financial statements of PKO Bank Polski SA for 2010, provided that the approval of the Polish Financial Supervision Authority is obtained. On 9 August 2011, the Polish Financial Supervision Authority has approved unanimously Andrzej Kołatkowski as Vice-President of the Bank’s Management Board.
During the year ended 31 December 2011, the following change took place in the composition of the Bank’s Supervisory Board:
The Annual General Shareholders’ Meeting of the Bank convened for 30 June 2011, appointed the following members of the Bank’s Supervisory Board:
• Cezary Banasiński, • Tomasz Zganiacz, • Jan Bossak, • Mirosław Czekaj, • Krzysztof Kilian, • Ewa Miklaszewska, • Piotr Marczak, • Marek Mroczkowski, • Ryszard Wierzba.
The State Treasury, as Authorised Shareholder, has established the list of 9 members of Supervisory Board and has appointed:
• Cezary Banasiński – as the Chairman of the Bank’s Supervisory Board, • Tomasz Zganiacz – as the Deputy Chairman of the Bank’s Supervisory Board.
Approval of financial statementsApproval of financial statementsApproval of financial statementsApproval of financial statements
These consolidated financial statements, reviewed by the Bank’s Supervisory Board’s Audit Committee on 29 February 2012, have been approved for issue by the Bank’s Management Board on 23 February 2012 and accepted by the Bank’s Supervisory Board on 29 February 2012.
2.2.2.2. Summary of significant accounting policies and estimates and judgementsSummary of significant accounting policies and estimates and judgementsSummary of significant accounting policies and estimates and judgementsSummary of significant accounting policies and estimates and judgements
2.1.2.1.2.1.2.1. Compliance with accounting standardsCompliance with accounting standardsCompliance with accounting standardsCompliance with accounting standards
These consolidated financial statements have been prepared in accordance with the International Financial Reporting Standards (IFRS) as adopted by the EU as at 31 December 2011, and in the areas not regulated by these standards, in accordance with the requirements of the Accounting Act of 29 September 1994 (Journal of Laws of 2009, no. 152, item 1223 with subsequent amendments) and the respective secondary legislation issued on its basis, as well as the requirements relating to issuers of securities registered or applying for registration on an official quotations market.
The European Commission has adopted IAS 39 ‘Financial Instruments: Recognition and Measurement’ except some decisions concerning hedge accounting. Due to the fact that the Bank applies IFRS as adopted by the European Union (‘EU’), the Bank has applied the IAS 39.AG99C in the form adopted by the EU, which allows to designate as a hedged item a portion of cash flows from variable rate deposits for which the effective interest rate is lower than the reference interest rate (not including margins). The IAS 39 as issued by the

This document is a translation of a document originally issued in Polish. The only binding version is the original Polish version.
Consolidated Financial Statements of the Powszechna Kasa Oszczędności Bank Polski Spółka Akcyjna Group
for the year ended 31 December 2011 (in PLN thousand)
16
IASB introduces limitations in that respect.
2.2.2.2.2.2.2.2. GoingGoingGoingGoing concernconcernconcernconcern
The consolidated financial statements of the PKO Bank Polski SA Group have been prepared on the basis that the Group will continue as a going concern during a period of 12 months from the issue date, i.e. since 5 March 2012.
As at the date of signing these consolidated financial statements, the Bank’s Management Board is not aware of any facts or circumstances that would indicate a threat to the continuing activity of the PKO Bank Polski SA Group for 12 months following the issue date as a result of any intended or compulsory withdrawal or significant limitation in the activities of the PKO Bank Polski SA Group.
2.3.2.3.2.3.2.3. Basis of preparation of the financial statementsBasis of preparation of the financial statementsBasis of preparation of the financial statementsBasis of preparation of the financial statements
These financial statements have been prepared on a fair value basis in respect of financial assets and liabilities at fair value through profit and loss, including derivatives and financial assets available for sale, with the exception of those for which the fair value cannot be reliably estimated. Other financial assets and liabilities (including loans and advances) are measured at amortised cost with an allowance for impairment losses or at cost with an allowance for impairment losses.
Non-current assets are stated at acquisition cost less accumulated depreciation and impairment allowances. The Group measures non-current assets (or groups of the above-mentioned assets) classified as held for sale at the lower of their carrying amount and fair value less costs to sell.
2.4.2.4.2.4.2.4. Basis of consolidationBasis of consolidationBasis of consolidationBasis of consolidation
2.4.1.2.4.1.2.4.1.2.4.1. SubsidiariesSubsidiariesSubsidiariesSubsidiaries
Subsidiaries are entities (including entities which are not incorporated, such as general partnerships) controlled by the parent company, which means that the parent company has a direct or indirect impact on the financial and operating policy of the given entity in order to gain economic benefits from its operations.
Control is exercised when the parent company holds directly or indirectly more than one-half of the voting rights in a given entity, unless in special circumstances it may be proven that such holdings do not lead to exercising control. Control is also exercised when the Bank has one-half or less voting rights in a given entity and when:
1) it has more than one-half of votes on the basis of agreements with other investors, 2) it is capable of managing the entity’s financial and operational policy on the basis of the
Memorandum of Association or an agreement, 3) it is capable of appointing and removing most of the Management Board or any equivalent
management body where the Management Board or equivalent body exercises control over the entity, or
4) it has the majority of votes at the Management Board’s or any equivalent management body’s meetings where the Management Board or equivalent body exercises control over the entity.
Subsidiaries are fully consolidated from the date on which control was acquired until the day until it ceased.
The ‘full’ method of consolidation requires the adding up of all full amounts of the individual items of statement of financial position, income statement of the subsidiaries and of the Bank, and making appropriate consolidation adjustments and eliminations. The carrying amount of the Bank's investments in subsidiaries and the equity of these entities at the date of their acquisition are eliminated at consolidation. The following items are eliminated in full at consolidation:
1) inter-company receivables and payables, and any other settlements of a similar nature, between the consolidated entities,
2) revenue and costs arising from business transactions conducted between the consolidated entities,

This document is a translation of a document originally issued in Polish. The only binding version is the original Polish version.
Consolidated Financial Statements of the Powszechna Kasa Oszczędności Bank Polski Spółka Akcyjna Group
for the year ended 31 December 2011 (in PLN thousand)
17
3) gains or losses from business transactions conducted between consolidated entities, included in the carrying amount of the assets of the consolidated entities, except for losses indicating impairment,
4) dividends accrued or paid by the subsidiaries to the parent company and to other consolidated entities,
5) inter-company cash flows in the cash flow statement.
The consolidated cash flow statement has been prepared on the basis of the consolidated statement of financial position, consolidated income statement and the additional notes and explanations.
The parent company and consolidated subsidiary reporting periods for the financial statements are co-terminous. Consolidation adjustments are made in order to eliminate any differences in the accounting policies applied by the Bank and its subsidiaries.
2.4.2.2.4.2.2.4.2.2.4.2. AcquisitionAcquisitionAcquisitionAcquisition methodmethodmethodmethod
The acquisition of subsidiaries by the Group is accounted for under the acquisition method.
As at the date of the acquisition, identifiable assets taken over, liabilities taken over and all non-controlling shares in the acquired entity are recognised separately from goodwill.
Identifiable assets and liabilities acquired are initially measured at fair value as at the acquisition date. In each and every business combination, all non-controlling shares in the acquired entity are measured at fair value or on a pro rata basis in respect of the share of the non-controlling shares in the identifiable net assets of the target entity.
Goodwill is recognised as at the acquisition date and measured as the excess of the total of:
1) the consideration provided, measured at fair value as at the date of the acquisition,
2) value of all non-controlling shares in the acquired entity, measured in accordance with the above rules, and
3) in the event of a business combination performed in stages, at fair value as at the date of acquiring interest in the capital of the acquired entity, which had been previously owned by the Bank
over the net amount of the value of identifiable assets and liabilities acquired, measured at fair value as at the acquisition date, determined as at the acquisition date.
If the net value, determined as at the acquisition date, of identifiable assets and liabilities acquired, measured at fair value as at the acquisition date is higher than the total of:
1) the consideration provided, measured at fair value as at the date of the acquisition,
2) value of all non-controlling shares in the acquired entity, measured in accordance with the above rules, and
3) in the event of a business combination performed in stages, at fair value as at the date of acquiring interest in the capital of the acquired entity, which had been previously owned by the Bank,
the difference is recognised directly in the income statement.
2.4.3.2.4.3.2.4.3.2.4.3. Associates and jointly controlled entitiesAssociates and jointly controlled entitiesAssociates and jointly controlled entitiesAssociates and jointly controlled entities
Associates are entities (including entities which are not incorporated, such as general partnerships) on which the Group exerts significant influence but whose financial and operating policies it does not control, which usually accompanies having from 20% to 50% of the total number of votes in the decision-making bodies of the entities.
Jointly controlled entities are trade companies or other entities, which are partly controlled by parent company or a significant investor and other shareholders or partners on the basis of the Memorandum of Association, company’s agreement or an agreement concluded for a period longer than one year.
Investments in associates and jointly controlled entities are accounted in accordance with the equity method and are initially stated at cost. The Group’s investment in associates and jointly controlled entities includes goodwill determined as at the acquisition date, net of any potential accumulated impairment allowances.
This document is a translation of a document originally issued in Polish. The only binding version is the original Polish version.
Consolidated Financial Statements of the Powszechna Kasa Oszczędności Bank Polski Spółka Akcyjna Group
for the year ended 31 December 2011 (in PLN thousand)
18
The Group’s share in the results of the associates and jointly controlled entities from the date of purchase has been recorded in the income statement and its share in changes of other comprehensive income from the date of purchase has been recorded in other comprehensive income. The carrying amount of investments is adjusted by the total movements in particular equity items from the date of their purchase. When the Group’s share in the losses of an associate or jointly controlled entity becomes equal or higher than the Group’s share in the associate or jointly controlled entity, which covers potential unsecured receivables, the Group discontinues recognising further losses unless it has assumed the obligation or has made payments on behalf of the given associate or jointly controlled entity.
Unrealised gains on transactions between the Group and its associates and jointly controlled entities are eliminated in proportion to the Group’s share in the above-mentioned entities. Unrealised losses are also eliminated unless the transaction proves that the given asset transferred has been impaired.
At each balance sheet date, the Group makes an assessment of whether there are any indicators of impairment in the value of investments in associates and jointly controlled entities. If any such indicators exist, the Group estimates the value in use of the investment or the fair value of the investment less costs to sale, depending on which of these values is higher. If carrying amount of the asset exceeds its recovery value, the Group recognises an impairment allowance in the income statement. The projection for the value in use requires making assumptions, e.g. about future cash flows that the Group may receive from dividends or the cash inflows from a potential disposal of the investment, less costs of the disposal. The adoption of different assumptions with reference to the projected cash flows could affect the carrying amount of certain investments.
2.5.2.5.2.5.2.5. Foreign currenciesForeign currenciesForeign currenciesForeign currencies
2.5.1.2.5.1.2.5.1.2.5.1. Functional and presentation currencyFunctional and presentation currencyFunctional and presentation currencyFunctional and presentation currency
Items presented in the financial statements of the individual Group entities, including KREDOBANK SA, Finansowa Kompania ‘Prywatne Inwestycje’ Sp. z o.o., UKRPOLINWESTYCJE Sp. z o.o. and PKO Finance AB are measured in functional currency i.e. in the currency of the basic economic environment in which the given entity operates. The functional currency of the parent company and other entities included in these financial statements, except for KREDOBANK SA, Finansowa Kompania ‘Prywatne Inwestycje’ Sp. z o.o., UKRPOLINWESTYCJE Sp. z o.o. and PKO Finance AB is the Polish zloty. The functional currency of KREDOBANK SA, Finansowa Kompania ‘Prywatne Inwestycje’ Sp. z o.o. and UKRPOLINWESTYCJE Sp. z o.o. is the Ukrainian hrivna and the functional currency of PKO Finance AB is Euro.
Consolidated financial statements are presented in the Polish zloty, which is the functional and presentation currency of the Group.
2.5.2.2.5.2.2.5.2.2.5.2. Transactions and Transactions and Transactions and Transactions and balancesbalancesbalancesbalances denominated in foreign currenciesdenominated in foreign currenciesdenominated in foreign currenciesdenominated in foreign currencies
Foreign currency transactions are translated into the functional currency using exchange rates prevailing at the dates of the transactions. At each balance sheet date items are translated by the Group using the following principles:
1) monetary assets denominated in foreign currency are translated into Polish zloty using a closing rate i.e. the average rate communicated by the National Bank of Poland for a given currency prevailing at the balance sheet date,
2) non-monetary assets valued at historical cost in foreign currency are translated into Polish zloty using exchange rates prevailing on a day of a particular transaction,
3) non-monetary assets designated at fair value through profit and loss in foreign currency are translated into Polish zloty using exchange rates as at the date of the determination of fair value.
Gains and losses on settlements of these transactions and the carrying amount of monetary and monetary assets and liabilities denominated in foreign currencies are recognised in the income statement.

This document is a translation of a document originally issued in Polish. The only binding version is the original Polish version.
Consolidated Financial Statements of the Powszechna Kasa Oszczędności Bank Polski Spółka Akcyjna Group
for the year ended 31 December 2011 (in PLN thousand)
19
UAHUAHUAHUAH 2011201120112011 2010201020102010
Rate prevailing on the last day of the period 0.4255 0.3722 Rate representing the arithmetical mean of the rates prevailing on the last day of each month of the period
0.3716 0.3830
The highest rate in the period 0.4267 0.4406
The lowest rate in the period 0.3330 0.3423
EUREUREUREUR 2011201120112011 2010201020102010
Rate prevailing on the last day of the period 4.4168 3.9603 Rate representing the arithmetical mean of the rates prevailing on the last day of each month of the period
4.1401 4.0044
The highest rate in the period 4.5494 4.1458
The lowest rate in the period 3.9345 3.8622
2.6.2.6.2.6.2.6. Financial assets and liabilitiesFinancial assets and liabilitiesFinancial assets and liabilitiesFinancial assets and liabilities
2.6.1.2.6.1.2.6.1.2.6.1. ClassificationClassificationClassificationClassification
Financial assets are classified by the Group into the following categories: financial assets designated at fair value through profit and loss, financial assets available for sale, loans and other receivables, financial assets held to maturity. Financial liabilities are classified as follows: financial liabilities designated at fair value through profit and loss and other financial liabilities. The classification of financial assets and liabilities is determined by the Group on initial recognition.
2.6.1.1.2.6.1.1.2.6.1.1.2.6.1.1. Financial assets and liabilities designated at fair value through profit and lossFinancial assets and liabilities designated at fair value through profit and lossFinancial assets and liabilities designated at fair value through profit and lossFinancial assets and liabilities designated at fair value through profit and loss
A financial asset or financial liability at fair value through profit and loss is a financial asset or financial liability that meets either of the following conditions:
1) it is classified as held for trading. Financial assets or financial liabilities are classified as held for trading if it is acquired or incurred principally for the purpose of selling or repurchasing it in the near term, is a part of a portfolio of identified financial instruments that are managed together and for which there is evidence of a recent actual pattern of short-term profit-taking. A derivative is also classified as held for trading except for a derivative that is a designated and effective hedging instrument.
2) upon initial recognition it is classified as designated at fair value through profit and loss. The Group may use this designation only when:
a) the designated financial asset or liability is a hybrid instrument which includes one or more embedded derivatives qualifying for separate recognition, and the embedded derivative financial instrument cannot significantly change the cash flows resulting from the host contract or its separation from the hybrid instrument is forbidden,
b) it eliminates or significantly reduces a measurement or recognition inconsistency (sometimes referred to as 'an accounting mismatch' that would otherwise arise from measuring assets or liabilities or recognising the gains and losses on them on different basis),
c) a group of financial assets, financial liabilities or both is managed and its performance is evaluated on a fair value basis, in accordance with the written risk management principles or investment strategy of the Group.
The Group has a policy of financial assets and liabilities management according to which financial assets and liabilities classified as held for trading and financial assets and liabilities portfolio designated upon initial recognition at fair value through profit and loss are managed separately.

This document is a translation of a document originally issued in Polish. The only binding version is the original Polish version.
Consolidated Financial Statements of the Powszechna Kasa Oszczędności Bank Polski Spółka Akcyjna Group
for the year ended 31 December 2011 (in PLN thousand)
20
2.6.1.2.2.6.1.2.2.6.1.2.2.6.1.2. Financial assets available for saleFinancial assets available for saleFinancial assets available for saleFinancial assets available for sale
Financial assets available for sale are non-derivative financial assets that are designated as available for sale or are not classified as financial assets:
a) at fair value through profit and loss (designated by the Group upon initial recognition), b) held-to-maturity, c) those that meet the definition of loans and advances.
2.6.1.3.2.6.1.3.2.6.1.3.2.6.1.3. Loans, Loans, Loans, Loans, advances and other receivablesadvances and other receivablesadvances and other receivablesadvances and other receivables
Loans and advances and other receivables are non-derivative financial assets with fixed or determinable payments that are not quoted in an active market, other than:
1) those that the Group intends to sell immediately or in the near term, which are classified as held for trading, and those that the Group upon initial recognition designates as at fair value through profit and loss,
2) those that the Group upon initial recognition designates as available for sale,
3) those for which the holder may not recover substantially all of its initial investment, other than because of credit deterioration, which are classified as available for sale.
2.6.1.4.2.6.1.4.2.6.1.4.2.6.1.4. Financial assets held to maturityFinancial assets held to maturityFinancial assets held to maturityFinancial assets held to maturity
Financial assets held-to-maturity are non-derivative financial assets with fixed or determinable payments and fixed maturity that the Group has the positive intention and ability to hold to maturity other than:
1) those that the Group designates upon initial recognition at fair value through profit and loss,
2) those that the Group designates as available for sale,
3) those that meet the definition of loans and advances.
As at 31 December 2011 and as at 31 December 2010, the Group did not hold any assets classified to this category.
2.6.1.5.2.6.1.5.2.6.1.5.2.6.1.5. Other financial liabilitiesOther financial liabilitiesOther financial liabilitiesOther financial liabilities
Other financial liabilities are the financial liabilities other than measured at fair value through profit and loss which have the nature of a deposit, or a loan or an advance received.
2.6.2.2.6.2.2.6.2.2.6.2. Accounting for transactionsAccounting for transactionsAccounting for transactionsAccounting for transactions
Financial assets and financial liabilities, including forward transactions giving rise to an obligation or a right to acquire or sell in the future a given number of specified financial instruments at a given price, are recognised in the books of account under trade date, irrespective of the settlement date provided in the contract.
2.6.3.2.6.3.2.6.3.2.6.3. Derecognition of financial instruments from a statement of financial positionDerecognition of financial instruments from a statement of financial positionDerecognition of financial instruments from a statement of financial positionDerecognition of financial instruments from a statement of financial position
Financial assets are derecognised when contractual rights to the cash flows from the financial asset expire, or when the financial asset is transferred by the Group to another entity. The financial asset is transferred when the Group:
1) the contractual rights to receive the cash flows from the financial asset is transferred, or
2) the Group retains the contractual rights to receive cash flows from the financial asset, but assumes a contractual obligation to pay cash flows to an entity outside the Group.

This document is a translation of a document originally issued in Polish. The only binding version is the original Polish version.
Consolidated Financial Statements of the Powszechna Kasa Oszczędności Bank Polski Spółka Akcyjna Group
for the year ended 31 December 2011 (in PLN thousand)
21
When the Group transfers a financial asset, it evaluates the extent to which it retains the risks and rewards of ownership of the financial asset. In such cases:
1) if all the risks and rewards of ownership of the financial asset are substantially transferred, then the Group derecognises the financial asset from the statement of financial position,
2) if all the risks and rewards of ownership of the financial asset are substantially retained, then the financial asset continues to be recognised in the statement of financial position,
3) if substantially all the risks and rewards of ownership of the financial asset are neither transferred nor retained, then a determination is made as to whether control of the financial asset has been retained. If the Group has retained control, it continues to recognise the financial asset in the statement of financial position to the extent of its continuing involvement in the financial asset, if control has not been retained, then the financial asset is derecognised from the statement of financial position.
The Group does not reclassify financial instruments to or from the category of designated at fair value through profit and loss since they are held or issued.
The Group removes a financial liability (or a part of a financial liability) from its statement of financial position when the obligation specified in the contract is discharged or cancelled or expires.
The Group derecognises loans when they have been extinguished, when they are expired, or when they are not recoverable. Loans, advances and other amounts due are written off against impairment allowances that were recognised for these accounts. In the case where no allowances were recognised against the account or the amount of the allowance is less than the amount of the loan or other receivable, the loan or receivable is written off after, the amount of the impairment allowance is increased by the difference between the value of the receivable and the amount of the allowances that have been recognised to date.
2.6.4.2.6.4.2.6.4.2.6.4. Valuation Valuation Valuation Valuation
When a financial asset or liability is initially recognised, it is measured at its fair value plus, in the case of a financial asset or liability not designated at fair value through profit and loss, transaction costs that are directly attributable to the acquisition or the issue of the financial asset or liability.
Subsequent to the initial recognition financial instruments are valued as follows:
2.6.4.1.2.6.4.1.2.6.4.1.2.6.4.1. Assets and Assets and Assets and Assets and liabilities designated at fair value through profit and lossliabilities designated at fair value through profit and lossliabilities designated at fair value through profit and lossliabilities designated at fair value through profit and loss
Assets and liabilities designated at fair value through profit and loss are measured at fair value with the result transferred to the income statement to the item ‘net income from financial instruments at fair value through profit and loss’.
2.6.4.2.2.6.4.2.2.6.4.2.2.6.4.2. Financial assets available for saleFinancial assets available for saleFinancial assets available for saleFinancial assets available for sale
Financial assets available for sale (except for impairment allowances and currency translation differences) are measured at fair value, and gains and losses arising from changes in fair value are recognised in the other comprehensive income until the amount included in the other comprehensive income is reclassified to the income statement when a financial asset is derecognised from a statement of financial position. Interest determined using effective interest rate from financial assets available for sale is presented in the net interest income.
2.6.4.3.2.6.4.3.2.6.4.3.2.6.4.3. Loans, advances and investments held to maturityLoans, advances and investments held to maturityLoans, advances and investments held to maturityLoans, advances and investments held to maturity
They are measured at amortised cost with the use of effective interest rate and an allowance for impairment losses. In the case of loans and advances for which it is not possible to reliably estimate the future cash flows and the effective interest rate, loans advances and investments held to maturity are measured at costs to pay.

This document is a translation of a document originally issued in Polish. The only binding version is the original Polish version.
Consolidated Financial Statements of the Powszechna Kasa Oszczędności Bank Polski Spółka Akcyjna Group
for the year ended 31 December 2011 (in PLN thousand)
22
2.6.4.4.2.6.4.4.2.6.4.4.2.6.4.4. Other financial liabilities including liabilities resulting from the issue of securitiesOther financial liabilities including liabilities resulting from the issue of securitiesOther financial liabilities including liabilities resulting from the issue of securitiesOther financial liabilities including liabilities resulting from the issue of securities
They are measured at amortised cost. If the time schedule of cash flows from a financial instrument cannot be determined, and thus the effective interest rate cannot be determined fairly, the liability is measured at the amount of consideration due.
Debt instruments issued by the Group are recognised as other financial liabilities and measured at amortised cost.
2.6.4.5.2.6.4.5.2.6.4.5.2.6.4.5. Method of establishing fair value and amortised costMethod of establishing fair value and amortised costMethod of establishing fair value and amortised costMethod of establishing fair value and amortised cost
Fair value of debt and equity financial instruments (at fair value through profit and loss and available for sale), for which there is an active market, is determined with reference to market value (bid price) (LEVEL 1, Note 49).
Fair value of debt and equity financial instruments (designated at fair value through profit and loss and available for sale), for which there is no active market is determined as follows:
1) equity instruments designated at fair value through profit and loss and available for sale:
a) price of the last transaction concluded on the market, unless in the period between the date of the transaction and the balance date there were significant changes in market conditions which might affect the price (LEVEL 2, Note 49),
b) at valuation performed by a specialised external entity providing services of this kind (LEVEL 2 or LEVEL 3, Note 49),
2) debt instruments designated at fair value through profit and loss (LEVEL 2, Note 49):
a) the method based on market prices of securities (the market value method),
b) the method based on market interest rate quotation (the yield curve method),
c) the method based on market prices of securities with similar financial characteristics (the reference asset value method),
3) debt instruments available for sale:
a) the method based on market prices of securities (the market value method) (LEVEL 2, Note 49),
b) the method based on market interest rate quotation (the yield curve method), adjusted for a risk margin equal to the margin specified in the issue terms. Material changes in the market interest rates are reflected in the changes in the fair value of such instruments (LEVEL 2, Note 49),
c) the method based on market prices of securities with similar financial characteristics (the reference asset value method) (LEVEL 2, Note 49),
d) in the case of securities whose fair value cannot be established with the use of the methods mentioned above, the fair value is determined based on the internal valuation model (LEVEL 2 or LEVEL 3, Note 49).
If it is not possible to determine fair value, equity instruments are stated at acquisition cost less impairment losses (LEVEL 3, Note 49).
Amortised cost is the amount at which the financial instrument was measured at the date of initial recognition, decreased by principal repayments, and increased or decreased by the cumulative amortisation of any differences between that initial amount and the amount at maturity, and decreased by any impairment allowances. Amortised cost is determined using the effective interest rate - the rate that discounts the expected future cash flows to the net present value over the period to maturity or the date of next re-pricing, and which is the internal rate of return of the asset/liability for the given period. The calculation of this rate includes payments received/made by the Group which affect financial characteristics of the instrument, with exception of potential future losses related to non-performing loans. Commissions, fees and transaction costs which constitute an integral part of the effective return on a financial instrument, adjust their carrying amounts and are included in the calculation of the effective interest rate.
This document is a translation of a document originally issued in Polish. The only binding version is the original Polish version.
Consolidated Financial Statements of the Powszechna Kasa Oszczędności Bank Polski Spółka Akcyjna Group
for the year ended 31 December 2011 (in PLN thousand)
23
2.6.5.2.6.5.2.6.5.2.6.5. Derivative instrumentsDerivative instrumentsDerivative instrumentsDerivative instruments
2.6.5.1.2.6.5.1.2.6.5.1.2.6.5.1. Recognition and measurementRecognition and measurementRecognition and measurementRecognition and measurement
Derivative financial instruments are recognised at fair value from the trade date. A derivative instrument becomes an asset if its fair value is positive and it becomes a liability if its fair value is negative. The fair value of instruments that are actively traded on the market is their market price (LEVEL 1, Note 49). In other cases, fair value is derived with the use of valuation models which use data from an active market. Valuation techniques are based on discounted cash flow models, option models and yield curves (LEVEL 2, Note 49).
When the estimated fair value is lower or higher than the fair value as of the preceding balance date (for transactions concluded in the reporting period – initial fair value), the Group includes the difference, respectively, in the net income from financial instruments designated at fair value through profit and loss or in the net foreign exchange gains in correspondence with ‘Derivative financial instruments’. The above recognition method applies to derivative instruments which do not qualify to the application of hedge accounting. The method of recording hedging derivatives is presented in Note 2.6.6.4.
The result of the ultimate settlement of derivative instrument transactions is reflected in the result from financial instruments designated at fair value through profit and loss or in the foreign exchange gains.
The notional amount of the underlying instruments is presented in off-balance sheet items from the date of the transaction until maturity.
2.6.5.2.2.6.5.2.2.6.5.2.2.6.5.2. Embedded derivative instrumentsEmbedded derivative instrumentsEmbedded derivative instrumentsEmbedded derivative instruments
An embedded derivative is a component of a hybrid (combined) instrument that also includes a non-derivative host contract (both of a financial or non-financial nature), with the effect that some of the cash flows of the combined instrument vary in a way similar to a stand-alone derivative. An embedded derivative causes some or all of the cash flows that otherwise would be required by the contract to be modified according to a specified interest rate, financial instrument price, commodity price, foreign exchange rate, or other variable, provided in the case of a non-financial variable that the variable is not specific to a party to the contract.
An assessment of whether a given contract contains an embedded derivative instrument is made at the date of entering into a contract. A reassessment can only be made when there is a change in the terms of the contract that significantly modifies the cash flows that otherwise would be required under the contract.
Embedded derivative instruments separated from host contracts and recognised separately and accounting records are valued at fair value. Valuation is presented in the statement of financial position under ‘Derivative Financial Instruments’. Changes in the valuation at fair value of derivative instruments are recorded in the income statement under the ‘Net income from financial instruments designated at fair value through profit and loss’ or ‘Net foreign exchange gains’.
Derivative instruments are recognised separately from the host contract, if all of the following conditions are met:
1) the hybrid (combined) instrument is not measured at fair value, changes of fair value are not recognised in the income statement,
2) the economic characteristics and risks of the embedded derivative instrument are not closely related to the economic characteristics and risks of the host contract,
3) a separate instrument with the same characteristics as the embedded derivative would meet the definition of a derivative.
In case of contracts which are not financial instruments and which include an instrument that fulfils the above conditions, profits and losses from embedded derivatives are recorded in the income statement under the ‘Net income from financial instruments designated at fair value through profit and loss’ or ‘Net foreign exchange gains’.

This document is a translation of a document originally issued in Polish. The only binding version is the original Polish version.
Consolidated Financial Statements of the Powszechna Kasa Oszczędności Bank Polski Spółka Akcyjna Group
for the year ended 31 December 2011 (in PLN thousand)
24
2.6.6.2.6.6.2.6.6.2.6.6. Hedge accountingHedge accountingHedge accountingHedge accounting
2.6.6.1.2.6.6.1.2.6.6.1.2.6.6.1. Hedge accounting criteriaHedge accounting criteriaHedge accounting criteriaHedge accounting criteria
The Group applies hedge accounting when all the terms and conditions below, specified in IAS 39, have been met:
1) upon setting up the hedge, a hedge relationship, the purpose of risk management by the entity, and the hedging strategy was officially established. The documentation includes the identification of the hedging instrument, the hedged item or transaction, the nature of the hedged risk and the manner in which the entity will assess the effectiveness of the hedging instrument in compensating the threat of changes in fair value of the hedged item or the cash flows related to the hedged risk,
2) a hedge was expected to be highly effective in compensating changes to the fair value or cash flows resulting from the hedged risk in accordance with the initially documented risk management strategy relating to the specific hedge relationship,
3) in respect of cash flow hedges, the planned hedged transaction must be highly probable and must be exposed to changes in cash flows which may, as a result, have an impact on the income statement,
4) the effectiveness of a hedge may be reliably assessed, i.e. the fair value or cash flows related to the hedged item and resulting from the hedged risk, and the fair value of the hedging instrument, may be reliably measured,
5) the hedge is assessed on a current basis and its high effectiveness in all reporting periods for which the hedge had been established is determined.
2.6.6.2.2.6.6.2.2.6.6.2.2.6.6.2. Discontinuing hedge accounting Discontinuing hedge accounting Discontinuing hedge accounting Discontinuing hedge accounting
The Group discontinues hedge accounting when:
1) a hedge instrument expires, is sold, released or exercised (replacing one hedge instrument with another or extending the validity of a given hedge instrument is not considered to be expiration or release if the replacement or extension of period to maturity is part of the documented hedging strategy adopted by the entity). In such an instance accumulated gains or losses related to the hedging instrument which were recognised directly in other comprehensive income over the period in which the hedge was effective are recognised in a separate item in other comprehensive income until the planned transaction is effected,
2) the hedge ceases to meet the hedge accounting criteria. In such an instance accumulated gains or losses related to the hedging instrument which were recognised directly in other comprehensive income over the period in which the hedge was effective are recognised in a separate item in other comprehensive income until the planned transaction is effected,
3) the planned transaction is no longer considered probable, therefore, all the accumulated gains or losses related to the hedging instrument which were recognised directly in other comprehensive income over the period in which the hedge was effective, are recognised in the income statement.
4) the Group invalidates a hedge relationship.
2.6.6.3.2.6.6.3.2.6.6.3.2.6.6.3. Fair value hedgeFair value hedgeFair value hedgeFair value hedge
As at 31 December 2011 and 2010, the Group did not apply fair value hedge accounting.
This document is a translation of a document originally issued in Polish. The only binding version is the original Polish version.
Consolidated Financial Statements of the Powszechna Kasa Oszczędności Bank Polski Spółka Akcyjna Group
for the year ended 31 December 2011 (in PLN thousand)
25
2.6.6.4.2.6.6.4.2.6.6.4.2.6.6.4. Cash flows hedgesCash flows hedgesCash flows hedgesCash flows hedges
A cash flow hedge is a hedge against the threat of cash flow volatility which can be attributed to a specific type of risk related to a recorded asset or a liability (such as the whole or a portion of future interest payments on variable interest rate debt) or a highly probable planned transaction, and which could affect the income statement.
Changes in the fair value of a derivative financial instrument designated as a cash flow hedge are recognised directly in other comprehensive income in respect of the portion constituting the effective portion of the hedge. The ineffective portion of a hedge is recognised in the income statement in ‘Net income from financial instruments designated at fair value through profit and loss’.
Amounts transferred directly to other comprehensive income are recognised in the income statement in the same period or periods in which the hedged planned transaction affects the income statement.
The effectiveness tests comprise the valuation of hedging transactions, net of interest accrued and currency translation differences on the nominal value of the hedging transactions. These are shown in the income statement, in ‘Net interest income’ and ‘Net foreign exchange gains’ respectively.
2.6.7.2.6.7.2.6.7.2.6.7. Offsetting of financial instrumentsOffsetting of financial instrumentsOffsetting of financial instrumentsOffsetting of financial instruments
A financial asset or liability may only be offset when the Group has a valid legal title to offset it and the settlement needs to be performed on a net basis, or the asset and liability are realised at the same time.
2.7.2.7.2.7.2.7. TraTraTraTransactions with a commitment to sell or buy backnsactions with a commitment to sell or buy backnsactions with a commitment to sell or buy backnsactions with a commitment to sell or buy back
Sell-buy back, buy-sell back transactions are transactions for the sale or purchase of a security with a commitment to buy or sell back the security at an agreed date and price.
Sell-buy back transactions are recognised at the date of the transaction under amounts due to other banks or amounts due to customers in respect of deposits, depending on the contractor.
Buy-sell back securities are recognised under amounts due from banks or loans and advances to customers, depending on the counterparty.
Sell-buy back, buy-sell back are measured at amortised cost, whereas securities which are an element of a sell-buy back transaction are not derecognised in the statement of financial position and are measured at the terms and conditions specified for particular securities portfolios. The difference between the sale price and the repurchase price is recognised as interest expense/income, as appropriate, and it is amortised over the term of the contract using the effective interest rate.
2.8.2.8.2.8.2.8. Impairment of financial assetsImpairment of financial assetsImpairment of financial assetsImpairment of financial assets
2.8.1.2.8.1.2.8.1.2.8.1. Assets measured at amortiAssets measured at amortiAssets measured at amortiAssets measured at amortisedsedsedsed costcostcostcost
At each balance date for credit, loan or finance lease, an assessment is made of whether there is objective evidence that a given financial asset or a group of financial assets is impaired. If such evidence exists, the Group determines the amounts of impairment losses. An impairment loss is incurred when there is objective evidence of impairment due to one or more events that occurred after the initial recognition of the asset (‘a loss event’), when the loss has a reliably measurable impact on the expected future cash flows from the financial asset or group of financial assets.

This document is a translation of a document originally issued in Polish. The only binding version is the original Polish version.
Consolidated Financial Statements of the Powszechna Kasa Oszczędności Bank Polski Spółka Akcyjna Group
for the year ended 31 December 2011 (in PLN thousand)
26
Objective evidence that a financial asset or group of assets is impaired includes observable data that comes to the attention of the Group about the following events:
1) significant financial difficulties of the issuer or the debtor,
2) breach of a contract by the issuer or the debtor, such as a default or a delinquency in contracted payments of interest or principal,
3) granting of a concession by the lender to the issuer or the borrower, for economic or legal reasons relating to the borrower's financial difficulty, that the lender would not otherwise consider,
4) high probability of bankruptcy or other financial reorganisation of the issuer or the debtor,
5) disappearance of an active market for a given financial asset on the active market due to financial difficulties of the issuer or the debtor,
6) evidence that there is a measurable reduction in the estimated future cash flows from a group of financial assets, including collectability of these cash flows.
The Group firstly assesses impairment on an individual basis for significant receivables. If, for a given financial asset assessed individually, there are no objective indications of impairment, the asset is included in a group of financial assets with similar characteristics, which are subsequently assessed for impairment on a collective basis.
Loan and lease receivables are classified by the Group on the basis of the amount of exposure into the individual and group portfolios.
In the individual portfolio, each individual loan or lease exposure is analysed for the existence of impairment evidence. If the asset is found to be impaired, an allowance is recognised against the amount of the receivable. If there is no objective evidence of impairment for a given exposure, this exposure is included in the portfolio of loans or lease receivables that are assessed on a collective basis.
Within the group portfolio, groups with similar credit risk characteristics are identified, which are then assessed for impairment on a collective basis.
If there is objective evidence for impairment of financial assets classified as loans and receivables, finance lease receivables or investments held to maturity, the amount of the impairment allowance is the difference between the carrying amount of the asset and the present value of the estimated future cash flows (excluding future credit losses that have not been incurred), discounted using the original effective interest rate from the date on which the financial asset was found to be impaired.
The calculation of the present value of estimated cash flows relating to financial assets for which there is held collateral takes into account cash flows arising from the realisation of the collateral, less costs to possess and sell.
Future cash flows from a group of financial assets assessed for impairment on a collective basis are estimated on the basis of cash flows generated from contracts and historical data generated from assets with similar risk characteristics.
Historical recovery parameters are adjusted on the basis of data from current observations, so as to take into account the impact of current conditions and exclude currently non-relevant factors.
In subsequent periods, if the amount of impairment loss is reduced because of an event subsequent to the impairment being recognised (e.g. improvement in debtor's credit rating), the impairment loss that was previously recognised is reversed by making an appropriate adjustment to impairment allowances. The amount of the reversal is recorded in the income statement.
The Group plans that the adopted methodology used for estimating impairment allowances will be developed in line with the further accumulations of historic impairment data from the existing information systems and applications. As a consequence, new data obtained by the Group could influence the level of impairment allowances in the future. The methodology and assumptions used in the estimates are reviewed on a regular basis to minimise the differences between the estimated and actual loss amounts.

This document is a translation of a document originally issued in Polish. The only binding version is the original Polish version.
Consolidated Financial Statements of the Powszechna Kasa Oszczędności Bank Polski Spółka Akcyjna Group
for the year ended 31 December 2011 (in PLN thousand)
27
2.8.2.2.8.2.2.8.2.2.8.2. Assets Assets Assets Assets available for saleavailable for saleavailable for saleavailable for sale
At each balance date, the Group makes an assessment, whether there is objective evidence that a given financial asset classified to financial assets available for sale is impaired. If such evidence exists, the Group determines the amounts of impairment losses.
Objective evidence that a financial asset or group of assets available for sale is impaired includes the following events:
1) significant financial difficulties of the issuer,
2) breach of a contract by the issuer, such as lack of contracted payments of interest or principal or late payments,
3) granting of a concession by the lender to the issuer, for economic or legal reasons relating to the borrower's financial difficulty, that the lender would not otherwise consider,
4) deterioration of the borrower’s financial condition in the period of maintaining the exposure,
5) high probability of bankruptcy or other financial reorganisation of the issuer,
6) increase in risk of a certain industry in the period of maintaining a significant exposure, in which the borrower operates, reflected in the industry being qualified as ‘elevated risk industry’.
The Group firstly assesses impairment on an individual basis for significant receivables.
If there is objective evidence of impairment on financial assets classified as debt securities available for sale not issued by the State Treasury, an impairment allowance is calculated as the difference between the asset’s carrying amount and the present fair value estimated as value of future cash flows discounted by the market interest rates set on the based on yield curves for Treasury bonds moved by risk margins.
An impairment loss of a financial asset classified as available for sale is recognised in the income statement, which results in the necessity to transfer the effects of accumulated losses from other comprehensive income to the income statement.
In subsequent periods, if the fair value of debt securities increases, and the increase may be objectively related to an event subsequent to the impairment being recognised, the impairment loss is reversed and the amount of the reversal is recorded in the income statement.
Impairment losses recognised against equity instruments are not reversed through profit and loss.
2.9.2.9.2.9.2.9. LeasingLeasingLeasingLeasing
The Group is a party to lease agreements, based on which it conveys in return for payment to use and take profits (the lessor) from tangible and intangible assets during a fixed period (the rights).
The Group is also a party to lease agreements, based on which it receives tangible fixed assets for an agreed period of time (the lessee).
The classification of lease agreements by the Group is based on the extent to which risks and rewards incidental to ownership of an asset lie with the lessor or the lessee.
2.9.1.2.9.1.2.9.1.2.9.1. The Group as a lessorThe Group as a lessorThe Group as a lessorThe Group as a lessor
As regards finance lease agreements, the Group, as a lessor, has receivables of the present value of contractual lease payments, increased by a possible unguaranteed residual value assigned to the lessor, fixed at the date of the lease agreement. These receivables are disclosed under ‘Loans and advances to customers’. Finance lease payments are apportioned between the finance income and the reduction of balance of receivables in a way that provide fixed interest rate from an outstanding debt.

This document is a translation of a document originally issued in Polish. The only binding version is the original Polish version.
Consolidated Financial Statements of the Powszechna Kasa Oszczędności Bank Polski Spółka Akcyjna Group
for the year ended 31 December 2011 (in PLN thousand)
28
As regards operating lease agreements, initial direct costs that are incremental and directly attributable to negotiating and arranging a lease, are added to the carrying value of the leased asset during the period fixed in the lease agreement, on the same basis as in the case of contracts for hire. Conditional lease payments constitute income when they are due. Lease payments due from agreements, which do not meet the finance lease criteria (operating lease agreements) constitute income in the income statement and are recognised on a straight-line basis during the lease term.
2.9.2.2.9.2.2.9.2.2.9.2. The Group as a lesseeThe Group as a lesseeThe Group as a lesseeThe Group as a lessee
Lease payments under an operating lease and subsequent instalments are recognised as an expense in the income statement and are recognised on a straight-line basis over the lease term.
2.10.2.10.2.10.2.10. TanTanTanTangible fixed assets and igible fixed assets and igible fixed assets and igible fixed assets and intangible assetsntangible assetsntangible assetsntangible assets
2.10.1.2.10.1.2.10.1.2.10.1. Intangible assetsIntangible assetsIntangible assetsIntangible assets
Intangible assets are identifiable non-monetary assets which do not have a physical form.
2.10.2.2.10.2.2.10.2.2.10.2. Goodwill Goodwill Goodwill Goodwill
Goodwill arising on acquisition of a business entity is initially recognised at the value determined according to the Note 2.4.2. Following the initial recognition, goodwill is stated at the initial value less any cumulative impairment allowances.
Goodwill arising on acquisition of subsidiaries is recognised under ‘Intangible assets’ and goodwill arising on acquisition of associates and jointly controlled entities is recognised under ‘Investments in associates and jointly controlled entities’.
The test for goodwill impairment is carried out at least at the end of each year. Impairment is calculated by estimating the recoverable amount of the cash-generating unit to which the given goodwill relates. If the recoverable amount of the cash-generating unit is lower than its carrying amount, an impairment allowance is recognised.
2.10.3.2.10.3.2.10.3.2.10.3. SoftwareSoftwareSoftwareSoftware
Acquired computer software licenses are capitalised in the amount of costs incurred on the purchase and preparing the software for use, taking into consideration accumulated amortisation and impairment allowances.
Further expenditure related to the maintenance of the computer software is recognised in costs when incurred.
2.10.4.2.10.4.2.10.4.2.10.4. Other intangible assetsOther intangible assetsOther intangible assetsOther intangible assets
Other intangible assets acquired by the Group are recognised at acquisition or production cost, less accumulated amortisation and impairment allowances.
2.10.5.2.10.5.2.10.5.2.10.5. Development costsDevelopment costsDevelopment costsDevelopment costs
Costs of completed development work are included in intangible assets in connection with future economic benefits and meeting specific terms and conditions, i.e. there is intends, possibility to complete and use the internally generated intangible asset, has proper technical and financial resources to finish the development and to use the asset and it is able to measure reliably the expenditure attributable to the intangible asset during its development which can be directly associated to the creation of the intangible asset.
2.10.6.2.10.6.2.10.6.2.10.6. Tangible fixed assetsTangible fixed assetsTangible fixed assetsTangible fixed assets
Tangible fixed assets are stated at acquisition cost or cost of production, less accumulated depreciation and impairment allowances.
Properties accounted for investment properties are valued according to accounting principles applied to tangible fixed assets.

This document is a translation of a document originally issued in Polish. The only binding version is the original Polish version.
Consolidated Financial Statements of the Powszechna Kasa Oszczędności Bank Polski Spółka Akcyjna Group
for the year ended 31 December 2011 (in PLN thousand)
29
2.10.7.2.10.7.2.10.7.2.10.7. Capital expenditure accruedCapital expenditure accruedCapital expenditure accruedCapital expenditure accrued
Carrying amount of tangible fixed assets and intangible assets is increased by additional expenditures incurred during their maintenance, when:
1) probability exists that the Group will achieve future economic benefits which can be assigned to the particular tangible fixed asset or intangible asset (higher than initially assessed, measured at e.g. by useful life, improvement of service quality, maintenance costs),
2) acquisition price or production cost of tangible fixed assets and intangible assets can be reliably estimated.
2.10.8.2.10.8.2.10.8.2.10.8. AmortisationAmortisationAmortisationAmortisation
Depreciation is charged on all non-current assets, whose value decreases due to usage or passage of time, using the straight-line method over the estimated useful life of the given asset. The adopted depreciation/amortisation method and useful life are reviewed on an annual basis.
Depreciation of tangible fixed assets, investment properties and amortisation of intangible assets begins on the first day of the month following the month in which the asset has been brought into use, and ends no later than at the time when:
1) the amount of depreciation or amortisation charges becomes equal to the initial cost of the asset, or
2) the asset is designated for liquidation, or
3) the asset is sold, or
4) the asset is found to be missing, or
5) it is found - as a result of verification - that the expected residual value of the asset exceeds its (net) carrying amount.
For non-financial fixed assets it is assumed that the residual value is nil, unless there is an obligation of a third party to buy back the asset, or if there is an active market which will continue to exist at the end of the asset's period of use and when it is possible to determine the value of the asset on this market.
Amortisation periods for basic groups of tangible fixed assets, investment properties and intangible assets applied by the Group:
TangibleTangibleTangibleTangible fixedfixedfixedfixed assetsassetsassetsassets PeriodsPeriodsPeriodsPeriods
Buildings, premises, cooperative rights to premises (including investment properties) 40-60 years
Leaseholds improvements (buildings, premises) 2-60 years
(or term of the lease if shorter)
Machinery and equipment 2-15 years
Computer hardware 2-10 years
Means of transport 3-5 years
Intangible assetsIntangible assetsIntangible assetsIntangible assets PeriodsPeriodsPeriodsPeriods
Software 2-15 years Other intangible assets 1-5 years
Costs relating to acquisition or construction of buildings are allocated to significant parts of the building (components), when such components have different useful lives or when each of the components generates benefits for the Group in a different manner. Each component of the building is depreciated separately.
2.10.9.2.10.9.2.10.9.2.10.9. IIIImpairment mpairment mpairment mpairment allowances allowances allowances allowances of nonof nonof nonof non----financial financial financial financial nonnonnonnon----currentcurrentcurrentcurrent assetsassetsassetsassets
At each balance date, the Group makes an assessment of whether there are any indicators of impairment of any of its non-financial non-current assets (or cash-generating units). If any such indicators exist, the Group makes an assessment of whether there are any indicators of impairment of any of its no estimates the recoverable amount being the higher of the fair value less costs to sell and the value in use of a non-current asset (or a cash generating unit), if the carrying amount of an asset exceeds its recoverable amount, the Bank recognises an impairment loss in the income statement. The projection for the value in use requires
This document is a translation of a document originally issued in Polish. The only binding version is the original Polish version.
Consolidated Financial Statements of the Powszechna Kasa Oszczędności Bank Polski Spółka Akcyjna Group
for the year ended 31 December 2011 (in PLN thousand)
30
making assumptions, e.g. about future expected cash flows that the Group may receive from the continued use or disposal of the non-current asset (or a cash-generating unit). The adoption of different assumptions with reference to the projected cash flows could affect the carrying amount of certain non-current assets.
If there are indications for impairment for group of assets, which do not generate cash flows irrespective of other assets or asset groups, and the recoverable amount of a single asset included in common assets cannot be determined, the Group determines the recoverable amount at the level of the cash generating unit to which the asset belongs.
Impairment allowances are recognised if the book value of an asset or its cash generating unit exceeds its recoverable amount. Impairment losses are recognised in the income statement.
Impairment allowances in respect of cash generating units first and foremost reduce the goodwill relating to those cash generating units (groups of units), and then they reduce proportionally the book value of other assets in the unit (group of units).
Impairment allowances in respect of goodwill cannot be reversed. In respect of other assets, the write-down may be reversed if there was a change in the estimates used to determine the recoverable amounts. An impairment loss may be reversed only to the level at which the book value of an asset does not exceed the book value – less depreciation – which would be determined should the impairment allowances not have been recorded.
2.11.2.11.2.11.2.11. Other items in the statement of financial positionOther items in the statement of financial positionOther items in the statement of financial positionOther items in the statement of financial position
2.11.1.2.11.1.2.11.1.2.11.1. NonNonNonNon----currentcurrentcurrentcurrent assets assets assets assets held held held held for sale and discontinued operationsfor sale and discontinued operationsfor sale and discontinued operationsfor sale and discontinued operations
Non-current assets held for sale include assets whose carrying amount is to be recovered as a result of sale and not due to continued use. Such assets only include assets available for immediate sale in the current condition, when such sale is highly probable, i.e. the entity has determined to sell the asset started to seek actively for a buyer and finish the sale process. In addition, such assets are offered for sale at a price which is reasonable with respect to their current fair value and it is expected that the sale will be recognised as completed within one year from the date of classification of the asset into this category.
Non-current assets held for sale are stated at the lower of their carrying amount or fair value less costs to sell. Impairment allowances for non-current assets held for sale are recognised in the income statement for the period, in which these allowances are made. These assets are not depreciated.
Discontinued operations are an element of the Group’s business which has been sold or which is qualified as held for sale, and which also constitutes an important separate area of the operations or its geographical area, or is a subsidiary acquired solely with the intention of resale. Operations may be classified as discontinued only when the operations are sold or when they meet the criteria of operations held for sale, whichever occurs earlier. A group for sale which is to be retired may also qualify as discontinued operations.
In case of non-current assets, for whose qualification criteria for the group of non-current assets held for sale are no longer fulfilled, the Group makes reclassification from fixed assets held for sale to the proper category of assets. Non-current assets withdrawn from assets held for sale are valued at lower of two values:
1) carrying amount before the moment of qualification to assets held for sale, less depreciation, which would have been included if the asset (or group of assets to be sold) would not have been qualified as held for sale,
2) recovery amount for the day of decision of sales abandonment.
This document is a translation of a document originally issued in Polish. The only binding version is the original Polish version.
Consolidated Financial Statements of the Powszechna Kasa Oszczędności Bank Polski Spółka Akcyjna Group
for the year ended 31 December 2011 (in PLN thousand)
31
2.11.2.2.11.2.2.11.2.2.11.2. InventoriesInventoriesInventoriesInventories
Inventories related mainly to real estate development activities of the Group and valued at the lower of two values: the purchase price/cost of production and net realisable value.
Expenses incurred in bringing the inventories to their present location and condition are treated as follows: finished goods (housing and service premises) and work in progress (housing and service premises in progress and land held for development) – as direct expenses and part of indirect costs of production. In the case of long-term preparatory or production periods, cost or purchase price is increased by finance charges specifically incurred for such purchases.
Net realisable value is the estimated selling price in the ordinary course of business less the estimated costs of completion and the estimated costs necessary to make the sale.
The value of inventories disbursement is determined by specific identification of individual purchase prices or production cost of components, which relate to realisation of specific projects.
2.11.3.2.11.3.2.11.3.2.11.3. Accruals and deferred incomeAccruals and deferred incomeAccruals and deferred incomeAccruals and deferred income
Accruals and deferred income mainly comprise commission income recognised using the straight-line method and other income received in advance, which will be recognised in the income statement in future reporting periods. Accruals and deferred income are shown in the statement of financial position under ‘Other liabilities’.
Prepayments and deferred costs include particular kinds of expenses which will be recognised in the income statement in future reporting periods. Prepayments and deferred costs are shown in the statement of financial position under ‘Other assets’.
2.12.2.12.2.12.2.12. ProvisionsProvisionsProvisionsProvisions
Provisions are liabilities of uncertain timing or amount. They are accrued when the Group has a present legal or constructive obligation as a result of past events, it is probable that an outflow of resources embodying economic benefits will be required to settle the obligation, and a reliable estimate of the amount of the obligation can be made.
If the effect of the time value of money is material, the amount of the provision is determined by discounting the forecast future cash flows to their present value, using the discount rate before tax which reflects the current market assessments of the time value of money and the potential risk related to a given obligation.
2.13.2.13.2.13.2.13. Restructuring provisionRestructuring provisionRestructuring provisionRestructuring provision
A restructuring provision is set up when general criteria for recognising provisions are met as well as there are met detailed criteria related to the legal or constructive obligation to set up provisions for restructuring costs specified in IAS 37. Precisely, the constructive obligation of restructurisation and recognising provisions arises only when the Group has a detailed, official restructuring plan and has raised justified expectations of the parties to which the plan relates that it will carry out restructuring by starting to implement the plan or by announcing the key elements of the plan to the above-mentioned parties. A detailed restructuring plan specifies at least activities or part of the activities to which the plan relates, the basic locations covered by the plan, the place of employment, functions and estimated number of employees who are to be compensated due to their contract termination, the amount of expenditure which is to be incurred and the date when the plan will be implemented. Legal obligation to recognise a restructuring provision results from the Act dated 13 March 2003 on detailed principles of employment termination from reasons independent from employees (Journal of Laws 2003, No 90, item 844 with subsequent amendments), according to which an employer is obliged to discuss an intention of mass redundancies with the company’s trade unions, in particular with regard to the possibilities of avoidance or reduction of the scale of mass redundancies. An employer is also obliged to discuss employees’ issues related to redundancies including, in particular, possibilities of retraining or professional trainings, as well as new job opportunities for dismissed employees.
This document is a translation of a document originally issued in Polish. The only binding version is the original Polish version.
Consolidated Financial Statements of the Powszechna Kasa Oszczędności Bank Polski Spółka Akcyjna Group
for the year ended 31 December 2011 (in PLN thousand)
32
The restructuring provision covers only such direct expenditures arising as a result of the restructuring which at the same time
1) necessarily result from the restructuring,
2) are not related to the Group’s on-going business operations.
The restructuring provision does not cover future operating expenses.
2.14.2.14.2.14.2.14. Employee benefitsEmployee benefitsEmployee benefitsEmployee benefits
According to the Collective Labour Agreement (Zakładowy Układ Zbiorowy Pracy), all employees of PKO Bank Polski SA are entitled to anniversary bonuses after completing a specified number of years in service and to retirement bonuses upon retirement. The Group periodically performs an actuarial valuation of provisions for future liabilities to employees.
The provision for retirement and pension benefits and anniversary bonuses is created individually for each employee on the basis of an actuarial valuation performed periodically by an independent actuary. The basis for calculation of these provisions are internal regulations, and especially the Collective Labour Agreement (‘Zakładowy Układ Zbiorowy Pracy’) being in force at the Group. Valuation of the employee benefit provisions is performed using actuarial techniques and assumptions. The calculation of the provision includes all bonuses and retirement benefits expected to be paid in the future. The provision was created on the basis of a list including all the necessary details of employees, in particular the length of their service, age and gender. The provisions calculated amount to discounted future payments, taking into account staff turnover, and relate to the service period beginning on the balance sheet date. Gains or losses resulting from actuarial calculations are recognised in the income statement.
The Group creates provisions for future liabilities arising from unused annual leave (taking into account all outstanding unused holiday days), from damages and severance payments made to those employees whose employment contracts are terminated for reasons independent of the employee and periodical settlements for the employee compensation costs incurred in the current period which will be paid out in future periods, including bonuses.
2.15.2.15.2.15.2.15. Borrowing costsBorrowing costsBorrowing costsBorrowing costs
Borrowing costs that may be directly attributable to the acquisition, construction or production of a qualifying asset are capitalised by the Group as part of acquisition or production cost of that asset when it is probable that they will result in future economic benefits and the acquisition or production cost can be measured reliably.
Other borrowing costs are recognised by the Group as an expense in the period in which they are incurred.
2.16.2.16.2.16.2.16. Contingent liabilities and commitmentsContingent liabilities and commitmentsContingent liabilities and commitmentsContingent liabilities and commitments
The Group enters into transactions, which, at the time of their inception, are not recognised in the statement of financial position as assets or liabilities, however they give rise to contingent liabilities and commitments. A contingent liability or commitment is:
1) a possible obligation that arises from past events and whose existence will be confirmed only at the time of occurrence or non-occurrence of one or more uncertain future events not wholly within the control of the Group,
2) a present obligation resulting from past events, but not recognised in the statement of financial position, because it is not probable that an outflow of cash or other assets will be required to fulfil the obligation, or the amount of the obligation cannot be estimated reliably.
For contingent liabilities and commitment granted which carry the risk of default by the commissioning party, provisions are recognised in accordance with IAS 37.

This document is a translation of a document originally issued in Polish. The only binding version is the original Polish version.
Consolidated Financial Statements of the Powszechna Kasa Oszczędności Bank Polski Spółka Akcyjna Group
for the year ended 31 December 2011 (in PLN thousand)
33
Credit lines and guarantees are the most significant items of contingent liabilities and commitment granted.
Upon initial recognition, a financial guarantee is stated at fair value. Following the initial recognition, the financial guarantee is measured at the higher of:
1) the amount determined in accordance with IAS 37 ‘Provisions, Contingent Liabilities and Contingent Assets’ and
2) the amount initially recognised less, when appropriate, cumulative amortisation recognised in accordance with IAS 18 ‘Revenue’.
2.17.2.17.2.17.2.17. Shareholders’ equityShareholders’ equityShareholders’ equityShareholders’ equity
Equity constitutes capital and reserves created in accordance with the legal regulations applicable in Poland and the Memorandum of Association. The classification to particular equity components, discussed in Note 2.17 below, results from the Polish Commercial Companies’ Code, the Banking Law and the requirements of IAS 1.7, IAS 1.78.e, IAS 1.54.q-r and IAS 1.79.b. In accordance with IAS 1, equity also includes unappropriated profits and accumulated losses, currency translation differences on translating foreign operations, the effective portions of cash flow hedges and net gains or losses on the valuation of financial instruments classified as available-for-sale. Equity components of the subsidiaries, other than share capital, in a proportion equal to the interest in the subsidiary held by the parent company, are added to respective equity components of the parent company. The Group's equity includes only those parts of the equity of the subsidiaries which arose after the acquisition of shares by the parent company.
2.17.1.2.17.1.2.17.1.2.17.1. Share capital Share capital Share capital Share capital
Share capital comprises solely the share capital of the parent company and is stated at nominal value in accordance with Memorandum of Association and entry to the Register of Entrepreneurs.
2.17.2.2.17.2.2.17.2.2.17.2. Reserve capital Reserve capital Reserve capital Reserve capital
Reserve capital is created according to the Memorandum of Association of the Group entities, from the appropriation of net profits and from share premium less issue costs and it is to cover the potential losses of Group entities.
2.17.3.2.17.3.2.17.3.2.17.3. Other comprehensive incomeOther comprehensive incomeOther comprehensive incomeOther comprehensive income
Other comprehensive income comprises the effects of valuation of financial assets available for sale and the amount of the related deferred tax, as well as the effective part of cash flow hedging resulting from hedge accounting and the related deferred tax. Moreover, the item includes the share of the Parent company in the revaluation reserve of associated entities and foreign exchange differences on translation of the net result of the foreign operation as a rate constituting the arithmetical average of foreign exchange rates for the currency as at the day ending each of the months in the financial year published by the National Bank of Poland, and foreign exchange differences arising on the measurement of net assets in the foreign operation.
2.17.4.2.17.4.2.17.4.2.17.4. General banking risk fundGeneral banking risk fundGeneral banking risk fundGeneral banking risk fund
General banking risk fund in PKO Bank Polski SA is created from profit after tax according to ‘The Banking Act’ dated 29 of August 1997 (Journal of Laws 2002, No. 72, item 665 with subsequent amendments) and it is to cover unidentified risks of the Bank.
2.17.5.2.17.5.2.17.5.2.17.5. Other reservesOther reservesOther reservesOther reserves
Other reserves are created from the appropriation of net profits. It is uniquely to cover the potential losses in the statement of financial position.
2.17.6.2.17.6.2.17.6.2.17.6. Shareholders' equity also includesShareholders' equity also includesShareholders' equity also includesShareholders' equity also includes
1) net result prior to the approval less declared dividends,
2) dividends declared after the reporting period but not paid.
The net profit or loss for the year is the profit before tax reported in the income statement for the current year, adjusted for the corporate income tax expense and profits (losses) attributable to non-controlling shareholders.

This document is a translation of a document originally issued in Polish. The only binding version is the original Polish version.
Consolidated Financial Statements of the Powszechna Kasa Oszczędności Bank Polski Spółka Akcyjna Group
for the year ended 31 December 2011 (in PLN thousand)
34
In accordance with the Polish legislation, only the equity of the parent company and the equity of specific subsidiaries, determined on the basis of stand-alone financial statements, are distributable. In the case of joint stock companies - the amount to be distributed between shareholders may not exceed the net profit for the previous year plus retained earnings and amounts reclassified from the supplementary capital and other reserves accumulated from profit appropriation which may be distributed as dividend. The resulting amount must be decreased by the amount of accumulated losses, Treasury shares and amounts which should be transferred from the net profit for the last year to supplementary capital or other reserves based on the law or the Memorandum of Association. In the case of limited liability companies - the amount to be distributed between shareholders may not exceed the net profit for the previous year plus retained earnings and amounts reclassified from the distributable portion of supplementary capital and other reserves accumulated from profit appropriation. The resulting amount must be decreased by the amount of accumulated losses, Treasury shares and amounts which should be transferred from the net profit for the last year to supplementary capital or other reserves based on the law or the Memorandum of Association.
2.17.7.2.17.7.2.17.7.2.17.7. NonNonNonNon----controlling interestcontrolling interestcontrolling interestcontrolling interest
Non-controlling interest represent the part of capital in a subsidiary company, which cannot be directly or indirectly assigned to the parent company.
2.18.2.18.2.18.2.18. Determination of Determination of Determination of Determination of a a a a ffffinancial resultinancial resultinancial resultinancial result
The Group recognises all significant expenses and income in accordance with the following policies: accrual basis, matching principle, policies for recognition and valuation of assets and liabilities, policies for recognition of impairment losses.
2.18.1.2.18.1.2.18.1.2.18.1. Interest income and expenseInterest income and expenseInterest income and expenseInterest income and expense
Interest income and expense comprise interest, including premiums and discounts in respect of financial instruments measured at amortised cost and instruments at fair value, with the exception of derivative financial instruments classified as held for trading.
Interest income and interest expenses are recognised on an accrual basis using the effective interest rate method.
Interest income in case of financial assets or group of similar financial assets for which an impairment loss values are calculated from present values of receivables (that is net of impairment loss) by using current interest rate used for discounting future cash flows for the purposes of estimating losses due to impairment.
Interest income/expense in respect of derivative financial instruments classified as held for trading are recognised in ‘Net income from financial instruments at fair value through profit and loss’ or ‘Net foreign exchange gains’ (applied to CIRS), with the exception of derivative instruments classified as hedging instruments into hedge accounting, have been presented in interest income.
Interest income also includes fee and commission received and paid, which are part of the effective interest rate of the financial instrument.
2.18.2.2.18.2.2.18.2.2.18.2. Fee and commission income and expenseFee and commission income and expenseFee and commission income and expenseFee and commission income and expense
Fee and commission income is generally recognised on an accrual basis at the time when the related service is performed. Fee and commission income includes one-off amounts charged by the Group for services not related directly to the creation of loans, advances and other receivables, as well as amounts charged by the Group for services performed over a period exceeding 3 months, which are recognised on a straight-line basis. Fee and commission income also includes fee and commission recognised on a straight-line basis, received on loans granted with unspecified schedule of cash flows for which cannot determine the effective interest rate.
2.18.3.2.18.3.2.18.3.2.18.3. DivideDivideDivideDividend incomend incomend incomend income
Dividend income is recognised in the income statement of the Group at the date on which shareholders’ rights to receive the dividend have been established.

This document is a translation of a document originally issued in Polish. The only binding version is the original Polish version.
Consolidated Financial Statements of the Powszechna Kasa Oszczędności Bank Polski Spółka Akcyjna Group
for the year ended 31 December 2011 (in PLN thousand)
35
2.18.4.2.18.4.2.18.4.2.18.4. Net income from financial instrumentsNet income from financial instrumentsNet income from financial instrumentsNet income from financial instruments designateddesignateddesignateddesignated at fair value at fair value at fair value at fair value
The result on financial instruments at fair value through profit and loss includes gains and losses arising from the disposal of financial instruments classified as financial assets/liabilities at fair value through profit and loss as well as the effect of their fair value measurement.
2.18.5.2.18.5.2.18.5.2.18.5. Gains less losses from investment securitiesGains less losses from investment securitiesGains less losses from investment securitiesGains less losses from investment securities
Gains less losses from investment securities include gains and losses arising from disposal of financial instruments classified as available for sale and held to maturity.
2.18.6.2.18.6.2.18.6.2.18.6. Foreign exchange gainsForeign exchange gainsForeign exchange gainsForeign exchange gains
Foreign exchange gains comprise foreign exchange gains and losses, both realised and unrealised, resulting from daily revaluation of assets and liabilities denominated in foreign currency using the average NBP exchange rates at the balance date, and from the fair value valuation of outstanding derivatives (FX forward, FX swap, CIRS and currency options).
The Group recognises in net foreign exchange gains both realised and unrealised foreign exchange gains and losses on fair value measurement of unrealised currency options. From an economic point of view, the method of presentation of net gains/losses on currency options applied allows the symmetrical recognition of net gains/losses on currency options and on spot and forward transactions concluded to hedge such options (transactions hedging the currency position generated as a result of changes in the market parameters affecting the currency option position).
The effects of changes in fair value and the result realised on the Gold Index option are also included in the foreign exchange gains due to the fact that the Bank treats gold as one of the currencies, in line with the provisions of the Resolution No. 76/2010 of the Polish Financial Supervision Authority dated 10 March 2010 on the scope and detailed principles for setting capital requirements in relation to the individual risk types (Polish Financial Supervision Authority’s Journal of Laws 2010, No. 2, item 11 with subsequent amendments).
Monetary assets and liabilities presented by the Group in the statement of financial position and off-balance sheet items denominated in foreign currency are translated into PLN using the average NBP rate prevailing for a given currency as at the balance date. Impairment allowances for loan exposures and other receivables denominated in foreign currencies, which are created in Polish zloty, are updated in line with a change in the valuation of the foreign currency assets for which these impairment allowances are created. Realised and unrealised currency translation differences are recorded in the income statement.
2.18.7.2.18.7.2.18.7.2.18.7. Other operating income and expenseOther operating income and expenseOther operating income and expenseOther operating income and expense
Other operating income and expense includes income and expense not related directly to banking activity. Other operating income mainly includes gains from sale or liquidation of non-current assets and assets possessed in exchange for debts, recovered bad debts, legal damages, fines and penalties, income from lease/rental of properties. Other operating expense mainly includes losses from sale or liquidation of non-current assets, including assets possessed in exchange for debts, costs of debt collection and donations.
Other operating income and expense in relation to the Group’s entities include also income from sale of finished goods, goods for resale and raw materials, and the corresponding costs of their production.
Income from construction services (real estate development activities) is recognised on a completed contract basis, which involves recognition of all construction costs that incurred during the period of construction as work-in-progress. Payments received on account of a purchase of apartments are shown within deferred income.

This document is a translation of a document originally issued in Polish. The only binding version is the original Polish version.
Consolidated Financial Statements of the Powszechna Kasa Oszczędności Bank Polski Spółka Akcyjna Group
for the year ended 31 December 2011 (in PLN thousand)
36
2.19.2.19.2.19.2.19. Income taxIncome taxIncome taxIncome tax
The income tax expense is classified into current and deferred income tax. The current income tax is recognised in the income statement. Deferred income tax, depending on the source of the temporary differences, is recorded in the income statement or in the item ‘Other comprehensive income’ in the statement of comprehensive income.
2.19.1.2.19.1.2.19.1.2.19.1. Current income taxCurrent income taxCurrent income taxCurrent income tax
Current income tax is calculated on the basis of gross accounting profit adjusted by non-taxable income, taxable income that does not constitute accounting income, non-tax deductible expenses and tax costs which are not accounting costs, in accordance with tax regulations. These items mainly include income and expenses relating to accrued interest receivable and payable, allowances on receivables and provisions for contingent liabilities and commitments.
While calculating corporate income tax, regulations being in force within particular tax jurisdiction with regard to corporate income tax of capital groups are taken into consideration. Simultaneously, the regulations of Decree of the Minister of Finance dated 7 May 2001 on extending the deadlines for paying corporate income tax prepayments for banks granting mortgage loans (Journal of Laws No. 43, item 482) are taken into consideration. According to the above-mentioned Decree moment of taxation of capitalised interest not paid by the borrower and not subject to temporary redemption by the State budget is deferred to the date of actual repayment or redemption of such interest. Therefore, the Group recognises the deferred income tax liability on income due to capitalised interest on mortgage loans, as described in the Decree.
2.19.2.2.19.2.2.19.2.2.19.2. Deferred income taxDeferred income taxDeferred income taxDeferred income tax
The amount of deferred tax is calculated as the difference between the tax base and book value of assets and liabilities for financial reporting purposes. The Group recognises deferred income tax assets and liabilities. An amount of deferred tax recognised in profit and loss is determined using the statement of financial position method – as a change in deferred income tax assets and liabilities. Deferred tax assets and deferred tax liabilities are presented in the statement of financial position respectively as assets or liabilities. The change in the balance of a deferred tax liability or a deferred tax asset is included in income tax expense, except for the effects of valuation of financial assets recognised in other comprehensive income, where changes in the balance of a deferred tax liability or deferred tax asset are accounted for in correspondence with other comprehensive income. The calculation of deferred tax takes into account the balance of the deferred tax asset and deferred tax liability at the beginning and at the end of the reporting period.
The carrying amount of deferred tax assets is reviewed at each balance sheet date and reduced to the extent that it is no longer probable that sufficient taxable profit will be available to allow all or part of the deferred tax asset to be utilised.
Deferred tax assets and liabilities are measured using tax rates that are expected to apply in the period when the asset is realised or the liability is settled, based on tax rates (and tax laws) that have been enacted or substantively enacted at the balance sheet date.
The Group uses the 19% tax rate for entities operating on the territory of Poland, a 16% tax rate for entities operating in Ukraine (in 2010: 21%) and 26.3% tax rate for entities operating in Sweden.
Deferred tax assets are offset by the Group with deferred tax liabilities only when there exists enforceable legal entitlement to offset current tax receivables with current tax liabilities and deferred tax is related to the same taxpayer and the same tax authority.

This document is a translation of a document originally issued in Polish. The only binding version is the original Polish version.
Consolidated Financial Statements of the Powszechna Kasa Oszczędności Bank Polski Spółka Akcyjna Group
for the year ended 31 December 2011 (in PLN thousand)
37
2.20.2.20.2.20.2.20. Critical eCritical eCritical eCritical estimates stimates stimates stimates and and and and judgementsjudgementsjudgementsjudgements
While preparing financial statements, the Group makes certain estimates and assumptions, which have a direct influence on both the financial statements presented and the notes to the financial statements.
The estimates and assumptions that are used by the Group in determining the value of its assets and liabilities as well as revenues and costs, are made based on historical data and other factors which are available and are considered to be proper in the given circumstances. Assumptions regarding the future and the data available are used for assessing carrying amounts of assets and liabilities which cannot be determined interchangeably using other sources. In making assessments the Group takes into consideration the reasons and sources of the uncertainties that are anticipated at the balance sheet date. Actual results may differ from estimates.
Estimates and assumptions made by the Group are subject to periodic reviews. Adjustments to estimates are recognised in the periods in which the estimates were adjusted, provided that these adjustments affect only the given period. If the adjustments affect both the period in which the adjustment was made as well as future periods, they are recognised in the period in which the adjustments were made and in the future periods.
The most significant areas in which the Group performs critical estimates are presented below:
2.20.1.2.20.1.2.20.1.2.20.1. Impairment of loans and advancesImpairment of loans and advancesImpairment of loans and advancesImpairment of loans and advances
An impairment loss is incurred when there is objective evidence of impairment due to events that occurred after the initial recognition of the asset (‘a loss event’), when the loss has a reliably measurable impact on the expected future cash flows from the financial asset or group of financial assets. Future cash flows are assessed by the Group on the basis of estimates based on historical parameters.
The adopted methodology used for estimating impairment allowances will be developed in line with the further possibilities of accumulations of historic impairment data from the existing information systems and applications. As a consequence, acquiring new data by the Group could affect the level of impairment allowances in the future. The methodology and assumptions used in the estimates are reviewed on a regular basis to minimise the differences between the estimated and actual loss amounts. In the case of a +/- 10% change in the present value of estimated cash flows for the Bank’s loan portfolio individually determined to be impaired, the estimated impairment allowances would decrease by PLN 212 million or increase by PLN 384 million respectively (as at 31 December 2010 respectively would decrease by PLN 181 million or increase by PLN 378 million). This estimate was made for the loan portfolio assessed for impairment on an individual basis, i.e. on the basis of individual analysis of future cash flows arising both from own payments and realisation of the collateral, i.e. the positions for which an individual method is applied.
2.20.2.2.20.2.2.20.2.2.20.2. Valuation of derivatives and nonValuation of derivatives and nonValuation of derivatives and nonValuation of derivatives and non----quoted debt quoted debt quoted debt quoted debt securities available for sale securities available for sale securities available for sale securities available for sale
The fair value of non-option derivatives and debt securities available for sale not listed on an active market is determined using valuation models based on discounted cash flows expected to be received from the given financial instrument. Options are valued using option pricing models. The variables and assumptions used in a valuation include any available data derived from observable markets.
In the valuation of non-quoted debentures available for sale, assumptions are also made about the contractor's credit risk, which may have an impact on the pricing of the instruments. Any change in these assumptions could affect the valuation of the above-mentioned instruments.
The valuation techniques used by the Bank for non-option derivative instruments are based on yield curve based on available market data (deposit margins on interbank market, IRS quotations). The Bank conducted a simulation to assess the potential influence of change of the yield curve on the transaction valuation. Upwards movement of yield curve by 50 b.p. would result in decrease of non-option derivative instruments valuation by PLN 77 million (as at 31 December 2010: PLN 35 million). A similar downwards movement in opposite direction would result in valuation increase by PLN 82 million (as at 31 December 2010: PLN 37 million), including the instruments covered by hedge accounting: a drop of PLN 83 million (in 2010: PLN 42 million) for upward movement of yield curve and increase of PLN 88 million (in 2010: PLN 50 million) for downward movement of the curve.

This document is a translation of a document originally issued in Polish. The only binding version is the original Polish version.
Consolidated Financial Statements of the Powszechna Kasa Oszczędności Bank Polski Spółka Akcyjna Group
for the year ended 31 December 2011 (in PLN thousand)
38
2.20.3.2.20.3.2.20.3.2.20.3. Calculation of provision for retirement and pension benefits and anniversary bonuses Calculation of provision for retirement and pension benefits and anniversary bonuses Calculation of provision for retirement and pension benefits and anniversary bonuses Calculation of provision for retirement and pension benefits and anniversary bonuses
The calculation of the provision includes all jubilee bonuses and retirement benefits expected to be paid in the future. The Bank performed a reassessment of its estimates as at 31 December 2011, on the basis of calculation conducted by an independent external actuary. The provisions calculated equate to discounted future payments, taking into account staff turnover, and relate to the period ending on the balance date. An important factor affecting the amount of the provision is the adopted financial discount rate. An increase/decrease in the financial discount rate of 0.25 pp. will contribute to an increase/decrease in the amount of the provision for retirement and pension benefits and jubilee bonuses of approx. PLN 9 million (as at 31 December 2010, an increase/decrease in financial discount rate by 0.5 pp. affected a decrease/increase in the value of the provision for retirement and pension benefits and anniversary bonuses by about PLN 19 million).
2.20.4.2.20.4.2.20.4.2.20.4. Useful economic lives of tangible fixed assets, intangible assets and investment propertiesUseful economic lives of tangible fixed assets, intangible assets and investment propertiesUseful economic lives of tangible fixed assets, intangible assets and investment propertiesUseful economic lives of tangible fixed assets, intangible assets and investment properties
In estimating useful lives of particular types of tangible fixed assets, intangible assets and investment properties, the Group considers following factors:
1) expected physical wear and tear, estimated based on the average period of use recorded to date, reflecting the normal physical wear and tear rate, intensity of use etc.,
2) technical or market obsolescence,
3) legal and other limitations on the use of the asset,
4) expected use of the asset assessed based on the expected production capacity or volume,
5) other factors affecting useful lives of such assets.
When the period of use of a given asset results from a contract term, the useful life of such an asset corresponds to the period defined in the contract. However, if the estimated useful life is shorter than the period defined in the contract, the estimated useful life is applied.
If the useful life of assets being subject to depreciation and classified as land and buildings was changed by +/- 10 years, it would influence the financial result of the Group as follows: a decrease in depreciation costs by PLN 27 million or an increase in depreciation costs by PLN 137 million respectively (as at 31 December 2010: a decrease in deprecation cost by PLN 27 million or increase in depreciation cost by PLN 152 million respectively).

This document is a translation of a document originally issued in Polish. The only binding version is the original Polish version.
Consolidated Financial Statements of the Powszechna Kasa Oszczędności Bank Polski Spółka Akcyjna Group
for the year ended 31 December 2011 (in PLN thousand)
39
2.21.2.21.2.21.2.21. Changes in Changes in Changes in Changes in aaaaccounting ccounting ccounting ccounting ppppoliciesoliciesoliciesolicies
Amendments to standards and interpretations which have come into force Amendments to standards and interpretations which have come into force Amendments to standards and interpretations which have come into force Amendments to standards and interpretations which have come into force and have been applied by the and have been applied by the and have been applied by the and have been applied by the GroupGroupGroupGroup since 1 January 2011since 1 January 2011since 1 January 2011since 1 January 2011
Standard/ interpretationStandard/ interpretationStandard/ interpretationStandard/ interpretation Introduction Introduction Introduction Introduction datedatedatedate
Application dateApplication dateApplication dateApplication date Approved by the Approved by the Approved by the Approved by the European UnionEuropean UnionEuropean UnionEuropean Union
Description of changesDescription of changesDescription of changesDescription of changes
Amendments to IAS 24 ‘Related party disclosure’
November 2009
Financial year starting on or after 1 January 2011
Yes The amendments introduce simplifications within requirements that refer to the disclosure of information by the entities related to state institutions and precise the definition of the related party.
These changes have no significant influence on the level of disclosures in the financial statements of the Group. Appropriate disclosures of the transactions of the Bank as a government related entity are included in Note 44 ‘Transactions with the State Treasury and related entities’.
Amendments to IAS 32 ‘Classification of rights issues’
October 2009
Financial year starting on or after 1 February 2010
Yes The amendments relate to rights issue accounting (rights issues, options, warrants) denominated in the currency different from the functional currency of the issuer. According to the amendments, if some conditions are met, it is required to disclose rights issue as equity regardless of the currency that the settlement price is set at.
These changes do not apply to the Group due to the fact that the Group does not issue rights issues, options, warrants denominated in the currency different from the functional currency of the issuer.
Amendments to IFRS 1 ‘First-time Adoption of IFRS’
January 2010
Financial year starting on or after 1 July 2010
Yes The amendments introduce additional exemptions for first-time adopters regarding disclosures required by amendments to IFRS 7 issued in March 2009 regarding fair value valuation and liquidity risk.
These changes do not apply to the Group due to the fact that the Group presents financial statements in accordance with IFRS from 2005.
IFRIC 19 ‘Extinguishing Financial Liabilities with Equity Instruments’
November 2009
Financial year starting on or after 1 July 2010
Yes This IFRIC clarifies the accounting principles when an entity renegotiates the terms of its debt with the result that the liability is extinguished through the debtor issuing its own equity instruments to the creditor. This IFRIC requires the equity instrument to be measured at fair value and a gain or loss to be recognised in the profit and loss account based on the fair value of the equity instruments compared to the carrying amount of the debt.
This information does not apply to the financial statements of the Group due to lack of such transactions in 2011 and 2010.
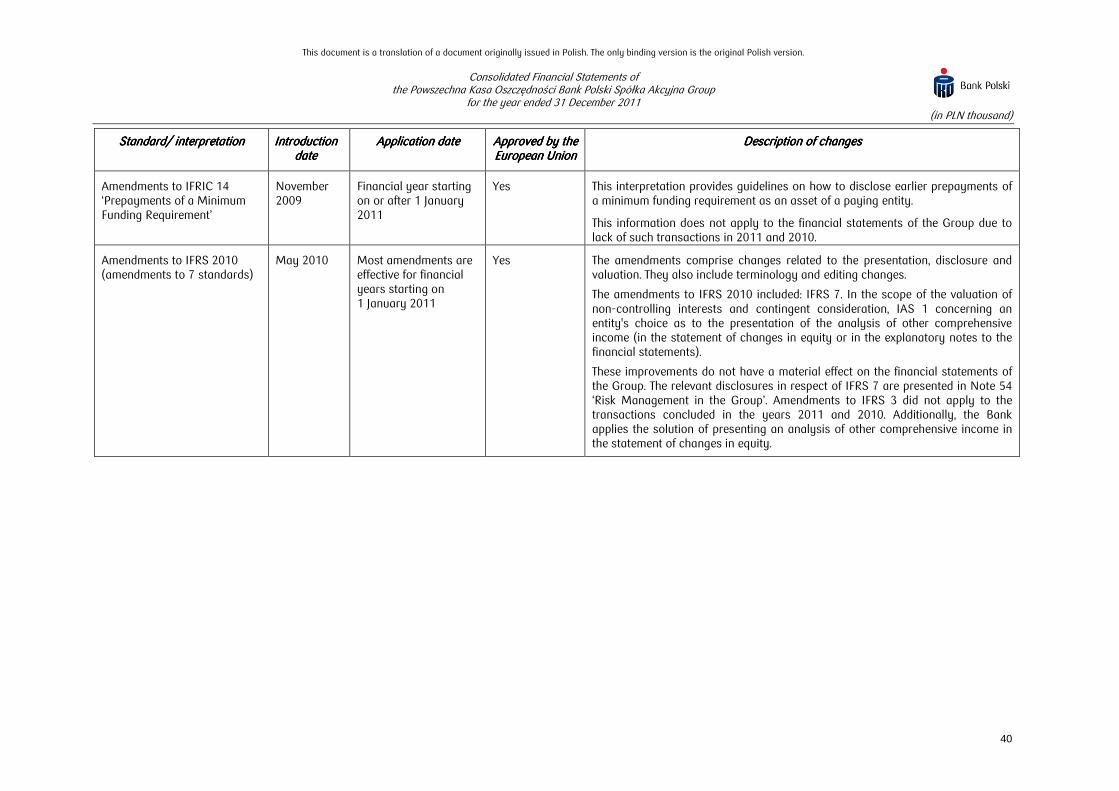
This document is a translation of a document originally issued in Polish. The only binding version is the original Polish version.
Consolidated Financial Statements of the Powszechna Kasa Oszczędności Bank Polski Spółka Akcyjna Group
for the year ended 31 December 2011 (in PLN thousand)
40
Standard/ interpretationStandard/ interpretationStandard/ interpretationStandard/ interpretation Introduction Introduction Introduction Introduction datedatedatedate
Application dateApplication dateApplication dateApplication date Approved by the Approved by the Approved by the Approved by the European UnionEuropean UnionEuropean UnionEuropean Union
Description of changesDescription of changesDescription of changesDescription of changes
Amendments to IFRIC 14 ‘Prepayments of a Minimum Funding Requirement’
November 2009
Financial year starting on or after 1 January 2011
Yes This interpretation provides guidelines on how to disclose earlier prepayments of a minimum funding requirement as an asset of a paying entity.
This information does not apply to the financial statements of the Group due to lack of such transactions in 2011 and 2010.
Amendments to IFRS 2010 (amendments to 7 standards)
May 2010 Most amendments are effective for financial years starting on 1 January 2011
Yes The amendments comprise changes related to the presentation, disclosure and valuation. They also include terminology and editing changes.
The amendments to IFRS 2010 included: IFRS 7. In the scope of the valuation of non-controlling interests and contingent consideration, IAS 1 concerning an entity's choice as to the presentation of the analysis of other comprehensive income (in the statement of changes in equity or in the explanatory notes to the financial statements).
These improvements do not have a material effect on the financial statements of the Group. The relevant disclosures in respect of IFRS 7 are presented in Note 54 ‘Risk Management in the Group’. Amendments to IFRS 3 did not apply to the transactions concluded in the years 2011 and 2010. Additionally, the Bank applies the solution of presenting an analysis of other comprehensive income in the statement of changes in equity.

This document is a translation of a document originally issued in Polish. The only binding version is the original Polish version.
Consolidated Financial Statements of the Powszechna Kasa Oszczędności Bank Polski Spółka Akcyjna Group
for the year ended 31 December 2011 (in PLN thousand)
41
New standards and interpretations and amendments to existing standards and interpretations, which have been published, but arNew standards and interpretations and amendments to existing standards and interpretations, which have been published, but arNew standards and interpretations and amendments to existing standards and interpretations, which have been published, but arNew standards and interpretations and amendments to existing standards and interpretations, which have been published, but are e e e not yet effective nor applied not yet effective nor applied not yet effective nor applied not yet effective nor applied by the Bankby the Bankby the Bankby the Bank
The International Accounting Standards Board and the International Financial Reporting Interpretations Committee have issued the following standards and amendments to existing standards, which are not yet effective:
Standard/ interpretationStandard/ interpretationStandard/ interpretationStandard/ interpretation Introduction Introduction Introduction Introduction datedatedatedate
Application dateApplication dateApplication dateApplication date Approved by Approved by Approved by Approved by the European the European the European the European
UnionUnionUnionUnion
Description of potential changesDescription of potential changesDescription of potential changesDescription of potential changes
Amendments to IFRS 1 ‘Severe Hyperinflation and Removal of Fixed Dates for First-time Adopters’
December 2010
Financial year starting on or after 1 July 2011
No The amendment regarding severe hyperinflation creates an additional exemption when an entity that has been subject to severe hyperinflation resumes presenting or presents for the first time, financial statements in accordance with IFRS. The exemption allows an entity to elect to measure certain assets and liabilities at fair value, and to use that fair value as the deemed cost in the opening IFRS statement of financial position.
The IASB has also amended IFRS 1 to eliminate references to fixed dates for one exception and one exemption, both dealing with financial assets and liabilities. The first change requires first-time adopters to apply the derecognition requirements of IFRS prospectively from the date of transition, rather than from 1 January 2004. The second amendment relates to financial assets or liabilities where the fair value is established through valuation techniques due to no active market and allows the guidance to be applied prospectively from the date of transition to IFRS rather than from 25 October 2002 or 1 January 2004. This means that a first-time adopter may not need to determine the fair value of certain financial assets and liabilities at initial recognition for periods prior to the date of transition. IFRS 9 has also been amended to reflect these changes.
These changes do not apply to the Group due to the fact that the Group presents financial statements in accordance with IFRS from 2005.

This document is a translation of a document originally issued in Polish. The only binding version is the original Polish version.
Consolidated Financial Statements of the Powszechna Kasa Oszczędności Bank Polski Spółka Akcyjna Group
for the year ended 31 December 2011 (in PLN thousand)
42
Standard/ interpretationStandard/ interpretationStandard/ interpretationStandard/ interpretation Introduction Introduction Introduction Introduction datedatedatedate
Application dateApplication dateApplication dateApplication date Approved by Approved by Approved by Approved by the European the European the European the European
UnionUnionUnionUnion
Description of potential changesDescription of potential changesDescription of potential changesDescription of potential changes
Amendments to IFRS 7 ‘Transfers of Financial Assets’
October 2010
Financial year starting on or after 1 July 2011
Yes
The amendments require additional disclosures in respect of risk exposures arising from transferred financial assets. The amendment includes a requirement to disclose by class of asset the nature, carrying amount and a description of the risks and rewards of financial assets that have been transferred to another party, yet remaining in the entity's balance sheet. Disclosures are also required to enable to understand the amount of any associated liabilities, and the relationship between the certain financial assets and associated liabilities. Where financial assets have been derecognised, but the entity is still exposed to certain risks and rewards associated with the transferred asset, additional disclosure is required to enable the effects of those risks to be understood.
These changes will be applicable to the financial statements of the Group for 2012 and will require the Group’s broader disclosures, however it is estimated that Group’s scale of changes would not be significant.
Amendments to IAS 12 ‘Recovery of Underlying Assets’
December 2010
Financial year starting on or after 1 January 2012
No The amendments relate to measuring deferred tax liabilities and deferred tax assets relating to investment property measured using the fair value model in IAS 40, Investment Property and introduce a rebuttable presumption that an investment property is recovered entirely through sale. This presumption is rebutted if the investment property is held within a business model whose objective is to consume substantially all of the economic benefits embodied in the investment property over time, rather than through sale. SIC-21, ‘Income Taxes – Recovery of Revalued Non-Depreciable Assets’, which addresses similar issues involving non-depreciable assets measured using the revaluation model in IAS 16, ‘Property, Plant and Equipment’, was incorporated into IAS 12 after excluding from its scope guidance on investment properties measured at fair value.
The above changes will possibly apply for the first time to the financial statements of the Group for the year 2013, provided that they are adopted by the European Union. As of today, due to a lack of such transactions in the Group, it is estimated that the above amendments shall not apply to the financial statements of the Group.
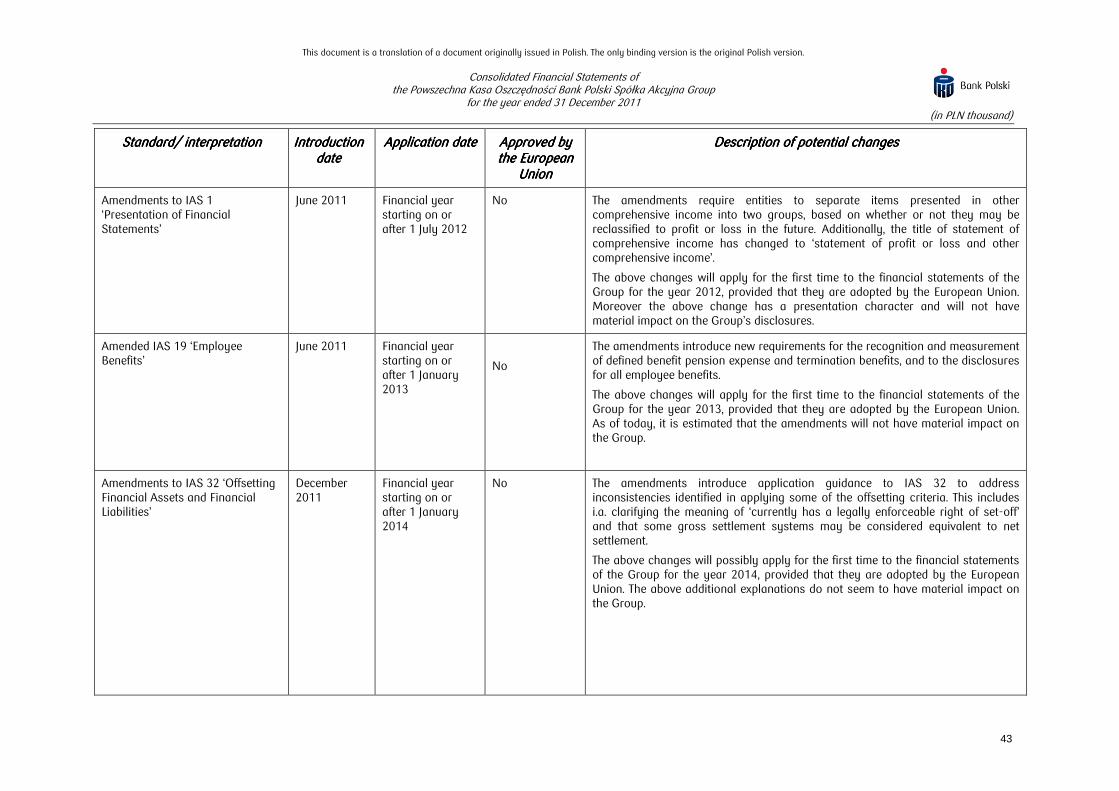
This document is a translation of a document originally issued in Polish. The only binding version is the original Polish version.
Consolidated Financial Statements of the Powszechna Kasa Oszczędności Bank Polski Spółka Akcyjna Group
for the year ended 31 December 2011 (in PLN thousand)
43
Standard/ interpretationStandard/ interpretationStandard/ interpretationStandard/ interpretation Introduction Introduction Introduction Introduction datedatedatedate
Application dateApplication dateApplication dateApplication date Approved by Approved by Approved by Approved by the European the European the European the European
UnionUnionUnionUnion
Description of potential changesDescription of potential changesDescription of potential changesDescription of potential changes
Amendments to IAS 1 ‘Presentation of Financial Statements’
June 2011 Financial year starting on or after 1 July 2012
No The amendments require entities to separate items presented in other comprehensive income into two groups, based on whether or not they may be reclassified to profit or loss in the future. Additionally, the title of statement of comprehensive income has changed to ‘statement of profit or loss and other comprehensive income’.
The above changes will apply for the first time to the financial statements of the Group for the year 2012, provided that they are adopted by the European Union. Moreover the above change has a presentation character and will not have material impact on the Group’s disclosures.
Amended IAS 19 ‘Employee Benefits’
June 2011 Financial year starting on or after 1 January 2013
No
The amendments introduce new requirements for the recognition and measurement of defined benefit pension expense and termination benefits, and to the disclosures for all employee benefits.
The above changes will apply for the first time to the financial statements of the Group for the year 2013, provided that they are adopted by the European Union. As of today, it is estimated that the amendments will not have material impact on the Group.
Amendments to IAS 32 ‘Offsetting Financial Assets and Financial Liabilities’
December 2011
Financial year starting on or after 1 January 2014
No The amendments introduce application guidance to IAS 32 to address inconsistencies identified in applying some of the offsetting criteria. This includes i.a. clarifying the meaning of ‘currently has a legally enforceable right of set-off’ and that some gross settlement systems may be considered equivalent to net settlement.
The above changes will possibly apply for the first time to the financial statements of the Group for the year 2014, provided that they are adopted by the European Union. The above additional explanations do not seem to have material impact on the Group.
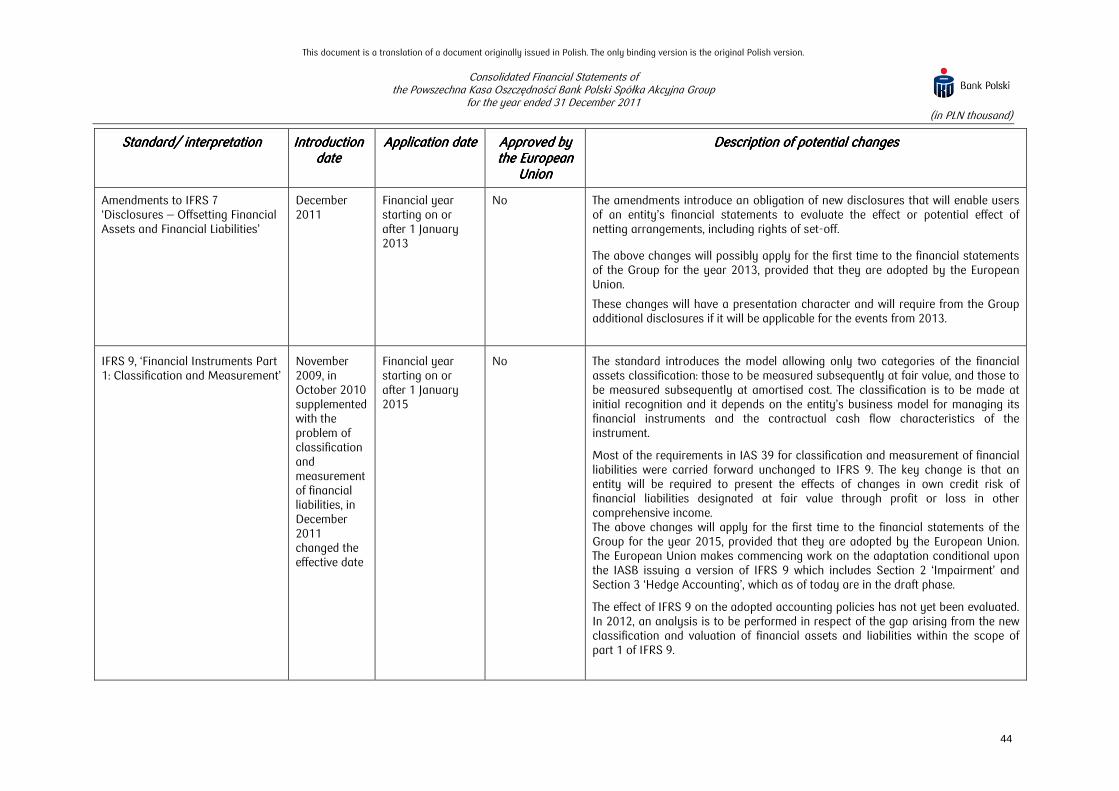
This document is a translation of a document originally issued in Polish. The only binding version is the original Polish version.
Consolidated Financial Statements of the Powszechna Kasa Oszczędności Bank Polski Spółka Akcyjna Group
for the year ended 31 December 2011 (in PLN thousand)
44
Standard/ interpretationStandard/ interpretationStandard/ interpretationStandard/ interpretation Introduction Introduction Introduction Introduction datedatedatedate
Application dateApplication dateApplication dateApplication date Approved by Approved by Approved by Approved by the European the European the European the European
UnionUnionUnionUnion
Description of potential changesDescription of potential changesDescription of potential changesDescription of potential changes
Amendments to IFRS 7 ‘Disclosures — Offsetting Financial Assets and Financial Liabilities’
December 2011
Financial year starting on or after 1 January 2013
No The amendments introduce an obligation of new disclosures that will enable users of an entity’s financial statements to evaluate the effect or potential effect of netting arrangements, including rights of set-off.
The above changes will possibly apply for the first time to the financial statements of the Group for the year 2013, provided that they are adopted by the European Union.
These changes will have a presentation character and will require from the Group additional disclosures if it will be applicable for the events from 2013.
IFRS 9, ‘Financial Instruments Part 1: Classification and Measurement’
November 2009, in October 2010 supplemented with the problem of classification and measurement of financial liabilities, in December 2011 changed the effective date
Financial year starting on or after 1 January 2015
No The standard introduces the model allowing only two categories of the financial assets classification: those to be measured subsequently at fair value, and those to be measured subsequently at amortised cost. The classification is to be made at initial recognition and it depends on the entity’s business model for managing its financial instruments and the contractual cash flow characteristics of the instrument.
Most of the requirements in IAS 39 for classification and measurement of financial liabilities were carried forward unchanged to IFRS 9. The key change is that an entity will be required to present the effects of changes in own credit risk of financial liabilities designated at fair value through profit or loss in other comprehensive income. The above changes will apply for the first time to the financial statements of the Group for the year 2015, provided that they are adopted by the European Union. The European Union makes commencing work on the adaptation conditional upon the IASB issuing a version of IFRS 9 which includes Section 2 ‘Impairment’ and Section 3 ‘Hedge Accounting’, which as of today are in the draft phase.
The effect of IFRS 9 on the adopted accounting policies has not yet been evaluated. In 2012, an analysis is to be performed in respect of the gap arising from the new classification and valuation of financial assets and liabilities within the scope of part 1 of IFRS 9.

This document is a translation of a document originally issued in Polish. The only binding version is the original Polish version.
Consolidated Financial Statements of the Powszechna Kasa Oszczędności Bank Polski Spółka Akcyjna Group
for the year ended 31 December 2011 (in PLN thousand)
45
Standard/ interpretationStandard/ interpretationStandard/ interpretationStandard/ interpretation Introduction Introduction Introduction Introduction datedatedatedate
Application dateApplication dateApplication dateApplication date Approved by Approved by Approved by Approved by the European the European the European the European
UnionUnionUnionUnion
Description of potential changesDescription of potential changesDescription of potential changesDescription of potential changes
IFRS 10 ‘Consolidated Financial Statements’
May 2011 Financial year starting on or after 1 January 2013
No The new standard replaces all of the guidance on control and consolidation in IAS 27 ‘Consolidated and separate financial statements’ and in the interpretation SIC-12 ‘Consolidation - special purpose entities’. IFRS 10 changes the definition of control so that the same criteria are applied to all entities to determine control. This definition is supported by extensive application guidance.
The above changes will possibly apply for the first time to the financial statements of the Group for the year 2013, provided that they are adopted by the European Union.
Based on preliminary analyses, the new standard does not seem to have a significant influence on the Group.
IFRS 11 ‘Joint Arrangements’ May 2011 Financial year starting on or after 1 January 2013
No The new standard replaces IAS 31 ‘Interests in Joint Ventures’ and the interpretation SIC-13 ‘Jointly Controlled Entities — Non-Monetary Contributions by Ventures’. Changes in the definitions have reduced the number of types of joint arrangements to two: joint operations and joint ventures. At the same time, the existing policy choice of proportionate consolidation for jointly controlled entities has been eliminated. Equity method is mandatory for all participants in joint ventures.
The above changes will possibly apply for the first time to the financial statements of the Group for the year 2013, provided that they are adopted by the European Union. In the case of the Group it is estimated, that the scope of changes will not be material.
IFRS 12 ‘Disclosure of Interest in Other Entities’
May 2011 Financial year starting on or after 1 January 2013
No The new standard applies to entities that have an interest in a subsidiary, a joint ventures, an associate or an unconsolidated structured entity. The standard replaces the disclosure requirements currently found in IAS 28 ‘Investments in associates’. IFRS 12 requires entities to disclose information that helps financial statement readers to evaluate the nature, risks and financial effects associated with the entity’s interests in subsidiaries, associates, joint ventures and unconsolidated structured entities. To meet these objectives, the new standard requires disclosures in a number of areas, including significant judgments and assumptions made in determining whether an entity controls, jointly controls, or significantly influences its interests in other entities, extended disclosures on share of non-controlling interests in group activities and cash flows, summarised financial information of subsidiaries with material non-controlling interests, and

This document is a translation of a document originally issued in Polish. The only binding version is the original Polish version.
Consolidated Financial Statements of the Powszechna Kasa Oszczędności Bank Polski Spółka Akcyjna Group
for the year ended 31 December 2011 (in PLN thousand)
46
Standard/ interpretationStandard/ interpretationStandard/ interpretationStandard/ interpretation Introduction Introduction Introduction Introduction datedatedatedate
Application dateApplication dateApplication dateApplication date Approved by Approved by Approved by Approved by the European the European the European the European
UnionUnionUnionUnion
Description of potential changesDescription of potential changesDescription of potential changesDescription of potential changes
detailed disclosures of interests in unconsolidated structured entities.
The above changes will apply for the first time to the financial statements of the Group for the year 2013, provided that they are adopted by the European Union. The changes applied will require additional disclosures to the Group’s financial statements, but it is estimated that due to the current wide range of disclosures about the Group’s entities in case of the Group the additional scope of disclosures will not be material.
IFRS 13 ‘Fair Value Measurement’ May 2011 Financial year starting on or after 1 January 2013
No The new standard aims to improve consistency and reduce complexity by providing a revised definition of fair value, and a single source of fair value measurement and disclosure requirements.
The above changes will apply for the first time to the financial statements of the Group for the year 2013, provided that they are adopted by the European Union.
As of today it is estimated that due to the character of the new IFRS the scope of changes will not be material.
Revised IAS 27 ‘Separate Financial Statements’
May 2011 Financial year starting on or after 1 January 2013
No IAS 27 was changed in connection with the publication of IFRS 10 ‘Consolidated Financial Statements’. The objective of revised IAS 27 is to prescribe the accounting and disclosure requirements for investments in subsidiaries, joint ventures and associates when an entity prepares separate financial statements. The guidance on control and consolidated financial statements was replaced by IFRS 10.
The above changes will apply for the first time to the financial statements of the Bank for the year 2013, provided that they are adopted by the European Union.
It is estimated that the additional scope of disclosures, due to the current wide range of disclosures about the Group’s entities will not be material.

This document is a translation of a document originally issued in Polish. The only binding version is the original Polish version.
Consolidated Financial Statements of the Powszechna Kasa Oszczędności Bank Polski Spółka Akcyjna Group
for the year ended 31 December 2011 (in PLN thousand)
47
Standard/ interpretationStandard/ interpretationStandard/ interpretationStandard/ interpretation Introduction Introduction Introduction Introduction datedatedatedate
Application dateApplication dateApplication dateApplication date Approved by Approved by Approved by Approved by the European the European the European the European
UnionUnionUnionUnion
Description of potential changesDescription of potential changesDescription of potential changesDescription of potential changes
Revised IAS 28 ‘Investments in Associates and Joint Ventures’
May 2011 Financial year starting on or after 1 January 2013
No The amendment of IAS 28 resulted from the IASB’s project on joint ventures. The Board decided to incorporate the accounting for joint ventures using the equity method into IAS 28 because this method is applicable to both joint ventures and associates. With this exception, other guidance remained unchanged.
The above changes will possibly apply for the first time to the financial statements of the Group for the year 2013, provided that they are adopted by the European Union.
According to the accounting policies subsidiaries and associates are recognised using equity method.
IFRIC 20 ‘Stripping Costs in the Production Phase of a Surface Mine’
October 2011 Financial year starting on or after 1 January 2013
No The interpretation clarifies that costs from the stripping activity are accounted for expenses of the current production in accordance with the principles of IAS 2, ‘Inventories’, to the extent that benefits from the stripping activity are realised in the form of inventory produced. To the extent the stripping activity leads to the benefits representing improved access to ore, the entity should recognise these costs as a ‘stripping activity asset’ within non-current assets, subject to certain criteria of interpretation being met.
In accordance with the range of activity of the Bank, IFRIC 20 does not apply.
The Management Board does not expect the introduction of the above-mentioned standards and interpretations to have a significant influence on the accounting policies applied by the Group with the exception of IFRS 9 (an influence of IFRS 9 on accounting principles applied by the Group have not been assessed yet). The Group intends to apply them in the periods indicated in the relevant standards and interpretations (without early adoption), provided that they are adopted by the EU.

This document is a translation of a document originally issued in Polish. The only binding version is the original Polish version.
Consolidated Financial Statements of the Powszechna Kasa Oszczędności Bank Polski Spółka Akcyjna Group
for the year ended 31 December 2011 (in PLN thousand)
48
3.3.3.3. Information on the segments of activities Information on the segments of activities Information on the segments of activities Information on the segments of activities
The PKO Bank Polski SA Group’s reporting scheme is primarily based on the criteria of groups of clients – recipients of products and services offered by the parent company and other entities of the PKO Bank Polski SA Group. Each operating business segment comprises activities of providing products and services that are characterised by similar risk and income – different from other business segments. The segment report below is recognised in an internal reporting system, i.e. the way of presenting data to the Management Board of PKO Bank Polski SA, used to assess achieved results and to allocate resources.
The segment report below presents an internal structure of the PKO Bank Polski SA Group. At present, the PKO Bank Polski SA Group comprises three basic segments: retail, corporate and investment segment:
1) The retail segment comprises transactions of the parent company with retail clients, small and medium entities and housing market clients, as well as activities of the following subsidiaries: KREDOBANK SA, Finansowa Kompania ‘Prywatne Inwestycje’ Sp. z o.o., PKO BP BANKOWY Powszechne Towarzystwo Emerytalne SA, PKO Towarzystwo Funduszy Inwestycyjnych SA, Inteligo Financial Services SA, PKO BP Finat Sp. z o.o., Centrum Elektronicznych Usług Płatniczych eService SA, Qualia Development Sp. z o.o. Group and Fort Mokotów Inwestycje Sp. z o.o. This segment comprises, among others, the following products and services: current and saving accounts, deposits, private banking services, investment products, credit and debit cards, consumer and mortgage loans, corporate loans for small and medium enterprises and housing market customers.
2) The corporate segment includes transactions of the parent company with large corporate clients, as well as activities of the Bankowy Fundusz Leasingowy SA Group and the Bankowe Towarzystwo Kapitałowe SA Group.
This segment comprises, among others, the following products and services: current and saving accounts, deposits, depositary services, currency and derivative products, sell buy back and buy sell back transactions, corporate loans, leases and factoring. Within the segment, PKO Bank Polski SA also enters, individually or in a consortium with other banks, into loan agreements financing large investment projects.
3) The investment segment comprises the Bank’s portfolio activity on its own account, i.e. investing and brokerage activities, interbank transactions, derivative instruments and debt securities transactions and activities of PKO Finance AB and Centrum Finansowe Puławska Sp. z .o.o. (own activities). In the net result of the segment, the net result of internal settlements (ALM) related to funds transfer pricing, the result on long-term sources of financing and the result on positions classified for hedge accounting is presented. Internal funds transfer is based on transfer pricing dependant on interest rates. The transactions between business segments are conducted on arm’s length. Long-term external financing includes the issuance of bonds, subordinated liabilities and funds under the EMTN programme issuance as well as amounts due to financial institutions.
The PKO Bank Polski SA Group typically settles inter-segment transactions as if they were concluded between unrelated parties, using internal settlement rates. The transactions between business segments are conducted on arm’s length.
Accounting policies applied in the segment report are consistent with accounting policies described in Note 2 of these financial statements.
Disclosed values of assets and liabilities are operating assets and liabilities applied by operating activities segment. Values of assets, liabilities, income and expenses of a particular segment are based on internal management information. To particular segments there have been assigned assets and liabilities as well as income and expense related to these assets and liabilities.
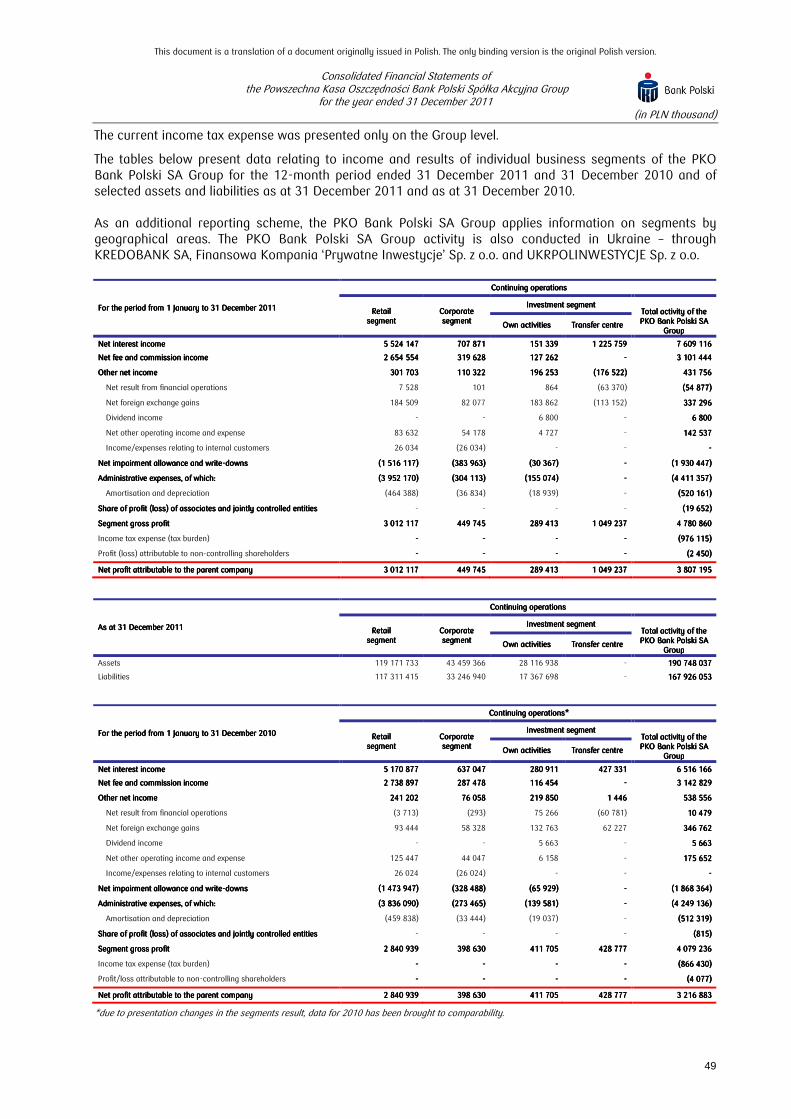
This document is a translation of a document originally issued in Polish. The only binding version is the original Polish version.
Consolidated Financial Statements of the Powszechna Kasa Oszczędności Bank Polski Spółka Akcyjna Group
for the year ended 31 December 2011 (in PLN thousand)
49
The current income tax expense was presented only on the Group level.
The tables below present data relating to income and results of individual business segments of the PKO Bank Polski SA Group for the 12-month period ended 31 December 2011 and 31 December 2010 and of selected assets and liabilities as at 31 December 2011 and as at 31 December 2010.
As an additional reporting scheme, the PKO Bank Polski SA Group applies information on segments by geographical areas. The PKO Bank Polski SA Group activity is also conducted in Ukraine – through KREDOBANK SA, Finansowa Kompania ‘Prywatne Inwestycje’ Sp. z o.o. and UKRPOLINWESTYCJE Sp. z o.o.
*due to presentation changes in the segments result, data for 2010 has been brought to comparability.
For the period from 1 January to 31 December 2011For the period from 1 January to 31 December 2011For the period from 1 January to 31 December 2011For the period from 1 January to 31 December 2011
Continuing Continuing Continuing Continuing operationsoperationsoperationsoperations
Retail Retail Retail Retail segmentsegmentsegmentsegment
Corporate Corporate Corporate Corporate segmentsegmentsegmentsegment
Investment segmentInvestment segmentInvestment segmentInvestment segment Total activity of the Total activity of the Total activity of the Total activity of the PKO Bank Polski SA PKO Bank Polski SA PKO Bank Polski SA PKO Bank Polski SA
GroupGroupGroupGroup Own activitiesOwn activitiesOwn activitiesOwn activities Transfer centreTransfer centreTransfer centreTransfer centre
Net interest incomeNet interest incomeNet interest incomeNet interest income 5 524 147 5 524 147 5 524 147 5 524 147 707 871 707 871 707 871 707 871 151 339 151 339 151 339 151 339 1 225 759 1 225 759 1 225 759 1 225 759 7 609 116 7 609 116 7 609 116 7 609 116
Net fee and commission incomeNet fee and commission incomeNet fee and commission incomeNet fee and commission income 2 654 554 2 654 554 2 654 554 2 654 554 319 628 319 628 319 628 319 628 127 262 127 262 127 262 127 262 ---- 3 101 444 3 101 444 3 101 444 3 101 444
Other net incomeOther net incomeOther net incomeOther net income 301 703 301 703 301 703 301 703 110 322 110 322 110 322 110 322 196 253 196 253 196 253 196 253 (176 522)(176 522)(176 522)(176 522) 431 756 431 756 431 756 431 756
Net result from financial operations 7 528 101 864 (63 370) (54 877)(54 877)(54 877)(54 877)
Net foreign exchange gains 184 509 82 077 183 862 (113 152) 337 296 337 296 337 296 337 296
Dividend income - - 6 800 - 6 800 6 800 6 800 6 800
Net other operating income and expense 83 632 54 178 4 727 - 142 537 142 537 142 537 142 537
Income/expenses relating to internal customers 26 034 (26 034) - - ----
Net impairment allowance and writeNet impairment allowance and writeNet impairment allowance and writeNet impairment allowance and write----downsdownsdownsdowns (1 516 117)(1 516 117)(1 516 117)(1 516 117) (383 963)(383 963)(383 963)(383 963) (30 367)(30 367)(30 367)(30 367) ---- (1 930 447)(1 930 447)(1 930 447)(1 930 447)
Administrative expenses, Administrative expenses, Administrative expenses, Administrative expenses, of which:of which:of which:of which: (3 952 170)(3 952 170)(3 952 170)(3 952 170) (304 113)(304 113)(304 113)(304 113) (155 074)(155 074)(155 074)(155 074) ---- (4 411 357)(4 411 357)(4 411 357)(4 411 357)
Amortisation and depreciation (464 388) (36 834) (18 939) - (520 161)(520 161)(520 161)(520 161)
Share of profit (loss) of associates and jointly controlled entitiesShare of profit (loss) of associates and jointly controlled entitiesShare of profit (loss) of associates and jointly controlled entitiesShare of profit (loss) of associates and jointly controlled entities - - - - (19 652)(19 652)(19 652)(19 652)
Segment gross profitSegment gross profitSegment gross profitSegment gross profit 3 012 117 3 012 117 3 012 117 3 012 117 449 745 449 745 449 745 449 745 289 413 289 413 289 413 289 413 1 049 237 1 049 237 1 049 237 1 049 237 4 780 860 4 780 860 4 780 860 4 780 860
Income tax expense (tax burden) ---- ---- ---- ---- (976 115)(976 115)(976 115)(976 115)
Profit (loss) attributable to non-controlling shareholders ---- ---- ---- ---- (2 450)(2 450)(2 450)(2 450)
Net profit attributable to the parent companyNet profit attributable to the parent companyNet profit attributable to the parent companyNet profit attributable to the parent company 3 012 117 3 012 117 3 012 117 3 012 117 449 745 449 745 449 745 449 745 289 413 289 413 289 413 289 413 1 049 237 1 049 237 1 049 237 1 049 237 3 807 195 3 807 195 3 807 195 3 807 195
As at 31 December 2011As at 31 December 2011As at 31 December 2011As at 31 December 2011
ContinuingContinuingContinuingContinuing operationsoperationsoperationsoperations
Retail Retail Retail Retail segmentsegmentsegmentsegment
Corporate Corporate Corporate Corporate segmentsegmentsegmentsegment
Investment segmentInvestment segmentInvestment segmentInvestment segment Total activity of the Total activity of the Total activity of the Total activity of the PKO Bank Polski SA PKO Bank Polski SA PKO Bank Polski SA PKO Bank Polski SA
GroupGroupGroupGroup Own activitiesOwn activitiesOwn activitiesOwn activities Transfer centreTransfer centreTransfer centreTransfer centre
Assets 119 171 733 43 459 366 28 116 938 - 190 748 037190 748 037190 748 037190 748 037
Liabilities 117 311 415 33 246 940 17 367 698 - 167 926 053167 926 053167 926 053167 926 053
For the period from 1 January to 31 December 2010For the period from 1 January to 31 December 2010For the period from 1 January to 31 December 2010For the period from 1 January to 31 December 2010
Continuing Continuing Continuing Continuing operationsoperationsoperationsoperations****
Retail Retail Retail Retail segmentsegmentsegmentsegment
Corporate Corporate Corporate Corporate segmentsegmentsegmentsegment
Investment segmentInvestment segmentInvestment segmentInvestment segment Total activity of the Total activity of the Total activity of the Total activity of the PKO Bank Polski SA PKO Bank Polski SA PKO Bank Polski SA PKO Bank Polski SA
GroupGroupGroupGroup Own activitiesOwn activitiesOwn activitiesOwn activities Transfer centreTransfer centreTransfer centreTransfer centre
Net interest incomeNet interest incomeNet interest incomeNet interest income 5 170 877 5 170 877 5 170 877 5 170 877 637 047 637 047 637 047 637 047 280 911 280 911 280 911 280 911 427 331 427 331 427 331 427 331 6 516 166 6 516 166 6 516 166 6 516 166
Net fee and commission incomeNet fee and commission incomeNet fee and commission incomeNet fee and commission income 2 738 897 2 738 897 2 738 897 2 738 897 287 478 287 478 287 478 287 478 116 454 116 454 116 454 116 454 ---- 3 142 829 3 142 829 3 142 829 3 142 829
Other net incomeOther net incomeOther net incomeOther net income 241 202 241 202 241 202 241 202 76 058 76 058 76 058 76 058 219 850 219 850 219 850 219 850 1 446 1 446 1 446 1 446 538 556 538 556 538 556 538 556
Net result from financial operations (3 713) (293) 75 266 (60 781) 10 479 10 479 10 479 10 479
Net foreign exchange gains 93 444 58 328 132 763 62 227 346 762 346 762 346 762 346 762
Dividend income - - 5 663 - 5 663 5 663 5 663 5 663
Net other operating income and expense 125 447 44 047 6 158 - 175 652 175 652 175 652 175 652
Income/expenses relating to internal customers 26 024 (26 024) - - ----
Net impairment allowance and writeNet impairment allowance and writeNet impairment allowance and writeNet impairment allowance and write----downsdownsdownsdowns (1 473 947)(1 473 947)(1 473 947)(1 473 947) (328 488)(328 488)(328 488)(328 488) (65 929)(65 929)(65 929)(65 929) ---- (1 868 364)(1 868 364)(1 868 364)(1 868 364)
Administrative expenses, of which:Administrative expenses, of which:Administrative expenses, of which:Administrative expenses, of which: (3 836 090)(3 836 090)(3 836 090)(3 836 090) (273 465)(273 465)(273 465)(273 465) (139 581)(139 581)(139 581)(139 581) ---- (4 249 136)(4 249 136)(4 249 136)(4 249 136)
Amortisation and depreciation (459 838) (33 444) (19 037) - (512 319)(512 319)(512 319)(512 319)
Share of profit (loss) of associates and jointly controlled entitiesShare of profit (loss) of associates and jointly controlled entitiesShare of profit (loss) of associates and jointly controlled entitiesShare of profit (loss) of associates and jointly controlled entities - - - - (815)(815)(815)(815)
Segment gross profitSegment gross profitSegment gross profitSegment gross profit 2 840 939 2 840 939 2 840 939 2 840 939 398 630 398 630 398 630 398 630 411 705 411 705 411 705 411 705 428 777 428 777 428 777 428 777 4 079 236 4 079 236 4 079 236 4 079 236
Income tax expense (tax burden) ---- ---- ---- ---- (866 430)(866 430)(866 430)(866 430)
Profit/loss attributable to non-controlling shareholders ---- ---- ---- ---- (4 077)(4 077)(4 077)(4 077)
Net profit attributable to the parent companyNet profit attributable to the parent companyNet profit attributable to the parent companyNet profit attributable to the parent company 2 840 939 2 840 939 2 840 939 2 840 939 398 630 398 630 398 630 398 630 411 705 411 705 411 705 411 705 428 777 428 777 428 777 428 777 3 216 883 3 216 883 3 216 883 3 216 883

This document is a translation of a document originally issued in Polish. The only binding version is the original Polish version.
Consolidated Financial Statements of the Powszechna Kasa Oszczędności Bank Polski Spółka Akcyjna Group
for the year ended 31 December 2011 (in PLN thousand)
50
*due to presentation changes in the segments result, data for 2010 has been brought to comparability.
As an additional reporting scheme, the PKO Bank Polski SA Group applies information on segments by geographical areas. The PKO Bank Polski SA Group activity is also conducted in Ukraine – through KREDOBANK SA, Finansowa Kompania ‘Prywatne Inwestycje’ Sp. z o.o. and UKRPOLINWESTYCJE Sp. z o.o.
For the period from 1 January to 31 December 201For the period from 1 January to 31 December 201For the period from 1 January to 31 December 201For the period from 1 January to 31 December 2011111
Continuing Continuing Continuing Continuing operationsoperationsoperationsoperations
PolandPolandPolandPoland UkraineUkraineUkraineUkraine TotalTotalTotalTotal
Net interest incomeNet interest incomeNet interest incomeNet interest income 7 562 456 46 660 7 609 116 7 609 116 7 609 116 7 609 116 Net fee and commission incomeNet fee and commission incomeNet fee and commission incomeNet fee and commission income 3 062 740 38 704 3 101 444 3 101 444 3 101 444 3 101 444
Other net incomeOther net incomeOther net incomeOther net income 429 079 2 677 431 756 431 756 431 756 431 756
Administrative expensesAdministrative expensesAdministrative expensesAdministrative expenses (4 306 730) (104 627) (4 411 357)(4 411 357)(4 411 357)(4 411 357)
Net impairment allowance and writeNet impairment allowance and writeNet impairment allowance and writeNet impairment allowance and write----downsdownsdownsdowns (1 865 152) (65 295) (1 930 447)(1 930 447)(1 930 447)(1 930 447)
Share ofShare ofShare ofShare of profit (loss) of associates and jointly controlled entitiesprofit (loss) of associates and jointly controlled entitiesprofit (loss) of associates and jointly controlled entitiesprofit (loss) of associates and jointly controlled entities - - (19 652)(19 652)(19 652)(19 652)
Segment gross profitSegment gross profitSegment gross profitSegment gross profit 4 882 393 4 882 393 4 882 393 4 882 393 (81 881)(81 881)(81 881)(81 881) 4 780 860 4 780 860 4 780 860 4 780 860
Income tax expense (tax burden) - - (976 115)(976 115)(976 115)(976 115)
Profit (loss) attributable to non-controlling shareholders - - (2 450)(2 450)(2 450)(2 450)
Net profit (loss) attributable to the parent companyNet profit (loss) attributable to the parent companyNet profit (loss) attributable to the parent companyNet profit (loss) attributable to the parent company 4 882 393 4 882 393 4 882 393 4 882 393 (81 881)(81 881)(81 881)(81 881) 3 807 195 3 807 195 3 807 195 3 807 195 Assets of the segment 189 196 560 1 551 477 190 748 037190 748 037190 748 037190 748 037 Liabilities of the segment 166 763 390 1 162 663 167 926 053167 926 053167 926 053167 926 053
For the period from 1 January to 31 December 2010For the period from 1 January to 31 December 2010For the period from 1 January to 31 December 2010For the period from 1 January to 31 December 2010
Continuing Continuing Continuing Continuing operationsoperationsoperationsoperations
PolandPolandPolandPoland UkraineUkraineUkraineUkraine TotalTotalTotalTotal
Net interest incomeNet interest incomeNet interest incomeNet interest income 6 446 248 69 918 6 516 166 6 516 166 6 516 166 6 516 166 Net fee and commission incomeNet fee and commission incomeNet fee and commission incomeNet fee and commission income 3 102 281 40 548 3 142 829 3 142 829 3 142 829 3 142 829
Other net incomeOther net incomeOther net incomeOther net income 539 835 (1 279) 538 556 538 556 538 556 538 556
Administrative expensesAdministrative expensesAdministrative expensesAdministrative expenses (4 135 277) (113 859) (4 249 136)(4 249 136)(4 249 136)(4 249 136)
Net impairment allowance and writeNet impairment allowance and writeNet impairment allowance and writeNet impairment allowance and write----downsdownsdownsdowns (1 858 988) (9 376) (1 868 364)(1 868 364)(1 868 364)(1 868 364)
Share ofShare ofShare ofShare of profit (loss) of associates and jointly controlled entitiesprofit (loss) of associates and jointly controlled entitiesprofit (loss) of associates and jointly controlled entitiesprofit (loss) of associates and jointly controlled entities - - (815)(815)(815)(815)
Segment gross profitSegment gross profitSegment gross profitSegment gross profit 4 094 099 4 094 099 4 094 099 4 094 099 (14 048)(14 048)(14 048)(14 048) 4 079 236 4 079 236 4 079 236 4 079 236
Income tax expense (tax burden) - - (866 430)(866 430)(866 430)(866 430)
Profit (loss) attributable to non-controlling shareholders - - (4 077)(4 077)(4 077)(4 077)
Net profit (loss) attributable to the parent companyNet profit (loss) attributable to the parent companyNet profit (loss) attributable to the parent companyNet profit (loss) attributable to the parent company 4 094 099 4 094 099 4 094 099 4 094 099 (14 048)(14 048)(14 048)(14 048) 3 216 883 3 216 883 3 216 883 3 216 883
Assets of the segment 168 030 912 1 629 589 169 660 501169 660 501169 660 501169 660 501 Liabilities of the segment 147 264 946 1 035 987 148 300 933148 300 933148 300 933148 300 933
As at 31 December 2010As at 31 December 2010As at 31 December 2010As at 31 December 2010
Continuing Continuing Continuing Continuing operationsoperationsoperationsoperations****
Retail Retail Retail Retail segmentsegmentsegmentsegment
Corporate Corporate Corporate Corporate segmentsegmentsegmentsegment
Investment segmentInvestment segmentInvestment segmentInvestment segment Total activity of the Total activity of the Total activity of the Total activity of the PKO Bank Polski SA PKO Bank Polski SA PKO Bank Polski SA PKO Bank Polski SA
GroupGroupGroupGroup Own activitiesOwn activitiesOwn activitiesOwn activities Transfer centreTransfer centreTransfer centreTransfer centre
Assets 112 010 210 34 963 122 22 687 169 - 169 660 501169 660 501169 660 501169 660 501
Liabilities 109 307 500 27 721 094 11 272 339 - 148 300 933148 300 933148 300 933148 300 933

This document is a translation of a document originally issued in Polish. The only binding version is the original Polish version.
Consolidated Financial Statements of the Powszechna Kasa Oszczędności Bank Polski Spółka Akcyjna Group
for the year ended 31 December 2011 (in PLN thousand)
51
NOTES TO THE NOTES TO THE NOTES TO THE NOTES TO THE CONSOLIDATED CONSOLIDATED CONSOLIDATED CONSOLIDATED INCOME STATEMENTINCOME STATEMENTINCOME STATEMENTINCOME STATEMENT
4.4.4.4. Interest income and expenseInterest income and expenseInterest income and expenseInterest income and expense
Interest and similar incomeInterest and similar incomeInterest and similar incomeInterest and similar income
2012012012011111 2010201020102010
Interest income calculated using the effective interest rate method, with Interest income calculated using the effective interest rate method, with Interest income calculated using the effective interest rate method, with Interest income calculated using the effective interest rate method, with respect to respect to respect to respect to financial assetsfinancial assetsfinancial assetsfinancial assets, which are not designated at fair value t, which are not designated at fair value t, which are not designated at fair value t, which are not designated at fair value thhhhrough profit rough profit rough profit rough profit and loss, of and loss, of and loss, of and loss, of which:which:which:which:
10 586 814 10 586 814 10 586 814 10 586 814 9 142 557 9 142 557 9 142 557 9 142 557
Income from loans and advances to customers 9 782 468 8 532 201
Income from investment securities available for sale 576 630 457 802
Income from investment securities held to maturity - 156
Income from placements with banks 218 731 148 494
Other 8 985 3 904
Other income,Other income,Other income,Other income, of whichof whichof whichof which: 1 450 948 1 450 948 1 450 948 1 450 948 1 272 758 1 272 758 1 272 758 1 272 758
Income from derivative hedging instruments 814 275 649 116
Income from financial assets designated upon initial recognition at fair value through profit and loss
561 826 494 702
Income from trading assets 74 847 128 940
TotalTotalTotalTotal 12 037 762 12 037 762 12 037 762 12 037 762 10 415 315 10 415 315 10 415 315 10 415 315
In the ‘Income from derivative hedging instruments’ the Group presents interest income from derivative instruments designated for hedge accounting that are effective hedging instruments in the respect of cash flow hedges. Details of hedging relationships applied by the Group are included in Note 21 ‘Derivative hedging instruments’.
In the year ended 31 December 2011, interest income from impaired loans amounted to PLN 385 425 thousand (in the year ended 31 December 2010 it amounted to PLN 320 718 thousand). This income has been included in the position ‘Income from loans and advances to customers’.
Interest expense and similar Interest expense and similar Interest expense and similar Interest expense and similar chargeschargeschargescharges
2012012012011111 2020202010101010
Interest expense calculated using the effective interestInterest expense calculated using the effective interestInterest expense calculated using the effective interestInterest expense calculated using the effective interest rate method,rate method,rate method,rate method, with respect to with respect to with respect to with respect to financial liabilities, which are not designated at fair value tfinancial liabilities, which are not designated at fair value tfinancial liabilities, which are not designated at fair value tfinancial liabilities, which are not designated at fair value thhhhrough profit and loss, of rough profit and loss, of rough profit and loss, of rough profit and loss, of which:which:which:which:
(4 426 762)(4 426 762)(4 426 762)(4 426 762) (3 872 932)(3 872 932)(3 872 932)(3 872 932)
Interest expense on amounts due to customers (4 101 578) (3 715 721)
Interest expense on debt securities in issue (278 178) (123 382)
Interest expense on deposits from banks (45 684) (30 276)
Premium expense on debt securities available for sale (1 322) (3 553)
Other expenseOther expenseOther expenseOther expense (1 884)(1 884)(1 884)(1 884) (26 217)(26 217)(26 217)(26 217)
TotalTotalTotalTotal (4 428 646)(4 428 646)(4 428 646)(4 428 646) (3 899 149)(3 899 149)(3 899 149)(3 899 149)

This document is a translation of a document originally issued in Polish. The only binding version is the original Polish version.
Consolidated Financial Statements of the Powszechna Kasa Oszczędności Bank Polski Spółka Akcyjna Group
for the year ended 31 December 2011 (in PLN thousand)
52
Net gains and losses from financial assets and liabilities measured at Net gains and losses from financial assets and liabilities measured at Net gains and losses from financial assets and liabilities measured at Net gains and losses from financial assets and liabilities measured at amortisedamortisedamortisedamortised costcostcostcost
2012012012011111 2020202010101010
Net gains and losses from financial assets measured at amortised costNet gains and losses from financial assets measured at amortised costNet gains and losses from financial assets measured at amortised costNet gains and losses from financial assets measured at amortised cost 8 744 562 8 744 562 8 744 562 8 744 562 7 462 566 7 462 566 7 462 566 7 462 566
Interest income from loans and advances to customers 9 782 468 8 532 201
Fee and commission income from loans and advances 582 100 528 824
Interest income from placements with banks 218 731 148 494
Net impairment allowance on loans and advances to customers and amounts due from banks measured at amortised cost (1 818 641) (1 728 268)
Net impairment allowance on finance lease receivables (20 096) (18 685)
Losses from financial liabilities measured at amortised Losses from financial liabilities measured at amortised Losses from financial liabilities measured at amortised Losses from financial liabilities measured at amortised costcostcostcost (4 425 440)(4 425 440)(4 425 440)(4 425 440) (3 869 379)(3 869 379)(3 869 379)(3 869 379)
Interest expense on amounts due to customers (4 101 578) (3 715 721)
Interest expense on debt securities in issue (278 178) (123 382)
Interest expense on deposits from bank (45 684) (30 276)
Net resultNet resultNet resultNet result 4 319 122 4 319 122 4 319 122 4 319 122 3 593 187 3 593 187 3 593 187 3 593 187
5.5.5.5. Fee and commission income and expenseFee and commission income and expenseFee and commission income and expenseFee and commission income and expense Fee and commission incomeFee and commission incomeFee and commission incomeFee and commission income
2012012012011111 2020202010101010
Income from financial assets, which are not designated at fair value through profit Income from financial assets, which are not designated at fair value through profit Income from financial assets, which are not designated at fair value through profit Income from financial assets, which are not designated at fair value through profit and loss, of which:and loss, of which:and loss, of which:and loss, of which:
582 100 582 100 582 100 582 100 528 824 528 824 528 824 528 824
Income from loans and advances 582 100 528 824
Other commissionsOther commissionsOther commissionsOther commissions 3 252 259 3 252 259 3 252 259 3 252 259 3 350 380 3 350 380 3 350 380 3 350 380
Income from payment cards 1 048 720 963 434
Income from maintenance of bank accounts 916 484 922 632
Income from loan insurance 515 499 653 501
Income from maintenance of investment and pension funds (including management fees) 340 751 338 144
Income from cash transactions 160 451 177 684
Income from securities transactions 70 344 73 261
Income from servicing foreign mass transactions 47 966 44 754
Income from sale and distribution of court fee stamps 18 625 26 255
Other* 133 419 150 715
Income from fiduciary activitiesIncome from fiduciary activitiesIncome from fiduciary activitiesIncome from fiduciary activities 2 806 2 806 2 806 2 806 1 659 1 659 1 659 1 659
TotalTotalTotalTotal 3 837 165 3 837 165 3 837 165 3 837 165 3 880 863 3 880 863 3 880 863 3 880 863
* Included in ‘Other’ are i.a. commissions received for servicing bond sale transactions, commissions of the Brokerage House (Dom Maklerski) for servicing Initial Public Offering issue and commissions for servicing indebtedness of borrowers against the State budget.
Fee and commission Fee and commission Fee and commission Fee and commission expenseexpenseexpenseexpense
2012012012011111 2020202010101010
Expenses on payment cards (320 592) (293 247)
Expenses on acquisition services (140 216) (144 252)
Expenses on loan insurance (133 488) (150 842)
Expenses on settlement services (20 977) (21 751) Expenses on asset management fees (16 158) (21 672) Expenses on fee and commissions for operating services rendered by banks (11 435) (10 137) Other* (92 855) (96 133)
TotalTotalTotalTotal (735 721)(735 721)(735 721)(735 721) (738 034)(738 034)(738 034)(738 034)
* Included in ‘Other’ are i.a.: fee and expenses paid by the Brokerage House (Dom Maklerski) to Warsaw Stock Exchange (GPW) and to the National Depository for Securities (KDPW).

This document is a translation of a document originally issued in Polish. The only binding version is the original Polish version.
Consolidated Financial Statements of the Powszechna Kasa Oszczędności Bank Polski Spółka Akcyjna Group
for the year ended 31 December 2011 (in PLN thousand)
53
6.6.6.6. Dividend incomeDividend incomeDividend incomeDividend income
2011201120112011 2020202010101010
Dividend income from the issuers of:Dividend income from the issuers of:Dividend income from the issuers of:Dividend income from the issuers of:
Securities classified as available for sale 6 416 5 411
Securities classified as held for trading 384 252
TotalTotalTotalTotal 6 800 6 800 6 800 6 800 5 663 5 663 5 663 5 663
7.7.7.7. Net income from financial instruments Net income from financial instruments Net income from financial instruments Net income from financial instruments designated designated designated designated at fair valueat fair valueat fair valueat fair value
2012012012011111 2020202010101010
Derivative instruments1)
(88 731) (104 809)
Debt securities 10 631 40 786
Equity instruments (612) 1 427
Structured bank securities designated at fair value through profit and loss1)
3 630 -
Other1)
26 19
TotalTotalTotalTotal (75 056)(75 056)(75 056)(75 056) (62 577)(62 577)(62 577)(62 577)
In the net income from financial instruments at fair value, position ‘Derivative instruments’, in financial year ended 31 December 2011, an ineffective portion related to cash flow hedges was recognised and it amounted to PLN (64 342) thousand (in financial year ended 31 December 2010, an ineffective portion related to cash flow hedges was recognised and it amounted to PLN (82 879) thousand).
2020202011111111 GainsGainsGainsGains LossesLossesLossesLosses Net resultNet resultNet resultNet result
Trading assets 10 504 206 (10 592 619) (88 413)
Financial assets designated upon initial recognition at fair value through profit and loss
65 089 (51 732) 13 357
TotalTotalTotalTotal 10 569 295 10 569 295 10 569 295 10 569 295 (10 (10 (10 (10 644 351)644 351)644 351)644 351) (75 056)(75 056)(75 056)(75 056)
2020202010101010 GainsGainsGainsGains LossesLossesLossesLosses Net resultNet resultNet resultNet result
Trading assets 8 472 769 (8 567 689) (94 920)
Financial assets designated upon initial recognition at fair value through profit and loss
54 192 (21 849) 32 343
TotalTotalTotalTotal 8 526 961 8 526 961 8 526 961 8 526 961 (8 589 538)(8 589 538)(8 589 538)(8 589 538) (62 577)(62 577)(62 577)(62 577)
The total change in fair values of financial instruments at fair value through profit and loss determined with use of valuation models (where no quotations from active market were available) in the year ended 31 December 2011 amounted to PLN (85 075)1 thousand (in the year ended 31 December 2010 PLN (104 790) 1) thousand) (LEVEL 2, Note 49).
8.8.8.8. Net gNet gNet gNet gainsainsainsains////(losses)(losses)(losses)(losses) onononon investment securitiesinvestment securitiesinvestment securitiesinvestment securities
2012012012011111 2020202010101010
Losses/gains recognised directly in other comprehensive income (53 828) (89 215)
Total result recogniTotal result recogniTotal result recogniTotal result recognisedsedsedsed directly in other comprehensive incomedirectly in other comprehensive incomedirectly in other comprehensive incomedirectly in other comprehensive income (53 828)(53 828)(53 828)(53 828) (89 215)(89 215)(89 215)(89 215)
Gains derecognised from other comprehensive income 21 448 75 530 Losses derecognised from other comprehensive income (1 269) (2 474)
Total result derecognised from other comprehensive income, Total result derecognised from other comprehensive income, Total result derecognised from other comprehensive income, Total result derecognised from other comprehensive income, recognised in profit and lossrecognised in profit and lossrecognised in profit and lossrecognised in profit and loss 20 179 20 179 20 179 20 179 73 056 73 056 73 056 73 056
Total result retained in other comprehensive incomeTotal result retained in other comprehensive incomeTotal result retained in other comprehensive incomeTotal result retained in other comprehensive income (33 649)(33 649)(33 649)(33 649) (16 159)(16 159)(16 159)(16 159)
1 The total amount of the items marked with1) in the note 7 ‘Net income from financial instruments designated at fair value’.
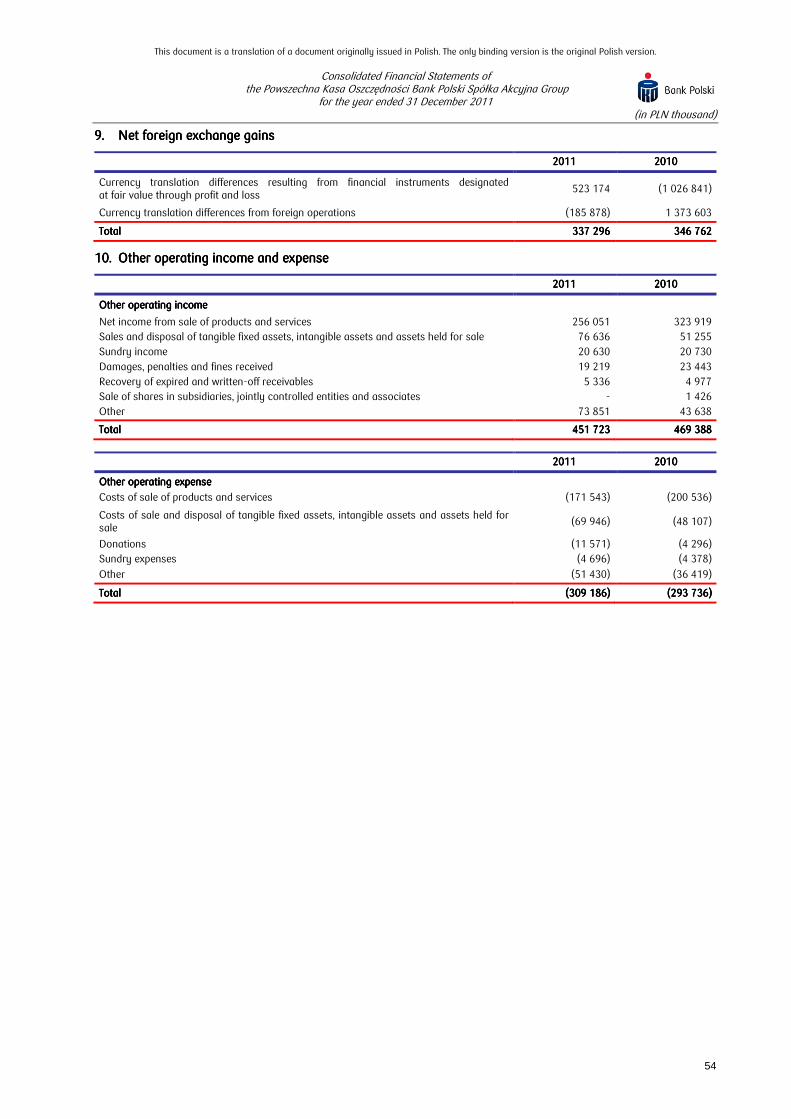
This document is a translation of a document originally issued in Polish. The only binding version is the original Polish version.
Consolidated Financial Statements of the Powszechna Kasa Oszczędności Bank Polski Spółka Akcyjna Group
for the year ended 31 December 2011 (in PLN thousand)
54
9.9.9.9. Net foreign exchange gainsNet foreign exchange gainsNet foreign exchange gainsNet foreign exchange gains
2012012012011111 2020202010101010
Currency translation differences resulting from financial instruments designated at fair value through profit and loss
523 174 (1 026 841)
Currency translation differences from foreign operations (185 878) 1 373 603
TotalTotalTotalTotal 337 296 337 296 337 296 337 296 346 762 346 762 346 762 346 762
10.10.10.10. Other operating income and expenseOther operating income and expenseOther operating income and expenseOther operating income and expense
2012012012011111 2020202010101010
Other operating incomeOther operating incomeOther operating incomeOther operating income
Net income from sale of products and services 256 051 323 919
Sales and disposal of tangible fixed assets, intangible assets and assets held for sale 76 636 51 255
Sundry income 20 630 20 730
Damages, penalties and fines received 19 219 23 443
Recovery of expired and written-off receivables 5 336 4 977
Sale of shares in subsidiaries, jointly controlled entities and associates - 1 426
Other 73 851 43 638
TotalTotalTotalTotal 451 723 451 723 451 723 451 723 469 388 469 388 469 388 469 388
2012012012011111 2020202010101010
Other operating expenseOther operating expenseOther operating expenseOther operating expense
Costs of sale of products and services (171 543) (200 536)
Costs of sale and disposal of tangible fixed assets, intangible assets and assets held for sale
(69 946) (48 107)
Donations (11 571) (4 296)
Sundry expenses (4 696) (4 378)
Other (51 430) (36 419)
TotalTotalTotalTotal (309 186)(309 186)(309 186)(309 186) (293 (293 (293 (293 736)736)736)736)
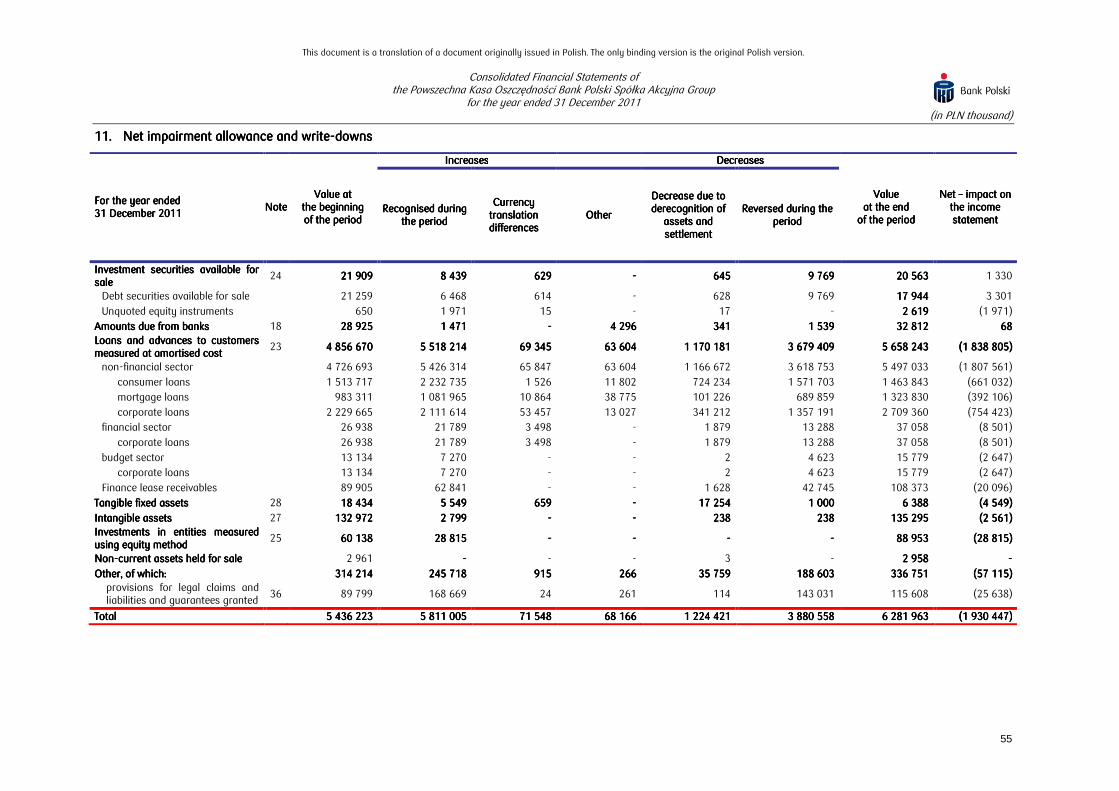
This document is a translation of a document originally issued in Polish. The only binding version is the original Polish version.
Consolidated Financial Statements of the Powszechna Kasa Oszczędności Bank Polski Spółka Akcyjna Group
for the year ended 31 December 2011 (in PLN thousand)
55
11.11.11.11. Net impairment allowanceNet impairment allowanceNet impairment allowanceNet impairment allowance and writeand writeand writeand write----downsdownsdownsdowns
For the year endedFor the year endedFor the year endedFor the year ended 31 December 201131 December 201131 December 201131 December 2011
NoteNoteNoteNote Value at Value at Value at Value at
the beginning the beginning the beginning the beginning of the periodof the periodof the periodof the period
IncreasesIncreasesIncreasesIncreases DecreasesDecreasesDecreasesDecreases
Value Value Value Value at the end at the end at the end at the end
of the periodof the periodof the periodof the period
Net Net Net Net –––– impact impact impact impact on on on on the income the income the income the income statementstatementstatementstatement
Recognised during Recognised during Recognised during Recognised during the periodthe periodthe periodthe period
Currency Currency Currency Currency translation translation translation translation differencesdifferencesdifferencesdifferences
OtherOtherOtherOther
Decrease due to Decrease due to Decrease due to Decrease due to derecognition of derecognition of derecognition of derecognition of
assetsassetsassetsassets and and and and settlementsettlementsettlementsettlement
Reversed during the Reversed during the Reversed during the Reversed during the periodperiodperiodperiod
Investment securities available for Investment securities available for Investment securities available for Investment securities available for salesalesalesale
24 21 909 21 909 21 909 21 909 8 439 8 439 8 439 8 439 629 629 629 629 ---- 645 645 645 645 9 769 9 769 9 769 9 769 20 563 20 563 20 563 20 563 1 330
Debt securities available for sale 21 259 6 468 614 - 628 9 769 17 944 17 944 17 944 17 944 3 301
Unquoted equity instruments 650 1 971 15 - 17 - 2 619 2 619 2 619 2 619 (1 971)
Amounts due from banksAmounts due from banksAmounts due from banksAmounts due from banks 18 28 925 28 925 28 925 28 925 1 471 1 471 1 471 1 471 ---- 4 296 4 296 4 296 4 296 341 341 341 341 1 539 1 539 1 539 1 539 32 812 32 812 32 812 32 812 68 68 68 68 Loans and advances to customers Loans and advances to customers Loans and advances to customers Loans and advances to customers measured at amortised costmeasured at amortised costmeasured at amortised costmeasured at amortised cost
23 4 856 670 4 856 670 4 856 670 4 856 670 5 518 214 5 518 214 5 518 214 5 518 214 69 345 69 345 69 345 69 345 63 604 63 604 63 604 63 604 1 170 181 1 170 181 1 170 181 1 170 181 3 679 409 3 679 409 3 679 409 3 679 409 5 658 243 5 658 243 5 658 243 5 658 243 (1 838 805)(1 838 805)(1 838 805)(1 838 805)
non-financial sector 4 726 693 5 426 314 65 847 63 604 1 166 672 3 618 753 5 497 033 (1 807 561)
consumer loans 1 513 717 2 232 735 1 526 11 802 724 234 1 571 703 1 463 843 (661 032)
mortgage loans 983 311 1 081 965 10 864 38 775 101 226 689 859 1 323 830 (392 106)
corporate loans 2 229 665 2 111 614 53 457 13 027 341 212 1 357 191 2 709 360 (754 423)
financial sector 26 938 21 789 3 498 - 1 879 13 288 37 058 (8 501)
corporate loans 26 938 21 789 3 498 - 1 879 13 288 37 058 (8 501)
budget sector 13 134 7 270 - - 2 4 623 15 779 (2 647)
corporate loans 13 134 7 270 - - 2 4 623 15 779 (2 647)
Finance lease receivables 89 905 62 841 - - 1 628 42 745 108 373 (20 096)
Tangible fixed assetsTangible fixed assetsTangible fixed assetsTangible fixed assets 28 18 434 18 434 18 434 18 434 5 549 5 549 5 549 5 549 659 659 659 659 ---- 17 254 17 254 17 254 17 254 1 000 1 000 1 000 1 000 6 388 6 388 6 388 6 388 (4 549)(4 549)(4 549)(4 549)
Intangible assetsIntangible assetsIntangible assetsIntangible assets 27 132 972 132 972 132 972 132 972 2 799 2 799 2 799 2 799 ---- ---- 238 238 238 238 238 238 238 238 135 295 135 295 135 295 135 295 (2 561)(2 561)(2 561)(2 561) Investments in entities measured Investments in entities measured Investments in entities measured Investments in entities measured using equity methodusing equity methodusing equity methodusing equity method
25 60 138 60 138 60 138 60 138 28 815 28 815 28 815 28 815 ---- ---- ---- ---- 88 953 88 953 88 953 88 953 (28 815)(28 815)(28 815)(28 815)
NonNonNonNon----current assets held for salecurrent assets held for salecurrent assets held for salecurrent assets held for sale 2 961 ---- - - 3 - 2 958 2 958 2 958 2 958 ----
Other, of which:Other, of which:Other, of which:Other, of which: 314 214 314 214 314 214 314 214 245 718 245 718 245 718 245 718 915 915 915 915 266 266 266 266 35 759 35 759 35 759 35 759 188 603 188 603 188 603 188 603 336 751 336 751 336 751 336 751 (57 115)(57 115)(57 115)(57 115) provisions for legal claims and liabilities and guarantees granted
36 89 799 168 669 24 261 114 143 031 115 608 (25 638)
TotalTotalTotalTotal 5 436 223 5 436 223 5 436 223 5 436 223 5 811 005 5 811 005 5 811 005 5 811 005 71 548 71 548 71 548 71 548 68 166 68 166 68 166 68 166 1 224 421 1 224 421 1 224 421 1 224 421 3 880 558 3 880 558 3 880 558 3 880 558 6 281 963 6 281 963 6 281 963 6 281 963 (1 930 447)(1 930 447)(1 930 447)(1 930 447)

This document is a translation of a document originally issued in Polish. The only binding version is the original Polish version.
Consolidated Financial Statements of the Powszechna Kasa Oszczędności Bank Polski Spółka Akcyjna Group
for the year ended 31 December 2011 (in PLN thousand)
56
Net impairment allowance and writeNet impairment allowance and writeNet impairment allowance and writeNet impairment allowance and write----downsdownsdownsdowns
For the year endedFor the year endedFor the year endedFor the year ended 31 December 201031 December 201031 December 201031 December 2010
NoteNoteNoteNote Value at Value at Value at Value at
the beginning the beginning the beginning the beginning of the periodof the periodof the periodof the period
IncreasesIncreasesIncreasesIncreases DecreasesDecreasesDecreasesDecreases
Value Value Value Value at the end at the end at the end at the end
of the of the of the of the periodperiodperiodperiod
Net Net Net Net –––– impact on impact on impact on impact on the income the income the income the income statementstatementstatementstatement
Recognised during Recognised during Recognised during Recognised during the periodthe periodthe periodthe period
Currency Currency Currency Currency translation translation translation translation differencesdifferencesdifferencesdifferences
OtherOtherOtherOther
Decrease due to Decrease due to Decrease due to Decrease due to derecognition of derecognition of derecognition of derecognition of
assetsassetsassetsassets and and and and settlementsettlementsettlementsettlement
Reversed during the Reversed during the Reversed during the Reversed during the periodperiodperiodperiod
Investment securities available for Investment securities available for Investment securities available for Investment securities available for salesalesalesale
24 21 572 21 572 21 572 21 572 8 156 8 156 8 156 8 156 216 216 216 216 ---- 1 198 1 198 1 198 1 198 6 837 6 837 6 837 6 837 21 909 21 909 21 909 21 909 (1 319)(1 319)(1 319)(1 319)
Debt securities available for sale 19 155 8 063 216 - 138 6 037 21 259 (2 026)
Unquoted equity instruments 2 417 93 - - 1 060 800 650 707
Amounts due from banksAmounts due from banksAmounts due from banksAmounts due from banks 18 27 109 27 109 27 109 27 109 896 896 896 896 ---- 1 078 1 078 1 078 1 078 ---- 158 158 158 158 28 925 28 925 28 925 28 925 (738)(738)(738)(738) Loans and advances to customers Loans and advances to customers Loans and advances to customers Loans and advances to customers measured at amortised costmeasured at amortised costmeasured at amortised costmeasured at amortised cost
23 3 937 124 3 937 124 3 937 124 3 937 124 4 359 759 4 359 759 4 359 759 4 359 759 16 728 16 728 16 728 16 728 26 642 26 642 26 642 26 642 870 039 870 039 870 039 870 039 2 613 544 2 613 544 2 613 544 2 613 544 4 856 670 4 856 670 4 856 670 4 856 670 (1 746 215)(1 746 215)(1 746 215)(1 746 215)
non-financial sector 3 824 558 4 196 059 16 688 26 642 861 275 2 475 979 4 726 693 (1 720 080)
consumer loans 1 362 621 1 728 793 2 149 3 217 668 058 915 005 1 513 717 (813 788)
mortgage loans 734 760 797 121 3 799 20 377 44 286 528 460 983 311 (268 661)
corporate loans 1 727 177 1 670 145 10 740 3 048 148 931 1 032 514 2 229 665 (637 631)
financial sector 19 248 18 834 40 - 8 162 3 022 26 938 (15 812)
corporate loans 19 248 18 834 40 - 8 162 3 022 26 938 (15 812)
budget sector 21 496 15 059 - - - 23 421 13 134 8 362
corporate loans 21 496 15 059 - - - 23 421 13 134 8 362
Finance lease receivables 71 822 129 807 - - 602 111 122 89 905 (18 685)
Tangible fixed assetsTangible fixed assetsTangible fixed assetsTangible fixed assets 28 1 856 1 856 1 856 1 856 29 418 29 418 29 418 29 418 ---- ---- 12 212 12 212 12 212 12 212 628 628 628 628 18 434 18 434 18 434 18 434 (28 (28 (28 (28 790)790)790)790)
Intangible assetsIntangible assetsIntangible assetsIntangible assets 27 95 135 95 135 95 135 95 135 37 837 37 837 37 837 37 837 ---- ---- ---- ---- 132 972 132 972 132 972 132 972 (37 837)(37 837)(37 837)(37 837) Investments in entities measured Investments in entities measured Investments in entities measured Investments in entities measured using equity methodusing equity methodusing equity methodusing equity method
25 5 028 5 028 5 028 5 028 55 171 55 171 55 171 55 171 ---- ---- ---- 61 61 61 61 60 138 60 138 60 138 60 138 (55 110)(55 110)(55 110)(55 110)
NonNonNonNon----current assets held for salecurrent assets held for salecurrent assets held for salecurrent assets held for sale 1 680 1 680 1 680 1 680 1 281 1 281 1 281 1 281 - - - - 2 961 2 961 2 961 2 961 (1 (1 (1 (1 281)281)281)281)
Other, of which:Other, of which:Other, of which:Other, of which: 359 043 359 043 359 043 359 043 230 182 230 182 230 182 230 182 379 379 379 379 27 27 27 27 42 309 42 309 42 309 42 309 233 108 233 108 233 108 233 108 314 214 314 214 314 214 314 214 2 926 2 926 2 926 2 926 provisions for legal claims and liabilities and guarantees granted
36 119 849 141 014 69 - 1 032 170 101 89 799 29 087
TotalTotalTotalTotal 4 448 547 4 448 547 4 448 547 4 448 547 4 722 700 4 722 700 4 722 700 4 722 700 17 323 17 323 17 323 17 323 27 747 27 747 27 747 27 747 925 758 925 758 925 758 925 758 2 854 336 2 854 336 2 854 336 2 854 336 5 436 223 5 436 223 5 436 223 5 436 223 (1 868 364)(1 868 364)(1 868 364)(1 868 364)

This document is a translation of a document originally issued in Polish. The only binding version is the original Polish version.
Consolidated Financial Statements of the Powszechna Kasa Oszczędności Bank Polski Spółka Akcyjna Group
for the year ended 31 December 2011 (in PLN thousand)
57
12.12.12.12. AAAAdministrative expensesdministrative expensesdministrative expensesdministrative expenses
2012012012011111 2020202010101010
Employee costs (2 403 744) (2 374 901) Overheads (1 276 586) (1 237 892)
Depreciation and amortisation (520 161) (512 319)
Taxes and other charges (74 129) (70 640)
Contribution and payments to Bank Guarantee Fund (136 737) (53 384)
TotalTotalTotalTotal (4 411 357)(4 411 357)(4 411 357)(4 411 357) (4 249 136)(4 249 136)(4 249 136)(4 249 136)
Wages and salaries / Wages and salaries / Wages and salaries / Wages and salaries / EEEEmployee benefitsmployee benefitsmployee benefitsmployee benefits
2012012012011111 2020202010101010
Wages and salaries, of which: (2 032 341) (2 011 724) actuarial provision for anniversary bonuses and retirement benefits (16 507) (43 497)
Social Security, of which: (304 511) (299 985)
contributions for retirement pay and pensions* (247 023) (239 819)
Other employee benefits (66 892) (63 192)
TotalTotalTotalTotal (2 403 744)(2 403 744)(2 403 744)(2 403 744) (2 374 901)(2 374 901)(2 374 901)(2 374 901)
*Total expense incurred by the Group related to contributions for retirement pay and pensions.
OOOOperating lease agreementsperating lease agreementsperating lease agreementsperating lease agreements
Operating lease Operating lease Operating lease Operating lease –––– lesseelesseelesseelessee
Lease agreements, under which the lessor retains substantially the risk and rewards incidental to the ownership of an asset, are classified as operating lease agreements. Lease payments under operating leases are recognised as expenses in the income statement, on a straight-line basis over the lease term.
Rental and tenancy agreements concluded by the Group in the course of its normal operating activities meet the criteria of operating leases. All of the above are arm’s length agreements.
The table below presents data on operating lease agreements concluded by the Group.
Total value of future lease payments Total value of future lease payments Total value of future lease payments Total value of future lease payments under irrevocable operating leaseunder irrevocable operating leaseunder irrevocable operating leaseunder irrevocable operating lease
31.12.20131.12.20131.12.20131.12.2011111 31.12.2031.12.2031.12.2031.12.2010101010
For the period: up to 1 year 106 028 92 788
from 1 year to 5 years 173 614 153 089
above 5 years 61 348 51 125
TotalTotalTotalTotal 340 990340 990340 990340 990 297 002297 002297 002297 002
Lease and sub-lease payments recognised as an expense of a given period from 1 January 2011 to 31 December 2011 amounted to PLN 129 812 thousand (in the period from 1 January 2010 to 31 December 2010 PLN 118 392 thousand).
13.13.13.13. Share of profit (loss) of associates and jointly controlled entitiesShare of profit (loss) of associates and jointly controlled entitiesShare of profit (loss) of associates and jointly controlled entitiesShare of profit (loss) of associates and jointly controlled entities
EntityEntityEntityEntity 2012012012011111 2020202010101010
Jointly controlled entitiesJointly controlled entitiesJointly controlled entitiesJointly controlled entities
Centrum Obsługi Biznesu Sp. z o.o. (3 991) (1 883)
Centrum Haffnera Sp. z o.o. Group (21 316) (6 077)
AssociatesAssociatesAssociatesAssociates
Bank Pocztowy SA 5 332 7 153
Agencja Inwestycyjna ‘CORP-SA’ SA 315 53
Poznański Fundusz Poręczeń Kredytowych Sp. z o.o. 8 (61)
TotalTotalTotalTotal (19 652)(19 652)(19 652)(19 652) (815)(815)(815)(815)
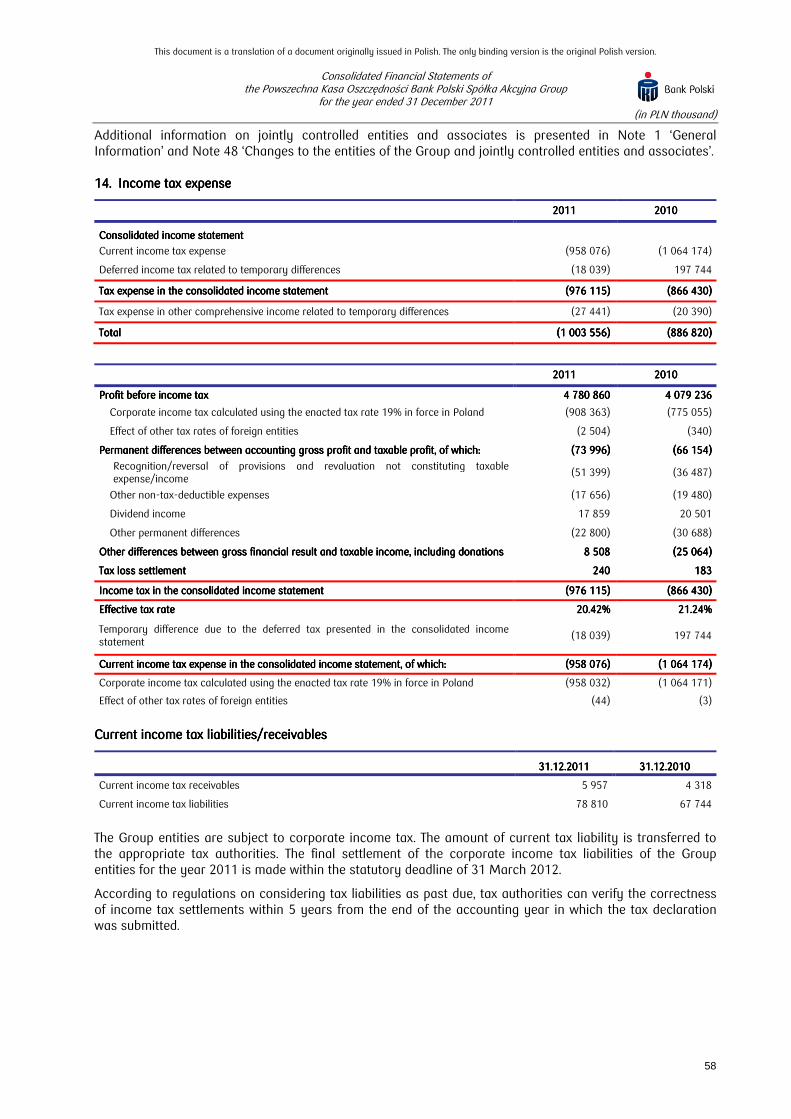
This document is a translation of a document originally issued in Polish. The only binding version is the original Polish version.
Consolidated Financial Statements of the Powszechna Kasa Oszczędności Bank Polski Spółka Akcyjna Group
for the year ended 31 December 2011 (in PLN thousand)
58
Additional information on jointly controlled entities and associates is presented in Note 1 ‘General Information’ and Note 48 ‘Changes to the entities of the Group and jointly controlled entities and associates’.
14.14.14.14. Income tax expenseIncome tax expenseIncome tax expenseIncome tax expense
2012012012011111 2020202010101010
Consolidated iConsolidated iConsolidated iConsolidated income statementncome statementncome statementncome statement
Current income tax expense (958 076) (1 064 174)
Deferred income tax related to temporary differences (18 039) 197 744
Tax expense in the consolidated income statementTax expense in the consolidated income statementTax expense in the consolidated income statementTax expense in the consolidated income statement (976 115)(976 115)(976 115)(976 115) (866 430)(866 430)(866 430)(866 430)
Tax expense in other comprehensive income related to temporary differences (27 441) (20 390)
TotalTotalTotalTotal (1 003 556)(1 003 556)(1 003 556)(1 003 556) (886 820)(886 820)(886 820)(886 820)
2012012012011111 2020202010101010
Profit before income taxProfit before income taxProfit before income taxProfit before income tax 4 780 860 4 780 860 4 780 860 4 780 860 4 079 236 4 079 236 4 079 236 4 079 236
Corporate income tax calculated using the enacted tax rate 19% in force in Poland (908 363) (775 055)
Effect of other tax rates of foreign entities (2 504) (340)
Permanent differences between Permanent differences between Permanent differences between Permanent differences between accounting gross profit and taxable profit, of which:accounting gross profit and taxable profit, of which:accounting gross profit and taxable profit, of which:accounting gross profit and taxable profit, of which: (73 996)(73 996)(73 996)(73 996) (66 154)(66 154)(66 154)(66 154)
Recognition/reversal of provisions and revaluation not constituting taxable expense/income
(51 399) (36 487)
Other non-tax-deductible expenses (17 656) (19 480)
Dividend income 17 859 20 501
Other permanent differences (22 800) (30 688)
Other differences between gross financial result and taxable income, including donationsOther differences between gross financial result and taxable income, including donationsOther differences between gross financial result and taxable income, including donationsOther differences between gross financial result and taxable income, including donations 8 508 8 508 8 508 8 508 (25 064)(25 064)(25 064)(25 064)
Tax loss settlementTax loss settlementTax loss settlementTax loss settlement 240 240 240 240 183 183 183 183
Income tax in the consolidated income statementIncome tax in the consolidated income statementIncome tax in the consolidated income statementIncome tax in the consolidated income statement (976 115)(976 115)(976 115)(976 115) (866 430)(866 430)(866 430)(866 430)
Effective tax rateEffective tax rateEffective tax rateEffective tax rate 20.42%20.42%20.42%20.42% 21.24%21.24%21.24%21.24%
Temporary difference due to the deferred tax presented in the consolidated income statement
(18 039) 197 744
Current income tax expense in the consolidated income statement, of which:Current income tax expense in the consolidated income statement, of which:Current income tax expense in the consolidated income statement, of which:Current income tax expense in the consolidated income statement, of which: (958 076)(958 076)(958 076)(958 076) (1 064 174)(1 064 174)(1 064 174)(1 064 174)
Corporate income tax calculated using the enacted tax rate 19% in force in Poland (958 032) (1 064 171)
Effect of other tax rates of foreign entities (44) (3)
Current income tax liabilities/Current income tax liabilities/Current income tax liabilities/Current income tax liabilities/receivables receivables receivables receivables
31.12.231.12.231.12.231.12.2000011111111 31.12.2031.12.2031.12.2031.12.2010101010
Current income tax receivables 5 957 4 318
Current income tax liabilities 78 810 67 744
The Group entities are subject to corporate income tax. The amount of current tax liability is transferred to the appropriate tax authorities. The final settlement of the corporate income tax liabilities of the Group entities for the year 2011 is made within the statutory deadline of 31 March 2012.
According to regulations on considering tax liabilities as past due, tax authorities can verify the correctness of income tax settlements within 5 years from the end of the accounting year in which the tax declaration was submitted.

This document is a translation of a document originally issued in Polish. The only binding version is the original Polish version.
Consolidated Financial Statements of the Powszechna Kasa Oszczędności Bank Polski Spółka Akcyjna Group
for the year ended 31 December 2011 (in PLN thousand)
59
Deferred tax asset/liabilityDeferred tax asset/liabilityDeferred tax asset/liabilityDeferred tax asset/liability
Consolidated sConsolidated sConsolidated sConsolidated statement of tatement of tatement of tatement of financial positionfinancial positionfinancial positionfinancial position
Consolidated iConsolidated iConsolidated iConsolidated income ncome ncome ncome statementstatementstatementstatement
31.12.20131.12.20131.12.20131.12.2011111 31.12.2031.12.2031.12.2031.12.2010101010 2012012012011111 2020202010101010
Deferred tax liabilityDeferred tax liabilityDeferred tax liabilityDeferred tax liability Interest accrued on receivables (loans) 176 076 111 398 (64 678) (22 944)
Capitalised interest on performing housing loans 190 844 211 576 20 732 26 870
Interest on securities 58 187 44 537 (13 650) (6 824)
Valuation of derivative financial instruments, of which: 94 471 98 859 - -
transferred to income statement 9 514 47 741 38 227 (34 784)
transferred to other comprehensive income 84 957 51 118 - -
Valuation of securities, of which: 16 414 - - -
transferred to income statement 15 443 - (15 443) -
transferred to other comprehensive income 971 - - -
Difference between book value and tax value of tangible fixed assets 293 318 256 004 (35 291) (22 488)
Temporary positive differences concerning Group’s entities, of which: 29 363 24 786 - -
transferred to income statement 29 307 24 535 (6 795) (1 595)
transferred to other comprehensive income 56 251 - -
Gross deferred tax liability,Gross deferred tax liability,Gross deferred tax liability,Gross deferred tax liability, of which:of which:of which:of which: 858 673858 673858 673858 673 747 160 747 160 747 160 747 160 ---- ---- transferred to income statement 772 689 695 791 (76 898) (61 765) transferred to other comprehensive income 85 984 51 369 - -
Deferred tax assetDeferred tax assetDeferred tax assetDeferred tax asset
Interest accrued on liabilities 391 527 406 364 (14 837) 79 945
Valuation of derivative financial instruments, of which: 16 093 19 470 - -
transferred to income statement 16 093 19 470 (3 377) 2 060
Valuation of securities of which: 24 550 57 394 - -
transferred to income statement 11 580 50 640 (39 060) 39 368
transferred to other comprehensive income 12 970 6 754 - -
Provision for employee benefits 126 714 118 613 8 101 8 442
Impairment allowances on credit exposure 414 558 335 477 79 081 98 983
Adjustment to straight-line basis and effective interest rate valuation 211 011 218 000 (6 989) 26 493
Other temporary negative differences 28 991 32 001 (3 010) -
Temporary negative differences concerning Group’s entities, of which: 159 787 119 879 - -
transferred to income statement 159 211 120 261 38 950 4 218
transferred to other comprehensive income 576 (382) - -
Gross deferred income tax asset, of which:Gross deferred income tax asset, of which:Gross deferred income tax asset, of which:Gross deferred income tax asset, of which: 1 373 2311 373 2311 373 2311 373 231 1 307 198 1 307 198 1 307 198 1 307 198 ---- ----
transferred to income statement 1 359 685 1 300 826 58 859 259 509 transferred to other comprehensive income 13 546 6 372 - -
Total deferred tax impactTotal deferred tax impactTotal deferred tax impactTotal deferred tax impact, of which:, of which:, of which:, of which: 514 558514 558514 558514 558 560 038 560 038 560 038 560 038 ---- -
transferred to income statement 586 996 605 035 (18 039) 197 744
transferred to other comprehensive income (72 438) (44 997) - -
Deferred income tax asset (presented in statement of financial position) Deferred income tax asset (presented in statement of financial position) Deferred income tax asset (presented in statement of financial position) Deferred income tax asset (presented in statement of financial position) 543 922543 922543 922543 922 582 802 582 802 582 802 582 802 ---- -
Deferred tax liability (presented in statement of financial position)Deferred tax liability (presented in statement of financial position)Deferred tax liability (presented in statement of financial position)Deferred tax liability (presented in statement of financial position) 29 36429 36429 36429 364 22 764 22 764 22 764 22 764 ---- -
Net deferred tax impact on the income statementNet deferred tax impact on the income statementNet deferred tax impact on the income statementNet deferred tax impact on the income statement ---- ---- (18 039)(18 039)(18 039)(18 039) 197 744 197 744 197 744 197 744
The item temporary negative differences concerning Group’s entities in respect of deferred tax as at 31 December 2011, in accordance with IAS 12, includes the tax effect of unsettled tax losses in the amount of PLN 52 436 thousand, including the tax loss of KREDOBANK SA in the amount of PLN 49 979 thousand. In accordance with the tax jurisdiction binding on the territory of Ukraine, the right to settling of the unsettled tax losses is not in principle restricted by any expiry date. Yet, the ability to settle tax losses which arose before 2011 has been questioned by the Ukrainian tax authorities as a result of a tax inspection carried out. At the same time the Group’s analysis of binding tax and judicial decisions and external opinions obtained indicate that there are no effective grounds for questioning the ability to settle those losses. In consequence, KREDOBANK SA appealed to the tax authorities against this decision and is waiting for the decision. The Management Board of the Bank is of the opinion that the appeal will be effective.

This document is a translation of a document originally issued in Polish. The only binding version is the original Polish version.
Consolidated Financial Statements of the Powszechna Kasa Oszczędności Bank Polski Spółka Akcyjna Group
for the year ended 31 December 2011 (in PLN thousand)
60
15.15.15.15. Earnings per shareEarnings per shareEarnings per shareEarnings per share
Basic earnings per shareBasic earnings per shareBasic earnings per shareBasic earnings per share
The basic earnings per share ratio is calculated on the basis of profit attributable to ordinary shareholders of the Bank, by dividing the respective profit by the weighted average number of ordinary shares outstanding during a given period.
Earnings per Earnings per Earnings per Earnings per shareshareshareshare
2012012012011111 2020202010101010
Profit per ordinary shareholder (in PLN thousand) 3 807 195 3 216 883
Weighted average number of ordinary shares during the period (in thousand) 1 250 000 1 250 000
Earnings per share (in PLN per share) 3.05 2.57
Earnings per Earnings per Earnings per Earnings per share from discontinued operationsshare from discontinued operationsshare from discontinued operationsshare from discontinued operations
In the periods ended 31 December 2011 and 31 December 2010, the Group did not report any discontinued operations.
Diluted earnings per shareDiluted earnings per shareDiluted earnings per shareDiluted earnings per share
The diluted earnings per share ratio is calculated on the basis of profit attributable to ordinary shareholders, by dividing the respective profit by the weighted average number of ordinary shares outstanding during a given period, adjusted for the effect of all potential dilutive ordinary shares.
There were no dilutive instruments in the year 2011 and 2010.
Diluted earnings per share from discontinued operationsDiluted earnings per share from discontinued operationsDiluted earnings per share from discontinued operationsDiluted earnings per share from discontinued operations
In the periods ended 31 December 2011 and 31 December 2010 the Group did not report any discontinued operations.
16.16.16.16. Dividends paid (in total and per share) on ordinary Dividends paid (in total and per share) on ordinary Dividends paid (in total and per share) on ordinary Dividends paid (in total and per share) on ordinary shares and other sharesshares and other sharesshares and other sharesshares and other shares
Pursuant to the Resolution No. 8/2011 of the Annual General Shareholders’ Meeting of Powszechna Kasa Oszczędności Bank Polski Spółka Akcyjna passed on 30 June 2011, the dividend for 2010 amounted to PLN 2 475 000 thousand, i.e. PLN 1.98 per share.
The list of shareholders eligible to receive dividend for 2010 was determined as at 31 August 2011, and the payment was made on 15 September 2011.
As at 31 December 2011, the Bank did not decide on whether to pay dividends. In accordance with the Bank’s policy on paying dividends, the Management Board of the Bank, while placing proposals on paying dividends, will take into consideration the necessity to ensure an appropriate level of the capital adequacy ratio and the capital necessary to the Bank’s development amounting to 40% of the Bank’s net profit for a given calendar year.
NOTES TO THE NOTES TO THE NOTES TO THE NOTES TO THE CONSOLIDATED CONSOLIDATED CONSOLIDATED CONSOLIDATED STATEMENT OF FINANCIAL POSITIONSTATEMENT OF FINANCIAL POSITIONSTATEMENT OF FINANCIAL POSITIONSTATEMENT OF FINANCIAL POSITION
17.17.17.17. Cash and balances with the central Cash and balances with the central Cash and balances with the central Cash and balances with the central bankbankbankbank
31.12.20131.12.20131.12.20131.12.2011111 31.12.2031.12.2031.12.2031.12.2010101010
Current account with the central bank 6 845 759 3 782 717
Cash 2 295 222 2 398 207
Other funds 1 187 1 488
TotalTotalTotalTotal 9 142 168 9 142 168 9 142 168 9 142 168 6 182 412 6 182 412 6 182 412 6 182 412
During the course of the working day, the Bank may use funds from the obligatory reserve account for ongoing payments, on the basis of an instruction submitted to the Central Bank of Poland (NBP). However, the Bank must ensure that the average monthly balance on this account complies with the requirements set in the obligatory reserve declaration.

This document is a translation of a document originally issued in Polish. The only binding version is the original Polish version.
Consolidated Financial Statements of the Powszechna Kasa Oszczędności Bank Polski Spółka Akcyjna Group
for the year ended 31 December 2011 (in PLN thousand)
61
Funds on the obligatory reserve account bear interest of 0.9 of the rediscount rate for bills of exchange. As at 31 December 2011, this interest rate was 4.275%.
As at 31 December 2011 and 31 December 2010, there were no further restrictions as regards the use of these funds.
18.18.18.18. Amounts due from banksAmounts due from banksAmounts due from banksAmounts due from banks
31.12.20131.12.20131.12.20131.12.2011111 31.12.2031.12.2031.12.2031.12.2010101010
Deposits with banks 1 912 647 1 493 827
Current accounts 405 724 722 717
Loans and advances granted 108 868 112 551
Cash in transit 1 800 6 862
Gross tGross tGross tGross totalotalotalotal 2 429 039 2 429 039 2 429 039 2 429 039 2 335 957 2 335 957 2 335 957 2 335 957
Impairment allowances on receivables, of which: (32 812) (28 925)
impairment allowances on exposure to a foreign bank (32 385) (28 089)
Net totalNet totalNet totalNet total 2 396 227 2 396 227 2 396 227 2 396 227 2 307 032 2 307 032 2 307 032 2 307 032
Details on risk related to amounts due from banks was presented in Note 55 ‘Credit risk management’.
19.19.19.19. Trading assetsTrading assetsTrading assetsTrading assets
31.12.20131.12.20131.12.20131.12.2011111 31.12.2031.12.2031.12.2031.12.2010101010
Debt securitiesDebt securitiesDebt securitiesDebt securities 1 300 164 1 300 164 1 300 164 1 300 164 1 491 053 1 491 053 1 491 053 1 491 053
issued by the State Treasury, of which: 1 268 471 1 483 144
Treasury bonds 1 219 069 1 483 144
Treasury bills 49 402 -
issued by non-financial institution, corporate bonds 14 947 509
issued by local government bodies, municipal bonds 14 783 7 390
issued by banks, BGK bonds 1 724 -
issued by other financial institutions, corporate bonds 239 10
Shares in other entities Shares in other entities Shares in other entities Shares in other entities ---- listed on stock exchangelisted on stock exchangelisted on stock exchangelisted on stock exchange 10 92510 92510 92510 925 12 59612 59612 59612 596
TotalTotalTotalTotal 1 311 0891 311 0891 311 0891 311 089 1 503 6491 503 6491 503 6491 503 649

This document is a translation of a document originally issued in Polish. The only binding version is the original Polish version.
Consolidated Financial Statements of the Powszechna Kasa Oszczędności Bank Polski Spółka Akcyjna Group
for the year ended 31 December 2011 (in PLN thousand)
62
Trading assets at carrying amountTrading assets at carrying amountTrading assets at carrying amountTrading assets at carrying amount by maturity as at 31 Decemby maturity as at 31 Decemby maturity as at 31 Decemby maturity as at 31 December 201ber 201ber 201ber 2011 1 1 1 and and and and as at 31 December 20as at 31 December 20as at 31 December 20as at 31 December 2010101010
As at 31 December 20As at 31 December 20As at 31 December 20As at 31 December 2011111111 up to 1 monthup to 1 monthup to 1 monthup to 1 month 1 1 1 1 ---- 3 months3 months3 months3 months 3 months 3 months 3 months 3 months ---- 1 year1 year1 year1 year
1 1 1 1 ---- 5 years5 years5 years5 years over 5 yearsover 5 yearsover 5 yearsover 5 years TotalTotalTotalTotal
Debt securitiesDebt securitiesDebt securitiesDebt securities 68 409 68 409 68 409 68 409 51 918 51 918 51 918 51 918 507 069 507 069 507 069 507 069 497 725 497 725 497 725 497 725 175 043 175 043 175 043 175 043 1 300 164 1 300 164 1 300 164 1 300 164 issued by the State Treasury 68 317 50 092 501 826 474 429 173 807 1 268 471 1 268 471 1 268 471 1 268 471
issued by non-financial institutions 92 821 620 13 414 - 14 947 14 947 14 947 14 947
issued by local government bodies - 778 4 623 8 405 977 14 783 14 783 14 783 14 783
issued by other financial institutions - 227 - 12 - 239 239 239 239
issued by banks - - - 1 465 259 1 724 1 724 1 724 1 724
TotalTotalTotalTotal 68 409 68 409 68 409 68 409 51 918 51 918 51 918 51 918 507 069 507 069 507 069 507 069 497 725 497 725 497 725 497 725 175 043 175 043 175 043 175 043 1 300 164 1 300 164 1 300 164 1 300 164
The average yield on debt securities issued by the State Treasury and included in the trading assets portfolio as at 31 December 2011 amounted to 4.61%. As at 31 December 2011 the Bank’s portfolio did not include Treasury securities denominated in foreign currencies.
The portfolio of trading assets as at 31 December 2011 comprised the following securities carried at nominal values:
• Treasury bonds 1 236 644
• Treasury bills 50 000
• Corporate bonds 14 900
• Municipal bonds 14 337
• BGK bonds 1 686
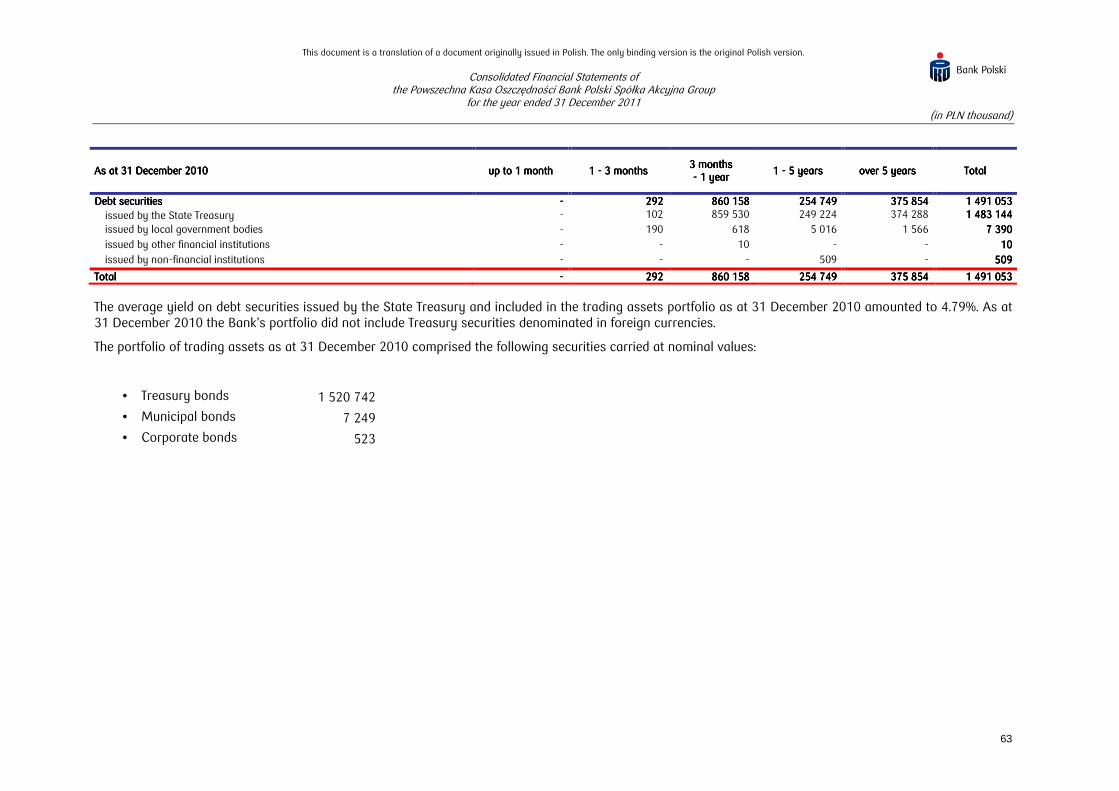
This document is a translation of a document originally issued in Polish. The only binding version is the original Polish version.
Consolidated Financial Statements of the Powszechna Kasa Oszczędności Bank Polski Spółka Akcyjna Group
for the year ended 31 December 2011 (in PLN thousand)
63
As at 31 December 20As at 31 December 20As at 31 December 20As at 31 December 2010101010 up to 1 monthup to 1 monthup to 1 monthup to 1 month 1 1 1 1 ---- 3 months3 months3 months3 months 3 months 3 months 3 months 3 months ---- 1 year1 year1 year1 year
1 1 1 1 ---- 5 years5 years5 years5 years over 5 yearsover 5 yearsover 5 yearsover 5 years TotalTotalTotalTotal
Debt securitiesDebt securitiesDebt securitiesDebt securities ---- 292 292 292 292 860 158 860 158 860 158 860 158 254 749 254 749 254 749 254 749 375 854 375 854 375 854 375 854 1 491 053 1 491 053 1 491 053 1 491 053 issued by the State Treasury - 102 859 530 249 224 374 288 1 483 144 1 483 144 1 483 144 1 483 144
issued by local government bodies - 190 618 5 016 1 566 7 390 7 390 7 390 7 390
issued by other financial institutions - - 10 - - 10 10 10 10
issued by non-financial institutions - - - 509 - 509 509 509 509
TotalTotalTotalTotal ---- 292 292 292 292 860 158 860 158 860 158 860 158 254 749 254 749 254 749 254 749 375 854 375 854 375 854 375 854 1 491 053 1 491 053 1 491 053 1 491 053
The average yield on debt securities issued by the State Treasury and included in the trading assets portfolio as at 31 December 2010 amounted to 4.79%. As at 31 December 2010 the Bank’s portfolio did not include Treasury securities denominated in foreign currencies.
The portfolio of trading assets as at 31 December 2010 comprised the following securities carried at nominal values:
• Treasury bonds 1 520 742
• Municipal bonds 7 249
• Corporate bonds 523

This document is a translation of a document originally issued in Polish. The only binding version is the original Polish version.
Consolidated Financial Statements of the Powszechna Kasa Oszczędności Bank Polski Spółka Akcyjna Group
for the year ended 31 December 2011 (in PLN thousand)
64
20.20.20.20. Derivative financial instrumentsDerivative financial instrumentsDerivative financial instrumentsDerivative financial instruments
DerivatDerivatDerivatDerivative instruments used by the Groupive instruments used by the Groupive instruments used by the Groupive instruments used by the Group
The Bank and other entities within the Group use various types of derivatives in order to manage risk involved in its business activities. As at 31 December 2011 and 31 December 2010, the Group held the following derivative instruments:
31.12.2031.12.2031.12.2031.12.2011111111 31.12.2031.12.2031.12.2031.12.2010101010
AssetsAssetsAssetsAssets LiabilitiesLiabilitiesLiabilitiesLiabilities AssetsAssetsAssetsAssets LiabilitiesLiabilitiesLiabilitiesLiabilities
Hedging instruments 516 925 342 598 153 921 555 983
Other derivative instruments 2 547 808 2 302 683 1 565 164 1 848 812
TotalTotalTotalTotal 3 064 733 3 064 733 3 064 733 3 064 733 2 645 281 2 645 281 2 645 281 2 645 281 1 719 085 1 719 085 1 719 085 1 719 085 2 404 795 2 404 795 2 404 795 2 404 795
Type of contractType of contractType of contractType of contract 31.12.20131.12.20131.12.20131.12.2011111 31.12.2031.12.2031.12.2031.12.2010101010
AssetsAssetsAssetsAssets LiabilitiesLiabilitiesLiabilitiesLiabilities AssetsAssetsAssetsAssets LiabilitiesLiabilitiesLiabilitiesLiabilities
IRS 1 941 309 1 925 161 1 447 237 1 553 029
FX Swap 438 331 139 720 62 204 83 613
CIRS 419 640 421 039 126 219 687 977
Forward 119 293 56 271 18 356 42 972
Options 106 492 70 112 46 397 25 382
FRA 38 117 31 965 12 157 11 107
Other 1 551 1 013 6 515 715
TotalTotalTotalTotal 3 064 733 3 064 733 3 064 733 3 064 733 2 645 281 2 645 281 2 645 281 2 645 281 1 719 085 1 719 085 1 719 085 1 719 085 2 404 795 2 404 795 2 404 795 2 404 795
The most frequently used types of derivatives in the Group’s activityare: IRS, FRA, FX Swap, CIRS and Forwards. The remaining entities in the Group may enter into transactions in derivatives exclusively for the purpose of hedging against the risk resulting from their core activities.

This document is a translation of a document originally issued in Polish. The only binding version is the original Polish version.
Consolidated Financial Statements of the Powszechna Kasa Oszczędności Bank Polski Spółka Akcyjna Group
for the year ended 31 December 2011 (in PLN thousand)
65
Derivative financial instruments as aDerivative financial instruments as aDerivative financial instruments as aDerivative financial instruments as at 31 December 201t 31 December 201t 31 December 201t 31 December 2011111
Nominal amounts of underlying instruments and fair value of dNominal amounts of underlying instruments and fair value of dNominal amounts of underlying instruments and fair value of dNominal amounts of underlying instruments and fair value of derivative financial instrumentserivative financial instrumentserivative financial instrumentserivative financial instruments
up to 1 monthup to 1 monthup to 1 monthup to 1 month 1 1 1 1 ---- 3 months3 months3 months3 months 3 months 3 months 3 months 3 months ---- 1 year1 year1 year1 year
1 1 1 1 ---- 5 years5 years5 years5 years over 5 yearsover 5 yearsover 5 yearsover 5 years TotalTotalTotalTotal Fair value Fair value Fair value Fair value (negative)(negative)(negative)(negative)
Fair value Fair value Fair value Fair value (positive)(positive)(positive)(positive)
Currency transactionsCurrency transactionsCurrency transactionsCurrency transactions
FX swap 21 083 789 9 126 101 10 647 681 137 381 - 40 994 952 40 994 952 40 994 952 40 994 952 139 720 438 331
Purchase of currency 10 609 912 4 618 540 5 346 158 66 712 - 20 641 322 20 641 322 20 641 322 20 641 322 - -
Sale of currency 10 473 877 4 507 561 5 301 523 70 669 - 20 353 630 20 353 630 20 353 630 20 353 630 - -
FX forward 1 791 631 2 619 474 3 200 974 426 898 - 8 038 977 8 038 977 8 038 977 8 038 977 56 271 119 293
Purchase of currency 898 463 1 312 740 1 614 283 213 824 - 4 039 310 4 039 310 4 039 310 4 039 310 - -
Sale of currency 893 168 1 306 734 1 586 691 213 074 - 3 999 667 3 999 667 3 999 667 3 999 667 - -
Options 1 463 178 3 694 347 5 122 277 3 009 547 - 13 289 349 13 289 349 13 289 349 13 289 349 70 112 106 492
Purchase 737 441 1 862 104 2 647 709 1 845 542 - 7 092 796 7 092 796 7 092 796 7 092 796 - -
Sale 725 737 1 832 243 2 474 568 1 164 005 - 6 196 553 6 196 553 6 196 553 6 196 553 - -
Cross Currency IRS - - 6 868 896 35 395 814 2 710 629 44 975 339 44 975 339 44 975 339 44 975 339 421 039 419 640
Purchase - - 3 422 487 17 483 131 1 342 072 22 247 690 22 247 690 22 247 690 22 247 690 - -
Sale - - 3 446 409 17 912 683 1 368 557 22 727 649 22 727 649 22 727 649 22 727 649 - -
Interest rate transactionsInterest rate transactionsInterest rate transactionsInterest rate transactions Interest Rate Swap (IRS) 35 442 220 41 119 688 135 027 442 156 039 292 23 222 768 390 851 410 390 851 410 390 851 410 390 851 410 1 925 161 1 941 309
Purchase 17 721 110 20 559 844 67 513 721 78 019 646 11 611 384 195 425 705 195 425 705 195 425 705 195 425 705 - -
Sale 17 721 110 20 559 844 67 513 721 78 019 646 11 611 384 195 425 705 195 425 705 195 425 705 195 425 705 - -
Forward Rate Agreement (FRA) 42 157 000 48 763 000 65 082 000 2 000 000 - 158 002 000 158 002 000 158 002 000 158 002 000 31 965 38 117
Purchase 21 579 000 22 946 000 31 621 000 1 000 000 - 77 146 000 77 146 000 77 146 000 77 146 000 - -
Sale 20 578 000 25 817 000 33 461 000 1 000 000 - 80 856 000 80 856 000 80 856 000 80 856 000 - -
Other transactionsOther transactionsOther transactionsOther transactions Other (including stock market index
derivatives) 1 682 190 4 114 409 747 36 216 - 2 132 267 2 132 267 2 132 267 2 132 267 1 013 1 551
Purchase 644 005 903 208 859 35 586 - 889 353 889 353 889 353 889 353 - -
Sale 1 038 185 3 211 200 888 630 - 1 242 914 1 242 914 1 242 914 1 242 914 - -
Total derivative instrumentsTotal derivative instrumentsTotal derivative instrumentsTotal derivative instruments 103 620 008 103 620 008 103 620 008 103 620 008 105 326 724 105 326 724 105 326 724 105 326 724 226 359 017 226 359 017 226 359 017 226 359 017 197 045 148 197 045 148 197 045 148 197 045 148 25 933 397 25 933 397 25 933 397 25 933 397 658 284 294 658 284 294 658 284 294 658 284 294 2 645 281 2 645 281 2 645 281 2 645 281 3 064 733 3 064 733 3 064 733 3 064 733

This document is a translation of a document originally issued in Polish. The only binding version is the original Polish version.
Consolidated Financial Statements of the Powszechna Kasa Oszczędności Bank Polski Spółka Akcyjna Group
for the year ended 31 December 2011 (in PLN thousand)
66
Derivative financial inDerivative financial inDerivative financial inDerivative financial instruments as at 31 December 20struments as at 31 December 20struments as at 31 December 20struments as at 31 December 2010101010
Nominal amounts of underlying instruments and fair value of deNominal amounts of underlying instruments and fair value of deNominal amounts of underlying instruments and fair value of deNominal amounts of underlying instruments and fair value of derivative financial instrumentsrivative financial instrumentsrivative financial instrumentsrivative financial instruments
up to 1 monthup to 1 monthup to 1 monthup to 1 month 1 1 1 1 ---- 3 months3 months3 months3 months 3 months 3 months 3 months 3 months ---- 1 year1 year1 year1 year
1 1 1 1 ---- 5 years5 years5 years5 years over over over over 5 years5 years5 years5 years TotalTotalTotalTotal Fair value Fair value Fair value Fair value (negative)(negative)(negative)(negative)
Fair value Fair value Fair value Fair value (positive)(positive)(positive)(positive)
Currency transactionsCurrency transactionsCurrency transactionsCurrency transactions
FX swap 13 472 316 4 136 351 157 816 - - 17 766 483 17 766 483 17 766 483 17 766 483 83 613 62 204
Purchase of currency 6 718 392 2 076 477 78 988 - - 8 873 857 8 873 857 8 873 857 8 873 857 - -
Sale of currency 6 753 924 2 059 874 78 828 - - 8 892 626 8 892 626 8 892 626 8 892 626 - -
FX forward 2 005 928 2 165 895 3 101 234 149 193 - 7 422 250 7 422 250 7 422 250 7 422 250 42 972 18 356
Purchase of currency 1 000 904 1 078 990 1 535 756 73 127 - 3 688 777 3 688 777 3 688 777 3 688 777 - -
Sale of currency 1 005 024 1 086 905 1 565 478 76 066 - 3 733 473 3 733 473 3 733 473 3 733 473 - -
Options 2 309 507 2 601 855 2 779 398 1 063 314 - 8 754 074 8 754 074 8 754 074 8 754 074 25 382 46 397
Purchase 1 166 247 1 297 847 1 383 949 517 322 - 4 365 365 4 365 365 4 365 365 4 365 365 - -
Sale 1 143 260 1 304 008 1 395 449 545 992 - 4 388 709 4 388 709 4 388 709 4 388 709 - -
Cross Currency IRS 1 885 130 303 795 5 133 837 28 861 974 2 783 575 38 968 311 38 968 311 38 968 311 38 968 311 687 977 126 219
Purchase 902 828 145 600 2 526 216 14 080 858 1 353 021 19 008 523 19 008 523 19 008 523 19 008 523 - -
Sale 982 302 158 195 2 607 621 14 781 116 1 430 554 19 959 788 19 959 788 19 959 788 19 959 788 - -
Interest rate transactionsInterest rate transactionsInterest rate transactionsInterest rate transactions Interest Rate Swap (IRS) 29 692 198 31 588 056 90 322 034 132 693 552 20 420 516 304 716 356 304 716 356 304 716 356 304 716 356 1 553 029 1 447 237
Purchase 14 846 099 15 794 028 45 161 017 66 346 776 10 210 258 152 358 178 152 358 178 152 358 178 152 358 178 - -
Sale 14 846 099 15 794 028 45 161 017 66 346 776 10 210 258 152 358 178 152 358 178 152 358 178 152 358 178 - -
Forward Rate Agreement (FRA) 22 013 000 30 732 000 37 825 000 1 850 000 - 92 420 000 92 420 000 92 420 000 92 420 000 11 107 12 157
Purchase 11 950 000 14 616 000 18 250 000 800 000 - 45 616 000 45 616 000 45 616 000 45 616 000 - -
Sale 10 063 000 16 116 000 19 575 000 1 050 000 - 46 804 000 46 804 000 46 804 000 46 804 000 - -
Other transactionsOther transactionsOther transactionsOther transactions
Other (including stock market index
derivatives) 4 045 978 18 693 6 306 400 000 - 4 470 977 4 470 977 4 470 977 4 470 977 715 6 515
Purchase 2 022 989 11 181 111 200 000 - 2 234 281 2 234 281 2 234 281 2 234 281 - -
Sale 2 022 989 7 512 6 195 200 000 - 2 236 696 2 236 696 2 236 696 2 236 696 - -
Total derivative instrumentsTotal derivative instrumentsTotal derivative instrumentsTotal derivative instruments 75 424 057 75 424 057 75 424 057 75 424 057 71 546 645 71 546 645 71 546 645 71 546 645 139 325 625 139 325 625 139 325 625 139 325 625 165 018 033 165 018 033 165 018 033 165 018 033 23 204 091 23 204 091 23 204 091 23 204 091 474 518 451 474 518 451 474 518 451 474 518 451 2 404 795 2 404 795 2 404 795 2 404 795 1 719 085 1 719 085 1 719 085 1 719 085

This document is a translation of a document originally issued in Polish. The only binding version is the original Polish version.
Consolidated Financial Statements of the Powszechna Kasa Oszczędności Bank Polski Spółka Akcyjna Group
for the year ended 31 December 2011 (in PLN thousand)
67
21.21.21.21. Derivative hedging instrumentsDerivative hedging instrumentsDerivative hedging instrumentsDerivative hedging instruments
As at 31 December 2011, the Group applies the following hedging strategies:
1) hedges against fluctuations in cash flows from mortgage loans in CHF and negotiated term deposits in PLN, resulting from the risk of fluctuations in interest rates and foreign exchange rates, using CIRS transactions,
2) hedges against fluctuations in cash flows from floating interest rate loans in PLN, resulting from the risk of fluctuations in interest rates, using IRS transactions,
3) hedges against fluctuations in cash flows from floating interest rate loans in EUR, resulting from the risk of fluctuations in interest rates, using IRS transactions,
4) hedges against fluctuations in cash flows from floating interest rate loans in CHF, resulting from the risk of fluctuations in interest rates, using IRS transactions.
As at 31 December 2010, the Group used the fair value hedge described in points 1-3 above.
As at 31 December 2011 and 31 December 2010, the Group did not use the fair value hedge.
The characteristics of the cash flow hedges applied by the Group are presented in the table below:
Hedging strategy:Hedging strategy:Hedging strategy:Hedging strategy:
Hedges against fluctuations in cash flows from mortgage loans in CHF Hedges against fluctuations in cash flows from mortgage loans in CHF Hedges against fluctuations in cash flows from mortgage loans in CHF Hedges against fluctuations in cash flows from mortgage loans in CHF and negotiated term deposits in PLN, resulting from the risk of and negotiated term deposits in PLN, resulting from the risk of and negotiated term deposits in PLN, resulting from the risk of and negotiated term deposits in PLN, resulting from the risk of
fluctuations in interest rates and in foreign exchange rates, using CIfluctuations in interest rates and in foreign exchange rates, using CIfluctuations in interest rates and in foreign exchange rates, using CIfluctuations in interest rates and in foreign exchange rates, using CIRS RS RS RS transactionstransactionstransactionstransactions
Type of hedge relationship Type of hedge relationship Type of hedge relationship Type of hedge relationship Hedge accounting of cash flow (macro cash flow hedge)
Description of hedge relationshipDescription of hedge relationshipDescription of hedge relationshipDescription of hedge relationship
Elimination of the risk of cash flow fluctuations generated by mortgage loans denominated in CHF and negotiated term deposits in PLN resulting from fluctuations in reference interest rates in CHF and PLN, and changes in foreign exchange rates CHF/PLN during the hedged period.
Hedged riskHedged riskHedged riskHedged risk Currency risk and interest rate risk.
Hedging instrumentHedging instrumentHedging instrumentHedging instrument CIRS transactions where the Bank pays coupons based on 3M CHF LIBOR, and receives coupons based on 3M WIBOR on the nominal amount defined in CHF and PLN respectively.
Hedged positionHedged positionHedged positionHedged position
1) The portfolio of floating rate mortgage loans denominated in CHF. 2) The portfolio of short-term negotiable term deposits, including
renewals in the future (high probability of occurrence). The Bank designated the hedged position according to the regulations of IAS 39.AG.99C as adopted by the EU.
Hedge efficiencyHedge efficiencyHedge efficiencyHedge efficiency Hedge effectiveness is verified through the use of prospective and retrospective effectiveness tests. The tests are performed monthly.
Periods in which cash flows are Periods in which cash flows are Periods in which cash flows are Periods in which cash flows are expected and in which they should expected and in which they should expected and in which they should expected and in which they should have an impact on the financial have an impact on the financial have an impact on the financial have an impact on the financial resultresultresultresult
January 2012 to October 2026
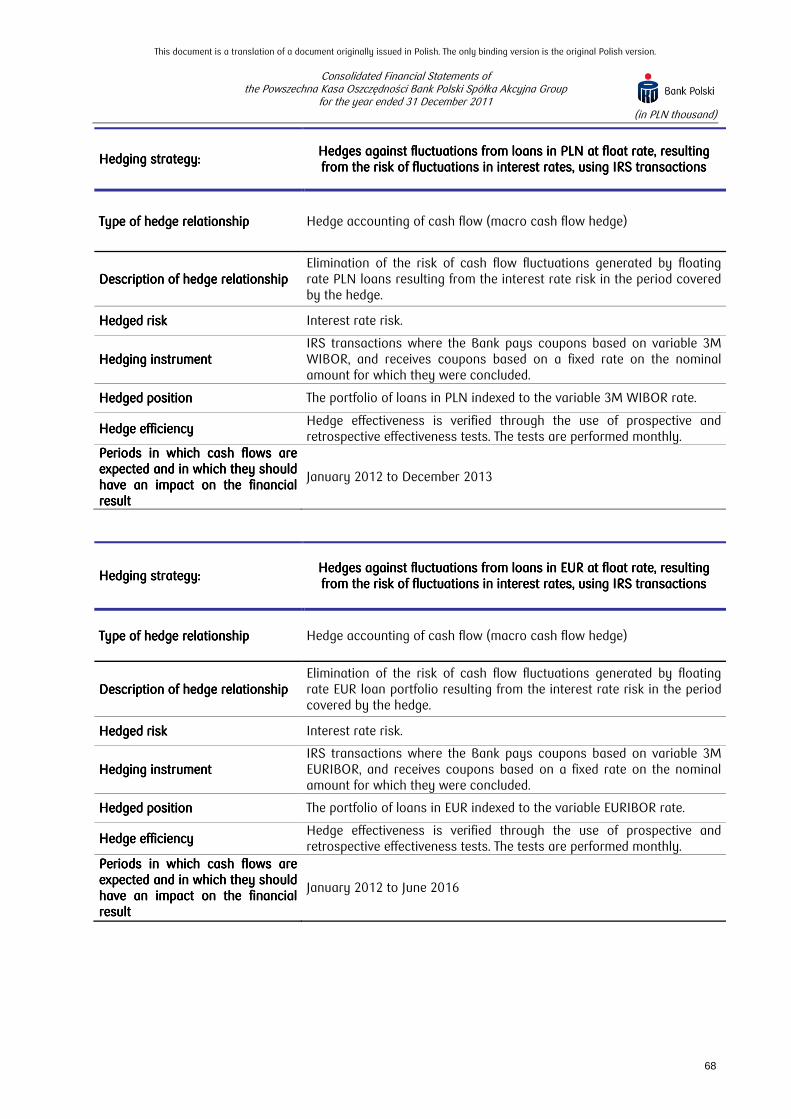
This document is a translation of a document originally issued in Polish. The only binding version is the original Polish version.
Consolidated Financial Statements of the Powszechna Kasa Oszczędności Bank Polski Spółka Akcyjna Group
for the year ended 31 December 2011 (in PLN thousand)
68
Hedging strategy:Hedging strategy:Hedging strategy:Hedging strategy: Hedges against fluctuations from loans in PLN at float rate, resulting Hedges against fluctuations from loans in PLN at float rate, resulting Hedges against fluctuations from loans in PLN at float rate, resulting Hedges against fluctuations from loans in PLN at float rate, resulting from the risk of fluctuations in interest rates, using IRS transactionsfrom the risk of fluctuations in interest rates, using IRS transactionsfrom the risk of fluctuations in interest rates, using IRS transactionsfrom the risk of fluctuations in interest rates, using IRS transactions
Type of hedge relationship Type of hedge relationship Type of hedge relationship Type of hedge relationship Hedge accounting of cash flow (macro cash flow hedge)
Description of hedge relationshipDescription of hedge relationshipDescription of hedge relationshipDescription of hedge relationship Elimination of the risk of cash flow fluctuations generated by floating rate PLN loans resulting from the interest rate risk in the period covered by the hedge.
Hedged riskHedged riskHedged riskHedged risk Interest rate risk.
Hedging instrumentHedging instrumentHedging instrumentHedging instrument IRS transactions where the Bank pays coupons based on variable 3M WIBOR, and receives coupons based on a fixed rate on the nominal amount for which they were concluded.
Hedged Hedged Hedged Hedged positionpositionpositionposition The portfolio of loans in PLN indexed to the variable 3M WIBOR rate.
Hedge efficiencyHedge efficiencyHedge efficiencyHedge efficiency Hedge effectiveness is verified through the use of prospective and retrospective effectiveness tests. The tests are performed monthly.
Periods in which cash Periods in which cash Periods in which cash Periods in which cash flows are flows are flows are flows are expected and in which they should expected and in which they should expected and in which they should expected and in which they should have an impact on the financial have an impact on the financial have an impact on the financial have an impact on the financial resultresultresultresult
January 2012 to December 2013
Hedging strategy:Hedging strategy:Hedging strategy:Hedging strategy: Hedges against fluctuations from loans in EUR at float rate, resulting Hedges against fluctuations from loans in EUR at float rate, resulting Hedges against fluctuations from loans in EUR at float rate, resulting Hedges against fluctuations from loans in EUR at float rate, resulting from the risk of fluctuations in interest rates, from the risk of fluctuations in interest rates, from the risk of fluctuations in interest rates, from the risk of fluctuations in interest rates, using IRS transactionsusing IRS transactionsusing IRS transactionsusing IRS transactions
Type of hedge relationship Type of hedge relationship Type of hedge relationship Type of hedge relationship Hedge accounting of cash flow (macro cash flow hedge)
Description of hedge relationshipDescription of hedge relationshipDescription of hedge relationshipDescription of hedge relationship Elimination of the risk of cash flow fluctuations generated by floating rate EUR loan portfolio resulting from the interest rate risk in the period covered by the hedge.
Hedged riskHedged riskHedged riskHedged risk Interest rate risk.
Hedging instrumentHedging instrumentHedging instrumentHedging instrument IRS transactions where the Bank pays coupons based on variable 3M EURIBOR, and receives coupons based on a fixed rate on the nominal amount for which they were concluded.
Hedged positionHedged positionHedged positionHedged position The portfolio of loans in EUR indexed to the variable EURIBOR rate.
Hedge Hedge Hedge Hedge efficiencyefficiencyefficiencyefficiency Hedge effectiveness is verified through the use of prospective and retrospective effectiveness tests. The tests are performed monthly.
Periods in which cash flows are Periods in which cash flows are Periods in which cash flows are Periods in which cash flows are expected and in which they should expected and in which they should expected and in which they should expected and in which they should have an impact on the financial have an impact on the financial have an impact on the financial have an impact on the financial resultresultresultresult
January 2012 to June 2016

This document is a translation of a document originally issued in Polish. The only binding version is the original Polish version.
Consolidated Financial Statements of the Powszechna Kasa Oszczędności Bank Polski Spółka Akcyjna Group
for the year ended 31 December 2011 (in PLN thousand)
69
Hedging strategy:Hedging strategy:Hedging strategy:Hedging strategy: Hedges against fluctuations from loans in CHF at float rate, resulting Hedges against fluctuations from loans in CHF at float rate, resulting Hedges against fluctuations from loans in CHF at float rate, resulting Hedges against fluctuations from loans in CHF at float rate, resulting from the risk of fluctuations in interest rates, using IRS transactionsfrom the risk of fluctuations in interest rates, using IRS transactionsfrom the risk of fluctuations in interest rates, using IRS transactionsfrom the risk of fluctuations in interest rates, using IRS transactions
Type of hedge relationship Type of hedge relationship Type of hedge relationship Type of hedge relationship Hedge accounting of cash flow (macro cash flow hedge)
Description of hedge relationshipDescription of hedge relationshipDescription of hedge relationshipDescription of hedge relationship Elimination of the risk of cash flow fluctuations generated by floating rate CHF loan portfolio resulting from the interest rate risk in the period covered by the hedge.
Hedged riskHedged riskHedged riskHedged risk Interest rate risk.
Hedging instrumentHedging instrumentHedging instrumentHedging instrument IRS transactions where the Bank pays coupons based on variable 3M LIBOR CHF, and receives coupons based on a fixed rate on the nominal amount for which they were concluded.
Hedged positionHedged positionHedged positionHedged position The portfolio of loans in CHF indexed to the variable 3M LIBOR CHF rate.
Hedge efficiencyHedge efficiencyHedge efficiencyHedge efficiency Hedge effectiveness is verified through the use of prospective and retrospective effectiveness tests. The tests are performed monthly.
Periods in which cash flows are Periods in which cash flows are Periods in which cash flows are Periods in which cash flows are expected and in which theyexpected and in which theyexpected and in which theyexpected and in which they should have an impact on the should have an impact on the should have an impact on the should have an impact on the financial resultfinancial resultfinancial resultfinancial result
January 2012 to July 2016
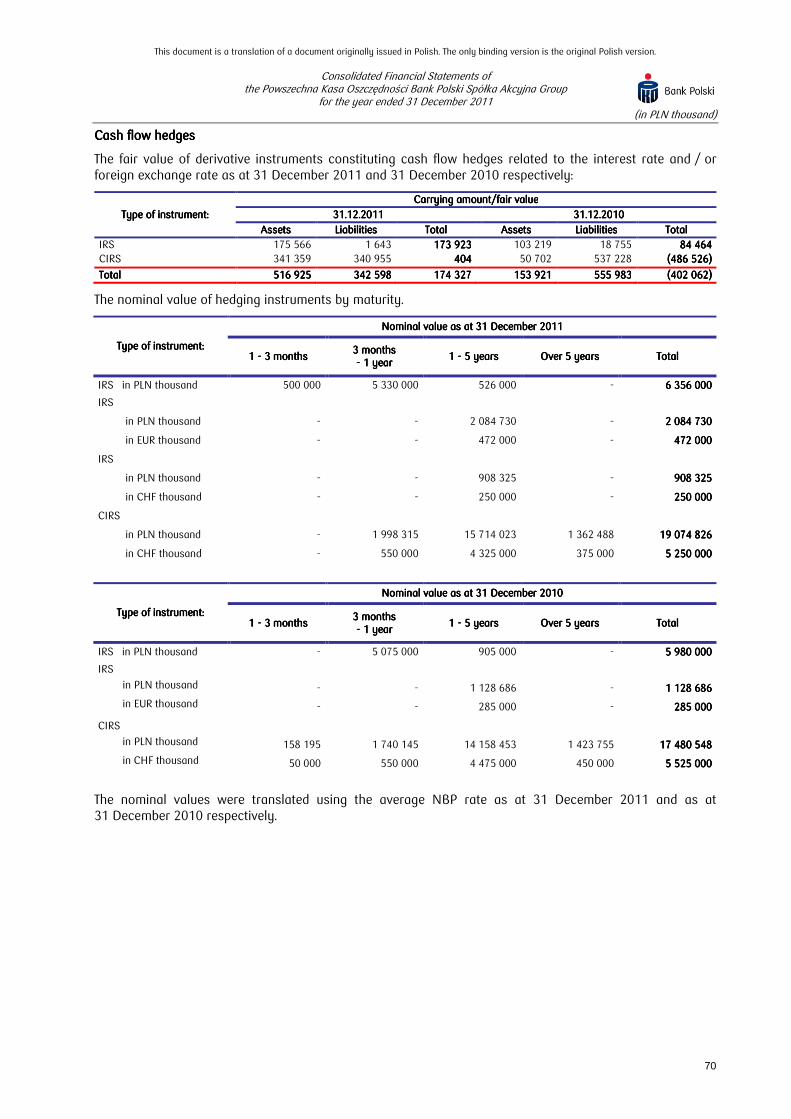
This document is a translation of a document originally issued in Polish. The only binding version is the original Polish version.
Consolidated Financial Statements of the Powszechna Kasa Oszczędności Bank Polski Spółka Akcyjna Group
for the year ended 31 December 2011 (in PLN thousand)
70
Cash flow hedgesCash flow hedgesCash flow hedgesCash flow hedges
The fair value of derivative instruments constituting cash flow hedges related to the interest rate and / or foreign exchange rate as at 31 December 2011 and 31 December 2010 respectively:
Type of instrument:Type of instrument:Type of instrument:Type of instrument:
Carrying amount/fair valueCarrying amount/fair valueCarrying amount/fair valueCarrying amount/fair value
31.12.20131.12.20131.12.20131.12.2011111 31.12.2031.12.2031.12.2031.12.2010101010
AssetsAssetsAssetsAssets LiabilitiesLiabilitiesLiabilitiesLiabilities TotalTotalTotalTotal AssetsAssetsAssetsAssets LiabilitiesLiabilitiesLiabilitiesLiabilities TotalTotalTotalTotal
IRS 175 566 1 643 173 923173 923173 923173 923 103 219 18 755 84 46484 46484 46484 464 CIRS 341 359 340 955 404404404404 50 702 537 228 (486(486(486(486 526)526)526)526)
TotalTotalTotalTotal 516 925516 925516 925516 925 342 598342 598342 598342 598 174 327174 327174 327174 327 153 921153 921153 921153 921 555 983555 983555 983555 983 (402(402(402(402 062)062)062)062)
The nominal value of hedging instruments by maturity.
Type of instrument:Type of instrument:Type of instrument:Type of instrument:
Nominal value Nominal value Nominal value Nominal value as as as as at 31 December 201at 31 December 201at 31 December 201at 31 December 2011111
1 1 1 1 ---- 3 months3 months3 months3 months 3 months 3 months 3 months 3 months ---- 1 year1 year1 year1 year
1 1 1 1 ---- 5 years5 years5 years5 years Over 5 yearsOver 5 yearsOver 5 yearsOver 5 years TotalTotalTotalTotal
IRS in PLN thousand 500 000 5 330 000 526 000 - 6666 356 000356 000356 000356 000
IRS
in PLN thousand - - 2 084 730 - 2222 084 730084 730084 730084 730
in EUR thousand - - 472 000 - 472 000472 000472 000472 000
IRS
in PLN thousand - - 908 325 - 908 325908 325908 325908 325
in CHF thousand - - 250 000 - 250 000250 000250 000250 000
CIRS
in PLN thousand - 1 998 315 15 714 023 1 362 488 19191919 074 826074 826074 826074 826
in CHF thousand - 550 000 4 325 000 375 000 5555 250 000250 000250 000250 000
Type of instrument: Type of instrument: Type of instrument: Type of instrument:
Nominal valueNominal valueNominal valueNominal value asasasas at 31 December 20at 31 December 20at 31 December 20at 31 December 2010101010
1 1 1 1 ---- 3 months3 months3 months3 months 3 months 3 months 3 months 3 months ---- 1 year1 year1 year1 year
1 1 1 1 ---- 5 years5 years5 years5 years Over 5 yearsOver 5 yearsOver 5 yearsOver 5 years TotalTotalTotalTotal
IRS in PLN thousand - 5 075 000 905 000 - 5555 980 000980 000980 000980 000
IRS
in PLN thousand - - 1 128 686 - 1111 128 686128 686128 686128 686
in EUR thousand - - 285 000 - 285 000285 000285 000285 000
CIRS
in PLN thousand 158 195 1 740 145 14 158 453 1 423 755 17171717 480 548480 548480 548480 548
in CHF thousand 50 000 550 000 4 475 000 450 000 5555 525 000525 000525 000525 000
The nominal values were translated using the average NBP rate as at 31 December 2011 and as at 31 December 2010 respectively.

This document is a translation of a document originally issued in Polish. The only binding version is the original Polish version.
Consolidated Financial Statements of the Powszechna Kasa Oszczędności Bank Polski Spółka Akcyjna Group
for the year ended 31 December 2011 (in PLN thousand)
71
Other comprehensive Other comprehensive Other comprehensive Other comprehensive income as regards income as regards income as regards income as regards cash flow hedgescash flow hedgescash flow hedgescash flow hedges 31.12.20131.12.20131.12.20131.12.2011111 31.12.2031.12.2031.12.2031.12.2010101010
Other comprehensive income at the beginning of the period 269 042 147 254
Gains/ losses transferred to other comprehensive income in the period 1 290 334 (145 504) Amount transferred from other comprehensive income to profit and loss, of which transferred to:
(1 112 234) 267 292
- interest income (814 275) (649 116)
- net foreign exchange gains (297 959) 916 408
Other comprehensive income at the end of the period (gross)Other comprehensive income at the end of the period (gross)Other comprehensive income at the end of the period (gross)Other comprehensive income at the end of the period (gross) 447 142 447 142 447 142 447 142 269 042 269 042 269 042 269 042
Tax effectTax effectTax effectTax effect (84 957)(84 957)(84 957)(84 957) (51 118)(51 118)(51 118)(51 118)
Other comprehensive income atOther comprehensive income atOther comprehensive income atOther comprehensive income at the end of the period (net)the end of the period (net)the end of the period (net)the end of the period (net) 362 185 362 185 362 185 362 185 217 924 217 924 217 924 217 924
Ineffective part of hedging cash flows recogniIneffective part of hedging cash flows recogniIneffective part of hedging cash flows recogniIneffective part of hedging cash flows recognisedsedsedsed through profit and lossthrough profit and lossthrough profit and lossthrough profit and loss (64 342)(64 342)(64 342)(64 342) (82 879)(82 879)(82 879)(82 879) EffectEffectEffectEffect on other comprehensive income in the period (gross)on other comprehensive income in the period (gross)on other comprehensive income in the period (gross)on other comprehensive income in the period (gross) 178 100 178 100 178 100 178 100 121 788 121 788 121 788 121 788
Deferred tax on cash flow hedgesDeferred tax on cash flow hedgesDeferred tax on cash flow hedgesDeferred tax on cash flow hedges (33 (33 (33 (33 839)839)839)839) (23 140)(23 140)(23 140)(23 140)
22.22.22.22. Financial assets designatedFinancial assets designatedFinancial assets designatedFinancial assets designated upon initial recognition upon initial recognition upon initial recognition upon initial recognition at fair valueat fair valueat fair valueat fair value through profit and lossthrough profit and lossthrough profit and lossthrough profit and loss
31.12.20131.12.20131.12.20131.12.2011111 31.12.2031.12.2031.12.2031.12.2010101010
Debt securitiesDebt securitiesDebt securitiesDebt securities 12 467 201 12 467 201 12 467 201 12 467 201 10 758 331 10 758 331 10 758 331 10 758 331
issued by central banks, of which: 8 593 791 3 997 780
NBP money market bills 8 593 791 3 997 780
issued by the State Treasury, of which: 3 620 515 6 631 702
Treasury bills 2 180 148 1 893 058
Treasury bonds PLN 1 318 278 4 738 644
Treasury bonds EUR 122 089 -
issued by local government bodies, of which: 252 895 128 849
municipal bonds EUR 143 973 128 849
municipal bonds PLN 108 922 -
TotalTotalTotalTotal 12 467 201 12 467 201 12 467 201 12 467 201 10 758 331 10 758 331 10 758 331 10 758 331
As at 31 December 2011 and as at 31 December 2010, the portfolio of financial instruments designated upon initial recognition at fair value through profit and loss comprised of the following:
By nominal amountBy nominal amountBy nominal amountBy nominal amount 31.12.20131.12.20131.12.20131.12.2011111 CurrencyCurrencyCurrencyCurrency 31.12.2031.12.2031.12.2031.12.2010101010 CurrencyCurrencyCurrencyCurrency
in the parent company:in the parent company:in the parent company:in the parent company:
NBP money market bills 8 600 000 PLN thousand 4 000 000 PLN thousand Treasury bills 2 196 950 PLN thousand 1 932 960 PLN thousand
Treasury bonds PLN 1 361 669 PLN thousand 4 834 445 PLN thousand
Treasury bonds EUR 110 420 PLN thousand - PLN thousand
municipal bonds EUR 110 420 PLN thousand 99 008 PLN thousand
municipal bonds PLN 100 000 PLN thousand - PLN thousand
in subsidiaries:in subsidiaries:in subsidiaries:in subsidiaries:
bonds of other entities 3 128 UAH thousand 22 148 UAH thousand
As at 31 December 2011, the average yield on debt securities issued by the State Treasury which are included in the portfolio of financial instruments designated upon initial recognition at fair value through profit and loss was 4.73%. As at 31 December 2010, the average yield on such securities amounted to 4.57%.

This document is a translation of a document originally issued in Polish. The only binding version is the original Polish version.
Consolidated Financial Statements of the Powszechna Kasa Oszczędności Bank Polski Spółka Akcyjna Group
for the year ended 31 December 2011 (in PLN thousand)
72
Financial assets designated Financial assets designated Financial assets designated Financial assets designated upon initial recognition upon initial recognition upon initial recognition upon initial recognition at fairat fairat fairat fair value through profit and loss value through profit and loss value through profit and loss value through profit and loss by by by by carrying amount carrying amount carrying amount carrying amount –––– by by by by maturitymaturitymaturitymaturity
As at 31 December 201As at 31 December 201As at 31 December 201As at 31 December 2011111 up to 1 monthup to 1 monthup to 1 monthup to 1 month 1 1 1 1 ---- 3 months3 months3 months3 months 3 months 3 months 3 months 3 months –––– 1 year1 year1 year1 year
1 1 1 1 ---- 5 years5 years5 years5 years over 5 yearsover 5 yearsover 5 yearsover 5 years TotalTotalTotalTotal
Debt securitiesDebt securitiesDebt securitiesDebt securities 8 974 505 8 974 505 8 974 505 8 974 505 2 180 148 2 180 148 2 180 148 2 180 148 512 243 512 243 512 243 512 243 547 410 547 410 547 410 547 410 252 895 252 895 252 895 252 895 12 467 201 12 467 201 12 467 201 12 467 201
issued by central banks 8 593 791 - - - - 8 593 791 8 593 791 8 593 791 8 593 791
issued by the State Treasury 380 714 2 180 148 512 243 547 410 - 3 620 515 3 620 515 3 620 515 3 620 515
issued by local government bodies - - - - 252 895 252 895 252 895 252 895 252 895
TotalTotalTotalTotal 8 974 505 8 974 505 8 974 505 8 974 505 2 180 148 2 180 148 2 180 148 2 180 148 512 243 512 243 512 243 512 243 547 410 547 410 547 410 547 410 252 895 252 895 252 895 252 895 12 467 201 12 467 201 12 467 201 12 467 201
As at 31 December 2010As at 31 December 2010As at 31 December 2010As at 31 December 2010 up to 1 monthup to 1 monthup to 1 monthup to 1 month 1 1 1 1 ---- 3 months3 months3 months3 months 3 months 3 months 3 months 3 months –––– 1 year1 year1 year1 year
1 1 1 1 ---- 5 years5 years5 years5 years over 5 yearsover 5 yearsover 5 yearsover 5 years TotalTotalTotalTotal
Debt securitiesDebt securitiesDebt securitiesDebt securities 3 997 780 3 997 780 3 997 780 3 997 780 430 435 430 435 430 435 430 435 4 105 431 4 105 431 4 105 431 4 105 431 2 095 836 2 095 836 2 095 836 2 095 836 128 849 128 849 128 849 128 849 10 758 331 10 758 331 10 758 331 10 758 331
issued by central banks 3 997 780 - - - - 3 997 780 3 997 780 3 997 780 3 997 780
issued by the State Treasury - 430 435 4 105 431 2 095 836 - 6 631 702 6 631 702 6 631 702 6 631 702
issued by local government bodies - - - - 128 849 128 849 128 849 128 849 128 849
TotalTotalTotalTotal 3 997 780 3 997 780 3 997 780 3 997 780 430 435 430 435 430 435 430 435 4 105 431 4 105 431 4 105 431 4 105 431 2 095 836 2 095 836 2 095 836 2 095 836 128 849 128 849 128 849 128 849 10 758 331 10 758 331 10 758 331 10 758 331
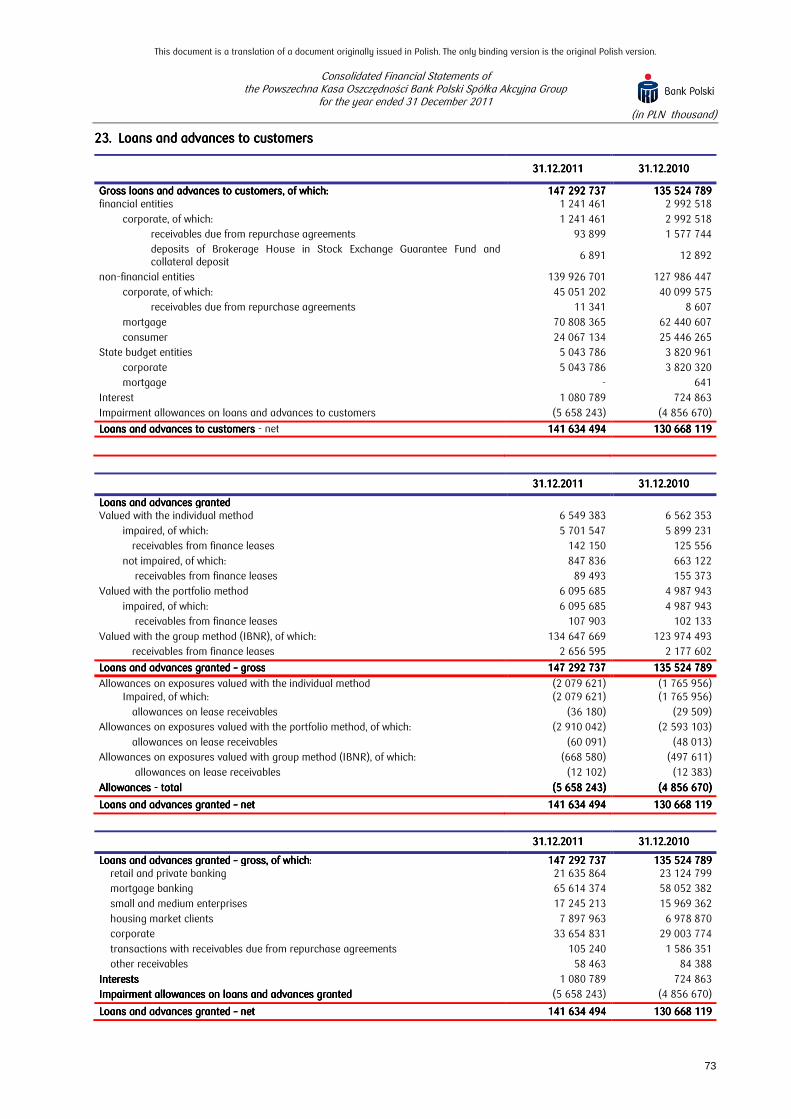
This document is a translation of a document originally issued in Polish. The only binding version is the original Polish version.
Consolidated Financial Statements of the Powszechna Kasa Oszczędności Bank Polski Spółka Akcyjna Group
for the year ended 31 December 2011 (in PLN thousand)
73
23.23.23.23. Loans and advances to customersLoans and advances to customersLoans and advances to customersLoans and advances to customers
31.12.20131.12.20131.12.20131.12.2011111 31.12.2031.12.2031.12.2031.12.2010101010
Gross loans and advances to customers, of which:Gross loans and advances to customers, of which:Gross loans and advances to customers, of which:Gross loans and advances to customers, of which: 147 292 737 147 292 737 147 292 737 147 292 737 135 524 789 135 524 789 135 524 789 135 524 789 financial entities 1 241 461 2 992 518
corporate, of which: 1 241 461 2 992 518
receivables due from repurchase agreements 93 899 1 577 744
deposits of Brokerage House in Stock Exchange Guarantee Fund and collateral deposit
6 891 12 892
non-financial entities 139 926 701 127 986 447
corporate, of which: 45 051 202 40 099 575
receivables due from repurchase agreements 11 341 8 607
mortgage 70 808 365 62 440 607
consumer 24 067 134 25 446 265
State budget entities 5 043 786 3 820 961
corporate 5 043 786 3 820 320
mortgage - 641
Interest 1 080 789 724 863
Impairment allowances on loans and advances to customers (5 658 243) (4 856 670)
LLLLoans and advances to customersoans and advances to customersoans and advances to customersoans and advances to customers - net 141 634 494 141 634 494 141 634 494 141 634 494 130 668 119 130 668 119 130 668 119 130 668 119
31.12.201131.12.201131.12.201131.12.2011 31.12.201031.12.201031.12.201031.12.2010
Loans and advances Loans and advances Loans and advances Loans and advances grantedgrantedgrantedgranted Valued with the individual method 6 549 383 6 562 353
impaired, of which: 5 701 547 5 899 231
receivables from finance leases 142 150 125 556
not impaired, of which: 847 836 663 122
receivables from finance leases 89 493 155 373
Valued with the portfolio method 6 095 685 4 987 943
impaired, of which: 6 095 685 4 987 943
receivables from finance leases 107 903 102 133
Valued with the group method (IBNR), of which: 134 647 669 123 974 493
receivables from finance leases 2 656 595 2 177 602
Loans and advances Loans and advances Loans and advances Loans and advances grantedgrantedgrantedgranted –––– grossgrossgrossgross 147 292 737 147 292 737 147 292 737 147 292 737 135 524 789 135 524 789 135 524 789 135 524 789
Allowances on exposures valued with the individual method (2 079 621) (1 765 956) Impaired, of which: (2 079 621) (1 765 956)
allowances on lease receivables (36 180) (29 509)
Allowances on exposures valued with the portfolio method, of which: (2 910 042) (2 593 103)
allowances on lease receivables (60 091) (48 013)
Allowances on exposures valued with group method (IBNR), of which: (668 580) (497 611)
allowances on lease receivables (12 102) (12 383)
Allowances Allowances Allowances Allowances ---- totaltotaltotaltotal (5 658 243)(5 658 243)(5 658 243)(5 658 243) (4 856 670)(4 856 670)(4 856 670)(4 856 670)
Loans and advances Loans and advances Loans and advances Loans and advances granted granted granted granted –––– netnetnetnet 141 634 494 141 634 494 141 634 494 141 634 494 130 668 119 130 668 119 130 668 119 130 668 119
31.12.201131.12.201131.12.201131.12.2011 31.12.201031.12.201031.12.201031.12.2010
Loans and advances Loans and advances Loans and advances Loans and advances grantedgrantedgrantedgranted –––– gross, of which:gross, of which:gross, of which:gross, of which: 147 292 737147 292 737147 292 737147 292 737 135 524 789135 524 789135 524 789135 524 789 retail and private banking 21 635 864 23 124 799
mortgage banking 65 614 374 58 052 382
small and medium enterprises 17 245 213 15 969 362
housing market clients 7 897 963 6 978 870
corporate 33 654 831 29 003 774
transactions with receivables due from repurchase agreements 105 240 1 586 351
other receivables 58 463 84 388
InterestsInterestsInterestsInterests 1 080 789 724 863
Impairment allowances on loans and advances Impairment allowances on loans and advances Impairment allowances on loans and advances Impairment allowances on loans and advances grantedgrantedgrantedgranted (5 658 243) (4 856 670)
Loans and advances Loans and advances Loans and advances Loans and advances granted granted granted granted –––– netnetnetnet 141 634 494141 634 494141 634 494141 634 494 130 668 119130 668 119130 668 119130 668 119
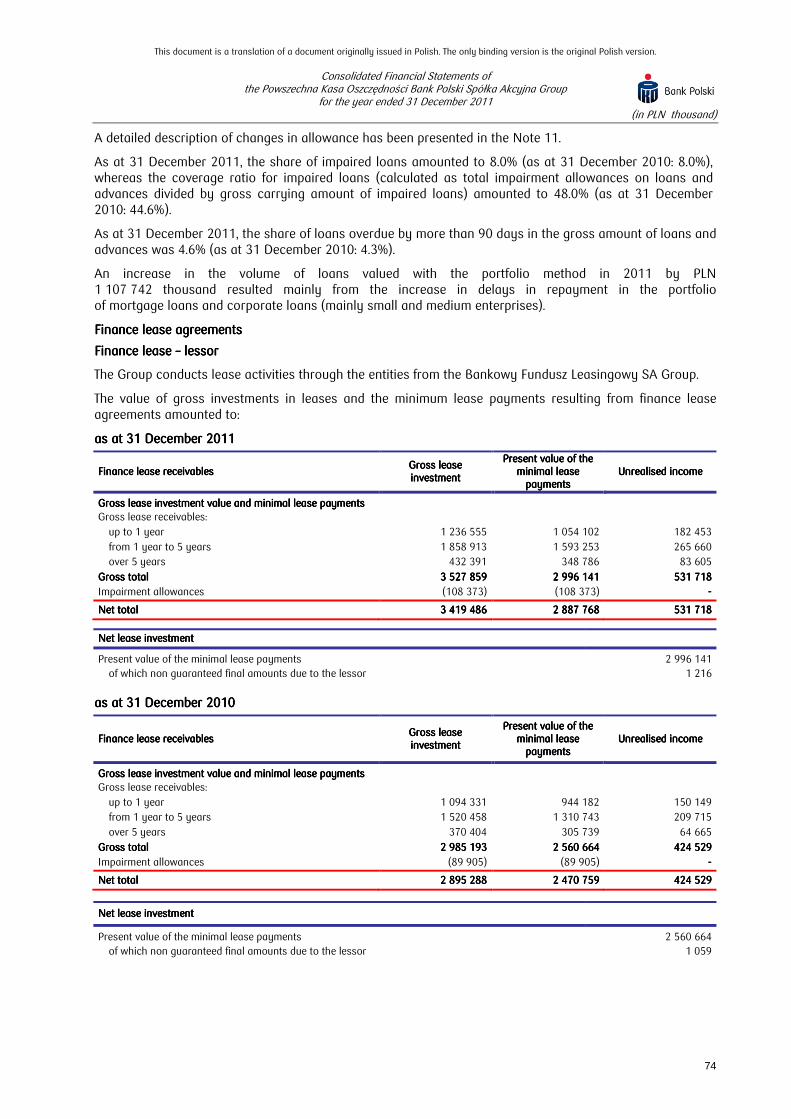
This document is a translation of a document originally issued in Polish. The only binding version is the original Polish version.
Consolidated Financial Statements of the Powszechna Kasa Oszczędności Bank Polski Spółka Akcyjna Group
for the year ended 31 December 2011 (in PLN thousand)
74
A detailed description of changes in allowance has been presented in the Note 11.
As at 31 December 2011, the share of impaired loans amounted to 8.0% (as at 31 December 2010: 8.0%), whereas the coverage ratio for impaired loans (calculated as total impairment allowances on loans and advances divided by gross carrying amount of impaired loans) amounted to 48.0% (as at 31 December 2010: 44.6%).
As at 31 December 2011, the share of loans overdue by more than 90 days in the gross amount of loans and advances was 4.6% (as at 31 December 2010: 4.3%).
An increase in the volume of loans valued with the portfolio method in 2011 by PLN 1 107 742 thousand resulted mainly from the increase in delays in repayment in the portfolio of mortgage loans and corporate loans (mainly small and medium enterprises).
Finance Finance Finance Finance lease agreementslease agreementslease agreementslease agreements
Finance lease Finance lease Finance lease Finance lease –––– lessorlessorlessorlessor
The Group conducts lease activities through the entities from the Bankowy Fundusz Leasingowy SA Group.
The value of gross investments in leases and the minimum lease payments resulting from finance lease agreements amounted to:
as at 31 December 2011as at 31 December 2011as at 31 December 2011as at 31 December 2011
Finance lease receivablesFinance lease receivablesFinance lease receivablesFinance lease receivables Gross lease Gross lease Gross lease Gross lease investmentinvestmentinvestmentinvestment
Present value of the Present value of the Present value of the Present value of the minimal lease minimal lease minimal lease minimal lease
paymentspaymentspaymentspayments Unrealised incomeUnrealised incomeUnrealised incomeUnrealised income
Gross lease investment value and minimal lease paymentsGross lease investment value and minimal lease paymentsGross lease investment value and minimal lease paymentsGross lease investment value and minimal lease payments
Gross lease receivables:
up to 1 year 1 236 555 1 054 102 182 453
from 1 year to 5 years 1 858 913 1 593 253 265 660
over 5 years 432 391 348 786 83 605
Gross totalGross totalGross totalGross total 3 527 859 3 527 859 3 527 859 3 527 859 2 996 141 2 996 141 2 996 141 2 996 141 531 718 531 718 531 718 531 718
Impairment allowances (108 373) (108 373) ----
Net total Net total Net total Net total 3 419 486 3 419 486 3 419 486 3 419 486 2 887 768 2 887 768 2 887 768 2 887 768 531 718 531 718 531 718 531 718 Net lease investmentNet lease investmentNet lease investmentNet lease investment
Present value of the minimal lease payments 2 996 141 of which non guaranteed final amounts due to the lessor 1 216
as at 31 December 2010as at 31 December 2010as at 31 December 2010as at 31 December 2010
Finance lease receivablesFinance lease receivablesFinance lease receivablesFinance lease receivables Gross lease Gross lease Gross lease Gross lease investmentinvestmentinvestmentinvestment
Present value of Present value of Present value of Present value of the the the the minimal lease minimal lease minimal lease minimal lease
paymentspaymentspaymentspayments Unrealised incomeUnrealised incomeUnrealised incomeUnrealised income
Gross lease investment value and minimal lease paymentsGross lease investment value and minimal lease paymentsGross lease investment value and minimal lease paymentsGross lease investment value and minimal lease payments
Gross lease receivables:
up to 1 year 1 094 331 944 182 150 149
from 1 year to 5 years 1 520 458 1 310 743 209 715
over 5 years 370 404 305 739 64 665
Gross totalGross totalGross totalGross total 2 985 193 2 985 193 2 985 193 2 985 193 2 560 664 2 560 664 2 560 664 2 560 664 424 529 424 529 424 529 424 529
Impairment allowances (89 905) (89 905) ----
Net total Net total Net total Net total 2 895 288 2 895 288 2 895 288 2 895 288 2 470 759 2 470 759 2 470 759 2 470 759 424 529 424 529 424 529 424 529
Net lease investmentNet lease investmentNet lease investmentNet lease investment
Present value of the minimal lease payments 2 560 664 of which non guaranteed final amounts due to the lessor 1 059
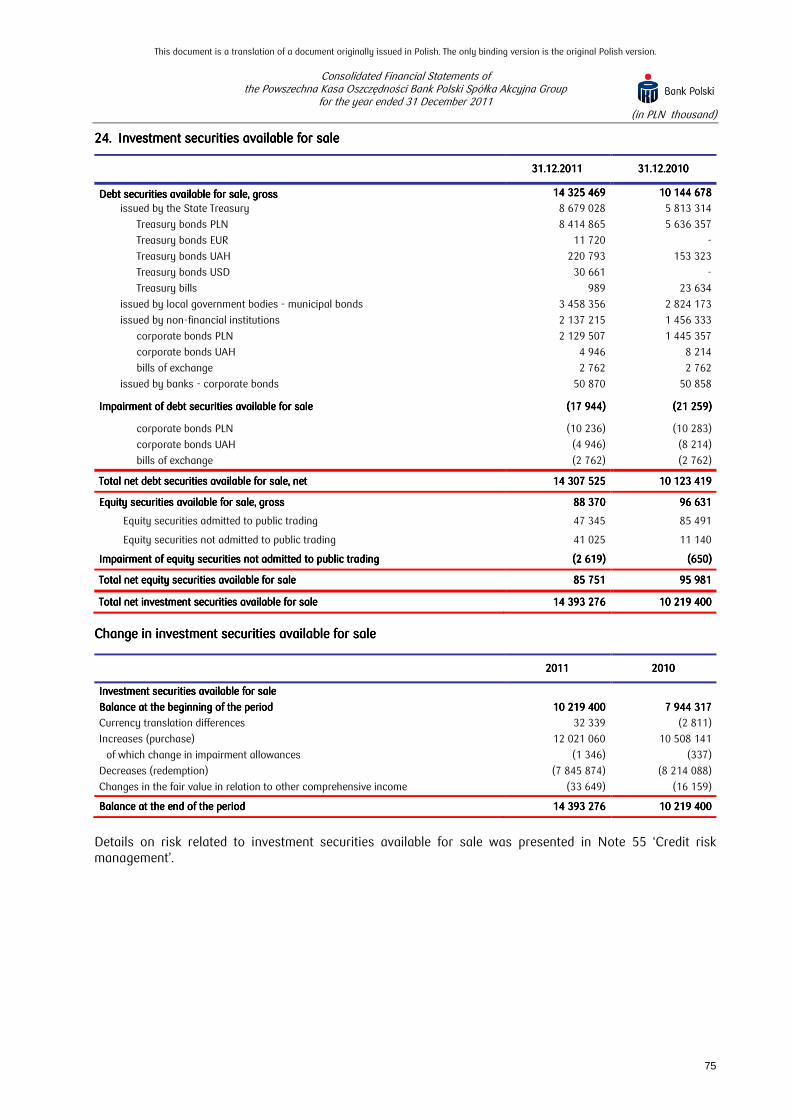
This document is a translation of a document originally issued in Polish. The only binding version is the original Polish version.
Consolidated Financial Statements of the Powszechna Kasa Oszczędności Bank Polski Spółka Akcyjna Group
for the year ended 31 December 2011 (in PLN thousand)
75
24.24.24.24. Investment securities available for saleInvestment securities available for saleInvestment securities available for saleInvestment securities available for sale
31.12.20131.12.20131.12.20131.12.2011111 31.12.2031.12.2031.12.2031.12.2010101010
Debt securities available for saleDebt securities available for saleDebt securities available for saleDebt securities available for sale,,,, grossgrossgrossgross 14 325 469 14 325 469 14 325 469 14 325 469 10 144 678 10 144 678 10 144 678 10 144 678
issued by the State Treasury 8 679 028 5 813 314
Treasury bonds PLN 8 414 865 5 636 357
Treasury bonds EUR 11 720 -
Treasury bonds UAH 220 793 153 323
Treasury bonds USD 30 661 -
Treasury bills 989 23 634
issued by local government bodies - municipal bonds 3 458 356 2 824 173
issued by non-financial institutions 2 137 215 1 456 333
corporate bonds PLN 2 129 507 1 445 357
corporate bonds UAH 4 946 8 214
bills of exchange 2 762 2 762
issued by banks - corporate bonds 50 870 50 858
Impairment of debt securities available for sale Impairment of debt securities available for sale Impairment of debt securities available for sale Impairment of debt securities available for sale (17 944)(17 944)(17 944)(17 944) (21 259)(21 259)(21 259)(21 259)
corporate bonds PLN (10 236) (10 283)
corporate bonds UAH (4 946) (8 214)
bills of exchange (2 762) (2 762)
Total net debt securities available for saleTotal net debt securities available for saleTotal net debt securities available for saleTotal net debt securities available for sale, net, net, net, net 14 307 525 14 307 525 14 307 525 14 307 525 10 123 419 10 123 419 10 123 419 10 123 419
Equity Equity Equity Equity securitiessecuritiessecuritiessecurities available for saleavailable for saleavailable for saleavailable for sale,,,, grossgrossgrossgross 88 370 88 370 88 370 88 370 96 631 96 631 96 631 96 631
Equity securities admitted to public trading 47 345 85 491
Equity securities not admitted to public trading 41 025 11 140
Impairment of equity securities not admitted to Impairment of equity securities not admitted to Impairment of equity securities not admitted to Impairment of equity securities not admitted to public tradingpublic tradingpublic tradingpublic trading (2 619)(2 619)(2 619)(2 619) (650)(650)(650)(650)
Total net equity securitiesTotal net equity securitiesTotal net equity securitiesTotal net equity securities available for sale available for sale available for sale available for sale 85 751 85 751 85 751 85 751 95 981 95 981 95 981 95 981
Total net investment securitiesTotal net investment securitiesTotal net investment securitiesTotal net investment securities available for saleavailable for saleavailable for saleavailable for sale 14 393 276 14 393 276 14 393 276 14 393 276 10 219 400 10 219 400 10 219 400 10 219 400
CCCChange in investment securities available for salehange in investment securities available for salehange in investment securities available for salehange in investment securities available for sale
2012012012011111 2020202010101010
Investment Investment Investment Investment securities available for salesecurities available for salesecurities available for salesecurities available for sale
Balance at the beginning of the periodBalance at the beginning of the periodBalance at the beginning of the periodBalance at the beginning of the period 10 219 400 10 219 400 10 219 400 10 219 400 7 944 317 7 944 317 7 944 317 7 944 317
Currency translation differences 32 339 (2 811)
Increases (purchase) 12 021 060 10 508 141
of which change in impairment allowances (1 346) (337)
Decreases (redemption) (7 845 874) (8 214 088)
Changes in the fair value in relation to other comprehensive income (33 649) (16 159)
Balance at the end of the periodBalance at the end of the periodBalance at the end of the periodBalance at the end of the period 14 393 276 14 393 276 14 393 276 14 393 276 10 219 400 10 219 400 10 219 400 10 219 400
Details on risk related to investment securities available for sale was presented in Note 55 ‘Credit risk management’.
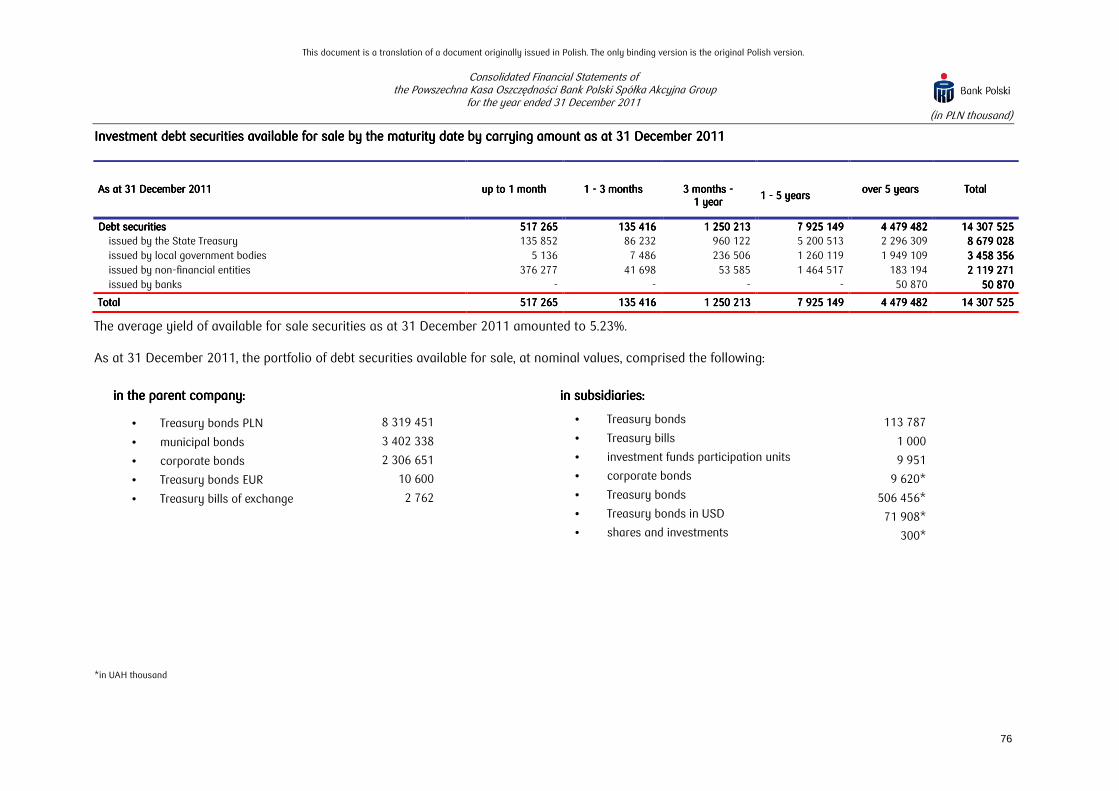
This document is a translation of a document originally issued in Polish. The only binding version is the original Polish version.
Consolidated Financial Statements of the Powszechna Kasa Oszczędności Bank Polski Spółka Akcyjna Group
for the year ended 31 December 2011 (in PLN thousand)
76
Investment Investment Investment Investment debt debt debt debt securities available for sale by the maturity date by carrying amountsecurities available for sale by the maturity date by carrying amountsecurities available for sale by the maturity date by carrying amountsecurities available for sale by the maturity date by carrying amount as at 31 December 2011as at 31 December 2011as at 31 December 2011as at 31 December 2011
As atAs atAs atAs at 31 December 20131 December 20131 December 20131 December 2011111 up to 1 monthup to 1 monthup to 1 monthup to 1 month 1 1 1 1 ---- 3 months3 months3 months3 months
3 months 3 months 3 months 3 months ---- 1 year1 year1 year1 year
1 1 1 1 ---- 5 years5 years5 years5 years
over 5 yearsover 5 yearsover 5 yearsover 5 years TotalTotalTotalTotal
DebtDebtDebtDebt securitiessecuritiessecuritiessecurities 517 265 517 265 517 265 517 265 135 416 135 416 135 416 135 416 1 250 213 1 250 213 1 250 213 1 250 213 7 925 149 7 925 149 7 925 149 7 925 149 4 479 482 4 479 482 4 479 482 4 479 482 14 307 525 14 307 525 14 307 525 14 307 525 issued by the State Treasury 135 852 86 232 960 122 5 200 513 2 296 309 8 679 028 8 679 028 8 679 028 8 679 028
issued by local government bodies 5 136 7 486 236 506 1 260 119 1 949 109 3 458 356 3 458 356 3 458 356 3 458 356
issued by non-financial entities 376 277 41 698 53 585 1 464 517 183 194 2 119 271 2 119 271 2 119 271 2 119 271
issued by banks - - - - 50 870 50 870 50 870 50 870 50 870
TotalTotalTotalTotal 517 265 517 265 517 265 517 265 135 416 135 416 135 416 135 416 1 250 213 1 250 213 1 250 213 1 250 213 7 925 149 7 925 149 7 925 149 7 925 149 4 479 482 4 479 482 4 479 482 4 479 482 14 307 525 14 307 525 14 307 525 14 307 525
The average yield of available for sale securities as at 31 December 2011 amounted to 5.23%.
As at 31 December 2011, the portfolio of debt securities available for sale, at nominal values, comprised the following:
in the parent company:in the parent company:in the parent company:in the parent company: in subsidiaries:in subsidiaries:in subsidiaries:in subsidiaries:
• Treasury bonds PLN 8 319 451 • Treasury bonds 113 787
• municipal bonds 3 402 338 • Treasury bills 1 000
• corporate bonds 2 306 651 • investment funds participation units 9 951
• Treasury bonds EUR 10 600 • corporate bonds 9 620*
• Treasury bills of exchange 2 762 • Treasury bonds 506 456*
• Treasury bonds in USD 71 908*
• shares and investments 300*
*in UAH thousand
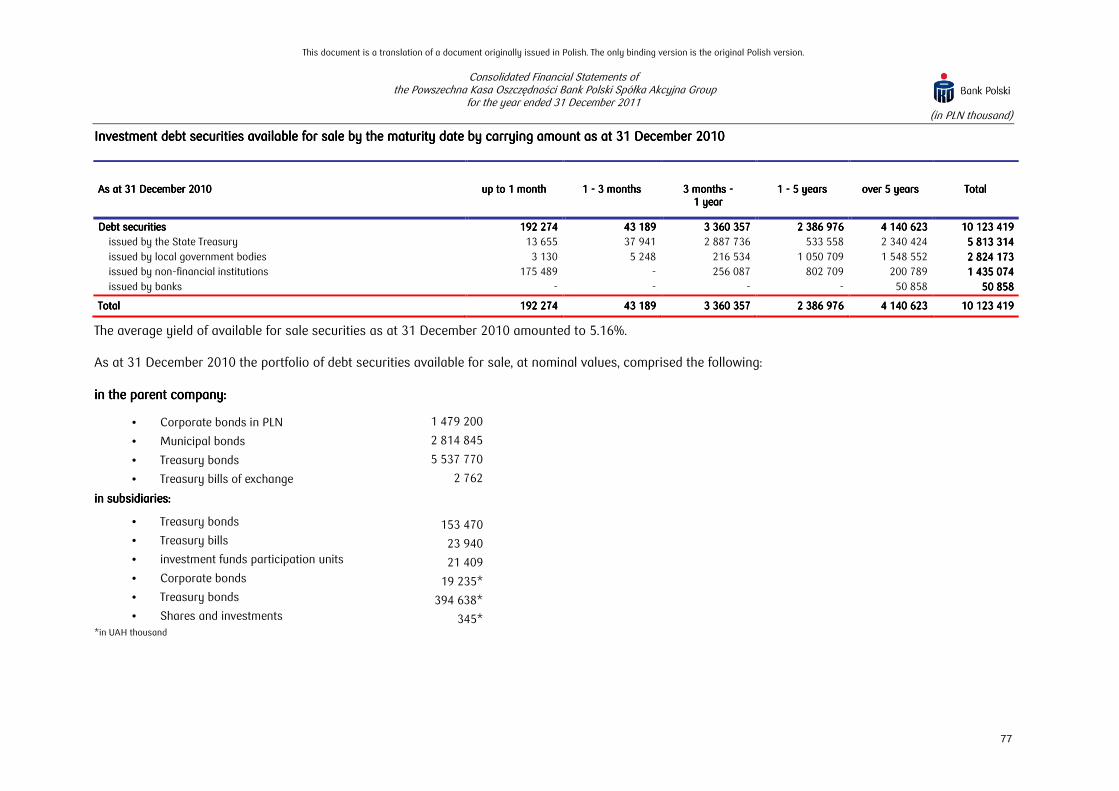
This document is a translation of a document originally issued in Polish. The only binding version is the original Polish version.
Consolidated Financial Statements of the Powszechna Kasa Oszczędności Bank Polski Spółka Akcyjna Group
for the year ended 31 December 2011 (in PLN thousand)
77
Investment debt securities available for sale by Investment debt securities available for sale by Investment debt securities available for sale by Investment debt securities available for sale by the maturity date by carrying amount as at 31 December 2010the maturity date by carrying amount as at 31 December 2010the maturity date by carrying amount as at 31 December 2010the maturity date by carrying amount as at 31 December 2010
As at 31 December 20As at 31 December 20As at 31 December 20As at 31 December 2010101010 up to 1 monthup to 1 monthup to 1 monthup to 1 month 1 1 1 1 ---- 3 months3 months3 months3 months
3 months 3 months 3 months 3 months ---- 1 year1 year1 year1 year
1 1 1 1 ---- 5 years5 years5 years5 years over 5 yearsover 5 yearsover 5 yearsover 5 years TotalTotalTotalTotal
DebtDebtDebtDebt securitiessecuritiessecuritiessecurities 192 274 192 274 192 274 192 274 43 189 43 189 43 189 43 189 3 360 357 3 360 357 3 360 357 3 360 357 2 386 976 2 386 976 2 386 976 2 386 976 4 140 623 4 140 623 4 140 623 4 140 623 10 123 419 10 123 419 10 123 419 10 123 419
issued by the State Treasury 13 655 37 941 2 887 736 533 558 2 340 424 5 813 314 5 813 314 5 813 314 5 813 314
issued by local government bodies 3 130 5 248 216 534 1 050 709 1 548 552 2 824 173 2 824 173 2 824 173 2 824 173
issued by non-financial institutions 175 489 - 256 087 802 709 200 789 1 435 074 1 435 074 1 435 074 1 435 074
issued by banks - - - - 50 858 50 858 50 858 50 858 50 858
TotalTotalTotalTotal 192 274 192 274 192 274 192 274 43 189 43 189 43 189 43 189 3 360 357 3 360 357 3 360 357 3 360 357 2 386 976 2 386 976 2 386 976 2 386 976 4 140 623 4 140 623 4 140 623 4 140 623 10 123 419 10 123 419 10 123 419 10 123 419
The average yield of available for sale securities as at 31 December 2010 amounted to 5.16%.
As at 31 December 2010 the portfolio of debt securities available for sale, at nominal values, comprised the following:
in the parent company:in the parent company:in the parent company:in the parent company:
• Corporate bonds in PLN 1 479 200
• Municipal bonds 2 814 845
• Treasury bonds 5 537 770
• Treasury bills of exchange 2 762
inininin subsidiaries:subsidiaries:subsidiaries:subsidiaries:
• Treasury bonds 153 470 • Treasury bills 23 940 • investment funds participation units 21 409 • Corporate bonds 19 235* • Treasury bonds 394 638* • Shares and investments 345*
*in UAH thousand

This document is a translation of a document originally issued in Polish. The only binding version is the original Polish version.
Consolidated Financial Statements of the Powszechna Kasa Oszczędności Bank Polski Spółka Akcyjna Group
for the year ended 31 December 2011 (in PLN thousand)
78
25.25.25.25. Investments in jointly controlled entitiesInvestments in jointly controlled entitiesInvestments in jointly controlled entitiesInvestments in jointly controlled entities and associatesand associatesand associatesand associates
a) the value of the Bank's investments in jointly controlled entities (i.e. the acquisition cost adjusted to the Bank’s share in the change in the entity’s net assets after acquisition date and impairment allowances)
Entity nameEntity nameEntity nameEntity name 31.12.201131.12.201131.12.201131.12.2011 31.12.201031.12.201031.12.201031.12.2010
Centrum Haffnera Sp. z o.o. Centrum Haffnera Sp. z o.o. Centrum Haffnera Sp. z o.o. Centrum Haffnera Sp. z o.o. GroupGroupGroupGroup 10 665 10 665 10 665 10 665 31 981 31 981 31 981 31 981
Purchase price 44 371 44 371
Change in valuation with equity method (33 706) (12 390)
Centrum Obsługi Biznesu Sp. z o.oCentrum Obsługi Biznesu Sp. z o.oCentrum Obsługi Biznesu Sp. z o.oCentrum Obsługi Biznesu Sp. z o.o 5 307 5 307 5 307 5 307 9 298 9 298 9 298 9 298
Purchase price 17 498 17 498
Change in valuation with equity method (12 191) (8 200)
TotalTotalTotalTotal 15 972 15 972 15 972 15 972 41 279 41 279 41 279 41 279
b) the value of the Bank's investments in associates (i.e. the acquisition cost adjusted to share in net assets change and impairment allowances)
Entity nameEntity nameEntity nameEntity name 31.12.201131.12.201131.12.201131.12.2011 31.12.201031.12.201031.12.201031.12.2010
Bank Pocztowy SABank Pocztowy SABank Pocztowy SABank Pocztowy SA 106 720 106 720 106 720 106 720 131 427 131 427 131 427 131 427
Purchase price 146 500 146 500
Change in valuation with equity method 44 198 40 098
Impairment allowances (83 978) (55 171)
Poznański Fundusz Poręczeń Kredytowych Sp. z o.o.Poznański Fundusz Poręczeń Kredytowych Sp. z o.o.Poznański Fundusz Poręczeń Kredytowych Sp. z o.o.Poznański Fundusz Poręczeń Kredytowych Sp. z o.o. - -
Purchase price 1 500 1 500
Change in valuation with equity method 3 475 3 467
Impairment allowances (4 975) (4 967)
Agencja Inwestycyjna CORPAgencja Inwestycyjna CORPAgencja Inwestycyjna CORPAgencja Inwestycyjna CORP----SA SA SA SA SA SA SA SA 427 427 427 427 225 225 225 225
Purchase price 29 29
Change in valuation with equity method 398 196
TotalTotalTotalTotal 107 147 107 147 107 147 107 147 131 652 131 652 131 652 131 652
Selected data on Selected data on Selected data on Selected data on associatesassociatesassociatesassociates accounted for using the equity methodaccounted for using the equity methodaccounted for using the equity methodaccounted for using the equity method
Entity nameEntity nameEntity nameEntity name Total assetsTotal assetsTotal assetsTotal assets Total Total Total Total
liabilitiesliabilitiesliabilitiesliabilities Total revenueTotal revenueTotal revenueTotal revenue Net profit Net profit Net profit Net profit % share% share% share% share
31.12.201131.12.201131.12.201131.12.2011 Bank Pocztowy SA Group 5 213 258 4 889 505 457 996 26 613 25.0001
Poznański Fundusz Poręczeń Kredytowych Sp. z o.o. 17 672 147 513 21 33.33
Agencja Inwestycyjna CORP-SA SA 3 874 1 833 12 459 1 109 22.31
TotalTotalTotalTotal 5 234 804 5 234 804 5 234 804 5 234 804 4 891 485 4 891 485 4 891 485 4 891 485 470 968 470 968 470 968 470 968 27 743 27 743 27 743 27 743 XXXX
31.12.201031.12.201031.12.201031.12.2010 Bank Pocztowy SA Group 4 156 609 3 835 948 369 797 14 412 25.0001
Poznański Fundusz Poręczeń Kredytowych Sp. z o.o. 16 896 45 604 32 33.33
Agencja Inwestycyjna CORP-SA SA 3 017 1 593 13 007 503 22.31
TotalTotalTotalTotal 4 176 522 4 176 522 4 176 522 4 176 522 3 837 586 3 837 586 3 837 586 3 837 586 383 408 383 408 383 408 383 408 14 947 14 947 14 947 14 947 XXXX
The information concerning Bank Pocztowy SA, presented in the table above is derived from consolidated financial statements prepared in accordance with the IFRS/IAS. Data about other companies is derived from financial statements prepared in accordance with the Polish Accounting Standards. According to the Group’s estimates, differences between the above-mentioned financial statements and the statements prepared in accordance with IFRS/IAS are not significant from the perspective of the financial statements of the Group. Data for the year 2010 is derived from audited financial statements.

This document is a translation of a document originally issued in Polish. The only binding version is the original Polish version.
Consolidated Financial Statements of the Powszechna Kasa Oszczędności Bank Polski Spółka Akcyjna Group
for the year ended 31 December 2011 (in PLN thousand)
79
Selected information on Selected information on Selected information on Selected information on jointly controlled entitiesjointly controlled entitiesjointly controlled entitiesjointly controlled entities accounaccounaccounaccounted for using the equity methodted for using the equity methodted for using the equity methodted for using the equity method
Entity nameEntity nameEntity nameEntity name Total Total Total Total
assetsassetsassetsassets Total liabilitiesTotal liabilitiesTotal liabilitiesTotal liabilities Total revenueTotal revenueTotal revenueTotal revenue Net profit Net profit Net profit Net profit % share% share% share% share
31.12.20131.12.20131.12.20131.12.2011111
Centrum Obsługi Biznesu Sp. z o.o. 122 199 107 940 22 275 (11 318) 41.44
Centrum Haffnera Sp. z o.o. Group 320 009 295 445 50 101 (46 586) 49.43
TotalTotalTotalTotal 442 208 442 208 442 208 442 208 403 385 403 385 403 385 403 385 72 376 72 376 72 376 72 376 (57 904)(57 904)(57 904)(57 904) XXXX
31.12.2031.12.2031.12.2031.12.2010101010
Centrum Obsługi Biznesu Sp. z o.o 124 979 98 835 20 151 (980) 41.44
Centrum Haffnera Sp. z o.o. Group 327 145 258 450 44 958 (11 262) 49.43
TotalTotalTotalTotal 452 124 452 124 452 124 452 124 357 285 357 285 357 285 357 285 65 109 65 109 65 109 65 109 (12 242)(12 242)(12 242)(12 242) XXXX
The information concerning Centrum Obsługi Biznesu Sp. z o.o. and Centrum Haffnera Sp. z o.o. Group, presented in the above table is derived from financial statements prepared in accordance with the Polish Accounting Standards. According to the Group’s estimates, differences between the above-mentioned financial statements and the statements prepared in accordance with IFRS/IAS are not significant from the perspective of the financial statements of the Group. Data of both entities for the year 2010 is derived from audited financial statements.
In the consolidated financial statements for the year ended 31 December 2011, all associates and jointly controlled entities are accounted for using the equity method.
2011201120112011 2010201020102010
Investments in associates at the beginning of the periodInvestments in associates at the beginning of the periodInvestments in associates at the beginning of the periodInvestments in associates at the beginning of the period 131 652 131 652 131 652 131 652 179 452 179 452 179 452 179 452
Share of profit/loss 5 655 7 146
Share in other comprehensive income of associates (1 233) 271
Dividends paid (112) (107)
Change in impairment allowances of investment (28 815) (55 110)
Investment in associates at the end of the periodInvestment in associates at the end of the periodInvestment in associates at the end of the periodInvestment in associates at the end of the period 107 147 107 147 107 147 107 147 131 652 131 652 131 652 131 652
In 2011, the Group increased an impairment allowances against shares of Bank Pocztowy SA of PLN 28 807 thousand and increased by PLN 8 thousand impairment allowances against shares of Poznański Fundusz Poręczeń Kredytowych Sp. z o.o. Impairment allowances against shares of Bank Pocztowy SA was recognised on the basis of the Company’s shares recoverable amount estimation, i.e. the value in use calculated on the basis of the discounted cash flows model for the years 2012-2016 and the fair value
estimation based on the market ratios of the peer group of banks.
In 2010, the Group recognised an impairment allowance against shares of Bank Pocztowy SA amounting to PLN 55 171 thousand and decreased by PLN 61 thousand impairment allowances against shares of Poznański Fundusz Poręczeń Kredytowych Sp. z o.o.
2012012012011111 2020202010101010
Investments in jointly controlled entities at the beginning of the periodInvestments in jointly controlled entities at the beginning of the periodInvestments in jointly controlled entities at the beginning of the periodInvestments in jointly controlled entities at the beginning of the period 41 279 41 279 41 279 41 279 49 240 49 240 49 240 49 240
Share of profit / loss (25 307) (7 961)
Investments in jointly controlled entities at the end of the periodInvestments in jointly controlled entities at the end of the periodInvestments in jointly controlled entities at the end of the periodInvestments in jointly controlled entities at the end of the period 15 972 15 972 15 972 15 972 41 279 41 279 41 279 41 279
As at 31 December 2011 and 31 December 2010, the parent company had no share in contingent liabilities and commitments of associates acquired jointly with other investors.
In 2011, PKO Bank Polski SA did not make any direct investments in jointly controlled entities or associates.

This document is a translation of a document originally issued in Polish. The only binding version is the original Polish version.
Consolidated Financial Statements of the Powszechna Kasa Oszczędności Bank Polski Spółka Akcyjna Group
for the year ended 31 December 2011 (in PLN thousand)
80
26.26.26.26. InventoriesInventoriesInventoriesInventories
Carrying amount of inventories by kind*Carrying amount of inventories by kind*Carrying amount of inventories by kind*Carrying amount of inventories by kind* 31.12.20131.12.20131.12.20131.12.2011111 31.12.2031.12.2031.12.2031.12.2010101010
Work-in-progress – construction investments 271 709 261 609 Finished goods - construction investments 216 851 195 817
Supplies 102 412 96 298
Materials 8 962 11 409
Impairment allowances on inventories (33 088) (34 858)
TTTTotalotalotalotal 566 846 566 846 566 846 566 846 530 275 530 275 530 275 530 275
* The balance relates mainly to expenses on real estate development incurred by the Group entities whose scope of activity relates to real estate development.
On 31 December 2011 and 31 December 2010 the Group had no inventories constituting collateral for liabilities to third parties.
27.27.27.27. Intangible assetsIntangible assetsIntangible assetsIntangible assets
For the year ended For the year ended For the year ended For the year ended 31 December 201131 December 201131 December 201131 December 2011
Development Development Development Development costscostscostscosts
SoftwareSoftwareSoftwareSoftware
Goodwill acquired Goodwill acquired Goodwill acquired Goodwill acquired as a result of business as a result of business as a result of business as a result of business
combinations (including combinations (including combinations (including combinations (including subsidiaries' goodwill)subsidiaries' goodwill)subsidiaries' goodwill)subsidiaries' goodwill)
OtherOtherOtherOther,,,, including including including including capital capital capital capital
expenditureexpenditureexpenditureexpenditure
TotalTotalTotalTotal
Net carrying amountNet carrying amountNet carrying amountNet carrying amount at the beginning of the periodat the beginning of the periodat the beginning of the periodat the beginning of the period 3 486 3 486 3 486 3 486 1 279 303 1 279 303 1 279 303 1 279 303 229 740 229 740 229 740 229 740 289 508 289 508 289 508 289 508 1 802 037 1 802 037 1 802 037 1 802 037
Taking control of a subsidiary - - 170 - 170 170 170 170
Purchases - 16 226 - 192 367 208 593 208 593 208 593 208 593
Sales and disposals - (659) - (558) (1 217)(1 217)(1 217)(1 217)
Impairment allowances - - (2 561) - (2 561)(2 561)(2 561)(2 561)
Currency translation differences on revaluation of foreign entities' operations results into the presentation currency
- 2 363 - - 2 363 2 363 2 363 2 363
Transfers - 358 071 - (358 071) ----
Amortisation - (206 598) - (4 474) (211 072)(211 072)(211 072)(211 072)
Other value changes - 1 987 - (292) 1 695 1 695 1 695 1 695
Net carrying amount Net carrying amount Net carrying amount Net carrying amount at the end of the periodat the end of the periodat the end of the periodat the end of the period 3 486 3 486 3 486 3 486 1 450 693 1 450 693 1 450 693 1 450 693 227 349 227 349 227 349 227 349 118 480 118 480 118 480 118 480 1 800 008 1 800 008 1 800 008 1 800 008
As at 1 January 2011 (at the beginning of the period)
Purchase price (gross carrying amount) 3 486 2 479 718 344 695 397 155 3 225 054 3 225 054 3 225 054 3 225 054
Accumulated amortisation and impairment allowances - (1 200 415) (114 955) (107 647) (1 423 017)(1 423 017)(1 423 017)(1 423 017)
Net carrying amountNet carrying amountNet carrying amountNet carrying amount 3 486 3 486 3 486 3 486 1 279 303 1 279 303 1 279 303 1 279 303 229 740 229 740 229 740 229 740 289 508 289 508 289 508 289 508 1 802 037 1 802 037 1 802 037 1 802 037
As at 31 December 2011 (at the end of the period)
Purchase price (gross carrying amount) 3 486 2 859 020 344 865 224 958 3 432 329 3 432 329 3 432 329 3 432 329
Accumulated amortisation and impairment allowances - (1 408 327) (117 516) (106 478) (1 632 321)(1 632 321)(1 632 321)(1 632 321)
Net carrying amountNet carrying amountNet carrying amountNet carrying amount 3 486 3 486 3 486 3 486 1 450 693 1 450 693 1 450 693 1 450 693 227 349 227 349 227 349 227 349 118 480 118 480 118 480 118 480 1 800 008 1 800 008 1 800 008 1 800 008
The most significant item of intangible assets of the Bank relates to expenditures on the Integrated Information System (ZSI). The cumulative capital expenditures incurred for the ZSI system during the years 2003–2011 amounted to PLN 1 134 893 thousand (during the years 2003–2010, they amounted to PLN 1 066 066 thousand).
As at 31 December 2011, the carrying amount of the Integrated Information System (ZSI) amounted to PLN 707 925 thousand. The expected useful life of the ZSI system is 15 years. As at 31 December 2011, the remaining useful life is 10 years.

This document is a translation of a document originally issued in Polish. The only binding version is the original Polish version.
Consolidated Financial Statements of the Powszechna Kasa Oszczędności Bank Polski Spółka Akcyjna Group
for the year ended 31 December 2011 (in PLN thousand)
81
For the year ended For the year ended For the year ended For the year ended 31 December 2031 December 2031 December 2031 December 2010101010
Development costsDevelopment costsDevelopment costsDevelopment costs SoftwareSoftwareSoftwareSoftware
Goodwill acquired Goodwill acquired Goodwill acquired Goodwill acquired as a result of business as a result of business as a result of business as a result of business
combinations (including combinations (including combinations (including combinations (including subsidiaries' goodwill)subsidiaries' goodwill)subsidiaries' goodwill)subsidiaries' goodwill)
OtherOtherOtherOther.... including including including including capital capital capital capital
expenditure expenditure expenditure expenditure TotalTotalTotalTotal
Net carrying amountNet carrying amountNet carrying amountNet carrying amount at the beginning of the periodat the beginning of the periodat the beginning of the periodat the beginning of the period 3 414 3 414 3 414 3 414 1 230 452 1 230 452 1 230 452 1 230 452 264 933 264 933 264 933 264 933 73 778 73 778 73 778 73 778 1 572 577 1 572 577 1 572 577 1 572 577
Purchases 58 15 002 - 463 096 478 156 478 156 478 156 478 156
Sales and disposals - (252) - (4 927) (5 179)(5 179)(5 179)(5 179)
Impairment allowances - - (35 193) (2 644) (37 837)(37 837)(37 837)(37 837)
Currency translation differences on revaluation of foreign entities' operations results into the presentation currency
- 394 - 7 401 401 401 401
Transfers - 240 132 - (240 132) ----
Amortisation - (190 135) - (3 533) (193 668)(193 668)(193 668)(193 668)
Other changes of value 14 (16 290) - 3 863 (12 413)(12 413)(12 413)(12 413)
Net carrying amount Net carrying amount Net carrying amount Net carrying amount at the end of the periodat the end of the periodat the end of the periodat the end of the period 3 486 3 486 3 486 3 486 1 279 303 1 279 303 1 279 303 1 279 303 229 740 229 740 229 740 229 740 289 508 289 508 289 508 289 508 1 802 037 1 802 037 1 802 037 1 802 037
As at 1 January 2010 (at the beginning of the period)
Purchase price (gross carrying amount) 3 414 2 254 339 344 695 180 126 2 782 574 2 782 574 2 782 574 2 782 574
Accumulated amortisation and impairment allowances - (1 023 887) (79 762) (106 348) (1 209 997)(1 209 997)(1 209 997)(1 209 997)
Net carrying amountNet carrying amountNet carrying amountNet carrying amount 3 414 3 414 3 414 3 414 1 230 452 1 230 452 1 230 452 1 230 452 264 933 264 933 264 933 264 933 73 778 73 778 73 778 73 778 1 572 577 1 572 577 1 572 577 1 572 577
As at 31 December 2010 (at the end of the period)
Purchase price (gross carrying amount) 3 486 2 479 718 344 695 397 155 3 225 054 3 225 054 3 225 054 3 225 054
Accumulated amortisation and impairment allowances - (1 200 415) (114 955) (107 647) (1 423 017)(1 423 017)(1 423 017)(1 423 017)
Net carrying amountNet carrying amountNet carrying amountNet carrying amount 3 486 3 486 3 486 3 486 1 279 303 1 279 303 1 279 303 1 279 303 229 740 229 740 229 740 229 740 289 508 289 508 289 508 289 508 1 802 037 1 802 037 1 802 037 1 802 037
The Group produced independently patents and licences of PLN 1 084 thousand. In the period from 1 January 2011 to 31 December 2011, the Group incurred capital expenditures for the purchase of tangible fixed assets and intangible assets in the amount of PLN 493 314 thousand (in the period from 1 January 2010 to 31 December 2010 PLN 630 492 thousand).
As at 31 December 2011 and as at 31 December 2010, there were no restrictions as regards the Group legal rights to intangible assets as cash flow hedges.
The table below presents data concerning goodwill included in the Group’s financial statements as at 31 December 2011 and 31 December 2010.
Net goodwillNet goodwillNet goodwillNet goodwill 31.12.20131.12.20131.12.20131.12.2011111 31.12.2031.12.2031.12.2031.12.2010101010
PKO Towarzystwo Funduszy Inwestycyjnych SA 149 564 149 564
PKO BP BANKOWY Powszechne Towarzystwo Emerytalne SA 51 158 51 158 Qualia spółka z ograniczoną odpowiedzialnością – Nowy Wilanów Sp.k.* 18 672 21 233
Centrum Finansowe Puławska Sp. z o.o. – in liquidation 7 785 7 785
Finansowa Kompania ‘Prywatne Inwestycje’ Sp. z o.o. 170 -
Total Total Total Total 227 349227 349227 349227 349 229 740229 740229 740229 740
* the Company was established as a result of transformation of the company PKO BP Inwestycje – Nowy Wilanów Sp. z o.o.
As at 31 December 2011, the Group conducted mandatory goodwill impairment tests in accordance with the model developed on the basis of the guidelines included in IAS 36 taking into consideration the specific nature of operations of particular entities.
The goodwill impairment testing model of PKO BP BANKOWY PTE SA was performed using the embedded value method, according to which the value in use of PKO Bank Polski SA’s share was determined, the goodwill impairment testing model of Centrum Finansowe Puławska Sp. z o.o.– in liquidation was performed by assessing the liquidation value of the Company, and the goodwill impairment testing models for other companies were based on discounted future cash flows and on the condition of continued holding of the shares.
As a result of the above-mentioned testing, consistently with the previous year, goodwill impairment allowance was recognised as a result of purchasing shares in PKO BP Inwestycje – Nowy Wilanów Sp. z o.o. (currently Qualia spółka z ograniczoną odpowiedzialnością – Nowy Wilanów Sp. k.) in the amount of PLN 2 561 thousand, i.e. in proportion to the disposed portion of cash generating units, to which the goodwill had been attributed (i.e. the project stage understood as an separate building or a complex of multi-apartment buildings constructed by the Company).
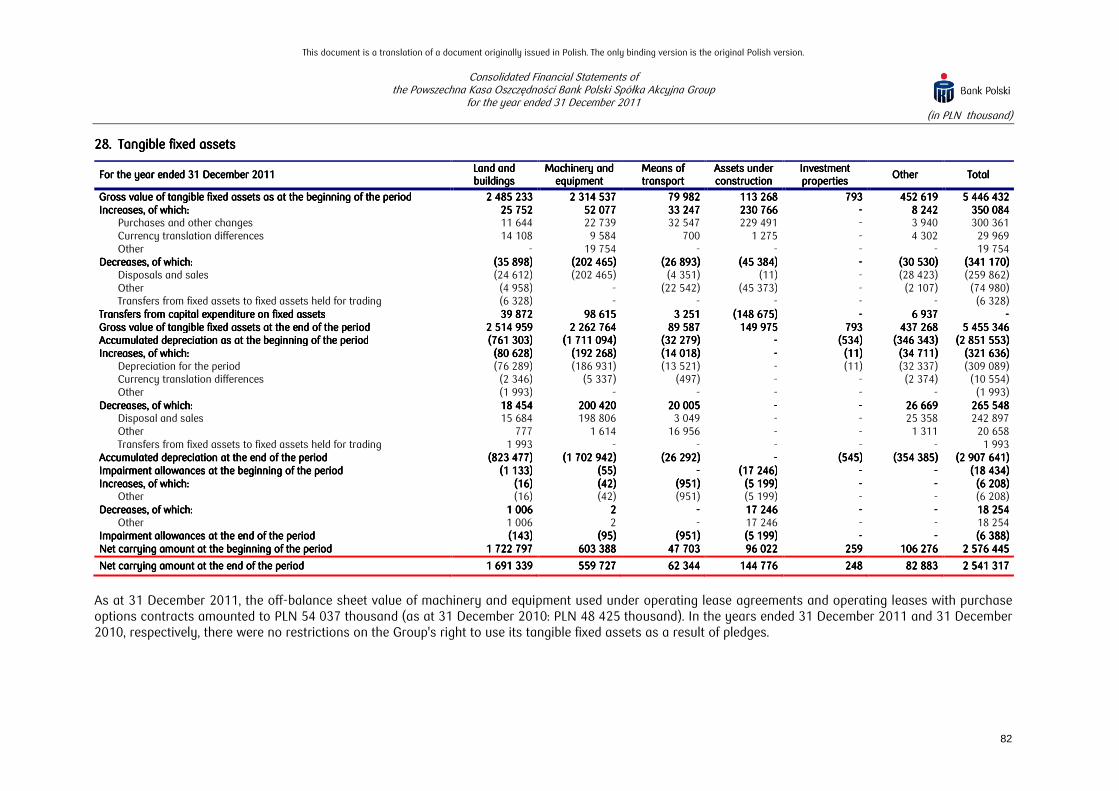
This document is a translation of a document originally issued in Polish. The only binding version is the original Polish version.
Consolidated Financial Statements of the Powszechna Kasa Oszczędności Bank Polski Spółka Akcyjna Group
for the year ended 31 December 2011 (in PLN thousand)
82
28.28.28.28. Tangible fixed assetsTangible fixed assetsTangible fixed assetsTangible fixed assets
For the year ended 31 December 2011For the year ended 31 December 2011For the year ended 31 December 2011For the year ended 31 December 2011 Land and Land and Land and Land and buildingsbuildingsbuildingsbuildings
Machinery and Machinery and Machinery and Machinery and equipmentequipmentequipmentequipment
Means of Means of Means of Means of transporttransporttransporttransport
Assets under Assets under Assets under Assets under constructionconstructionconstructionconstruction
InvesInvesInvesInvestment tment tment tment propertiespropertiespropertiesproperties
OtherOtherOtherOther TotalTotalTotalTotal
Gross value of tangible fixedGross value of tangible fixedGross value of tangible fixedGross value of tangible fixed assets as at the beginning of the periodassets as at the beginning of the periodassets as at the beginning of the periodassets as at the beginning of the period 2 485 233 2 485 233 2 485 233 2 485 233 2 314 537 2 314 537 2 314 537 2 314 537 79 982 79 982 79 982 79 982 113 268 113 268 113 268 113 268 793 793 793 793 452 619 452 619 452 619 452 619 5 446 432 5 446 432 5 446 432 5 446 432 Increases, of which:Increases, of which:Increases, of which:Increases, of which: 25 752 25 752 25 752 25 752 52 077 52 077 52 077 52 077 33 247 33 247 33 247 33 247 230 766 230 766 230 766 230 766 ---- 8 242 8 242 8 242 8 242 350 084 350 084 350 084 350 084
Purchases and other changes 11 644 22 739 32 547 229 491 - 3 940 300 361 Currency translation differences 14 108 9 584 700 1 275 - 4 302 29 969 Other - 19 754 - - - - 19 754
Decreases, of which:Decreases, of which:Decreases, of which:Decreases, of which: (35 898)(35 898)(35 898)(35 898) (202 465)(202 465)(202 465)(202 465) (26 893)(26 893)(26 893)(26 893) (45 384)(45 384)(45 384)(45 384) ---- (30 530)(30 530)(30 530)(30 530) (341 170)(341 170)(341 170)(341 170) Disposals and sales (24 612) (202 465) (4 351) (11) - (28 423) (259 862) Other (4 958) - (22 542) (45 373) - (2 107) (74 980) Transfers from fixed assets to fixed assets held for trading (6 328) - - - - - (6 328)
Transfers from capital expenditure on fixed assetsTransfers from capital expenditure on fixed assetsTransfers from capital expenditure on fixed assetsTransfers from capital expenditure on fixed assets 39 872 39 872 39 872 39 872 98 615 98 615 98 615 98 615 3 251 3 251 3 251 3 251 (148 675)(148 675)(148 675)(148 675) ---- 6 937 6 937 6 937 6 937 ---- Gross value of Gross value of Gross value of Gross value of tangible tangible tangible tangible fixed assets at the end of the periodfixed assets at the end of the periodfixed assets at the end of the periodfixed assets at the end of the period 2 514 959 2 514 959 2 514 959 2 514 959 2 262 764 2 262 764 2 262 764 2 262 764 89 587 89 587 89 587 89 587 149 975 149 975 149 975 149 975 793 793 793 793 437 268 437 268 437 268 437 268 5 455 346 5 455 346 5 455 346 5 455 346 Accumulated depreciation asAccumulated depreciation asAccumulated depreciation asAccumulated depreciation as at the beginning of the periodat the beginning of the periodat the beginning of the periodat the beginning of the period (761 303)(761 303)(761 303)(761 303) (1 711 094)(1 711 094)(1 711 094)(1 711 094) (32 279)(32 279)(32 279)(32 279) ---- (534)(534)(534)(534) (346 343)(346 343)(346 343)(346 343) (2 851 553)(2 851 553)(2 851 553)(2 851 553) Increases, of which:Increases, of which:Increases, of which:Increases, of which: (80 628)(80 628)(80 628)(80 628) (192 268)(192 268)(192 268)(192 268) (14 018)(14 018)(14 018)(14 018) ---- (11)(11)(11)(11) (34 711)(34 711)(34 711)(34 711) (321 636)(321 636)(321 636)(321 636)
Depreciation for the period (76 289) (186 931) (13 521) - (11) (32 337) (309 089) Currency translation differences (2 346) (5 337) (497) - - (2 374) (10 554) Other (1 993) - - - - - (1 993)
Decreases, of which:Decreases, of which:Decreases, of which:Decreases, of which: 18 454 18 454 18 454 18 454 200 420 200 420 200 420 200 420 20 005 20 005 20 005 20 005 ---- ---- 26 669 26 669 26 669 26 669 265 548 265 548 265 548 265 548 Disposal and sales 15 684 198 806 3 049 - - 25 358 242 897 Other 777 1 614 16 956 - - 1 311 20 658 Transfers from fixed assets to fixed assets held for trading 1 993 - - - - - 1 993
Accumulated depreciation at the end of the periodAccumulated depreciation at the end of the periodAccumulated depreciation at the end of the periodAccumulated depreciation at the end of the period (823 477)(823 477)(823 477)(823 477) (1 702 942)(1 702 942)(1 702 942)(1 702 942) (26 292)(26 292)(26 292)(26 292) ---- (545)(545)(545)(545) (354 385)(354 385)(354 385)(354 385) (2 907 641)(2 907 641)(2 907 641)(2 907 641) Impairment allowancesImpairment allowancesImpairment allowancesImpairment allowances at the beginning of the periodat the beginning of the periodat the beginning of the periodat the beginning of the period (1 133)(1 133)(1 133)(1 133) (55)(55)(55)(55) ---- (17 246)(17 246)(17 246)(17 246) ---- ---- (18 434)(18 434)(18 434)(18 434) Increases, of which:Increases, of which:Increases, of which:Increases, of which: (16)(16)(16)(16) (42)(42)(42)(42) (951)(951)(951)(951) (5 199)(5 199)(5 199)(5 199) ---- ---- (6 208)(6 208)(6 208)(6 208)
Other (16) (42) (951) (5 199) - - (6 208) Decreases, of which:Decreases, of which:Decreases, of which:Decreases, of which: 1 006 1 006 1 006 1 006 2 2 2 2 ---- 17 246 17 246 17 246 17 246 ---- ---- 18 254 18 254 18 254 18 254
Other 1 006 2 - 17 246 - - 18 254 Impairment allowances at the end of the periodImpairment allowances at the end of the periodImpairment allowances at the end of the periodImpairment allowances at the end of the period (143)(143)(143)(143) (95)(95)(95)(95) (951)(951)(951)(951) (5 199)(5 199)(5 199)(5 199) ---- ---- (6 388)(6 388)(6 388)(6 388) Net carrying amount at the beginning of the periodNet carrying amount at the beginning of the periodNet carrying amount at the beginning of the periodNet carrying amount at the beginning of the period 1 722 797 1 722 797 1 722 797 1 722 797 603 388 603 388 603 388 603 388 47 703 47 703 47 703 47 703 96 022 96 022 96 022 96 022 259 259 259 259 106 276 106 276 106 276 106 276 2 576 445 2 576 445 2 576 445 2 576 445
Net carrying amount at the end of the periodNet carrying amount at the end of the periodNet carrying amount at the end of the periodNet carrying amount at the end of the period 1 691 339 1 691 339 1 691 339 1 691 339 559 727 559 727 559 727 559 727 62 344 62 344 62 344 62 344 144 776 144 776 144 776 144 776 248 248 248 248 82 883 82 883 82 883 82 883 2 541 317 2 541 317 2 541 317 2 541 317
As at 31 December 2011, the off-balance sheet value of machinery and equipment used under operating lease agreements and operating leases with purchase options contracts amounted to PLN 54 037 thousand (as at 31 December 2010: PLN 48 425 thousand). In the years ended 31 December 2011 and 31 December 2010, respectively, there were no restrictions on the Group's right to use its tangible fixed assets as a result of pledges.
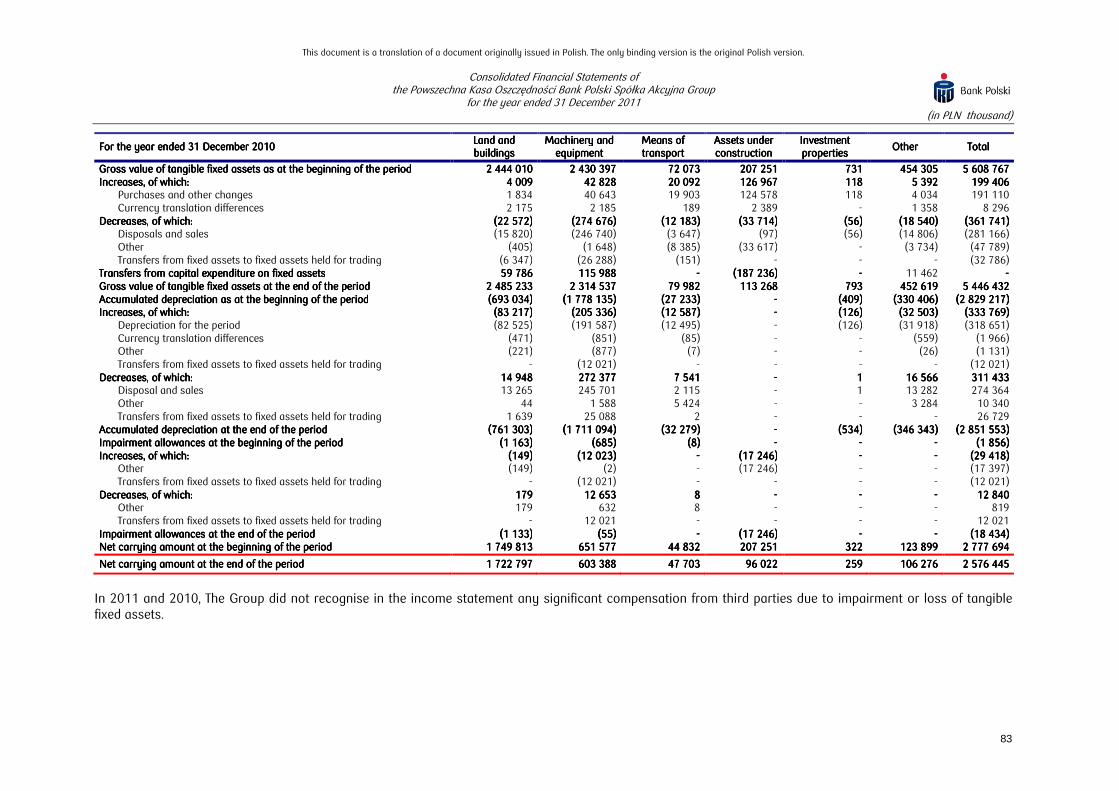
This document is a translation of a document originally issued in Polish. The only binding version is the original Polish version.
Consolidated Financial Statements of the Powszechna Kasa Oszczędności Bank Polski Spółka Akcyjna Group
for the year ended 31 December 2011 (in PLN thousand)
83
For the year ended 31 December 2010For the year ended 31 December 2010For the year ended 31 December 2010For the year ended 31 December 2010 Land and Land and Land and Land and buildingsbuildingsbuildingsbuildings
Machinery and Machinery and Machinery and Machinery and equipmentequipmentequipmentequipment
Means of Means of Means of Means of transporttransporttransporttransport
Assets under Assets under Assets under Assets under constructionconstructionconstructionconstruction
Investment Investment Investment Investment propertiespropertiespropertiesproperties
OtherOtherOtherOther TotalTotalTotalTotal
Gross value of tangibleGross value of tangibleGross value of tangibleGross value of tangible fixedfixedfixedfixed assets as at the beginning of the periodassets as at the beginning of the periodassets as at the beginning of the periodassets as at the beginning of the period 2 444 010 2 444 010 2 444 010 2 444 010 2 430 397 2 430 397 2 430 397 2 430 397 72 073 72 073 72 073 72 073 207 251 207 251 207 251 207 251 731 731 731 731 454 305 454 305 454 305 454 305 5 608 767 5 608 767 5 608 767 5 608 767 Increases,Increases,Increases,Increases, of which:of which:of which:of which: 4 009 4 009 4 009 4 009 42 828 42 828 42 828 42 828 20 092 20 092 20 092 20 092 126 967 126 967 126 967 126 967 118 118 118 118 5 392 5 392 5 392 5 392 199 406 199 406 199 406 199 406
Purchases and other changes 1 834 40 643 19 903 124 578 118 4 034 191 110 Currency translation differences 2 175 2 185 189 2 389 - 1 358 8 296
Decreases,Decreases,Decreases,Decreases, of which:of which:of which:of which: (22 572)(22 572)(22 572)(22 572) (274 676)(274 676)(274 676)(274 676) (12 183)(12 183)(12 183)(12 183) (33 714)(33 714)(33 714)(33 714) (56)(56)(56)(56) (18 540)(18 540)(18 540)(18 540) (361 741)(361 741)(361 741)(361 741) Disposals and sales (15 820) (246 740) (3 647) (97) (56) (14 806) (281 166) Other (405) (1 648) (8 385) (33 617) - (3 734) (47 789) Transfers from fixed assets to fixed assets held for trading (6 347) (26 288) (151) - - - (32 786)
Transfers from capital expenditure on fixed assetsTransfers from capital expenditure on fixed assetsTransfers from capital expenditure on fixed assetsTransfers from capital expenditure on fixed assets 59 786 59 786 59 786 59 786 115 988 115 988 115 988 115 988 ---- (187 (187 (187 (187 236)236)236)236) ---- 11 462 ---- Gross value of Gross value of Gross value of Gross value of tangible tangible tangible tangible fixed assets at the end of the periodfixed assets at the end of the periodfixed assets at the end of the periodfixed assets at the end of the period 2 485 233 2 485 233 2 485 233 2 485 233 2 314 537 2 314 537 2 314 537 2 314 537 79 982 79 982 79 982 79 982 113 268 113 268 113 268 113 268 793 793 793 793 452 619 452 619 452 619 452 619 5 446 432 5 446 432 5 446 432 5 446 432 Accumulated depreciation as at the beginning of the periodAccumulated depreciation as at the beginning of the periodAccumulated depreciation as at the beginning of the periodAccumulated depreciation as at the beginning of the period (693 034)(693 034)(693 034)(693 034) (1 778 135)(1 778 135)(1 778 135)(1 778 135) (27 233)(27 233)(27 233)(27 233) ---- (409)(409)(409)(409) (330 (330 (330 (330 406)406)406)406) (2 829 217)(2 829 217)(2 829 217)(2 829 217) Increases,Increases,Increases,Increases, of which:of which:of which:of which: (83 217)(83 217)(83 217)(83 217) (205 336)(205 336)(205 336)(205 336) (12 587)(12 587)(12 587)(12 587) ---- (126)(126)(126)(126) (32 503)(32 503)(32 503)(32 503) (333 769)(333 769)(333 769)(333 769)
Depreciation for the period (82 525) (191 587) (12 495) - (126) (31 918) (318 651) Currency translation differences (471) (851) (85) - - (559) (1 966) Other (221) (877) (7) - - (26) (1 131) Transfers from fixed assets to fixed assets held for trading - (12 021) - - - - (12 021)
Decreases,Decreases,Decreases,Decreases, of which:of which:of which:of which: 14 948 14 948 14 948 14 948 272 377 272 377 272 377 272 377 7 541 7 541 7 541 7 541 ---- 1 1 1 1 16 566 16 566 16 566 16 566 311 433 311 433 311 433 311 433 Disposal and sales 13 265 245 701 2 115 - 1 13 282 274 364 Other 44 1 588 5 424 - - 3 284 10 340 Transfers from fixed assets to fixed assets held for trading 1 639 25 088 2 - - - 26 729
Accumulated depreciation at the end of the periodAccumulated depreciation at the end of the periodAccumulated depreciation at the end of the periodAccumulated depreciation at the end of the period (761 303)(761 303)(761 303)(761 303) (1 711 094)(1 711 094)(1 711 094)(1 711 094) (32 279)(32 279)(32 279)(32 279) ---- (534)(534)(534)(534) (346 343)(346 343)(346 343)(346 343) (2 851 553)(2 851 553)(2 851 553)(2 851 553) Impairment allowancesImpairment allowancesImpairment allowancesImpairment allowances at the beginning of the periodat the beginning of the periodat the beginning of the periodat the beginning of the period (1 163)(1 163)(1 163)(1 163) (685)(685)(685)(685) (8)(8)(8)(8) ---- ---- ---- (1 856)(1 856)(1 856)(1 856) Increases,Increases,Increases,Increases, of which:of which:of which:of which: (149)(149)(149)(149) (12 023)(12 023)(12 023)(12 023) ---- (17 246)(17 246)(17 246)(17 246) ---- ---- (29 418)(29 418)(29 418)(29 418)
Other (149) (2) - (17 246) - - (17 397) Transfers from fixed assets to fixed assets held for trading - (12 021) - - - - (12 021)
Decreases,Decreases,Decreases,Decreases, of which:of which:of which:of which: 179 179 179 179 12 653 12 653 12 653 12 653 8 8 8 8 ---- ---- ---- 12 840 12 840 12 840 12 840 Other 179 632 8 - - - 819 Transfers from fixed assets to fixed assets held for trading - 12 021 - - - - 12 021
Impairment allowancesImpairment allowancesImpairment allowancesImpairment allowances at the end of the periodat the end of the periodat the end of the periodat the end of the period (1 133)(1 133)(1 133)(1 133) (55)(55)(55)(55) ---- (17 246)(17 246)(17 246)(17 246) ---- ---- (18 434)(18 434)(18 434)(18 434) Net carrying amount at the beginning of the periodNet carrying amount at the beginning of the periodNet carrying amount at the beginning of the periodNet carrying amount at the beginning of the period 1 749 813 1 749 813 1 749 813 1 749 813 651 577 651 577 651 577 651 577 44 832 44 832 44 832 44 832 207 251 207 251 207 251 207 251 322 322 322 322 123 899 123 899 123 899 123 899 2 777 694 2 777 694 2 777 694 2 777 694
Net carrying Net carrying Net carrying Net carrying amount at the end of the periodamount at the end of the periodamount at the end of the periodamount at the end of the period 1 722 797 1 722 797 1 722 797 1 722 797 603 388 603 388 603 388 603 388 47 703 47 703 47 703 47 703 96 022 96 022 96 022 96 022 259 259 259 259 106 276 106 276 106 276 106 276 2 576 445 2 576 445 2 576 445 2 576 445
In 2011 and 2010, The Group did not recognise in the income statement any significant compensation from third parties due to impairment or loss of tangible fixed assets.
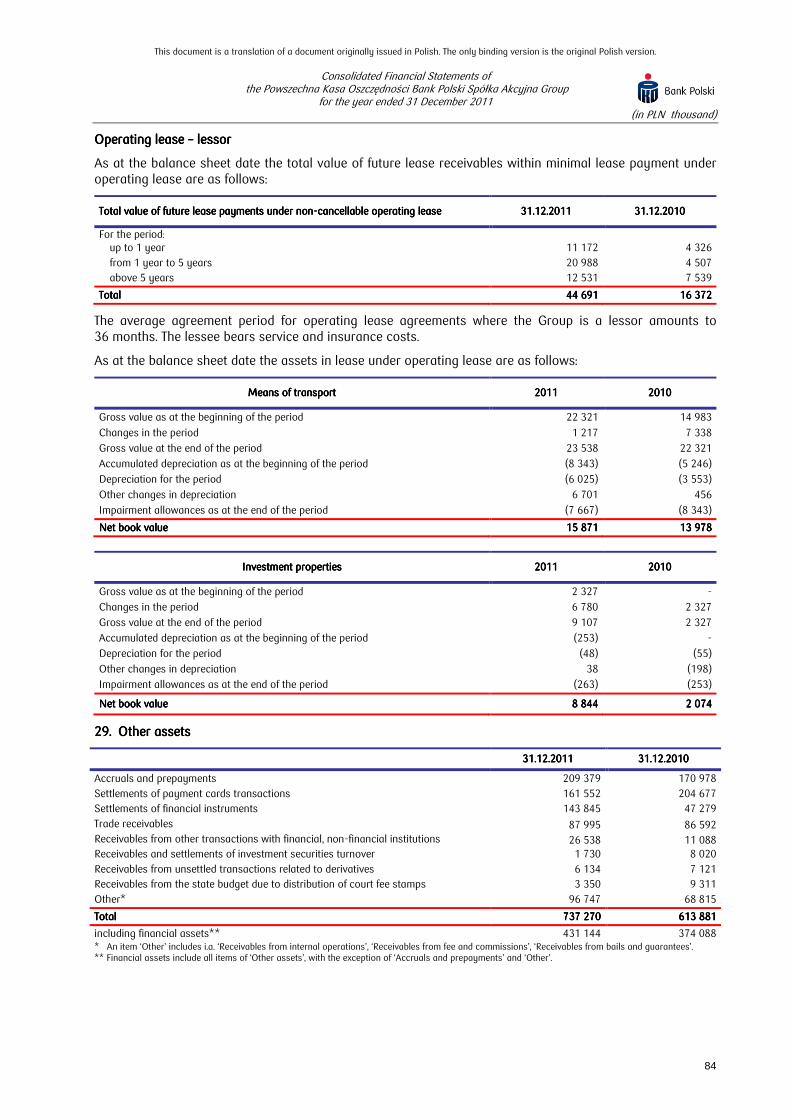
This document is a translation of a document originally issued in Polish. The only binding version is the original Polish version.
Consolidated Financial Statements of the Powszechna Kasa Oszczędności Bank Polski Spółka Akcyjna Group
for the year ended 31 December 2011 (in PLN thousand)
84
Operating lease Operating lease Operating lease Operating lease –––– lessorlessorlessorlessor
As at the balance sheet date the total value of future lease receivables within minimal lease payment under operating lease are as follows:
Total value of future lease payments under Total value of future lease payments under Total value of future lease payments under Total value of future lease payments under nonnonnonnon----cancellable operating leasecancellable operating leasecancellable operating leasecancellable operating lease 31.12.201131.12.201131.12.201131.12.2011 31.12.201031.12.201031.12.201031.12.2010
For the period: up to 1 year 11 172 4 326
from 1 year to 5 years 20 988 4 507
above 5 years 12 531 7 539
TotalTotalTotalTotal 44 69144 69144 69144 691 16 37216 37216 37216 372
The average agreement period for operating lease agreements where the Group is a lessor amounts to 36 months. The lessee bears service and insurance costs.
As at the balance sheet date the assets in lease under operating lease are as follows:
Means of transportMeans of transportMeans of transportMeans of transport 2011201120112011 2010201020102010
Gross value as at the beginning of the period 22 321 14 983
Changes in the period 1 217 7 338
Gross value at the end of the period 23 538 22 321
Accumulated depreciation as at the beginning of the period (8 343) (5 246)
Depreciation for the period (6 025) (3 553)
Other changes in depreciation 6 701 456
Impairment allowances as at the end of the period (7 667) (8 343)
Net book valueNet book valueNet book valueNet book value 15 87115 87115 87115 871 13 97813 97813 97813 978
Investment propertiesInvestment propertiesInvestment propertiesInvestment properties 2011201120112011 2010201020102010
Gross value as at the beginning of the period 2 327 -
Changes in the period 6 780 2 327
Gross value at the end of the period 9 107 2 327
Accumulated depreciation as at the beginning of the period (253) -
Depreciation for the period (48) (55)
Other changes in depreciation 38 (198)
Impairment allowances as at the end of the period (263) (253)
Net book valueNet book valueNet book valueNet book value 8 844 8 844 8 844 8 844 2 0742 0742 0742 074
29.29.29.29. Other assetsOther assetsOther assetsOther assets
31.12.20131.12.20131.12.20131.12.2011111 31.12.2031.12.2031.12.2031.12.2010101010
Accruals and prepayments 209 379 170 978
Settlements of payment cards transactions 161 552 204 677
Settlements of financial instruments 143 845 47 279
Trade receivables 87 995 86 592 Receivables from other transactions with financial, non-financial institutions 26 538 11 088 Receivables and settlements of investment securities turnover 1 730 8 020
Receivables from unsettled transactions related to derivatives 6 134 7 121
Receivables from the state budget due to distribution of court fee stamps 3 350 9 311
Other* 96 747 68 815
TotalTotalTotalTotal 737 270 737 270 737 270 737 270 613 881 613 881 613 881 613 881
including financial assets** 431 144 374 088 * An item ‘Other’ includes i.a. ‘Receivables from internal operations’, ‘Receivables from fee and commissions’, ‘Receivables from bails and guarantees’. ** Financial assets include all items of ‘Other assets’, with the exception of ‘Accruals and prepayments’ and ‘Other’.
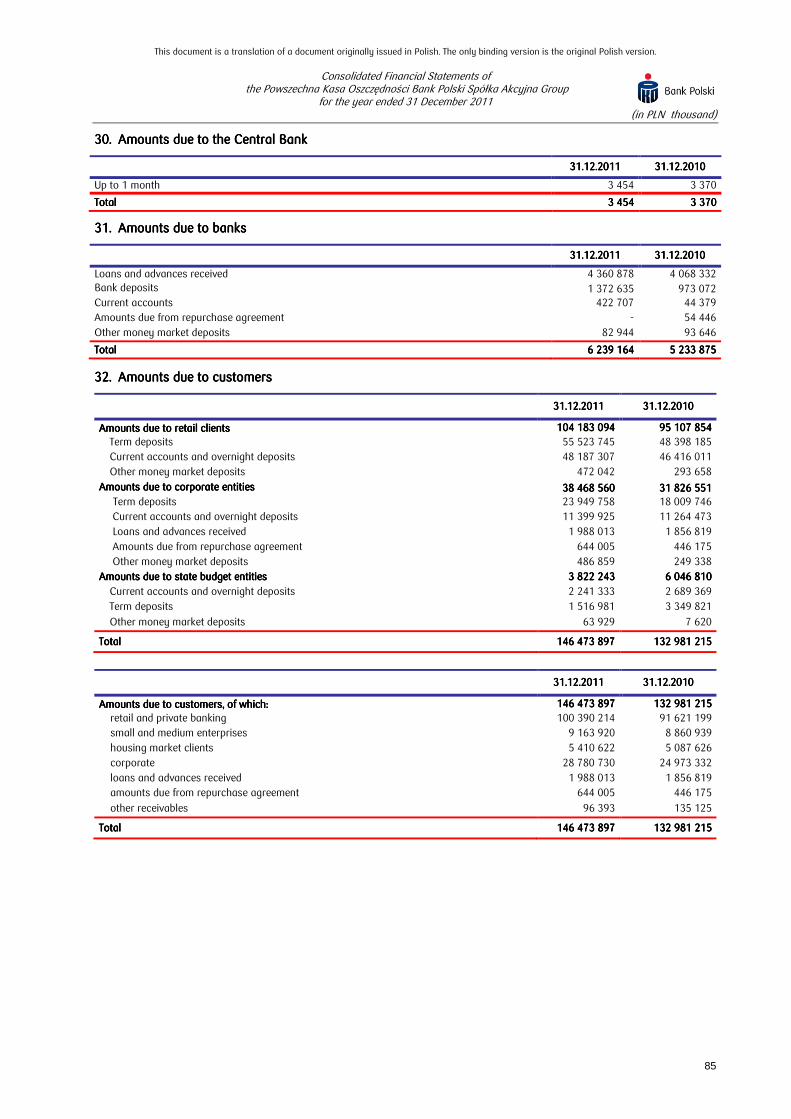
This document is a translation of a document originally issued in Polish. The only binding version is the original Polish version.
Consolidated Financial Statements of the Powszechna Kasa Oszczędności Bank Polski Spółka Akcyjna Group
for the year ended 31 December 2011 (in PLN thousand)
85
30.30.30.30. Amounts due to the Amounts due to the Amounts due to the Amounts due to the CCCCentral entral entral entral BBBBankankankank
31.12.20131.12.20131.12.20131.12.2011111 31.12.2031.12.2031.12.2031.12.2010101010
Up to 1 month 3 454 3 370
Total Total Total Total 3 454 3 454 3 454 3 454 3 370 3 370 3 370 3 370
31.31.31.31. Amounts due to banksAmounts due to banksAmounts due to banksAmounts due to banks
31.12.20131.12.20131.12.20131.12.2011111 31.12.2031.12.2031.12.2031.12.2010101010
Loans and advances received 4 360 878 4 068 332 Bank deposits 1 372 635 973 072 Current accounts 422 707 44 379
Amounts due from repurchase agreement - 54 446
Other money market deposits 82 944 93 646
Total Total Total Total 6 239 164 6 239 164 6 239 164 6 239 164 5 233 875 5 233 875 5 233 875 5 233 875
32.32.32.32. Amounts due to customersAmounts due to customersAmounts due to customersAmounts due to customers
31.12.201131.12.201131.12.201131.12.2011 31.12.201031.12.201031.12.201031.12.2010
Amounts Amounts Amounts Amounts due to retail clientsdue to retail clientsdue to retail clientsdue to retail clients 104 183 094 104 183 094 104 183 094 104 183 094 95 107 854 95 107 854 95 107 854 95 107 854
Term deposits 55 523 745 48 398 185
Current accounts and overnight deposits 48 187 307 46 416 011
Other money market deposits 472 042 293 658
Amounts due to corporate entitiesAmounts due to corporate entitiesAmounts due to corporate entitiesAmounts due to corporate entities 38 468 560 38 468 560 38 468 560 38 468 560 31 826 551 31 826 551 31 826 551 31 826 551 Term deposits 23 949 758 18 009 746
Current accounts and overnight deposits 11 399 925 11 264 473
Loans and advances received 1 988 013 1 856 819
Amounts due from repurchase agreement 644 005 446 175
Other money market deposits 486 859 249 338
Amounts due to state budget entitiesAmounts due to state budget entitiesAmounts due to state budget entitiesAmounts due to state budget entities 3 822 243 3 822 243 3 822 243 3 822 243 6 046 810 6 046 810 6 046 810 6 046 810
Current accounts and overnight deposits 2 241 333 2 689 369
Term deposits 1 516 981 3 349 821
Other money market deposits 63 929 7 620
TotalTotalTotalTotal 146 473 897 146 473 897 146 473 897 146 473 897 132 981 215 132 981 215 132 981 215 132 981 215
31.12.201131.12.201131.12.201131.12.2011 31.12.201031.12.201031.12.201031.12.2010
Amounts due to customers, of which:Amounts due to customers, of which:Amounts due to customers, of which:Amounts due to customers, of which: 146 473 897146 473 897146 473 897146 473 897 132 981 215132 981 215132 981 215132 981 215
retail and private banking 100 390 214 91 621 199
small and medium enterprises 9 163 920 8 860 939
housing market clients 5 410 622 5 087 626
corporate 28 780 730 24 973 332
loans and advances received 1 988 013 1 856 819
amounts due from repurchase agreement 644 005 446 175
other receivables 96 393 135 125
TotalTotalTotalTotal 146 473 897146 473 897146 473 897146 473 897 132 981 215132 981 215132 981 215132 981 215
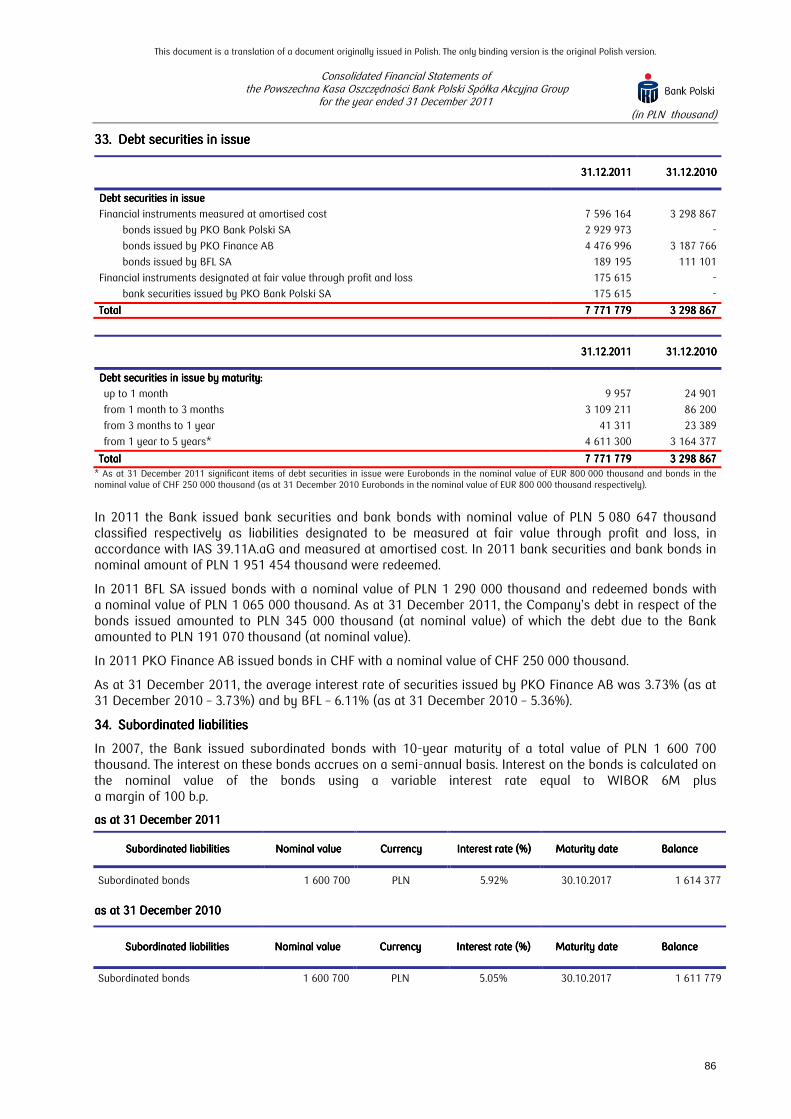
This document is a translation of a document originally issued in Polish. The only binding version is the original Polish version.
Consolidated Financial Statements of the Powszechna Kasa Oszczędności Bank Polski Spółka Akcyjna Group
for the year ended 31 December 2011 (in PLN thousand)
86
33.33.33.33. Debt securities in issueDebt securities in issueDebt securities in issueDebt securities in issue
33331.121.121.121.12.2011.2011.2011.2011 31.12.201031.12.201031.12.201031.12.2010
Debt securities in issueDebt securities in issueDebt securities in issueDebt securities in issue
Financial instruments measured at amortised cost 7 596 164 3 298 867
bonds issued by PKO Bank Polski SA 2 929 973 -
bonds issued by PKO Finance AB 4 476 996 3 187 766
bonds issued by BFL SA 189 195 111 101
Financial instruments designated at fair value through profit and loss 175 615 -
bank securities issued by PKO Bank Polski SA 175 615 -
Total Total Total Total 7 771 779 7 771 779 7 771 779 7 771 779 3 298 867 3 298 867 3 298 867 3 298 867
33331111....12121212.2011.2011.2011.2011 31.12.201031.12.201031.12.201031.12.2010
Debt securities in issue by maturityDebt securities in issue by maturityDebt securities in issue by maturityDebt securities in issue by maturity::::
up to 1 month 9 957 24 901
from 1 month to 3 months 3 109 211 86 200
from 3 months to 1 year 41 311 23 389
from 1 year to 5 years* 4 611 300 3 164 377
TotalTotalTotalTotal 7 771 779 7 771 779 7 771 779 7 771 779 3 298 867 3 298 867 3 298 867 3 298 867
* As at 31 December 2011 significant items of debt securities in issue were Eurobonds in the nominal value of EUR 800 000 thousand and bonds in the nominal value of CHF 250 000 thousand (as at 31 December 2010 Eurobonds in the nominal value of EUR 800 000 thousand respectively).
In 2011 the Bank issued bank securities and bank bonds with nominal value of PLN 5 080 647 thousand classified respectively as liabilities designated to be measured at fair value through profit and loss, in accordance with IAS 39.11A.aG and measured at amortised cost. In 2011 bank securities and bank bonds in nominal amount of PLN 1 951 454 thousand were redeemed.
In 2011 BFL SA issued bonds with a nominal value of PLN 1 290 000 thousand and redeemed bonds with a nominal value of PLN 1 065 000 thousand. As at 31 December 2011, the Company’s debt in respect of the bonds issued amounted to PLN 345 000 thousand (at nominal value) of which the debt due to the Bank amounted to PLN 191 070 thousand (at nominal value).
In 2011 PKO Finance AB issued bonds in CHF with a nominal value of CHF 250 000 thousand.
As at 31 December 2011, the average interest rate of securities issued by PKO Finance AB was 3.73% (as at 31 December 2010 – 3.73%) and by BFL – 6.11% (as at 31 December 2010 – 5.36%).
34.34.34.34. Subordinated liabilitiesSubordinated liabilitiesSubordinated liabilitiesSubordinated liabilities
In 2007, the Bank issued subordinated bonds with 10-year maturity of a total value of PLN 1 600 700 thousand. The interest on these bonds accrues on a semi-annual basis. Interest on the bonds is calculated on the nominal value of the bonds using a variable interest rate equal to WIBOR 6M plus a margin of 100 b.p.
aaaas at 31 December 201s at 31 December 201s at 31 December 201s at 31 December 2011111
Subordinated liabilitiesSubordinated liabilitiesSubordinated liabilitiesSubordinated liabilities Nominal valueNominal valueNominal valueNominal value CurrencyCurrencyCurrencyCurrency Interest rate (%)Interest rate (%)Interest rate (%)Interest rate (%) Maturity dateMaturity dateMaturity dateMaturity date BalanceBalanceBalanceBalance
Subordinated bonds 1 600 700 PLN 5.92% 30.10.2017 1 614 377
aaaas at 31 December 20s at 31 December 20s at 31 December 20s at 31 December 2010101010
Subordinated liabilitiesSubordinated liabilitiesSubordinated liabilitiesSubordinated liabilities Nominal valueNominal valueNominal valueNominal value CurrencyCurrencyCurrencyCurrency Interest rate (%)Interest rate (%)Interest rate (%)Interest rate (%) Maturity dateMaturity dateMaturity dateMaturity date BalanceBalanceBalanceBalance
Subordinated bonds 1 600 700 PLN 5.05% 30.10.2017 1 611 779

This document is a translation of a document originally issued in Polish. The only binding version is the original Polish version.
Consolidated Financial Statements of the Powszechna Kasa Oszczędności Bank Polski Spółka Akcyjna Group
for the year ended 31 December 2011 (in PLN thousand)
87
cccchange in subordinated liabilitieshange in subordinated liabilitieshange in subordinated liabilitieshange in subordinated liabilities
2012012012011111 2020202010101010
As at the beginning of the periodAs at the beginning of the periodAs at the beginning of the periodAs at the beginning of the period 1 611 779 1 611 779 1 611 779 1 611 779 1 612 178 1 612 178 1 612 178 1 612 178 Increases of accrued interest 87 125 82 191
Decreases of repayment of interest (84 527) (82 590)
Subordinated liabilities as at the end of the periodSubordinated liabilities as at the end of the periodSubordinated liabilities as at the end of the periodSubordinated liabilities as at the end of the period 1 614 377 1 614 377 1 614 377 1 614 377 1 611 779 1 611 779 1 611 779 1 611 779
35.35.35.35. Other liabilitiesOther liabilitiesOther liabilitiesOther liabilities
31.12.20131.12.20131.12.20131.12.2011111 31.12.2031.12.2031.12.2031.12.2010101010
Deferred income 305 372 345 302
Accounts payable 291 040 304 515
Other liabilitiesOther liabilitiesOther liabilitiesOther liabilities relatingrelatingrelatingrelating to:to:to:to: 1 854 351 1 854 351 1 854 351 1 854 351 1 443 017 1 443 017 1 443 017 1 443 017
interbank settlements 580 998 174 854
liabilities relating to settlements of security transactions 279 204 181 456
liabilities due to suppliers 195 740 162 137
liabilities relating to investment activities and internal operations 182 964 196 687
liabilities due to legal settlements 147 009 283 408
liabilities arising from foreign currency activities 140 546 131 849
financial instruments settlements 82 861 39 851
liabilities relating to payment cards 27 981 20 430
liabilities due to insurance companies 24 821 25 465
liabilities due to UOKiK (the Competition and Consumer Protection Office) 16 597 22 310 liabilities due to distribution of Treasury stamps 12 626 14 375 settlement of acquisition of machines, materials, works and services regarding construction of tangible assets
10 265 4 844
liabilities arising from transactions with financial and non-financial institutions 11 949 29 065
other* 140 790 156 286
TotalTotalTotalTotal 2 450 763 2 450 763 2 450 763 2 450 763 2 092 834 2 092 834 2 092 834 2 092 834
including financial liabilities** 1 857 592 1 307 838 * Item ‘other’ includes i.a. other liabilities related to bail and guarantees and liabilities related to trade of securities. ** Financial liabilities include all items of ‘Other liabilities’ with the exception of ‘Deferred income’, ‘Liabilities due to legal settlements’ and ‘Other’.
As at 31 December 2011 and 31 December 2010, none of the Group entities had overdue contractual liabilities.
36.36.36.36. ProvisionsProvisionsProvisionsProvisions
For the yearFor the yearFor the yearFor the year ended 31 December 201ended 31 December 201ended 31 December 201ended 31 December 2011111
Provision for Provision for Provision for Provision for legal claimslegal claimslegal claimslegal claims
Provisions for Provisions for Provisions for Provisions for anniversary anniversary anniversary anniversary bonuses and bonuses and bonuses and bonuses and retirement retirement retirement retirement benefitsbenefitsbenefitsbenefits
Provisions for Provisions for Provisions for Provisions for liabilities and liabilities and liabilities and liabilities and guarantees guarantees guarantees guarantees
grantedgrantedgrantedgranted
Other Other Other Other provisions*provisions*provisions*provisions*
TotalTotalTotalTotal
As at 1 January 2011, of which:As at 1 January 2011, of which:As at 1 January 2011, of which:As at 1 January 2011, of which: 7 4797 4797 4797 479 411 792411 792411 792411 792 82 32082 32082 32082 320 82 09982 09982 09982 099 583 690583 690583 690583 690
Short term provisionShort term provisionShort term provisionShort term provision 7 479 7 479 7 479 7 479 29 628 29 628 29 628 29 628 82 320 82 320 82 320 82 320 82 023 82 023 82 023 82 023 201 450201 450201 450201 450
Long term provisionLong term provisionLong term provisionLong term provision ---- 382 164 382 164 382 164 382 164 ---- 76 76 76 76 382 240 382 240 382 240 382 240 Increase of provision 399 36 257 168 270 8 656 213 582 213 582 213 582 213 582 Use of provision (114) - - (2 274) (2 388)(2 388)(2 388)(2 388)
Release of provision (4 126) (19 750) (138 905) (13 224) (176 005)(176 005)(176 005)(176 005) Currency translation differences - - 24 - 24 24 24 24
Other changes - - 261 - 261 261 261 261
As at 31 December 2011, of which:As at 31 December 2011, of which:As at 31 December 2011, of which:As at 31 December 2011, of which: 3 638 3 638 3 638 3 638 428 299 428 299 428 299 428 299 111 970 111 970 111 970 111 970 75 257 75 257 75 257 75 257 619 164 619 164 619 164 619 164
Short termShort termShort termShort term provisionprovisionprovisionprovision 3 638 3 638 3 638 3 638 38 232 38 232 38 232 38 232 111 970 111 970 111 970 111 970 75 257 75 257 75 257 75 257 229 097 229 097 229 097 229 097 Long termLong termLong termLong term provisionprovisionprovisionprovision ---- 390 067 390 067 390 067 390 067 ---- ---- 390 067 390 067 390 067 390 067
*Included in ‘Other provisions’ is i.a.: restructuring provision of PLN 63 636 thousand and provision of PLN 3 946 thousand for potential claims on impaired loans portfolios sold.
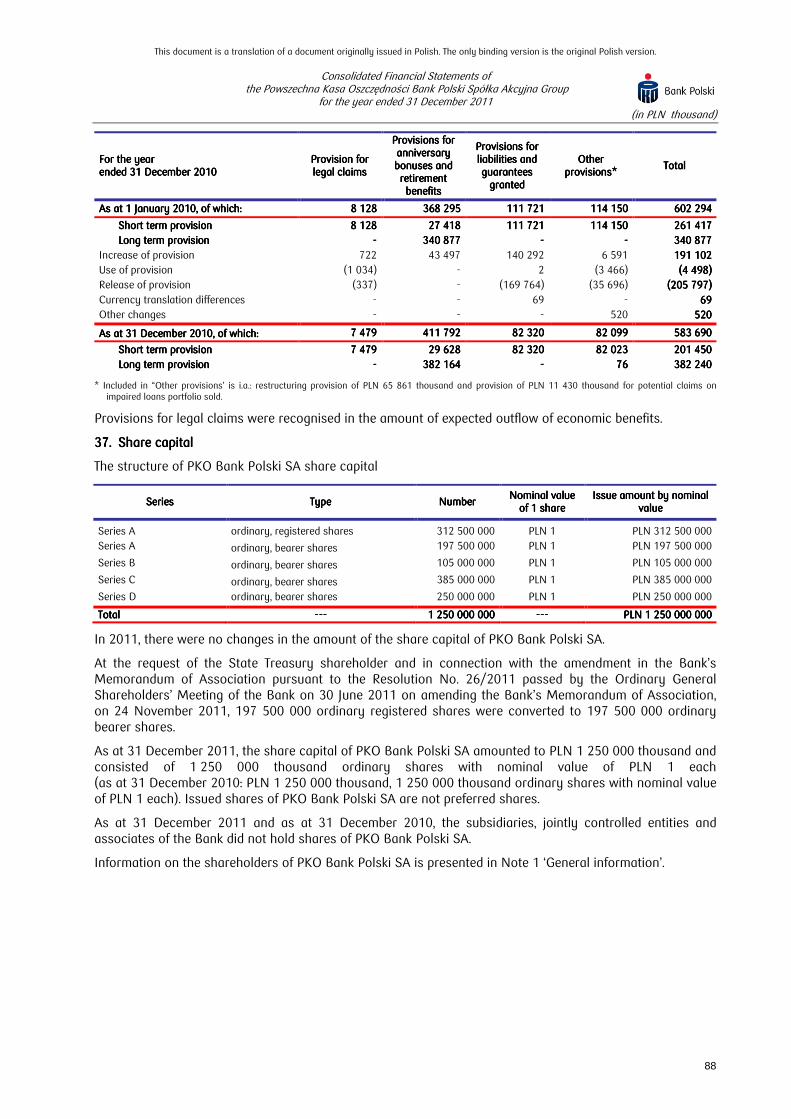
This document is a translation of a document originally issued in Polish. The only binding version is the original Polish version.
Consolidated Financial Statements of the Powszechna Kasa Oszczędności Bank Polski Spółka Akcyjna Group
for the year ended 31 December 2011 (in PLN thousand)
88
For the year For the year For the year For the year ended 31 December 20ended 31 December 20ended 31 December 20ended 31 December 2010101010
Provision for Provision for Provision for Provision for legal claimslegal claimslegal claimslegal claims
Provisions for Provisions for Provisions for Provisions for anniversary anniversary anniversary anniversary bonuses and bonuses and bonuses and bonuses and retirement retirement retirement retirement benefitsbenefitsbenefitsbenefits
Provisions for Provisions for Provisions for Provisions for liabilities and liabilities and liabilities and liabilities and guarantees guarantees guarantees guarantees
grantedgrantedgrantedgranted
Other Other Other Other provisions*provisions*provisions*provisions*
TotalTotalTotalTotal
As at 1 January 2010,As at 1 January 2010,As at 1 January 2010,As at 1 January 2010, of which:of which:of which:of which: 8 1288 1288 1288 128 368 295368 295368 295368 295 111 721111 721111 721111 721 114 150114 150114 150114 150 602 294602 294602 294602 294
Short termShort termShort termShort term provisionprovisionprovisionprovision 8 128 8 128 8 128 8 128 27 418 27 418 27 418 27 418 111 721 111 721 111 721 111 721 114 150 114 150 114 150 114 150 261 417261 417261 417261 417
Long termLong termLong termLong term provisionprovisionprovisionprovision ---- 340 877 340 877 340 877 340 877 ---- ---- 340 877 340 877 340 877 340 877
Increase of provision 722 43 497 140 292 6 591 191 102 191 102 191 102 191 102
Use of provision (1 034) - 2 (3 466) (4 498)(4 498)(4 498)(4 498)
Release of provision (337) - (169 764) (35 696) (205 797)(205 797)(205 797)(205 797)
Currency translation differences - - 69 - 69 69 69 69
Other changes - - - 520 520 520 520 520
As at 31 December 2010, of which:As at 31 December 2010, of which:As at 31 December 2010, of which:As at 31 December 2010, of which: 7 479 7 479 7 479 7 479 411 792 411 792 411 792 411 792 82 320 82 320 82 320 82 320 82 099 82 099 82 099 82 099 583 690 583 690 583 690 583 690
Short termShort termShort termShort term provisionprovisionprovisionprovision 7 479 7 479 7 479 7 479 29 628 29 628 29 628 29 628 82 320 82 320 82 320 82 320 82 023 82 023 82 023 82 023 201 450 201 450 201 450 201 450
Long termLong termLong termLong term provisionprovisionprovisionprovision ---- 382 164 382 164 382 164 382 164 ---- 76 76 76 76 382 240 382 240 382 240 382 240
* Included in “Other provisions’ is i.a.: restructuring provision of PLN 65 861 thousand and provision of PLN 11 430 thousand for potential claims on impaired loans portfolio sold.
Provisions for legal claims were recognised in the amount of expected outflow of economic benefits.
37.37.37.37. Share capitalShare capitalShare capitalShare capital
The structure of PKO Bank Polski SA share capital
SeriesSeriesSeriesSeries TypeTypeTypeType NumberNumberNumberNumber Nominal value Nominal value Nominal value Nominal value
of 1 shareof 1 shareof 1 shareof 1 share Issue Issue Issue Issue amount by nominal amount by nominal amount by nominal amount by nominal
valuevaluevaluevalue
Series A ordinary, registered shares 312 500 000 PLN 1 PLN 312 500 000
Series A ordinary, bearer shares 197 500 000 PLN 1 PLN 197 500 000
Series B ordinary, bearer shares 105 000 000 PLN 1 PLN 105 000 000
Series C ordinary, bearer shares 385 000 000 PLN 1 PLN 385 000 000
Series D ordinary, bearer shares 250 000 000 PLN 1 PLN 250 000 000
TotalTotalTotalTotal ------------ 1 250 000 000 1 250 000 000 1 250 000 000 1 250 000 000 ------------ PLN PLN PLN PLN 1 250 000 0001 250 000 0001 250 000 0001 250 000 000
In 2011, there were no changes in the amount of the share capital of PKO Bank Polski SA.
At the request of the State Treasury shareholder and in connection with the amendment in the Bank’s Memorandum of Association pursuant to the Resolution No. 26/2011 passed by the Ordinary General Shareholders’ Meeting of the Bank on 30 June 2011 on amending the Bank’s Memorandum of Association, on 24 November 2011, 197 500 000 ordinary registered shares were converted to 197 500 000 ordinary bearer shares.
As at 31 December 2011, the share capital of PKO Bank Polski SA amounted to PLN 1 250 000 thousand and consisted of 1 250 000 thousand ordinary shares with nominal value of PLN 1 each (as at 31 December 2010: PLN 1 250 000 thousand, 1 250 000 thousand ordinary shares with nominal value of PLN 1 each). Issued shares of PKO Bank Polski SA are not preferred shares.
As at 31 December 2011 and as at 31 December 2010, the subsidiaries, jointly controlled entities and associates of the Bank did not hold shares of PKO Bank Polski SA.
Information on the shareholders of PKO Bank Polski SA is presented in Note 1 ‘General information’.

This document is a translation of a document originally issued in Polish. The only binding version is the original Polish version.
Consolidated Financial Statements of the Powszechna Kasa Oszczędności Bank Polski Spółka Akcyjna Group
for the year ended 31 December 2011 (in PLN thousand)
89
38.38.38.38. Other capital Other capital Other capital Other capital
31.12.20131.12.20131.12.20131.12.2011111 31.12.2031.12.2031.12.2031.12.2010101010
Other capitalOther capitalOther capitalOther capital,,,, of which:of which:of which:of which: Reserve capital 13 041 390 12 212 177
Other reserves 3 460 368 3 412 239
General banking risk fund 1 070 000 1 070 000
Total other reservesTotal other reservesTotal other reservesTotal other reserves 17 571 758 17 571 758 17 571 758 17 571 758 16 694 416 16 694 416 16 694 416 16 694 416
Share in other comprehensive income of an associate (257) 976
Financial assets available for sale (52 422) (25 171)
Cash flow hedges 362 185 217 924
Total other capital from comprehensive incomeTotal other capital from comprehensive incomeTotal other capital from comprehensive incomeTotal other capital from comprehensive income 309 506 309 506 309 506 309 506 193 729 193 729 193 729 193 729
Total other capitalTotal other capitalTotal other capitalTotal other capital 17 881 264 17 881 264 17 881 264 17 881 264 16 888 145 16 888 145 16 888 145 16 888 145
OTHER NOTESOTHER NOTESOTHER NOTESOTHER NOTES
39.39.39.39. Transferred financial assets which do not qualify for derecognitionTransferred financial assets which do not qualify for derecognitionTransferred financial assets which do not qualify for derecognitionTransferred financial assets which do not qualify for derecognition from from from from consolidated consolidated consolidated consolidated statement of statement of statement of statement of financial positionfinancial positionfinancial positionfinancial position
As at 31 December 2011 and as at 31 December 2010, the Group did not hold any significant transferred financial assets in such a way that part or all of the financial assets would not qualify for derecognition from statement of financial position.
40.40.40.40. Pledged assetsPledged assetsPledged assetsPledged assets
The Group had the following pledged assets:
40.1.40.1.40.1.40.1. Liabilities from Liabilities from Liabilities from Liabilities from negative valuation of financial instrumentsnegative valuation of financial instrumentsnegative valuation of financial instrumentsnegative valuation of financial instruments
The collateral due to negative valuation of financial instruments comprises placements with banks. The amount of these assets as at 31 December 2011 amounted to PLN 435 957 thousand (as at 31 December 2010 PLN 825 718 thousand).
40.2.40.2.40.2.40.2. Liabilities from sellLiabilities from sellLiabilities from sellLiabilities from sell----buybuybuybuy----back transactions (SBB)back transactions (SBB)back transactions (SBB)back transactions (SBB)
31.12.20131.12.20131.12.20131.12.2011111 31.12.2031.12.2031.12.2031.12.2010101010
Treasury bonds:Treasury bonds:Treasury bonds:Treasury bonds:
nominal value 665 043 458 322
carrying amount 643 483 445 460
40.3.40.3.40.3.40.3. Bank deposit guarantee fundBank deposit guarantee fundBank deposit guarantee fundBank deposit guarantee fund
PKO Bank Polski SA contributes to a fund for the guarantee of retail deposits in accordance with Article 25 of the Act on the Bank Guarantee Fund (Bankowy Fundusz Gwarancyjny) dated 14 December 1994 (unified text Journal of Laws 2009, No. 84, item 711 with subsequent amendments).
31.12.20131.12.20131.12.20131.12.2011111 31.12.2031.12.2031.12.2031.12.2010101010
Value of the fund 535 226 489 891 Nominal value of pledge 565 000 515 000
Type of pledge Treasury bonds Treasury bonds
Maturity of the pledge 25.01.2021 25.01.2021
Carrying value of the pledged asset 555 135 506 992
The Bank’s contribution to the Bank Guarantee Fund is secured by Treasury bonds with maturities sufficient to secure their carrying amount over the period defined by the above Act. The Fund is increased or decreased on 1 July of each year, in proportion to the amount providing the basis for calculation of mandatory reserve deposits.
40.4.40.4.40.4.40.4. Guarantee Fund for the Settlement of Stock Exchange Transactions Guarantee Fund for the Settlement of Stock Exchange Transactions Guarantee Fund for the Settlement of Stock Exchange Transactions Guarantee Fund for the Settlement of Stock Exchange Transactions
Cash pledged as collateral for securities' transactions conducted by Dom Maklerski PKO BP SA (Brokerage House) are deposited in the National Depository for Securities (KDPW SA), as part of the Guarantee Fund for the Settlement of Stock Exchange Transactions.
31.12.20131.12.20131.12.20131.12.2011111 31.12.2031.12.2031.12.2031.12.2010101010
Guarantee Fund for the Settlement of Stock Exchange Transactions 3 923 6 950

This document is a translation of a document originally issued in Polish. The only binding version is the original Polish version.
Consolidated Financial Statements of the Powszechna Kasa Oszczędności Bank Polski Spółka Akcyjna Group
for the year ended 31 December 2011 (in PLN thousand)
90
Each direct participant who holds the status of settlements-making participant is obliged to make payments to the settlement fund which guarantees a proper settlement of the stock exchange transactions covered by that fund. The amount of the payments depends on the value of transactions made by each participant, and is updated by KDPW SA on a daily basis.
41.41.41.41. Contingent liabilities Contingent liabilities Contingent liabilities Contingent liabilities
UnderwritUnderwritUnderwritUnderwriting programsing programsing programsing programs
As at 31 December 2011, the Group's underwriting agreements covered the following securities (maximum liability of the Group to acquire securities):
Issuer of securities Issuer of securities Issuer of securities Issuer of securities underwrittenunderwrittenunderwrittenunderwritten
Type of underwritten Type of underwritten Type of underwritten Type of underwritten securitiessecuritiessecuritiessecurities
OffOffOffOff----balance sheet balance sheet balance sheet balance sheet liabilities resulting from liabilities resulting from liabilities resulting from liabilities resulting from underwriting agreementunderwriting agreementunderwriting agreementunderwriting agreement
Contract periodContract periodContract periodContract period SubSubSubSub----issue typeissue typeissue typeissue type
Company ACompany ACompany ACompany A corporate bonds 423 000 31.07.2013 Bonds Issue Agreement* Company BCompany BCompany BCompany B corporate bonds 136 013 31.12.2024 Bonds Issue Agreement* Company CCompany CCompany CCompany C corporate bonds 102 700 31.10.2013 Bonds Issue Agreement* Company DCompany DCompany DCompany D corporate bonds 24 900 30.12.2015 Bonds Issue Agreement* Company ECompany ECompany ECompany E corporate bonds 20 000 02.01.2012 Bonds Issue Agreement* Total Total Total Total 706 613706 613706 613706 613
* Relates to the Agreement for Organisation, Conducting and Servicing of the Bond Issuance Program.
As at 31 December 2010, the Group's underwriting agreements covered the following securities (maximum liability of the Group to acquire securities):
Issuer of securities Issuer of securities Issuer of securities Issuer of securities underwrittenunderwrittenunderwrittenunderwritten
Type of Type of Type of Type of underwritten underwritten underwritten underwritten securitiessecuritiessecuritiessecurities
OffOffOffOff----balance sweet balance sweet balance sweet balance sweet liabilities resulting from liabilities resulting from liabilities resulting from liabilities resulting from underwriting agreementunderwriting agreementunderwriting agreementunderwriting agreement
Contract periodContract periodContract periodContract period SubSubSubSub----issue typeissue typeissue typeissue type
Company ACompany ACompany ACompany A Corporate bonds 304 000 31.07.2013 Bonds Issue Agreement* Company ECompany ECompany ECompany E Corporate bonds 200 000 02.01.2012 Bonds Issue Agreement* Company BCompany BCompany BCompany B Corporate bonds 155 000 31.12.2024 Bonds Issue Agreement* Company DCompany DCompany DCompany D Corporate bonds 74 900 30.12.2015 Bonds Issue Agreement* Company FCompany FCompany FCompany F Corporate bonds 13 000 31.12.2018 Bonds Issue Agreement* Entity AEntity AEntity AEntity A Municipal bonds 4 000 31.12.2025 Bonds Issue Agreement* Total Total Total Total 750 900750 900750 900750 900
* Relates to the Agreement for Organisation, Conducting and Servicing of the Bond Issuance Program.
All securities of the Group under the sub-issue (underwriting) program have an unlimited transferability, are not listed on the stock exchange and are not traded on a regulated OTC market.
Contractual commitmentsContractual commitmentsContractual commitmentsContractual commitments
As at 31 December 2011 the value of contractual commitments concerning intangible assets amounted to PLN 98 233 thousand (as at 31 December 2010 the value of commitments amounted to PLN 1 100 thousand).
Granted lGranted lGranted lGranted loan commitmentsoan commitmentsoan commitmentsoan commitments
31.12.20131.12.20131.12.20131.12.2011111 31.12.2031.12.2031.12.2031.12.2010101010
Financial entities 1 144 993 752 074
Non-financial entities 28 486 768 27 747 336
State budged entities 823 897 1 005 614
TotalTotalTotalTotal 30 455 658 30 455 658 30 455 658 30 455 658 29 505 024 29 505 024 29 505 024 29 505 024
of which: irrevocable loan commitments 5 946 055 7 001 338
Granted loan commitments have been presented in nominal values.

This document is a translation of a document originally issued in Polish. The only binding version is the original Polish version.
Consolidated Financial Statements of the Powszechna Kasa Oszczędności Bank Polski Spółka Akcyjna Group
for the year ended 31 December 2011 (in PLN thousand)
91
Guarantees issuedGuarantees issuedGuarantees issuedGuarantees issued
31.12.20131.12.20131.12.20131.12.2011111 31.12.2031.12.2031.12.2031.12.2010101010
Financial entities 6 053 115 4 792 355
Non-financial entities 207 156 2 234 228 State budged entities 174 459 253 771
TotalTotalTotalTotal 6 434 730 6 434 730 6 434 730 6 434 730 7 280 354 7 280 354 7 280 354 7 280 354
In the years ended 31 December 2011 and 31 December 2010, the Bank and its subsidiaries did not issue any guarantees in respect of loans or advances and did not issue any guarantees to a single entity or a subsidiary thereof with a total value accounting for 10% of the Group’s equity.
Information on provisions for contingent guarantees and financial liabilities is included in Note 36 ‘Provisions’.
Contingent liabilities by maturity as at 31 December 201Contingent liabilities by maturity as at 31 December 201Contingent liabilities by maturity as at 31 December 201Contingent liabilities by maturity as at 31 December 2011111
UUUUp to 1 monthp to 1 monthp to 1 monthp to 1 month 1 1 1 1 ---- 3 months3 months3 months3 months 3 months3 months3 months3 months ---- 1 year1 year1 year1 year
1 1 1 1 ---- 5 years5 years5 years5 years Over Over Over Over
5 years5 years5 years5 years TotalTotalTotalTotal
Loan commitments 15 573 751 936 775 4 677 249 3 930 378 5 337 505 30 455 658 30 455 658 30 455 658 30 455 658
Guarantee liabilities issued 102 848 80 264 1 776 447 3 962 200 512 971 6 434 730 6 434 730 6 434 730 6 434 730
TotalTotalTotalTotal 15 676 599 15 676 599 15 676 599 15 676 599 1 017 039 1 017 039 1 017 039 1 017 039 6 453 696 6 453 696 6 453 696 6 453 696 7 892 578 7 892 578 7 892 578 7 892 578 5 850 476 5 850 476 5 850 476 5 850 476 36 890 388 36 890 388 36 890 388 36 890 388
Contingent liabilities by maturity as at 31 December 20Contingent liabilities by maturity as at 31 December 20Contingent liabilities by maturity as at 31 December 20Contingent liabilities by maturity as at 31 December 2010101010
UUUUp to 1 monthp to 1 monthp to 1 monthp to 1 month 1 1 1 1 ---- 3 months3 months3 months3 months 3 months3 months3 months3 months ---- 1 year1 year1 year1 year
1 1 1 1 ---- 5 years5 years5 years5 years OverOverOverOver
5 years5 years5 years5 years TotalTotalTotalTotal
Loan commitments 16 631 759 314 035 3 994 998 2 923 109 5 641 123 29 505 024 29 505 024 29 505 024 29 505 024
Guarantee liabilities issued 1 649 878 974 119 1 828 614 2 550 325 277 418 7 280 354 7 280 354 7 280 354 7 280 354
TotalTotalTotalTotal 18 281 63718 281 63718 281 63718 281 637 1 288 1541 288 1541 288 1541 288 154 5 823 6125 823 6125 823 6125 823 612 5 473 4345 473 4345 473 4345 473 434 5 918 5415 918 5415 918 5415 918 541 36 785 378 36 785 378 36 785 378 36 785 378
OffOffOffOff----balance sheetbalance sheetbalance sheetbalance sheet liabilitieliabilitieliabilitieliabilitiessss receivedreceivedreceivedreceived (by nominal amount)(by nominal amount)(by nominal amount)(by nominal amount)
31.12.20131.12.20131.12.20131.12.2011111 31.12.2031.12.2031.12.2031.12.2010101010
Financial 883 117 403 874
Guarantees 1 918 281 2 228 815
TotalTotalTotalTotal 2222 801 398801 398801 398801 398 2222 632 689632 689632 689632 689
Assets pledged as collateral for contingent liabilitiesAssets pledged as collateral for contingent liabilitiesAssets pledged as collateral for contingent liabilitiesAssets pledged as collateral for contingent liabilities
As at 31 December 2011 and as at 31 December 2010 the Group had no assets pledged as collateral for contingent liabilities.
Right to sell or pledge colRight to sell or pledge colRight to sell or pledge colRight to sell or pledge collateral established for the Grouplateral established for the Grouplateral established for the Grouplateral established for the Group
As at 31 December 2011 and as at 31 December 2010, there was no collateral established for the Group which the Group was entitled to sell or encumber with another pledge in the event of fulfilment of all obligations by the owner of the collateral.
42.42.42.42. Legal claimsLegal claimsLegal claimsLegal claims
As at 31 December 2011, the total value of court proceedings in which the PKO Bank Polski SA Group’s entities are a defendant was PLN 428 623 thousand, of which PLN 79 202 thousand refers to court proceedings in Ukraine (as at 31 December 2010 the total value of above mentioned court proceedings was PLN 315 447 thousand), while the total value of court proceedings in which the Group’s entities are the plaintiff was PLN 698 971 thousand, of which PLN 417 673 thousand referred to court proceedings in Ukraine, mainly related to collection of dues from loan agreements granted by KREDOBANK SA, (as at 31 December 2010 the total value of above mentioned court proceedings was PLN 312 731 thousand).

This document is a translation of a document originally issued in Polish. The only binding version is the original Polish version.
Consolidated Financial Statements of the Powszechna Kasa Oszczędności Bank Polski Spółka Akcyjna Group
for the year ended 31 December 2011 (in PLN thousand)
92
The most significant legal claims of the Group are described below:
a)a)a)a) uuuunfair competition proceedingsnfair competition proceedingsnfair competition proceedingsnfair competition proceedings The Bank is a party to proceedings initiated on the basis of a decision dated 23 April 2001 of the President of the Competition and Consumer Protection Office (Urząd Ochrony Konkurencji i Konsumentów - UOKiK) upon request of the Polish Trade and Distribution Organisation (Polska Organizacja Handlu i Dystrybucji - Związek Pracodawców) against the operators of the Visa and Europay payment systems and the banks issuing Visa and Europay/Eurocard/Mastercard banking cards. The claims under these proceedings relate to the use of practices limiting competition on the market of banking card payments in Poland, consisting of applying pre-agreed “interchange’ fees for transactions made using Visa and Europay/Eurocard/Mastercard cards as well as limiting access to this market by external entities. On 29 December 2006, UOKiK decided that the practices, consisting of joint establishment of interchange fee, did limit market competition and ordered that any such practices should be discontinued, and imposed a fine on, among others, PKO Bank Polski SA, in the amount of PLN 16 597 thousand. On 20 December 2011 a hearing was held during which no factual resolution of the appeals was reached. The Court obligated MasterCard to submit explanations concerning the issue and set the date for another sitting of the Court for 31 January 2012. The date of the hearing was appointed for 9 February 2012. In connection with the application of the plaintiffs’ attorney, including PKO Bank Polski SA, the court postponed the heating date for 24 April 2012. As at 31 December 2011 and as at 31 December 2010, the Bank had a liability in the above-mentioned amount.
b)b)b)b) llllegal claims inegal claims inegal claims inegal claims in KREDOBANK SAKREDOBANK SAKREDOBANK SAKREDOBANK SA
KREDOBANK SA is party to a court dispute with its Client who defaulted on a loan. On 31 January 2011 KREDOBANK SA instigated court proceedings against the above-mentioned Client in connection with the commencement of collection of loan dues, as a result of which the Client filed a counter-claim against KREDOBANK SA for annulling the loan agreements and collateral agreements.
The court accepted the client’s claim and determined the loan agreements invalid, in effect the Client is obliged to return to KREDOBANK SA the amount of loan received (UAH 40 860 thousand, i.e. PLN 17 386 thousand at the average NBP rate at the end of 2011), and KREDOBANK SA is obliged to return to the Client the amount of interest received (UAH 4 506.6 thousand, i.e. PLN 1 918 thousand at the average NBP rate at the end of 2011). The amounts due from the Customer were covered in the books of KREDOBANK SA by a 100% impairment allowance. In December 2011, the above-mentioned loan was transferred to Finansowa Kompania ’Prywatne Inwestycje’ Sp. z o.o. and as at 31 December 2011 a 100% impairment allowance was recorded against this impaired loan.
KREDOBANK SA is considering filing a motion for cassation to the Supreme Court of the Ukraine and for sending the case for reconsideration.
At the same time, having obtained a favourable court verdict, on 31 October 2011 the Client filed a claim against KREDOBANK SA for compensation for direct losses, loss of profits and moral losses. The claim is for the amount of UAH 185 million (i.e. PLN 79 million at the average NBP rate at the end of 2011). Court proceedings are pending on the case.
As at 31 December 2011 the Group did not recognise the provision for the above mentioned compensation claim.
c)c)c)c) rrrreeee----privatisation claims relating to properties helprivatisation claims relating to properties helprivatisation claims relating to properties helprivatisation claims relating to properties held by the Groupd by the Groupd by the Groupd by the Group
As at the date of these financial statements, five administrative proceedings are pending to invalidate decisions issued by public administration authorities with respect to properties held by the Bank and one administrative proceeding concerning a property acquired by the Bank in liquidation process of Centrum Finansowe Puławska Sp. z o.o. – in liquidation. These proceedings, in the event of an unfavourable outcome may result in re-privatisation claims and one administrative proceeding for the establishment of perpetual usufruct right to a property owned by the Bank. Given the current status of these proceedings as regards stating the invalidity of decisions and verdicts of public administration bodies, it is not possible to assess their potential negative financial effects for the Bank. Moreover, with respect to two properties of the Bank claims were submitted by their former owners (court proceedings are pending).

This document is a translation of a document originally issued in Polish. The only binding version is the original Polish version.
Consolidated Financial Statements of the Powszechna Kasa Oszczędności Bank Polski Spółka Akcyjna Group
for the year ended 31 December 2011 (in PLN thousand)
93
In the opinion of the Management Board of PKO Bank Polski SA, in 2012 the probability of significant claims arising against the Bank in relation to the above mentioned proceedings is remote.
43.43.43.43. Supplementary information to the Supplementary information to the Supplementary information to the Supplementary information to the consolidated cash flow statementconsolidated cash flow statementconsolidated cash flow statementconsolidated cash flow statement
Cash and cash equivalentsCash and cash equivalentsCash and cash equivalentsCash and cash equivalents
Cash and cash equivalents consist of cash on hand, cash on nostro accounts with the National Bank of Poland, current amounts due from banks, as well as other cash equivalents with maturities up to three months from the date of acquisition.
31.12.20131.12.20131.12.20131.12.2011111 31.12.2031.12.2031.12.2031.12.2010101010
Cash and balances with the central bank 9 142 168 6 182 412 Current receivables from banks 2 280 802 2 256 269
TotalTotalTotalTotal 11 422 970 11 422 970 11 422 970 11 422 970 8 438 681 8 438 681 8 438 681 8 438 681
Cash flow from interests and dividendsCash flow from interests and dividendsCash flow from interests and dividendsCash flow from interests and dividends,,,, both received and paid both received and paid both received and paid both received and paid
Interest income Interest income Interest income Interest income ---- receivedreceivedreceivedreceived 2011201120112011 2010201020102010
Income from loans and advances to customers 8 267 884 7 139 112
Income from securities designated upon initial recognition at fair value through profit and loss 596 387 473 267
Income from investment securities 469 357 513 639
Income from placements 237 962 164 434
Income from trading securities 74 675 133 245
Other interest received 1 395 908 2 596 549
TotalTotalTotalTotal 11 042 173 11 042 173 11 042 173 11 042 173 11 020 246 11 020 246 11 020 246 11 020 246
Interest expense Interest expense Interest expense Interest expense –––– paidpaidpaidpaid 2012012012011111 2020202010101010
Interest expense on deposits - paid (2 899 239) (3 111 424)
Interest expense on loans and advances - paid (183 479) (70 829)
Interest expense on debt securities in issue - paid (109 020) (101 423) Other interest paid (mainly premium from debt securities, interest expense on cash collateral liabilities, interest expense on current account of special purpose funds)
(1 117 954) (1 408 249)
TotalTotalTotalTotal (4 309 692)(4 309 692)(4 309 692)(4 309 692) (4 691 925)(4 691 925)(4 691 925)(4 691 925)
Dividend income Dividend income Dividend income Dividend income ---- receivedreceivedreceivedreceived 2011201120112011 2010201020102010
Dividend income from subsidiaries, jointly controlled entities and associates 87 228 104 232
Dividend income from other entities 6 800 5 663
Total Total Total Total 94 028 94 028 94 028 94 028 109 895 109 895 109 895 109 895
DividendDividendDividendDividend expensesexpensesexpensesexpenses ---- paidpaidpaidpaid 2011201120112011 2010201020102010
Dividend paid to shareholders of the parent company (2 475 000) (2 375 000)
Total Total Total Total (2 475 000)(2 475 000)(2 475 000)(2 475 000) (2 375 000)(2 375 000)(2 375 000)(2 375 000)
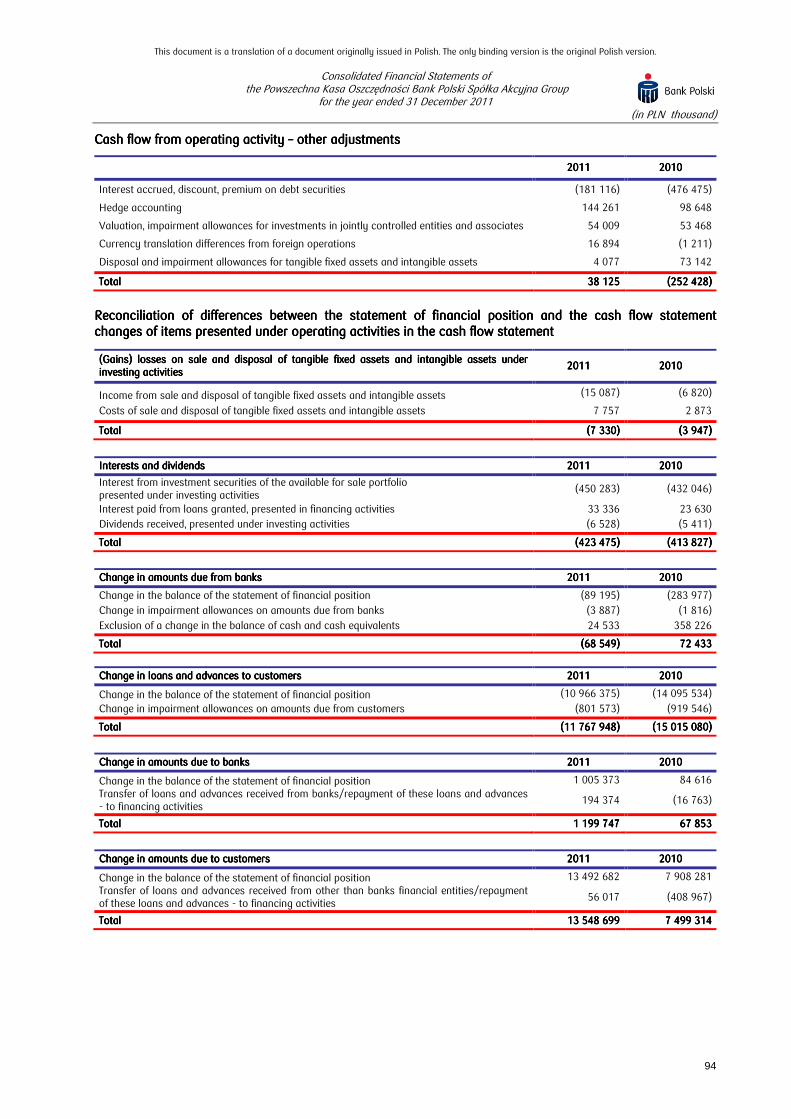
This document is a translation of a document originally issued in Polish. The only binding version is the original Polish version.
Consolidated Financial Statements of the Powszechna Kasa Oszczędności Bank Polski Spółka Akcyjna Group
for the year ended 31 December 2011 (in PLN thousand)
94
Cash flow from operating activity Cash flow from operating activity Cash flow from operating activity Cash flow from operating activity –––– other other other other adjustmentsadjustmentsadjustmentsadjustments
2011201120112011 2010201020102010
Interest accrued, discount, premium on debt securities (181 116) (476 475)
Hedge accounting 144 261 98 648
Valuation, impairment allowances for investments in jointly controlled entities and associates 54 009 53 468
Currency translation differences from foreign operations 16 894 (1 211)
Disposal and impairment allowances for tangible fixed assets and intangible assets 4 077 73 142
TotalTotalTotalTotal 38 125 38 125 38 125 38 125 (252 428)(252 428)(252 428)(252 428)
Reconciliation of differences Reconciliation of differences Reconciliation of differences Reconciliation of differences betweenbetweenbetweenbetween the statement of financial position and the cash flow statement the statement of financial position and the cash flow statement the statement of financial position and the cash flow statement the statement of financial position and the cash flow statement changes of items presented under operating activities in the cash flow statementchanges of items presented under operating activities in the cash flow statementchanges of items presented under operating activities in the cash flow statementchanges of items presented under operating activities in the cash flow statement
((((GainsGainsGainsGains) losses) losses) losses) losses on sale and disposal of tangible fixed assets and intangible assets under on sale and disposal of tangible fixed assets and intangible assets under on sale and disposal of tangible fixed assets and intangible assets under on sale and disposal of tangible fixed assets and intangible assets under investing activitiesinvesting activitiesinvesting activitiesinvesting activities
2012012012011111 2020202010101010
Income from sale and disposal of tangible fixed assets and intangible assets (15 087) (6 820)
Costs of sale and disposal of tangible fixed assets and intangible assets 7 757 2 873
TotalTotalTotalTotal (7 330)(7 330)(7 330)(7 330) (3 947)(3 947)(3 947)(3 947)
Interests and dividendsInterests and dividendsInterests and dividendsInterests and dividends 2012012012011111 2020202010101010
Interest from investment securities of the available for sale portfolio presented under investing activities
(450 283) (432 046)
Interest paid from loans granted, presented in financing activities 33 336 23 630
Dividends received, presented under investing activities (6 528) (5 411)
TotalTotalTotalTotal (423 475)(423 475)(423 475)(423 475) (413 827)(413 827)(413 827)(413 827)
ChangeChangeChangeChange in amounts due from banksin amounts due from banksin amounts due from banksin amounts due from banks 2012012012011111 2020202010101010
Change in the balance of the statement of financial position (89 195) (283 977)
Change in impairment allowances on amounts due from banks (3 887) (1 816)
Exclusion of a change in the balance of cash and cash equivalents 24 533 358 226
TotalTotalTotalTotal (68 549)(68 549)(68 549)(68 549) 72 433 72 433 72 433 72 433
ChangeChangeChangeChange in loans and advances to customersin loans and advances to customersin loans and advances to customersin loans and advances to customers 2012012012011111 2020202010101010
Change in the balance of the statement of financial position (10 966 375) (14 095 534)
Change in impairment allowances on amounts due from customers (801 573) (919 546)
TotalTotalTotalTotal (11 767 948)(11 767 948)(11 767 948)(11 767 948) (15 015 080)(15 015 080)(15 015 080)(15 015 080)
Change in amounts due to banksChange in amounts due to banksChange in amounts due to banksChange in amounts due to banks 2011201120112011 2010201020102010
Change in the balance of the statement of financial position 1 005 373 84 616 Transfer of loans and advances received from banks/repayment of these loans and advances - to financing activities
194 374 (16 763)
TotalTotalTotalTotal 1 199 747 1 199 747 1 199 747 1 199 747 67 853 67 853 67 853 67 853
Change in amounts due to customersChange in amounts due to customersChange in amounts due to customersChange in amounts due to customers 2011201120112011 2010201020102010
Change in the balance of the statement of financial position 13 492 682 7 908 281 Transfer of loans and advances received from other than banks financial entities/repayment of these loans and advances - to financing activities
56 017 (408 967)
TotalTotalTotalTotal 13 548 699 13 548 699 13 548 699 13 548 699 7 499 314 7 499 314 7 499 314 7 499 314
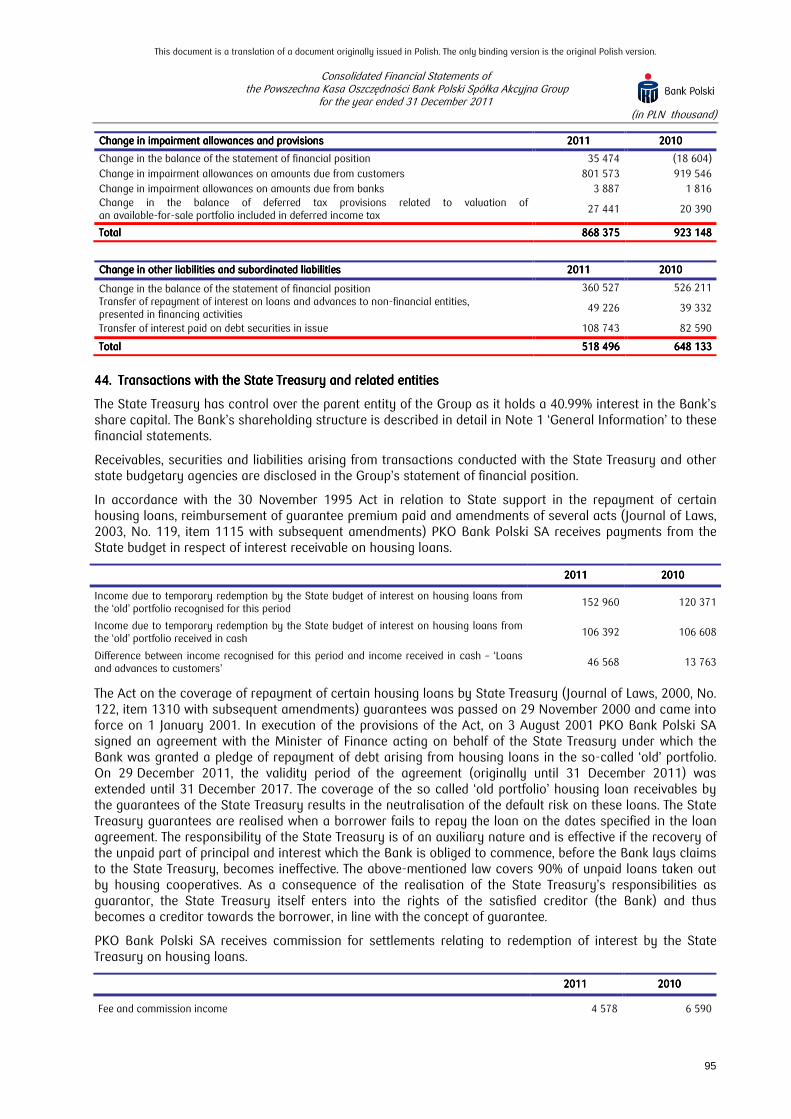
This document is a translation of a document originally issued in Polish. The only binding version is the original Polish version.
Consolidated Financial Statements of the Powszechna Kasa Oszczędności Bank Polski Spółka Akcyjna Group
for the year ended 31 December 2011 (in PLN thousand)
95
Change in impairment allowances and provisionsChange in impairment allowances and provisionsChange in impairment allowances and provisionsChange in impairment allowances and provisions 2011201120112011 2010201020102010
Change in the balance of the statement of financial position 35 474 (18 604)
Change in impairment allowances on amounts due from customers 801 573 919 546
Change in impairment allowances on amounts due from banks 3 887 1 816 Change in the balance of deferred tax provisions related to valuation of an available-for-sale portfolio included in deferred income tax
27 441 20 390
TotalTotalTotalTotal 868 375 868 375 868 375 868 375 923 148 923 148 923 148 923 148
Change in other liabilities and subordinated liabilitiesChange in other liabilities and subordinated liabilitiesChange in other liabilities and subordinated liabilitiesChange in other liabilities and subordinated liabilities 2011201120112011 2010201020102010
Change in the balance of the statement of financial position 360 527 526 211 Transfer of repayment of interest on loans and advances to non-financial entities, presented in financing activities
49 226 39 332
Transfer of interest paid on debt securities in issue 108 743 82 590
TotalTotalTotalTotal 518 496 518 496 518 496 518 496 648 133 648 133 648 133 648 133
44.44.44.44. Transactions with the State Treasury and related entitiesTransactions with the State Treasury and related entitiesTransactions with the State Treasury and related entitiesTransactions with the State Treasury and related entities
The State Treasury has control over the parent entity of the Group as it holds a 40.99% interest in the Bank’s share capital. The Bank’s shareholding structure is described in detail in Note 1 ‘General Information’ to these financial statements.
Receivables, securities and liabilities arising from transactions conducted with the State Treasury and other state budgetary agencies are disclosed in the Group’s statement of financial position.
In accordance with the 30 November 1995 Act in relation to State support in the repayment of certain housing loans, reimbursement of guarantee premium paid and amendments of several acts (Journal of Laws, 2003, No. 119, item 1115 with subsequent amendments) PKO Bank Polski SA receives payments from the State budget in respect of interest receivable on housing loans.
2012012012011111 2020202010101010
Income due to temporary redemption by the State budget of interest on housing loans from the ‘old’ portfolio recognised for this period
152 960 120 371
Income due to temporary redemption by the State budget of interest on housing loans from the ‘old’ portfolio received in cash
106 392 106 608
Difference between income recognised for this period and income received in cash – ‘Loans and advances to customers’
46 568 13 763
The Act on the coverage of repayment of certain housing loans by State Treasury (Journal of Laws, 2000, No. 122, item 1310 with subsequent amendments) guarantees was passed on 29 November 2000 and came into force on 1 January 2001. In execution of the provisions of the Act, on 3 August 2001 PKO Bank Polski SA signed an agreement with the Minister of Finance acting on behalf of the State Treasury under which the Bank was granted a pledge of repayment of debt arising from housing loans in the so-called ‘old’ portfolio. On 29 December 2011, the validity period of the agreement (originally until 31 December 2011) was extended until 31 December 2017. The coverage of the so called ‘old portfolio’ housing loan receivables by the guarantees of the State Treasury results in the neutralisation of the default risk on these loans. The State Treasury guarantees are realised when a borrower fails to repay the loan on the dates specified in the loan agreement. The responsibility of the State Treasury is of an auxiliary nature and is effective if the recovery of the unpaid part of principal and interest which the Bank is obliged to commence, before the Bank lays claims to the State Treasury, becomes ineffective. The above-mentioned law covers 90% of unpaid loans taken out by housing cooperatives. As a consequence of the realisation of the State Treasury’s responsibilities as guarantor, the State Treasury itself enters into the rights of the satisfied creditor (the Bank) and thus becomes a creditor towards the borrower, in line with the concept of guarantee.
PKO Bank Polski SA receives commission for settlements relating to redemption of interest by the State Treasury on housing loans.
2012012012011111 2020202010101010
Fee and commission income 4 578 6 590

This document is a translation of a document originally issued in Polish. The only binding version is the original Polish version.
Consolidated Financial Statements of the Powszechna Kasa Oszczędności Bank Polski Spółka Akcyjna Group
for the year ended 31 December 2011 (in PLN thousand)
96
As of 1 January 1996 the Bank became the general distributor of court fee stamps. The Bank receives commissions in this respect from the State Treasury.
2012012012011111 2020202010101010
Fee and commission income 18 625 26 255
Dom Maklerski PKO Bank Polski SA (the brokerage house of PKO Bank Polski SA) performs the role of an agent for the issue of retail Treasury bonds under the agreement signed between the Ministry of Finance as the issuer and PKO Bank Polski SA on 11 February 2003. Under this agreement, Dom Maklerski PKO Bank Polski SA receives a fee for providing the services of an agent for the issue of bonds.
2012012012011111 2020202010101010
Fee and commission income 29 669 31 842

This document is a translation of a document originally issued in Polish. The only binding version is the original Polish version.
Consolidated Financial Statements of the Powszechna Kasa Oszczędności Bank Polski Spółka Akcyjna Group
for the year ended 31 December 2011 (in PLN thousand)
97
Significant transactions of PKO Bank Polski SA with the State Treasury’s related entities Significant transactions of PKO Bank Polski SA with the State Treasury’s related entities Significant transactions of PKO Bank Polski SA with the State Treasury’s related entities Significant transactions of PKO Bank Polski SA with the State Treasury’s related entities
The transactions were concluded at arm’s length.
As at 31 December 2011 and 31 December 2010, no significant impairment allowances were recognised for above-mentioned receivables.
EntityEntityEntityEntity
31.12.201131.12.201131.12.201131.12.2011 31.12.201031.12.201031.12.201031.12.2010
Total receivablesTotal receivablesTotal receivablesTotal receivables Total liabilitiesTotal liabilitiesTotal liabilitiesTotal liabilities
Contingent Contingent Contingent Contingent liabilities and liabilities and liabilities and liabilities and
commitments commitments commitments commitments –––– financial and financial and financial and financial and
guaranteeguaranteeguaranteeguarantee
Interest incomeInterest incomeInterest incomeInterest income Fee and Fee and Fee and Fee and
commission commission commission commission incomeincomeincomeincome
Interest expensesInterest expensesInterest expensesInterest expenses Total receivablesTotal receivablesTotal receivablesTotal receivables Total liabilitiesTotal liabilitiesTotal liabilitiesTotal liabilities
Contingent Contingent Contingent Contingent liabilities and liabilities and liabilities and liabilities and
commitments commitments commitments commitments –––– financial and financial and financial and financial and
guaranteeguaranteeguaranteeguarantee
Interest incomeInterest incomeInterest incomeInterest income Fee and Fee and Fee and Fee and
commission commission commission commission incomeincomeincomeincome
Interest Interest Interest Interest expensesexpensesexpensesexpenses
Entity 1Entity 1Entity 1Entity 1 399 939 - 368 959 4 980 909 (301) 349 633 - 260 851 5 067 639 (15)
Entity 2Entity 2Entity 2Entity 2 178 132 15 474 144 912 3 898 578 (45) 57 438 - 24 562 4 366 38 (381)
Entity 3Entity 3Entity 3Entity 3 132 802 150 000 477 545 13 039 2 797 (3 182) 154 846 128 924 407 670 19 133 883 (2 222)
Entity 4Entity 4Entity 4Entity 4 130 940 - - 18 230 245 (6 988) 195 894 - 2 428 - - -
Entity 5Entity 5Entity 5Entity 5 102 811 - 20 357 6 228 605 (5) 91 040 - 8 002 3 518 270 (2)
Entity 6Entity 6Entity 6Entity 6 85 306 12 543 60 000 5 731 156 (2 995) - 76 923 30 000 6 486 189 (2 799)
Entity 7Entity 7Entity 7Entity 7 58 103 7 000 136 013 2 923 11 (774) 66 421 38 943 155 000 3 219 9 (137)
Entity 8Entity 8Entity 8Entity 8 54 758 11 045 95 264 3 420 783 (1 370) 60 246 28 101 89 754 2 699 355 (766)
Entity 9Entity 9Entity 9Entity 9 48 749 45 850 - 565 5 (1 158) 39 603 - - 353 5 (7)
Entity 10Entity 10Entity 10Entity 10 41 060 10 000 50 000 2 927 97 (3 259) 58 340 6 827 50 000 - - -
Entity 11Entity 11Entity 11Entity 11 25 048 - - 1 507 8 (114) 34 011 - - 1 812 6 (81)
Entity 12Entity 12Entity 12Entity 12 21 700 12 009 100 1 406 116 (1) 23 620 - 580 1 484 29 (176)
EntityEntityEntityEntity 13131313 20 115 5 105 6 000 1 441 32 (645) 18 000 8 221 18 000 - - -
Entity 14Entity 14Entity 14Entity 14 19 556 - 3 434 1 340 76 - 23 790 - 3 601 1 424 72 -
Entity 15Entity 15Entity 15Entity 15 18 207 70 000 - 1 657 10 (17 116) 36 409 65 092 - 2 407 10 (1 498)
Other significant Other significant Other significant Other significant exposuresexposuresexposuresexposures 132 392 1 898 747 2 930 663 23 970 3 945 (129 133) 209 958 1 526 433 3 463 905 40 341 5 957 (77 245)
TotalTotalTotalTotal 1 469 618 1 469 618 1 469 618 1 469 618 2 237 773 2 237 773 2 237 773 2 237 773 4 293 247 4 293 247 4 293 247 4 293 247 93 262 93 262 93 262 93 262 10 373 10 373 10 373 10 373 (167 086)(167 086)(167 086)(167 086) 1 419 249 1 419 249 1 419 249 1 419 249 1 879 464 1 879 464 1 879 464 1 879 464 4 514 353 4 514 353 4 514 353 4 514 353 92 309 92 309 92 309 92 309 8 462 8 462 8 462 8 462 (85 329)(85 329)(85 329)(85 329)

This document is a translation of a document originally issued in Polish. The only binding version is the original Polish version.
Consolidated Financial Statements of the Powszechna Kasa Oszczędności Bank Polski Spółka Akcyjna Group
for the year ended 31 December 2011 (in PLN thousand)
98
45.45.45.45. Related party transactionsRelated party transactionsRelated party transactionsRelated party transactions
Transactions of the parent company with jointly controlled entities and associates Transactions of the parent company with jointly controlled entities and associates Transactions of the parent company with jointly controlled entities and associates Transactions of the parent company with jointly controlled entities and associates valued withvalued withvalued withvalued with the equity the equity the equity the equity methodmethodmethodmethod
All presented below transactions with jointly controlled entities and associates were arm’s length transactions. Repayment terms are within a range from 1 month to 10 years.
31 December 2011
EntityEntityEntityEntity NetNetNetNet
receivablesreceivablesreceivablesreceivables
including including including including grossgrossgrossgross loansloansloansloans
LiabilitiesLiabilitiesLiabilitiesLiabilities TotalTotalTotalTotal
incomeincomeincomeincome
including including including including interestinterestinterestinterest
and fee andand fee andand fee andand fee and commissioncommissioncommissioncommission
incomeincomeincomeincome
Total Total Total Total expenseexpenseexpenseexpense
including interest including interest including interest including interest and fee and and fee and and fee and and fee and commissioncommissioncommissioncommission
expenseexpenseexpenseexpense
Contingent Contingent Contingent Contingent liabilitiesliabilitiesliabilitiesliabilities
and and and and commitmentscommitmentscommitmentscommitments
Agencja Inwestycyjna CORP-SA SA - - 76 691 - 2 552 - - Bank Pocztowy SA - - 983 346 325 486 481 24 974 CENTRUM HAFFNERA Sp. z o.o. - - 2 797 18 18 - - - Centrum Majkowskiego Sp. z o.o. - - 7 350 13 13 245 245 - Centrum Obsługi Biznesu Sp. z o.o. 33 625 33 625 21 447 993 993 635 635 - Centrum Operacyjne Sp. z o.o. - - 156 5 5 - - - Kamienica Morska Sp. z o.o. - - - 13 13 - - - Kolej Gondolowa ‘Jaworzyna Krynicka’ SA 8 479 8 479 217 479 479 58 58 2 976 Poznański Fundusz Poręczeń Kredytowych Sp. z o.o. - - 1 047 2 2 907 907 - Promenada Sopocka Sp. z o.o. 49 162 49 162 1 477 1 496 1 496 20 20 - Sopot Zdrój Sp. z o.o. 235 466 235 466 3 318 7 322 7 322 71 71 -
TotalTotalTotalTotal 326 732 326 732 326 732 326 732 326 732 326 732 326 732 326 732 38 868 38 868 38 868 38 868 11 378 11 378 11 378 11 378 10 666 10 666 10 666 10 666 4 974 4 974 4 974 4 974 2 417 2 417 2 417 2 417 27 950 27 950 27 950 27 950
Spółka Dystrybucyjna Banku Pocztowego Sp. z o.o. was not presented in the table due to lack of mutual transactions with the Bank.
31 December 2010
EntityEntityEntityEntity NetNetNetNet
receivablesreceivablesreceivablesreceivables
including including including including grossgrossgrossgross loansloansloansloans
LiabilitiesLiabilitiesLiabilitiesLiabilities TotalTotalTotalTotal
incomeincomeincomeincome
including including including including interestinterestinterestinterest
and fee andand fee andand fee andand fee and commissioncommissioncommissioncommission
incomeincomeincomeincome
Total Total Total Total expenseexpenseexpenseexpense
including interest including interest including interest including interest andandandand fee and fee and fee and fee and commissioncommissioncommissioncommission
expenseexpenseexpenseexpense
Contingent Contingent Contingent Contingent liabilities liabilities liabilities liabilities
and and and and commitmentscommitmentscommitmentscommitments
Agencja Inwestycyjna CORP-SA SA 61 - 87 628 - 2 425 - - Bank Pocztowy SA - - 105 146 131 1 962 419 1 330 CENTRUM HAFFNERA Sp. z o.o. - - 2 478 9 9 59 59 - Centrum Majkowskiego Sp. z o.o. - - 4 765 6 6 93 93 - Centrum Obsługi Biznesu Sp. z o.o. 30 799 30 799 22 285 753 752 558 557 - Kamienica Morska Sp. z o.o. - - 66 6 6 - - - Kolej Gondolowa ‘Jaworzyna Krynicka’ SA 5 824 5 824 538 74 74 9 9 8 375 Poznański Fundusz Poręczeń Kredytowych Sp. z o.o. - - 16 178 1 1 152 141 - Promenada Sopocka Sp. z o.o. 43 805 43 805 691 1 165 1 165 - - - Sopot Zdrój Sp. z o.o. 209 785 209 785 4 049 5 617 5 617 60 60 -
TOTALTOTALTOTALTOTAL 290 274 290 274 290 274 290 274 290 213 290 213 290 213 290 213 51 242 51 242 51 242 51 242 8 405 8 405 8 405 8 405 7 761 7 761 7 761 7 761 5 318 5 318 5 318 5 318 1 338 1 338 1 338 1 338 9 705 9 705 9 705 9 705
46.46.46.46. Personal related partyPersonal related partyPersonal related partyPersonal related party transactionstransactionstransactionstransactions
As at 31 December 2011, two entities were related to the Bank through the key management personnel of PKO Bank Polski SA or the close family members of the key management personnel (one entity as at 31 December 2010).
In 2011 and 2010 no intercompany transactions were concluded with these entities.
47.47.47.47. Remuneration Remuneration Remuneration Remuneration –––– PKO Bank PKO Bank PKO Bank PKO Bank Polski SA key managementPolski SA key managementPolski SA key managementPolski SA key management
a) short-term employee benefits*
Remuneration received from PKO Bank Polski SARemuneration received from PKO Bank Polski SARemuneration received from PKO Bank Polski SARemuneration received from PKO Bank Polski SA
ShortShortShortShort----term employee benefitsterm employee benefitsterm employee benefitsterm employee benefits 2011201120112011 2010201020102010
The Management Board of the Bank 10 937 6 831
The Supervisory Board of the Bank 1 088 621
Total Total Total Total 12 025 12 025 12 025 12 025 7 452 7 452 7 452 7 452
*Includes remuneration from the Bank and the Bank’s subsidiaries, unless stated otherwise. ** Includes remuneration from associates in the amount of PLN 15 thousand. *** Includes remuneration from associates in the amount of PLN 46 thousand.

This document is a translation of a document originally issued in Polish. The only binding version is the original Polish version.
Consolidated Financial Statements of the Powszechna Kasa Oszczędności Bank Polski Spółka Akcyjna Group
for the year ended 31 December 2011 (in PLN thousand)
99
Remuneration received from related companies (other than the State Treasury and entities related to the Remuneration received from related companies (other than the State Treasury and entities related to the Remuneration received from related companies (other than the State Treasury and entities related to the Remuneration received from related companies (other than the State Treasury and entities related to the State Treasury)State Treasury)State Treasury)State Treasury)
ShortShortShortShort----term employee benefitsterm employee benefitsterm employee benefitsterm employee benefits 2012012012011111 2020202010101010
The Management Board of the Bank 47 137
Total Total Total Total 47 47 47 47 ******** 137 137 137 137 ************
b) post-employment benefits
As at 31 December 2011 and 31 December 2010 no post-employment benefits were granted.
c) other long-term benefits
As at 31 December 2011 and 31 December 2010 no ‘other long-term benefits’ were granted.
d) benefits due to termination of employment
As at 31 December 2011 benefits paid due to termination of employment amounted to PLN 1 920 thousand, as at 31 December 2010 benefits paid due to termination of employment amounted to PLN 1 440 thousand.
e) share-based payments
As at 31 December 2011 and 31 December 2010 no benefits were granted in the form of share-based payments.
Loans, advances and guarantees provided by the Bank to the management and employeesLoans, advances and guarantees provided by the Bank to the management and employeesLoans, advances and guarantees provided by the Bank to the management and employeesLoans, advances and guarantees provided by the Bank to the management and employees
31.12.20131.12.20131.12.20131.12.2011111 31.12.2031.12.2031.12.2031.12.2010101010
The Management Board members 130 199
The Supervisory Board members 2 415 2 400
TotalTotalTotalTotal 2 545 2 545 2 545 2 545 2 599 2 599 2 599 2 599
Interest conditions and repayment periods of the above-mentioned items are set at arm’s length.
Remuneration received by members of the Management Board and the Supervisory Board Remuneration received by members of the Management Board and the Supervisory Board Remuneration received by members of the Management Board and the Supervisory Board Remuneration received by members of the Management Board and the Supervisory Board of the PKO Bank Polskiof the PKO Bank Polskiof the PKO Bank Polskiof the PKO Bank Polski SA Group subsidiariesSA Group subsidiariesSA Group subsidiariesSA Group subsidiaries
ShortShortShortShort----term employee benefitsterm employee benefitsterm employee benefitsterm employee benefits 2012012012011111 2020202010101010
The Management Board 19 753 14 099
The Supervisory Board 173 539
TotalTotalTotalTotal 19 926 19 926 19 926 19 926 14 638 14 638 14 638 14 638
48.48.48.48. Changes to the entities of the Group, jointly controlled entities and associatesChanges to the entities of the Group, jointly controlled entities and associatesChanges to the entities of the Group, jointly controlled entities and associatesChanges to the entities of the Group, jointly controlled entities and associates
In 2011 the following events, concerning subsidiaries (direct and indirect), affecting the structure of the PKO Bank Polski SA Group took place:
1)1)1)1) concerning Bankowe Towarzystwo Kapitałowe SAconcerning Bankowe Towarzystwo Kapitałowe SAconcerning Bankowe Towarzystwo Kapitałowe SAconcerning Bankowe Towarzystwo Kapitałowe SA
On 12 January 2011, an increase in the share capital of Bankowe Towarzystwo Kapitałowe SA of PLN 3 000 thousand was registered in the National Court Register. As a result of the above-mentioned increase, the Company’s share capital amounts to PLN 24 243.9 thousand and consists of 242 439 shares, each of PLN 100 nominal value.
All the shares in the increased share capital were acquired by PKO Bank Polski SA for a price equal to the nominal value of the shares taken up.

This document is a translation of a document originally issued in Polish. The only binding version is the original Polish version.
Consolidated Financial Statements of the Powszechna Kasa Oszczędności Bank Polski Spółka Akcyjna Group
for the year ended 31 December 2011 (in PLN thousand)
100
As at 31 December 2011, the interest of PKO Bank Polski SA in the share capital and in the votes at the General Shareholders’ Meeting of the Company was 100%.
2)2)2)2) concerning PKO BP Factoring SAconcerning PKO BP Factoring SAconcerning PKO BP Factoring SAconcerning PKO BP Factoring SA
On 7 March 2011, an increase in the share capital of PKO BP Faktoring SA in the total amount of PLN 1 500 thousand was registered in the National Court Register. As a result of the above-mentioned increase, the Company’s share capital amounts to PLN 9 000 thousand and consists of 9 000 shares, each of PLN 1 thousand nominal value.
All shares in the increased share capital were acquired by Bankowe Towarzystwo Kapitałowe SA, a subsidiary of PKO Bank Polski SA, for PLN 3 000 thousand, while PLN 1 500 thousand was recognised in the Company’s reserve capital.
Following the registration of the above-mentioned share issue, the interest of BTK SA in the share capital and in the votes at the General Shareholders’ Meeting of the Company is 99.9889%.
3)3)3)3) concerning the process of liquidatioconcerning the process of liquidatioconcerning the process of liquidatioconcerning the process of liquidationnnn of Centrum Finansowe Puławska Sp. z o. o. of Centrum Finansowe Puławska Sp. z o. o. of Centrum Finansowe Puławska Sp. z o. o. of Centrum Finansowe Puławska Sp. z o. o.
On 13 June 2011, an increase in the share capital of Centrum Finansowe Puławska Sp. z o.o. of PLN 39 000 thousand was registered with the National Court Register. As a result of the above-mentioned increase, the Company’s share capital amounts to PLN 117 808 thousand and consists of 14 726 shares, each of PLN 8 thousand nominal value.
All shares in the increased share capital were acquired by PKO Bank Polski SA for a price equal to the nominal value of the shares taken up. The funds raised as a result of the above-mentioned capital increase were used for early repayment of the loan with PKO Bank Polski SA.
In the result of the above-mentioned share issue, the interest of PKO Bank Polski SA in the share capital and in the votes at the General Shareholders’ Meeting of the Company is still 100%.
On 1 July 2011, PKO Bank Polski SA, as the sole shareholder of Centrum Finansowe Puławska Sp. z o.o., passed a resolution on the Company's winding up and opening its liquidation as of 1 July 2011. The relevant motion was filed with the National Court register on 4 July 2011.
The winding up of the Company will not result in any changes to the scope of activities of the PKO Bank Polski SA Group – in the Bank, activities related to the acquisition of management of the Centrum Finansowe Puławska building in Warsaw together with the property are carried out, which is the main activity conducted by the Company.
4)4)4)4) concerning the takeover of direct control of PKO BP Finat Sp. z o.o. by PKO Bank Polski SAconcerning the takeover of direct control of PKO BP Finat Sp. z o.o. by PKO Bank Polski SAconcerning the takeover of direct control of PKO BP Finat Sp. z o.o. by PKO Bank Polski SAconcerning the takeover of direct control of PKO BP Finat Sp. z o.o. by PKO Bank Polski SA
As part of the process related to the takeover of direct control of PKO BP Finat Sp. z o.o. by the Bank, on 12 September 2011 PKO BP Finat Sp. z o.o. repaid to PKO BP BANKOWY Powszechne Towarzystwo Emerytalne SA capital contribution in the amount of PLN 2 500 thousand.
In the third quarter of 2011 PKO Bank Polski SA bought from its subsidiaries all shares of PKO BP Finat Sp. z o.o., of which:
− On 24 August 2011 bought from Inteligo Financial Services SA 75 999 shares of PKO BP Finat Sp. z o.o. with a total nominal value of PLN 7 599.9 thousand; purchase price of the above-mentioned shares amounted to PLN 9 392.7 thousand.
− On 13 September 2011 bought from PKO BP BANKOWY Powszechne Towarzystwo Emerytalne SA 18 610 shares of PKO BP Finat Sp. z o.o. with a total nominal value of PLN 1 861 thousand; purchase price amounted to PLN 2 300 thousand.
As a result of the above-mentioned transaction, PKO Bank Polski SA directly holds shares of PKO BP Finat Sp. z o.o. which represent 100% interest in the share capital of the Company and entitle to 100% of the votes at the General Shareholders’ Meeting.

This document is a translation of a document originally issued in Polish. The only binding version is the original Polish version.
Consolidated Financial Statements of the Powszechna Kasa Oszczędności Bank Polski Spółka Akcyjna Group
for the year ended 31 December 2011 (in PLN thousand)
101
5)5)5)5) concerning Bankowy Leasing Sp. z o.o.concerning Bankowy Leasing Sp. z o.o.concerning Bankowy Leasing Sp. z o.o.concerning Bankowy Leasing Sp. z o.o.
On 27 January 2011, the increase in the share capital of Bankowy Leasing Sp. z o.o. in the total amount of PLN 6 600 thousand was registered with the National Court Register. All the shares were acquired by Bankowy Fundusz Leasingowy SA – a subsidiary of the Bank – for a price equal to the nominal value of the shares taken up.
On 11 May 2011, the increase in the share capital of Bankowy Leasing Sp. z o.o. in the total amount of PLN 12 700 thousand was registered with the National Court Register. All the shares were acquired by Bankowy Fundusz Leasingowy SA – a subsidiary of the Bank – for a price equal to the nominal value of the shares taken up.
On 28 September 2011 Bankowy Fundusz Leasingowy SA bought from PKO Bank Polski SA 1 share in Bankowy Leasing Sp. z o.o. The purchase price was PLN 0.8 thousand. As a result of the above transaction Bankowy Fundusz Leasingowy SA became the sole shareholder of the company Bankowy Leasing Sp. z o.o.
On 30 December 2011 with the National Court Register was registered:
- the increase in the share capital of Bankowy Leasing Sp. z o.o. in the total amount of PLN 15 414.5 thousand by the share issue, which were granted to Bankowy Fundusz Leasingowy SA as a sole shareholder of the company BFL Nieruchomości Sp. z o.o. (acquiree) in a merger of the subsidiaries of Bankowy Fundusz Leasingowy SA,
- the merger of the subsidiaries of Bankowy Fundusz Leasingowy SA, as a result of which the whole assets of the company BFL Nieruchomości Sp. z o.o. was transferred to the company Bankowy Leasing Sp. z o.o.
As at 31 December 2011 share capital of the Company amounted to PLN 57 414.5 thousand and divides on 114 829 shares of a nominal value of PLN 500 each.
6)6)6)6) concerning BFL Nieruchomości Sp. z o.o.concerning BFL Nieruchomości Sp. z o.o.concerning BFL Nieruchomości Sp. z o.o.concerning BFL Nieruchomości Sp. z o.o.
In 2011, the increase in the share capital of BFL Nieruchomości Sp. z o.o. in the total amount of PLN 8 000 thousand, including: on 27 January in the amount of PLN 1 000 thousand and on 9 May in the amount of PLN 7 000 thousand, was registered with the National Court Register. As a result of the above-mentioned increase, the Company’s share capital amounts to PLN 18 400 thousand and consists of 36 800 shares of PLN 500 nominal value each.
All the shares in the increased share capital were taken up by Bankowy Fundusz Leasingowy SA – a subsidiary of PKO Bank Polski SA, for a price equal to the nominal value of the shares taken up.
On 28 September 2011 Bankowy Fundusz Leasingowy SA bought from PKO Bank Polski SA 1 share in BFL Nieruchomości Sp. z o.o. The purchase price was PLN 0.8 thousand. As a result of the above transaction, Bankowy Fundusz Leasingowy SA became the sole shareholder in BFL Nieruchomości Sp. z o.o.
On 30 December 2011 the merger of the subsidiaries of Bankowy Fundusz Leasingowy SA was registered with the National Court Register, whereby all the assets of BFL Nieruchomości Sp. z o.o. was transferred to Bankowy Leasing Sp. z o.o., and BFL Nieruchomości Sp. z o.o. was removed from the register.
7)7)7)7) concerning the Qualia Development Sp. z o.o. Group concerning the Qualia Development Sp. z o.o. Group concerning the Qualia Development Sp. z o.o. Group concerning the Qualia Development Sp. z o.o. Group (till 10 May 2011 appearing under the name of(till 10 May 2011 appearing under the name of(till 10 May 2011 appearing under the name of(till 10 May 2011 appearing under the name of the the the the PKO BP Inwestycje Sp. z o.PKO BP Inwestycje Sp. z o.PKO BP Inwestycje Sp. z o.PKO BP Inwestycje Sp. z o.o. Group)o. Group)o. Group)o. Group)
In 2011, the Qualia Development Sp. z o.o. Group carried out actions aimed at implementing a new concept of development activities within the Group structure, which consists mainly of limited partnerships established to execution of investment projects, in which Qualia Development Sp. z o.o. acts as a limited partner and Qualia Sp. z o.o. acts as a general partner.
As part of above-mentioned actions:
− Qualia Sp. z o.o. was formed (the Company was registered with the National Court Register on 25 February 2011).

This document is a translation of a document originally issued in Polish. The only binding version is the original Polish version.
Consolidated Financial Statements of the Powszechna Kasa Oszczędności Bank Polski Spółka Akcyjna Group
for the year ended 31 December 2011 (in PLN thousand)
102
The Company’s share capital amounts to PLN 5 thousand and consists of 100 shares, each of PLN 50 nominal value. On the day of the Company’s establishment, its shares with a nominal value of PLN 4 950 thousand were taken up by Qualia Development Sp. z o.o., and 1 share with a nominal value of PLN 50 was taken up by Qualia – Rezydencja Flotylla Sp. z o.o. – a subsidiary of Qualia Development Sp. z o.o. Since 28 April 2011 the sole shareholder in the company is Qualia Development Sp. z o.o. which repurchased 1 share for a price equal to the nominal value of the share.
− Qualia spółka z ograniczoną odpowiedzialnością - Sopot Spółka komandytowa was formed (the Partnership was registered in the National Court Register on 11 March 2011).
The partners are: Qualia Sp. z o.o. (general partner, amount of contribution: PLN 1 thousand) and Qualia Development Sp. z o.o. (limited partner, the limited partner’s amount of contribution and limit of liability: PLN 4 700 thousand, increased from PLN 1 thousand by the partners’ resolution of 31 March 2011). The activities of Qualia spółka z ograniczoną odpowiedzialnością - Sopot Spółka komandytowa comprise the preparation and execution of the investment project in Sopot at Bohaterów Monte Cassino Street.
− On 6 April 2011, Qualia Sp. z o.o. bought from PKO Bank Polski SA one share in PKO BP Inwestycje – Nowy Wilanów Sp. z o.o. for PLN 21.4 thousand.
− PKO BP Inwestycje – Nowy Wilanów Sp. z o.o. was transformed into a limited partnership and change its name to Qualia spółka z ograniczoną odpowiedzialnością – Nowy Wilanów Spółka komandytowa (on 1 July 2011 the above mentioned changes were registered in the National Court Register).
The partners are: Qualia Development Sp. z o.o. (limited partner, the limited partner’s amount of contribution: 3 999 thousand) and Qualia Sp. z o.o. (general partner, amount of contribution: PLN 1 thousand).
− On 6 April 2011 Qualia Sp. z o.o. bought from PKO Bank Polski SA 1 share in PKO BP Inwestycje - Neptun Park Sp. z o.o. for PLN 0.8 thousand.
− PKO BP Inwestycje – Neptun Park Sp. z o.o. was transformed into a limited partnership and change its name to Qualia spółka z ograniczoną odpowiedzialnością – Neptun Park Spółka komandytowa (on 1 July 2011 the above mentioned changes were registered with the National Court Register).
The partners are: Qualia Development Sp. z o.o. (limited partner, the limited partner’s amount of contribution: PLN 3 999.9 thousand) and Qualia Sp. z o.o. (general partner, amount of contribution: PLN 0.1 thousand).
− Qualia spółka z ograniczoną odpowiedzialnością - Pomeranka Spółka komandytowa was formed (the Partnership was registered with the National Court Register on 21 July 2011).
The partners are: Qualia Development Sp. z o.o. (limited partner, the limited partner’s amount of contribution: PLN 1 thousand) and Qualia Sp. z o.o. (general partner, amount of contribution: PLN 1 thousand).
− Qualia spółka z ograniczoną odpowiedzialnością – Projekt 1 Spółka komandytowa was formed (the Partnership was registered with the National Court Register on 29 July 2011).
The partners are: Qualia Development Sp. z o.o. (limited partner, the limited partner’s amount of contribution: PLN 1 thousand) and Qualia Sp. z o.o. (general partner, amount of contribution: PLN 1 thousand).
− Qualia – Residence Sp. z o.o. was formed (the Company was registered with the National Court Register on 6 October 2011).
The Company’s share capital amounts to PLN 5 thousand and consists of 100 shares, each of PLN 50 nominal value. On the day of the Company’s establishment, its shares with a nominal value of PLN 4.95 thousand were taken up by Qualia Development Sp. z o.o., and 1 share with a nominal value of PLN 50 was taken up by Qualia Sp. z o.o. Since 13 October 2011 the sole shareholder in the Company is Qualia Development Sp. z o.o., which repurchased the 1 share for a price equal to the nominal value of the share.

This document is a translation of a document originally issued in Polish. The only binding version is the original Polish version.
Consolidated Financial Statements of the Powszechna Kasa Oszczędności Bank Polski Spółka Akcyjna Group
for the year ended 31 December 2011 (in PLN thousand)
103
− Qualia Hotel Management Sp. z o.o was formed (the Company’s Notarial Deed was signed on 28 November 2011).
The Company’s share capital amounts to PLN 50 thousand and consists of 1 000 shares, each of PLN 50 nominal value. Shares with a nominal value of PLN 49.95 thousand were taken up by Qualia Development Sp. z o.o., and 1 share with a nominal value of PLN 50 was taken up by Qualia Sp. z o.o. The Company was registered with the National Court Register on 4 January 2012. The company was included in the consolidated financial statements of the PKO Bank Polski SA Group for the year 2011. The activities of the Company are operating activities in the area of hotel suites.
and
− liquidation of Fort Mokotów Sp. z o.o. was commenced
On 28 July 2011, the Extraordinary Shareholders’ Meeting of Fort Mokotów Sp. z o.o. – a subsidiary of Qualia Development Sp. z o.o. – passed a resolution to dissolve the Company and open its liquidation as of 28 July 2011. The liquidation is carried out in connection with completing the execution of a development project.
In 2011, the following companies changed their names:
− PKO BP Inwestycje Sp. z o.o. changed its name to Qualia Development Sp. z o.o., on 11 May 2011 the change was registered with the National Court Register,
− PKO BP Inwestycje – Sarnia Dolina Sp. z o.o. changed its name to Sarnia Dolina Sp. z o.o., on 29 June 2011 the change was registered with the National Court Register,
− PKO BP Inwestycje – Rezydencja Flotylla Sp. z o.o. changed its name to Qualia- Rezydencja Flotylla Sp. z o.o., on 30 June 2011 the change was registered with the National Court Register
In 2011, the following additional contributions to the capital of the Qualia Development Sp. z o.o. Group companies were made:
− PKO Bank Polski SA made additional contributions to Qualia Development Sp. z o.o. in the total amount of PLN 65 580 thousand (of which: PLN 5 340 thousand on 25 March, PLN 5 800 thousand on 1 June and PLN 54 440 thousand on 21 November),
− on 7 April 2011 Qualia Development Sp. z o.o. made an additional contribution to Qualia Sp. z o.o. of PLN 25 thousand,
− on 28 November 2011 Qualia Development Sp. z o.o. made an additional contribution to Qualia Residence Sp. z o.o. of PLN 42 025 thousand.
8)8)8)8) concerning the acquisition of a new company Finansowconcerning the acquisition of a new company Finansowconcerning the acquisition of a new company Finansowconcerning the acquisition of a new company Finansowa Kompania ‘Prywatne Inwestycje’a Kompania ‘Prywatne Inwestycje’a Kompania ‘Prywatne Inwestycje’a Kompania ‘Prywatne Inwestycje’
Sp. z o.o.Sp. z o.o.Sp. z o.o.Sp. z o.o.
PKO Bank Polski SA acquired 1 share with a nominal value of UAH 3 101 thousand in Finansowa Kompania ‘Prywatne Inwestycje’ Sp. z o.o. with its seat in Kiev from Kompania Finansowa ‘Centrum Usług Faktoringowych’ Sp. z o.o., which represent 100% interest in the share capital of the Company and entitle to 100% of the votes at the General Shareholders’ Meeting. The acquisition price was PLN 1 482 thousand.
On 29 November 2011, PKO Bank Polski SA was registered with the State Ukrainian Register of Businesses as the Company’s sole shareholder.
In December 2011 the Company purchased from KREDOBANK SA in three bundles the sectioned off impaired loans portfolio in the total amount of UAH 1 645 million (PLN 700 million at the average NBP rate as of the last day of 2011). The purchase was financed with loan received from PKO Bank Polski SA in the amount of USD 63 million (PLN 215 million at the average NBP rate as of the last day of 2011).
Receivables will be subject to the debt collection activity conducted through the company ‘Inter-Risk Ukraine’ Spółka z dodatkową odpowiedzialnością (additional liability company).
and the following events relating to co-subsidiaries and associates:

This document is a translation of a document originally issued in Polish. The only binding version is the original Polish version.
Consolidated Financial Statements of the Powszechna Kasa Oszczędności Bank Polski Spółka Akcyjna Group
for the year ended 31 December 2011 (in PLN thousand)
104
− On 28 September 2011, a decrease in the share capital of Centrum Majkowskiego Sp. z o.o. was registered with the National Court Register. The company is a subsidiary of Centrum Haffnera Sp. z o.o. (a co-subsidiary of PKO Bank Polski SA). The share capital was reduced from PLN 6 609 thousand to PLN 3 833.2 thousand by reducing the nominal value of each share,
− On 30 September 2011, the Extraordinary Shareholders’ Meeting of Spółka Dystrybucyjna Banku Pocztowego Sp. z o.o. – a subsidiary of Bank Pocztowy SA (an associate of PKO Bank Polski SA) made a decision to increase the Company's share capital from PLN 2 000 thousand to PLN 2 679.8 thousand by increasing the nominal value of the shares. The above-mentioned capital increase was registered with the National Court Register on 10 January 2012.
49.49.49.49. FFFFair value of financial assets and financial liabilitiesair value of financial assets and financial liabilitiesair value of financial assets and financial liabilitiesair value of financial assets and financial liabilities
Fair value is the amount for which an asset could be exchanged, or a liability settled, between knowledgeable, willing, unrelated parties in an arm's length transaction.
49.1.49.1.49.1.49.1. Categories of valuation at fair value of financial assets and liabilities measured at Categories of valuation at fair value of financial assets and liabilities measured at Categories of valuation at fair value of financial assets and liabilities measured at Categories of valuation at fair value of financial assets and liabilities measured at fair value in the fair value in the fair value in the fair value in the statement of financial positionstatement of financial positionstatement of financial positionstatement of financial position
On the basis of applied methods of valuation at fair value, the Group classifies financial assets and liabilities to the following categories:
1) Level 1:Level 1:Level 1:Level 1: Financial assets and liabilities whose fair value is stated directly at prices quoted (not adjusted) from active markets for identical assets and liabilities. The Group classified to that category the following items:
− debt securities valued at fixing from Bondspot platform.
− debt and equity securities in the Brokerage House (Dom Maklerski) portfolio.
− debt and equity securities which are traded on regulated market.
2) Level 2:Level 2:Level 2:Level 2: Financial assets and liabilities whose fair value is determined with use of valuation models where all significant entry data are observable on the market directly (as prices) or indirectly (based on prices). The Group classified to that category the following items:
− debt securities valuated to the curve or those whose price comes from Bloomberg platform or brokerage pages in Reuters system but for which market is not active,
− non-treasury debt securities issued by other financial entities, local government bodies, non-financial entities quoted on the stock exchange or not traded on a regulated market,
− securities issued by Ministry of Finance of Ukraine in KREDOBANK SA portfolio,
− derivative instruments.
3) Level 3: Level 3: Level 3: Level 3: Financial assets and liabilities whose fair value is determined with use of valuation models, for which available data is not derived from observable markets. The Group classified to this category shares not quoted on Warsaw Stock Exchange (WSE), equity securities portfolio and debt securities portfolio of KREDOBANK SA.
Note 2 ‘Summary of significant accounting policies and estimates and judgements’ provides detailed information on the method of fair value calculation.

This document is a translation of a document originally issued in Polish. The only binding version is the original Polish version.
Consolidated Financial Statements of the Powszechna Kasa Oszczędności Bank Polski Spółka Akcyjna Group
for the year ended 31 December 2011 (in PLN thousand)
105
The table below presents a classification of financial assets and liabilities presented in the financial statements at fair value divided into three levels of the fair value hierarchy as at 31 December 2011:
Assets and liabilities valued at fair value as at Assets and liabilities valued at fair value as at Assets and liabilities valued at fair value as at Assets and liabilities valued at fair value as at 31313131.12..12..12..12.2011201120112011
NoteNoteNoteNote CarryingCarryingCarryingCarrying amountamountamountamount
Level Level Level Level 1111 Level 2Level 2Level 2Level 2 Level 3Level 3Level 3Level 3
Prices quoted on Prices quoted on Prices quoted on Prices quoted on the active marketsthe active marketsthe active marketsthe active markets
Valuation Valuation Valuation Valuation techniques based techniques based techniques based techniques based
on observon observon observon observableableableable market datamarket datamarket datamarket data
Other valuation Other valuation Other valuation Other valuation techniquestechniquestechniquestechniques
Trading assetsTrading assetsTrading assetsTrading assets 19 1 311 089 1 311 089 1 311 089 1 311 089 1 261 687 1 261 687 1 261 687 1 261 687 49494949 402 402 402 402 ---- Debt securities 1 300 164 1 250 762 49 402 -
Shares in other entities 10 925 10 925 - -
Derivative financial instrumentsDerivative financial instrumentsDerivative financial instrumentsDerivative financial instruments 20 3 064 733 3 064 733 3 064 733 3 064 733 5 066 5 066 5 066 5 066 3 059 667 3 059 667 3 059 667 3 059 667 ----
Hedging instruments 516 925 - 516 925 -
Trade instruments 2 547 808 5 066 2 542 742 -
Financial assets designated Financial assets designated Financial assets designated Financial assets designated upon initial recognition upon initial recognition upon initial recognition upon initial recognition at fair at fair at fair at fair value through profit and lossvalue through profit and lossvalue through profit and lossvalue through profit and loss
22 12 467 201 12 467 201 12 467 201 12 467 201 1 318 278 1 318 278 1 318 278 1 318 278 11 148 923 11 148 923 11 148 923 11 148 923 ----
Debt securities 12 467 201 1 318 278 11 148 923 -
Investment securities available for saleInvestment securities available for saleInvestment securities available for saleInvestment securities available for sale
24 14 393 276 14 393 276 14 393 276 14 393 276 8 465 685 8 465 685 8 465 685 8 465 685 5 891 671 5 891 671 5 891 671 5 891 671 35 920 35 920 35 920 35 920
Debt securities 14 307 525 8 415 854 5 891 671 -
Equity securities 85 751 49 831 - 35 920
Financial assets at fair value Financial assets at fair value Financial assets at fair value Financial assets at fair value ---- totaltotaltotaltotal 31 236 299 31 236 299 31 236 299 31 236 299 11 050 716 11 050 716 11 050 716 11 050 716 20 14920 14920 14920 149 663 663 663 663 35 920 35 920 35 920 35 920
Derivative financial instrumentsDerivative financial instrumentsDerivative financial instrumentsDerivative financial instruments 20 2 645 281 2 645 281 2 645 281 2 645 281 816 816 816 816 2 644 465 2 644 465 2 644 465 2 644 465 ---- Hedging instruments 342 598 - 342 598 -
Trade instruments 2 302 683 816 2 301 867 -
Debt securities in issueDebt securities in issueDebt securities in issueDebt securities in issue 33 175 615 175 615 175 615 175 615 ---- 175 615 175 615 175 615 175 615 ----
Financial instruments designated at fair value through profit and loss
175 615 - 175 615 -
Financial liabilities at fair value Financial liabilities at fair value Financial liabilities at fair value Financial liabilities at fair value ---- totaltotaltotaltotal 2 820 896 2 820 896 2 820 896 2 820 896 816 816 816 816 2 820 080 2 820 080 2 820 080 2 820 080 ----
Financial assets available for sale as at Financial assets available for sale as at Financial assets available for sale as at Financial assets available for sale as at 31.12.31.12.31.12.31.12.2011 2011 2011 2011 (Note 19(Note 19(Note 19(Note 19)))) CarryingCarryingCarryingCarrying amountamountamountamount
Level 1Level 1Level 1Level 1 Level 2Level 2Level 2Level 2 Level 3Level 3Level 3Level 3
Debt securities 1 300 164 1 250 762 49 402 -
Treasury bills 49 402 - 49 402 -
Treasury bonds 1 219 069 1 219 069 - -
Corporate bonds 15 186 15 186 - -
Municipal bonds 14 783 14 783 - -
BGK bonds 1 724 1 724 - -
Shares in other entities 10 925 10 925 - -
TOTALTOTALTOTALTOTAL 1 311 1 311 1 311 1 311 089089089089 1 261 6871 261 6871 261 6871 261 687 49 40249 40249 40249 402 ----
Financial assets designated Financial assets designated Financial assets designated Financial assets designated upon initial recognition upon initial recognition upon initial recognition upon initial recognition at fair value at fair value at fair value at fair value through profit and lossthrough profit and lossthrough profit and lossthrough profit and loss as at 31.12.as at 31.12.as at 31.12.as at 31.12.2011 2011 2011 2011 (Note 22(Note 22(Note 22(Note 22))))
CarryingCarryingCarryingCarrying amountamountamountamount
Level 1Level 1Level 1Level 1 Level 2Level 2Level 2Level 2 Level 3Level 3Level 3Level 3
Debt securities 12 467 201 1 318 278 11 148 923 -
NBP money market bills 8 593 791 - 8 593 791 -
Treasury bills 2 180 148 - 2 180 148 -
Treasury bonds PLN 1 318 278 1 318 278 - -
Treasury bonds EUR 122 089 - 122 089 -
Municipal bonds PLN 108 922 - 108 922 -
Municipal bonds EUR 143 973 - 143 973 -
TOTALTOTALTOTALTOTAL 12 467 20112 467 20112 467 20112 467 201 1 318 2781 318 2781 318 2781 318 278 11 148 92311 148 92311 148 92311 148 923 ----

This document is a translation of a document originally issued in Polish. The only binding version is the original Polish version.
Consolidated Financial Statements of the Powszechna Kasa Oszczędności Bank Polski Spółka Akcyjna Group
for the year ended 31 December 2011 (in PLN thousand)
106
Investment securities available for sale as at 31.12.2011 Investment securities available for sale as at 31.12.2011 Investment securities available for sale as at 31.12.2011 Investment securities available for sale as at 31.12.2011 (Note 24)(Note 24)(Note 24)(Note 24)
CarryingCarryingCarryingCarrying amountamountamountamount
Level 1Level 1Level 1Level 1 Level 2Level 2Level 2Level 2 Level 3Level 3Level 3Level 3
Debt securities available for sale 14 307 525 8 415 854 5 891 671 -
Treasury bonds PLN 8 414 865 8 414 865 - -
Treasury bonds EUR 11 720 - 11 720 -
Treasury bonds UAH 220 793 - 220 793 -
Treasury bonds USD 30 661 - 30 661 -
Municipal bonds 3 458 356 - 3 458 356 -
Corporate bonds 2 170 141 - 2 170 141 -
Treasury bills 989 989 - -
Equity securities 85 751 49 831 - 35 920
TOTALTOTALTOTALTOTAL 14 393 27614 393 27614 393 27614 393 276 8 465 6858 465 6858 465 6858 465 685 5 891 6715 891 6715 891 6715 891 671 35 92035 92035 92035 920
The table below presents a classification of financial assets and liabilities presented in the financial statements at fair value divided into three levels of the fair value hierarchy as at 31 December 2010.
Assets and liabilities valued at fair value as at Assets and liabilities valued at fair value as at Assets and liabilities valued at fair value as at Assets and liabilities valued at fair value as at 31.12.31.12.31.12.31.12.2010201020102010
NoteNoteNoteNote CarryingCarryingCarryingCarrying amountamountamountamount
Level Level Level Level 1111 Level 2Level 2Level 2Level 2 Level 3Level 3Level 3Level 3
Prices quoted on Prices quoted on Prices quoted on Prices quoted on the active marketsthe active marketsthe active marketsthe active markets
Valuation Valuation Valuation Valuation techniques based techniques based techniques based techniques based
on observon observon observon observableableableable market datamarket datamarket datamarket data
Other valuation Other valuation Other valuation Other valuation techniquestechniquestechniquestechniques
Trading assetsTrading assetsTrading assetsTrading assets 19191919 1 503 649 1 503 649 1 503 649 1 503 649 1 448 815 1 448 815 1 448 815 1 448 815 54 834 54 834 54 834 54 834 ---- Debt securities 1 491 053 1 436 219 54 834 -
Shares in other entities 12 596 12 596 - -
Derivative financial instrumentsDerivative financial instrumentsDerivative financial instrumentsDerivative financial instruments 20202020 1 719 085 1 719 085 1 719 085 1 719 085 718 718 718 718 1 718 367 1 718 367 1 718 367 1 718 367 ----
Hedging instruments 153 921 - 153 921 -
Trade instruments 1 565 164 718 1 564 446 - Financial assets designated Financial assets designated Financial assets designated Financial assets designated upon initial recognition upon initial recognition upon initial recognition upon initial recognition at fair at fair at fair at fair value through profit and lossvalue through profit and lossvalue through profit and lossvalue through profit and loss
22222222
10 758 331 10 758 331 10 758 331 10 758 331 3 048 210 3 048 210 3 048 210 3 048 210 7 710 121 7 710 121 7 710 121 7 710 121 ----
Debt securities 10 758 331 3 048 210 7 710 121 -
Investment securities available for saleInvestment securities available for saleInvestment securities available for saleInvestment securities available for sale 24242424 24242424
10 219 400 10 219 400 10 219 400 10 219 400 5 746 686 5 746 686 5 746 686 5 746 686 4 463 428 4 463 428 4 463 428 4 463 428 9 286 9 286 9 286 9 286
Debt securities 10 123 419 5 659 991 4 463 428 -
Equity securities 95 981 86 695 - 9 286
Financial assets at fair value Financial assets at fair value Financial assets at fair value Financial assets at fair value ---- totaltotaltotaltotal 24 200 465 24 200 465 24 200 465 24 200 465 10 244 429 10 244 429 10 244 429 10 244 429 13 946 750 13 946 750 13 946 750 13 946 750 9 286 9 286 9 286 9 286
Derivative financial instrumentsDerivative financial instrumentsDerivative financial instrumentsDerivative financial instruments 20202020 ---- Hedging instruments 555 983 - 555 983 -
Trade instruments 1 848 812 - 1 848 812 -
Financial liabilities at fair value Financial liabilities at fair value Financial liabilities at fair value Financial liabilities at fair value ---- totaltotaltotaltotal 2 404 795 2 404 795 2 404 795 2 404 795 ---- 2 404 795 2 404 795 2 404 795 2 404 795 ----
Financial assets available for sale as Financial assets available for sale as Financial assets available for sale as Financial assets available for sale as at 31.12.2010 at 31.12.2010 at 31.12.2010 at 31.12.2010 (Note 19)(Note 19)(Note 19)(Note 19) CarryingCarryingCarryingCarrying amountamountamountamount
Level 1Level 1Level 1Level 1 Level 2Level 2Level 2Level 2 LevelLevelLevelLevel 3333
Debt securities 1 491 053 1 436 219 54 834 - Treasury bills - - - -
Treasury bonds 1 483 144 1 428 310 54 834 -
Corporate bonds 519 519 - -
Municipal bonds 7 390 7 390 - -
BGK bonds - - - -
Shares in other entities 12 596 12 596 - -
TOTALTOTALTOTALTOTAL 1 503 6491 503 6491 503 6491 503 649 1 448 8151 448 8151 448 8151 448 815 54 83454 83454 83454 834 ----
Financial assets designated Financial assets designated Financial assets designated Financial assets designated upon initial recognition upon initial recognition upon initial recognition upon initial recognition at fair value at fair value at fair value at fair value through pthrough pthrough pthrough profit and loss as at 31.12.2010 rofit and loss as at 31.12.2010 rofit and loss as at 31.12.2010 rofit and loss as at 31.12.2010 (Note 22)(Note 22)(Note 22)(Note 22)
CarryingCarryingCarryingCarrying amountamountamountamount
Level 1Level 1Level 1Level 1 Level 2Level 2Level 2Level 2 Level 3Level 3Level 3Level 3
Debt securities 10 758 331 3 048 210 7 710 121 - NBP money market bills 3 997 780 - 3 997 780 -
Treasury bills 1 893 058 - 1 893 058 -
Treasury bonds PLN 4 738 644 3 048 210 1 690 434 -
Municipal bonds EUR 128 849 - 128 849 -
TOTALTOTALTOTALTOTAL 10 758 33110 758 33110 758 33110 758 331 3 048 2103 048 2103 048 2103 048 210 7 710 1217 710 1217 710 1217 710 121 ----

This document is a translation of a document originally issued in Polish. The only binding version is the original Polish version.
Consolidated Financial Statements of the Powszechna Kasa Oszczędności Bank Polski Spółka Akcyjna Group
for the year ended 31 December 2011 (in PLN thousand)
107
Investment securities available for sale as at 31.12.2010 Investment securities available for sale as at 31.12.2010 Investment securities available for sale as at 31.12.2010 Investment securities available for sale as at 31.12.2010 (Note 24)(Note 24)(Note 24)(Note 24)
CarryingCarryingCarryingCarrying amountamountamountamount
Level 1Level 1Level 1Level 1 Level 2Level 2Level 2Level 2 Level 3Level 3Level 3Level 3
Debt securities available for sale 10 123 419 5 659 991 4 463 428 - Treasury bonds PLN 5 636 357 5 636 357 - -
Treasury bonds EUR - - - -
Treasury bonds UAH 153 323 - 153 323 -
Treasury bonds USD - - - -
Municipal bonds 2 824 173 - 2 824 173 -
Corporate bonds 1 485 932 - 1 485 932 -
Treasury bills 23 634 23 634 - -
Equity securities 95 981 86 695 - 9 286
TOTALTOTALTOTALTOTAL 10 219 40010 219 40010 219 40010 219 400 5 746 6865 746 6865 746 6865 746 686 4 463 4284 463 4284 463 4284 463 428 9 2869 2869 2869 286
Between 2011 and 2010, there was a change in the approach to the Polish Treasury bonds denominated in Polish zloty for which there is no BondSpot fixing, including the bonds which in line with the principles of the BondSpot market do not have BondSpot fixing due to the short term to maturity. In 2010, the prices for such bonds were obtained from Bloomberg websites or from broker sites in the Reuters system. As from 2011, the revaluation price for the above-mentioned bonds is the market price in the regulated BondSpot market. Apart from the above change, there were no significant transfers between levels 1 and 2 in 2011 and 2010.
The table below presents the classification of financial assets and liabilities measured in the period at fair value divided into a three-level hierarchy (1 January 2011 - 31 December 2011):
Financial assets Financial assets Financial assets Financial assets designated at fair designated at fair designated at fair designated at fair
valuevaluevaluevalue through profit through profit through profit through profit and loand loand loand lossssssss
Investment securities Investment securities Investment securities Investment securities available for saleavailable for saleavailable for saleavailable for sale
TotalTotalTotalTotal
Opening balance as at 1 January 2011Opening balance as at 1 January 2011Opening balance as at 1 January 2011Opening balance as at 1 January 2011 ---- 9 286 9 286 9 286 9 286 9 286 9 286 9 286 9 286 Total gains or losses 3 628 3 994 7 622
in financial result 3 628 3 994 7 622
Purchase - 25 900 25 900
Sales (3 628) (3 260) (6 888)
Closing balance as at 31 December 2011Closing balance as at 31 December 2011Closing balance as at 31 December 2011Closing balance as at 31 December 2011 ---- 35 920 35 920 35 920 35 920 35 920 35 920 35 920 35 920
Total gains or losses for the period in the financial result for Total gains or losses for the period in the financial result for Total gains or losses for the period in the financial result for Total gains or losses for the period in the financial result for assets held at the end of the periodassets held at the end of the periodassets held at the end of the periodassets held at the end of the period
3 628 3 628 3 628 3 628 3 994 3 994 3 994 3 994 7 622 7 622 7 622 7 622
Financial assets Financial assets Financial assets Financial assets designated at fair designated at fair designated at fair designated at fair
valuevaluevaluevalue through profit through profit through profit through profit and lossand lossand lossand loss
Investment securities Investment securities Investment securities Investment securities available for saleavailable for saleavailable for saleavailable for sale
TotalTotalTotalTotal
Opening balance as at 1 January 2010Opening balance as at 1 January 2010Opening balance as at 1 January 2010Opening balance as at 1 January 2010 4 159 4 159 4 159 4 159 7 846 7 846 7 846 7 846 12 005 12 005 12 005 12 005
Total gains or losses (3 885) 1 182 (2 703)
in financial result (3 885) 262 (3 623)
total in other comprehensive income - 920 920
Purchase - 4 950 4 950
Sales (274) (3 663) (3 937)
Transfer to or from level 3 - (1 029) (1 029)
Closing balance as at 31 December 2010Closing balance as at 31 December 2010Closing balance as at 31 December 2010Closing balance as at 31 December 2010 ---- 9 286 9 286 9 286 9 286 9 286 9 286 9 286 9 286
Total gains or losses for the period in the financial result for Total gains or losses for the period in the financial result for Total gains or losses for the period in the financial result for Total gains or losses for the period in the financial result for assets held at the end of assets held at the end of assets held at the end of assets held at the end of the periodthe periodthe periodthe period
(3 885)(3 885)(3 885)(3 885) 262 262 262 262 (3 623)(3 623)(3 623)(3 623)

This document is a translation of a document originally issued in Polish. The only binding version is the original Polish version.
Consolidated Financial Statements of the Powszechna Kasa Oszczędności Bank Polski Spółka Akcyjna Group
for the year ended 31 December 2011 (in PLN thousand)
108
49.2.49.2.49.2.49.2. Financial assets and liabilities not presented at fair value in the statement of financial positionFinancial assets and liabilities not presented at fair value in the statement of financial positionFinancial assets and liabilities not presented at fair value in the statement of financial positionFinancial assets and liabilities not presented at fair value in the statement of financial position
The Group holds certain financial instruments which are not stated at fair value in the statement of financial position.
Where there is no market value of financial instruments available, their fair values have been estimated using various valuation techniques. The fair value of financial instruments was measured using a model based on estimating the present value of future cash flows by discounting them using relevant interest rates. All models calculations include certain simplifying assumptions and therefore are sensitive to those assumptions. Set out below is a summary of the main methods and assumptions used for estimation of fair values of financial instruments which are not presented at fair value.
For certain categories of financial instruments it has been assumed that their carrying amount equals approximately their fair values, which is due to lack of expected material differences between their carrying amount and their fair value resulting from the features of these groups (such as short term character, high correlation with market parameters, unique character of the instrument). This applies to following groups of financial instruments:
− loans and advances to customers: a portion of the mortgage loans portfolio (the so-called ‘old portfolio’), loans with no specified repayment schedule, which are due at the moment of valuation
− amounts due to clients: liabilities with no specified payment schedule, other specific products for which no active market exists, such as housing plan passbooks and bills of savings,
− deposits and interbank placements with maturity date up to 7 days or with a variable interest rate,
− loans and advances granted and taken on interbank market at a variable interest rate (change of interest rate maximum on a three month basis),
− cash and balances with the Central Bank and amounts due to the Central Bank,
− other financial assets and liabilities,
− debt securities in issue (at variable interest rate), issued by KREDOBANK and BFL.
With regard to loans and advances to clients, the fair value of these instruments has been calculated using discounted future cash flows, and applying current interest rates plus a risk margin and relevant scheduled repayment dates. The current margin level has been established based on transactions with similar credit risk executed during the last quarter of the year ended as of the balance sheet date.
The fair value of deposits and other amounts due to customers other than banks, with specified maturities, has been calculated using the discounted expected future cash flows and applying current interest rates for given deposit products.
The fair value of the subordinated debt of the Bank has been estimated based on the expected future cash flows discounted using the yield curve.
The fair value of debt securities issued by PKO Bank Polski SA has been estimated based on expected future cash flows discounted using the current interbank interest rates.
The fair value of debt securities issued by PKO Finance AB has been estimated using Bloomberg data.
The fair value of interbank placements and deposits has been estimated based on the expected future cash flows discounted using the current interbank interest rates.
Receivables on financial lease have been estimated based on expected cash flows discounted using internal rate of return for lease transactions of the same kind, concluded by the Group in the period directly preceding the balance sheet date.

This document is a translation of a document originally issued in Polish. The only binding version is the original Polish version.
Consolidated Financial Statements of the Powszechna Kasa Oszczędności Bank Polski Spółka Akcyjna Group
for the year ended 31 December 2011 (in PLN thousand)
109
The table below shows a summary of the carrying amounts and fair values for the individual groups of financial instruments which have not been presented at fair value in the Group’s statement of financial positions as at 31 December 2011 and 31 December 2010:
31.12.20131.12.20131.12.20131.12.2011111 31.12.2031.12.2031.12.2031.12.2010101010
ccccarrying amountarrying amountarrying amountarrying amount ffffair valueair valueair valueair value ccccarrying amountarrying amountarrying amountarrying amount ffffair value air value air value air value
Cash and balances with the central bank 9 142 168 9 142 168 6 182 412 6 182 412
Amounts due from banks 2 396 227 2 395 600 2 307 032 2 310 677
Loans and advances to customers 141 634 494 134 828 126 130 668 119 132 354 672
corporate loans 48 929 163 47 334 318 44 842 815 45 730 364
consumer loans 22 872 908 22 444 892 24 129 437 24 276 727
mortgage loans 69 832 423 65 048 916 61 695 867 62 347 581
Other financial assets 431 144 431 144 374 088 374 088
Amounts due to the central bank 3 454 3 454 3 370 3 370
Amounts due to banks 6 239 164 6 234 511 5 233 875 5 233 592
Amounts due to customers 146 473 897 146 495 779 132 981 215 132 769 766
due to corporate entities 38 468 560 38 468 586 31 826 551 31 617 979
due to state budget entities 3 822 243 3 822 243 6 046 810 6 046 896
due to retail clients 104 183 094 104 204 950 95 107 854 95 104 891
Debt securities in issue 7 771 779 7 773 693 3 298 867 3 298 867
Subordinated liabilities 1 614 377 1 618 446 1 611 779 1 617 238
Other financial liabilities 1 857 592 1 857 592 1 307 838 1 307 838
50.50.50.50. FiduciaryFiduciaryFiduciaryFiduciary activitiesactivitiesactivitiesactivities
The Bank is a direct participant in the National Depository for Securities (Krajowy Depozyt Papierów Wartościowych) and the Securities Register (at the National Bank of Poland). The Bank maintains investment accounts, services transactions on the domestic and foreign markets, and provides fiduciary services and performs depository role for pension and investment funds. Assets placed in the Bank within fiduciary services are not included in these financial statements as they do not meet the criteria of an asset.
Moreover, as a member of the Council of Depositary Banks and the Council of Non-treasury Debt Securities by the Polish Bank Association, PKO Bank Polski SA takes part in developing regulations and market standards.
51.51.51.51. SaleSaleSaleSale of impaired loan portfoliosof impaired loan portfoliosof impaired loan portfoliosof impaired loan portfolios
The Group did not enter any securitisation transactions, although:
− in 2010, the Bank performed a bundle sale of 120 thousand retail receivables classified as ‘loss’ in relation to individuals who do not conduct business activities. The debt portfolio amounted to PLN 1 127 million and 1.4 thousand of receivables from institutional clients classified as 'loss’, with a total value of PLN 307 million,
− in the first half of 2011, the Bank carried out another bundle sale of 51 thousand retail receivables classified as ‘loss’ in relation to individuals who do not conduct business activities. The sale covered a bundle with a total debt of PLN 565 million.
− in the second half of 2011, the subsequent bundle sales were carried for which sales agreements were signed in 2011:
a) in the third quarter, over 49 thousand retail receivables classified as ‘loss’ in relation to individuals who do not conduct business activities. The sale covered a portfolio with a total debt of PLN 418 million,

This document is a translation of a document originally issued in Polish. The only binding version is the original Polish version.
Consolidated Financial Statements of the Powszechna Kasa Oszczędności Bank Polski Spółka Akcyjna Group
for the year ended 31 December 2011 (in PLN thousand)
110
b) in the fourth quarter, over 43 thousand retail receivables classified as ‘loss’ in relation to individuals who do not conduct business activities. The sale covered a portfolio with a total debt of PLN 533 million,
c) in the fourth quarter, over 4 thousand receivables from institutional customers in the impaired loans portfolio classified as ‘loss’ with a total value of PLN 520 million,
− the total carrying amount of the provision for potential claims on impaired loans portfolios sold as at 31 December 2011 amounted to PLN 3 945 thousand (as at 31 December 2010 it was PLN 11 430 thousand). The Bank did not receive any securities on account of the above-mentioned transactions.
52.52.52.52. Differences between previously published financial statements and these financial statementsDifferences between previously published financial statements and these financial statementsDifferences between previously published financial statements and these financial statementsDifferences between previously published financial statements and these financial statements
In 2011 there were no significant changes in relation to previously published financial statements.
53.53.53.53. Influence of macroeconomic Influence of macroeconomic Influence of macroeconomic Influence of macroeconomic situation on the Groupsituation on the Groupsituation on the Groupsituation on the Group’s results’s results’s results’s results
The macroeconomic situation, including the continued economic revival in the conditions of high uncertainty related to the fiscal crisis in the euro zone, had a significant effect on the activities and financial standing of the Group in 2011. In 2011, the increased volatility of financial markets continued; it was mainly related to the deterioration in the economic growth perspectives in the largest global economies and the escalation of the debt crisis in euro zone countries. The highest scale of volatility occurred in the third quarter of 2011, as a result of the deterioration in global economy growth perspectives, the increased risk of Greece's insolvency and the downgraded credit rating of the USA. In response to the further deterioration in conditions on the financial markets, the euro zone countries continued working on mechanisms that would stabilise public finance and on another financial support programme for Greece. In recent months, the European Central Bank has also announced a number of actions aimed at relaxing the monetary policy and stabilising the situation in the banking sector, including a 3-year LTRO (Long-Term Refinancing Operation) loan, which significantly reduced the systemic risk for the European banking system.
The economic growth in Poland accelerated to 4.3% in 2011 (from 3.9% in 2010), making Poland one of the leaders in economic growth in Europe. The economic growth dynamics were stimulated by stable private consumption in conditions of a stabilised situation on the labour market and the continuation of public investments in infrastructure. On the other hand, the continued uncertainty which was mainly related to the situation in Poland's external environment determined prudent investment activities of enterprises. The increase in the risk premium in the third quarter of 2011 was a cause for the weakening of the Euro and Polish złoty exchange rates.
PKO Bank Polski SA has positively passed the pan-European stress tests carried out in the middle of 2011 by the European Banking Authority (EBA) in cooperation with national supervision authorities. The tests which constituted a theoretical test of resistance in the event of a potential macroeconomic downturn, showed that the Bank considerably exceeded the minimum ratios adopted for the tests. The Bank has also successfully passed the stress tests carried out by the Polish Financial Supervision Authority and an examination carried out by the EBA concerning the effect of introducing the minimum level of equity in relation to risk-weighted assets (Common Equity Tier 1 ratio) at a level of 9%. It is worth noting that the Group does not have exposures in debt securities issued by governments of the euro zone peripheral countries and the Hungarian government. The results for 2012, including the level of dividend paid, may be significantly affected by the expectation formulated by the PFSA in December 2011 concerning maintaining the capital adequacy ratio on a level above 12%.
Taking into account the impact of the macroeconomic situation on the condition of the customers of PKO Bank Polski, the Group strictly follows a conservative approach to risk by recognising impairment losses whose scale and structure reflects the impact of the current macroeconomic situation on the Group’s financial statements.
In 2011, the Group earned the best financial results in its history. At the same time, the Group is the leader of the banking sector in terms of total assets, equity, loans granted and deposits accepted.

This document is a translation of a document originally issued in Polish. The only binding version is the original Polish version.
Consolidated Financial Statements of the Powszechna Kasa Oszczędności Bank Polski Spółka Akcyjna Group
for the year ended 31 December 2011 (in PLN thousand)
111
In 2011, the Group developed its business activities based on a safe and effective structure of financing. The dynamic development of the loan activity was financed with the increase in amounts due to customers (including funds from the issue of Eurobonds) and the increase in amounts due in respect of own issue of debt securities to the domestic market.
High financial results have been achieved with considerable growth dynamics of net interest income compared with the previous year, accompanied by an increase in administrative expenses. At the same time, the aggregate dynamics of the Bank’s income items considerably exceeded the growth dynamics of administrative expenses, which translated into the increased effectiveness of the Bank's operations.
The financial results achieved by the Group are an important component of the ‘Leader’ Strategy of PKO Bank Polski SA adopted by the Management Board of the Bank and approved by its Supervisory Board in February 2010. The strategy set out two main strategic objectives for 2010-2012: PKO Bank Polski SA being a clear leader of the Polish banking sector and being a stable, profitable and effective bank. The strategy, focused on fulfilling the needs of the Bank’s customers, as well as the expectations of its owners and employees, provides for the continuation of sustainable growth, synergies and leveraging the potential of the entire Group. PKO Bank Polski is the central entity of an efficient Group, offering comprehensive services to its customers. The actions undertaken as part of the Bank's Strategy include a number of initiatives aimed at fully utilising the potential of all the subsidiaries in order to optimise the business benefits.
Due to the exposure in Ukrainian companies, in particular KREDOBANK SA, the Group is exposed to the effects or risks characteristic to the Ukrainian market. In 2011, economic growth in the Ukraine accelerated to 5.2% y/y. The favourable economic situation and the drop in dynamics of prices resulted in maintaining a strong real increase in salaries. At the same time, the actions undertaken by the central bank ensured the stability of the exchange rate, in spite of the disturbances on the international financial markets. In the context of a good economic condition, the situation of the banking sector improved gradually, which was expressed in a growth in the profitability ratios and a drop in the ratio of impaired loans to the total loan portfolio.
PKO Bank Polski SA continues to implement measures aimed at ensuring the safe functioning of its companies in Ukraine in the environment of the current macroeconomic situation in the Ukraine. These measures include strengthening oversight activities, monitoring funds transferred to the Companies by the Bank and the development of the regulatory requirements determined by the National Bank of Ukraine in KREDOBANK SA.
OBJECTIVES AND PRINCIPLES OF RISK MAOBJECTIVES AND PRINCIPLES OF RISK MAOBJECTIVES AND PRINCIPLES OF RISK MAOBJECTIVES AND PRINCIPLES OF RISK MANAGEMENT RELATED TO FINANCIAL INSTRUMENTSNAGEMENT RELATED TO FINANCIAL INSTRUMENTSNAGEMENT RELATED TO FINANCIAL INSTRUMENTSNAGEMENT RELATED TO FINANCIAL INSTRUMENTS
54.54.54.54. RiskRiskRiskRisk management management management management in in in in the the the the GroupGroupGroupGroup
Risk management is one the most important internal processes both in PKO Bank Polski SA and other entities of the PKO Bank Polski SA Group. Risk management aims at ensuring an appropriate level of security and profitability of business activity in the changing legal and economic environment and the level of the risks plays an important role in the planning process.
At the PKO Bank Polski SA Group the following types of risk have been identified, which are subject to management: credit risk, interest rate risk, currency risk, liquidity risk, price risk of equity instruments, operational risk, compliance risk, business risk (including strategic risk) and reputation risk. Derivatives risk is a subject to a special control due to the specific characteristics of these instruments.
The process of banking risk management in the Group consists of the following stages:
– risk identification – the identification of actual and potential sources of risk and estimation of the significance of the potential influence of a given type of risk on the financial situation in the Group. Within the risk identification process, types of risk perceived as material in the banking activity, the entities of the Group and the whole Group’s activity are identified,
– risk measurement and assessment – defining risk assessment tools adequate to the type and significance of the risk, data availability and quantitative risk assessment by means of defined tools, as well as risk assessment aimed at identifying the scale or scope of risk, taking into account the achievement of goals of risk management. Within risk measurement, stress-test are being conducted on the basis of assumption providing a fair risk assessment,

This document is a translation of a document originally issued in Polish. The only binding version is the original Polish ver
the Powszechna Kasa Oszczędności Bank Polski
– risk forecasting and monitoring and adopted reference points (e.g. limitsissued recommendations and suggestions). Risk monitoring is performed with the frequency adequate to the materiality and volatility of a specific risk type,
– risk reporting – periodic informing the Management of thetaken actions and recommendationsmanaging level of the recipients,
– management actions – includingtolerance, establishing limits and thresholdsof tools supporting risk management. The management and credit risk level.
The risk management process is described on the chart below.
Risk management in the Group is based specially on the following principles:
– the Group manages all of the identified types of banking risk,– the risk level is monitored on a curr– the risk management process is appropriate to the scale of the operations and to the materiality
and complexity of a given risk and tailored to new risk factors– the risk management methods (in particula
systems are tailored to the scale and complexity of the risk and verified and basis,
– the risk management process management strategy, in particular with regard to the
– the area of risk and debt recovery remains organi– risk management is integrated with the planning and co
Risk management in the Bank takes place in all of the organi
The organisation of risk management is presented in the chart below:
Management actions
This document is a translation of a document originally issued in Polish. The only binding version is the original Polish ver
Consolidated Financial Statements of Powszechna Kasa Oszczędności Bank Polski Spółka Akcyjna Group
for the year ended 31 December 2011
risk forecasting and monitoring – preparing risk level forecasts and monitoring deviances from forecasts and adopted reference points (e.g. limits, thresholds, plans, measurements from the previous periodissued recommendations and suggestions). Risk monitoring is performed with the frequency adequate to
atility of a specific risk type, periodic informing the Management of the Bank about the results of risk assessment
taken actions and recommendations. Scope, frequency and the form of reporting is adjusted to the anaging level of the recipients,
including, among others, issuing internal regulations, estestablishing limits and thresholds, issuing recommendations, making
of tools supporting risk management. The objective of taking management actions is to form the risk k level.
The risk management process is described on the chart below.
is based specially on the following principles:
dentified types of banking risk, the risk level is monitored on a current basis, the risk management process is appropriate to the scale of the operations and to the materialityand complexity of a given risk and tailored to new risk factors and sources on a current basis,the risk management methods (in particular the models and their assumptions) and the risk measurement systems are tailored to the scale and complexity of the risk and verified and validated on a periodical
the risk management process supports the pursuit of the Group’s strategy in keepinin particular with regard to the level of tolerance of the risk,
the area of risk and debt recovery remains organisationally independent of business activities,risk management is integrated with the planning and controlling systems.
Risk management in the Bank takes place in all of the organisational units of the Bank.
of risk management is presented in the chart below:
Measurement and assessment
Forecasting and monitoring
Reporting
Management actions
Identification
This document is a translation of a document originally issued in Polish. The only binding version is the original Polish version.
(in PLN thousand)
112
preparing risk level forecasts and monitoring deviances from forecasts measurements from the previous period.
issued recommendations and suggestions). Risk monitoring is performed with the frequency adequate to
Bank about the results of risk assessment, frequency and the form of reporting is adjusted to the
establishing the level of risk making decisions about the use
of taking management actions is to form the risk
the risk management process is appropriate to the scale of the operations and to the materiality, scale current basis,
r the models and their assumptions) and the risk measurement validated on a periodical
’s strategy in keeping with the risk level of tolerance of the risk,
ependent of business activities,
al units of the Bank.

This document is a translation of a document originally issued in Polish. The only binding version is the original Polish ver
the Powszechna Kasa Oszczędności Bank Polski
The organiThe organiThe organiThe organisationsationsationsation of risk management chartof risk management chartof risk management chartof risk management chart
The risk management process is a regular basis about the risk profile of the Bank as well as of the PKO Bank Polski SA Group and the most important activities taken in the area of risk management.
The Bank’s Management Board is responsible for the risk management, including supervising and monitoring of activities taken by the Bank in the area of risk management. The Bank’s Management Board approves the most important decisions affecting the risk profile of the Bank anrisk management system.
The risk management process is carried out in three, mutually independent lines of defence:1) the first line of defence, which is functional internal control that ensures using risk controls
compliance of the activities with the2) the second line of defence, which is the risk management system, including risk management
methods, tools, process and 3) the third line of defence, which is
The independence of the lines of defence consists of preserving organiareas:
– the function of the second line of defence as regards creating system solutions is independent of the function of the first line of defence,
– the function of the third line of defence is independent of the functions of the fidefence,
– the function of managing the compliance risk reports directly to the Member of the Management Board of the Bank.
The first line of defence is being performed in the organithe Head Office and entities of the Group and concerns the activities of those units and entities which may generate risk. The units, cells and entities of the Group are responsible for identifying risks, designing and implementing appropriate controls, including in the external entities, unless controls have been implemented as part of the measures taken in the second line of to have comparable and cohesive systems of risk control account the specific business characteristic of ea
This document is a translation of a document originally issued in Polish. The only binding version is the original Polish ver
Consolidated Financial Statements of Powszechna Kasa Oszczędności Bank Polski Spółka Akcyjna Group
for the year ended 31 December 2011
of risk management chartof risk management chartof risk management chartof risk management chart
The risk management process is supervised by the Supervisory Board of the Bank, which is informed on regular basis about the risk profile of the Bank as well as of the PKO Bank Polski SA Group and the most
important activities taken in the area of risk management.
t Board is responsible for the risk management, including supervising and monitoring in the area of risk management. The Bank’s Management Board approves the
most important decisions affecting the risk profile of the Bank and enacts internal regulations defining the
The risk management process is carried out in three, mutually independent lines of defence:the first line of defence, which is functional internal control that ensures using risk controls compliance of the activities with the generally applicable laws, the second line of defence, which is the risk management system, including risk management methods, tools, process and organisation of risk management, the third line of defence, which is an internal audit.
The independence of the lines of defence consists of preserving organisational independence in the following
the function of the second line of defence as regards creating system solutions is independent of the first line of defence,
the function of the third line of defence is independent of the functions of the fi
the function of managing the compliance risk reports directly to the Member of the Management Board of
e is being performed in the organisational units of the Bank, the organithe Head Office and entities of the Group and concerns the activities of those units and entities which may
d entities of the Group are responsible for identifying risks, designing and implementing appropriate controls, including in the external entities, unless controls have been implemented as part of the measures taken in the second line of defence. At the same time the Group’s entities are obliged to have comparable and cohesive systems of risk control in the bank and in the Group’s entities, account the specific business characteristic of each entity and market conditions.
This document is a translation of a document originally issued in Polish. The only binding version is the original Polish version.
(in PLN thousand)
113
he Bank, which is informed on regular basis about the risk profile of the Bank as well as of the PKO Bank Polski SA Group and the most
t Board is responsible for the risk management, including supervising and monitoring in the area of risk management. The Bank’s Management Board approves the
d enacts internal regulations defining the
The risk management process is carried out in three, mutually independent lines of defence: the first line of defence, which is functional internal control that ensures using risk controls and
the second line of defence, which is the risk management system, including risk management
al independence in the following
the function of the second line of defence as regards creating system solutions is independent of the
the function of the third line of defence is independent of the functions of the first and second lines of
the function of managing the compliance risk reports directly to the Member of the Management Board of
al units of the Bank, the organisational units of the Head Office and entities of the Group and concerns the activities of those units and entities which may
d entities of the Group are responsible for identifying risks, designing and implementing appropriate controls, including in the external entities, unless controls have been implemented
me time the Group’s entities are obliged in the bank and in the Group’s entities, taking into

This document is a translation of a document originally issued in Polish. The only binding version is the original Polish version.
Consolidated Financial Statements of the Powszechna Kasa Oszczędności Bank Polski Spółka Akcyjna Group
for the year ended 31 December 2011 (in PLN thousand)
114
The second line of defence is being performed, in particular, in the Risk and Debt Collection Area, the specialist organisational units of the Bank responsible for credit analyses, the organisational unit of the Head Office managing the compliance risk, as well as the organisational units of the Head Office responsible for controlling.
The third line of defence is being performed as part of internal audit, including the audit of the effectiveness of the system of managing the risk relating to the Bank’s activities.
The organisational units of the Head Office of the Bank that are grouped within the Banking Risk Division, the Restructuring and Debt Collection Division, and the Credit Risk Assessment Department manage risk within the limits of competence assigned to them.
The Banking Risk Division is responsible for:
– identifying risk factors and sources, – measuring, assessing, and monitoring and reporting risk levels (material risks) on a regular basis, – measuring and assessing capital adequacy, – preparing recommendations for the Management Board of the Bank or committees regarding the
acceptable level of risk, – creating internal regulations on managing risk and capital adequacy, – developing IT systems dedicated to supporting risk and capital adequacy management.
The Restructuring and Debt Collection Department is responsible for:
– recovering receivables from difficult clients swiftly and increasing the effectiveness of such measures, – effective and early monitoring of delays in the collection of receivables of retail market clients, – selling difficult receivables effectively and outsourcing the tasks carried out, as well as effective
management of assets taken over as a result of recovering the Bank’s receivables.
The Analysis and Credit Risk Assessment Centre (Centrum Analiz i Oceny Ryzyka Kredytowego) is responsible for evaluating and verifying the level of credit risk level assessed in respect of individual credit exposures, which due to the scale of the exposure, client’s segment or risk level required independent assessment. In connection with the implementation of the T Recommendation by the Bank, the Analysis and Credit Risk Assessment Centre takes lending decisions in respect of individual clients.
Risk management is supported by the following committees: – Risk Committee (RC), – Assets & Liabilities Committee (ALCO), – Bank’s Credit Committee (BCC), – Central Credit Committee (CCC), – the Operating Risk Committee (ORC), – credit committees which operate in the regional retail and corporate branch offices.
The RC monitors the integrity, adequacy and efficiency of the bank risk management system, as well as capital adequacy and implementation of the risk management policies consistent with the Bank’s Strategy, and analyses and evaluates the application of strategic risk limits specified in the PKO Bank Polski SA’s Bank Risk Management Strategy.
The RC supports the Supervisory Board in the bank risk management process by formulating recommendations and making decisions concerning capital adequacy and the efficiency of the bank risk monitoring system.
ALCO makes decisions within the scope of granted authorisations and issues recommendations to the Bank’s Management Board with regard to portfolio credit risk management, interest rate risk management, currency risk, liquidity risk and the Bank’s asset and liabilities management. The Committee is chaired by the President of the Bank’s Management Board.
BCC makes loan decisions with regard to significant individual loan exposures, or issues recommendations in this respect to the Bank’s Management Board.
CCC supports the decisions taken by the relevant managing directors and the Bank’s Management Board members with its recommendations and the credit committees operating in the regions support branch directors and directors of the Regional Corporate Branches in matters bearing a higher risk level.
This document is a translation of a document originally issued in Polish. The only binding version is the original Polish version.
Consolidated Financial Statements of the Powszechna Kasa Oszczędności Bank Polski Spółka Akcyjna Group
for the year ended 31 December 2011 (in PLN thousand)
115
ORC supports the Bank’s Management Board in the process of managing operating risk by:
– giving recommendations, inter alia, as to the Bank's Management Board approval of the level of operating risk tolerance, operating risk limits reserved for the competences of the Bank's Management Board, defining operating risk stress tests and other activities related to systemic management of the operating risk,
– taking decisions in respect of thresholds and critical values of key risk indicators (KRI), operating risk limits reserved for the competences of ORC, values of key parameters used in calculating value at risk (VaR) in respect of operating risk, and individual approach to outliers.
Moreover, ORC prepares operating risk management recommendations for member companies of the PKO Bank Polski SA Group, which are submitted to the Group’s entities as part of the Bank’s corporate governance.
The Bank supervises activities of the individual subsidiaries of the PKO Bank Polski SA Group. As part of this supervision, the Bank sets out and approves their development strategies, including the level of the risk. The Bank also supervises the entities’ risk management systems and provides support in the development of these systems. Additionally, it reflects business risk of the particular Group entities in the risk reporting and risk monitoring system of the entire Group.
The internal regulations concerning management of certain types of risk in the entities of the Group are defined by internal regulations implemented by those entities, after consulting the Bank’s opinion and having taken into account the recommendations issued to the entities by the Bank. The internal regulations of the entities concerning risk management allow for consistent and comparable assessment of particular types of risk within the Bank and entities of the Group, as well as reflect the specific nature of the entity’s activity and the market on which it operates.
PKO Bank Polski SA’s top priority is to maintain its strong capital position and to further increase its stable sources of financing underlying the stable development of business activity, while maintaining the priorities of efficiency and effective cost control.
On 21 June 2011 PKO Bank Polski SA obtained the consent of the Polish Financial Supervision Authority (PFSA) for applying statistical methods to calculate capital requirements for operating risk (AMA) as of 30 June 2011, with temporary limitation (until the elimination of the PFSA conditions) on a decrease in capital requirements no more than to the level of 75% of the requirement calculated by the standardised approach.
Moreover, in 2011 the PKO Bank Polski Group participated in a stress tests organised by EBA (European Banking Authority). The test results confirmed the Group’s strong equity position and significant resistence to potential negative market scenarios.
In 2011, actions were carried out in relation to the development of the credit risk measurement methodology in KREDOBANK SA aimed at adapting the solutions to IAS. Active efforts were also made to automate the crediting process, including the assessment of the credit risk by adapting and implementing a system analogical to the application used by PKO Bank Polski SA. Additionally, internal regulations related to the process of crediting individuals and legal entities were updated.
In 2011 actions started in the Bankowy Fundusz Leasingowy SA Group on amending the ‘Procedures for assessing the risk of lease transactions and the scoring methodology, and reconstruction of the decision-making process’. These together with the new IT system are planned to be implemented in 2012.
54.1.54.1.54.1.54.1. IdentificationIdentificationIdentificationIdentification of significant types of riskof significant types of riskof significant types of riskof significant types of risk
The significance of the individual types of risk is established at the Bank’s and Group’s entities level. When determining criteria of classifying a given type of risk as significant, an influence of a given type of risk on the Bank’s, Group’s entities and whole Group’s activities are taken into account, whereas three types of risk are recognised:
– considered as significant a priori – being managed actively, – potentially significant – for which significance monitoring is being made,
This document is a translation of a document originally issued in Polish. The only binding version is the original Polish version.
Consolidated Financial Statements of the Powszechna Kasa Oszczędności Bank Polski Spółka Akcyjna Group
for the year ended 31 December 2011 (in PLN thousand)
116
– other non-defined or non-occurring in the Bank or Group types of risk (insignificant and non-monitored).
Based on quantitative and qualitative information, an assessment of significance of given types of risk is performed in the Bank periodically. As a result of assessment, a given type of risk is being classified as significant/insignificant. Similar assessment is concluded periodically in the Group’s entities. Monitoring is conducted if significant change in activities took place or the profile of the Bank or the Group changed.
55.55.55.55. CreditCreditCreditCredit risk managementrisk managementrisk managementrisk management
Credit risk is defined as a risk of occurrence of losses due to counterparty’s default of payments to the Bank or as a risk of decrease in economic value of amounts due to the Bank as a result of deterioration of counterparty’s ability to repay amounts due to the Bank.
The objective of credit risk management is to minimise losses on the credit portfolio as well as to minimise the risk of occurrence of loans threatened with impairment exposure, while keeping expected level of profitability and value of credit portfolio at the same time.
The Bank and subsidiaries of the Group apply the following principles of credit risk management:
– each loan transaction is subject to comprehensive credit risk assessment, which is reflected in an internal rating or credit scoring,
– credit risk relating to potential and concluded loan transactions is measured on a cyclical basis, taking into consideration changes in external conditions and in the financial standing of the borrowers,
– credit risk assessment of exposures which are significant due to their risk levels is subject to additional verification by credit risk assessment teams, which are independent of the business teams,
– terms of loan contracts that are offered to a client depend on the credit risk generated by the contract, – loan granting decisions are made only by authorised persons, within their authority, – credit risk is diversified by geographical location, by industry, by product and by clients, – expected credit risk is mitigated by setting collateral, appropriate credit margins and appropriate
allowances for credit losses.
The above-mentioned policies are executed by the Bank through the use of advanced credit risk management methods, both on the level of individual exposures and on the level of the whole credit portfolio of the Bank. These methods are verified and developed to ensure compliance with the internal ratings based requirements (IRB) i.e. advanced credit risk management method, which can be used while calculating capital requirements for credit risk after being approved by the Financial Supervision Authority.
The Group entities, which have significant credit risk levels (KREDOBANK SA, the BFL SA Group, the BTK SA Group) manage their credit risk individually, but the methods used by them for credit risk assessment and measurement are adjusted to the methods used by PKO Bank Polski SA, taking into account the specific nature of the activities of these companies.
Any changes to the solutions used by the Group companies are agreed every time with the Bank's units responsible for risk management.
The BFL SA Group, the BTK SA Group and KREDOBANK SA measure credit risk regularly and the results of such measurements are submitted to the Bank.
KREDOBANK SA, the BFL SA Group and the BTK Group have units responsible for risk in their organisational structures, which are in particular responsible for:
– developing methods of credit risk assessment, recognising provisions and allowances,
– controlling and monitoring credit risk during the lending process,
– the quality and efficiency of restructuring and enforcement of the amounts due from clients.

This document is a translation of a document originally issued in Polish. The only binding version is the original Polish version.
Consolidated Financial Statements of the Powszechna Kasa Oszczędności Bank Polski Spółka Akcyjna Group
for the year ended 31 December 2011 (in PLN thousand)
117
In these companies, the credit decision limits depend primarily on: the amount of the exposure to a given client, the amount of an individual credit transaction and the period of credit transaction.
The process of credit decision-making at KREDOBANK SA, the BFL SA Group and the BTK SA Group is supported by credit committees, which are involved in the case of transactions which generate increased credit risk. Appropriate organisational units of the Banking Risk Division participate in managing the credit risk in the Group companies by giving their opinions on projects and periodically reviewing internal regulations of these companies relating to the assessment of credit risk and preparation of recommendations relating to amendments in the drafts of regulations. The Bank supports implementation of the recommended changes in principles for assessing credit risk in the Group entities.
Measurement of credit riskMeasurement of credit riskMeasurement of credit riskMeasurement of credit risk
Credit risk measurement methodsCredit risk measurement methodsCredit risk measurement methodsCredit risk measurement methods
In order to assess the level of credit risk and profitability of loan portfolios, the Bank uses different credit risk measurement and valuation methods, including:
– Probability of Default (PD), – Expected Loss (EL), – Credit Value at Risk (CVaR), – effectiveness measures used in scoring methodologies (Accuracy Ratio), – share and structure of non-performing loans (according to IAS), – coverage ratio of non-performing loans with impairment allowances (according to IAS), – cost of risk.
PKO Bank Polski SA extends regularly the scope of credit risk measures used, taking account of the internal rating-based method (IRB) requirements, and extends the use of risk measures to cover the whole Bank’s loan portfolio with these methods.
The portfolio credit risk measurement methods make it possible, i.e. to reflect the credit risk in the price of products, determine the optimum cut-off levels and determine impairment allowances.
The Bank performs analysis and stress-tests regarding the influence of potential changes in macroeconomic environment on the quality of Bank’s loan portfolio. The test results are reported to the Bank’s Executives. The above-mentioned information enables the Bank to identify and take measures to limit the negative influence of unfavourable market changes on the Bank’s performance.
The Bank assesses the risk of individual credit transactions with the use of scoring and rating methods, which are created, developed and supervised by the Banking Risk Division. The assessment methods are supported by specialist application software. The scoring method is defined by Bank’s internal regulations whose main aim is to ensure uniform and objective assessment of credit risk during the credit process.
The Bank assesses the credit risk of retail clients on two levels: the client’s borrowing capacity and his creditworthiness. The assessment of borrowing capacity involves an examination of the client’s financial situation, whereas the creditworthiness assessment involves scoring and evaluating the client’s credit history obtained from external sources and internal records of the Bank.
In 2011, the parameters for assessing the creditability of individual customers were adapted to the amended provisions of the Recommendation S, in particular as regards the following: – changing the method of determining disposable income for foreign currency loan transactions drawn to
finance real property and foreign currency loan transactions secured by mortgage, – changing (shortening) the maximum lending period adopted in the assessment of creditability, – taking into account the probability that the level of the borrower’s income will change after acquisition
the pension entitlement in the assessment of creditability.
The evaluation of credit risk related to financing institutional clients is performed in two dimensions: in respect of the client and of the transaction. The assessment measures comprise ratings of clients and transactions. The comprehensive measure of credit risk which reflects both risk factors is the aggregate rating. Since 1 September 2010, Bank uses a scoring method for credit risk evaluation of clients in the SME

This document is a translation of a document originally issued in Polish. The only binding version is the original Polish version.
Consolidated Financial Statements of the Powszechna Kasa Oszczędności Bank Polski Spółka Akcyjna Group
for the year ended 31 December 2011 (in PLN thousand)
118
segment, and a dedicated software application. This method is available apart from the rating method. Its implementation resulted in shortening the assessment process of loan applications as well as improvement of credit risk management effectiveness. As a result of the positive scoring of the institutional clients’ portfolio in November 2011 the scoring procedure was extended.
The information about ratings and scoring is widely used at the Bank for the purposes of credit risk management, the system of credit decision-making powers, determining the amounts above which independent credit assessment services are activated and in the credit risk assessment and reporting system.
In order to reduce the period of response as regards warning signals suggesting an increase in credit risk level, the Bank implemented a dedicated application the Early Warning System (EWS) in August 2010. In 2011 this tool was being developed, in result of which in June 2011 the automatic identification of adverse events was implemented.
In 2011 in its rating system the Bank took into consideration the identification of default events, achieving consistency between the rating system and the system for identifying individual premises for impairment of credit exposures. The scale of rating non-financial customers was also expanded: in place of 8 rating classes, 10 rating classes were introduced and at the same time it was decided that credit exposures which had been classified into the rating class ‘G’ (due to the low likeliness of default) were not to be automatically considered to be individually impaired. Moreover, as a rule the terms and conditions for determining availability of financing were maintained.
In the second half of 2011, in determining the write-downs against the portfolio of mortgage loans for individuals, the Bank used the portfolio parameters estimated on the basis of the methodology for estimating parameters for the purpose of calculating the capital requirements using the IRB method. The new methodology takes into account intense restructuring processes conducted in respect of the above-mentioned portfolio and allows more precise assessment of the related credit risk.
Forecasting and monitoring of credit riskForecasting and monitoring of credit riskForecasting and monitoring of credit riskForecasting and monitoring of credit risk
The Group’s exposure to credit risk The Group’s exposure to credit risk The Group’s exposure to credit risk The Group’s exposure to credit risk
Amounts due from banksAmounts due from banksAmounts due from banksAmounts due from banks ExposureExposureExposureExposure
31.12.20131.12.20131.12.20131.12.2011111 31.12.2031.12.2031.12.2031.12.2010101010
Amounts due from banks impaired, of which: 32 499 28 559
valued with an individual method 32 385 28 089
Amounts due from banks not impaired, of which: 2 396 540 2 307 398
neither past due nor impaired 2 396 540 2 307 047
past due but not impaired - 351
past due up to 4 days - 351
Gross totalGross totalGross totalGross total 2 429 039 2 429 039 2 429 039 2 429 039 2 335 957 2 335 957 2 335 957 2 335 957
Impairment Impairment Impairment Impairment allowanceallowanceallowanceallowancessss (32 812)(32 812)(32 812)(32 812) (28 925)(28 925)(28 925)(28 925)
Net total by carrying amountNet total by carrying amountNet total by carrying amountNet total by carrying amount 2 396 227 2 396 227 2 396 227 2 396 227 2 307 032 2 307 032 2 307 032 2 307 032
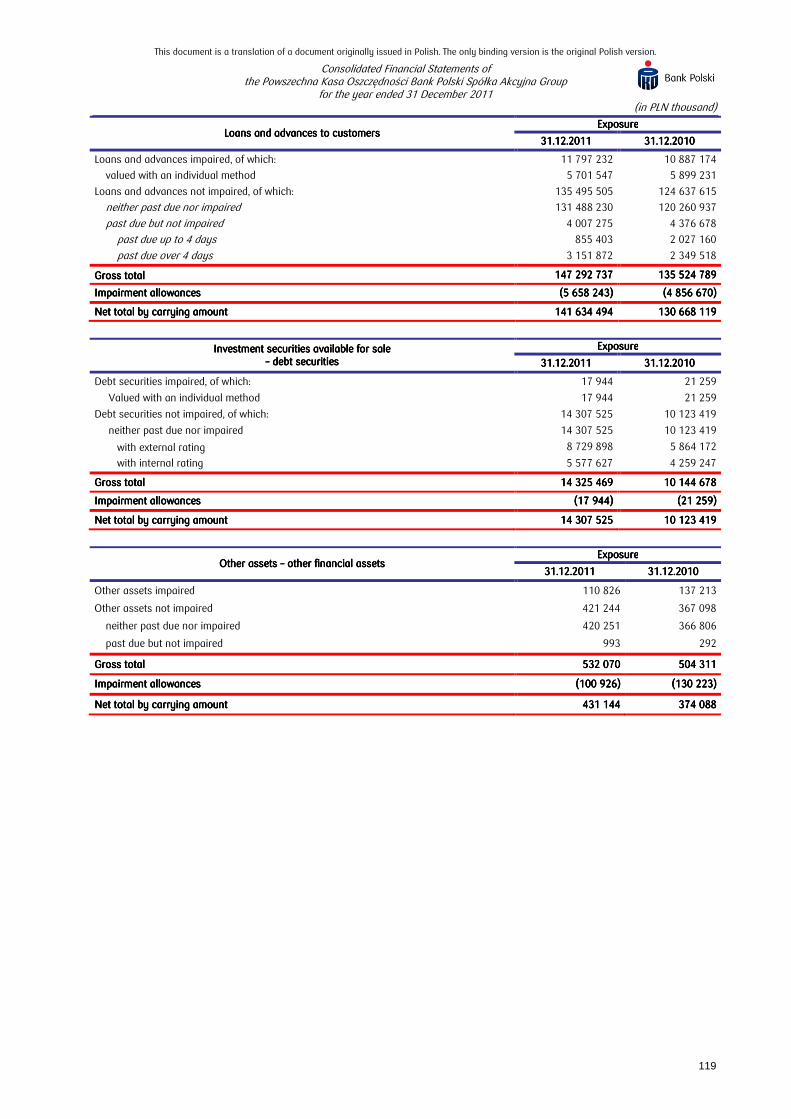
This document is a translation of a document originally issued in Polish. The only binding version is the original Polish version.
Consolidated Financial Statements of the Powszechna Kasa Oszczędności Bank Polski Spółka Akcyjna Group
for the year ended 31 December 2011 (in PLN thousand)
119
Loans and advances to customersLoans and advances to customersLoans and advances to customersLoans and advances to customers ExposureExposureExposureExposure
31.12.20131.12.20131.12.20131.12.2011111 31.12.2031.12.2031.12.2031.12.2010101010
Loans and advances impaired, of which: 11 797 232 10 887 174
valued with an individual method 5 701 547 5 899 231
Loans and advances not impaired, of which: 135 495 505 124 637 615
neither past due nor impaired 131 488 230 120 260 937
past due but not impaired 4 007 275 4 376 678
past due up to 4 days 855 403 2 027 160
past due over 4 days 3 151 872 2 349 518
Gross totalGross totalGross totalGross total 147 292 737 147 292 737 147 292 737 147 292 737 135 524 789 135 524 789 135 524 789 135 524 789
Impairment allowancesImpairment allowancesImpairment allowancesImpairment allowances (5 658 243)(5 658 243)(5 658 243)(5 658 243) (4 856 670)(4 856 670)(4 856 670)(4 856 670)
Net total by carryingNet total by carryingNet total by carryingNet total by carrying amountamountamountamount 141 634 494 141 634 494 141 634 494 141 634 494 130 668 119 130 668 119 130 668 119 130 668 119
Investment securities available for sale Investment securities available for sale Investment securities available for sale Investment securities available for sale –––– debt securitiesdebt securitiesdebt securitiesdebt securities
ExposureExposureExposureExposure
31.12.20131.12.20131.12.20131.12.2011111 31.12.2031.12.2031.12.2031.12.2010101010
Debt securities impaired, of which: 17 944 21 259
Valued with an individual method 17 944 21 259
Debt securities not impaired, of which: 14 307 525 10 123 419
neither past due nor impaired 14 307 525 10 123 419
with external rating 8 729 898 5 864 172
with internal rating 5 577 627 4 259 247
Gross totalGross totalGross totalGross total 14 325 469 14 325 469 14 325 469 14 325 469 10 144 678 10 144 678 10 144 678 10 144 678
Impairment allowancesImpairment allowancesImpairment allowancesImpairment allowances (17 944)(17 944)(17 944)(17 944) (21 259)(21 259)(21 259)(21 259)
Net total by carrying amountNet total by carrying amountNet total by carrying amountNet total by carrying amount 14 307 525 14 307 525 14 307 525 14 307 525 10 123 419 10 123 419 10 123 419 10 123 419
Other assets Other assets Other assets Other assets –––– other financial assetsother financial assetsother financial assetsother financial assets ExposureExposureExposureExposure
31.12.201131.12.201131.12.201131.12.2011 31.12.201031.12.201031.12.201031.12.2010
Other assets impaired 110 826 137 213
Other assets not impaired 421 244 367 098
neither past due nor impaired 420 251 366 806
past due but not impaired 993 292
Gross totalGross totalGross totalGross total 532 070 532 070 532 070 532 070 504 311 504 311 504 311 504 311
Impairment allowancesImpairment allowancesImpairment allowancesImpairment allowances (100 926)(100 926)(100 926)(100 926) (130 223)(130 223)(130 223)(130 223)
Net total by carrying amountNet total by carrying amountNet total by carrying amountNet total by carrying amount 431 144 431 144 431 144 431 144 374 088 374 088 374 088 374 088
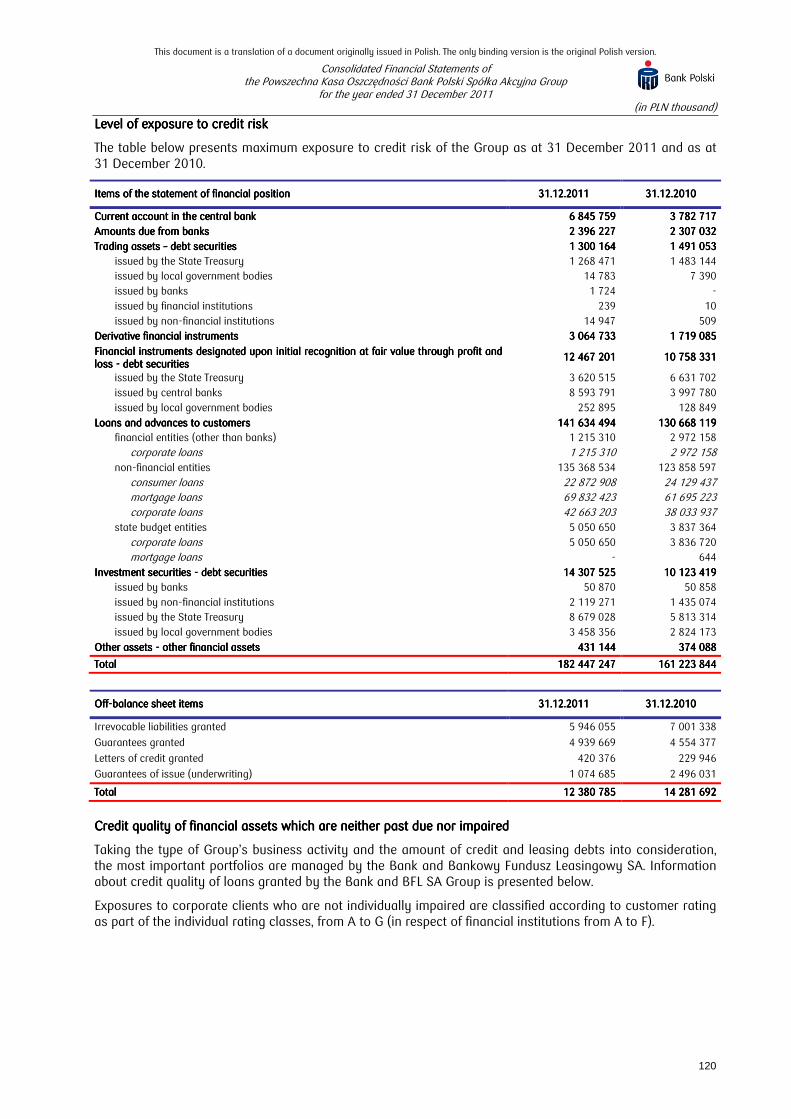
This document is a translation of a document originally issued in Polish. The only binding version is the original Polish version.
Consolidated Financial Statements of the Powszechna Kasa Oszczędności Bank Polski Spółka Akcyjna Group
for the year ended 31 December 2011 (in PLN thousand)
120
Level ofLevel ofLevel ofLevel of exposure to credit riskexposure to credit riskexposure to credit riskexposure to credit risk
The table below presents maximum exposure to credit risk of the Group as at 31 December 2011 and as at 31 December 2010.
Items of the statement of financial positionItems of the statement of financial positionItems of the statement of financial positionItems of the statement of financial position 31.12.20131.12.20131.12.20131.12.2011111 31.12.2031.12.2031.12.2031.12.2010101010
Current account in Current account in Current account in Current account in the central bthe central bthe central bthe central bankankankank 6 845 759 6 845 759 6 845 759 6 845 759 3 782 717 3 782 717 3 782 717 3 782 717
Amounts due from banksAmounts due from banksAmounts due from banksAmounts due from banks 2 396 227 2 396 227 2 396 227 2 396 227 2 307 032 2 307 032 2 307 032 2 307 032
Trading assets Trading assets Trading assets Trading assets –––– debt securitiesdebt securitiesdebt securitiesdebt securities 1 300 164 1 300 164 1 300 164 1 300 164 1 491 053 1 491 053 1 491 053 1 491 053
issued by the State Treasury 1 268 471 1 483 144
issued by local government bodies 14 783 7 390
issued by banks 1 724 -
issued by financial institutions 239 10
issued by non-financial institutions 14 947 509
Derivative financial instrumentsDerivative financial instrumentsDerivative financial instrumentsDerivative financial instruments 3 064 733 3 064 733 3 064 733 3 064 733 1 719 085 1 719 085 1 719 085 1 719 085
Financial instruments designatedFinancial instruments designatedFinancial instruments designatedFinancial instruments designated upon initial recognitionupon initial recognitionupon initial recognitionupon initial recognition at fair value through profit and at fair value through profit and at fair value through profit and at fair value through profit and loss loss loss loss ---- debt securitiesdebt securitiesdebt securitiesdebt securities
12 467 201 12 467 201 12 467 201 12 467 201 10 758 331 10 758 331 10 758 331 10 758 331
issued by the State Treasury 3 620 515 6 631 702
issued by central banks 8 593 791 3 997 780
issued by local government bodies 252 895 128 849
Loans and advances to customersLoans and advances to customersLoans and advances to customersLoans and advances to customers 141 634 494 141 634 494 141 634 494 141 634 494 130 668 119 130 668 119 130 668 119 130 668 119
financial entities (other than banks) 1 215 310 2 972 158
corporate loans 1 215 310 2 972 158 non-financial entities 135 368 534 123 858 597
consumer loans 22 872 908 24 129 437 mortgage loans 69 832 423 61 695 223 corporate loans 42 663 203 38 033 937
state budget entities 5 050 650 3 837 364
corporate loans 5 050 650 3 836 720
mortgage loans - 644
Investment securities Investment securities Investment securities Investment securities ---- debt securitiesdebt securitiesdebt securitiesdebt securities 14 307 525 14 307 525 14 307 525 14 307 525 10 123 419 10 123 419 10 123 419 10 123 419
issued by banks 50 870 50 858
issued by non-financial institutions 2 119 271 1 435 074
issued by the State Treasury 8 679 028 5 813 314
issued by local government bodies 3 458 356 2 824 173
Other assets Other assets Other assets Other assets ---- other financial assetsother financial assetsother financial assetsother financial assets 431 144 431 144 431 144 431 144 374 088 374 088 374 088 374 088
TotalTotalTotalTotal 182 447 247 182 447 247 182 447 247 182 447 247 161 223 844 161 223 844 161 223 844 161 223 844
OffOffOffOff----balance sheet itemsbalance sheet itemsbalance sheet itemsbalance sheet items 31.12.20131.12.20131.12.20131.12.2011111 31.12.2031.12.2031.12.2031.12.2010101010
Irrevocable liabilities granted 5 946 055 7 001 338
Guarantees granted 4 939 669 4 554 377
Letters of credit granted 420 376 229 946
Guarantees of issue (underwriting) 1 074 685 2 496 031
TotalTotalTotalTotal 12 380 785 12 380 785 12 380 785 12 380 785 14 281 692 14 281 692 14 281 692 14 281 692
Credit quality of financial assets which are Credit quality of financial assets which are Credit quality of financial assets which are Credit quality of financial assets which are neither past due nor impairedneither past due nor impairedneither past due nor impairedneither past due nor impaired
Taking the type of Group’s business activity and the amount of credit and leasing debts into consideration, the most important portfolios are managed by the Bank and Bankowy Fundusz Leasingowy SA. Information about credit quality of loans granted by the Bank and BFL SA Group is presented below.
Exposures to corporate clients who are not individually impaired are classified according to customer rating as part of the individual rating classes, from A to G (in respect of financial institutions from A to F).

This document is a translation of a document originally issued in Polish. The only binding version is the original Polish version.
Consolidated Financial Statements of the Powszechna Kasa Oszczędności Bank Polski Spółka Akcyjna Group
for the year ended 31 December 2011 (in PLN thousand)
121
The following loan portfolios are covered by the rating system: – corporate clients, – housing market corporate clients, – small and medium enterprises (excluding certain product groups which are assessed in a simplified
manner).
Financial assets neither past due nor impairedFinancial assets neither past due nor impairedFinancial assets neither past due nor impairedFinancial assets neither past due nor impaired 31.12.201131.12.201131.12.201131.12.2011 31.12.201031.12.201031.12.201031.12.2010
Amounts due from banksAmounts due from banksAmounts due from banksAmounts due from banks 2 396 5402 396 5402 396 5402 396 540 2 307 0472 307 0472 307 0472 307 047
of which:
with rating 2 072 322 2 215 818
without rating 324 218 91 229
Loans and advances to customersLoans and advances to customersLoans and advances to customersLoans and advances to customers 131 488 230131 488 230131 488 230131 488 230 120 260 937120 260 937120 260 937120 260 937
with rating 123 173 721 115 489 715
without rating 8 314 509 4 771 222
PKO Bank Polski SAPKO Bank Polski SAPKO Bank Polski SAPKO Bank Polski SA 128 593 307128 593 307128 593 307128 593 307 118 036 993118 036 993118 036 993118 036 993
with rating – financial, non-financial and budget sector (corporate loans) 38 595 846 36 648 989
A (first rate) 1 269 043 1 053 966
B (very good) 2 377 152 2 683 977
C (good) 4 248 073 6 165 665
D (satisfactory) 8 937 711 10 691 018
E (average) 9 791 398 7 460 009
F (acceptable) 9 244 208 8 594 354
G (poor)* 2 728 261 -
with rating – non-financial sector (consumer and mortgage loans) 83 438 089 77 811 902
A (first rate) 39 006 051 43 929 181
B (very good) 28 255 664 13 666 144
C (good) 6 770 389 12 303 034
D (average) 3 224 042 3 536 471
E (acceptable) 6 181 943 4 377 072
without rating – financial, non-financial and budget sector (consumer, mortgage and other loans)
6 559 372 3 576 102
The BFL SA GroupThe BFL SA GroupThe BFL SA GroupThe BFL SA Group 2 307 4632 307 4632 307 4632 307 463 1 858 2531 858 2531 858 2531 858 253
with rating 1 139 786 1 028 824
A2 (first rate) 4 574 2 858
A3 (very good) 71 872 109 326
A4 (good) 147 577 132 142
A5 (satisfactory) 354 505 284 998
A6 (average) 477 485 391 914
B1 (acceptable) 61 132 94 634
B2 (poor) 19 117 12 065
C (bad) 3 524 887
without rating 1 167 677 829 429 without rating – customers of non-financial and financial sector of other entities of the PKO Bank Polski SA Group
587 460 365 691
Other assets Other assets Other assets Other assets –––– other financial assets other financial assets other financial assets other financial assets 420 251420 251420 251420 251 366 806366 806366 806366 806
TotalTotalTotalTotal 134 305 021134 305 021134 305 021134 305 021 122 934 790122 934 790122 934 790122 934 790
* In 2011 the Bank reclassified the catalogue of premises for individual loan impairment consisting specifically of discontinuing to recognise the premise of ‘deterioration in the customer’s financial position during the crediting period’ in respect of customers who until then were in this group and are characterised by a relatively low probability of default.
Loans and advances which are not individually impaired and are not rated, are characterised with a satisfactory level of the credit risk. It concerns, in particular, retail loans (including mortgage loans) which are not individually significant and thus do not create significant credit risk.
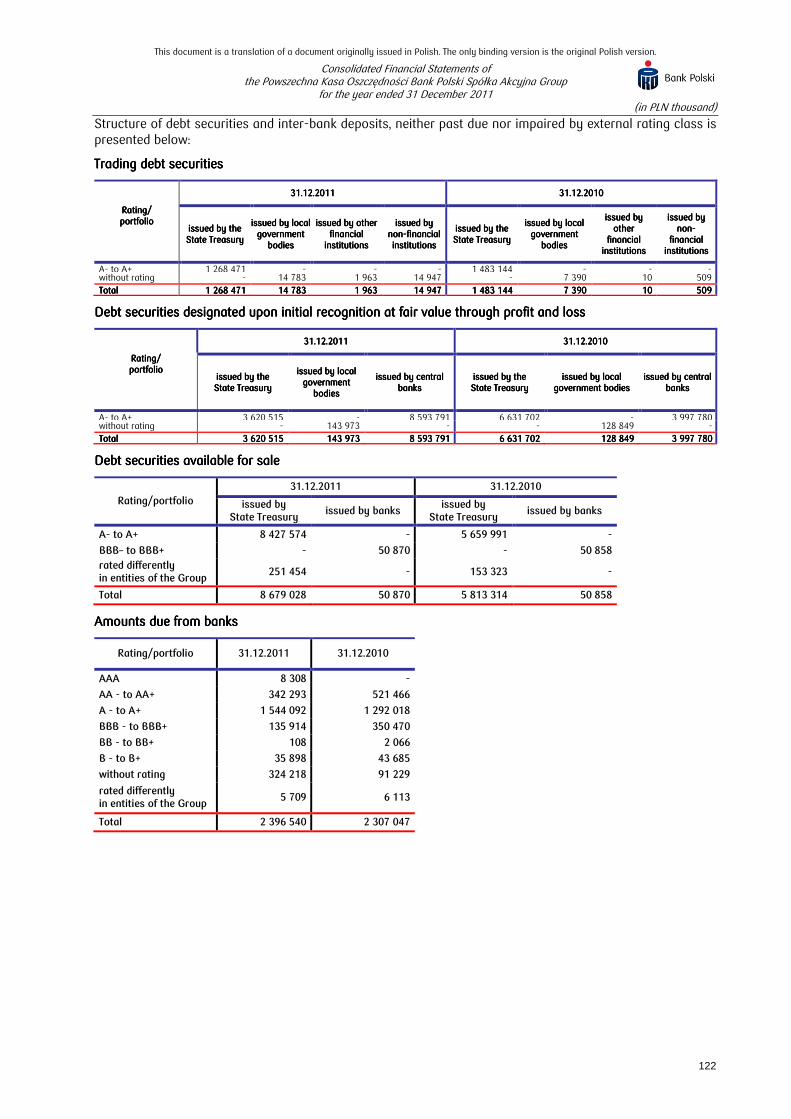
This document is a translation of a document originally issued in Polish. The only binding version is the original Polish version.
Consolidated Financial Statements of the Powszechna Kasa Oszczędności Bank Polski Spółka Akcyjna Group
for the year ended 31 December 2011 (in PLN thousand)
122
Structure of debt securities and inter-bank deposits, neither past due nor impaired by external rating class is presented below:
Trading dTrading dTrading dTrading debt securitiesebt securitiesebt securitiesebt securities
Rating/Rating/Rating/Rating/ portfolioportfolioportfolioportfolio
31.12.201131.12.201131.12.201131.12.2011 31.12.201031.12.201031.12.201031.12.2010
issued by the issued by the issued by the issued by the State TreasuryState TreasuryState TreasuryState Treasury
issued by local issued by local issued by local issued by local government government government government
bodiesbodiesbodiesbodies
issued by other issued by other issued by other issued by other financial financial financial financial
institutionsinstitutionsinstitutionsinstitutions
issued by issued by issued by issued by nonnonnonnon----financial financial financial financial institutionsinstitutionsinstitutionsinstitutions
issued by the issued by the issued by the issued by the State TreasuryState TreasuryState TreasuryState Treasury
issued by local issued by local issued by local issued by local government government government government
bodiesbodiesbodiesbodies
issued by issued by issued by issued by other other other other
financial financial financial financial institutionsinstitutionsinstitutionsinstitutions
issued by issued by issued by issued by nonnonnonnon----
financial financial financial financial institutionsinstitutionsinstitutionsinstitutions
A- to A+ 1 268 471 - - - 1 483 144 - - - without rating - 14 783 1 963 14 947 - 7 390 10 509
TotalTotalTotalTotal 1 268 471 1 268 471 1 268 471 1 268 471 14 783 14 783 14 783 14 783 1 963 1 963 1 963 1 963 14 947 14 947 14 947 14 947 1 483 144 1 483 144 1 483 144 1 483 144 7 390 7 390 7 390 7 390 10 10 10 10 509 509 509 509
Debt securities designated Debt securities designated Debt securities designated Debt securities designated upon initial recognition upon initial recognition upon initial recognition upon initial recognition at fair value through profit and loss at fair value through profit and loss at fair value through profit and loss at fair value through profit and loss
Rating/Rating/Rating/Rating/ portfolioportfolioportfolioportfolio
31.12.201131.12.201131.12.201131.12.2011 31.12.201031.12.201031.12.201031.12.2010
issued by the issued by the issued by the issued by the State TreasuryState TreasuryState TreasuryState Treasury
issued by local issued by local issued by local issued by local government government government government
bodiesbodiesbodiesbodies
issued by central issued by central issued by central issued by central bbbbankankankankssss
issued by the issued by the issued by the issued by the State TreasuryState TreasuryState TreasuryState Treasury
issued by local issued by local issued by local issued by local government bodiesgovernment bodiesgovernment bodiesgovernment bodies
issued by central issued by central issued by central issued by central bbbbankankankankssss
A- to A+ 3 620 515 - 8 593 791 6 631 702 - 3 997 780 without rating - 143 973 - - 128 849 -
TotalTotalTotalTotal 3 620 515 3 620 515 3 620 515 3 620 515 143 973 143 973 143 973 143 973 8 593 791 8 593 791 8 593 791 8 593 791 6 631 702 6 631 702 6 631 702 6 631 702 128 849 128 849 128 849 128 849 3 997 780 3 997 780 3 997 780 3 997 780
Debt securities available for saleDebt securities available for saleDebt securities available for saleDebt securities available for sale
Rating/portfolio 31.12.2011 31.12.2010
issued by State Treasury
issued by banks issued by
State Treasury issued by banks
A- to A+ 8 427 574 - 5 659 991 -
BBB– to BBB+ - 50 870 - 50 858
rated differently in entities of the Group
251 454 - 153 323 -
Total 8 679 028 50 870 5 813 314 50 858
Amounts due from banksAmounts due from banksAmounts due from banksAmounts due from banks
Rating/portfolio 31.12.2011 31.12.2010
AAA 8 308 -
AA - to AA+ 342 293 521 466
A - to A+ 1 544 092 1 292 018
BBB - to BBB+ 135 914 350 470
BB - to BB+ 108 2 066
B - to B+ 35 898 43 685
without rating 324 218 91 229
rated differently in entities of the Group
5 709 6 113
Total 2 396 540 2 307 047
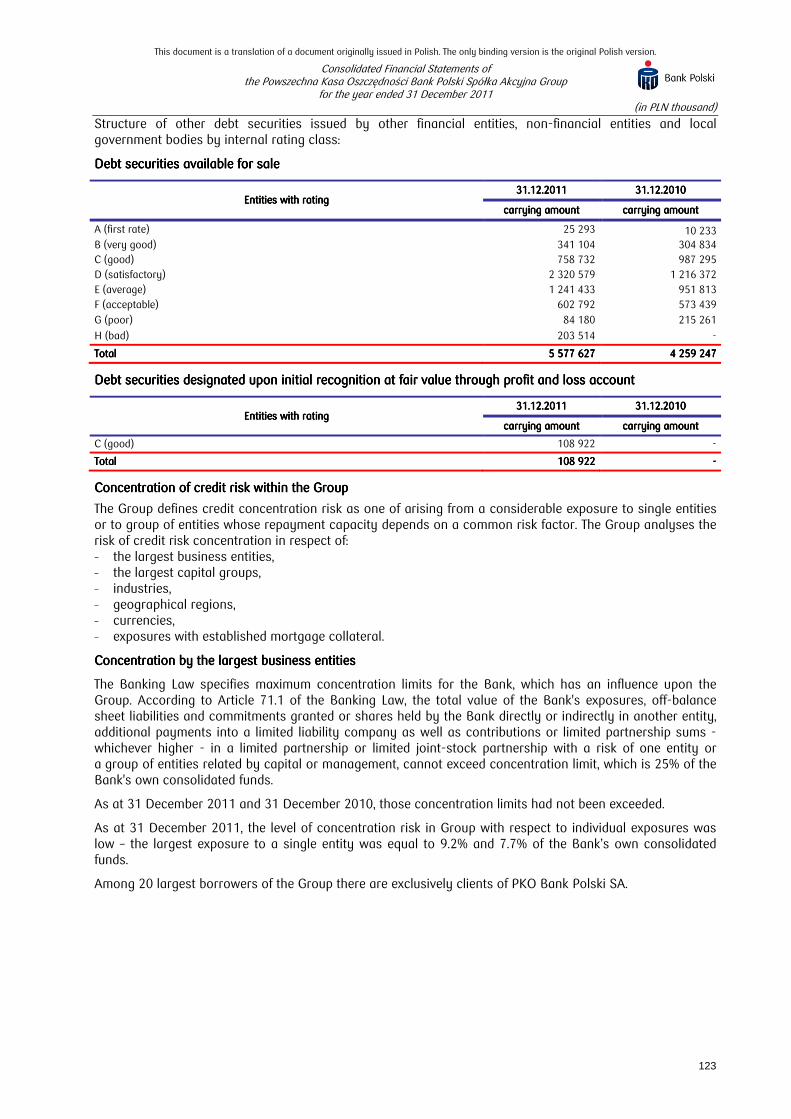
This document is a translation of a document originally issued in Polish. The only binding version is the original Polish version.
Consolidated Financial Statements of the Powszechna Kasa Oszczędności Bank Polski Spółka Akcyjna Group
for the year ended 31 December 2011 (in PLN thousand)
123
Structure of other debt securities issued by other financial entities, non-financial entities and local government bodies by internal rating class:
Debt securities aDebt securities aDebt securities aDebt securities available for sale vailable for sale vailable for sale vailable for sale
Entities with ratingEntities with ratingEntities with ratingEntities with rating 31.12.20131.12.20131.12.20131.12.2011111 31.12.2031.12.2031.12.2031.12.2010101010
carrying amountcarrying amountcarrying amountcarrying amount carrying amountcarrying amountcarrying amountcarrying amount
A (first rate) 25 293 10 233 B (very good) 341 104 304 834
C (good) 758 732 987 295
D (satisfactory) 2 320 579 1 216 372
E (average) 1 241 433 951 813
F (acceptable) 602 792 573 439
G (poor) 84 180 215 261
H (bad) 203 514 -
TotalTotalTotalTotal 5 577 6275 577 6275 577 6275 577 627 4 259 2474 259 2474 259 2474 259 247
Debt securitiesDebt securitiesDebt securitiesDebt securities designateddesignateddesignateddesignated upon initial recognition upon initial recognition upon initial recognition upon initial recognition at fair value at fair value at fair value at fair value throughthroughthroughthrough profit and loss accountprofit and loss accountprofit and loss accountprofit and loss account
Entities with ratingEntities with ratingEntities with ratingEntities with rating 31.12.201131.12.201131.12.201131.12.2011 31.12.201031.12.201031.12.201031.12.2010
carrying amountcarrying amountcarrying amountcarrying amount carrying amountcarrying amountcarrying amountcarrying amount
C (good) 108 922 -
TotalTotalTotalTotal 108 922108 922108 922108 922 ----
Concentration of credit risk within the Concentration of credit risk within the Concentration of credit risk within the Concentration of credit risk within the GroupGroupGroupGroup
The Group defines credit concentration risk as one of arising from a considerable exposure to single entities or to group of entities whose repayment capacity depends on a common risk factor. The Group analyses the risk of credit risk concentration in respect of: – the largest business entities, – the largest capital groups, – industries, – geographical regions, – currencies, – exposures with established mortgage collateral.
Concentration by the Concentration by the Concentration by the Concentration by the largestlargestlargestlargest business entitiesbusiness entitiesbusiness entitiesbusiness entities
The Banking Law specifies maximum concentration limits for the Bank, which has an influence upon the Group. According to Article 71.1 of the Banking Law, the total value of the Bank's exposures, off-balance sheet liabilities and commitments granted or shares held by the Bank directly or indirectly in another entity, additional payments into a limited liability company as well as contributions or limited partnership sums - whichever higher - in a limited partnership or limited joint-stock partnership with a risk of one entity or a group of entities related by capital or management, cannot exceed concentration limit, which is 25% of the Bank's own consolidated funds.
As at 31 December 2011 and 31 December 2010, those concentration limits had not been exceeded.
As at 31 December 2011, the level of concentration risk in Group with respect to individual exposures was low – the largest exposure to a single entity was equal to 9.2% and 7.7% of the Bank’s own consolidated funds.
Among 20 largest borrowers of the Group there are exclusively clients of PKO Bank Polski SA.

This document is a translation of a document originally issued in Polish. The only binding version is the original Polish version.
Consolidated Financial Statements of the Powszechna Kasa Oszczędności Bank Polski Spółka Akcyjna Group
for the year ended 31 December 2011 (in PLN thousand)
124
Total exposure of the Group towards the 20 largest non-banking sector clients:
31.12.20131.12.20131.12.20131.12.2011111 31.12.2031.12.2031.12.2031.12.2010101010
No.No.No.No. Exposure*Exposure*Exposure*Exposure* Share in the loan Share in the loan Share in the loan Share in the loan
portfolio**portfolio**portfolio**portfolio** No.No.No.No. Exposure*Exposure*Exposure*Exposure*
Share in the loan Share in the loan Share in the loan Share in the loan portfolio**portfolio**portfolio**portfolio**
1. 1 258 272 0.85% 1. 736 873 0.54% 2. 541 970 0.37% 2. 464 247 0.34% 3. 484 761 0.33% 3. 350 441 0.26% 4. 399 939 0.27% 4. 334 671 0.25% 5. 342 022 0.23% 5. 326 815 0.24% 6. 325 542 0.22% 6. 297 702 0.22% 7. 323 299 0.22% 7. 287 418 0.21% 8. 313 271 0.21% 8. 281 790 0.21% 9. 294 361 0.20% 9. 256 297 0.19% 10. 293 060 0.20% 10. 250 000 0.18% 11. 262 785 0.18% 11. 243 947 0.18% 12. 244 256 0.17% 12. 230 999 0.17% 13. 237 574 0.16% 13. 229 921 0.17% 14. 236 898 0.16% 14. 223 904 0.17% 15. 235 466 0.16% 15. 218 157 0.16% 16. 220 566 0.15% 16. 214 447 0.16% 17. 213 811 0.15% 17. 212 636 0.16% 18. 212 868 0.14% 18. 209 785 0.15% 19. 206 108 0.14% 19. 199 078 0.15% 20. 203 980 0.14% 20. 195 894 0.14%
TotalTotalTotalTotal 6 850 8096 850 8096 850 8096 850 809 4.65%4.65%4.65%4.65% TotalTotalTotalTotal 5 765 0225 765 0225 765 0225 765 022 4.25%4.25%4.25%4.25% * Total exposure includes loans, advances, purchased debts, discounts on bills of exchange, realised guarantees and interest receivable. ** Loan portfolio does not include off-balance sheet and capital exposures.
Concentration by the largest capital groupsConcentration by the largest capital groupsConcentration by the largest capital groupsConcentration by the largest capital groups
The greatest exposure of the PKO Bank Polski SA Group towards a group of borrowers amounted to 1.31%. The 5 largest capital groups include only clients of PKO Bank Polski SA.
As at 31 December 2011, the concentration of credit risk by the largest capital groups was low. The greatest exposure of the Group towards a capital group amounted to 10.5% and 9.4% of the Group’s own consolidated funds.
Total exposure of the Group towards the 5 largest capital groups:
31.12.20131.12.20131.12.20131.12.2011111 31.12.2031.12.2031.12.2031.12.2010101010
No.No.No.No. Exposure*Exposure*Exposure*Exposure* Share in the loan Share in the loan Share in the loan Share in the loan
portfolio**portfolio**portfolio**portfolio** No.No.No.No. Exposure*Exposure*Exposure*Exposure*
Share in the loan Share in the loan Share in the loan Share in the loan portfolio**portfolio**portfolio**portfolio**
1 1 928 808 1.31% 1*** 1 183 394 0.87% 2 1 725 766 1.17% 2 898 546 0.66% 3 1 226 346 0.83% 3 892 191 0.66% 4 950 453 0.65% 4 871 694 0.64% 5 949 050 0.64% 5 848 561 0.63%
TotalTotalTotalTotal 6 780 4236 780 4236 780 4236 780 423 4.60%4.60%4.60%4.60% TotalTotalTotalTotal 4 694 3864 694 3864 694 3864 694 386 3.46%3.46%3.46%3.46%
* Total exposure includes loans, advances, purchased debts, discounts on bills of exchange, realised guarantees, interest receivable and off-balance sheet and capital exposures. ** Loan portfolio does not include off-balance sheet and capital exposures. *** Concentration in respect of the entities exempted from concentration limits under the Article 71.3 of the Banking Law.
Concentration by industryConcentration by industryConcentration by industryConcentration by industry
As compared with 31 December 2010 the exposure of the Group in industry sectors has increased by over PLN 7.5 billion. The total exposure in the four largest industry sectors: ‘Industrial processing’, ‘Wholesale and retail trade (...)’, ‘Maintenance of real estate’ and ‘Construction’ amounted to approx. 63% of the total loan portfolio covered by an analysis of the sector.
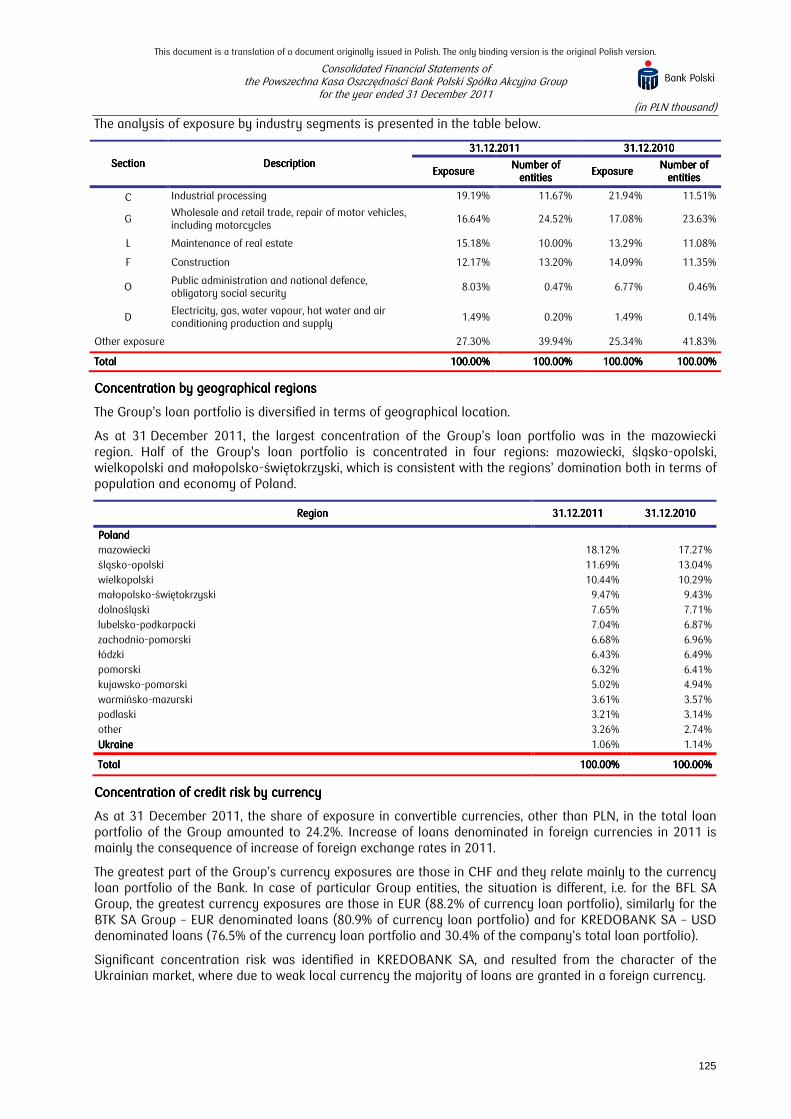
This document is a translation of a document originally issued in Polish. The only binding version is the original Polish version.
Consolidated Financial Statements of the Powszechna Kasa Oszczędności Bank Polski Spółka Akcyjna Group
for the year ended 31 December 2011 (in PLN thousand)
125
The analysis of exposure by industry segments is presented in the table below.
SectionSectionSectionSection DescriptionDescriptionDescriptionDescription
31.12.20131.12.20131.12.20131.12.2011111 31.12.2031.12.2031.12.2031.12.2010101010
ExposureExposureExposureExposure Number of Number of Number of Number of
entitiesentitiesentitiesentities ExposureExposureExposureExposure
Number of Number of Number of Number of entitiesentitiesentitiesentities
C Industrial processing 19.19% 11.67% 21.94% 11.51%
G Wholesale and retail trade, repair of motor vehicles, including motorcycles
16.64% 24.52% 17.08% 23.63%
L Maintenance of real estate 15.18% 10.00% 13.29% 11.08%
F Construction 12.17% 13.20% 14.09% 11.35%
O Public administration and national defence, obligatory social security
8.03% 0.47% 6.77% 0.46%
D Electricity, gas, water vapour, hot water and air conditioning production and supply
1.49% 0.20% 1.49% 0.14%
Other exposure 27.30% 39.94% 25.34% 41.83%
TotalTotalTotalTotal 100.00100.00100.00100.00%%%% 100.00%100.00%100.00%100.00% 100.00%100.00%100.00%100.00% 100.00%100.00%100.00%100.00%
Concentration by geographical regionsConcentration by geographical regionsConcentration by geographical regionsConcentration by geographical regions
The Group’s loan portfolio is diversified in terms of geographical location.
As at 31 December 2011, the largest concentration of the Group’s loan portfolio was in the mazowiecki region. Half of the Group's loan portfolio is concentrated in four regions: mazowiecki, śląsko-opolski, wielkopolski and małopolsko-świętokrzyski, which is consistent with the regions’ domination both in terms of population and economy of Poland.
RegionRegionRegionRegion 33331.12.2011.12.2011.12.2011.12.2011111 31.12.2031.12.2031.12.2031.12.2010101010
PolandPolandPolandPoland mazowiecki 18.12% 17.27%
śląsko-opolski 11.69% 13.04%
wielkopolski 10.44% 10.29%
małopolsko-świętokrzyski 9.47% 9.43%
dolnośląski 7.65% 7.71%
lubelsko-podkarpacki 7.04% 6.87%
zachodnio-pomorski 6.68% 6.96%
łódzki 6.43% 6.49%
pomorski 6.32% 6.41%
kujawsko-pomorski 5.02% 4.94%
warmińsko-mazurski 3.61% 3.57%
podlaski 3.21% 3.14%
other 3.26% 2.74%
UkrainUkrainUkrainUkraineeee 1.06% 1.14%
TotalTotalTotalTotal 100.00%100.00%100.00%100.00% 100.00%100.00%100.00%100.00%
Concentration of credit risk by currencyConcentration of credit risk by currencyConcentration of credit risk by currencyConcentration of credit risk by currency
As at 31 December 2011, the share of exposure in convertible currencies, other than PLN, in the total loan portfolio of the Group amounted to 24.2%. Increase of loans denominated in foreign currencies in 2011 is mainly the consequence of increase of foreign exchange rates in 2011.
The greatest part of the Group’s currency exposures are those in CHF and they relate mainly to the currency loan portfolio of the Bank. In case of particular Group entities, the situation is different, i.e. for the BFL SA Group, the greatest currency exposures are those in EUR (88.2% of currency loan portfolio), similarly for the BTK SA Group – EUR denominated loans (80.9% of currency loan portfolio) and for KREDOBANK SA – USD denominated loans (76.5% of the currency loan portfolio and 30.4% of the company’s total loan portfolio).
Significant concentration risk was identified in KREDOBANK SA, and resulted from the character of the Ukrainian market, where due to weak local currency the majority of loans are granted in a foreign currency.

This document is a translation of a document originally issued in Polish. The only binding version is the original Polish version.
Consolidated Financial Statements of the Powszechna Kasa Oszczędności Bank Polski Spółka Akcyjna Group
for the year ended 31 December 2011 (in PLN thousand)
126
Concentration oConcentration oConcentration oConcentration of credit risk by currencyf credit risk by currencyf credit risk by currencyf credit risk by currency
CurrencyCurrencyCurrencyCurrency 31.12.20131.12.20131.12.20131.12.2011111 31.12.2031.12.2031.12.2031.12.2010101010
PLN 75.76% 76.43%
Foreign currencies, of which: 24.24% 23.57%
CHF 16.46% 16.85%
EUR 5.71% 4.73%
USD 1.41% 1.44%
UAH 0.64% 0.54%
GBP 0.02% 0.01%
TotalTotalTotalTotal 100.00%100.00%100.00%100.00% 100.00%100.00%100.00%100.00%
Other Other Other Other types of concentrationtypes of concentrationtypes of concentrationtypes of concentration
In accordance with the Recommendation S and T of the Polish Financial Supervision Authority, the Bank uses internal limits on credit exposures related to the Bank’s customers defining the appetite for the credit risk.
As at 31 December 2011, these limits have not been exceeded.
Renegotiated receivablesRenegotiated receivablesRenegotiated receivablesRenegotiated receivables
The purpose of the restructuring activity of the Group is to maximise the effectiveness of non-performing loan management. The aim is to receive the highest possible recoveries and, at the same time, incur the minimal costs relating to these recoveries in the case of enforcement proceedings.
The restructuring activities include a change in payment terms which is individually agreed on an each contract basis. Such changes may concern:
1) repayment deadline,
2) repayment schedule,
3) interest rate,
4) payment recognition order,
5) collateral,
6) amount to be repaid (reduction of the amount).
As a result of signing and a timely service of a restructuring agreement the loan being restructured is reset from overdue to current. Evaluation of the ability of a debtor to fulfil the restructuring agreement conditions (debt repayment according to the agreed schedule) constitutes an element of the restructuring process. Active restructuring agreements are monitored on an on-going basis.
Past due financial assetsPast due financial assetsPast due financial assetsPast due financial assets Financial assets which are past due but not impaired at the reporting date include the following financial assets:
Financial AssetsFinancial AssetsFinancial AssetsFinancial Assets
31.12.20131.12.20131.12.20131.12.2011111 31.12.2031.12.2031.12.2031.12.2010101010
up to 1 up to 1 up to 1 up to 1 monthmonthmonthmonth
1 1 1 1 ---- 3 3 3 3 monthsmonthsmonthsmonths
over 3 over 3 over 3 over 3 monthsmonthsmonthsmonths
TotalTotalTotalTotal up to 1 up to 1 up to 1 up to 1 monthmonthmonthmonth
1 1 1 1 ---- 3 3 3 3 monthsmonthsmonthsmonths
over 3 over 3 over 3 over 3 monthsmonthsmonthsmonths
TotalTotalTotalTotal
Loans and advances to customersLoans and advances to customersLoans and advances to customersLoans and advances to customers 2 543 933 1 348 716 114 626114 626114 626114 626 4 007 2754 007 2754 007 2754 007 275 3 259 441 1 021 127 96 110 4 376 6784 376 6784 376 6784 376 678
financial sector 4 469 153 - 4 6224 6224 6224 622 - - 102 102102102102
non-financial sector 2 494 974 1 348 563 114 626 3 958 1633 958 1633 958 1633 958 163 2 657 540 1 021 127 96 008 3 774 6753 774 6753 774 6753 774 675
budget sector 44 490 - - 44 49044 49044 49044 490 601 901 - - 601 901601 901601 901601 901
Amounts due from Amounts due from Amounts due from Amounts due from banksbanksbanksbanks - - - ---- 351 - - 351351351351
Other assets Other assets Other assets Other assets –––– other financial assetsother financial assetsother financial assetsother financial assets 477 - 516 993993993993 - 292 - 292292292292
TotalTotalTotalTotal 2 544 4102 544 4102 544 4102 544 410 1 348 7161 348 7161 348 7161 348 716 115 142115 142115 142115 142 4 008 2684 008 2684 008 2684 008 268 3 259 7923 259 7923 259 7923 259 792 1 021 4191 021 4191 021 4191 021 419 96 11096 11096 11096 110 4 377 3214 377 3214 377 3214 377 321
Collateral for the above receivables includes: mortgages, registered pledges, transfers of property rights, account lock-ups, loan exposure insurances, warranties and guarantees.
The Bank made an assessment which proved that for the above-mentioned loan exposures the expected cash flows exceed the carrying amount of these exposures.
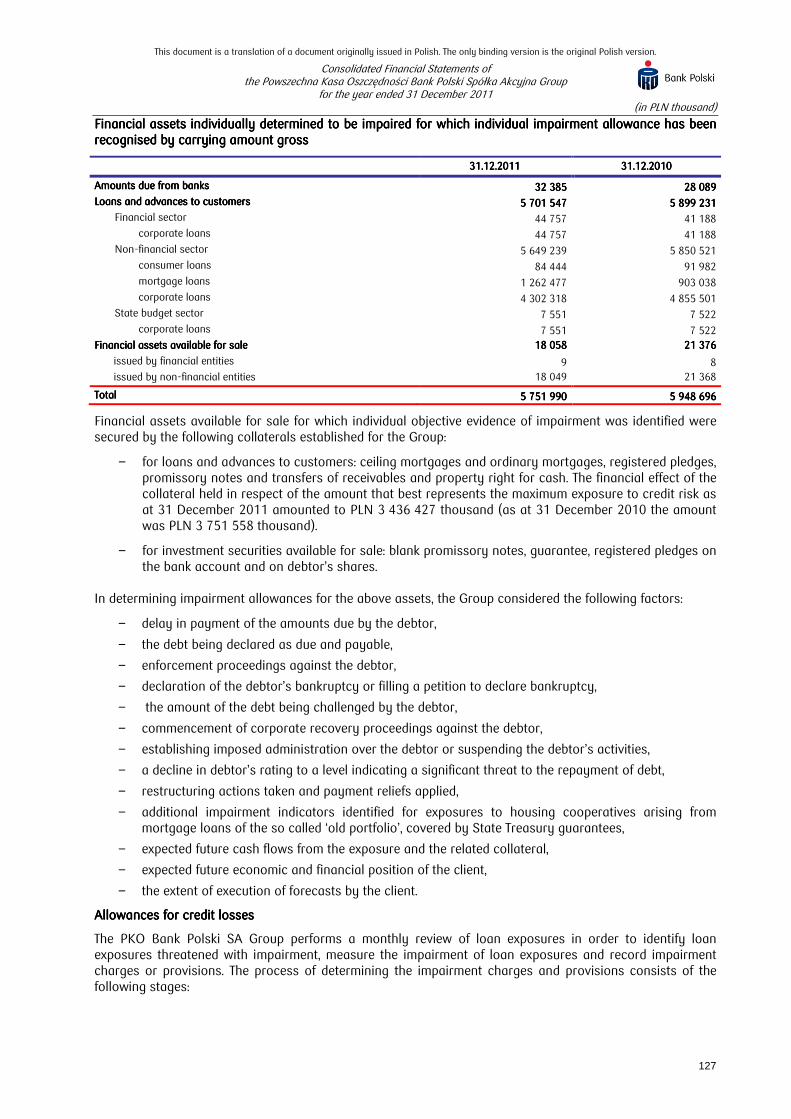
This document is a translation of a document originally issued in Polish. The only binding version is the original Polish version.
Consolidated Financial Statements of the Powszechna Kasa Oszczędności Bank Polski Spółka Akcyjna Group
for the year ended 31 December 2011 (in PLN thousand)
127
Financial assets iFinancial assets iFinancial assets iFinancial assets individually determined to be impaired for which individual impairment allowance has been ndividually determined to be impaired for which individual impairment allowance has been ndividually determined to be impaired for which individual impairment allowance has been ndividually determined to be impaired for which individual impairment allowance has been recognised by carrying amount grossrecognised by carrying amount grossrecognised by carrying amount grossrecognised by carrying amount gross
31.12.20131.12.20131.12.20131.12.2011111 31.12.2031.12.2031.12.2031.12.2010101010
Amounts due from banksAmounts due from banksAmounts due from banksAmounts due from banks 32 385 32 385 32 385 32 385 28 089 28 089 28 089 28 089 Loans and advances to customersLoans and advances to customersLoans and advances to customersLoans and advances to customers 5 701 547 5 701 547 5 701 547 5 701 547 5 899 231 5 899 231 5 899 231 5 899 231
Financial sector 44 757 41 188 corporate loans 44 757 41 188
Non-financial sector 5 649 239 5 850 521 consumer loans 84 444 91 982 mortgage loans 1 262 477 903 038 corporate loans 4 302 318 4 855 501
State budget sector 7 551 7 522 corporate loans 7 551 7 522
Financial assetsFinancial assetsFinancial assetsFinancial assets available for saleavailable for saleavailable for saleavailable for sale 18 058 18 058 18 058 18 058 21 376 21 376 21 376 21 376
issued by financial entities 9 8 issued by non-financial entities 18 049 21 368
TotalTotalTotalTotal 5 751 990 5 751 990 5 751 990 5 751 990 5 948 696 5 948 696 5 948 696 5 948 696
Financial assets available for sale for which individual objective evidence of impairment was identified were secured by the following collaterals established for the Group:
− for loans and advances to customers: ceiling mortgages and ordinary mortgages, registered pledges, promissory notes and transfers of receivables and property right for cash. The financial effect of the collateral held in respect of the amount that best represents the maximum exposure to credit risk as at 31 December 2011 amounted to PLN 3 436 427 thousand (as at 31 December 2010 the amount was PLN 3 751 558 thousand).
− for investment securities available for sale: blank promissory notes, guarantee, registered pledges on the bank account and on debtor’s shares.
In determining impairment allowances for the above assets, the Group considered the following factors:
− delay in payment of the amounts due by the debtor,
− the debt being declared as due and payable,
− enforcement proceedings against the debtor,
− declaration of the debtor’s bankruptcy or filling a petition to declare bankruptcy,
− the amount of the debt being challenged by the debtor,
− commencement of corporate recovery proceedings against the debtor,
− establishing imposed administration over the debtor or suspending the debtor’s activities,
− a decline in debtor’s rating to a level indicating a significant threat to the repayment of debt,
− restructuring actions taken and payment reliefs applied,
− additional impairment indicators identified for exposures to housing cooperatives arising from mortgage loans of the so called ‘old portfolio’, covered by State Treasury guarantees,
− expected future cash flows from the exposure and the related collateral,
− expected future economic and financial position of the client,
− the extent of execution of forecasts by the client.
Allowances for credit lossesAllowances for credit lossesAllowances for credit lossesAllowances for credit losses
The PKO Bank Polski SA Group performs a monthly review of loan exposures in order to identify loan exposures threatened with impairment, measure the impairment of loan exposures and record impairment charges or provisions. The process of determining the impairment charges and provisions consists of the following stages:
This document is a translation of a document originally issued in Polish. The only binding version is the original Polish version.
Consolidated Financial Statements of the Powszechna Kasa Oszczędności Bank Polski Spółka Akcyjna Group
for the year ended 31 December 2011 (in PLN thousand)
128
– identifying the indications of impairment and events significant from the point of view of identifying those indications,
– registering in the Group’s IT systems the events that are material from the point of view of identifying indications of impairment of credit exposures,
– determining the method of measuring impairment,
– measuring impairment and determining an impairment charge or provision,
– verifying and aggregating the results of the impairment measurement,
– recording the results of impairment measurement.
The PKO Bank Polski SA Group applies three methods of estimating impairment:
– the individualised method applied in respect of individually significant loans, for which the objective evidence of impairment was identified or requiring individual assessment due to the transactions specifics and resulting from events determining the repayment of exposure,
– the portfolio method applied in respect of individually insignificant loans, for which the objective evidence of impairment was identified,
– the group method (IBNR) applied in respect of the loans for which no objective evidence of impairment was identified, but there is a possibility of losses incurred but not recognised occurring.
The structure of the loan portfolio and loan impairment allowances of the PKO Bank Polski SA Group are presented in Note 23 ‘Loans and advances to customers’.
With regard to other credit exposures, the provision is determined as the difference between the expected amount of exposure in the statement of financial position, which will arise as a result of an off-balance sheet liabilities (from the date at which the assessment is performed till the date of overdue amounts due arising considered as constituting an indication of individual impairment) and the present value of the expected future cash flows obtained from the exposure in the statement of financial position arising out of the off-balance sheet liabilities.
When determining a provision under the individualised method, the expected future cash flows are estimated for each loan exposure separately.
When determining a provision under the portfolio method or the group method, the portfolio parameters are used, estimated using statistical methods, based on the historic observation of exposures with the same features.
The structure of the loan portfolio and loan impairment allowances of the PKO Bank Polski SA Group are presented in Note 23 ‘Loans and advances to customers’.
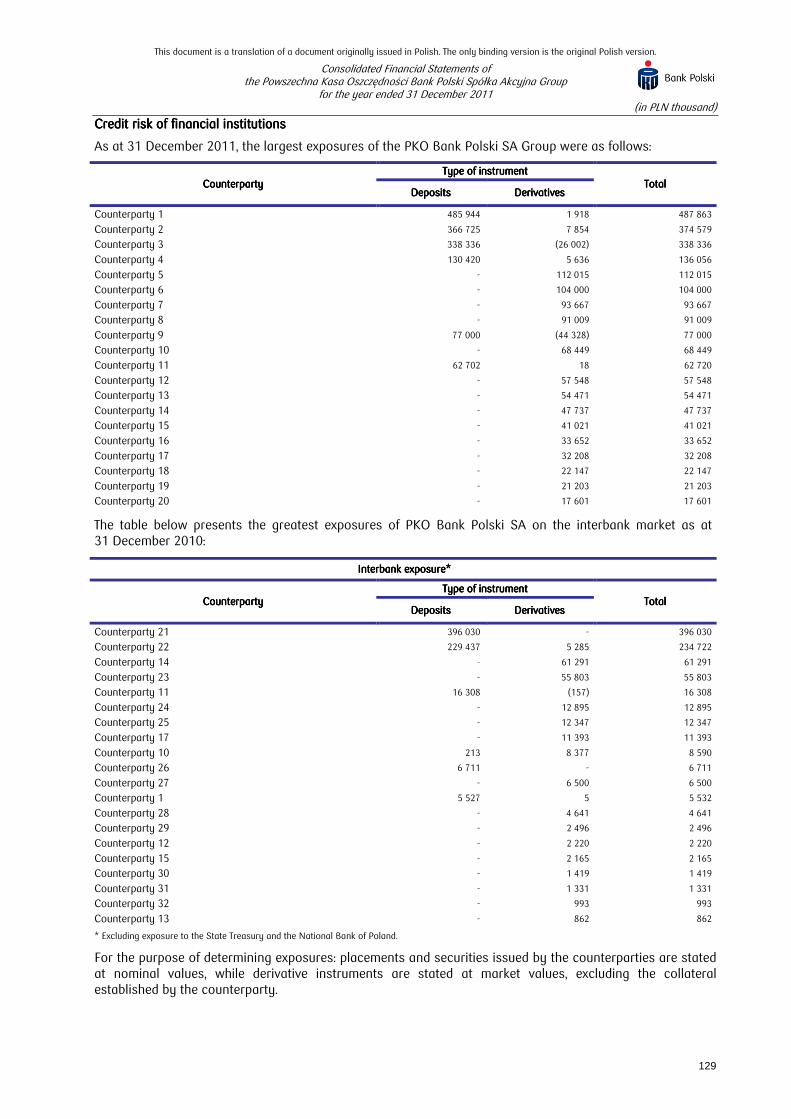
This document is a translation of a document originally issued in Polish. The only binding version is the original Polish version.
Consolidated Financial Statements of the Powszechna Kasa Oszczędności Bank Polski Spółka Akcyjna Group
for the year ended 31 December 2011 (in PLN thousand)
129
Credit risk of financial institutionsCredit risk of financial institutionsCredit risk of financial institutionsCredit risk of financial institutions
As at 31 December 2011, the largest exposures of the PKO Bank Polski SA Group were as follows:
CounterpartyCounterpartyCounterpartyCounterparty Type of instrument Type of instrument Type of instrument Type of instrument
TotalTotalTotalTotal DepositsDepositsDepositsDeposits DDDDerivativeserivativeserivativeserivatives
Counterparty 1 485 944 1 918 487 863
Counterparty 2 366 725 7 854 374 579
Counterparty 3 338 336 (26 002) 338 336
Counterparty 4 130 420 5 636 136 056
Counterparty 5 - 112 015 112 015
Counterparty 6 - 104 000 104 000
Counterparty 7 - 93 667 93 667
Counterparty 8 - 91 009 91 009
Counterparty 9 77 000 (44 328) 77 000
Counterparty 10 - 68 449 68 449
Counterparty 11 62 702 18 62 720
Counterparty 12 - 57 548 57 548
Counterparty 13 - 54 471 54 471
Counterparty 14 - 47 737 47 737
Counterparty 15 - 41 021 41 021
Counterparty 16 - 33 652 33 652
Counterparty 17 - 32 208 32 208
Counterparty 18 - 22 147 22 147
Counterparty 19 - 21 203 21 203
Counterparty 20 - 17 601 17 601
The table below presents the greatest exposures of PKO Bank Polski SA on the interbank market as at 31 December 2010:
Interbank exposureInterbank exposureInterbank exposureInterbank exposure****
CounterpartyCounterpartyCounterpartyCounterparty Type of instrument Type of instrument Type of instrument Type of instrument
TotalTotalTotalTotal DepositsDepositsDepositsDeposits DDDDerivativeserivativeserivativeserivatives
Counterparty 21 396 030 - 396 030
Counterparty 22 229 437 5 285 234 722
Counterparty 14 - 61 291 61 291
Counterparty 23 - 55 803 55 803
Counterparty 11 16 308 (157) 16 308
Counterparty 24 - 12 895 12 895
Counterparty 25 - 12 347 12 347
Counterparty 17 - 11 393 11 393
Counterparty 10 213 8 377 8 590
Counterparty 26 6 711 - 6 711
Counterparty 27 - 6 500 6 500
Counterparty 1 5 527 5 5 532
Counterparty 28 - 4 641 4 641
Counterparty 29 - 2 496 2 496
Counterparty 12 - 2 220 2 220
Counterparty 15 - 2 165 2 165
Counterparty 30 - 1 419 1 419
Counterparty 31 - 1 331 1 331
Counterparty 32 - 993 993
Counterparty 13 - 862 862
* Excluding exposure to the State Treasury and the National Bank of Poland.
For the purpose of determining exposures: placements and securities issued by the counterparties are stated at nominal values, while derivative instruments are stated at market values, excluding the collateral established by the counterparty.

This document is a translation of a document originally issued in Polish. The only binding version is the original Polish version.
Consolidated Financial Statements of the Powszechna Kasa Oszczędności Bank Polski Spółka Akcyjna Group
for the year ended 31 December 2011 (in PLN thousand)
130
Total exposure to each counterparty (column ‘Total’) is the sum of exposures arising from placements and securities, increased by the exposure arising from derivative instruments, if it is positive (otherwise the exposure arising from derivatives is not included in total exposure). Exposure arising from all instruments is calculated from the moment of entering into transaction.
As at 31 December 2011 the Bank had signed master agreements (in accordance with ISDA/ Polish Banks Association standards) with 27 local banks and 51 foreign banks and credit institutions. Additionally the Bank was a party of 55 CSA agreements (Credit Support Annex)/Polish Banks Association Agreements with established collateral and 4 ISMA agreements (International Securities Market Association).
GeographicalGeographicalGeographicalGeographical localilocalilocalilocalisationsationsationsation of counterpartiesof counterpartiesof counterpartiesof counterparties
The counterparties generating the 20 largest exposures as at 31 December 2011 and as at 31 December 2010 come from the following countries (classified by location of registered office):
No.No.No.No. CountryCountryCountryCountry CounterpartyCounterpartyCounterpartyCounterparty
1. Austria Counterparty 2 2. Belgium Counterparty 28
3. Denmark Counterparty 10
4. France Counterparty 9, Counterparty 13, Counterparty 15
5. Netherlands Counterparty 27
6. Canada Counterparty 32
7. Germany Counterparty 6, Counterparty 20
8. Norway Counterparty 1
9. Poland Counterparty 3, Counterparty 4, Counterparty 12, Counterparty 14, Counterparty 18, Counterparty 19, Counterparty 22, Counterparty 23, Counterparty 24
10. Switzerland Counterparty 17
11. Sweden Counterparty 26
12. USA Counterparty 31
13. United Kingdom Counterparty 5, Counterparty 7, Counterparty 8, Counterparty 11, Counterparty 16, Counterparty 25, Counterparty 29, Counterparty 30
14. Italy Counterparty 21
Counterparty structure by ratingCounterparty structure by ratingCounterparty structure by ratingCounterparty structure by rating
Exposure structure by rating is presented in the table below. The ratings were determined based on external ratings granted by Moody’s, Standard&Poor’s and Fitch (when a rating was granted by two agencies, the lower rating was applied, whereas when a rating was granted by three agencies, the middle rating was applied). Rating for counterparties 1 to 32 was accepted as at 31 December 2011.
RatingRatingRatingRating CountCountCountCounterpartyerpartyerpartyerparty
AA Counterparty 15, Counterparty 30, Counterparty 32, Counterparty 8
A Counterparty 1, Counterparty 10, Counterparty 11, Counterparty 13, Counterparty 16, Counterparty 17, Counterparty 2, Counterparty 25, Counterparty 26, Counterparty 27, Counterparty 28, Counterparty 3, Counterparty 31, Counterparty 5, Counterparty 6, Counterparty 7, Counterparty 9
BBB Counterparty 12, Counterparty 18, Counterparty 20, Counterparty 21, Counterparty 23, Counterparty 24, Counterparty 4
BB Counterparty 14, Counterparty 22
Without rating Counterparty 19, Counterparty 29
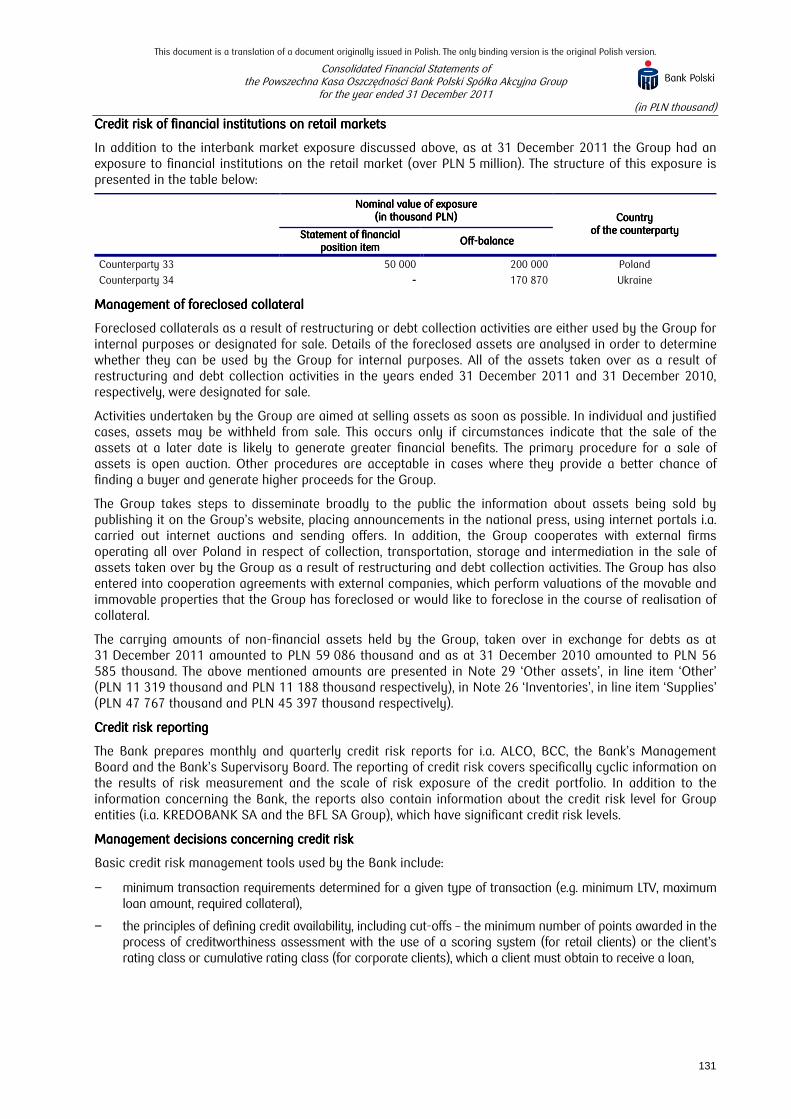
This document is a translation of a document originally issued in Polish. The only binding version is the original Polish version.
Consolidated Financial Statements of the Powszechna Kasa Oszczędności Bank Polski Spółka Akcyjna Group
for the year ended 31 December 2011 (in PLN thousand)
131
Credit Credit Credit Credit risk of financial institutions on retail marketsrisk of financial institutions on retail marketsrisk of financial institutions on retail marketsrisk of financial institutions on retail markets
In addition to the interbank market exposure discussed above, as at 31 December 2011 the Group had an exposure to financial institutions on the retail market (over PLN 5 million). The structure of this exposure is presented in the table below:
Nominal value of exposure Nominal value of exposure Nominal value of exposure Nominal value of exposure (in thousand PLN)(in thousand PLN)(in thousand PLN)(in thousand PLN) Country Country Country Country
of the counterpartyof the counterpartyof the counterpartyof the counterparty Statement of financial Statement of financial Statement of financial Statement of financial position itemposition itemposition itemposition item
OffOffOffOff----balancebalancebalancebalance
Counterparty 33 50 000 200 000 Poland
Counterparty 34 ---- 170 870 Ukraine
Management of foreclosed collateralManagement of foreclosed collateralManagement of foreclosed collateralManagement of foreclosed collateral
Foreclosed collaterals as a result of restructuring or debt collection activities are either used by the Group for internal purposes or designated for sale. Details of the foreclosed assets are analysed in order to determine whether they can be used by the Group for internal purposes. All of the assets taken over as a result of restructuring and debt collection activities in the years ended 31 December 2011 and 31 December 2010, respectively, were designated for sale.
Activities undertaken by the Group are aimed at selling assets as soon as possible. In individual and justified cases, assets may be withheld from sale. This occurs only if circumstances indicate that the sale of the assets at a later date is likely to generate greater financial benefits. The primary procedure for a sale of assets is open auction. Other procedures are acceptable in cases where they provide a better chance of finding a buyer and generate higher proceeds for the Group.
The Group takes steps to disseminate broadly to the public the information about assets being sold by publishing it on the Group’s website, placing announcements in the national press, using internet portals i.a. carried out internet auctions and sending offers. In addition, the Group cooperates with external firms operating all over Poland in respect of collection, transportation, storage and intermediation in the sale of assets taken over by the Group as a result of restructuring and debt collection activities. The Group has also entered into cooperation agreements with external companies, which perform valuations of the movable and immovable properties that the Group has foreclosed or would like to foreclose in the course of realisation of collateral.
The carrying amounts of non-financial assets held by the Group, taken over in exchange for debts as at 31 December 2011 amounted to PLN 59 086 thousand and as at 31 December 2010 amounted to PLN 56 585 thousand. The above mentioned amounts are presented in Note 29 ‘Other assets’, in line item ‘Other’ (PLN 11 319 thousand and PLN 11 188 thousand respectively), in Note 26 ‘Inventories’, in line item ‘Supplies’ (PLN 47 767 thousand and PLN 45 397 thousand respectively).
Credit risk reportingCredit risk reportingCredit risk reportingCredit risk reporting
The Bank prepares monthly and quarterly credit risk reports for i.a. ALCO, BCC, the Bank’s Management Board and the Bank’s Supervisory Board. The reporting of credit risk covers specifically cyclic information on the results of risk measurement and the scale of risk exposure of the credit portfolio. In addition to the information concerning the Bank, the reports also contain information about the credit risk level for Group entities (i.a. KREDOBANK SA and the BFL SA Group), which have significant credit risk levels.
Management decisions concerning credit riskManagement decisions concerning credit riskManagement decisions concerning credit riskManagement decisions concerning credit risk
Basic credit risk management tools used by the Bank include:
− minimum transaction requirements determined for a given type of transaction (e.g. minimum LTV, maximum loan amount, required collateral),
− the principles of defining credit availability, including cut-offs – the minimum number of points awarded in the process of creditworthiness assessment with the use of a scoring system (for retail clients) or the client’s rating class or cumulative rating class (for corporate clients), which a client must obtain to receive a loan,

This document is a translation of a document originally issued in Polish. The only binding version is the original Polish version.
Consolidated Financial Statements of the Powszechna Kasa Oszczędności Bank Polski Spółka Akcyjna Group
for the year ended 31 December 2011 (in PLN thousand)
132
− concentration limits – the limits defined in the Article 71, clause 1 of the Banking Law,
− industry-related limits – limits which reduce the risk level related to financing institutional clients that conduct business activities in industries characterised by high level of credit risk,
− limits on credit exposures related to the Bank's customers – the limits defining the appetite for credit risk as result of i.a. the recommendations S and T,
− credit limits defining the Bank’s maximum exposure to a given client or country in respect of wholesale operations and settlement limits and limits for the period of exposure,
− competence limits – they define the maximum level of credit decision-making powers with regard to the Bank’s clients, the limits depend primarily on the amount of the Bank’s exposure to a given client (or a group of related clients) and the loan transaction period; the competence limit depends on the credit decision-making level (in the Bank’s organisational structure),
− minimum credit margins – credit risk margins relating to a given credit transaction concluded by the Bank with a given corporate client but the interest rate offered to a client cannot be lower than the reference rate plus credit risk margin.
Collateral management policy plays a significant role in establishing minimum transaction terms as regards credit risk. The Bank’s and the entities’ of the Group collateral management is meant to secure properly the credit risk to which the Group is exposed, including first of all the fact of establishing collateral that will ensure the highest possible level of recovery in the event of realisation of collateral.
The Bank applies the following rules with respect to accepting legal collateral for loans:
− in the case of substantial loans (in terms of value), several types of collateral are established, if possible, personal guarantees are combined with collateral established on assets,
− liquid types of collateral i.e. collateral established on tangible assets, which the Bank is likely to dispose of quickly for a price approximating the value of the assets put up as collateral are preferred,
− types of collateral which are exposed to a risk of significant adverse fluctuations of value are treated as auxiliary collateral,
− when an asset is accepted as collateral, an assignment of rights from the insurance policy relating to this asset or the insurance policy issued to the Bank are accepted as additional collateral,
− effective establishment of collateral in compliance with the loan agreement is necessary to make the funds available.
The policy regarding legal collateral is defined by internal regulations of Group’s subsidiaries.
The type of collateral depends on the product and the type of the client. With regard to real estate financing products, collateral is required to be established as mortgage on the property. Until an effective mortgage is established, the following types of collateral are used (depending on type and amount of loan): an increased credit margin or/and a collateral in the form of a cession of receivables related to the construction agreement, bill of exchange, guarantee or an insurance of receivables.
With regard to retail banking loans for individuals, usually personal guarantees are used (a civil law surety/guarantee, a bill of exchange) or collateral is established on the client’s bank account, his car or securities.
With regard to loans for the financing of small and medium enterprises and corporate clients, collateral can be established on i.a.: trade receivables, bank accounts, movable property, real estate or securities.
When signing a leasing agreement, BFL SA Group, as a proprietor of leased objects, treats them as collateral.

This document is a translation of a document originally issued in Polish. The only binding version is the original Polish version.
Consolidated Financial Statements of the Powszechna Kasa Oszczędności Bank Polski Spółka Akcyjna Group
for the year ended 31 December 2011 (in PLN thousand)
133
56.56.56.56. Interest rate risk managementInterest rate risk managementInterest rate risk managementInterest rate risk management
The interest rate risk is a risk of incurring losses on the Bank's balance and off-balance sheet items sensitive to interest rate fluctuations, as a result of changes in the interest rates on the market.
The objective of interest rate risk management is to mitigate the risk of incurring losses arising from market interest rate changes to an acceptable level by shaping the structure of balance and off-balance sheet items.
Measurement oMeasurement oMeasurement oMeasurement of interest rate riskf interest rate riskf interest rate riskf interest rate risk
In the process of interest rate risk management, the Group uses, in particularly, the Value at Risk (VaR) model, interest income sensitivity measure, stress tests and a repricing gap.
The value at risk (VaR) is defined as a potential loss arising from the maintained structure of balance and off-balance sheet items and the volatility of interest rates, with the assumed probability level and taking into account the correlation between the risk factors.
The sensitivity of interest income is a measure showing changes in interest income resulting from abrupt changes in the interest rates. This measure takes into account the diversity of revaluation dates of the
individual interest-bearing items in each of the selected time horizons.
Stress-tests are used to estimate potential losses arising from a held structure of the statement of financial position and off-balance sheet items under market conditions that cannot be described in a standard manner using statistical measures. Two types of scenarios are used by the Bank:
1) hypothetical scenarios – which are based on arbitrary interest rate fluctuations: a parallel move in interest rate curves for the particular currencies by ±50 b.p., ±100 b.p. and by ±200 b.p.,
2) historical scenarios – in which interest rate fluctuations are adopted based on the behaviour of interest rates in the past, including: the highest historical change, a bend of a yield curve along with portfolio positions, a bend of yield curve of peak and twist types, the largest historical non-parallel fluctuation of the interest rate curves for securities and derivative instruments that hedge them.
The repricing gap shows the difference between the present value of assets and liabilities exposed to interest rate risk, subject to revaluation in a given time range, and these balances are recognised on the transaction date.
Measures of interest rate gap are determined for other Group entities using similar methods to those used for determining the interest rate gap for the Bank itself, taking into account the specific nature of the entities.

This document is a translation of a document originally issued in Polish. The only binding version is the original Polish version.
Consolidated Financial Statements of the Powszechna Kasa Oszczędności Bank Polski Spółka Akcyjna Group
for the year ended 31 December 2011 (in PLN thousand)
134
RepriRepriRepriRepriccccing Gaping Gaping Gaping Gap 0000----1month1month1month1month 1111----3 3 3 3
monthsmonthsmonthsmonths 3333----6 6 6 6
monthsmonthsmonthsmonths 6666----12 12 12 12
monthsmonthsmonthsmonths 1111----2 2 2 2
yearsyearsyearsyears 2222----5 5 5 5
yyyyearsearsearsears >5 years>5 years>5 years>5 years TotalTotalTotalTotal
PLN (in PLN thousand)PLN (in PLN thousand)PLN (in PLN thousand)PLN (in PLN thousand) 31.12.201131.12.201131.12.201131.12.2011
The Group - periodic gap 50 300 391 13 856 572 (20 533 401) (22 321 974) (4 487 228) 900 527 79 727 17 794 614 17 794 614 17 794 614 17 794 614
The Group - cumulative gap 50 300 391 64 156 963 43 623 562 21 301 588 16 814 360 17 714 887 17 794 614 ----
PLN (in PLN thousand)PLN (in PLN thousand)PLN (in PLN thousand)PLN (in PLN thousand) 31.12.201031.12.201031.12.201031.12.2010
The Group - periodic gap 40 074 163 16 872 118 (23 857 194) (13 908 620) (2 867 293) 538 212 329 000 17 180 386 17 180 386 17 180 386 17 180 386
The Group - cumulative gap 40 074 163 56 946 281 33 089 087 19 180 467 16 313 174 16 851 386 17 180 386 ----
USD (in USD thousand)USD (in USD thousand)USD (in USD thousand)USD (in USD thousand) 31.12.201131.12.201131.12.201131.12.2011
The Group - periodic gap 542 875 (35 377) (311 295) (360 850) (39 223) 24 152 84 102 (95 616)(95 616)(95 616)(95 616)
The Group - cumulative gap 542 875 507 498 196 203 (164 647) (203 870) (179 718) (95 616) ----
USD (in USD thousand)USD (in USD thousand)USD (in USD thousand)USD (in USD thousand) 31.12.201031.12.201031.12.201031.12.2010
The Group - periodic gap 304 316 (161 359) (166 953) (139 043) 11 781 54 871 94 404 (1 983)(1 983)(1 983)(1 983)
The Group - cumulative gap 304 316 142 957 (23 996) (163 039) (151 258) (96 387) (1 983) ----
EUR (in EUR thousand)EUR (in EUR thousand)EUR (in EUR thousand)EUR (in EUR thousand) 31.12.201131.12.201131.12.201131.12.2011
The Group - periodic gap 299 125 (187 104) (25 506) (16 821) (40 984) (337 996) 7 879 (301 407)(301 407)(301 407)(301 407)
The Group - cumulative gap 299 125 112 021 86 515 69 694 28 710 (309 286) (301 407) ----
EUR (in EUR thousand)EUR (in EUR thousand)EUR (in EUR thousand)EUR (in EUR thousand) 31.12.201031.12.201031.12.201031.12.2010
The Group - periodic gap 661 080 (308 414) 78 172 (223 242) 19 577 (592 387) 40 700 (324 514)(324 514)(324 514)(324 514)
The Group - cumulative gap 661 080 352 666 430 838 207 596 227 173 (365 214) (324 514) ----
CHF (in CHF thousand)CHF (in CHF thousand)CHF (in CHF thousand)CHF (in CHF thousand) 31.12.201131.12.201131.12.201131.12.2011
The Group - periodic gap (683 848) 546 151 (15 430) (38 121) 1 427 (29 085) 7 345 (211 561)(211 561)(211 561)(211 561)
The Group - cumulative gap (683 848) (137 697) (153 127) (191 248) (189 821) (218 906) (211 561) ----
CHF (in CHF thousand)CHF (in CHF thousand)CHF (in CHF thousand)CHF (in CHF thousand) 31.12.201031.12.201031.12.201031.12.2010
The Group - periodic gap 302 630 (552 592) (3 600) (4 460) (40) 1 520 6 770 (249 772)(249 772)(249 772)(249 772)
The Group - cumulative gap 302 630 (249 962) (253 562) (258 022) (258 062) (256 542) (249 772) ----
At the end of 2011 and 2010 the Group had a positive cumulative gap in PLN in all time horizons.
Forecasting and monitoring of interest rate riskForecasting and monitoring of interest rate riskForecasting and monitoring of interest rate riskForecasting and monitoring of interest rate risk
As at 31 December 2011 and 31 December 2010, the exposure of the PKO Bank Polski SA Group to the interest rate risk comprised mainly of the exposure of the Bank. Interest rate risk generated by the other Group entities with regard to PLN, EUR and CHF did not have a significant effect on the interest rate risk of the entire Group and therefore did not significantly affect its risk profile. Interest rate risk with regard to USD was significantly altered by exposure of the Group, in which the biggest part has the exposure of KREDOBANK SA.

This document is a translation of a document originally issued in Polish. The only binding version is the original Polish version.
Consolidated Financial Statements of the Powszechna Kasa Oszczędności Bank Polski Spółka Akcyjna Group
for the year ended 31 December 2011 (in PLN thousand)
135
VaR of the Bank and stress tests analysis of the Group’s exposure to the interest rate risk are presented in the following table:
Name of the sensitivity measureName of the sensitivity measureName of the sensitivity measureName of the sensitivity measure 31.12.201131.12.201131.12.201131.12.2011 31.12.201031.12.201031.12.201031.12.2010
VaR for a 10-day time horizon (in PLN thousand)* 62 661 39 004 Parallel movement of interest rate curves by 200 b.p. (in PLN thousand) (stress test) 530 726 522 641
* Due to the nature of the activities carried out by the other Group entities generating significant interest rate risk as well as a the specific nature of the market on which they operate, the Group does not calculate consolidated VaR. These companies apply their own risk measures in the interest rate risk management. KREDOBANK SA uses the 10-day interest rate VaR for the main currencies, which amounted to PLN 29 673 thousands as at 31 December 2011 and PLN 30 150 thousand as at 31 December 2010, respectively.
As at 31 December 2011 the interest rate VaR for a 10-day time horizon (10-day VaR) amounted to PLN 62 661 thousand, which accounted for approximately 0.36% of the value of the Bank’s own funds. As at 31 December 2010, VaR for the Bank amounted to PLN 39 004 thousand, which accounted for approximately 0.24% of the Bank’s own funds*.
Reporting of the interest rate riskReporting of the interest rate riskReporting of the interest rate riskReporting of the interest rate risk
The Bank prepares daily, weekly, monthly and quarterly reports addressing interest rate risk. The quarterly reports are also applicable to the Group. Reports present the information on interest rate risk exposure and usages of available limits regarding the risk. Reports are prepared mainly for RC, ALCO, the Bank’s Management Board and the Bank’s Supervisory Board.
Management decisions as regards interest rate riskManagement decisions as regards interest rate riskManagement decisions as regards interest rate riskManagement decisions as regards interest rate risk
The main tools used in interest rate risk management in the Group include: − procedures for interest rate risk management, − limits and thresholds for interest rate risk, − defining allowable transactions based on interest rates.
The Group established limits and thresholds for interest rate risk comprising the following: price sensitivity, interest income sensitivity, limits and threshold for losses and limits on instruments sensitive to interest rate fluctuations.
Methods of interest rate risk management in the Group entities are defined by internal regulations implemented by those entities which are characterised by significant values of interest rate risk measure outcomes. These regulations are developed after consultation with the Bank and include recommendations issued by the Bank for Group entities.
57.57.57.57. CCCCurrency riskurrency riskurrency riskurrency risk managementmanagementmanagementmanagement
Currency risk is the risk of incurring losses due to unfavourable exchange rate changes. The risk is generated by maintaining open currency positions in a given foreign currency.
The objective of currency risk management is to mitigate the risk of incurring losses arising from exchange rate fluctuations to an acceptable level by shaping the structure of balance and off-balance sheet items.
Measurement ofMeasurement ofMeasurement ofMeasurement of thethethethe ccccurrency riskurrency riskurrency riskurrency risk
The Bank measures the currency risk using the Value at Risk (VaR) model and stress tests.
The value at risk (VaR) is defined as a potential loss arising from currency position and foreign exchange rate volatility under the assumed confidence level and taking into account the correlation between the risk factors.
* Own funds calculated in accordance with regulations concerning calculation of the capital adequacy ratio.

This document is a translation of a document originally issued in Polish. The only binding version is the original Polish version.
Consolidated Financial Statements of the Powszechna Kasa Oszczędności Bank Polski Spółka Akcyjna Group
for the year ended 31 December 2011 (in PLN thousand)
136
Stress-tests and crash-tests are used to estimate potential losses arising from currency position under extraordinary market conditions that cannot be described in a standard manner using statistical measures. Two types of scenarios are used by the Bank:
1) hypothetical scenarios – which assume a hypothetical appreciation or depreciation of currency rates (by 20% and 50%),
2) historical scenarios – bases on the behaviour of currency rates observed in the past.
Forecasting and monitoriForecasting and monitoriForecasting and monitoriForecasting and monitoring of ng of ng of ng of currency riskcurrency riskcurrency riskcurrency risk
VaR of the Bank and stress-testing of the Group’s financial assets exposed to currency risk are stated cumulatively for all currencies in the table below:
Name of sensitivity Name of sensitivity Name of sensitivity Name of sensitivity measuremeasuremeasuremeasure 31.12.20131.12.20131.12.20131.12.2011111 31.12.2031.12.2031.12.2031.12.2010101010
VaR for a 10-day time horizon (in PLN thousand)* 1 470 3 171
Change in CUR/PLN +20% (in PLN thousand) (stress-test)** 17 210 8 109
* Due to the nature of the activities carried out by the other Group entities generating significant currency risk as well as the specific nature of the market on which they operate, the Bank does not calculate consolidated VaR. These companies apply their own risk measures in the currency risk management. KREDOBANK SA uses the 10-day VaR, which amounted to approx. PLN 467 thousands as at 31 December 2011 and approx. PLN 182 thousand as at 31 December 2010, respectively.
** The table presents the value of the most adverse stress-test of the scenarios: PLN appreciation by 20% and PLN depreciation by 20%. The value of stress-test at the end of 2010 was brought to comparability.
The level of currency risk was low both at 31 December 2011 and 31 December 2010.
The Group’s currency positions are presented in the table below:
31.12.20131.12.20131.12.20131.12.2011111 31.12.2031.12.2031.12.2031.12.2010101010
Currency Currency Currency Currency ppppositionositionositionosition Currency Currency Currency Currency ppppositionositionositionosition
EUR 83 153 (4 035)
GBP 50 48 073
CHF (37 266) (18 820)
USD (180 781) (78 916)
Other (Global Net) 11 630 11 257
The volume of currency positions is a key factor determining the level of currency risk on which the Group is exposed (except for volatility of foreign exchange rates). The level of currency positions is determined by all foreign currency transactions, which are concluded by the Group, both in the statement of financial position and off-balance sheet transactions. The Bank’s exposure to currency risk is low (with reference to own funds, VaR for a 10-day time horizon for the Bank’s currency position at the end of 2011 amounted to ca. 0.01%).
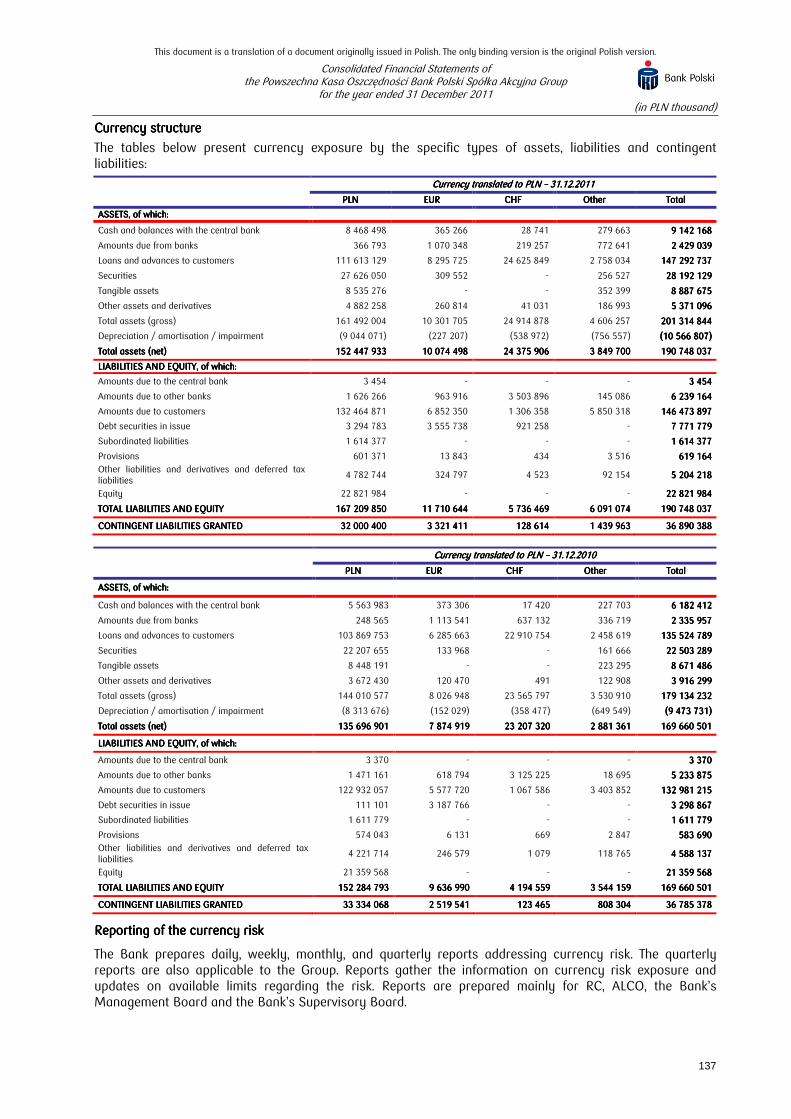
This document is a translation of a document originally issued in Polish. The only binding version is the original Polish version.
Consolidated Financial Statements of the Powszechna Kasa Oszczędności Bank Polski Spółka Akcyjna Group
for the year ended 31 December 2011 (in PLN thousand)
137
Currency structureCurrency structureCurrency structureCurrency structure
The tables below present currency exposure by the specific types of assets, liabilities and contingent liabilities:
Currency translated to PLN Currency translated to PLN Currency translated to PLN Currency translated to PLN –––– 31.12.20131.12.20131.12.20131.12.2011111
PLNPLNPLNPLN EUREUREUREUR CHFCHFCHFCHF OtherOtherOtherOther TotalTotalTotalTotal
ASSETSASSETSASSETSASSETS,,,, of whichof whichof whichof which::::
Cash and balances with the central bank 8 468 498 365 266 28 741 279 663 9 142 168 9 142 168 9 142 168 9 142 168
Amounts due from banks 366 793 1 070 348 219 257 772 641 2 429 039 2 429 039 2 429 039 2 429 039
Loans and advances to customers 111 613 129 8 295 725 24 625 849 2 758 034 147 292 737 147 292 737 147 292 737 147 292 737
Securities 27 626 050 309 552 - 256 527 28 192 129 28 192 129 28 192 129 28 192 129
Tangible assets 8 535 276 - - 352 399 8 887 675 8 887 675 8 887 675 8 887 675
Other assets and derivatives 4 882 258 260 814 41 031 186 993 5 371 096 5 371 096 5 371 096 5 371 096
Total assets (gross) 161 492 004 10 301 705 24 914 878 4 606 257 201 314 844 201 314 844 201 314 844 201 314 844
Depreciation / amortisation / impairment (9 044 071) (227 207) (538 972) (756 557) (10 566 807)(10 566 807)(10 566 807)(10 566 807)
Total assets (net)Total assets (net)Total assets (net)Total assets (net) 152 447 152 447 152 447 152 447 939393933333 10 074 498 10 074 498 10 074 498 10 074 498 24 375 906 24 375 906 24 375 906 24 375 906 3333 849 700849 700849 700849 700 190 748 037 190 748 037 190 748 037 190 748 037
LIABILITIESLIABILITIESLIABILITIESLIABILITIES AND EQUITYAND EQUITYAND EQUITYAND EQUITY,,,, of whichof whichof whichof which::::
Amounts due to the central bank 3 454 - - - 3 454 3 454 3 454 3 454
Amounts due to other banks 1 626 266 963 916 3 503 896 145 086 6 239 164 6 239 164 6 239 164 6 239 164
Amounts due to customers 132 464 871 6 852 350 1 306 358 5 850 318 146 473 897 146 473 897 146 473 897 146 473 897
Debt securities in issue 3 294 783 3 555 738 921 258 - 7 771 779 7 771 779 7 771 779 7 771 779
Subordinated liabilities 1 614 377 - - - 1 614 377 1 614 377 1 614 377 1 614 377
Provisions 601 371 13 843 434 3 516 619 164 619 164 619 164 619 164
Other liabilities and derivatives and deferred tax liabilities
4 782 744 324 797 4 523 92 154 5 204 218 5 204 218 5 204 218 5 204 218
Equity 22 821 984 - - - 22 821 984 22 821 984 22 821 984 22 821 984
TOTAL LIABILITIES AND EQUITYTOTAL LIABILITIES AND EQUITYTOTAL LIABILITIES AND EQUITYTOTAL LIABILITIES AND EQUITY 167167167167 209 850209 850209 850209 850 11111111 710 644710 644710 644710 644 5 736 469 5 736 469 5 736 469 5 736 469 6666 091 074091 074091 074091 074 190 748 037 190 748 037 190 748 037 190 748 037
CONTINGENT LIABILITIES GRANTEDCONTINGENT LIABILITIES GRANTEDCONTINGENT LIABILITIES GRANTEDCONTINGENT LIABILITIES GRANTED 32 000 400 32 000 400 32 000 400 32 000 400 3 321 411 3 321 411 3 321 411 3 321 411 128 614 128 614 128 614 128 614 1 439 963 1 439 963 1 439 963 1 439 963 36 890 388 36 890 388 36 890 388 36 890 388
Currency translated to PLN Currency translated to PLN Currency translated to PLN Currency translated to PLN –––– 31.12.2031.12.2031.12.2031.12.2010101010
PLNPLNPLNPLN EUREUREUREUR CHFCHFCHFCHF OtherOtherOtherOther TotalTotalTotalTotal
ASSETSASSETSASSETSASSETS,,,, of which:of which:of which:of which:
Cash and balances with the central bank 5 563 983 373 306 17 420 227 703 6 182 412 6 182 412 6 182 412 6 182 412
Amounts due from banks 248 565 1 113 541 637 132 336 719 2 335 957 2 335 957 2 335 957 2 335 957
Loans and advances to customers 103 869 753 6 285 663 22 910 754 2 458 619 135 524 789 135 524 789 135 524 789 135 524 789
Securities 22 207 655 133 968 - 161 666 22 503 289 22 503 289 22 503 289 22 503 289
Tangible assets 8 448 191 - - 223 295 8 671 486 8 671 486 8 671 486 8 671 486
Other assets and derivatives 3 672 430 120 470 491 122 908 3 916 299 3 916 299 3 916 299 3 916 299
Total assets (gross) 144 010 577 8 026 948 23 565 797 3 530 910 179 134 232 179 134 232 179 134 232 179 134 232
Depreciation / amortisation / impairment (8 313 676) (152 029) (358 477) (649 549) (9 473 731)(9 473 731)(9 473 731)(9 473 731)
Total assets (net)Total assets (net)Total assets (net)Total assets (net) 135 696 901 135 696 901 135 696 901 135 696 901 7 874 919 7 874 919 7 874 919 7 874 919 23 207 320 23 207 320 23 207 320 23 207 320 2 881 361 2 881 361 2 881 361 2 881 361 169 660 501 169 660 501 169 660 501 169 660 501
LIABILITIESLIABILITIESLIABILITIESLIABILITIES AND EQUITYAND EQUITYAND EQUITYAND EQUITY, , , , of which:of which:of which:of which:
Amounts due to the central bank 3 370 - - - 3 370 3 370 3 370 3 370
Amounts due to other banks 1 471 161 618 794 3 125 225 18 695 5 233 875 5 233 875 5 233 875 5 233 875
Amounts due to customers 122 932 057 5 577 720 1 067 586 3 403 852 132 981 215 132 981 215 132 981 215 132 981 215
Debt securities in issue 111 101 3 187 766 - - 3 298 867 3 298 867 3 298 867 3 298 867
Subordinated liabilities 1 611 779 - - - 1 611 779 1 611 779 1 611 779 1 611 779
Provisions 574 043 6 131 669 2 847 583 690 583 690 583 690 583 690
Other liabilities and derivatives and deferred tax liabilities
4 221 714 246 579 1 079 118 765 4 588 137 4 588 137 4 588 137 4 588 137
Equity 21 359 568 - - - 21 359 568 21 359 568 21 359 568 21 359 568
TOTAL LIABILITIES AND EQUITYTOTAL LIABILITIES AND EQUITYTOTAL LIABILITIES AND EQUITYTOTAL LIABILITIES AND EQUITY 152 284 793 152 284 793 152 284 793 152 284 793 9 636 990 9 636 990 9 636 990 9 636 990 4 194 559 4 194 559 4 194 559 4 194 559 3 544 159 3 544 159 3 544 159 3 544 159 169 660 501 169 660 501 169 660 501 169 660 501
CONTINGENT LIABILITIES GRANTEDCONTINGENT LIABILITIES GRANTEDCONTINGENT LIABILITIES GRANTEDCONTINGENT LIABILITIES GRANTED 33 334 068 33 334 068 33 334 068 33 334 068 2 519 541 2 519 541 2 519 541 2 519 541 123 465 123 465 123 465 123 465 808 304 808 304 808 304 808 304 36 785 378 36 785 378 36 785 378 36 785 378
Reporting of the currency riskReporting of the currency riskReporting of the currency riskReporting of the currency risk
The Bank prepares daily, weekly, monthly, and quarterly reports addressing currency risk. The quarterly reports are also applicable to the Group. Reports gather the information on currency risk exposure and updates on available limits regarding the risk. Reports are prepared mainly for RC, ALCO, the Bank’s Management Board and the Bank’s Supervisory Board.

This document is a translation of a document originally issued in Polish. The only binding version is the original Polish version.
Consolidated Financial Statements of the Powszechna Kasa Oszczędności Bank Polski Spółka Akcyjna Group
for the year ended 31 December 2011 (in PLN thousand)
138
Management decisions concerning currency riManagement decisions concerning currency riManagement decisions concerning currency riManagement decisions concerning currency risksksksk
Main tools used in currency risk management in the Group include:
− procedures for currency risk management, − limits and thresholds for currency risk, − defining allowable types of transactions in foreign currencies and the exchange rates used in
such transactions.
The Group has set limits and threshold values for currency risk, i.a.: currency positions, Value at Risk calculated for a 10-day time horizon and daily loss from transactions on currency market.
58.58.58.58. Liquidity risk managementLiquidity risk managementLiquidity risk managementLiquidity risk management
The liquidity risk is defined as the lack of possibility to pay the debts on time due to the lack of liquid assets. Lack of liquidity may arise from inappropriate structure of statement of financial position, misfit of cash flows, not received payments from contractors, sudden withdrawal of cash by clients or other market events.
The objective of liquidity risk management is to pay present and future debts (also potential) on time, taking into account the nature of performed activities and requirements which may occur due to changes in market environment, by shaping the structure of statement of financial position and contingent liabilities and commitments.
The Group’s policy concerning liquidity is based on keeping a portfolio of liquid securities and increasing stable sources of financing (stable deposits, in particular). In its liquidity risk management policy, also uses money market instruments, including NBP open market operations.
Measurement of the liquidity risk Measurement of the liquidity risk Measurement of the liquidity risk Measurement of the liquidity risk
The Group makes use of the following liquidity risk measures:
− the contractual liquidity gap method and the liquidity gap in real terms,
− liquidity reserve,
− measure of stability of deposit and loan portfolios,
− stress tests (liquidity stress tests).
Forecasting and monitoring of liquidity risForecasting and monitoring of liquidity risForecasting and monitoring of liquidity risForecasting and monitoring of liquidity riskkkk
Liquidity gaps presented below include the sum of Bank’s adjusted liquidity gap (adjusted in terms of the following: permanent balances on deposits of non-financial sector and their maturity, permanent balances on loans in current accounts for non-financial entities and their maturity and liquid securities and their maturity) and contractual liquidity gap of other Group’s entities.
a’vistaa’vistaa’vistaa’vista 0 0 0 0 ---- 1 1 1 1
monthmonthmonthmonth 1 1 1 1 ---- 3 3 3 3
monthsmonthsmonthsmonths 3 3 3 3 ---- 6 6 6 6
monthsmonthsmonthsmonths 6 6 6 6 ---- 12 12 12 12
monthsmonthsmonthsmonths 12 12 12 12 ---- 36363636 monthsmonthsmonthsmonths
36363636 ---- 60 60 60 60 monthsmonthsmonthsmonths
over 60 over 60 over 60 over 60 monthsmonthsmonthsmonths
31.12.201131.12.201131.12.201131.12.2011
The Group - adjusted gap in real terms
7 299 484 12 094 029 (1 599 805) 1 399 996 (1 169 611) 10 276 571 16 150 066 (44 450 730)(44 450 730)(44 450 730)(44 450 730)
The Group - cumulative adjusted gap in real terms
7 299 484 19 393 513 17 793 708 19 193 704 18 024 093 28 300 664 44 450 730 ----
31.12.201031.12.201031.12.201031.12.2010
The Group - adjusted gap in real terms
3 207 473 14 102 549 (949 842) (106 638) 3 800 570 5 160 414 (1 014 208) (24 200 318)
The Group - cumulative adjusted gap in real terms
3 207 473 17 310 022 16 360 180 16 253 542 20 054 112 25 214 526 24 200 318 ----
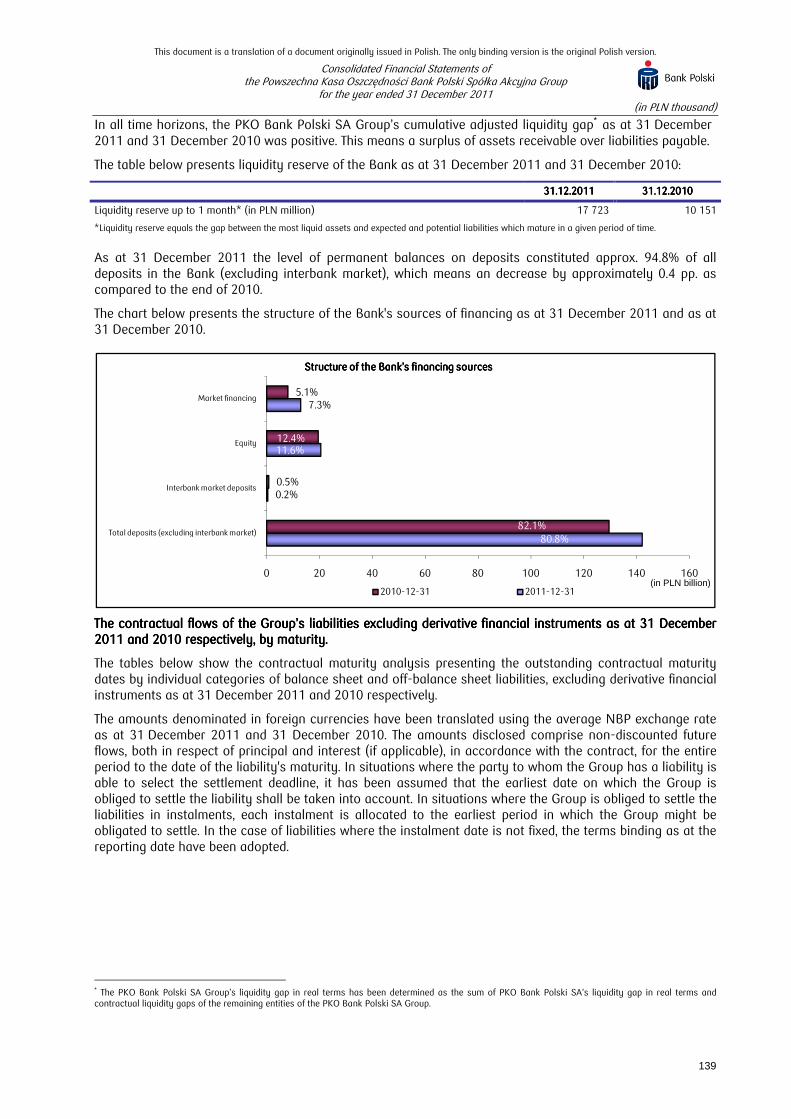
This document is a translation of a document originally issued in Polish. The only binding version is the original Polish version.
Consolidated Financial Statements of the Powszechna Kasa Oszczędności Bank Polski Spółka Akcyjna Group
for the year ended 31 December 2011 (in PLN thousand)
139
In all time horizons, the PKO Bank Polski SA Group’s cumulative adjusted liquidity gap∗ as at 31 December 2011 and 31 December 2010 was positive. This means a surplus of assets receivable over liabilities payable.
The table below presents liquidity reserve of the Bank as at 31 December 2011 and 31 December 2010:
31.12.201131.12.201131.12.201131.12.2011 31.12.201031.12.201031.12.201031.12.2010
Liquidity reserve up to 1 month* (in PLN million) 17 723 10 151
*Liquidity reserve equals the gap between the most liquid assets and expected and potential liabilities which mature in a given period of time.
As at 31 December 2011 the level of permanent balances on deposits constituted approx. 94.8% of all deposits in the Bank (excluding interbank market), which means an decrease by approximately 0.4 pp. as compared to the end of 2010.
The chart below presents the structure of the Bank's sources of financing as at 31 December 2011 and as at 31 December 2010.
TTTThe contractual fhe contractual fhe contractual fhe contractual flows of the Grouplows of the Grouplows of the Grouplows of the Group’s liabilities excluding derivative financial instruments as at 31 December ’s liabilities excluding derivative financial instruments as at 31 December ’s liabilities excluding derivative financial instruments as at 31 December ’s liabilities excluding derivative financial instruments as at 31 December 2011 and 2010 respectively, by maturity2011 and 2010 respectively, by maturity2011 and 2010 respectively, by maturity2011 and 2010 respectively, by maturity....
The tables below show the contractual maturity analysis presenting the outstanding contractual maturity dates by individual categories of balance sheet and off-balance sheet liabilities, excluding derivative financial instruments as at 31 December 2011 and 2010 respectively.
The amounts denominated in foreign currencies have been translated using the average NBP exchange rate as at 31 December 2011 and 31 December 2010. The amounts disclosed comprise non-discounted future flows, both in respect of principal and interest (if applicable), in accordance with the contract, for the entire period to the date of the liability's maturity. In situations where the party to whom the Group has a liability is able to select the settlement deadline, it has been assumed that the earliest date on which the Group is obliged to settle the liability shall be taken into account. In situations where the Group is obliged to settle the liabilities in instalments, each instalment is allocated to the earliest period in which the Group might be obligated to settle. In the case of liabilities where the instalment date is not fixed, the terms binding as at the reporting date have been adopted.
∗ The PKO Bank Polski SA Group’s liquidity gap in real terms has been determined as the sum of PKO Bank Polski SA’s liquidity gap in real terms and contractual liquidity gaps of the remaining entities of the PKO Bank Polski SA Group.
80.8%
0.2%
11.6%
7.3%
82.1%
0.5%
12.4%
5.1%
0 20 40 60 80 100 120 140 160
Total deposits (excluding interbank market)
Interbank market deposits
Equity
Market financing
(in PLN billion)
Structure of the Bank’s financing sourcesStructure of the Bank’s financing sourcesStructure of the Bank’s financing sourcesStructure of the Bank’s financing sources
2010-12-31 2011-12-31

This document is a translation of a document originally issued in Polish. The only binding version is the original Polish version.
Consolidated Financial Statements of the Powszechna Kasa Oszczędności Bank Polski Spółka Akcyjna
for the year ended 31 December 2011 (in PLN thousand)
140
Contractual flows of the Contractual flows of the Contractual flows of the Contractual flows of the GroupGroupGroupGroup’s liabilities as at 31 December 2011 by maturity’s liabilities as at 31 December 2011 by maturity’s liabilities as at 31 December 2011 by maturity’s liabilities as at 31 December 2011 by maturity
Up to 1 monthUp to 1 monthUp to 1 monthUp to 1 month
1 1 1 1 ---- 3 months3 months3 months3 months 3 months3 months3 months3 months ---- 1 year1 year1 year1 year
1 1 1 1 ---- 5 years5 years5 years5 years Over 5 Over 5 Over 5 Over 5 yearsyearsyearsyears Contractual valueContractual valueContractual valueContractual value Carrying Carrying Carrying Carrying amountamountamountamount
Liabilities:Liabilities:Liabilities:Liabilities:
Amounts due to the central bank 3 454 - - - - 3 454 3 454 3 454 3 454 3 454
Amounts due to other banks 2 206 359 286 603 3 635 593 423 617 202 084 6 754 256 6 239 164 6 239 164 6 239 164 6 239 164
Amounts due to customers 93 164 498 15 234 611 35 242 327 3 184 423 1 798 613 148 624 472 146 473 897 146 473 897 146 473 897 146 473 897
Debt securities in issue - 3 141 070 164 040 5 145 214 - 8 450 324 7 771 779 7 771 779 7 771 779 7 771 779
Subordinated liabilities - - 96 383 369 881 1 699 775 2 166 039 1 614 377 1 614 377 1 614 377 1 614 377
Other liabilities 1 813 989 426 765 119 187 17 172 73 650 2 450 763 2 450 763 2 450 763 2 450 763 2 450 763
Off-balance sheet financial liabilities – granted 15 573 751 936 775 4 677 249 3 930 378 5 337 505 30 455 658 ----
Off-balance sheet guarantee liabilities – issued 102 848 80 264 1 776 447 3 962 200 512 971 6 434 730 ----
Contractual flows of the Contractual flows of the Contractual flows of the Contractual flows of the GroupGroupGroupGroups liabilities as at 31 December 2010 by maturitys liabilities as at 31 December 2010 by maturitys liabilities as at 31 December 2010 by maturitys liabilities as at 31 December 2010 by maturity
Up to 1 monthUp to 1 monthUp to 1 monthUp to 1 month
1 1 1 1 ---- 3 months3 months3 months3 months 3 months3 months3 months3 months ---- 1 year1 year1 year1 year
1 1 1 1 ---- 5 years5 years5 years5 years Over 5 yearsOver 5 yearsOver 5 yearsOver 5 years Contractual valueContractual valueContractual valueContractual value Carrying Carrying Carrying Carrying amountamountamountamount
Liabilities:Liabilities:Liabilities:Liabilities:
Amounts due to the central bank 3 370 - - - - 3 370 3 370 3 370 3 370 3 370
Amounts due to other banks 1 175 530 99 282 518 099 4 268 099 196 449 6 257 459 5 233 875 5 233 875 5 233 875 5 233 875
Amount due to customers 82 510 946 17 377 623 31 661 703 1 877 178 1 608 955 135 036 405 132 981 215 132 981 215 132 981 215 132 981 215
Debt securities in issue 25 000 95 000 122 469 3 658 117 - 3 900 586 3 298 867 3 298 867 3 298 867 3 298 867
Subordinated liabilities - - 80 835 323 563 1 762 592 2 166 990 1 611 779 1 611 779 1 611 779 1 611 779
Other liabilities 1 984 551 41 329 42 972 16 136 6 343 2 091 331 2 092 834 2 092 834 2 092 834 2 092 834
Off-balance sheet financial liabilities – granted 16 631 759 314 035 3 994 998 2 923 109 5 641 123 29 505 024 ----
Off-balance sheet guarantee liabilities – issued 1 649 878 974 119 1 828 614 2 550 325 277 418 7 280 354 ----

This document is a translation of a document originally issued in Polish. The only binding version is the original Polish version.
Consolidated Financial Statements of the Powszechna Kasa Oszczędności Bank Polski Spółka Akcyjna Group
for the year ended 31 December 2011 (in PLN thousand)
141
The contractual flows related to derivative financial instruments as at 31The contractual flows related to derivative financial instruments as at 31The contractual flows related to derivative financial instruments as at 31The contractual flows related to derivative financial instruments as at 31 December 2011 and 2010 December 2011 and 2010 December 2011 and 2010 December 2011 and 2010 respectively, by respectively, by respectively, by respectively, by maturity datesmaturity datesmaturity datesmaturity dates
Derivative financial instruments settled in net amountsDerivative financial instruments settled in net amountsDerivative financial instruments settled in net amountsDerivative financial instruments settled in net amounts
Derivative financial instruments settled by the Group on a net basis include:
• interest rate swaps (IRS), • Forward Rate Agreements (FRA), • Non Deliverable Forwards (NDF), • options.
The tables below show the contractual maturity analysis presenting the outstanding contractual maturity dates by individual categories of derivative financial instruments in respect of which the balance sheet date valuation was negative (a liability) as at 31 December 2011 and as at 31 December 2010 respectively.
The amounts denominated in foreign currencies have been translated using the average NBP exchange rate as at 31 December 2011 and as at 31 December 2010. In the case of IRS transactions, non-discounted future net cash flows in respect of interest have been presented and in the case of the remaining derivative instruments settled on a net basis, the amount of the valuation as at 31 December 2011 and as at 31 December 2010 respectively was adopted as the value of cash flows.
Moreover, in the table the cash flows from IRS transactions which constitute cash flow hedges in respect of loans with variable interest rates are shown separately.
31 December 201131 December 201131 December 201131 December 2011 Up tUp tUp tUp to 1 o 1 o 1 o 1 monthmonthmonthmonth
1 1 1 1 ---- 3 3 3 3 monthsmonthsmonthsmonths
3 months 3 months 3 months 3 months ---- 1 year1 year1 year1 year
1 1 1 1 ---- 5 years5 years5 years5 years Over 5 Over 5 Over 5 Over 5 yearsyearsyearsyears
Contractual Contractual Contractual Contractual valuevaluevaluevalue
Derivative financial instruments Derivative financial instruments Derivative financial instruments Derivative financial instruments ---- liabilities:liabilities:liabilities:liabilities: - Interest Rate Swap (IRS) transactions, of which: (86 181) (446 346) (102 476) (519 508) (65 127) (1 219 638)
- derivative hedging instruments (720) (43 123) (125 667) (2 643) - (172 153)
- other derivative hedging instruments: options, FRA, NDF
(13 321) (31 074) (63 496) (67 089) (3 424) (178 404)
31 December 201031 December 201031 December 201031 December 2010 Up to 1 Up to 1 Up to 1 Up to 1 monthmonthmonthmonth
1 1 1 1 ---- 3 3 3 3 monthsmonthsmonthsmonths
3 months 3 months 3 months 3 months ---- 1 year1 year1 year1 year
1 1 1 1 ---- 5 years5 years5 years5 years Over 5 Over 5 Over 5 Over 5 yearsyearsyearsyears
Contractual Contractual Contractual Contractual valuevaluevaluevalue
Derivative financial instruments Derivative financial instruments Derivative financial instruments Derivative financial instruments ---- liabilities:liabilities:liabilities:liabilities: - Interest Rate Swap (IRS) transactions, of which: (105 205) (163 410) 2 734 (324 556) (37 553) (627 990)
- derivative hedging instruments (26 310) (33 432) 155 030 3 071 - 98 359
- other derivative hedging instruments: options, FRA, NDF
(7 054) (16 545) (35 648) (8 188) - (67 435)
Derivative financial instruments settled in gross amountsDerivative financial instruments settled in gross amountsDerivative financial instruments settled in gross amountsDerivative financial instruments settled in gross amounts
Derivative financial instruments settled by the Group on a gross basis include:
• foreign currency swaps, • foreign currency forwards, • Cross Currency IRS (CIRS).
The tables below show the contractual maturity analysis, presenting the outstanding contractual maturity dates by individual categories of derivative financial instruments (inflows and outflows) in respect of which the balance sheet date valuation was negative (a liability) as at 31 December 2011 and 2010 respectively.
The amounts denominated in foreign currencies have been translated using the average NBP rate as at 31 December 2011 and as at 31 December 2010. The amounts disclosed comprise non-discounted future cash flows, both in respect of principal and interest (if applicable).

This document is a translation of a document originally issued in Polish. The only binding version is the original Polish version.
Consolidated Financial Statements of the Powszechna Kasa Oszczędności Bank Polski Spółka Akcyjna Group
for the year ended 31 December 2011 (in PLN thousand)
142
In the table below cash flows from CIRS transactions which constitute cash flow hedges in respect of mortgage loans denominated in CHF and deposits negotiated in PLN are shown separately.
31 December 201131 December 201131 December 201131 December 2011 Up to 1 Up to 1 Up to 1 Up to 1 monthmonthmonthmonth
1 1 1 1 ---- 3 months3 months3 months3 months 3 months 3 months 3 months 3 months ---- 1 year1 year1 year1 year
1 1 1 1 ---- 5 years5 years5 years5 years Over 5 yearsOver 5 yearsOver 5 yearsOver 5 years Contractual Contractual Contractual Contractual
valuevaluevaluevalue
Derivative financial instruments:Derivative financial instruments:Derivative financial instruments:Derivative financial instruments: - outflows, of which: (4 648 404) (1 171 801) (2 714 512) (8 556 597) (293 894) (17 385 208)
- derivative hedging instruments (107) (79) (1 283 493) (5 831 422) (181 665) (7 296 766)
- inflows, of which: 4 757 021 1 259 677 2 905 469 8 381 329 308 220 17 611 716
- derivative hedging instruments 13 780 8 815 1 297 074 5 424 579 178 425 6 922 673
31 December 201031 December 201031 December 201031 December 2010 Up to 1 Up to 1 Up to 1 Up to 1 monthmonthmonthmonth
1 1 1 1 ---- 3 months3 months3 months3 months 3 months 3 months 3 months 3 months ---- 1 year1 year1 year1 year
1 1 1 1 ---- 5 years5 years5 years5 years Over 5 yearsOver 5 yearsOver 5 yearsOver 5 years Contractual Contractual Contractual Contractual
valuevaluevaluevalue
Derivative financial instruments:Derivative financial instruments:Derivative financial instruments:Derivative financial instruments: - outflows, of which: (4 769 951) (1 117 732) (2 671 901) (11 263 845) (1 003 961) (20 827 390)
- derivative hedging instruments (2 774) (160 404) (1 329 956) (9 662 916) (986 358) (12 142 408)
- inflows, of which: 4 785 673 1 209 276 2 928 744 11 794 926 972 125 21 690 744
- derivative hedging instruments 56 848 193 084 1 515 203 9 789 602 943 602 12 498 339
Current and nonCurrent and nonCurrent and nonCurrent and non----current assets and liabilities current assets and liabilities current assets and liabilities current assets and liabilities as at 31 December 2011as at 31 December 2011as at 31 December 2011as at 31 December 2011
ShortShortShortShort----termtermtermterm LongLongLongLong----termtermtermterm Impairment allowancesImpairment allowancesImpairment allowancesImpairment allowances Total carrying Total carrying Total carrying Total carrying
amountamountamountamount
AssetsAssetsAssetsAssets
Cash and balances with the central bank 9 142 168 - - 9 142 168 9 142 168 9 142 168 9 142 168
Amounts due from banks 2 425 344 3 695 (32 812) 2 396 227 2 396 227 2 396 227 2 396 227
Financial assets held for trading 638 321 672 768 - 1 311 089 1 311 089 1 311 089 1 311 089
Derivative financial instruments 1 304 726 1 760 007 - 3 064 733 3 064 733 3 064 733 3 064 733
Financial assets designated upon initial recognition at fair value through profit and loss
11 666 896 800 305 - 12 467 201 12 467 201 12 467 201 12 467 201
Loans and advances to customers 37 349 343 109 943 394 (5 658 243) 141 634 494 141 634 494 141 634 494 141 634 494
Investment securities available for sale 2 116 703 12 297 136 (20 563) 14 393 276 14 393 276 14 393 276 14 393 276
Inventories 493 481 106 453 (33 088) 566 846 566 846 566 846 566 846
Other assets 1 626 436 4 563 001 (417 434) 5 772 003 5 772 003 5 772 003 5 772 003
TOTAL ASSETSTOTAL ASSETSTOTAL ASSETSTOTAL ASSETS 66666666 763 418763 418763 418763 418 130 146 75130 146 75130 146 75130 146 759 9 9 9 (6 162 140)(6 162 140)(6 162 140)(6 162 140) 190 748 037 190 748 037 190 748 037 190 748 037
LiabilitiesLiabilitiesLiabilitiesLiabilities
Amounts due to the central bank 3 454 - - 3 454 3 454 3 454 3 454
Amounts due to other banks 5 513 385 725 779 - 6 239 164 6 239 164 6 239 164 6 239 164
Derivate financial instruments 883 657 1 761 624 - 2 645 281 2 645 281 2 645 281 2 645 281
Amounts due to customers 141 686 933 4 786 964 - 146 473 897 146 473 897 146 473 897 146 473 897
Debt securities in issue 3 160 479 4 611 300 - 7 771 779 7 771 779 7 771 779 7 771 779
Subordinated liabilities - 1 614 377 - 1 614 377 1 614 377 1 614 377 1 614 377
Other liabilities 3 096 173 81 928 - 3 178 101 3 178 101 3 178 101 3 178 101
TOTAL LIABILITIESTOTAL LIABILITIESTOTAL LIABILITIESTOTAL LIABILITIES 154 344 081154 344 081154 344 081154 344 081 13131313 581 581 581 581 999972727272 ---- 167 926 053167 926 053167 926 053167 926 053
EQUITYEQUITYEQUITYEQUITY ---- 22 821 984 22 821 984 22 821 984 22 821 984 ---- 22 821 98422 821 98422 821 98422 821 984
TOTAL LIABILITIES AND EQUITYTOTAL LIABILITIES AND EQUITYTOTAL LIABILITIES AND EQUITYTOTAL LIABILITIES AND EQUITY 154154154154 344344344344 081081081081 36 403 36 403 36 403 36 403 999955556666 ---- 190 748 037190 748 037190 748 037190 748 037
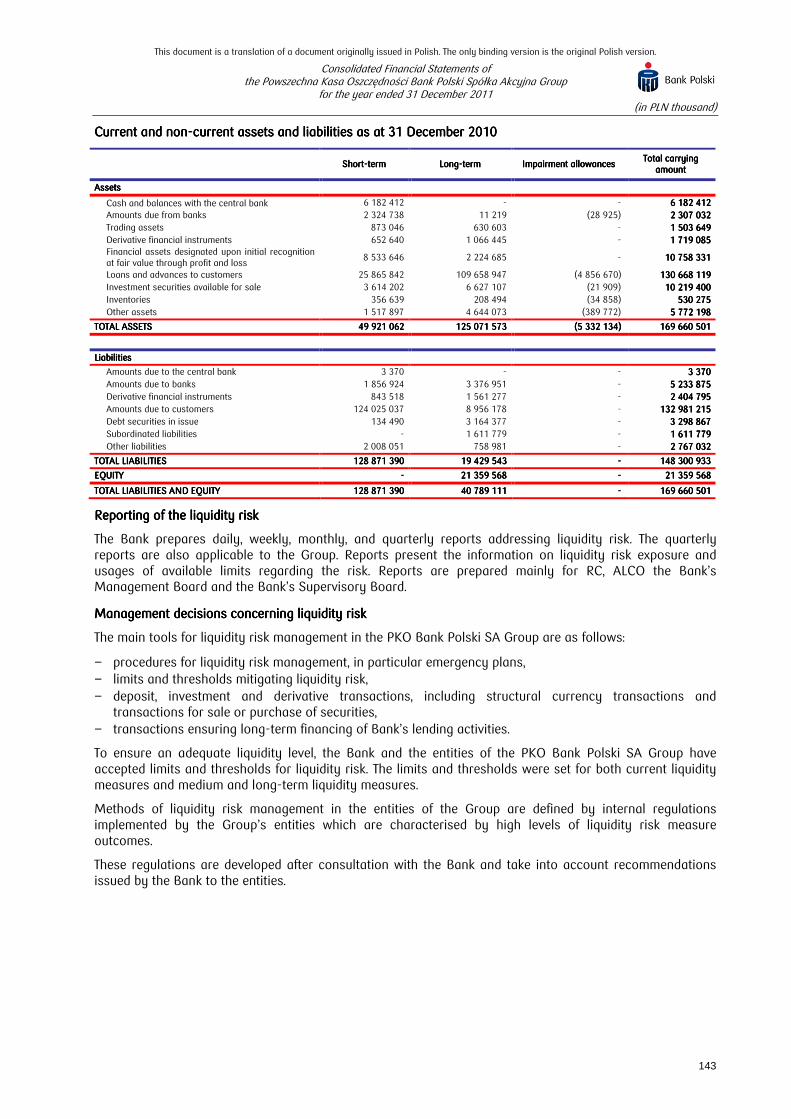
This document is a translation of a document originally issued in Polish. The only binding version is the original Polish version.
Consolidated Financial Statements of the Powszechna Kasa Oszczędności Bank Polski Spółka Akcyjna Group
for the year ended 31 December 2011 (in PLN thousand)
143
Current and nonCurrent and nonCurrent and nonCurrent and non----current asscurrent asscurrent asscurrent assets and liabilities ets and liabilities ets and liabilities ets and liabilities as at 31 December 2010as at 31 December 2010as at 31 December 2010as at 31 December 2010
ShortShortShortShort----termtermtermterm LongLongLongLong----termtermtermterm Impairment allowancesImpairment allowancesImpairment allowancesImpairment allowances Total carrying Total carrying Total carrying Total carrying
amountamountamountamount
AssetsAssetsAssetsAssets
Cash and balances with the central bank 6 182 412 - - 6 182 412 6 182 412 6 182 412 6 182 412 Amounts due from banks 2 324 738 11 219 (28 925) 2 307 032 2 307 032 2 307 032 2 307 032 Trading assets 873 046 630 603 - 1 503 649 1 503 649 1 503 649 1 503 649 Derivative financial instruments 652 640 1 066 445 - 1 719 085 1 719 085 1 719 085 1 719 085 Financial assets designated upon initial recognition at fair value through profit and loss
8 533 646 2 224 685 - 10 758 331 10 758 331 10 758 331 10 758 331
Loans and advances to customers 25 865 842 109 658 947 (4 856 670) 130 668 119 130 668 119 130 668 119 130 668 119 Investment securities available for sale 3 614 202 6 627 107 (21 909) 10 219 400 10 219 400 10 219 400 10 219 400 Inventories 356 639 208 494 (34 858) 530 275 530 275 530 275 530 275 Other assets 1 517 897 4 644 073 (389 772) 5 772 198 5 772 198 5 772 198 5 772 198
TOTAL ASSETSTOTAL ASSETSTOTAL ASSETSTOTAL ASSETS 49 921 062 49 921 062 49 921 062 49 921 062 125 071 573 125 071 573 125 071 573 125 071 573 (5 332 134)(5 332 134)(5 332 134)(5 332 134) 169 660 501 169 660 501 169 660 501 169 660 501
LiabilitiesLiabilitiesLiabilitiesLiabilities
Amounts due to the central bank 3 370 - - 3 370 3 370 3 370 3 370 Amounts due to banks 1 856 924 3 376 951 - 5 233 875 5 233 875 5 233 875 5 233 875 Derivative financial instruments 843 518 1 561 277 - 2 404 795 2 404 795 2 404 795 2 404 795 Amounts due to customers 124 025 037 8 956 178 - 132 981 215 132 981 215 132 981 215 132 981 215 Debt securities in issue 134 490 3 164 377 - 3 298 867 3 298 867 3 298 867 3 298 867 Subordinated liabilities - 1 611 779 - 1 611 779 1 611 779 1 611 779 1 611 779 Other liabilities 2 008 051 758 981 - 2 767 032 2 767 032 2 767 032 2 767 032
TOTAL LIABILITIESTOTAL LIABILITIESTOTAL LIABILITIESTOTAL LIABILITIES 128 871 390128 871 390128 871 390128 871 390 19 429 54319 429 54319 429 54319 429 543 ---- 148 300 933148 300 933148 300 933148 300 933
EQUITYEQUITYEQUITYEQUITY ---- 21 359 568 21 359 568 21 359 568 21 359 568 ---- 21 359 56821 359 56821 359 56821 359 568
TOTAL LIABILITIES AND EQUITYTOTAL LIABILITIES AND EQUITYTOTAL LIABILITIES AND EQUITYTOTAL LIABILITIES AND EQUITY 128 871 390128 871 390128 871 390128 871 390 40 789 11140 789 11140 789 11140 789 111 ---- 169 660 501169 660 501169 660 501169 660 501
Reporting of the liquidity riskReporting of the liquidity riskReporting of the liquidity riskReporting of the liquidity risk
The Bank prepares daily, weekly, monthly, and quarterly reports addressing liquidity risk. The quarterly reports are also applicable to the Group. Reports present the information on liquidity risk exposure and usages of available limits regarding the risk. Reports are prepared mainly for RC, ALCO the Bank’s Management Board and the Bank’s Supervisory Board.
Management decisions concerning liquidity risk Management decisions concerning liquidity risk Management decisions concerning liquidity risk Management decisions concerning liquidity risk
The main tools for liquidity risk management in the PKO Bank Polski SA Group are as follows:
− procedures for liquidity risk management, in particular emergency plans, − limits and thresholds mitigating liquidity risk, − deposit, investment and derivative transactions, including structural currency transactions and
transactions for sale or purchase of securities, − transactions ensuring long-term financing of Bank’s lending activities.
To ensure an adequate liquidity level, the Bank and the entities of the PKO Bank Polski SA Group have accepted limits and thresholds for liquidity risk. The limits and thresholds were set for both current liquidity measures and medium and long-term liquidity measures.
Methods of liquidity risk management in the entities of the Group are defined by internal regulations implemented by the Group’s entities which are characterised by high levels of liquidity risk measure outcomes.
These regulations are developed after consultation with the Bank and take into account recommendations issued by the Bank to the entities.

This document is a translation of a document originally issued in Polish. The only binding version is the original Polish version.
Consolidated Financial Statements of the Powszechna Kasa Oszczędności Bank Polski Spółka Akcyjna Group
for the year ended 31 December 2011 (in PLN thousand)
144
59.59.59.59. Management of pManagement of pManagement of pManagement of price risk of equity securitiesrice risk of equity securitiesrice risk of equity securitiesrice risk of equity securities
The price risk of equity securities is the risk of incurring a loss due to changes in the prices of equity securities on the public market or stock exchange indices, generated by maintaining open positions in instruments sensitive to changes in these market parameters.
The price risk of equity securities results from operations conducted as part of trading activities (DM PKO BP SA), investing activities and from other operations as part of banking activities generating a position in equity securities.
Managing the equity securities risk is aimed at limiting possible losses due to changes in the prices of equity securities on the public market or stock exchange indices to a level acceptable to the Bank, by optimising the positions taken in instruments sensitive to changes in these market parameters.
The risk is managed by imposing limits on the activities of Dom Maklerski PKO BP broken down into the banking portfolio and the trading portfolio, and by monitoring the utilisation thereof.
The effect of the price risk of equity securities on the financial position of the Bank was assessed as immaterial. The positions taken in equity securities and index instruments are limited, and the Bank does not expect them to increase significantly.
60.60.60.60. Other price riskOther price riskOther price riskOther price risk
Taking into consideration other price risks, at the end of the year 2011, the Bank was exposed to price risk of investment fund participation units in collective investment funds.
This risk is immaterial – a capital requirement, pursuant to the Resolution No. 76/2010 of the Polish Financial Supervision Authority (with subsequent amendments) ∗, to cover the above mentioned risk was at the end of the year 2011 lower than PLN 1 million.
61.61.61.61. Management of dManagement of dManagement of dManagement of derivative instruments riskerivative instruments riskerivative instruments riskerivative instruments risk
The risk of derivative instruments is a risk of incurring losses arising from the Bank taking up a position in financial instruments, which meet all of the following conditions:
1) the value of an instrument changes with the change of the underlying instrument,
2) it does not require any initial net investment or requires only a small initial net investment compared with other types of contracts which similarly respond to changes in market terms,
3) it is to be settled at a future date.
The process of derivative instruments risk management is integrated with the process of: interest rate, currency, liquidity as well as credit risk management. However, due to the specific nature of derivatives it is subject to special control specified in the internal regulations of the Bank.
Measurement of the derivative instruments riskMeasurement of the derivative instruments riskMeasurement of the derivative instruments riskMeasurement of the derivative instruments risk
The Bank measures the derivative instrument risk using, among others, the Value at Risk (VaR) model described in the section on interest rate risk or currency risk, depending on the risk factor which affects the value of the instrument.
In the measurement of other Group members’ derivative-related risk, information on the companies’ positions in specific instruments is used, as indicated by the Bank.
Forecasting and monitoring Forecasting and monitoring Forecasting and monitoring Forecasting and monitoring of the derivative of the derivative of the derivative of the derivative instruments riskinstruments riskinstruments riskinstruments risk
Monitoring the risk of derivative instruments takes place as part of monitoring of other types of financial and credit risk. The Bank pays special attention to monitor financial risk related to the maintenance of currency options portfolio and customer credit risk resulting from amounts due to the Bank in respect of derivative instruments.
* Amendments to the Resolution No. 76/2010 were introduced by the following PFSA resolutions: Resolution No. 369/2010 dated 12 October 2010, PFSA Resolution
No. 153/2011 dated 7 June 2011, PFSA Resolution No. 206/2011 dated 22 August 2011 and PFSA Resolution No. 324/2011 dated 20 December 2011.

This document is a translation of a document originally issued in Polish. The only binding version is the original Polish version.
Consolidated Financial Statements of the Powszechna Kasa Oszczędności Bank Polski Spółka Akcyjna Group
for the year ended 31 December 2011 (in PLN thousand)
145
Reporting of the derivative instruments riskReporting of the derivative instruments riskReporting of the derivative instruments riskReporting of the derivative instruments risk
The Bank prepares daily, weekly, monthly, and quarterly reports addressing the risk of the derivative instruments. The quarterly reports are also applicable to the Group. Reports present the information on the derivative risk exposure and updates on available limits regarding the risk. Reports are prepared mainly for RC, ALCO the Bank’s Management Board and the Bank’s Supervisory Board.
Management decisions concerning risk of derivative instruments Management decisions concerning risk of derivative instruments Management decisions concerning risk of derivative instruments Management decisions concerning risk of derivative instruments
The main tools used in derivative risk management are as follows:
− written procedures for derivative risk management,
− limits and thresholds set for the risk related to derivative instruments,
− master agreements specifying, among others, settlement mechanisms.
Risk management is carried out by imposing limits on the derivative instruments included in the Bank's trading and banking portfolios, monitoring limits and reporting risk level.
Master agreements concluded by the Bank with the major business partners based on the standards developed by the Polish Bank Association (domestic banks) and ISDA (foreign banks and credit institutions), which allow offsetting mutual liabilities, both due (mitigation of settlement risk) and not yet due (mitigation of pre-settlement risk), are particularly important for mitigating the risk associated with derivative instruments. Additional collateral for exposures, resulting from derivative instruments are collateral deposits escrowed by counterparties as a part of CSA agreement (Credit Support Annex).
Methods of derivative risk management in the Group entities are defined by internal regulations implemented by these entities which take up a position in financial instruments or plan to take positions in such instruments. These regulations are developed after consultation with the Bank and take into account the recommendations issued by the Bank for the Group entities.
Positions taken by the other Group entities in particular derivative instruments are determined using similar methods to those used for positions taken by the Bank in such instruments, taking into account the specific nature of the business conducted by the Group entities.
62.62.62.62. Operational risk managementOperational risk managementOperational risk managementOperational risk management
Operational risk is defined as the risk of occurrence of a loss due to non-compliance or unreliability of internal processes, people and systems or external events.
The objective of operational risk management is to optimise operational efficiency by reducing operating losses, costs streamlining and improving the timing and adequacy of the response of the Group to events which are beyond its control.
Measurement of the operational risk Measurement of the operational risk Measurement of the operational risk Measurement of the operational risk
Measurement of operational risk at the Bank aims at defining the scale of threats related to the existence of operational risk with the use of defined risk measures. The measurement of operational risk comprises:
− KRI calculation,
− calculation of VaR for operating risk,
− scenario-based analyses (stress-tests).

This document is a translation of a document originally issued in Polish. The only binding version is the original Polish version.
Consolidated Financial Statements of the Powszechna Kasa Oszczędności Bank Polski Spółka Akcyjna Group
for the year ended 31 December 2011 (in PLN thousand)
146
Identification and assessment of operational risk comprises operational risk appearing in the existing products, processes and IT applications of the Bank, the above is conducted with the use of:
− accumulation of data on operational events,
− results of internal audit,
− results of functional internal control,
− Key Risk Indicators (KRI).
Forecasting and monitoring of operational riskForecasting and monitoring of operational riskForecasting and monitoring of operational riskForecasting and monitoring of operational risk
The Bank regularly monitors:
− utilisation level of strategic tolerance limits on operational risk,
− utilisation level of operational risk losses,
− effectiveness and timeliness of actions taken to reduce or transfer the operational risk,
− setting threshold values of Key Risk Indicators (KRI),
− operating events and their effects,
− effects of actions taken following external control recommendations or internal audits,
− quality of the internal functional controls.
In 2011, the dominant impact on the operational risk profile of the Group was exercised by the following three entities: PKO Bank Polski SA, the BFL SA Group and KREDOBANK SA. The other Group entities, considering their significantly smaller scale and type of activity, generate only reduced operational risk. Group entities manage operational risk according to principles of risk management in PKO Bank Polski SA, considering their specific nature and scale of activity.
Reporting of operational riskReporting of operational riskReporting of operational riskReporting of operational risk
The Bank prepares reports concerning operational risk of the Bank and the entities of the Group on a quarterly basis. The reports are addressed to the Operational Risk Committee, the Bank’s Management Board and the Bank’s Supervisory Board. The reports contain among others:
− information on the operational risk profile of the Bank resulting from the process of identifying and assessing the threats for products, processes and IT software of the Bank,
− information on the results of measuring and monitoring operational risk,
− information on operating events and their financial effects,
− the most important projects and initiatives as regards operational risk management.
− recommendation or proposal of actions for the Operational Risk Committee or the Bank’s Management Board,
− information about utilisation level of strategic tolerance limit and losses limits on operational risk.
Each month, information on operational risk is prepared and forwarded to members of the Bank’s Management Board and organisational units of the Bank responsible for system-based operating risk management. The scope of information is diversified and tailored to the scope of responsibilities of individual recipients of the information.
Management decisions concerning operational riskManagement decisions concerning operational riskManagement decisions concerning operational riskManagement decisions concerning operational risk
Operational risk management is performed through systemic solutions as well as regular ongoing management of the risk. Systemic operational risk management is centralised at the PKO Bank Polski SA Head Office level. The ongoing operational risk management is conducted by every organisational unit of the Bank.

This document is a translation of a document originally issued in Polish. The only binding version is the original Polish version.
Consolidated Financial Statements of the Powszechna Kasa Oszczędności Bank Polski Spółka Akcyjna Group
for the year ended 31 December 2011 (in PLN thousand)
147
In order to manage the operational risk, the Bank gathers internal and external data about operating events and their causes, data on the operating environment, and data related to the quality of internal functional controls.
In order to mitigate exposure to operational risk, following tools are used by the Bank:
1) control instruments, 2) human resources management instruments (proper staff selection, enhancement of professional
qualification of employees, motivation packages), 3) setting threshold values of Key Risk Indicators (KRI), 4) tolerance and operational risk limits, 5) contingency plans, 6) insurance, 7) outsourcing.
The instruments used for mitigating operating risk are selected among other things depending on:
1) availability and adequacy of risk-mitigating instruments, 2) the nature of operations or of the process in which the operating risk was identified, 3) materiality of the risk, 4) the cost of using the instrument.
Additionally, the Bank’s internal regulations stipulate the duty to refrain from excessively risky operations, and if such operations are being conducted – to withdraw from them or to limit their scope. The level of operating risk is deemed to be excessive when the potential benefits from a given type of operation are lower than the potential operating losses.
If the level of operational risk is too high, the Bank takes the following actions:
− risk avoidance – withdrawing from too risky activity or resigning from undertaking it if there is no possibility of managing it,
− reducing the scale of activities characterised by too high level of risk, if it can be possibly managed and it is possible to take actions reducing risk,
− risk transfer – insurance against the risk of occurring operational events ensuring the maintenance of operational risk on such a level that the Bank’s activities are not threatened.
The Group entities manage the operational risk in accordance with the rules implemented by the PKO Bank Polski SA, taking into account the specific nature of the business conducted by the Group entities.
63.63.63.63. Compliance risk mCompliance risk mCompliance risk mCompliance risk managementanagementanagementanagement
Compliance risk is defined as the risk of legal sanctions, incurring financial losses or losing reputation or reliability due to failure of the Group, its employees or entities acting on its behalf to comply with the provisions of the law, internal regulations, standards adopted by the Group, including ethical standards.
The objective of compliance risk management is to ensure the Group’s compliance with law and adopted standards and the Bank’s acting as a entity that is reliable, fair and honest, through mitigating compliance risk, reputation risk or risk of the Group’s credibility and mitigating the risk of occurring financial losses or legal sanction risk resulting from breach of regulations and ethical standards.
Appropriate organisational units or designated employees are responsible for finding systemic solutions in the area of ensuring the Group’s entities comply with the binding regulations and operating standards. Compliance Department is responsible for finding such solutions, development of the method for evaluation, monitoring and reporting compliance risk. The Compliance Department is a unit which was granted independence and which reports directly to the President of the Bank’s Management Board.
This document is a translation of a document originally issued in Polish. The only binding version is the original Polish version.
Consolidated Financial Statements of the Powszechna Kasa Oszczędności Bank Polski Spółka Akcyjna Group
for the year ended 31 December 2011 (in PLN thousand)
148
The rules concerning the process of compliance risk management adopted by all Group entities are inherent within the PKO Bank Polski SA Group.
Compliance risk management involves in particular:
– preventing involvement of the Group in illegal activities,
– ensuring data protection,
– development of ethical standards and monitoring of their application,
– conflict of interest management,
– preventing situations where the Group’s employees could be perceived as pursuing their own interest in the professional context,
– professional, fair and transparent formulation of product offers, advertising and marketing messages,
– prompt, fair and professional consideration of complaints, requests and quality claims of clients.
In order to identify and assess compliance risk, information on cases of non-compliance and their origins is being used, including information based on internal audits results, functional control and external controls.
Identification and assessment of compliance risk is mainly based on:
– estimating the most probable number of typical cases of non-compliance arising during the year,
– estimating the severity of the potential cases of non-compliance,
– assessing the existence of any additional factors of compliance risk.
While performing an assessment a character and potential losses are defined together with methods of reducing or eliminating compliance risk. Assessment is held through workshops.
Monitoring of compliance risk is conducted with the use of information submitted by the Companies and consists of:
– the analysis of non-compliance events in the Group and in banking sector, the reasons for their occurrence and their effects,
– the assessment of amendments in key legal regulations which have an impact on the Bank’s and the Group’s activity,
– the assessment of actions taken by the Group in respect of managing compliance risk.
Reporting of information concerning compliance risk includes both the Bank, and Group’s entities. Reports prepared quarterly contain information, including cases of non-compliance, passed by the Group’s entities. Reports are addressed to the Bank’s Management Board, the Bank’s Supervisory Board, and the Supervisory Board’s Audit Committee. Reports contain among others:
– the results of identifying and assessing compliance risk,
– the non-compliance events,
– the key amendments in regulatory environment.
The Group has adopted a zero tolerance policy against compliance risk, which means that the Group focuses its actions towards eliminating this risk.
64.64.64.64. Strategic risk managementStrategic risk managementStrategic risk managementStrategic risk management
The strategic risk is defined as a risk related to the possibility of negative financial consequences caused by erroneous decisions, decisions made on the basis of an inappropriate assessment or failure to make correct decisions relating to the direction of the Bank’s strategic development.
Managing the strategic risk is aimed at maintaining, on an acceptable level, the negative financial consequences resulting from bad decisions, decisions made on the basis of an incorrect assessment or failing to make appropriate decisions on the direction of the strategic development of the Bank.

This document is a translation of a document originally issued in Polish. The only binding version is the original Polish version.
Consolidated Financial Statements of the Powszechna Kasa Oszczędności Bank Polski Spółka Akcyjna Group
for the year ended 31 December 2011 (in PLN thousand)
149
In measuring the strategic risk, the Bank takes into account an impact of selected types of factors, distinguished in the activity and in the environment, which comprise in particular:
– external factors,
– factors related to the growth and development of the banking operations,
– factors related to the management of human resources,
– factors related to investment activities,
– factors related to the organisational culture.
The monitoring of the strategic risk level is performed in the Bank at least on an annual basis at minimum.
Strategic risk reporting is conducted annually in the Bank. The reports on strategic risk are prepared mainly for the Bank’s Management Board and for managing directors of the Bank’s Head Office.
The management of strategic risk in the Bank is mainly applied in the form of actions undertaken if an elevated level of strategic risk occurs.
65.65.65.65. Reputation risk managementReputation risk managementReputation risk managementReputation risk management
The reputation risk is defined as the risk related to a possibility of negative variations from the planned results of the Group due to the deterioration of the Group’s image.
The objective of managing the reputation risk is to protect the Group’s image and limit the probability of the occurrence and level of reputation-related losses.
Reputation risk ratios are calculated based on annual assessment of negative image-related events identified in a given calendar year for particular types of image-related events. Main tools used to determine the Group’s reputation risk level are:
– a catalogue of image-related events categories containing a list of image-related categories with appropriate weights assigned,
– a register of image-related events containing a list of negative image-related events that occurred grouped by image-related events categories.
Monitoring of image-related events is performed on an ongoing basis and includes:
– monitoring the external and internal communication channels of the Group with the environment in terms of identifying the negative impact of image-related events,
– gathering and analyzing information related to the occurrence or a possibility of occurrence of image related events;
– recording data on the identified negative impact of image-related events.
The reports on the level of reputation risk are prepared in the Bank on an annual basis. The reports are addressed to the organisational units of the Banking Risk Division.
Management of reputation risk in the Group mainly comprises preventive activities aimed at reducing or minimising the scale and the scope of reputation events, as well as selection of effective tools for protective measures aimed at eliminating, mitigating or minimising the unfavourable effect of unfavourable events on the Group’s image.
66.66.66.66. Capital adequacyCapital adequacyCapital adequacyCapital adequacy
Capital adequacy is the maintenance of a level of capital by the PKO Bank Polski SA Group exceeds sum of regulatory capital requirements (the so-called Pillar 1) and sum of internal capital requirements (the so-called Pillar 2).
The objective of capital adequacy management is to maintain capital on a level that is adequate to the risk scale and profile of the Group's activities.
The process of managing the Group’s capital adequacy comprises:
This document is a translation of a document originally issued in Polish. The only binding version is the original Polish version.
Consolidated Financial Statements of the Powszechna Kasa Oszczędności Bank Polski Spółka Akcyjna Group
for the year ended 31 December 2011 (in PLN thousand)
150
– identifying and monitoring of all of significant risks,
– assessing internal capital to cover the individual risk types and total internal capital,
– monitoring, reporting, forecasting and limiting of capital adequacy,
– performing internal capital allocations to business segments, client segments and entities in the Group in connection with profitability analyses,
– using tools affecting the capital adequacy level (including: tools affecting the level of equity, the scale of equity item reductions and the level of the loan portfolio).
The main measures of capital adequacy are:
– the capital adequacy ratio whose minimum level in accordance with the Banking Act is 8%,
– the ratio of equity to internal capital whose acceptable minimum level in accordance with the Banking Act is 1.0.
As at 31 December 2011 compared with 31 December 2010 (comparable data calculated in accordance with the amended regulations concerning rules of calculating capital requirements as well as own funds), the Group’s capital adequacy ratio dropped by 0.10 pp. to 12.37%, mainly due to an increase in the Group’s credit risk capital requirement, resulted mainly from the fast loan portfolio growth of the Group.
Despite the drop in the capital adequacy ratio, the Group’s capital adequacy 2011 remained at a safe level, significantly above the statutory limits.
66.1.66.1.66.1.66.1. Own funds Own funds Own funds Own funds calculated calculated calculated calculated for the for the for the for the capital adequacy purposescapital adequacy purposescapital adequacy purposescapital adequacy purposes
Own funds for the purposes of capital adequacy are calculated based on the provisions of the Banking Law and the Resolution No. 325/2011*of the Polish Financial Supervision Authority of 20 December 2011 on decreasing core funds (Official journal of the PFSA nr 13 item 49 as of 30 December 2011).
Own funds comprise basic funds, supplementary funds and short-term capital.
Basic funds are comprised of the following items:
1) principal funds comprising: share capital, reserve capital, other reserve capital,
2) general banking risk fund,
3) unappropriated profits from previous years,
4) net profit prior to approval and net profit for the current reporting period, calculated based on appropriate accounting standards, decreased by any expected charges and dividends, in amounts not exceeding amounts audited by certified public accountants, in accordance with the Banking Law, Article 127.2, Point 2)c).
Basic funds are reduced by deducting the following items:
1) intangible assets stated at carrying amount,
2) the Bank’s equity exposures to financial institutions, lending institutions, domestic banks, foreign banks and insurance companies – in the amount of 50% of the value of such exposures,
3) unrealised losses on debt, equity instruments and other receivables classified as available for sale,
4) negative currency translation differences from foreign operations,
5) negative amounts in respect of adjustments on revaluation of assets in the trading portfolio.
* the Resolution No. 325/2011 of the Polish Financial Supervision Authority of 20 December 2011 on other deductions from the primary funds - their value, scope and methods of application; other balance sheet items included in complementary funds – their value, scope and methods of allocation to the bank's additional funds; deductions from the additional funds – their value, scope and methods of application; the scope and method of considering the bank’s activities in groups while calculating own funds.
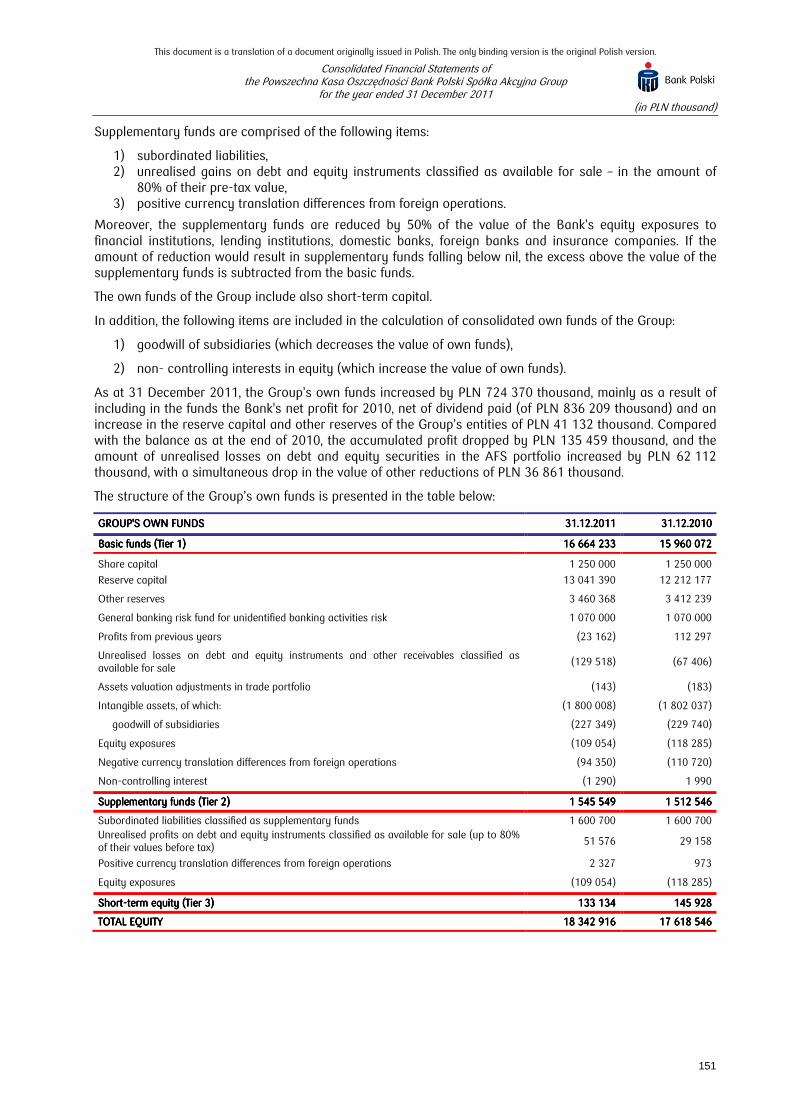
This document is a translation of a document originally issued in Polish. The only binding version is the original Polish version.
Consolidated Financial Statements of the Powszechna Kasa Oszczędności Bank Polski Spółka Akcyjna Group
for the year ended 31 December 2011 (in PLN thousand)
151
Supplementary funds are comprised of the following items:
1) subordinated liabilities, 2) unrealised gains on debt and equity instruments classified as available for sale – in the amount of
80% of their pre-tax value, 3) positive currency translation differences from foreign operations.
Moreover, the supplementary funds are reduced by 50% of the value of the Bank’s equity exposures to financial institutions, lending institutions, domestic banks, foreign banks and insurance companies. If the amount of reduction would result in supplementary funds falling below nil, the excess above the value of the supplementary funds is subtracted from the basic funds.
The own funds of the Group include also short-term capital.
In addition, the following items are included in the calculation of consolidated own funds of the Group:
1) goodwill of subsidiaries (which decreases the value of own funds),
2) non- controlling interests in equity (which increase the value of own funds).
As at 31 December 2011, the Group’s own funds increased by PLN 724 370 thousand, mainly as a result of including in the funds the Bank's net profit for 2010, net of dividend paid (of PLN 836 209 thousand) and an increase in the reserve capital and other reserves of the Group’s entities of PLN 41 132 thousand. Compared with the balance as at the end of 2010, the accumulated profit dropped by PLN 135 459 thousand, and the amount of unrealised losses on debt and equity securities in the AFS portfolio increased by PLN 62 112 thousand, with a simultaneous drop in the value of other reductions of PLN 36 861 thousand.
The structure of the Group’s own funds is presented in the table below:
GROUPGROUPGROUPGROUP'S OWN FUNDS'S OWN FUNDS'S OWN FUNDS'S OWN FUNDS 31.12.20131.12.20131.12.20131.12.2011111 31.12.2031.12.2031.12.2031.12.2010101010
Basic funds (Tier 1)Basic funds (Tier 1)Basic funds (Tier 1)Basic funds (Tier 1) 16 664 233 16 664 233 16 664 233 16 664 233 15 960 072 15 960 072 15 960 072 15 960 072
Share capital 1 250 000 1 250 000
Reserve capital 13 041 390 12 212 177
Other reserves 3 460 368 3 412 239
General banking risk fund for unidentified banking activities risk 1 070 000 1 070 000
Profits from previous years (23 162) 112 297
Unrealised losses on debt and equity instruments and other receivables classified as available for sale
(129 518) (67 406)
Assets valuation adjustments in trade portfolio (143) (183)
Intangible assets, of which: (1 800 008) (1 802 037)
goodwill of subsidiaries (227 349) (229 740)
Equity exposures (109 054) (118 285)
Negative currency translation differences from foreign operations (94 350) (110 720)
Non-controlling interest (1 290) 1 990
Supplementary funds (Tier 2)Supplementary funds (Tier 2)Supplementary funds (Tier 2)Supplementary funds (Tier 2) 1 545 549 1 545 549 1 545 549 1 545 549 1 512 546 1 512 546 1 512 546 1 512 546
Subordinated liabilities classified as supplementary funds 1 600 700 1 600 700 Unrealised profits on debt and equity instruments classified as available for sale (up to 80% of their values before tax)
51 576 29 158
Positive currency translation differences from foreign operations 2 327 973
Equity exposures (109 054) (118 285)
ShortShortShortShort----term equity term equity term equity term equity (Tier 3)(Tier 3)(Tier 3)(Tier 3) 133 134 133 134 133 134 133 134 145 928 145 928 145 928 145 928
TOTAL EQUITYTOTAL EQUITYTOTAL EQUITYTOTAL EQUITY 18 342 916 18 342 916 18 342 916 18 342 916 17 618 546 17 618 546 17 618 546 17 618 546

This document is a translation of a document originally issued in Polish. The only binding version is the original Polish version.
Consolidated Financial Statements of the Powszechna Kasa Oszczędności Bank Polski Spółka Akcyjna Group
for the year ended 31 December 2011 (in PLN thousand)
152
66.2.66.2.66.2.66.2. Capital requirements (Pillar 1)Capital requirements (Pillar 1)Capital requirements (Pillar 1)Capital requirements (Pillar 1)
The Group calculates capital requirements in accordance with the Resolution No. 76/2010 of the Polish Financial Supervision Authority dated 10 March 2010 on scope and detailed principles of setting capital requirements in connection with the individual risk types (Polish Financial Supervision Authority’s Journal of Laws No 2, item 11 dated 9 April 2011 with subsequent amendments): in respect of the Bank’s operational risk – using the standard method, in respect of operating risk - starting from 30 June 2011 using the advanced method (AMA) (for the year 2010 using the standard method (TSA)) and in respect of market risk - using the basic methods.
The scale of the Bank’s and the Group’s trading activities is significant, therefore the total capital requirements constitute sum of the capital requirements for:
1) credit risk – including credit risk of the banking book and counterparty credit risk,
2) market risk – including foreign exchange risk, commodities risk, equity securities risk, specific risk of debt instruments, general risk of interest rates,
3) operational risk,
4) other types of capital requirements in respect of:
a) settlement/delivery risk,
b) the risk of exceeding the exposure concentration limit and the large exposure limit,
c) the risk of exceeding the capital concentration threshold.
The table below shows the Group’s exposure to particular types of risk.
Capital requirementsCapital requirementsCapital requirementsCapital requirements 31.12.20131.12.20131.12.20131.12.2011111 31.12.2031.12.2031.12.2031.12.2010101010
Credit riskCredit riskCredit riskCredit risk 10 657 309 10 657 309 10 657 309 10 657 309 9 821 710 9 821 710 9 821 710 9 821 710 credit risk (banking book) 10 534 714 9 756 757
counterparty risk (trading book) 122 595 64 953
Market riskMarket riskMarket riskMarket risk 355 284 355 284 355 284 355 284 422 154 422 154 422 154 422 154
equity securities risk 1 604 767
specific risk of debt instruments 262 412 341 058
general risk of interest rates 91 268 80 329
Operational riskOperational riskOperational riskOperational risk 852 099 852 099 852 099 852 099 1 057 922 1 057 922 1 057 922 1 057 922
Total capital requirementsTotal capital requirementsTotal capital requirementsTotal capital requirements 11 864 692 11 864 692 11 864 692 11 864 692 11 301 786 11 301 786 11 301 786 11 301 786
Capital Capital Capital Capital adequacy ratioadequacy ratioadequacy ratioadequacy ratio 12.37%12.37%12.37%12.37% 12.47%12.47%12.47%12.47%
An increase in the capital requirement in 2011 in respect of credit risk resulted from a significant increase in the volume of loan portfolio (statement of financial position and off-balance-sheet exposure) by approx. 6.6%.
A decrease in the capital requirement in respect of market risk by 15.8% to the level of PLN 355 million resulted mainly from a decrease in the value of issue underwriting, whereas an increase in the value of corporate bonds (total decrease in the requirements on bonds approx. by 29%).
The Bank’s capital requirements in respect of operating risk as at 31 December 2011 has been calculated under the advanced measurement approach (AMA). On 21 June 2011, the Bank obtained approval from the PFSA for implementing this approach with a temporary limitation (until the conditions set by the PFSA have been met) on the drop in the capital requirement by no more than up to a level of 75% of the requirement calculated under the standardised approach (TSA). As a consequence, as at December 2011 the requirement in respect of operating risk for the Group compared with the value at the end of December 2010 dropped by PLN 206 million to PLN 852 million. The requirement in respect of operational risk of Group entities was calculated using the basic index approach (BIA) both in 2011 and 2010.
The Group calculates capital requirements on account of credit risk according to the following formula:
– in case of statement of financial position items – a product of a carrying amount, a risk weight of the exposure calculated according to the standardised method of credit risk requirement and 8% (considering collateral),
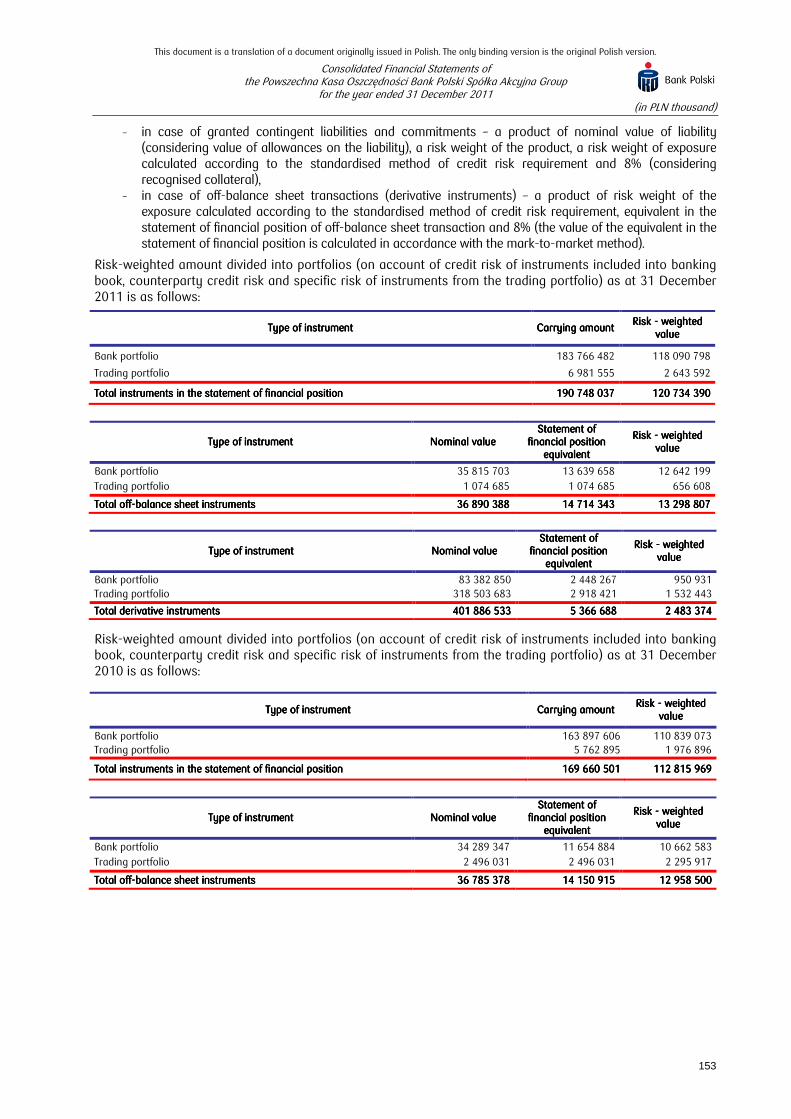
This document is a translation of a document originally issued in Polish. The only binding version is the original Polish version.
Consolidated Financial Statements of the Powszechna Kasa Oszczędności Bank Polski Spółka Akcyjna Group
for the year ended 31 December 2011 (in PLN thousand)
153
– in case of granted contingent liabilities and commitments – a product of nominal value of liability (considering value of allowances on the liability), a risk weight of the product, a risk weight of exposure calculated according to the standardised method of credit risk requirement and 8% (considering recognised collateral),
– in case of off-balance sheet transactions (derivative instruments) – a product of risk weight of the exposure calculated according to the standardised method of credit risk requirement, equivalent in the statement of financial position of off-balance sheet transaction and 8% (the value of the equivalent in the statement of financial position is calculated in accordance with the mark-to-market method).
Risk-weighted amount divided into portfolios (on account of credit risk of instruments included into banking book, counterparty credit risk and specific risk of instruments from the trading portfolio) as at 31 December 2011 is as follows:
Type of instrumentType of instrumentType of instrumentType of instrument Carrying amountCarrying amountCarrying amountCarrying amount Risk Risk Risk Risk ---- weighted weighted weighted weighted
valuevaluevaluevalue
Bank portfolio 183 766 482 118 090 798
Trading portfolio 6 981 555 2 643 592
Total instruments in the statement of financial position Total instruments in the statement of financial position Total instruments in the statement of financial position Total instruments in the statement of financial position 190 748 037 190 748 037 190 748 037 190 748 037 120 734 390 120 734 390 120 734 390 120 734 390
Type of instrument Type of instrument Type of instrument Type of instrument Nominal valueNominal valueNominal valueNominal value Statement of Statement of Statement of Statement of
financial position financial position financial position financial position equivalentequivalentequivalentequivalent
Risk Risk Risk Risk ---- weighted weighted weighted weighted valuevaluevaluevalue
Bank portfolio 35 815 703 13 639 658 12 642 199
Trading portfolio 1 074 685 1 074 685 656 608
Total offTotal offTotal offTotal off----balance sheet instrumentsbalance sheet instrumentsbalance sheet instrumentsbalance sheet instruments 36 890 388 36 890 388 36 890 388 36 890 388 14 714 343 14 714 343 14 714 343 14 714 343 13 298 807 13 298 807 13 298 807 13 298 807
Type of instrument Type of instrument Type of instrument Type of instrument Nominal valueNominal valueNominal valueNominal value Statement of Statement of Statement of Statement of
financial position financial position financial position financial position equivalentequivalentequivalentequivalent
Risk Risk Risk Risk ---- weighted weighted weighted weighted valuevaluevaluevalue
Bank portfolio 83 382 850 2 448 267 950 931 Trading portfolio 318 503 683 2 918 421 1 532 443
Total derivative instrumentsTotal derivative instrumentsTotal derivative instrumentsTotal derivative instruments 401 886 533 401 886 533 401 886 533 401 886 533 5 366 688 5 366 688 5 366 688 5 366 688 2 483 374 2 483 374 2 483 374 2 483 374
Risk-weighted amount divided into portfolios (on account of credit risk of instruments included into banking book, counterparty credit risk and specific risk of instruments from the trading portfolio) as at 31 December 2010 is as follows:
Type of instrumentType of instrumentType of instrumentType of instrument Carrying amountCarrying amountCarrying amountCarrying amount Risk Risk Risk Risk ---- weighted weighted weighted weighted
valuevaluevaluevalue
Bank portfolio 163 897 606 110 839 073 Trading portfolio 5 762 895 1 976 896
Total instruments in the statement of financial positionTotal instruments in the statement of financial positionTotal instruments in the statement of financial positionTotal instruments in the statement of financial position 169 660 501 169 660 501 169 660 501 169 660 501 112 815 969 112 815 969 112 815 969 112 815 969
Type of instrumentType of instrumentType of instrumentType of instrument Nominal valueNominal valueNominal valueNominal value Statement of Statement of Statement of Statement of
financial position financial position financial position financial position equivalentequivalentequivalentequivalent
Risk Risk Risk Risk ---- weighted weighted weighted weighted valuevaluevaluevalue
Bank portfolio 34 289 347 11 654 884 10 662 583
Trading portfolio 2 496 031 2 496 031 2 295 917
Total offTotal offTotal offTotal off----balance sheet instrumentsbalance sheet instrumentsbalance sheet instrumentsbalance sheet instruments 36 785 378 36 785 378 36 785 378 36 785 378 14 150 915 14 150 915 14 150 915 14 150 915 12 958 500 12 958 500 12 958 500 12 958 500
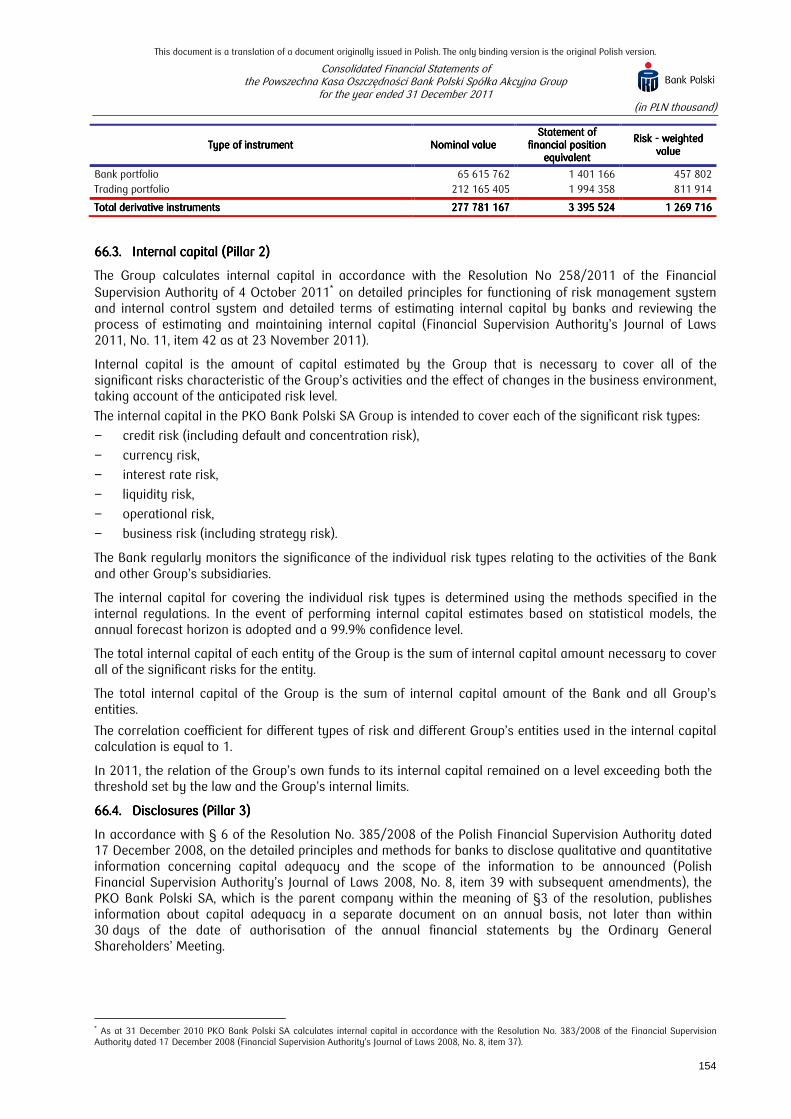
This document is a translation of a document originally issued in Polish. The only binding version is the original Polish version.
Consolidated Financial Statements of the Powszechna Kasa Oszczędności Bank Polski Spółka Akcyjna Group
for the year ended 31 December 2011 (in PLN thousand)
154
Type of instrument Type of instrument Type of instrument Type of instrument Nominal valueNominal valueNominal valueNominal value Statement of Statement of Statement of Statement of
financial position financial position financial position financial position equivalentequivalentequivalentequivalent
Risk Risk Risk Risk ---- weighted weighted weighted weighted valuevaluevaluevalue
Bank portfolio 65 615 762 1 401 166 457 802
Trading portfolio 212 165 405 1 994 358 811 914
Total derivative instruments Total derivative instruments Total derivative instruments Total derivative instruments 277 781 167 277 781 167 277 781 167 277 781 167 3 395 524 3 395 524 3 395 524 3 395 524 1 269 716 1 269 716 1 269 716 1 269 716
66.3.66.3.66.3.66.3. Internal capital (Pillar 2)Internal capital (Pillar 2)Internal capital (Pillar 2)Internal capital (Pillar 2)
The Group calculates internal capital in accordance with the Resolution No 258/2011 of the Financial Supervision Authority of 4 October 2011∗ on detailed principles for functioning of risk management system and internal control system and detailed terms of estimating internal capital by banks and reviewing the process of estimating and maintaining internal capital (Financial Supervision Authority’s Journal of Laws 2011, No. 11, item 42 as at 23 November 2011).
Internal capital is the amount of capital estimated by the Group that is necessary to cover all of the significant risks characteristic of the Group’s activities and the effect of changes in the business environment, taking account of the anticipated risk level.
The internal capital in the PKO Bank Polski SA Group is intended to cover each of the significant risk types:
− credit risk (including default and concentration risk),
− currency risk,
− interest rate risk,
− liquidity risk,
− operational risk,
− business risk (including strategy risk).
The Bank regularly monitors the significance of the individual risk types relating to the activities of the Bank and other Group’s subsidiaries.
The internal capital for covering the individual risk types is determined using the methods specified in the internal regulations. In the event of performing internal capital estimates based on statistical models, the annual forecast horizon is adopted and a 99.9% confidence level.
The total internal capital of each entity of the Group is the sum of internal capital amount necessary to cover all of the significant risks for the entity.
The total internal capital of the Group is the sum of internal capital amount of the Bank and all Group’s entities.
The correlation coefficient for different types of risk and different Group’s entities used in the internal capital calculation is equal to 1.
In 2011, the relation of the Group’s own funds to its internal capital remained on a level exceeding both the threshold set by the law and the Group’s internal limits.
66.4.66.4.66.4.66.4. Disclosures (Pillar 3)Disclosures (Pillar 3)Disclosures (Pillar 3)Disclosures (Pillar 3)
In accordance with § 6 of the Resolution No. 385/2008 of the Polish Financial Supervision Authority dated 17 December 2008, on the detailed principles and methods for banks to disclose qualitative and quantitative information concerning capital adequacy and the scope of the information to be announced (Polish Financial Supervision Authority’s Journal of Laws 2008, No. 8, item 39 with subsequent amendments), the PKO Bank Polski SA, which is the parent company within the meaning of §3 of the resolution, publishes information about capital adequacy in a separate document on an annual basis, not later than within 30 days of the date of authorisation of the annual financial statements by the Ordinary General Shareholders’ Meeting.
∗ As at 31 December 2010 PKO Bank Polski SA calculates internal capital in accordance with the Resolution No. 383/2008 of the Financial Supervision Authority dated 17 December 2008 (Financial Supervision Authority’s Journal of Laws 2008, No. 8, item 37).

This document is a translation of a document originally issued in Polish. The only binding version is the original Polish version.
Consolidated Financial Statements of the Powszechna Kasa Oszczędności Bank Polski Spółka Akcyjna Group
for the year ended 31 December 2011 (in PLN thousand)
155
Details of the scope of capital adequacy information disclosed, the method of its verification and publication are presented in the PKO Bank Polski SA Capital Adequacy Information Policies, which are available on the Bank’s website (www.pkobp.pl).
INFORMATION ON THE ENTITY AUTHORISED TO AUDIT FINANCIAL STATEMENTS AND EVENTS AFTER THE INFORMATION ON THE ENTITY AUTHORISED TO AUDIT FINANCIAL STATEMENTS AND EVENTS AFTER THE INFORMATION ON THE ENTITY AUTHORISED TO AUDIT FINANCIAL STATEMENTS AND EVENTS AFTER THE INFORMATION ON THE ENTITY AUTHORISED TO AUDIT FINANCIAL STATEMENTS AND EVENTS AFTER THE REPORTING PERIODREPORTING PERIODREPORTING PERIODREPORTING PERIOD
67.67.67.67. Information on Information on Information on Information on the entity authorised to audit financial statementsthe entity authorised to audit financial statementsthe entity authorised to audit financial statementsthe entity authorised to audit financial statements
Entity authorised to audit financial statements with which PKO Bank Polski SA concluded an agreement is PricewaterhouseCoopers Sp. z o.o. The agreement concerns auditing the financial statements of PKO Bank Polski SA as well as auditing the consolidated financial statements of the PKO Bank Polski SA Group. The above agreement was concluded on 14 April 2011.
Total net remuneration of PricewaterhouseCoopers Sp. z o.o. for the audit of the separate financial statements and consolidated financial statements of PKO Bank Polski SA in 2011 amounted to PLN 1 140 thousand (2010: PLN 1 140 thousand), total net remuneration of PricewaterhouseCoopers Sp. z o.o. for the certifying services, including the review of the financial statements amounted in 2011 to PLN 1 910 thousand (2010: PLN 560 thousand).
Total net remuneration of PricewaterhouseCoopers Sp. z o.o. related to rendering PKO Bank Polski SA other services in 2011 amounted to PLN 2 031 thousand (2010: PLN 1 066 thousand).
68.68.68.68. Events after the reporting periodEvents after the reporting periodEvents after the reporting periodEvents after the reporting period
On 9 January 2012, in the Qualia Development Sp. z o.o. Group new companies agreements were concluded: Qualia Spółka z ograniczoną odpowiedzialnością - Władysławowo Spółka Komandytowa, Qualia Spółka z ograniczoną odpowiedzialnością - Zakopane Spółka Komandytowa, Qualia Spółka z ograniczoną odpowiedzialnością - Jurata Spółka Komandytowa. These companies were established for the purpose of realisation of investment projects. Ongoing registration of above-mentioned companies with the National Court Register.
On 16 January 2012, PKO Bank Polski SA was registered with the State Ukrainian Register of Businesses as the sole shareholder of ‘Inter-Risk Ukraina’ Additional Liability Company with its seat in Kiev (the additional liability means that the shareholder is responsible for the company's liabilities up to 103% of its share). PKO Bank Polski SA acquired 1 share constituting 100% of the Company’s share capital which entitles it to 100% of votes at the shareholders’ meeting. The acquisition price was PLN 2 500 thousand. On 30 January 2012, the Bank made a capital contribution of the above-mentioned Company of UAH 43 million (PLN 17 212.9 thousand). The main purpose of acquiring and subsequently the operation of the Company is to use it to perform effective debt collection of the impaired loans portfolio of KREDOBANK SA and the impaired loans portfolio purchased by Finansowa Kompania ‘Prywatne Inwestycje’ Sp. z o.o.
On 27 January 2012, Qualia Development Sp. z o.o. made an additional payment to the company Qualia Residence Sp. z o.o. amounted to PLN 13 000 thousand.
On 31 January 2012 was signed a sales agreement of a Holiday and Recreation Center ‘Daglezja’ in Zakopane by the Bank with the company Qualia Residence Sp. z o.o.
On 31 January 2012, the increase in the share capital of Bankowy Leasing Sp. z o.o. in the total amount of PLN 9 500 thousand was registered with the National Court Register. All the shares were taken up by Bankowy Fundusz Leasingowy SA – the Bank’s subsidiary- for the price equal to the nominal value of the shares taken up.
In January and February 2012, PKO Bank Polski SA made a capital contribution to Qualia Development Sp. z o.o. totalling PLN 35 319 thousand.
In 2012 during the period to the publication of the report the Bank conducted activities connected with the liquidation of Centrum Finansowe Puławska Sp. z o.o. On 1 March 2012, in order to take over its assets, including property, in which is the Bank’s Head Office registered office is located.
In February 2012, PKO Bank Polski SA carried out a transaction consisting of selling 2% interest in Finansowa Kompania ‘Prywatne Inwestycje’ Sp. z o.o. to ‘Inter-Risk Ukraina’ Spółka z dodatkową odpowiedzialnością. The above-mentioned transaction was carried out as part of the process of transforming Finansowa Kompania ‘Prywatne Inwestycje’ Sp. z o.o. into a subsidiary of ‘Inter-Risk Ukraina’ Spółka z dodatkową odpowiedzialnością.

This document is a translation of a document originally issued in Polish. The only binding version is the original Polish version.
Consolidated Financial Statements of the Powszechna Kasa Oszczędności Bank Polski Spółka Akcyjna Group
for the year ended 31 December 2011 (in PLN thousand)
156
On 10 February 2012, the Bank carried out an issue of own bonds based on the Scheme for issuing bonds for the domestic market. The nominal value of the bonds issued as part of the Issue is PLN 1,500,000 thousand. The nominal value of one bond is PLN 100 thousand. The bonds issued as part of the Issue are bearer zero-coupon discount bonds. The redemption of the bonds issued as part of the Issue will be performed at their nominal value.
Signatures of all Members of the Management Board of the BankSignatures of all Members of the Management Board of the BankSignatures of all Members of the Management Board of the BankSignatures of all Members of the Management Board of the Bank
23.02.2012 Zbigniew Jagiełło President of the
Management Board
.............................. (signature)
23.02.2012 Piotr Alicki Vice-President of the Management Board
.............................. (signature)
23.02.2012 Bartosz Drabikowski
Vice-President of the Management Board
.............................. (signature)
23.02.2012 Andrzej Kołatkowski Vice-President of the Management Board
.............................. (signature)
23.02.2012 Jarosław Myjak Vice-President of the Management Board
.............................. (signature)
23.02.2012 Jacek Obłękowski Vice-President of the Management Board
.............................. (signature)
23.02.2012 Jakub Papierski Vice-President of the Management Board
.............................. (signature)
Signature of person responsible for maintaining the books of account
23.02.2012
Danuta Szymańska
Director of the Bank
..............................
(signature)