(in press) physical criteria for distinguishing sandy tsunami and storm
TRANSCRIPT
�������� ����� ��
Physical criteria for distinguishing sandy tsunami and storm deposits usingmodern examples
Robert A. Morton, Guy Gelfenbaum, Bruce E. Jaffe
PII: S0037-0738(07)00019-XDOI: doi: 10.1016/j.sedgeo.2007.01.003Reference: SEDGEO 3770
To appear in: Sedimentary Geology
Received date: 30 December 1899Revised date: 30 December 1899Accepted date: 30 December 1899
Please cite this article as: Morton, Robert A., Gelfenbaum, Guy, Jaffe, Bruce E., Physicalcriteria for distinguishing sandy tsunami and storm deposits using modern examples,Sedimentary Geology (2007), doi: 10.1016/j.sedgeo.2007.01.003
This is a PDF file of an unedited manuscript that has been accepted for publication.As a service to our customers we are providing this early version of the manuscript.The manuscript will undergo copyediting, typesetting, and review of the resulting proofbefore it is published in its final form. Please note that during the production processerrors may be discovered which could affect the content, and all legal disclaimers thatapply to the journal pertain.

ACC
EPTE
D M
ANU
SCR
IPT
ACCEPTED MANUSCRIPT
1
Physical Criteria for Distinguishing Sandy Tsunami and Storm Deposits Using Modern
Examples
Robert A. Mortona,*, Guy Gelfenbaumb, Bruce E. Jaffec
aU.S. Geological Survey, 600 Fourth St. S., St. Petersburg, FL 33701 USA
bU.S. Geological Survey, 345 Middlefield Rd., Menlo Park, CA 94025 USA
cU.S. Geological Survey, 400 Natural Bridges Drive, Santa Cruz, CA 95060 USA
Abstract
Modern subaerial sand beds deposited by major tsunamis and hurricanes were compared at
trench, transect, and sub-regional spatial scales to evaluate which attributes are most useful for
distinguishing the two types of deposits. Physical criteria that may be diagnostic include:
sediment composition, textures and grading, types and organization of stratification, thickness,
geometry, and landscape conformity.
Published reports of Pacific Ocean tsunami impacts and our field observations suggest that
sandy tsunami deposits are generally < 25 cm thick, extend hundreds of meters inland from the
beach, and fill microtopography but generally conform to the antecedent landscape. They
commonly are a single homogeneous bed that is normally graded overall, or that consists of only
a few thin layers. Mud intraclasts and mud laminae within the deposit are strong evidence of
tsunami deposition. Twig orientation or other indicators of return flow during bed aggradation
are also diagnostic of tsunami deposits. Sandy storm deposits tend to be > 30 cm thick, generally
extend < 300 m from the beach, and will not advance beyond the antecedent macrotopography
they are able to fill. They typically are composed of numerous subhorizontal planar laminae
organized into multiple laminasets that are normally or inversely graded, they do not contain
internal mud laminae and rarely contain mud intraclasts. Application of these distinguishing
characteristics depends on their preservation potential and any deposit modifications that
accompany burial.
The distinctions between tsunami and storm deposits are related to differences in the
hydrodynamics and sediment-sorting processes during transport. Tsunami deposition results
from a few high-velocity, long-period waves that entrain sediment from the shoreface, beach,
ACC
EPTE
D M
ANU
SCR
IPT
ACCEPTED MANUSCRIPT
2
and landward erosion zone. Tsunamis can have flow depths greater than 10 m, transport
sediment primarily in suspension, and distribute the load over a broad region where sediment
falls out of suspension when flow decelerates. In contrast, storm inundation generally is gradual
and prolonged, consisting of many waves that erode beaches and dunes with no significant
overland return flow until after the main flooding. Storm flow depths are commonly < 3 m,
sediment is transported primarily as bed load by traction, and the load is deposited within a zone
relatively close to the beach.
Keywords: Coastal inundation; Overwash; Storm deposit; Tsunami deposit; Sediment transport;
Hydrodynamics
* Corresponding author.
E-mail address: [email protected] (R. Morton)
1. Introduction
Tsunamis and coastal storms are two of the most dangerous and yet most common water
hazards to affect population centers and economic infrastructures worldwide. Both are globally
frequent but are brief physical phenomena that typically cause death and destruction along low-
lying coastal regions. Because these coastal hazards have direct social impacts, some scientists
have extended the historical record through the use of paleo-event deposits and have derived
frequency and intensity estimates from the stratigraphic record (Atwater and Hemphill-Haley,
1996; Bourgeois and Minoura, 1997; Hutchinson et al., 1997; Liu and Fearn, 2000; Donnelly et
al., 2001; Hayne and Chappell, 2001: Jaffe and Gelfenbaum, 2002). Because paleo-event
analyses are used to predict event recurrence and to conduct hazard-vulnerability assessments, it
is essential to be able to distinguish between tsunami and storm deposits in the sedimentary
record.
Tsunami flooding results from a train of long-period waves that can rapidly travel long
distances from where they were generated by deep-ocean earthquakes, submarine landslides,
volcanic eruptions, or asteroid impacts. In contrast, extreme coastal storms are the products of
coupling between the atmosphere and ocean, whereby cyclonic wind circulation and low
ACC
EPTE
D M
ANU
SCR
IPT
ACCEPTED MANUSCRIPT
3
barometric pressure combine to raise water levels and generate destructive waves. Despite their
genetic differences, both tsunamis and storms cause brief coastal flooding with high overland
flow velocities. In many settings, the resulting sand deposits can have similar physical attributes,
making it difficult to differentiate them without some a priori evidence (Foster et al., 1991;
Dawson and Shi, 2000).
Distinguishing tsunami impacts from those of storms is uncomplicated when the preserved
erosional and depositional features are for extreme events. For example, tsunamis are the most
likely explanation for those deposits where emplacement of large boulders is consistent with the
historical tsunami record (Noormets et al., 2002; Goff et al., 2006), or the wave run-up elevations
greatly exceed those of storms or sea-level fluctuations (Jones and Hunter, 1992; McMurtry et
al., 2004), or where both clast size and elevation are beyond the expected range, such as cobbles
deposited in high dunes (Nichol et al., 2002). But in many parts of the world, nearshore
sediments available for reworking and transport are limited to sand and mud with some gravel,
which makes distinguishing tsunami and storm deposits more difficult, especially when they are
at low elevations that can be reached easily by overwash from either event.
Compared to coastal storms, major tsunamis are less frequent events, occurring about once per
decade in the Pacific Ocean region where they are most common because of the active tectonic
setting. The devastating impacts of tsunami waves have been reported for hundreds of years, and
yet only a few modern tsunami deposits have been described in detail (Wright and Mella, 1963;
Nishimura and Miyaji, 1995; Sato et al., 1995; Shi et al., 1995; Minoura et al., 1997; Dawson et
al., 1996; Bourgeois et al., 1999; Gelfenbaum and Jaffe, 2003; Jaffe et al., 2003). Even some
historical tsunami studies represent interpreted paleo-events because they occurred more than
100 yrs before the field investigation and/or are buried beneath younger deposits. Goff et al.
(1998) used paleo-tsunami interpretations to establish diagnostic criteria for tsunami deposits
because there were insufficient studies of modern tsunami deposits to represent an acceptable
sample size. After investigating known tsunami deposits at several coastal sites, Kortekaas
(2002) concluded that most of the criteria identified by Goff et al. (1998) also apply to storm
deposits.
The dramatic geological changes associated with storms have been the subject of intense
investigation because of their annual occurrence and devastating impacts on coastal
communities. Despite the abundant literature regarding modern storm deposits (see Morton and
ACC
EPTE
D M
ANU
SCR
IPT
ACCEPTED MANUSCRIPT
4
Sallenger, 2003 for partial review), few if any of these studies examine multiple attributes of the
deposits in a way that allows for direct comparison with tsunami deposits. Sedgwick and Davis
(2003) used a geographically limited sample of modern overwash sites to develop criteria for
identifying storm deposits. Nearly all of the criteria that Sedgwick and Davis (2003) identified
also apply to tsunamis deposits; therefore, they are not uniquely diagnostic of storm deposits.
The few studies specifically designed to compare characteristics of historical tsunami and
storm deposits (Nanayama et al., 2000; Kortekaas, 2002; Goff et al., 2004; Tuttle et al., 2004)
were conducted at the same or nearby sites. This eliminated or reduced inter-site sediment and
landscape variability but prevented the comparison of impacts of events of similar intensities.
Each study also relied on an interpreted origin for one of the deposits, which was buried beneath
younger surficial sediments. Burial does not necessarily invalidate the conclusions drawn from
the comparisons, but it does introduce post-depositional modifications that could alter the upper
contact, thickness, textural trends, and areal extent of the deposit.
In this study, we examine modern sand beds deposited by two local tsunamis and two
hurricanes that were all major events (Table 1) capable of causing substantial coastal change and
forming deposits with high preservation potential. Field sites were selected to avoid buildings
that would modify flow and influence associated deposits. By investigating subaerial deposits
shortly after they formed, we can eliminate any question about their origin and the physical
processes that produced them. We systematically analyzed the field and laboratory data to make
direct sedimentological, stratigraphic, and morphological comparisons between the two types of
deposits and supplemented our observations with those reported in the literature for other
modern tsunami and storm deposits. Herein we compare the flow and sediment-transport
processes of tsunamis and extreme storms, and the resulting deposits, at spatial scales ranging
from a trench (meters), cross-shore transect (hundreds of meters), or sub-region (kilometers).
Characteristics of storm and tsunami flow relevant to sediment transport and deposition include
wave height and period, number of waves, flow depth and duration, water velocities, and
boundary-layer structure. Characteristics of the deposits that are useful for comparison include
deposit composition and thickness, sediment-transport distance from the shore, lateral continuity,
grain-size distribution, sedimentary structures, and vertical trends within the deposit.
Our intent is to identify the most significant physical criteria that can be used to interpret the
origin of isolated coastal sand beds that are commonly used to reconstruct frequency and
ACC
EPTE
D M
ANU
SCR
IPT
ACCEPTED MANUSCRIPT
5
intensity of paleo-storms and paleo-tsunamis. The objective of these comparisons is the
identification of criteria that are diagnostic regardless of local variations in physical setting and
sediment sources. Our approach is to use average values or characteristics with the highest
frequency of occurrence so that extreme or unusual conditions that would produce anomalies are
recognized and avoided.
Terminology used to describe the stratigraphical hierarchy of the sand deposits (lamina,
laminaset, bed) follows that of Campbell (1967). A lamina is the smallest visible unit of
stratification, whereas laminasets are groups of conformable, genetically related laminae
separated by a bounding surface. A bed consists of one or more laminasets. Layer is an informal
term used for units that do not exhibit laminae or laminasets.
2. Tsunami Processes and Deposits
2.1 Tsunami Hydrodynamics – General Description
Eyewitness accounts (Wright and Mella, 1963; Gelfenbaum and Jaffe, 2003; Liu et al., 2005)
and videos of the 2004 Indian Ocean tsunami record different initial manifestations of the
tsunami and provide a basis for establishing general inundation and flow characteristics (Table
2). Arrival of the first tsunami perturbation can take one of at least three different forms, a
continuous surge, an elevated bore, or a recession of the sea. Preliminary reports for the 2004
Indian Ocean tsunami indicate that nearfield sites initially experienced a bore, whereas farfield
sites initially experienced a surge.
Tsunami surges have been described by Wright and Mella (1963) and Tilling et al. (1976), and
were recorded in the December 26, 2004 videos of the west coast of Sri Lanka. A tsunami surge
consists of a gradual offshore rise in water followed by a rapid onshore surge that floods
continuously inland until the volume of water distributed across the land equals the volume of
water driven onshore. After the primary surge, there is a relaxation in flow, followed by pulses
from low, short-period ocean waves superimposed on the floodwaters. Commonly the first
tsunami inundation reported is a minor surge that is limited in depth and inundation distance.
Tsunami bores have been described by Shi et al. (1995) and Gelfenbaum and Jaffe (2003), and
were recorded in the December 26, 2004 videos of Phuket, Thailand. A tsunami bore advances as
ACC
EPTE
D M
ANU
SCR
IPT
ACCEPTED MANUSCRIPT
6
a highly turbulent, elevated wall of water that breaks continuously along a front as it passes
through the normal surf zone, then rushes up and onshore as flow crosses the sloping beach.
Massive flooding associated with the bore is followed by smaller waves that increase flow depth
and temporarily accelerate flow velocities.
A recession of the ocean commonly precedes the highest and most destructive tsunami wave
(Wright and Mella, 1963; Tilling et al., 1976), whether it is the first or a subsequent wave. Liu et
al. (2005) reported that the sea may recede several hundred meters and the ocean level may be
lowered several meters for as much as 30 minutes before a high, steep wave or bore rushes
onshore and rapidly inundates the land. Lowering of the sea can expose a broad zone of erodable
sediments on the beach and upper shoreface and make them readily available for entrainment by
uprush of the incoming wave. The exposed subtidal zone, the beach, and the land within about
150 m of the beach are the most likely sources of eroded and entrained sediment.
Depending on wave period and slope of the coastal plain, subsequent waves in the wave train
may move inland before floodwaters of the preceding wave have receded. Eyewitness accounts
from Chile (Wright and Mella, 1963), Papua New Guinea (Gelfenbaum and Jaffe, 2003), and
Sumatra describe the second and third waves traveling over the previous waves in the wave train.
Flow depths and landward slope of the water surface during tsunami flooding are controlled by
height and steepness of the first wave and heights of subsequent waves superimposed on the pre-
existing flood depths. Bryant (2001) estimated tsunami flow velocities of 1.3 to 9.3 m/s from an
equation that relates heights of tsunami waves flowing over land and slope of the water surface.
Titov and Synolakis (1997), Titov et al. (2001), Jaffe and Gelfenbaum (2002), and Jaffe and
Gelfenbaum (this issue) estimated tsunami flow velocities of 4 to 17 m/s from shallow-water
wave models and sediment-transport models of tsunami deposits.
Our post-tsunami field observations in Perú, Papua New Guinea, Sri Lanka, and Sumatra
demonstrate that tsunami floodwaters may change direction and flow laterally along local
topographic gradients, or seaward if the flow is blocked by inland elevations that exceed the
height of wave runup. For barrier-lagoon settings with low elevations, the alongshore or
offshore-directed return flow may be weak or absent if elevations landward of the beach are
lower than the potential height of wave runup. For those conditions, overland flow can be
unidirectional toward the lagoon. Where coastal-plain elevations are several meters high or
elevations increase landward (hilly terrane), return flow from the tsunami can be rapid because
ACC
EPTE
D M
ANU
SCR
IPT
ACCEPTED MANUSCRIPT
7
the ocean height is well below the height of tsunami inundation. Tsunami return flow usually
follows topographic lows and may form dendritic drainage patterns that coalesce into channels.
The return-flow channels can scour several meters below the land surface near the beach.
The highly energetic turbulent tsunami flow, which commonly is directed perpendicular to the
shoreline, erodes unconsolidated surficial sediments and transports debris inland. The flow
scours the land surface near the shore and incorporates eroded sediments into the suspended load
that was previously excavated from the shoreface and beach. Where flow velocity (or more
accurately sediment-transport flux) increases landward, tsunami inundation produces an erosion
zone (Shi et al., 1995; Gelfenbaum and Jaffe, 2003; Jaffe et al., 2003). Where sediment flux is
approximately uniform, a bypass zone is created. The combined erosion/bypass zone can extend
inland from the beach as much as 150 m (Gelfenbaum and Jaffe, 2003). At some sites, the zone
of beach retreat is the same as the zone of erosion (see post-tsunami beach profiles of Rasheed et
al., 2006) and sand deposition begins at the backbeach and extends continuously inland. At other
sites, erosion and sand deposition alternate where there is local interaction between the flow,
objects (e.g., trees), and topography.
Videos of the 2004 tsunami show that although the tsunami was highly turbulent in the
nearshore zone, sediment concentration was low until just before it came ashore. At least for the
shores around the Indian Ocean, the zone of subaqueous erosion and sediment entrainment did
not extend far offshore. This condition indicates that most of the sediment in a tsunami deposit is
eroded from the beach and adjacent land (Sato et al., 1995) and not from the ocean floor at great
depth. Sediment concentration increases rapidly at the front and base of the wave as it crosses the
beach and first encounters the land. Sediment concentration also is highly variable alongshore in
different parts of the advancing wave.
Tsunami flooding typically results in a sediment drape deposited from suspension as the wave
passes inland (Minoura et al., 1997; Gelfenbaum and Jaffe, 2003; Jaffe et al., 2003). Initially
coarser material, then finer material, is deposited as flow velocities decelerate either as a result of
frictional dissipation of wave energy (water surface slope decreases as the wave passes) or
interference between a receding wave and subsequent proceeding wave. The number of times the
depositional process is repeated depends on the balance of energy, timing, and interference
between incoming and outgoing waves in the wave train.

ACC
EPTE
D M
ANU
SCR
IPT
ACCEPTED MANUSCRIPT
8
2.2 1998 Papua New Guinea Tsunami
The devastating July17, 1998, Papua New Guinea (PNG) tsunami inundated low-lying barrier
spits and coastal plains over a 60-km stretch of coast. The tsunami was generated either from a
magnitude 7 earthquake, a large nearby submarine landslide, or both (Tanioka, 1999; Geist,
2000; Tappin et al., 2001). The tsunami ripped large palm trees out of the ground and destroyed
most of the buildings in its path. Eyewitnesses confirmed there were three main waves, each
coming within about 5 minutes of another, with the second and third waves arriving before the
previous wave(s) receded. The third wave reached land about 15 minutes after the first wave, and
the land remained flooded for several hours (Davies, 1999; McSaveney et al., 2000). Maximum
water levels, which were 15 m (Fig. 1) along the spit fronting Sissano Lagoon (Fig. 2), decreased
to 2-3 m about 15 km to the west (Kawata et al., 1999). A section of coast spanning 20 km
sustained water levels over 10 m high, a focusing that may have resulted from proximity of the
source disturbance (Matsuyama et al., 1999). The tsunami approached nearly perpendicular to
the coast during inundation (Fig. 3). However, the return flow was directed toward topographic
lows around the lagoon (Gelfenbaum and Jaffe, 2003).
Despite the destructive force of the tsunami, a sandy bed was deposited as a thin continuous
sheet over several tens of kilometers of coast (Table 3). The tsunami deposit was generally
tabular and extended about 100 m from the shoreline to near the limit of inundation, a distance of
up to 750 m (Gelfenbaum and Jaffe, 2003). The limit of inundation was identified by a wrack
line deposit of formerly floating debris. The tsunami traveled much farther inland across Sissano
Lagoon, but data on a tsunami deposit in the lagoon were not collected. Gelfenbaum and Jaffe
(2003) estimated that an offshore source (probably the upper shoreface) provided twice as much
sand as the subaerial beach and berm to form the deposit.
Gelfenbaum and Jaffe (2003) described the PNG tsunami deposit from four cross-shore
transects. At Waipo (Fig. 2), a transect about 300 m long with 10 trenches revealed a thin sandy
tsunami deposit that started 120 m from the shoreline and extended inland 280 m, about 40 m
short of the inundation limit. The entire deposit was massive or normally graded; it varied from <
0.5 cm to 5 cm thick, and the mean grain size decreased landward. The flow depth at this
location was 4 to 7 m (Kawata et al., 1999).

ACC
EPTE
D M
ANU
SCR
IPT
ACCEPTED MANUSCRIPT
9
At the Arop site (Figs. 2 and 3), the main tsunami flow was 10-15 m high near the beach
(Kawata et al., 1999). The transect of Gelfenbaum and Jaffe (2003), with more than 20 trenches,
crossed a steep beach face and berm that reached 2.2 m above sea level and then extended across
a low-lying, nearly flat coastal plain for 700 m (Fig. 4A). An erosion zone extended from the
beach to about 50 m inland. In a short distance, the deposit thickness increased from zero to
about 8 cm and remained between 4 and 11 cm thick for nearly 500 m (Fig. 4B). At its landward
edge, the deposit thinned to zero over about 100 m, extending to within 40 m of the inundation
limit. Cross-shore trends in grain size, sorting, and skewness were determined from bulk samples
from each trench (Fig. 4C). Coarsest beach sediment and finer offshore (-3 m depth) sediment
contained all size classes that were transported by the tsunami and deposited farther inland.
Mean grain size of the tsunami deposit remained relatively constant along most of the transect
(150-520 m) but became finer near the landward end of the deposit. A mud layer up to 0.6 cm
thick capped the sandy tsunami deposit and was commonly found overlying the sand in local
depressions. At nearly all sites along the Arop transect, the tsunami deposit was normally graded
(Fig. 5A), with coarse or medium sand at the base fining upward to fine sand or mud at the top.
The upward fining was systematic (Fig. 5B), showing no indication of multiple layers or internal
stratification. Mud rip-up clasts from the underlying soil were commonly found within the
graded deposits.
The Otto transect (Fig. 2) was on a long spit that formed the eastern side of Sissano Lagoon.
At this transect, the spit was < 200 m wide and < 1 m high; consequently, the entire end of the
spit was inundated by the tsunami, which was estimated to be 10-15 m high. Across the spit, the
40-m-wide erosion zone near the beach was followed by a deposition zone where tsunami
deposit thickness varied up to 28 cm (Gelfenbaum and Jaffe, 2003). The deposit at Otto
consisted of a massive layer 10-15 cm thick overlain by a thinly laminated layer 5-10 cm thick.
There were no significant cross-shore grain size trends in this deposit.
At Sissano (Fig. 2), a 600-m long transect crossed the coastal plain that reached elevations of
3 m. Reported maximum water levels were 5-10 m high near the coast (Kawata et al., 1999).
Indicators suggested several directions of flow with the main flow arriving perpendicular to the
coast, but return flow was directed toward local topographic lows, and in some places,
perpendicular to the main flow (Gelfenbaum and Jaffe, 2003). No sediment was deposited within
100 m of the shoreline. About 150 m inland, a sandy deposit 8 cm thick was found overlying a

ACC
EPTE
D M
ANU
SCR
IPT
ACCEPTED MANUSCRIPT
10
rooted and compacted sandy soil. From 150 to 425 m inland, the tsunami deposit was nearly
tabular, and cross-shore variability in deposit thickness was similar to the variability in thickness
in the shore-parallel direction. Within this zone, the average deposit thickness was 6 cm and the
range was from 0.5 to 12 cm. In a few places, there was a single fining-upward layer; however,
in other places, the deposit was composed of multiple layers. At one of the trenches, 1-cm
vertical sampling revealed two fining-upward layers separated by an abrupt contact. It was not
possible to correlate the number of waves reported at a location and the number of layers in the
tsunami deposit because there were more waves than sand layers.
2.3 2001 Perú Tsunami
On June 23, 2001, a deadly tsunami hit the southern coast of Perú, triggered by a massive fault
rupture and earthquake of magnitude 8.4. The tsunami was observed in many Pacific coastal
areas including Perú, Chile, Hawaii, New Zealand, and Japan. Hardest hit was the region near
Camaná in southern Perú, where the tsunami killed 87 people and destroyed more than 3000
structures (Okal et al., 2002; Dengler et al., 2003). The tsunami flowed inland more than 1 km at
some locations and left sedimentary deposits along more than 50 km of coast (Fig. 1). Tsunami
deposits were identified in three different coastal settings in the Camaná region (Fig. 6): (1)
muddy floodplain, (2) sandy river valley, and (3) sandy open coast (Jaffe et al., 2003). Tsunami
deposits consisted primarily of structureless sand layers that fined upward overall (Table 3).
Deposits typically had an erosional contact at their base overlain by a heavy mineral layer.
In a muddy floodplain cultivated field near La Quinta, typical tsunami deposits contained rip-
up clasts, had a mud layer separating two normally graded sand layers, and were capped by mud
and mud balls (Fig. 7). Rip-up clasts tended to be concentrated near the base of the deposit,
although larger rip-ups were found at different levels in sand layers. Occasional rounded cobbles,
transported inland more than 100 m from a cobble berm at the coast, were dispersed within and
on top of tsunami sand deposits. The presence of a mud layer between normally graded sand
layers was evidence of two separate phases of flow creating the deposit. Eyewitnesses reported
three to four large waves at this location and a maximum tsunami flow depth of approximately
5.5 m.
ACC
EPTE
D M
ANU
SCR
IPT
ACCEPTED MANUSCRIPT
11
Tsunami deposits in an ephemeral stream valley near Playa Jahuay were easily identified
because mineralogy of the river sand contrasted with that of the tsunami sand, which had a
mineralogy similar to the beach sand (Jaffe et al., 2003). Typical deposits were two sand layers,
each with a heavy mineral lamina at their base. Sand layers typically were normally graded
overall, although massive layers and layers with inverse grading were also observed. There were
no mud rip-up clasts or mud layers within the stream valley tsunami deposit because mud was
not available locally. About 150 m away from the stream, the tsunami deposited sand in a field
where 15-cm-high ridges had been created by plowing. The microtopography affected tsunami
sand deposits, which tended to form on the lee side of the ridges and in the swales. These
deposits contained mud clasts derived from the underlying soil.
Tsunami deposits in sandy open-coast settings lacking well-developed soils were identified
using a tendency for normal grading and an erosional base overlying truncated or deformed (e.g.,
trample marks) beach laminae (Jaffe et al., 2003). A thin mud layer, sometimes containing fine
silt, capped open-coast tsunami deposits where the runup reached mud cliffs. Heavy mineral
laminae were present at the bases of most of the tsunami sand beds and at one or more horizons
within each bed.
Variations in tsunami deposit thickness and number of sand layers at Amecosupe (Figs. 6 and
8) illustrate the cross-shore trends. An erosion zone extended inland about 100 m from the
shoreline. Between 100 and 200 m inland, deposition was from both runup and return flow,
which was concentrated by a road that trapped water and deflected flow alongshore. From 1 to 7
layers were identified in this zone. At some locations there were thin cross-beds at the surface of
the deposit created by ripples migrating alongshore with the return flow. This was a rare
observation of cross bedding in a tsunami deposit in Perú. Between 200 m and 488 m inland,
which is within 5 m of the limit of inundation, tsunami deposit thickness decreased from 25 to
0.5 cm, and the number of sand layers decreased from 3 to 1. Deposit thickness responded to
local topography (order of 0.5 m of relief) and the number of tsunami waves that reached a
location. Because deposits were an amalgamation from three separate waves, the thickest beds
occurred where all three waves deposited sand. The simple model for landward thinning holds
but is modified by abrupt thinning at locations where fewer tsunami waves deposited sand.
ACC
EPTE
D M
ANU
SCR
IPT
ACCEPTED MANUSCRIPT
12
3. Storm Processes and Deposits
3.1 Storm Hydrodynamics – General Description
For this discussion, the characteristics and coastal responses of both tropical and extratropical
cyclones are considered (Morton, 1988). Tropical cyclones initially cause a gradual rise in water
level as forerunners of deep-water waves reach the shore and the storm moves landward. There is
both a very rapid rise and fall in peak storm surge as the storm crosses the coast and then a more
gradual fall as flooded coastal areas and surrounding water bodies are drained (Table 2). For
tropical cyclones, the highest storm surges are generally restricted to a few tens of kilometers
adjacent to the eye, although elevated water levels can encompass more than 600 km of coast.
Coastal flooding by extratropical cyclones (mid-latitude storms) is different in that the rise and
fall of water levels are more gradual, the maximum storm surge can last for several days, and the
surge can spread alongshore for more than 500 km (Morton et al., 2003). Within both of these
flooding scenarios, the relative timing and stages of storm erosion and deposition are: (1) gradual
inundation of the beach with attendant beach and dune erosion, (2) overtopping of dunes or berm
crest where dunes are absent, and (3) deposition of perched fans or an overwash terrace. Morton
(2002) described these and other morphological responses during coastal inundation.
Few measurements are available to establish an accurate range of overwash flow velocities.
Reported field measurements were for small perched fans (confined flow) produced by moderate
to weak extratropical storms. Fisher et al. (1974) and Leatherman (1977) reported maximum
flow velocities of 2.4 m/s for overwash where water depths were extremely shallow (15 cm) and
only slightly above the backbeach elevations. Overwash currents were driven by breaking waves
that surged every 1 to 2 minutes during brief (< 5 hr) events. In another field study, Holland et al.
(1991) used an instrument array and video recorder to investigate flow velocities and sediment
transport during a hurricane at an overwash terrace setting (unconfined flow). They reported
maximum and average flow velocities of 2.9 and 2.0 m/s, respectively, in extremely shallow
water (average flow depths of 13 cm) for overwash surges with an average period of 4 minutes.
None of the prior studies evaluated overwash flow depths and velocities where high-frequency
waves continuously transfer sand from the upper shoreface and beach to former subaerial sites
onshore. The hazardous conditions, destructive forces acting on field equipment, and rapidly
ACC
EPTE
D M
ANU
SCR
IPT
ACCEPTED MANUSCRIPT
13
changing flow depths generally have prevented measurement of flow velocities where the area
inland of the beach is entirely flooded, water depths are substantially greater than the backbeach
elevation, and wave-driven flow velocities are augmented by wind stress. Morton (1979) used
flow depths, wind speeds, and bedform angles at supercritical flow for three different hurricanes
to estimate flow velocities for the overwash conditions. Calculated overwash velocities ranged
from 1.3 to 4.5 m/s, depending on the method used to determine velocities.
3.2 1961 Hurricane Carla – United States Gulf of Mexico
Hurricane Carla was a large intense storm that had a high storm surge and caused extensive
flooding and morphological changes along more than 600 km of the Texas coast. Maximum
wind speeds at landfall were 280 km/hr. Backbeaches were inundated for about 60 hrs and near-
maximum surge heights of 3 to 4 m (U.S. Army Corps of Engineers, 1962) persisted for more
than 24 hrs (Morton and Paine, 1985). Judging from the observed surge heights and storm-berm
elevations, overwash deposits must have formed when flow depths were about 1 to 1.5 m. Flow
was perpendicular to the coast throughout overwash because winds continued to blow onshore
after landfall. The effect of high wind stress on shallow water was evident. The extreme inland
extent of sediment transport at some sites (Fig. 1), and a shore-parallel zone of sediment
bypassing as much as 575 m wide all point to wind-augmented currents (Morton, 1979).
Carla overwash deposits were examined at three locations (Fig. 9) that encompassed about
190 km of the region of greatest morphological impact. Proximal overwash terrace deposits
exposed near the beach by subsequent erosion were composed of sand and some gravel-size shell
(Table 3). Terrace deposits varied in thickness from 60 cm near landfall (Fig. 10A) to 1.3 m
about 190 km northeast of the eye (Fig. 10B). At several sites the high concentrations of
reworked shells caused them to be poorly stratified and poorly sorted, indicating high sediment
concentrations and rapid deposition. Where vestiges of stratification were visible, they were
subhorizontal planar laminae and laminasets that consisted of coarse shell overlain by fine sand
(Fig. 10A). The shell valves and fragments were oriented parallel to the bedding planes. Carla
deposits thinned landward across Matagorda Peninsula (Fig. 9) and were at least 25 to 30 cm
thick where they graded into the adjacent lagoon. These distal overwash deposits were composed
ACC
EPTE
D M
ANU
SCR
IPT
ACCEPTED MANUSCRIPT
14
of well-sorted fine sand that was organized as plane parallel laminations. A few laminae of fine
shell fragments or heavy minerals were also present.
The Carla deposits exhibited both overall upward-fining and landward-fining trends that
reflected a decrease in shell abundance but not a significant cross-shore change in size of the
well-sorted sand fraction. Despite the availability of mud on the beach and upper shoreface, no
mud or rip-up clasts were observed in the deposits. At all shore-parallel exposures, the basal
overwash contact was abrupt but irregular in elevation, owing both to erosion and preservation of
the undulating antecedent topography.
The landward extent of Carla overwash deposits ranged from 30 to 927 m and averaged 193 m
(Fig. 1, Table 3). Greatest transport distances coincided with the zone of incised channels and
associated individual overwash fans (Morton and Sallenger, 2003). Away from these anomalies,
overwash distances generally were less than 200 m. Maximum elevation of the deposit base was
about 1 m and maximum top elevation was about 2.3 m. Both top and bottom elevations of the
deposits decreased landward.
3.3 2003 Hurricane Isabel – United States Atlantic Ocean
Hurricane Isabel was a moderately large storm that at its peak intensity had sustained winds of
270 km/h and offshore significant wave heights of 8.1 m (U.S. Army Corps of Engineers, 2004).
Before crossing the Outer Banks of North Carolina, Isabel’s forward progress slowed, which
increased dune erosion and overwash by prolonging the duration of beach flooding to about 9 hrs
at the peak of the tidal cycle. Maximum inundation of the beaches and barriers lasted for about 5
hrs. At Cape Hatteras, North Carolina (Fig. 11), Isabel generated a maximum open-coast surge of
2.7 m, and it elevated water levels and overwashed low-lying areas as far as 400 km from the
storm center. Where Isabel destroyed the dunes, storm waves and strong onshore winds
constructed broad overwash terraces (Figs. 12 and 13) and formed two breaches that segmented
narrow Hatteras Island.
For the present study, post-Isabel field investigations were conducted at three sites on Hatteras
Island, North Carolina and at one site on southern Assateague Island, Virginia (Fig. 11).
Overwash on Hatteras Island consisted of at least two phases of deposition. The first phase was
responsible for the greatest inland transport of sand and construction of overwash terraces that

ACC
EPTE
D M
ANU
SCR
IPT
ACCEPTED MANUSCRIPT
15
terminated in avalanche faces (Figs. 12 and 13). The effects of wind-driven currents were only
evident on the first-phase deposits. Second-phase deposits overlie and did not extend as far
landward as the first phase deposits. In one trench, concentrated and dispersed organic debris
consistent with wrack lines and grass mats separated the two corresponding layers. In another
trench, heavy minerals also were concentrated at the contact between layers. Isabel deposits were
composed of well-sorted medium sand that is slightly negatively (coarse) skewed as a result of
the minor shell component (Fig. 14).
At the site southwest of Hatteras, the barrier island was only 300 to 800 m wide and located
about 55 km northeast of the storm center. Before Isabel, the beach was relatively wide, the
foredune ridge complex was 3 to 4 m high and 75 m wide, the mid-island surface consisted of
hummocky topography owing to low discontinuous, grassy mounds, and the low back-island
flats were vegetated by low bushes that formed a dense thicket. Isabel destroyed the foredune
ridge and constructed an overwash terrace about 2 m high and 200 to 250 m wide (Fig. 1) that
terminated in an avalanche face. Slopes on the avalanche face typically were 9˚ to 15˚ but were
as much as 31˚ where dense bushes impeded the flow. Debris trapped in bushes indicated that the
maximum flow depth, including waves, was about 1.26 m near the limit of overwash deposition.
The variability in overwash terrace thickness in the three trenches at Hatteras (40 to 97 cm)
probably was related to the hummocky topography before the storm. Thickness was greatest at
the seaward margin of the deposit and also locally along the avalanche face where dense brush
acted as a dam. Within each trench, there was a thin mat of grass or other debris deposited about
one-third of the thickness above the base. This organic detritus indicates a period of waning flow
or possibly falling water level when floating debris was deposited and then subsequently buried
by sand during renewed overwash.
Isabel overwash deposits at Hatteras consisted of well-sorted sand organized as subhorizontal
planar stratification with alternating zones of seaward and landward dip. The low-angle seaward-
dipping laminasets probably represent antidune backsets similar to those described by Barwis
and Hayes (1985). Landward dips ranged from 3˚ to 6˚ except at the avalanche face where dips
locally increase to 9˚. Greatest deposit thickness corresponded to laminasets with landward dip.
Shell fragments were rare in the overwash deposits even though the winnowed surface was
covered with shell fragments.
ACC
EPTE
D M
ANU
SCR
IPT
ACCEPTED MANUSCRIPT
16
In the ocean-side trench at Hatteras (Fig. 14), where stratification exhibited landward dip and
consisted of at least 12 laminasets, vertical trends in mean grain size revealed two cycles of
uniform/upward coarsening/upward fining (0-30 cm and 30-60 cm), and a third cycle of upward
coarsening/upward fining at the top of the deposit (60-90 cm). The coarsest and finest grains
were within the deposit, not at the base or at the top; however, sediments overall were slightly
coarser at the top than at the base.
At Rodanthe (Fig. 11), the barrier was 500 to 900 m wide and located about 100 km northeast
of the storm center, but well within the zone of maximum surface wind speeds. The pre-storm
beach was relatively wide, the foredune ridge was about 2.5 to 4 m high and about 50 m wide
(Fig. 13), the mid-island surface, which was relatively smooth, consisted of low grassy mounds,
and tall marsh grasses occupied the low back-island flats. Isabel reduced foredune elevations
about 2 m and constructed a landward sloping overwash terrace that was 50 to 75 cm thick, about
1.5 m high, and 200 to 250 m wide (Figs. 12 and 13). The terrace terminated in an avalanche
face that projected into the marsh where dense grass prevented further transport of sand. Depth
of overwash flow could not be accurately estimated, although it exceeded 45 cm, the average
height of the terrace deposit above the marsh surface. A flow depth of 76 cm was measured on a
building about 500 m alongshore from the trench transect.
In four of the five trenches at Rodanthe, deposit thickness is relatively uniform (40 to 50 cm)
probably because the pre-storm topography of the mid-island area was flat. The overwash
deposits consist of well-sorted sand with minor concentrations of shell fragments organized
primarily as subhorizontal planar laminations. The deposit consisted of 7 to more than 15
laminasets that became thinner toward the top of the deposit. In a trench near the avalanche face
the 19-cm-thick deposit showed foreset laminations dipping about 9˚ landward. Two trenches
near the terminus of deposition showed no evidence of stratification owing to the dense grass
that protruded through the overwash sand. Tall marsh grass landward of the overwash was
vertical and undisturbed, indicating that flow was not deep or moving with high velocity when
the distal terrace sand was deposited.
Despite having a storm surge of only 0.5 m above normal high tide that lasted for only a few
hours, Isabel waves completely overwashed the southern end of Assateague Island, Virginia
(Fig. 11) more than 375 km from the storm center. Overwash deposition filled topographic lows
with sand as much as 1.2 m thick. At Assateague, sediment-laden currents reoccupied and
ACC
EPTE
D M
ANU
SCR
IPT
ACCEPTED MANUSCRIPT
17
aggraded a former overwash terrace that was nearly barren and sloped landward. Isabel
deposition advanced the backbarrier margin where it terminated in an avalanche face in the
adjacent lagoon. A lack of any feature above the overwash terrace prevented estimating the depth
of overwash flow, which probably was < 1 m.
Three trenches were examined along a shore-normal transect where Assateague Island was
250 to 300 m wide and prone to frequent overwash. The ocean-side trench revealed a stacked
series of subhorizontal planar laminations organized into at least 11 laminasets, each from 3 to
10 cm thick. Most laminasets were accentuated by a heavy-mineral lamination at the base and
overall inverse textural grading of the sand bed from fine at the base to coarse at the top.
Laminasets were thinner toward the top of the deposit. The amalgamation of multiple overwash
deposits and lack of vegetative cover or soil made it difficult to delineate the Isabel deposit in the
ocean-side trench precisely. The most noticeable sedimentological break was a change in sand
color from light tan to dark brown about 66 cm below the surface. Thickness of the Isabel
deposit (43 cm) was well defined in the mid-island trench where poorly sorted sand and gravel
form the base. The gravel consisted of rip-up clasts of durable construction pavement eroded
from a bicycle path. Overlying sediments were subhorizontal planar laminated sand organized
into at least 11 laminasets, each from 2 to 5 cm thick. The Isabel deposit in the bayside trench
consisted of 18 cm of tan, well-sorted sand faintly laminated by planar stratification. The sand
laminae were organized into multiple thin (2.5-3.5 cm) laminasets, which were in sharp contrast
with the underlying muddy dark-brown sand with roots that represented the former fringing
marsh.
4. Discussion
4.1 Trench-scale criteria
Criteria that may be useful for distinguishing between tsunami and storm deposits at the trench
scale of investigation include sediment composition, textures and grading, types of stratification
and number of layers (Table 4). These criteria consider morphological and textural data from the
four deposits discussed in detail above, and from other modern tsunami and storm deposits
described in the literature and referenced below.
ACC
EPTE
D M
ANU
SCR
IPT
ACCEPTED MANUSCRIPT
18
4.1.1 Deposit composition
Cobble- to boulder-size slabs of rocks and blocks of coral and organic-rich mud are commonly
exhumed, respectively, from outcrops, reefs, and relict marshes and deposited on back beaches
and overwash flats by both tsunamis (Jaffe et al., 2003) and storms (Hayes, 1967). At a smaller
scale, where fine-grained sediment is available, rip-up clasts are common in the lower part of
tsunami deposits or in the mud cap (Fig. 7 and Shi et al., 1995; Gelfenbaum and Jaffe, 2003;
Jaffe et al., 2003; Goff et al., 2004). In contrast, mud rip-up clasts are rare or absent in storm
deposits (Table 3 and Schwartz, 1975; Morton 1978; Leatherman and Williams, 1983). Even at
many mud-rich sites, storm deposits are composed of sand commonly with high concentrations
of shell because there is little sand in the eroded sediments. The absence of muddy rip-up clasts
is attributed to the turbulence of the water and prolonged vigorous agitation that disaggregates
and disperses the mud. Although shell valves or fragments may be present in both storm and
tsunami deposits, discrete lamina of whole or comminuted shells are only common in storm
deposits, probably because of the high-frequency waves and sediment-sorting mechanisms.
Some sandy tsunami deposits contain mud laminations or plant debris that may be distributed
either within or at the top of the event bed (Fig. 7 and Jaffe et al., 2003; Tuttle et al., 2004). The
internal mud laminations are related to the mode of sediment transport (suspension) and
sufficient time for mud to settle between successive tsunami waves because of their long periods,
or to be introduced as soil eroded from adjacent slopes by the return flow. Kortekaas (2002)
identified rafts of organic material and buried plants as being diagnostic of tsunami deposits.
Although rare in occurrence, these same features may be present within some storm deposits (see
Hurricane Isabel example).
Mud is rare in most sandy storm deposits (Hayes, 1967; Schwartz, 1975; Morton 1978;
Leatherman and Williams, 1983). The complete absence of internal mud laminations is a result
of persistent high velocity, nearly unidirectional flow during the storm. The only fine-grained
sediments are late-stage deposition from suspension. Thin mud drapes or algal mats form at the
top of storm deposits in low inland settings (scour depressions, marshes, back-barrier flats)
where water can be ponded for extended periods (Hayes, 1967; Morton, 1978). The surficial mud
laminations are usually thin and susceptible to wind deflation or erosion by the next storm event;
ACC
EPTE
D M
ANU
SCR
IPT
ACCEPTED MANUSCRIPT
19
therefore, preservation potential is low. Higher elevations prevent post-storm water from being
ponded on overwash terrace deposits.
4.1.2 Sediment textures, grading, and stratification
Most modern tsunami deposits consist of one layer or only a few layers or laminasets (Table 3
and Nishimura and Miyaji, 1995; Nanayama et al., 2000; Gelfenbaum and Jaffe, 2003; Jaffe et
al., 2003; Tuttle et al., 2004), and most are normally graded overall (Nishimura and Miyaji,
1995; Shi et al., 1995; Bourgeois et al., 1999; Gelfenbaum and Jaffe, 2003; Jaffe et al., 2003;
Tuttle et al., 2004). Overall inverse grading of tsunami deposits is rare. Single-layer,
homogeneous and structureless tsunami deposits are indicative of extremely rapid deposition
such as would occur when flow decelerates between the uprush and backwash phases.
Sandy storm deposits typically exhibit numerous individual laminations segregated into
multiple discrete laminasets that commonly exhibit either normal or inverse grading (Fig. 14 and
Schwartz, 1975; Leatherman and Williams, 1983). Both tsunami and storm deposits can appear
to be massive without sedimentary structures, but most storm deposits exhibit at least some
subhorizontal planar stratification (Schwartz, 1975; Morton 1978; Leatherman and Williams,
1983; Tuttle et al., 2004). Where present, the number of layers or laminasets in both tsunami and
storm deposits depends partly on the thickness of the deposit. There is no clear correlation
between the number of layers within a bed and the number of waves either for tsunami or storm
deposits.
Only storm deposits commonly exhibit sedimentary structures other than planar stratification,
such as foresets (Hayes, 1967; Schwartz, 1975; Morton, 1978; Leatherman and Williams, 1983;
Nanayama et al., 2000), backsets (Barwis and Hayes, 1985), and climbing ripples (Morton,
1978). Although landward-dipping laminae may be present anywhere within a storm deposit, the
steepest foreset laminations are restricted to a narrow (few meter) band near the avalanche face.
Such a spatially restricted feature likely would not be observed in most paleo-storm deposits.
The variability of stratification types in storm deposits is probably a result of relatively shallow
flow depths, variable flow velocities, and predominant bed-load transport.
Trench-scale attributes of the sand deposits that are not diagnostic include sediment sorting,
distribution of heavy minerals, and nature of the basal contact with underlying sediments. Both

ACC
EPTE
D M
ANU
SCR
IPT
ACCEPTED MANUSCRIPT
20
storm and tsunami deposits can be well to poorly sorted, both can contain heavy-mineral lamina
at the base and within the deposit because the heavies are source dependent, and basal contacts
for both storm and tsunami deposits are usually abrupt (Table 3 and Hayes, 1967; Schwartz,
1975; Morton 1978; Leatherman and Williams, 1983; Shi et al., 1995; Gelfenbaum and Jaffe,
2003; Jaffe et al., 2003).
4. 2 Transect-scale criteria
Criteria that may be diagnostic at the transect scale include deposit thickness and geometry,
landscape conformity, deposit elevation, inland inundation distances, and sediment-transport
distances (Table 4). At the transect scale, both tsunami and storm deposits may show great lateral
variability; therefore, lateral variability is not diagnostic.
4.2.1 Deposit thickness, geometry, and landscape conformity
Maximum thicknesses of sand beds reported for modern tsunami deposits are about 1 m
(Bourgeois and Reinhart, 1989; Goff et al., 1998); however, most are < 25 cm thick (Wright and
Mella, 1963; Nishimura and Miyaji, 1995; Sato et al., 1995; Minoura et al., 1997; Bourgeois et
al., 1999; Nanayama et al., 2000; Gelfenbaum and Jaffe, 2003; Jaffe et al., 2003; Tuttle et al.,
2004). Sand deposits from a single extreme storm may be as much as 1.5 to 2 m thick and they
are commonly > 30 cm thick (see summary in Morton and Sallenger, 2003). Storm deposits tend
to be thick because overwash durations are long, transport distances are short, flow depths are
low, sediment concentrations are high, and repeated sediment transport under waves replenishes
sand supply during overwash. Narrow, thick, lens-shaped deposits (terraces) that merge with the
back beach are uncommon in tsunamis and may be diagnostic of storms. Both storm and tsunami
deposits can be broad and thin, but this geometry is more common for tsunami deposits (Wright
and Mella, 1963; Nishimura and Miyaji, 1995; Shi et al., 1995; Gelfenbaum and Jaffe, 2003)
because inundation duration is short, sediment is dispersed across relatively deep flow,
inundation distances are typically great, and volume of entrained sediment is limited by the brief
onshore flow. The greater flow depths and intensities of tsunamis allow for greater particle-size
segregation and dispersion of suspended sediments higher above the bed, whereas the elevation
ACC
EPTE
D M
ANU
SCR
IPT
ACCEPTED MANUSCRIPT
21
of high concentrations of suspended sediment in turbulent storm overwash flow typically is not
far above the bed.
Both tsunami and storm deposits vary in thickness alongshore and across shore, but tsunami
deposits tend to conform to the antecedent topography, forming a thin drape over the previous
land surface (Fig. 15 and Gelfenbaum and Jaffe, 2003; Goff et al., 2004) but responding to local
microtopography by filling in the minor depressions (Nishimura and Miyaji, 1995; Bourgeois et
al., 1999; Gelfenbaum and Jaffe, 2003). Storm deposits, on the other hand, tend to fill in lows of
the antecedent macrotopography, and they aggrade to a surface of relatively uniform elevation
alongshore, which is controlled by floodwater depth (Morton and Paine, 1985).
The zone of erosion or sediment bypassing constructed by tsunamis (Shi et al., 1995;
Gelfenbaum and Jaffe, 2003; Jaffe et al., 2003) typically extends farther inland from the beach
than those constructed by storm waves, because the wave height and concomitant sediment
entrainment capacity are greater for tsunamis immediately landward of the beach. Most storm
overwash deposits merge with and are extensions of the back beach, or start at the back beach
erosional scarp (Morton and Paine, 1985; Morton and Sallenger, 2003). Exceptions are broad
storm-constructed erosion zones where flow was greatly augmented by high wind stress
(Morton, 1979).
4.2.2 Deposit elevation
The basal elevation of tsunami and storm deposits can either increase or decrease landward
depending on local topography. However, tsunami deposits, because of their physiographic
setting and great inland penetration, tend to occupy higher elevations inland from the shore (Figs.
3 and 6 and Sato et al., 1995; Shi et al., 1995; Jaffe et al., 2003; Goff et al., 2004; Tuttle et al.,
2004), whereas storm deposits typically occupy lower elevations landward (Fig. 13 and Morton,
1978). Maximum elevations for tsunami deposits can easily exceed the 2 to 3 m maximum
elevations above sea level of storm deposits. The height of individual tsunamis produces runup
that is able to traverse even higher elevations landward. In contrast, increased elevations and
friction greatly reduce the inland extent of storm waves and their ability to transport and deposit
sediments at higher elevations.
ACC
EPTE
D M
ANU
SCR
IPT
ACCEPTED MANUSCRIPT
22
4.3 Sub-regional scale criteria
The only sub-regional scale criteria considered potentially diagnostic for comparison are the
inland inundation distance and associated limit of sand deposition (Fig. 1, Table 3). Inundation
distance of oceanic flooding by tsunamis and storms depends on land elevation and slope,
surface roughness (including interference from vegetation and buildings), and temporary or
sustained height of the ocean. The energy in a tsunami is capable of driving water inland from
several hundred meters to several kilometers where the coastal-plain topography is relatively flat
(Wright and Mella, 1963; Minoura et al., 1997; Bourgeois et al., 1999; Gelfenbaum and Jaffe,
2003). Consequently, inland sediment-transport distances for tsunamis can exceed 300 m
(Wright and Mella, 1963; Sato et al., 1995; Minoura et al., 1997; Gelfenbaum and Jaffe, 2003).
In contrast, prolonged flooding associated with storm surges can drive saltwater more than 15
km inland of the shore (Table 3), but sediment deposition from the ocean is typically restricted to
a zone a few hundred meters from the shore (Figs. 1 and 12 and summary in Morton and
Sallenger, 2003). The kilometer-scale sediment-transport distances associated with storm-incised
channels (Fig. 1) are rare and not representative of typical storm deposits.
Modern tsunami deposits have been observed far inland from the open ocean (Wright and
Mella, 1963). They are preferentially preserved in sheltered settings protected from waves
(wetlands and lakes) and across open-water bodies such as estuaries and lagoons. Maximum
inland distances reported for tsunami deposits up river valleys (Wright and Mella, 1963) also are
greater than comparable sediment-transport distances recorded for storms because storms
typically do not transport beach sand up river valleys.
5. Conclusions
Although the number of modern tsunami and storm deposits examined in detail is limited,
there appears to be enough convergent data to describe an idealized deposit (Fig. 16) based on a
number of sedimentological and morphological characteristics. The physical attributes that
strongly favor a tsunami origin are: a relatively thin (ave. < 25 cm) bed composed of normally
graded sand consisting of a single structureless bed or a bed with only a few thin layers.
Additional attributes that strongly favor tsunami deposits are the presence of internal mud

ACC
EPTE
D M
ANU
SCR
IPT
ACCEPTED MANUSCRIPT
23
laminae or intraclasts near the base composed of the underlying cohesive sediments. Tsunami
deposits generally conform to the landscape like a drape and they typically gain elevation
landward. At some sites, deposit elevation may be diagnostic or complementary if it is near the
upper range or exceeds the expected elevation of storm deposits. Any internal directional
indicator of offshore flow during bed aggradation would be diagnostic of a tsunami deposit.
Tsunami deposits tend to thicken and then thin landward, and maximum deposit thickness
typically is located more than 50 m inland from the beach because there commonly is a zone of
erosion near the beach.
The physical attributes that strongly favor a storm origin are: a moderately thick (ave. > 30
cm) sand bed composed of numerous subhorizontal planar laminations organized into multiple
laminasets. Maximum bed thickness is near the shore, and landward thinning of the deposit is
commonly abrupt. Features that favor storm deposits are the types of stratification associated
with bed-load transport (foresets, climbing ripples, backsets), numerous thin (mm to a few cm)
laminasets of alternating coarse and fine textures indicative of high-frequency waves. Abundant
shell fragments organized in laminations also favor a storm origin. Storm deposits fill in
topographic lows, and the upper surface is relatively uniform in elevation alongshore.
A single observation site probably is inadequate for distinguishing between a paleo-tsunami or
paleo-storm deposit considering their numerous similarities and lack of unequivocal diagnostic
criteria that would likely be preserved at any single site. Therefore multiple sample sites and a
quasi-three-dimensional reconstruction of the sedimentary deposit in question would be
necessary to evaluate the origin of a paleo-event deposit adequately. At many locations, the most
reliable means to differentiate tsunami and storm deposits may be the context within which the
deposit is found. For example, sandy deposits associated with liquefaction structures or with co-
seismic subsidence features, such as buried soils or drowned forests, or moderately wide
sediment bypass zones, such as coastal water bodies, strongly favor a tsunami origin.
Many sandy paleo-tsunami deposits are encased in muddy estuarine, lagoonal, or marsh
sediments (Atwater, 1987). The stark contrast in depositional energy between the anomalous
emplaced sand and background mud makes them relatively easy to recognize. The intentional
search for paleo-tsunami deposits in environments sheltered from open-coast waves offers
advantages for recognition and preservation, but it may adversely bias some of the observed
physical attributes, such as deposit thickness and lateral extent. Open-coast settings may be
ACC
EPTE
D M
ANU
SCR
IPT
ACCEPTED MANUSCRIPT
24
preferred exploration sites for paleo-storm and paleo-tsunami deposits. Overwash deposition by
either process tends to be repeated at open-ocean sites because regional geologic setting and
local morphology make the sites vulnerable to flooding from elevated waves. At these sites,
overwash deposits are amalgamated sequences of sand beds, each exhibiting the characteristics
of a storm or a tsunami deposit. Consequently, it may be difficult to distinguish individual event
deposits without preservation of intervening paleosols.
Trench-scale differences between tsunami and storm deposits have been described, but there is
still a need for additional comparisons that will expand the sample database and improve the
probabilistic quantification of individual criteria at any site. Moreover, there is a compelling
need for research that would allow accurate derivation of hydrodynamic conditions from the
sediment textures and stratification.
In this paper, we emphasized the use of physical attributes to differentiate between tsunami-
emplaced and storm-emplaced sand deposits. Other studies have favored the use of microfossil
assemblages, pollen, and geochemical signatures as evidence for marine inundation and onshore
sediment transport caused by tsunamis (Dawson et al. 1996; Goff et al., 1998; Tuttle et al., 2004)
and storms (Collins et al., 1999; Haslett et al., 2000). Perhaps combining complementary
physical, paleontological, and chemical data will someday allow unequivocal differentiation of
tsunami and storm deposits.
Acknowledgements
We are grateful to Laura Landerman and Gary Schneider for conducting the textural analyses,
Kristy Guy for preparing the North Carolina Hurricane Isabel data, Betsy Boynton for preparing
the final figures, and Bob Peters for helping analyze the Perú data and for discussing tsunami
sedimentation. We also benefited from discussions with Bruce Richmond about storm and
tsunami deposits. James Ebert and Courtney Schuup of the National Park Service provided
assistance by respectively granting permission to study storm deposits within the Cape Hatteras
National Seashore and examining the storm deposits at Assateague Island. We also thank James
Goff, Andrew Short, David Rubin, and David Smith for their reviews and constructive
comments.

ACC
EPTE
D M
ANU
SCR
IPT
ACCEPTED MANUSCRIPT
25
References
Atwater, B.F., 1987. Evidence of great Holocene earthquakes along the outer coast of Washington state. Science. 236, 942-944. Atwater, B.F., and Hemphill-Haley, E., 1996. Preliminary estimates of tsunami recurrence intervals for great earthquakes of the past 3500 years at Northeastern Willapa Bay, Washington. U.S. Geological Survey Open-File Report 96-001. Barwis, J.H. and Hayes, M.O., 1985, Antidunes on modern and ancient washover fans. Jour. Sed. Petrology. 55, 907-916. Bourgeois, J., and Minoura, K., 1997. Paleotsunami studies - Contribution to mitigation and risk assessment. In: V. K. Gusiakov (Ed.) Tsunami Mitigation and Risk Assessment, p. 1-4. Bourgeois, J., and Reinhart, M.A., 1989. Onshore erosion and deposition by the 1960 tsunami at the Rio Lingue estuary, South-central Chile. Abst. EOS. 70, 1331. Bourgeois, J., Petroff, C., Yeh, H., Titov, V., Synolakis, D.E., Benson, B., Kuroiwa, J., Lander, J., and Norabueuna, E., 1999. Geologic setting, field survey and modeling of the Chimbote, Northern Perú tsunami of 21 February 1996. Pure and Applied Geophysics. 154, 513-540. Bryant, E.A., 2001. Tsunami. The underrated hazard. Cambridge University Press, Cambridge. Campbell, C.V., 1967. Lamina, laminaset, bed, and bedset. Sedimentology. 8, 7-26. Collins, E.S., Scott, D.B., and Gayes, P.T., 1999, Hurricane record on the South Carolina coast: Can they be detected in the sediment record? Quaternary International, 56, 15-26. Davies, H., 1999. Tsunami, PNG, 1998. University of Papua New Guinea Press, Port Moresby, 49p. Dawson, A.G., and Shi, S., 2000. Tsunami deposits. Pure and Applied Geophysics. 157, 875-897. Dawson, A., Shi, S., Dawson, S., Takahashi, T., and Shuto, N., 1996. Coastal sedimentation associated with the June 2nd and 3rd 1994 tsunami in Rajegwesi, Java. Quat. Sci. Rev. 15, 901-912. Dawson, S., Smith, D.E., Ruffman, A., and Shi, S., 1996. The diatom biostratigraphy of tsunami sediments: Examples from recent and middle Holocene events. Physics and Chemistry of the Earth. 21, 87-92
ACC
EPTE
D M
ANU
SCR
IPT
ACCEPTED MANUSCRIPT
26
Dengler, L.D., Borrero, J., Gelfenbaum, G. Jaffe, B., Okal, E., Ortiz, M., and Titov, V, 2003. Tsunami. In: Rogriquez-Marek, A., and Edwards, C. (Eds.), Southern Perú Earthquake of 23 June 2001 Reconnaissance Report. Earthquake Spectra. 19, 115-144. Donnelly, J.P., Bryant, S.S., Butler, J., Dowling, J., Fan, L., Hausmann, N., Newby, P., Shuman, B., Stern, J., Westover, K., and Web, T., 2001. 700 yr sedimentary record of intense hurricane landfalls in southern New England. Geological Society of America Bulletin. 113, 714-727. Fisher, J.S., Leatherman, S.P., and Perry, F.C., 1974. Overwash processes on Assateague Island. Proc. 14th Intl. Coastal Eng. Conf. Copenhagen, 1194-1212. Foster, I.D., Albon, A.J., Bardell, K.M., Fletcher, J.L., Jardine, T.C., Mothers, R.J., Pritchard, M.A., and Truner, S.E., 1991. High energy coastal sedimentary deposits; an evaluation of depositional processes in southwest England. Earth Surface Processes and Landforms. 16, 341-356. Geist, E.L. 2000. Origin of the 17 July 1998 Papua New Guinea tsunami: Earthquake or landslide? Seismological Research Letters. 71, 344-351.
Gelfenbaum, G., and Jaffe, B., 2003. Erosion and sedimentation from the 17 July 1998 Papua New Guinea tsunami. Pure and Applied Geophysics. 160, 1969-1999. Goff, J., Crozier, M., Sutherland, V., Cochran, U., and Shane, P., 1998. Possible tsunami deposits from the 1855 earthquake, North Island, New Zealand. Geol. Soc. London Spec. Pub. 133, 353-374. Goff, J., McFadgen, B.G., and Chague-Goff, C., 2004. Sedimentary differences between the 2002 Easter storm and the 15th-century Okoropunga tsunami, southeastern North Island, New Zealand. Marine Geol. 204, 235-250. Goff, J., Dudley, W.C., de Maintenon, M.J., Cain, G., Coney, J.P., 2006. The largest local tsunami in 20th century Hawaii. Marine Geol. 226, 65-79. Haslett, S.K., Bryant, E.A., and Curr, R.H.F., 2000. Tracing beach sand provenance and transport using foraminifera: Examples from NW Europe and SE Australia. In: Foster, I. (Ed.), Tracers in Geomorphology. Wiley, Chichester, 437-452. Hayes, M.O., 1967. Hurricanes as geological agents - case studies of Hurricanes Carla, 1961, and Cindy, 1963. The University of Texas, Austin, Bureau of Economic Geology Report of Investigation 61. Hayne, M., and Chappell, J., 2001. Cyclone frequency during the last 5000 years at Cuacoa Island, north Queensland, Australia. Palaeogeography, Palaeoclimatology, Palaeoecology, 168, 207-219. Holland, K.T., Holman, R.A., and Sallenger, A.H., 1991. Estimation of overwash bore velocities using video techniques. Proc. Coastal Sediments ’91, 489-497.
ACC
EPTE
D M
ANU
SCR
IPT
ACCEPTED MANUSCRIPT
27
Hutchinson, I., Clague, J.C., and Mathewes, R.W., 1997. Reconstructing the tsunami record on an emerging coast: a case study of Kanim Lake, Vancouver Island, British Columbia, Canada. Jour. Coastal Res. 13, 545-553. Jaffe, B., and Gelfenbaum, G., 2002. Using tsunami deposits to improve assessment of tsunami risk. Solutions to Coastal Disasters ’02 Conference Proc., 836-847. Jaffe, B., and Gelfenbaum, G., in press. A simple model for calculating tsunami flow speed from tsunami deposits. Sed. Geology Special Issue, this volume. Jaffe, B., Gelfenbaum, G., Rubin, D., Peters, R., Anima, R., Swensson, M., Olcese, D., Bernales L., Gomez, J., and Riega, P., 2003. Tsunami deposits: Identification and interpretation of tsunami deposits from the June 23, 2001 Perú tsunami. Proc. Coastal Sediments ‘03, 13p. Jones, B., and Hunter, I.G., 1992. Very large boulders on the coast of Grand Caymans coastlines. Jour. Coastal Res. 8, 763-774. Kawata, Y., Benson, B., Borrero, J. Davies, H., de Lange, W., Imamura, F., Letz, H., Nott, J., and Synolakis, C.E., 1999. Tsunami in Papua New Guinea not as intense as first thought. EOS, Trans. Am. Geophys. U. 80, 101-105.
Kortekaas, S., 2002. Tsunamis, storms, and earthquakes: Distinguishing coastal flooding events. Unpub. Dissert. Coventry University. Leatherman, S.P., 1977. Overwash hydraulics and sediment transport. Am. Soc. Civil Eng., Coastal Sediments 77. 135-148. Leatherman, S.P., and Williams, A.T., 1983. Vertical sedimentation units in a barrier island washover fan. Earth Surface Processes and Land Forms. 8, 141-150. Liu, K.B. and Fearn, M.L., 2000. Reconstruction of prehistoric landfall frequencies of catastrophic hurricanes in northwestern Florida from lake sediment records. Quaternary Research. 54, 238-245. Liu, P. L.-F., Lynett, P., Fernando, H., Jaffe, B., Fritz, H., Higman, B., Morton, R., Goff, J., and Synolakis, C., 2005. Observations by the international tsunami team in Sri Lanka. Science, 308, 1595. Matsuyama, M., Walsh, J.P., and Yeh, H., 1999. The effect of bathymetry on tsunami characteristics at Sissano Lagoon, Papua New Guinea. Geophysical Research Letters. 26, 3513-3516.

ACC
EPTE
D M
ANU
SCR
IPT
ACCEPTED MANUSCRIPT
28
McMurtry, G. M., Fryer, G. J., Tappin, D. R., Wilkinson, I. P., Williams, M., Fietzke, J., Garbe-Schoenberg, D., and Watts, P., 2004, Megatsunami deposits on Kohala Volcano, Hawaii, from flank collapse of Mauna Loa. Geology, 32, 741-744.
McSaveney, M.J., Goff, J.R., Darby, D.J., Goldsmith, P., Barnett, A., Elliott, S., and Nongkas, M., 2000. The 17 July 1998 tsunami, Papua New Guinea: Evidence and initial interpretation. Marine Geol. 170, 81-92. Minoura, K., Imamura, F., Takahashi, T., and Shuto, N., 1997, Sequence of sedimentation processes caused by the 1992 Flores tsunami: Evidence from Babi Island. Geology. 25, 523-526. Morton, R.A., 1978. Large-scale rhomboid bed forms and sedimentary structures associated with hurricane washover. Sedimentology. 25, 183–204. Morton, R.A., 1979. Subaerial storm deposits formed on barrier flats by wind-driven currents. Sed. Geology. 24, 105–122. Morton, R. A., 1988, Nearshore responses to great storms. In: Clifton, H.E. (Ed.), Sedimentologic consequences of convulsive geologic events. Geol. Soc. America Spec. Paper 229, 7-22. Morton, R.A., 2002. Factors controlling storm impacts on coastal barriers and beaches - A preliminary basis for real-time forecasting. Jour. Coastal Res. 18, 486-501. Morton, R.A., and Paine, J.G., 1985. Beach and vegetation-line changes at Galveston Island, Texas. Erosion, deposition, and recovery from Hurricane Alicia. The University of Texas at Austin, Bureau of Economic Geology Geological Circular 85-5. Morton, R.A., and Sallenger, A.H., 2003. Morphological impacts of extreme storms on sandy beaches and barriers. Jour. Coastal Res. 19, 560-573. Morton, R.A., Guy, K.K., Hill, H.W., and Pascoe, T., 2003, Regional morphological responses to the March 1962 Ash Wednesday storm. Proc. Coastal Sediments ’03, 11p. Nanayama, F., Shigeno, K., Satake, K., Shimokawa, K., Koitabashi, S., Miyasaka, S., and Ishii, M., 2000. Sedimentary differences between the 1993 Hokkaido-nansei-oki tsunami and the 1959 Miyakojima typhoon at Taisei, southwestern Hokkaido, northern Japan. Sed. Geol. 135, 255-264. Nichol, S.L., Lian, O.B., and Carter, C.H., 2002. Sheet-gravel evidence for a late Holocene tsunami run-up on beach dunes, Great Barrier Island, New Zealand. Sed. Geol. 155, 129-145. Nishimura, Y., and Miyaji, N., 1995. Tsunami deposits from the 1993 southwest Hokkaido earthquake and the 1640 Hokkaido eruption, northern Japan. Pure and Applied Geophysics 144, 719-733.

ACC
EPTE
D M
ANU
SCR
IPT
ACCEPTED MANUSCRIPT
29
Noormets, R., Felton, E.A., and Crook, K.A.W., 2002. Sedimentology of rocky shorelines: 2. Shoreline megaclasts on the north shore of Oahu, Hawaii – origins and history. Sed. Geol. 150, 31-45. Okal, E., Dengler, L., Araya, S, Borrero, J., Gomer, B., Koshimura, S., Laos, G., Oclese, D., Ortiz, M., Swensson, M., Titov, V., and Vegas, F., 2002. Field survey of the Camaná, Perú tsunami of June 23, 2001. Seismological Research Letters. 73, 907-920. Rasheed, K.A.A., Das, V.K., Revichandran, C., Vijayan, P.R., and Thottam, T.J., 2006. Tsunami impacts on morphology of beaches along south Kerala coast, west coast of India. Science of Tsunami Hazards, 24, 24-34. Sato, H., Shimamoto, T., Tsutsumi, A., and Kawamoto, E., 1995, Onshore tsunami deposits caused by the 1993 southwest Hokkaido and 1983 Japan Sea earthquakes. Pure and Applied Geophysics. 144, 693-717. Sedgwick, P.E., and Davis, R.A., 2003. Stratigraphy of washover deposits in Florida: Implications for recognition in the stratigraphic record. Marine Geol. 200, 31-48. Schwartz, R.K., 1975. Nature and genesis of some storm washover deposits. U.S. Army Corps of Engineers, Coastal Engineering Research Center Technical Memorandum No. 61, Ft. Belvoir, VA. Shi, S., Dawson, A.G., and Smith, D.E., 1995. Coastal sedimentation associated with the December 12th, 1992 tsunami in Flores, Indonesia. Pure and Applied Geophysics 144, 526-536. Tanioka, Y., 1999. Analysis of the far-field tsunamis generated by the 1998 Papua New Guinea earthquake. Geophysical Research Letters. 26, p. 3393-3396. Tappin, D.R., Watts, P., McMurtry, G.M., Lafoy, Y., and Matsumoto, T., 2001. The Sissano, Papua New Guinea tsunami of July 1998 - Offshore evidence on the source mechanism. Marine Geol. 175, 1-23. Tilling, R.I., Koyanagi, R.Y., Lipman, P.W., Lockwood, J.P., Moore, J.G., and Swanson, D.A., 1976. Earthquake and related catastrophic events, Island of Hawaii November 29, 1975. U.S. Geological Survey Circular 740. Titov, V.V., and Synolakis, C.E., 1997. Extreme inundation flows during the Hokkaido-Nansei-Oki tsunami. Geophysical Research Letters, 24, 1315-1318. Titov, V.V., Jaffe, B.E., Gonzalez, F.I., and Gelfenbaum, G. 2001. Re-evaluating source mechanisms for the 1998 Papua New Guinea tsunami using revised slump estimates and sedimentation modeling. Proceedings International Tsunami Symposium, 2001, 389-396.
ACC
EPTE
D M
ANU
SCR
IPT
ACCEPTED MANUSCRIPT
30
Tuttle, M.P., Ruffman, A., Anderson, T., and Hewitt, J., 2004. Distinguishing tsunami from storm deposits in eastern North America. The 1929 Grand Banks tsunami versus the 1991 Halloween storm. Seismological Research Letters. 75, 117-131. U.S. Army Corps of Engineers, 1962. Report on Hurricane Carla, 9-12 September 1961. Galveston District Corps of Engineers, Galveston. U.S. Army Corps of Engineers, 2004. http://www.frf.usace.army.mil/ Wright, C, and Mella, A., 1963. Modifications to the soil pattern of South-central Chile resulting from seismic and associated phenomena during the period May to August 1960. Bulletin Seismological Society of America. 53, 1367-1402.
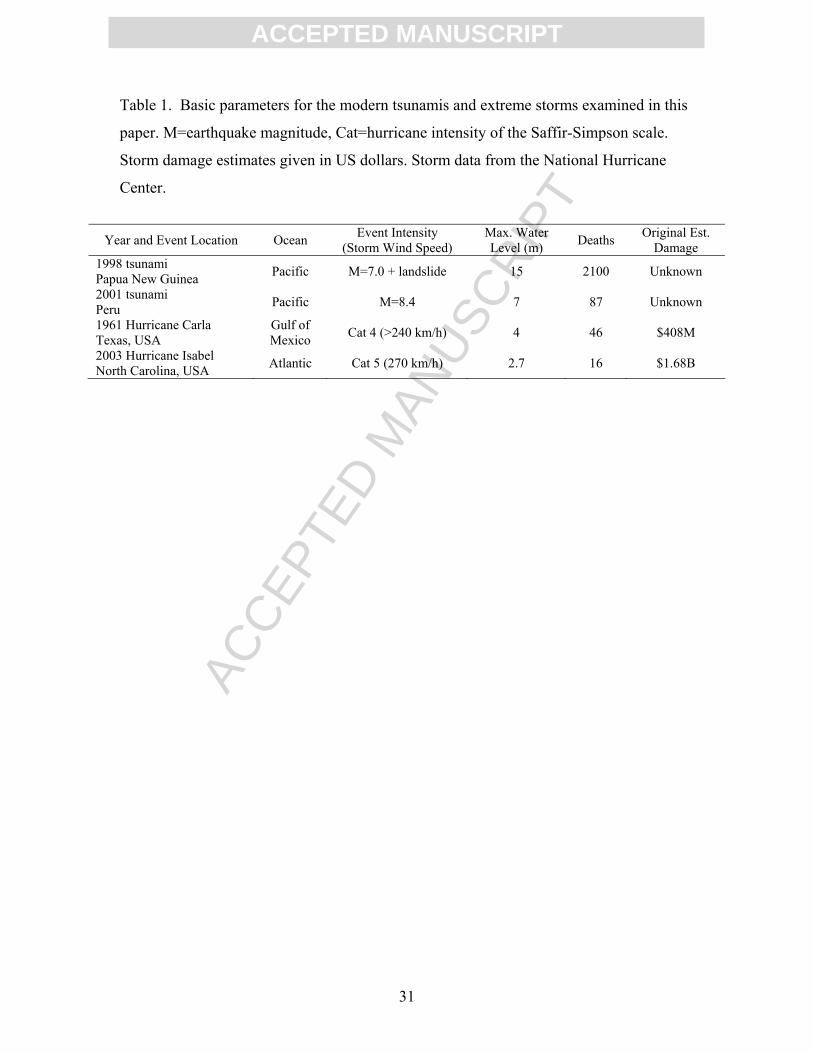
ACC
EPTE
D M
ANU
SCR
IPT
ACCEPTED MANUSCRIPT
31
Table 1. Basic parameters for the modern tsunamis and extreme storms examined in this
paper. M=earthquake magnitude, Cat=hurricane intensity of the Saffir-Simpson scale.
Storm damage estimates given in US dollars. Storm data from the National Hurricane
Center.
Year and Event Location Ocean Event Intensity
(Storm Wind Speed) Max. Water Level (m) Deaths Original Est.
Damage 1998 tsunami Papua New Guinea Pacific M=7.0 + landslide 15 2100 Unknown
2001 tsunami Peru Pacific M=8.4 7 87 Unknown
1961 Hurricane Carla Texas, USA
Gulf of Mexico Cat 4 (>240 km/h) 4 46 $408M
2003 Hurricane Isabel North Carolina, USA Atlantic Cat 5 (270 km/h) 2.7 16 $1.68B
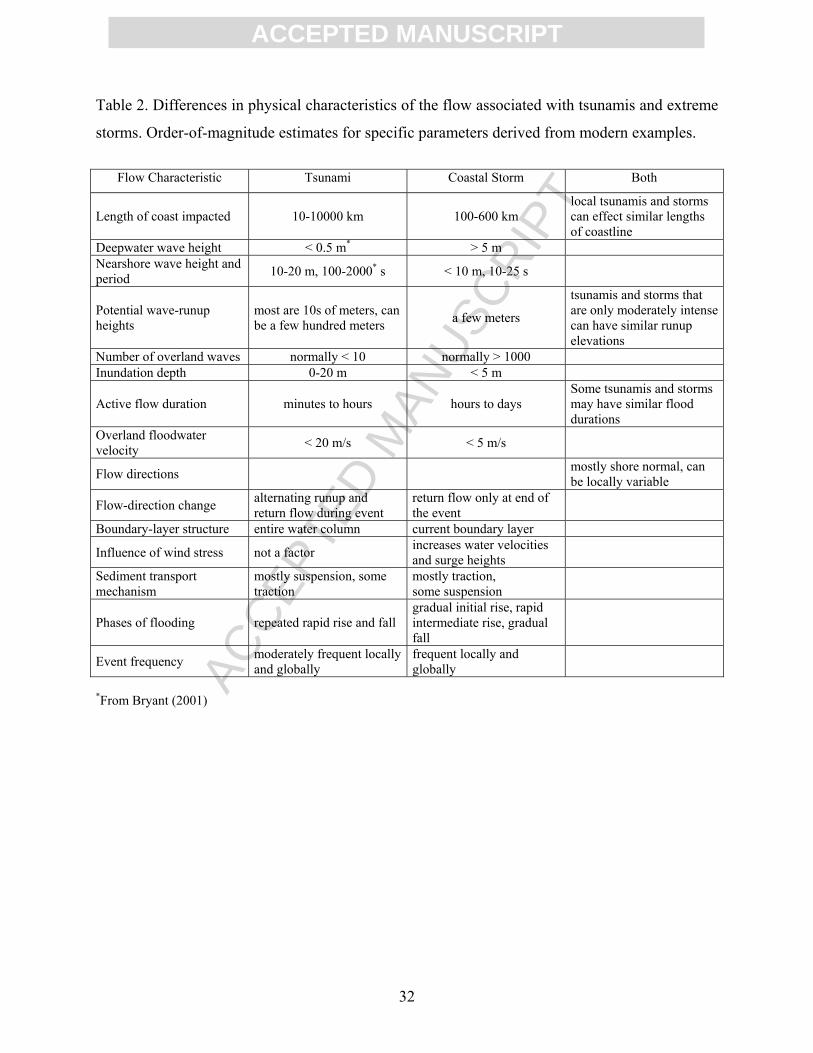
ACC
EPTE
D M
ANU
SCR
IPT
ACCEPTED MANUSCRIPT
32
Table 2. Differences in physical characteristics of the flow associated with tsunamis and extreme
storms. Order-of-magnitude estimates for specific parameters derived from modern examples.
Flow Characteristic Tsunami Coastal Storm Both
Length of coast impacted 10-10000 km 100-600 km local tsunamis and storms can effect similar lengths of coastline
Deepwater wave height < 0.5 m* > 5 m Nearshore wave height and period 10-20 m, 100-2000* s < 10 m, 10-25 s
Potential wave-runup heights
most are 10s of meters, can be a few hundred meters a few meters
tsunamis and storms that are only moderately intense can have similar runup elevations
Number of overland waves normally < 10 normally > 1000 Inundation depth 0-20 m < 5 m
Active flow duration minutes to hours hours to days Some tsunamis and storms may have similar flood durations
Overland floodwater velocity < 20 m/s < 5 m/s
Flow directions mostly shore normal, can be locally variable
Flow-direction change alternating runup and return flow during event
return flow only at end of the event
Boundary-layer structure entire water column current boundary layer
Influence of wind stress not a factor increases water velocities and surge heights
Sediment transport mechanism
mostly suspension, some traction
mostly traction, some suspension
Phases of flooding repeated rapid rise and fall gradual initial rise, rapid intermediate rise, gradual fall
Event frequency moderately frequent locally and globally
frequent locally and globally
*From Bryant (2001)
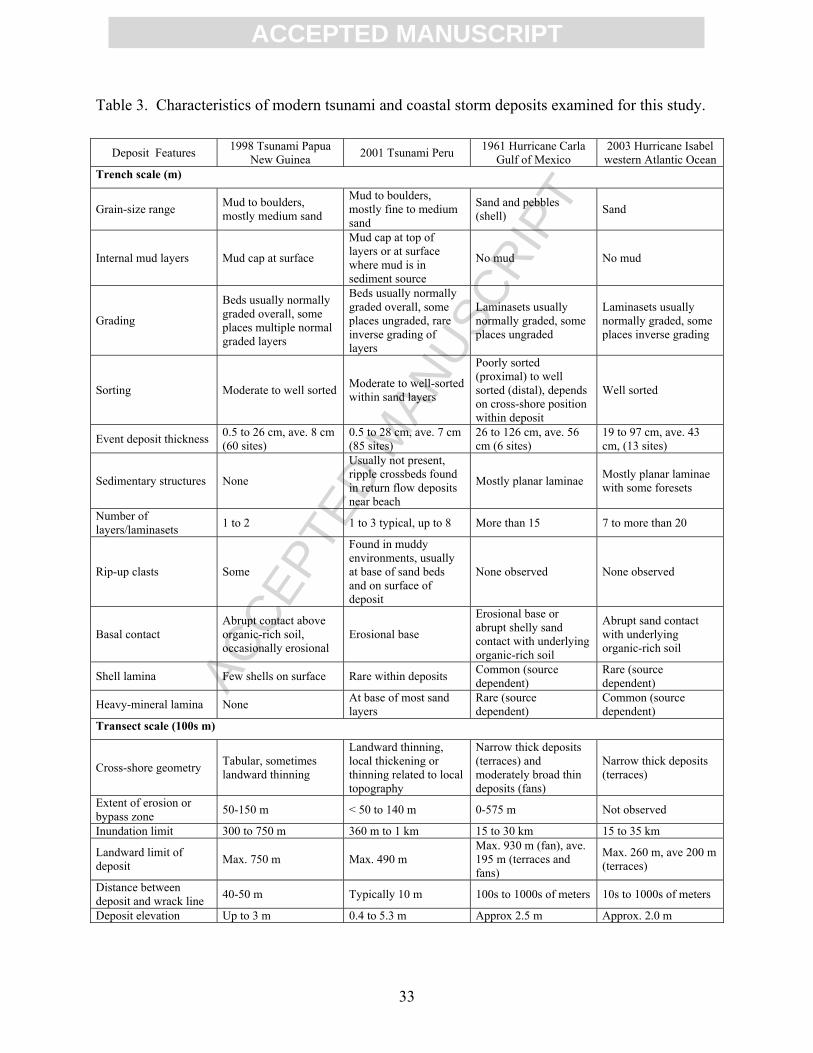
ACC
EPTE
D M
ANU
SCR
IPT
ACCEPTED MANUSCRIPT
33
Table 3. Characteristics of modern tsunami and coastal storm deposits examined for this study.
Deposit Features 1998 Tsunami Papua New Guinea 2001 Tsunami Peru 1961 Hurricane Carla
Gulf of Mexico 2003 Hurricane Isabel western Atlantic Ocean
Trench scale (m)
Grain-size range Mud to boulders, mostly medium sand
Mud to boulders, mostly fine to medium sand
Sand and pebbles (shell) Sand
Internal mud layers Mud cap at surface
Mud cap at top of layers or at surface where mud is in sediment source
No mud No mud
Grading
Beds usually normally graded overall, some places multiple normal graded layers
Beds usually normally graded overall, some places ungraded, rare inverse grading of layers
Laminasets usually normally graded, some places ungraded
Laminasets usually normally graded, some places inverse grading
Sorting Moderate to well sorted Moderate to well-sorted within sand layers
Poorly sorted (proximal) to well sorted (distal), depends on cross-shore position within deposit
Well sorted
Event deposit thickness 0.5 to 26 cm, ave. 8 cm (60 sites)
0.5 to 28 cm, ave. 7 cm (85 sites)
26 to 126 cm, ave. 56 cm (6 sites)
19 to 97 cm, ave. 43 cm, (13 sites)
Sedimentary structures None
Usually not present, ripple crossbeds found in return flow deposits near beach
Mostly planar laminae Mostly planar laminae with some foresets
Number of layers/laminasets 1 to 2 1 to 3 typical, up to 8 More than 15 7 to more than 20
Rip-up clasts Some
Found in muddy environments, usually at base of sand beds and on surface of deposit
None observed None observed
Basal contact Abrupt contact above organic-rich soil, occasionally erosional
Erosional base
Erosional base or abrupt shelly sand contact with underlying organic-rich soil
Abrupt sand contact with underlying organic-rich soil
Shell lamina Few shells on surface Rare within deposits Common (source dependent)
Rare (source dependent)
Heavy-mineral lamina None At base of most sand layers
Rare (source dependent)
Common (source dependent)
Transect scale (100s m)
Cross-shore geometry Tabular, sometimes landward thinning
Landward thinning, local thickening or thinning related to local topography
Narrow thick deposits (terraces) and moderately broad thin deposits (fans)
Narrow thick deposits (terraces)
Extent of erosion or bypass zone 50-150 m < 50 to 140 m 0-575 m Not observed
Inundation limit 300 to 750 m 360 m to 1 km 15 to 30 km 15 to 35 km
Landward limit of deposit Max. 750 m Max. 490 m
Max. 930 m (fan), ave. 195 m (terraces and fans)
Max. 260 m, ave 200 m (terraces)
Distance between deposit and wrack line 40-50 m Typically 10 m 100s to 1000s of meters 10s to 1000s of meters
Deposit elevation Up to 3 m 0.4 to 5.3 m Approx 2.5 m Approx. 2.0 m
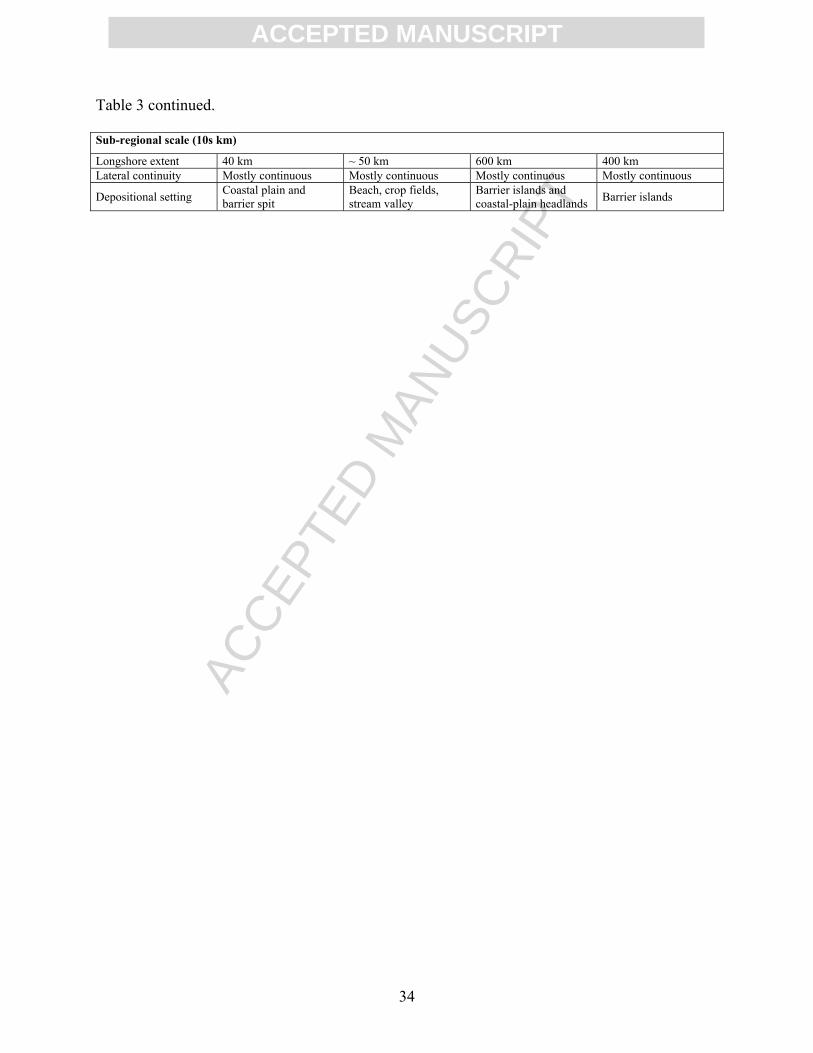
ACC
EPTE
D M
ANU
SCR
IPT
ACCEPTED MANUSCRIPT
34
Table 3 continued. Sub-regional scale (10s km)
Longshore extent 40 km ~ 50 km 600 km 400 km Lateral continuity Mostly continuous Mostly continuous Mostly continuous Mostly continuous
Depositional setting Coastal plain and barrier spit
Beach, crop fields, stream valley
Barrier islands and coastal-plain headlands Barrier islands
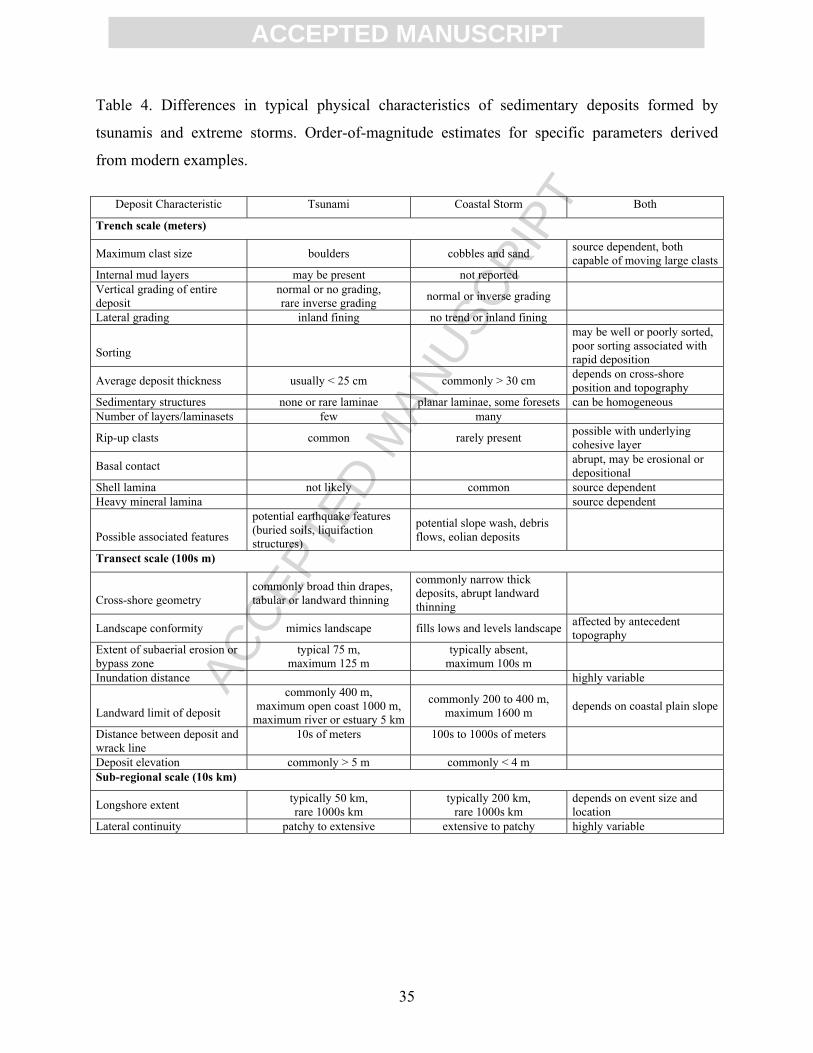
ACC
EPTE
D M
ANU
SCR
IPT
ACCEPTED MANUSCRIPT
35
Table 4. Differences in typical physical characteristics of sedimentary deposits formed by
tsunamis and extreme storms. Order-of-magnitude estimates for specific parameters derived
from modern examples.
Deposit Characteristic Tsunami Coastal Storm Both
Trench scale (meters)
Maximum clast size boulders cobbles and sand source dependent, both capable of moving large clasts
Internal mud layers may be present not reported Vertical grading of entire deposit
normal or no grading, rare inverse grading normal or inverse grading
Lateral grading inland fining no trend or inland fining
Sorting
may be well or poorly sorted, poor sorting associated with rapid deposition
Average deposit thickness usually < 25 cm commonly > 30 cm depends on cross-shore position and topography
Sedimentary structures none or rare laminae planar laminae, some foresets can be homogeneous Number of layers/laminasets few many
Rip-up clasts common rarely present possible with underlying cohesive layer
Basal contact abrupt, may be erosional or depositional
Shell lamina not likely common source dependent Heavy mineral lamina source dependent
Possible associated features
potential earthquake features (buried soils, liquifaction structures)
potential slope wash, debris flows, eolian deposits
Transect scale (100s m)
Cross-shore geometry
commonly broad thin drapes, tabular or landward thinning
commonly narrow thick deposits, abrupt landward thinning
Landscape conformity mimics landscape fills lows and levels landscape affected by antecedent topography
Extent of subaerial erosion or bypass zone
typical 75 m, maximum 125 m
typically absent, maximum 100s m
Inundation distance highly variable
Landward limit of deposit
commonly 400 m, maximum open coast 1000 m,
maximum river or estuary 5 km
commonly 200 to 400 m, maximum 1600 m depends on coastal plain slope
Distance between deposit and wrack line
10s of meters
100s to 1000s of meters
Deposit elevation commonly > 5 m commonly < 4 m Sub-regional scale (10s km)
Longshore extent typically 50 km, rare 1000s km
typically 200 km, rare 1000s km
depends on event size and location
Lateral continuity patchy to extensive extensive to patchy highly variable

ACC
EPTE
D M
ANU
SCR
IPT
ACCEPTED MANUSCRIPT
36
Figure Captions Figure 1. Alongshore variations in inland sediment-transport distances and water levels for selected sandy tsunami and storm deposits. (A) 1998 tsunami Papua New Guinea, (B) 2001 tsunami Perú, (C) 1961 Hurricane Carla, U.S.A. (after Morton and Sallenger, 2003), (D) 2003 Hurricane Isabel, U.S.A. Figure 2. Locations of 1998 tsunami deposit transects in Papua New Guinea. Figure 3. Aerial photograph of tsunami deposit distribution and flow directions at Arop transect, Papua New Guinea. From Gelfenbaum and Jaffe (2003). Figure 4. (A) Topographic profile elevations, (B) tsunami deposit thickness, and (C) grain-size statistics at Arop transect, Papua New Guinea. From Gelfenbaum and Jaffe (2003). Figure 5. (A) Tsunami deposit characteristics and (B) sediment textures at the Arop transect, Papua New Guinea. From Gelfenbaum and Jaffe (2003). Figure 6. Locations of 2001 tsunami deposit transects near Camana, Perú. Figure 7. Tsunami deposit exposure and sediment textures at La Quinta, Perú showing mud layer that separates lower and upper layers. General location shown in Fig. 6. Figure 8. Tsunami deposit thickness with number of layers and topographic profile at Amecosupe, Perú. General location shown in Fig. 6. Figure 9. Locations of 1961 Hurricane Carla deposit transects in Texas, U.S.A. on (A) Matagorda Peninsula and (B) Bolivar Peninsula. Figure 10. Proximal overwash deposits of Hurricane Carla on (A) Bolivar Peninsula, Texas and (B) Matagorda Peninsula, Texas. Deposits were approximately 130 and 60 cm thick, respectively, and consisted of poorly sorted sand and shell. Abrupt basal contacts overlie well-sorted sand of older barrier-island deposits. General locations shown in Fig. 9. Figure 11. Locations of 2003 Hurricane Isabel deposit transects in (A) North Carolina and (B) Virginia, U.S.A. Figure 12. Post-Isabel (Sept. 19) aerial photograph of the Rodanthe, North Carolina site. Topographic changes along transect A-A’ are shown in Figure 13. Aerial photograph courtesy of the National Oceanic and Atmospheric Administration. General location shown in Fig. 11. Figure 13. Pre-Isabel (Sept. 16) and post-Isabel (Sept. 21) lidar topographic profiles at the Rodanthe, North Carolina site showing dune destruction and overwash deposition associated with the hurricane. The pre-storm lidar survey extended inland only about 150 m. Irregular elevations on the post-storm profile between 100- and 150-m distance is likely the result of heavy equipment clearing the road. General location shown in Fig. 11.
ACC
EPTE
D M
ANU
SCR
IPT
ACCEPTED MANUSCRIPT
37
Figure 14. Hurricane Isabel deposit and sediment textures exposed in the ocean-side trench at the Hatteras, North Carolina site. General location shown in Fig. 11. Figure 15. Differences in flow depths, inundation distances, and sediment-transport distances for sand beds deposited by (A) tsunamis and (B) coastal storms. Figure 16. Composite characteristics of typical sandy tsunami and storm deposits.
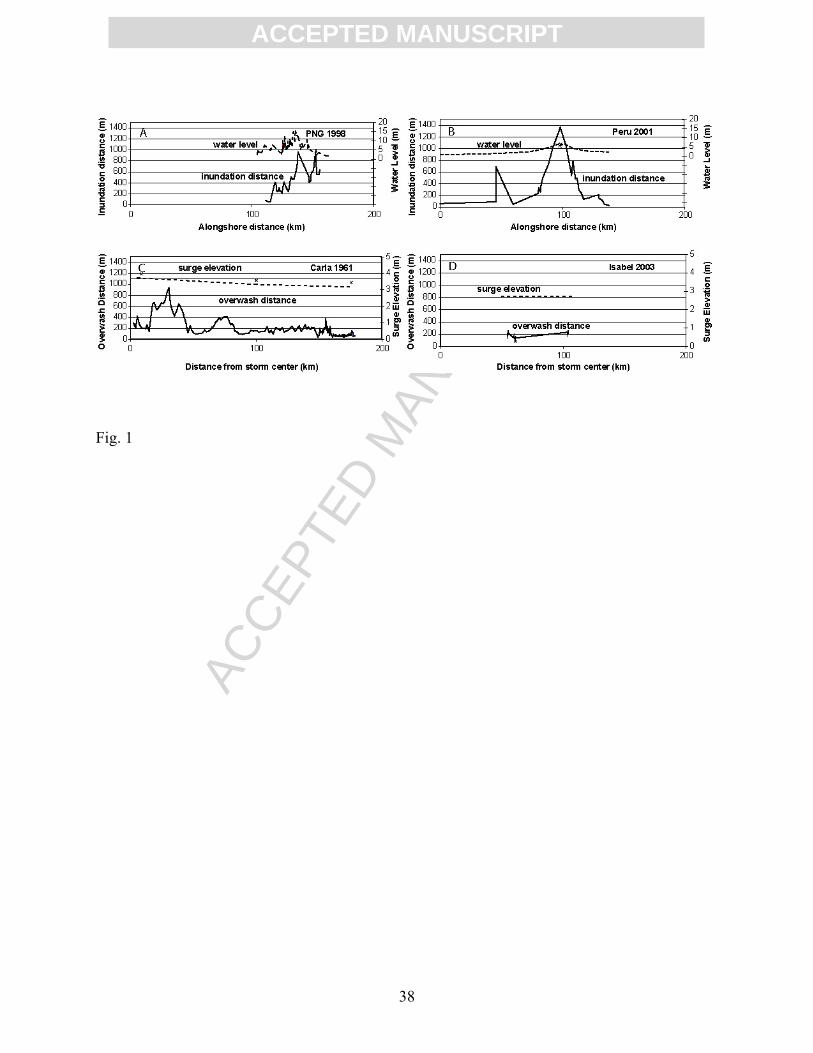
ACC
EPTE
D M
ANU
SCR
IPT
ACCEPTED MANUSCRIPT
38
Fig. 1
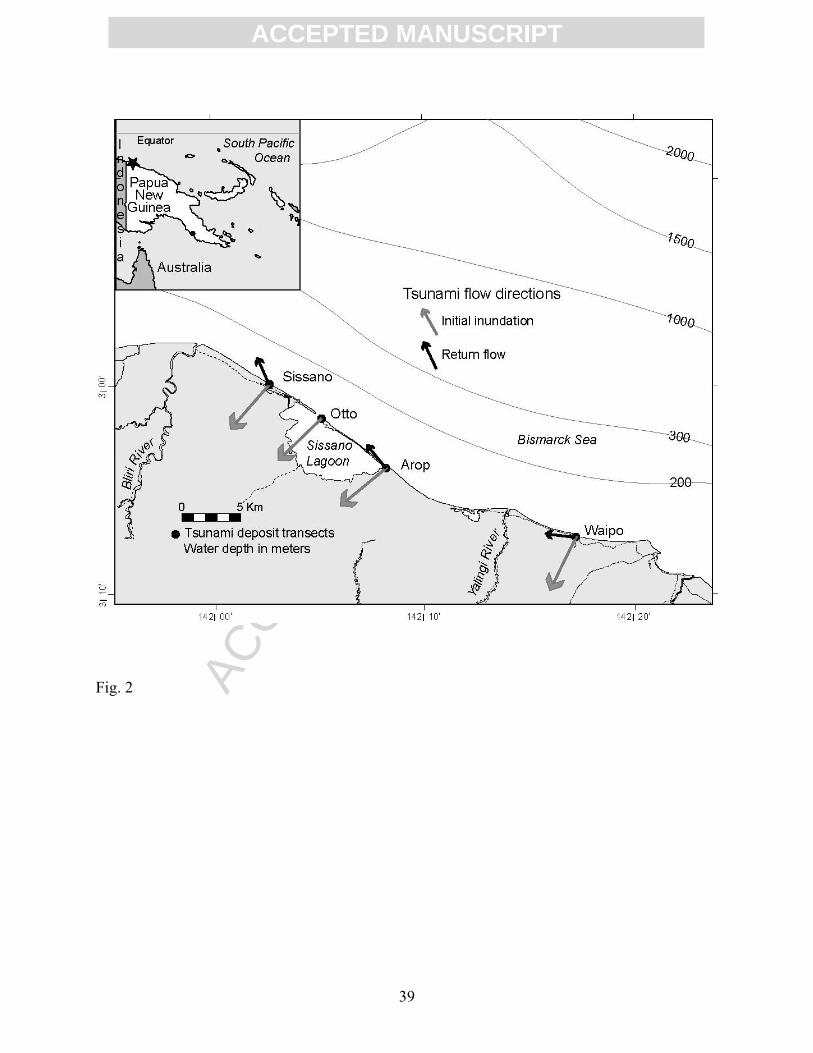
ACC
EPTE
D M
ANU
SCR
IPT
ACCEPTED MANUSCRIPT
39
Fig. 2

ACC
EPTE
D M
ANU
SCR
IPT
ACCEPTED MANUSCRIPT
40
Fig. 3
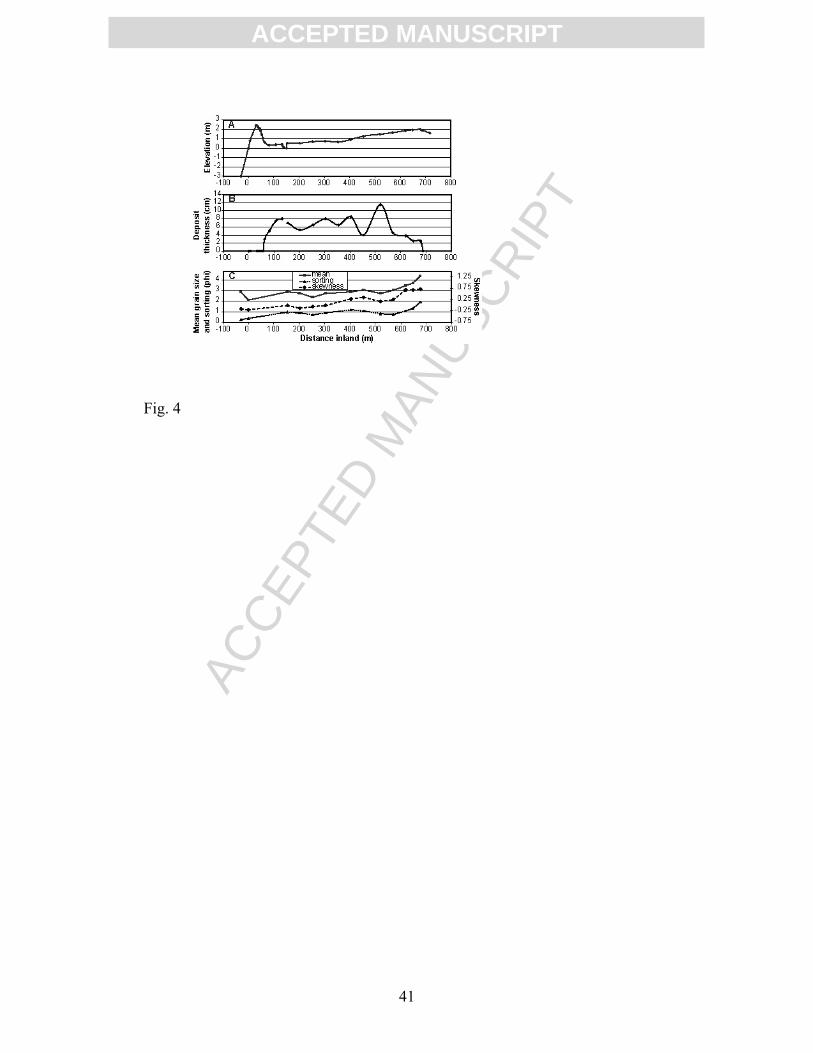
ACC
EPTE
D M
ANU
SCR
IPT
ACCEPTED MANUSCRIPT
41
Fig. 4
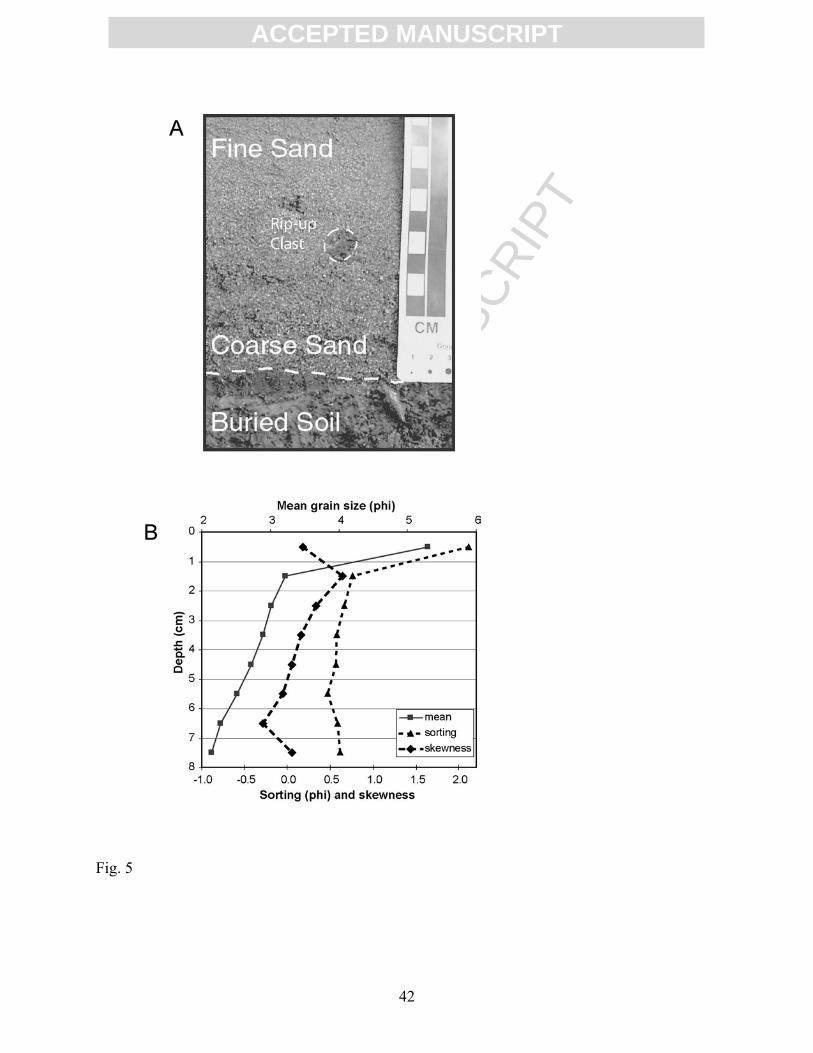
ACC
EPTE
D M
ANU
SCR
IPT
ACCEPTED MANUSCRIPT
42
Fig. 5
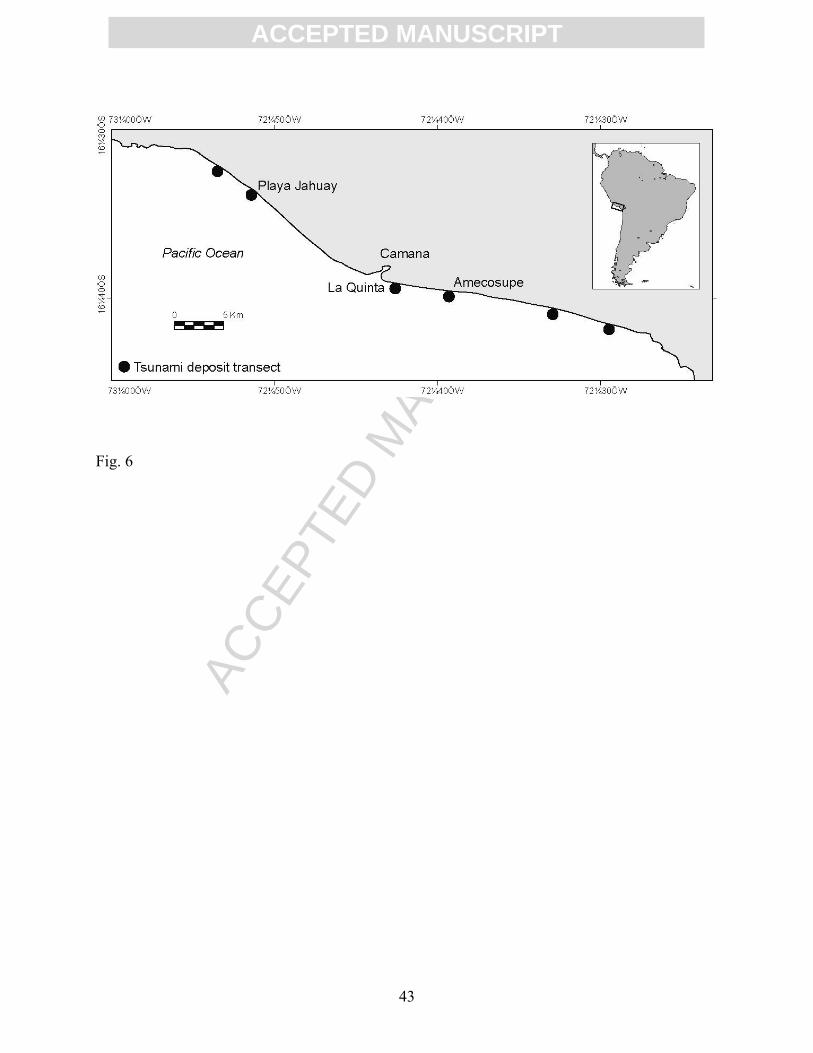
ACC
EPTE
D M
ANU
SCR
IPT
ACCEPTED MANUSCRIPT
43
Fig. 6
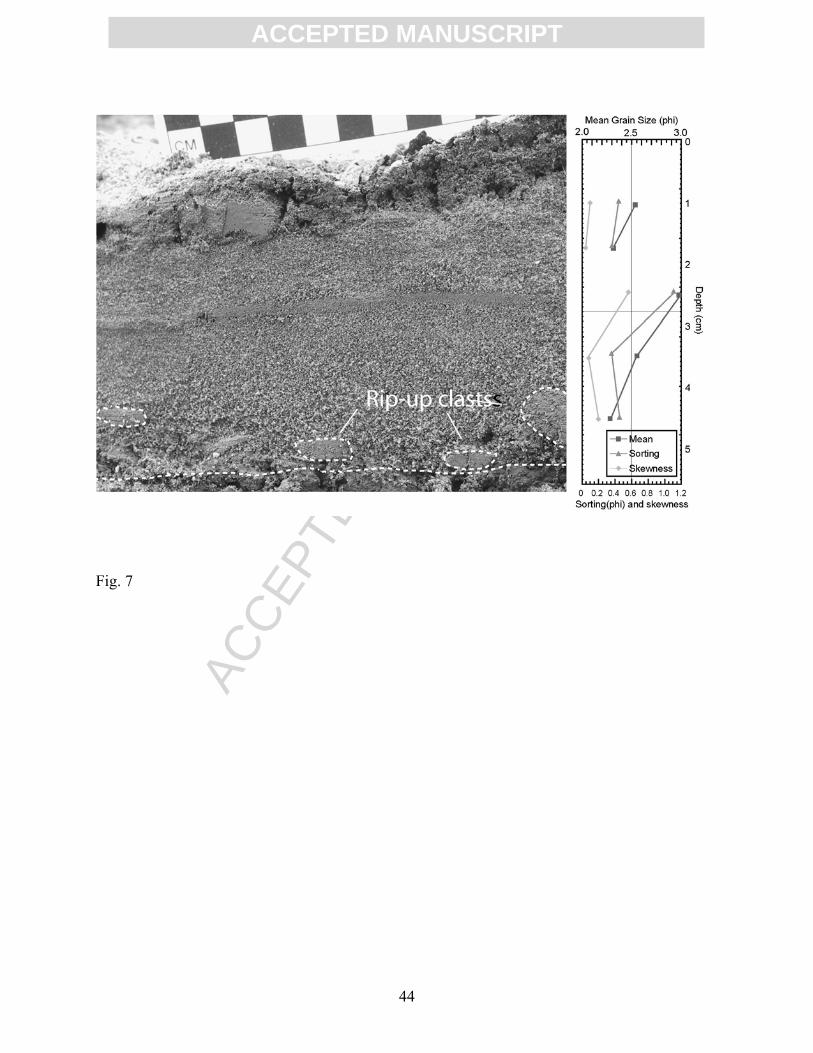
ACC
EPTE
D M
ANU
SCR
IPT
ACCEPTED MANUSCRIPT
44
Fig. 7

ACC
EPTE
D M
ANU
SCR
IPT
ACCEPTED MANUSCRIPT
45
Fig. 8

ACC
EPTE
D M
ANU
SCR
IPT
ACCEPTED MANUSCRIPT
46
Fig. 9

ACC
EPTE
D M
ANU
SCR
IPT
ACCEPTED MANUSCRIPT
47
Fig. 10

ACC
EPTE
D M
ANU
SCR
IPT
ACCEPTED MANUSCRIPT
48
Fig. 11
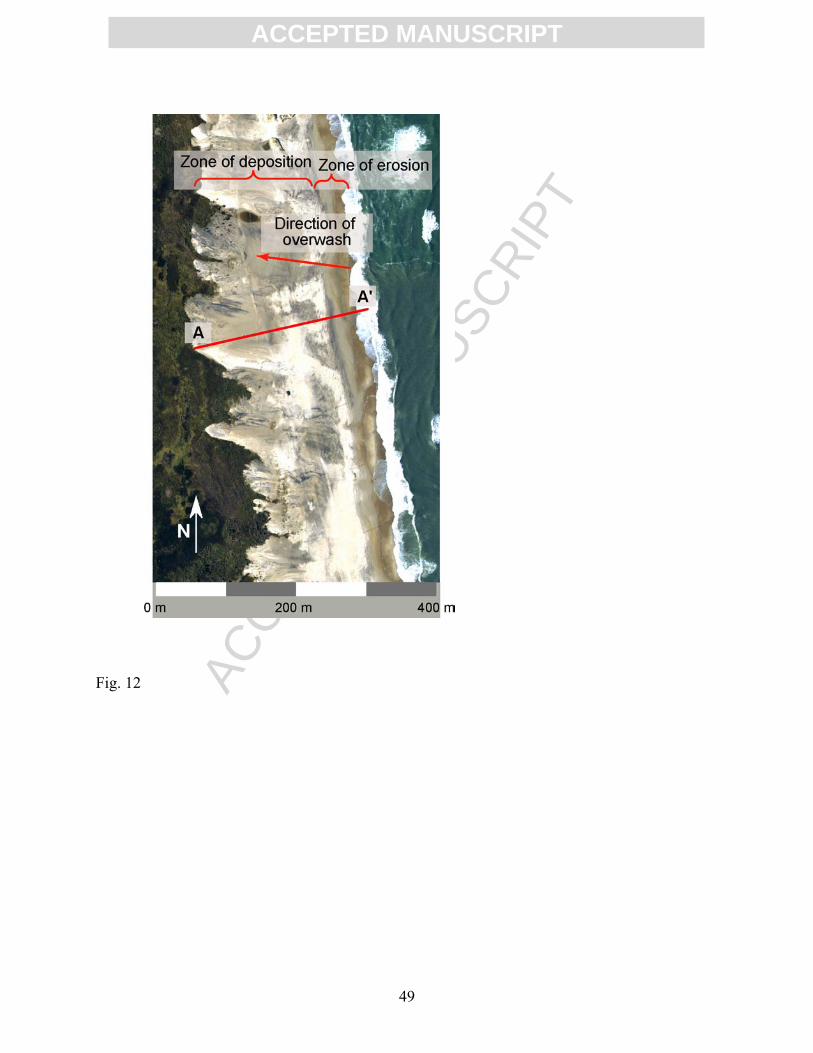
ACC
EPTE
D M
ANU
SCR
IPT
ACCEPTED MANUSCRIPT
49
Fig. 12

ACC
EPTE
D M
ANU
SCR
IPT
ACCEPTED MANUSCRIPT
50
Fig. 13
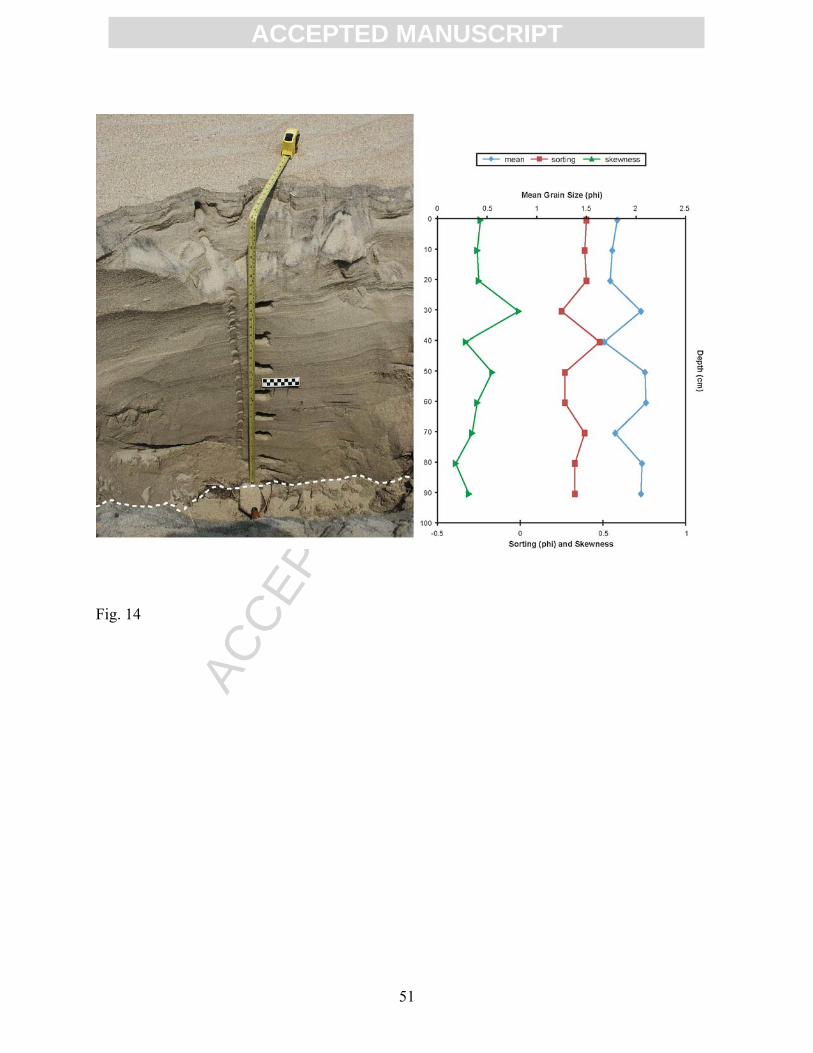
ACC
EPTE
D M
ANU
SCR
IPT
ACCEPTED MANUSCRIPT
51
Fig. 14
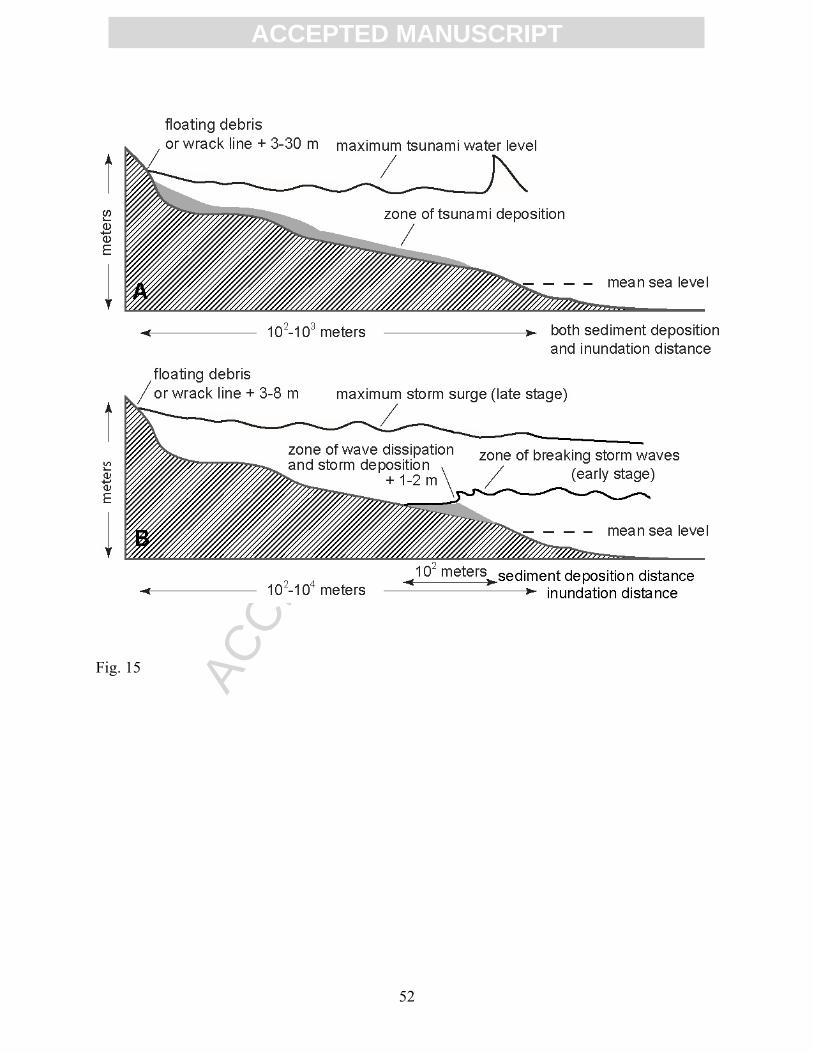
ACC
EPTE
D M
ANU
SCR
IPT
ACCEPTED MANUSCRIPT
52
Fig. 15

ACC
EPTE
D M
ANU
SCR
IPT
ACCEPTED MANUSCRIPT
53
Fig. 16