in search of spillovers through backward linkages of ...users.ox.ac.uk/~econ0247/javorcikaer.pdf ·...
TRANSCRIPT

Does Foreign Direct Investment Increase the Productivityof Domestic Firms
In Search of Spillovers Through Backward Linkages
By BEATA SMARZYNSKA JAVORCIK
Many countries strive to attract foreign direct investment (FDI) hoping that knowl-edge brought by multinationals will spill over to domestic industries and increasetheir productivity In contrast with earlier literature that failed to find positiveintraindustry spillovers from FDI this study focuses on effects operating acrossindustries The analysis based on firm-level data from Lithuania produces evidenceconsistent with positive productivity spillovers from FDI taking place throughcontacts between foreign affiliates and their local suppliers in upstream sectorsThe data indicate that spillovers are associated with projects with shareddomestic and foreign ownership but not with fully owned foreign investments(JEL F2 O1 O3)
Policy makers in many developing and tran-sition economies place attracting foreign directinvestment (FDI) high on their agenda expect-ing FDI inflows to bring much-needed capitalnew technologies marketing techniques andmanagement skills While all of these potentialbenefits of FDI are viewed as important partic-ular emphasis is placed on the contribution ofFDI to increasing productivity and competitive-ness of the domestic industry It is often hopedthat technology transfer resulting from FDI willgo beyond actual projects undertaken by foreigninvestors and through knowledge spilloverswill benefit domestic firms
Yet there is no evidence that positive exter-nalities generated by foreign presence actuallyexist As Dani Rodrik (1999) remarked ldquoto-dayrsquos policy literature is filled with extravagantclaims about positive spillovers from FDI butthe evidence is soberingrdquo Indeed the difficul-ties associated with disentangling different ef-fects at play and data limitations have preventedresearchers from providing conclusive evidenceof positive externalities resulting from FDIWhile recent firm-level studies have overcomemany of the difficulties faced by earlier litera-ture the emerging message is not veryoptimistic
The existing literature on this subject is ofthree kinds First there are case studies whichare often very informative and include a wealthof valuable information (see for instance Theo-dore H Moran 2001) but because they pertainto particular FDI projects or specific countriesthey cannot be easily generalized Then there isa plethora of industry-level studies most ofwhich show a positive correlation between for-eign presence and the average value added perworker in the sector Because most of them relyon cross-sectional data their disadvantage is thedifficulty in establishing the direction of causal-ity It is possible that this positive association iscaused by the fact that multinationals tend tolocate in high-productivity industries ratherthan by genuine productivity spillovers Thepositive correlation may also be a result of FDI
The World Bank MSN MC3ndash303 1818 H Street NWWashington DC 20433 (e-mail bsmarzynskaworldbankorg) I wish to thank Mary Amiti Enrique Aldaz-CarrollAndrew Bernard Simon Evenett Ana Fernandes MichaelFerrantino Caroline Freund Holger Gorg Mary Hallward-Driemeier Wolfgang Keller Pravin Krishna Hiau LooiKee Maryla Maliszewska Jacques Morisset Marcelo Olar-reaga Nina Pavcnik Maurice Schiff Matt Slaughter Mari-ana Spatareanu Jim Tybout two anonymous referees andthe participants of the Tuck International Trade Conferencefor valuable comments and suggestions The financial sup-port received from the Foreign Investment Advisory Service(FIAS)mdasha joint facility of the International Finance Corpo-ration and the World Bankmdashis gratefully acknowledgedThis paper is part of a larger FIAS effort to improve theunderstanding of spillovers from multinational corporationsto local firms The views expressed in the paper are those ofthe author and should not be attributed to the World Bank orits Executive Directors
605
inflows forcing less productive domestic firmsto exit andor of multinationals increasing theirshare of host country market both of whichwould raise the average productivity in the in-dustry1 Finally there is research based on firm-level panel data which examines whether theproductivity of domestic firms is correlated withthe extent of foreign presence in their sectorMost of these studies however such as thecareful analyses done by Mona Haddad andAnn E Harrison (1993) on Morocco Brian JAitken and Harrison (1999) on VenezuelaSimeon Djankov and Bernard Hoekman (2000)on the Czech Republic and Jozef Konings(2001) on Bulgaria Romania and Poland castdoubt on the existence of spillovers from FDI indeveloping countries The researchers either failto find a significant effect or produce evidenceof negative horizontal spillovers that is theeffect the presence of multinational corpora-tions has on domestic firms in the same sectorThe picture is more optimistic in the case ofindustrialized countries as the recent work byJonathan E Haskel et al (2002) and WolfgangKeller and Stephen R Yeaple (2003) providesconvincing evidence of positive FDI spilloversin the United Kingdom and the United Statesrespectively2
It is possible though that researchers havebeen looking for FDI spillovers in the wrongplace Since multinationals have an incentive toprevent information leakage that would enhancethe performance of their local competitors butat the same time may benefit from transferringknowledge to their local suppliers spilloversfrom FDI are more likely to be vertical thanhorizontal in nature In other words spillovers
are most likely to take place through backwardlinkages that is contacts between domesticsuppliers of intermediate inputs and their mul-tinational clients and thus they would not havebeen captured by the earlier studies3 It is alsoplausible that spillovers from multinationalpresence in upstream sectors exist thanks toprovision of inputs that either were previouslyunavailable in the country or are technologi-cally more advanced less expensive or accom-panied by provision of complementary servicesAs Blomstrom et al (2000) point out hardlyany empirical studies analyze vertical spill-overs The notable exceptions are recent papersby Garrick Blalock (2001) employing firm-levelpanel data from Indonesia and by Koen Schoorsand Bartoldus van der Tol (2001) relyingon cross-sectional enterprise-level informationfrom Hungary both of which provide evidenceof positive FDI spillovers through backwardlinkages4
The purpose of this study is twofold First itexamines whether the productivity of domesticfirms is correlated with the presence of mul-tinationals in downstream sectors (potentialcustomers) or upstream industries (potentialsuppliers of intermediate inputs) Detectingsuch effects would be consistent with the exis-tence of vertical spillovers The analysis im-proves over the recent literature by taking intoaccount econometric problems that may havebiased the results of earlier work Namely thesemiparametric estimation method suggested bySteven G Olley and Ariel Pakes (1996) is em-ployed to account for endogeneity of input de-mand Moreover standard errors are correctedto take into account the fact that the measures ofpotential spillovers are industry specific whilethe observations in the data set are at the firmlevel As Brent R Moulton (1990) pointed outfailing to make such a correction will lead to aserious downward bias in the estimated errorsthus resulting in a spurious finding of statisti-
1 The pioneering work on this issue done by Richard ECaves (1974) focused on Australia It was followed bystudies looking at Mexico where due to the large techno-logical gap between foreign and domestic firms the scopefor spillovers may have been higher [see Magnus Blom-strom and Hakan Persson (1983) Blomstrom and EdwardN Wolff (1994) and the summary of studies on Mexicandata by Blomstrom (1989)] Note that the criticism regard-ing reverse causality does not apply to all industry-levelresearch as some studies looked at changes taking placebetween two points in time [Blomstrom (1986) on Mexico]or relied on panel data [Xiaming Liu et al (2000) on theUnited Kingdom] and still concluded that there exist posi-tive spillovers from FDI
2 For surveys of the literature on spillovers from FDI seeHolger Gorg and Eric Strobl (2001) and Robert E Lipsey(2002)
3 For a theoretical justification of spillovers throughbackward linkages see Andres Rodrıguez-Clare (1996)James R Markusen and Anthony J Venables (1999) andPing Lin and Kamal Saggi (2004) For case studies seeMoran (2001)
4 Maurice Kugler (2000) also finds intersectoral technol-ogy spillovers from FDI in Colombia However he does notdistinguish between different channels through which suchspillovers may be occurring (backward versus forwardlinkages)
606 THE AMERICAN ECONOMIC REVIEW JUNE 2004
cal significance for the aggregate variable ofinterest
Second this study goes beyond the existingliterature by shedding light on determinants ofvertical spillovers It examines whether benefitsstemming from vertical linkages are related tothe extent of foreign ownership in affiliatesBased on case studies and investor surveysthese factors have been conjectured to influencethe reliance on local sourcing on the part ofmultinationals and thus the potential benefits ofbackward linkages but to the best of our knowl-edge their impact has not been systematicallyexamined5
The analysis is based on data from the annualenterprise survey conducted by the LithuanianStatistical Office (2001) The survey coverage isextensive as firms accounting for about 85 per-cent of output in each sector are included Thedata constitute an unbalanced panel coveringthe period 1996ndash2000 Focusing on a transitioneconomy such as Lithuania is very suitable forthis project as the endowment of skilled laborenjoyed by transition countries makes them aparticularly likely place for productivity spill-overs to manifest themselves6
The findings can be summarized as followsThe empirical results are consistent with theexistence of positive spillovers from FDI takingplace through backward linkages but there is norobust evidence of spillovers occurring througheither the horizontal or the forward linkagechannel In other words the productivity ofLithuanian firms is positively correlated withthe extent of potential contacts with multina-tional customers but not with the presence ofmultinationals in the same industry or the exis-tence of multinational suppliers of intermediateinputs The magnitude of the effect is econom-ically meaningful A one-standard-deviation in-crease in the foreign presence in the sourcingsectors is associated with a 15-percent rise inoutput of each domestic firm in the supplyingindustry The productivity effect is found to
originate from investments with joint foreignand domestic ownership but not from fullyowned foreign affiliates which is consistentwith the evidence of a larger amount of localsourcing undertaken by jointly owned projects
This study is structured as follows Section Igives a brief overview of spillover channelsSection II discusses FDI inflows into Lithuaniathe data and the estimation strategy The resultsare presented in Section III and Section IVpresents conclusions
I Overview of Spillover Channels
Spillovers from FDI take place when the en-try or presence of multinational corporationsincreases the productivity of domestic firms in ahost country and the multinationals do not fullyinternalize the value of these benefits Spill-overs may take place when local firms improvetheir efficiency by copying technologies of for-eign affiliates operating in the local market ei-ther through observation or by hiring workerstrained by the affiliates Another kind of spill-over occurs if multinational entry leads to moresevere competition in the host country marketand forces local firms to use their existingresources more efficiently or to search fornew technologies (Blomstrom and Ari Kokko1998)
To the extent that domestic firms and multi-nationals operating in the same sector competewith one another the latter have an incentive toprevent technology leakage and spillovers fromtaking place This can be achieved through for-mal protection of their intellectual propertytrade secrecy paying higher wages to preventlabor turnover or locating in countries or indus-tries where domestic firms have limited imita-tive capacities to begin with7 This observationis consistent with the results of recent studiesthat failed to produce evidence of positive hor-izontal spillovers from FDI
On the other hand multinationals have noincentive to prevent technology diffusion to up-stream sectors as they may benefit from
5 See the United Nations Centre on Transnational Orga-nizations (UNCTC) (2001 Ch 4) for a comprehensivereview of this topic
6 For instance during 1990ndash2000 the number of scien-tists and engineers in research and development activitiesper million people was equal to 2031 in Lithuania com-pared to 2139 in Korea 711 in Argentina 168 in Braziland 154 in Malaysia (World Bank 2003b)
7 Several studies (Aitken et al 1996 Sourafel Girma etal 2001) have documented that foreign firms pay higherwages than domestic firms Multinationals have also beenfound to be sensitive to the strength of intellectual propertyrights protection in host countries (see Javorcik 2004)
607VOL 94 NO 3 JAVORCIK SPILLOVERS THROUGH BACKWARD LINKAGES
improved performance of intermediate inputsuppliers Thus backward linkagesmdashthat iscontacts between multinational firms and theirlocal suppliersmdashshould be the most likely chan-nel through which spillovers would manifestthemselves These spillovers may take placethrough (i) direct knowledge transfer from for-eign customers to local suppliers8 (ii) higherrequirements for product quality and on-timedelivery introduced by multinationals whichprovide incentives to domestic suppliers to up-grade their production management or technol-ogy9 and (iii) multinational entry increasingdemand for intermediate products which allowslocal suppliers to reap the benefits of scaleeconomies
Similarly domestic firms may become moreproductive as a result of gaining access to newimproved or less costly intermediate inputsproduced by multinationals in upstream sec-tors (forward linkage channel) Sales of theseinputs by multinationals may be accompaniedby provision of complementary services thatmay not be available in connection withimports
Anecdotal evidence confirms spillovers tak-ing place through backward linkages in transi-tion countries For instance after a Czechproducer of aluminum alloy castings for theautomotive industry signed its first contractwith a multinational customer the staff from themultinational would visit the Czech firmrsquos pre-mises for two days each month over an ex-tended period to work on improving the qualitycontrol system Subsequently the Czech firmapplied these improvements to its other produc-tion lines (not serving this particular customer)
and reduced the number of defective itemsproduced10
The results of a recent enterprise survey con-ducted in Latvia by the World Bank (2003a) areconsistent with our expectation of positive spill-overs taking place through backward linkagesbut are ambiguous with respect to the intrain-dustry effect The evidence from Latvia is par-ticularly relevant as besides being neighboringcountries Lithuania and Latvia share many sim-ilarities in terms of their history and economicconditions The survey demonstrated that a ma-jority of multinationals are engaged in localsourcingmdash82 percent of those interviewed hadat least one Latvian supplier of intermediateinputs and on average 47 percent of interme-diate inputs purchased by foreign firms camefrom Latvian producers Thirty-three percent ofLatvian firms supplying multinationals reportedreceiving assistance from their customers Asfar as horizontal spillovers are concerned one-third of Latvian firms stated that they havebenefited from the presence of foreign firms intheir sector (15 percent through sourcing inputsfrom multinationals 14 percent by learningabout new technologies and 9 percent by learn-ing about new marketing strategies) At thesame time 41 percent of survey respondentsreported that foreign entry increased competi-tion in their industry with 29 percent of firmsadmitting to having lost market share to foreignfirms As Aitken and Harrison (1999) pointedout knowledge spillovers within an industrymay be counterbalanced by the competition ef-fect that is as domestic firms lose market shareto foreign entrants they experience lower pro-ductivity since their fixed costs are spread overa smaller market Thus the reported increase incompetition levels due to foreign entry is con-sistent with the lack of intraindustry spilloversfound in the current analysis
Different types of FDI projects may havedifferent implications for vertical spillovers Forinstance it has been argued that affiliates estab-lished through mergers and acquisitions or jointventures are likely to source more locally thanthose taking the form of greenfield projects(UNCTC 2001) While the latter have to puttime and effort into developing local linkages
8 As numerous case studies indicate (see Moran) multi-nationals often provide technical assistance to their suppli-ers in order to raise the quality of their products or facilitateinnovation They help suppliers with management trainingand organization of the production process quality controlpurchase of raw materials and even finding additional cus-tomers Note that the existence of linkages does not neces-sarily guarantee that spillovers take place nor does the factthat multinationals may charge for services provided pre-clude the presence of spillovers Spillovers take place whenforeign affiliates are unable to extract the full value of theresulting productivity increase through direct payment orlower prices they pay for intermediates sourced from thelocal firm
9 For instance many multinationals require their suppli-ers to obtain International Standards Organization (ISO)quality certifications
10 Source Interview with company management con-ducted by the author in the Czech Republic in May 2003
608 THE AMERICAN ECONOMIC REVIEW JUNE 2004
the former can take advantage of the supplierrelationships of the acquired firm or its localpartners Empirical evidence to support thisview has been found for Japanese investors(Rene Belderbos et al 2001) and for Swedishaffiliates in Eastern Europe (UNCTC 2000)Unfortunately in the data set used here it isimpossible to distinguish among the three typesof foreign investment However to the extentthat full foreign ownership is a proxy for green-field projects it is expected that fully ownedforeign affiliates will tend to rely more on im-ported inputs while investment projects withshared domestic and foreign ownership willtend to source more locally11 This hypothesis issupported by the survey mentioned abovewhich showed that while over half of partiallyowned foreign affiliates operating in Latvia pur-chased their intermediate inputs locally thesame was true of only 9 percent of fully ownedforeign subsidiaries (World Bank 2003a) Sim-ilarly the results of a study of the largest ex-porters in Hungary (Istvan Janos Toth andAndras Semjen 1999) indicate that foreign af-filiates with larger shares of foreign equity tendto purchase fewer inputs from Hungarian com-panies In sum it is expected that larger spill-overs are associated with partially rather thanfully owned foreign projects
II Data and Estimation Strategy
A Foreign Direct Investment in Lithuania
Like other former Soviet Republics Lithua-nia had been virtually closed to foreign in-vestment until 1990 when it regained itsindependence and began the process of transi-tion to a market economy The first stage of theprivatization process starting in 1991 offeredlimited opportunities for foreign investors Itwas not until 1997 that FDI inflows into Lithua-nia increased significantly as a result of thesecond stage of the privatization program Asillustrated in Figure 1 FDI inflows peaked in1998 when 60 percent of shares of Lietuvas
Telekomas (Lithuanian Telecom) the fixed-linemonopoly operator were sold to Amber Tele-holdings a consortium of Swedish Telia andFinnish Sonera [European Bank for Reconstruc-tion and Development (EBRD) 2001]12 Due toits late start Lithuania has attracted less FDIthan have other Central and Eastern Europecountries (CEECs) Cumulative FDI inflowsduring the period 1993ndash2000 reached US$694per capita placing Lithuania seventh amongCEECs above Slovenia Bulgaria and Roma-nia In terms of the value of cumulative FDIinflows per capita Lithuania ranks eighthabove Estonia and Slovenia (see Table 1)
As far as sectoral distribution of FDI is con-cerned 44 percent of the FDI stock in 1996 wasin manufacturing After large inflows into thetelecommunications and financial sectors thisfigure decreased to 32 percent in 2000 Withinmanufacturing food products beverages andtobacco attracted the largest share of investment(12 percent of total FDI stock) followed bytextiles and leather products (4 percent) andrefined petroleum and chemicals (4 percent)Electrical machinery optical instruments andwood products also received significant foreigninvestments [Organization for Economic Co-operation and Development (OECD) 2000] Adetailed distribution of FDI stock in 2000within the two-digit manufacturing sectors cal-culated on the basis of the data set used inthe study is presented in the first column inTable 2
11 There may exist greenfield projects undertaken jointlyby foreign and local entities but in that case they should belumped together with joint ventures as the participation ofa local company brings access to domestic suppliers Thisclassification will however be problematic in the case offull acquisitions undertaken by foreigners
12 Note that the large jump in FDI inflows due to thistransaction does not affect the results of this paper as onlymanufacturing sectors are included in the econometricanalysis
FIGURE 1 NET FDI INFLOWS INTO LITHUANIA
609VOL 94 NO 3 JAVORCIK SPILLOVERS THROUGH BACKWARD LINKAGES
Lithuaniarsquos population gross domestic prod-uct (GDP) and not surprisingly FDI inflowsare concentrated in three principal citiesVilnius Kaunas and Klaipeda At the begin-ning of 2000 Vilnius accounted for 605 per-cent of the countryrsquos total FDI with the othertwo cities accounting for 105 and 116 percentrespectively Direct investment in manufactur-ing sectors is concentrated around Klaipedawhile the bulk of FDI inflows into wholesaleand retail trading are found in the capital city ofVilnius (OECD 2000 2001)
B Data Description
The data used in this study come from theannual enterprise survey conducted by theLithuanian Statistical Office The survey cover-age is extensive as firms accounting for about85 percent of output in each sector are includedin the sample The Lithuanian enterprise datahave been praised for their high quality and
reliability13 The data constitute an unbalancedpanel covering the period 1996ndash2000 Thenumber of firms per year varies from a low oftwelve thousand in 1996 to a high of twenty-onethousand in 1999 Due to financial constraints insome years the Statistical Office was forced toreduce the scope of the exercise In each yearhowever the same sampling technique wasused
This study focuses on manufacturing firms(sectors 15ndash36 in Nomenclature generale desactivites economiques dans les Communauteseuropeennes NACE) which lowers the samplesize to 2500 to 4000 firms per year The num-ber of observations is further reduced by delet-ing those with missing values zero sales zeroemployment and observations failing to satisfy
13 A recent study examining the quality of data collectedby statistical offices ranked Lithuania second among 20transition economies (see Misha Belkindas et al 1999)
TABLE 1mdashFDI INFLOWS INTO CEECS 1993ndash2000
Panel A
FDI inflow (millions of US$)
1993 1994 1995 1996 1997 1998 1999 2000
Czech Republic 654 878 2568 1435 1286 3700 6313 4987Hungary 2350 1144 4519 2274 2167 2037 1977 1646Estonia 162 214 201 150 266 581 305 387Latvia 45 214 180 382 521 357 348 410Poland 1715 1875 3659 4498 4908 6365 7270 9341Slovak Republic 199 270 236 351 174 562 354 2052Lithuania 30 31 73 152 355 926 486 379Slovenia 113 117 150 173 334 216 107 136Bulgaria 40 105 90 109 505 537 806 1002Romania 94 341 419 263 1215 2031 1041 1037
Panel B
FDI inflows 2000 FDI inflows 1993ndash2000
Aspercent of
GDPPer capita
(US$)Value
(mn US$)Per capita
(US$)
Czech Republic 97 485 21822 2124Hungary 35 163 18113 1790Estonia 75 283 2268 1656Latvia 57 173 2456 1036Poland 59 242 39631 1025Slovak Republic 104 380 4198 777Lithuania 34 108 2432 694Slovenia 07 68 1345 676Bulgaria 79 123 3194 393Romania 27 46 6441 287
Note CEECs Central and Eastern European countries FDI foreign direct investmentSources FDI figuresmdashIMF (2003) GDP and population datamdashWorld Bank (2003b)
610 THE AMERICAN ECONOMIC REVIEW JUNE 2004
other basic error checks Moreover two sectorsmdashtobacco (NACE 16) and manufacturing ofrefined petroleum products (NACE 23)mdashareexcluded since the small number of firmsmakes it impossible to apply the Olley-Pakestechnique (discussed below) to these industriesThus the final sample size varies between 1918and 2711 firms in a given year The sectoraldistribution of firms in the last year of the sam-ple is presented in Table 2
The data set contains information on foreignownership sales inventories employmentfixed assets input costs investment locationand share of exports in total sales Firms withforeign capital participation are defined as firms
in which the share of subscribed capital (equity)owned by foreign investors is equal to at least10 percent More than 12 percent or 1414 ofthe total of 11630 observations meet thisdefinition
Lithuania and other transition countries ofEastern Europe are suitable objects for an anal-ysis of FDI spillovers because of their highendowment of skilled labor which makes themparticularly likely locations for productivityspillovers On the downside the brief durationof the panel makes it more difficult to detect thepresence of spillovers Extending the panel toearlier years would not mitigate this problembecause of limited FDI presence during the
TABLE 2mdashDISTRIBUTION OF FIRMS WITH FOREIGN CAPITAL BY INDUSTRY IN 2000
Code Sector
Distributionof FDIacross
sectorsa
(percent)
Domesticfirms(1)
Firmswith
foreigncapitalb
(2)
Allfirms(3) (2)(3) 100 Horizontal Backward Forward
15 Food products andbeverages
196 396 50 446 112 266 15 48
17 Textiles 125 74 30 104 288 397 137 1718 Wearing apparel 19 172 43 215 200 335 27 25619 Leather and leather products 01 19 3 22 136 66 68 15320 Wood and wood products
except furniture42 382 43 425 101 343 125 84
21 Pulp paper and paperproducts
23 17 6 23 261 394 172 109
22 Publishing printing andrecorded media
02 204 12 216 56 70 35 183
24 Chemicals and chemicalproducts
107 44 17 61 279 209 74 37
25 Rubber and plastic products 38 111 25 136 184 314 110 10926 Other nonmetallic mineral
products74 141 17 158 108 353 31 68
27 Basic metals 06 6 3 9 333 503 167 4328 Fabricated metal products 07 156 24 180 133 107 84 22329 Machinery and equipment 11 94 12 106 113 232 69 15330 Office machinery and
computers00 8 2 10 200 80 63 225
31 Electrical equipment andapparatus
12 37 4 41 98 653 71 150
32 Radio television andcommunication equipment
43 24 5 29 172 322 144 170
33 Medical precision andoptical instruments
08 42 7 49 143 238 119 187
34 Motor vehicles 08 9 1 10 100 598 44 12635 Other transport equipment 76 39 8 47 170 715 02 13136 Furniture 06 154 20 174 115 97 69 145
Total 804 2129 332 2461 135 315 81 131
a Shares do not add up to 100 percent since NACE 16 (tobacco) and NACE 23 (manufacturing of refined petroleumproducts) which account for 09 and 187 percent of FDI stock are not included in the table
b Foreign share of at least 10 percent of total capital
611VOL 94 NO 3 JAVORCIK SPILLOVERS THROUGH BACKWARD LINKAGES
early 1990rsquos Further a high level of aggrega-tion in the industry classification (NACE two-digit) and the fact that the data set pertains tofirms rather than plants also works against find-ing a significant spillover effect
C Estimation Strategy
To examine the correlation between firm pro-ductivity and FDI in the same industry or othersectors an approach similar to that taken byearlier literature is followed and several varia-tions of the following equation are estimated
(1)
ln Yijrt 1ln Kijrt 2ln Lijrt 3ln Mijrt
4 Foreign Shareijrt 5 Horizontaljt
6 Backwardjt 7 Forwardjt
t r j ijrt
Yijrt stands for the real output of firm i operatingin sector j and region r at time t which iscalculated by adjusting the reported sales forchanges in inventories of finished goods anddeflating the resulting value by the ProducerPrice Index for the appropriate two-digit NACEsector Kijrt capital is defined as the value offixed assets at the beginning of the year de-flated by the simple average of the deflators forfive NACE sectors machinery and equipmentoffice accounting and computing machineryelectrical machinery and apparatus motor vehi-cles trailers and semi-trailers and other trans-port equipment Since in the data set it isimpossible to distinguish between skilled andunskilled workers labor is expressed in terms ofefficiency units which are computed by divid-ing the wage bill by the minimum wage (Lijrt)
14
Mijrt materials are equal to the value of mate-rial inputs adjusted for changes in material in-ventories deflated by an intermediate inputsdeflator calculated for each sector based on theinput-output matrix and deflators for the rele-vant industries Finally Foreign Shareijrt mea-
sures the share of firmrsquos total equity owned byforeign investors
Turning to proxies for spillovers Horizontaljtcaptures the extent of foreign presence in sectorj at time t and is defined as foreign equityparticipation averaged over all firms in the sec-tor weighted by each firmrsquos share in sectoraloutput15 In other words
(2) Horizontaljt
i for all i j
Foreign Shareit Yit i for all i j
Yit
Thus the value of the variable increases withthe output of foreign investment enterprises andthe share of foreign equity in these firms
Backwardjt is a proxy for the foreign pres-ence in the industries that are being supplied bysector j It is intended to capture the extent ofpotential contacts between domestic suppliersand multinational customers It is defined fol-lowing Blalock and Schoors and van der Tolas16
(3) Backwardjt k if k j
jk Horizontalkt
where jk is the proportion of sector jrsquos outputsupplied to sector k taken from the 1996 input-output matrix at the two-digit NACE level Theproportion is calculated excluding products sup-plied for final consumption but including im-ports of intermediate products17 As the formula
14 This approach was pioneered by Zvi Griliches andVidar Ringstad (1971) and more recently used by JamesTybout et al (1991) Note that defining employment as thenumber of workers yields similar results
15 This definition is analogous to that in Aitken andHarrison who use employment as weights Schoors and vander Tol as well as Blalock employ output weights but do nottake into account the share of foreign equity treating asforeign total output of firms with at least 10 or 20 percentforeign equity respectively
16 To illustrate the meaning of the variable suppose thatthe sugar industry sells half of its output to jam producersand half to chocolate producers If no multinationals areproducing jam but half of all chocolate production comesfrom foreign affiliates the Backward variable will be cal-culated as follows 1frasl2 0 1frasl2 1frasl2 025
17 Since relationships between sectors may change overtime (although a radical change is unlikely) using multipleinput-output matrices would be ideal Unfortunately input-output matrices for later years are unavailable Similarlywhile employing a matrix excluding imports would be pref-erable such a matrix does not exist Thus the results shouldbe interpreted with these two caveats in mind
612 THE AMERICAN ECONOMIC REVIEW JUNE 2004
indicates inputs supplied within the sector arenot included since this effect is already cap-tured by the Horizontal variable18 The greaterthe foreign presence in sectors supplied by in-dustry j and the larger the share of intermediatessupplied to industries with a multinational pres-ence the higher the value of the variable
The Forward variable is defined as theweighted share of output in upstream (or sup-plying) sectors produced by firms with foreigncapital participation As only intermediates soldin the domestic market are relevant to thisstudy goods produced by foreign affiliates forexports (Xit) are excluded Thus the followingformula is used
(4) Forwardjt
m if m j
jm i for all i m
Foreign Shareit
Yit Xit i for all i m
Yit Xitwhere jm is the share of inputs purchased byindustry j from industry m in total inputssourced by sector j For the same reason asbefore inputs purchased within the sector areexcluded The value of the variable increaseswith the share of foreign affiliates in the (do-mestically sold) output of upstream sectors
The proxies for horizontal and vertical link-ages are time-varying sector-specific variablesWhile the coefficients taken from the input-output table remain fixed changes in level offoreign investment and firm output are observedduring the period in question Table 2 lists thevalues of all three measures in the last year ofthe sample 2000
There is significant variation across sectorsand time in all variables For instance the valueof Horizontal ranges from 715 percent in othertransport equipment and 65 percent in electricalequipment and apparatus to 66 percent inleather and leather products The average valueincreases from almost 12 percent in 1996 toover 31 percent in 2000 Similarly the value of
the Backward variable rises from 36 percent in1996 to 6 percent in 1998 and 81 percent in2000 The highest value is registered in pulppaper and paper products (17 percent) basicmetals (167 percent) and radio TV and com-munications equipment (144 percent) whilethe lowest (02 percent) is in manufacturingother transport equipment The Forward proxyranges from 256 percent in manufacturingwearing apparel to 165 percent in manufactur-ing textiles Again the Forward variable in-creases over time from 33 percent in the firstyear to 131 percent in the last year See Tables3 and 4 for more details on summary statistics
Figures 2 through 4 present changes in thevalue of all spillover variables in each sectorbetween 1996 and 2000 It is worth noting thatseven industries registered a rise in the Back-ward measure of more than 5 percentage pointswhile a further 10 sectors experienced an in-crease of more than 2 percentage points Thelargest change was observed in textiles pulpand paper and wood as well as rubber andplastics In the case of the Horizontal variablethe changes were even more pronounced with13 industries experiencing an increase of over10 percentage points and motor vehicles lead-ing the ranking Apparel metal products andoffice machinery on the other hand saw thegreatest change in the Forward measure
In an exploratory regression the model de-scribed above is estimated using ordinary leastsquares (OLS) with Whitersquos correction for het-eroskedasticity A firmrsquos output is the depen-dent variable and explanatory variables includecapital labor materials foreign equity shareand proxies for FDI spillovers operatingthrough horizontal backward and forwardchannels Since knowledge externalities fromthe foreign presence may take time to manifestthemselves two specifications are employedone with contemporaneous and one with laggedspillover variables The estimation is performedon the full sample and on the sample of domes-tic firms only19 The model includes fixed ef-fects for years (4) industries (19) and regions(9) The results in Table 5 indicate that firmswith foreign capital tend to be more produc-tive than purely Lithuanian firms And more
18 Including the share of intermediates supplied withinthe sector in the Backward measure does not change theconclusions with respect to the correlation between firmproductivity and foreign presence in the sourcing sectors
19 Domestic firms are defined as those with less than 10percent foreign equity
613VOL 94 NO 3 JAVORCIK SPILLOVERS THROUGH BACKWARD LINKAGES
important for the purpose of this study we finda significant and positive coefficient on bothBackward and Horizontal variables in all fourspecifications The coefficients on lagged valuesappear be larger and (in the case of Backward)of higher statistical significance The third spill-over variable Forward does not appear to bestatistically significant In sum the results areconsistent with productivity spillovers fromFDI both taking place within industries andflowing from multinational customers to theirdomestic suppliers
To be more confident about isolating the ef-fects of productivity spillovers we must con-trol for other factors that may influence firmproductivity If multinational entry decreasesindustry concentration leading to more compe-tition and forcing domestic firms to improve
their efficiency this situation may still be re-garded as a broadly defined spillover effectSince however our interest is primarily knowl-edge transfer it would be useful to separate thetwo phenomena Thus the Herfindahl index(H4) is included as a proxy for the level ofindustry concentration20 Further foreign entryinto downstream sectors may increase demandfor intermediate products which in turn will
20 The index is defined as the sum of the squared marketshares of the four largest producers in a given sector and itsvalue may range from 0 to 10000 As pointed out byStephen Nickell (1996) predictions of the theoretical liter-ature on the impact of competition on productivity areambiguous In his empirical analysis however he findsevidence of competition being positively correlated withproductivity growth
TABLE 3mdashSUMMARY STATISTICS
Summary statistics for levelsSummary statistics for first
differences
Number ofobservations Mean
Standarddeviation
Number ofobservations Mean
Standarddeviation
ln Y 11630 135 20 6853 001 06ln L 11630 61 18 6853 006 06ln K 11630 120 24 6853 026 07ln Materials 11630 123 25 6853 002 11ln Gross Investment 8262 106 24 3765 004 18Foreign share 11630 78 230 6853 042 91Exports share 9762 211 340 5757 120 226Horizontal 11630 197 123 6853 399 47Backward 11630 49 39 6853 105 11Backward
(fully foreign owned)11630 19 20 6853 041 06
Backward(partially foreign owned)
11630 30 25 6853 064 11
Backward (concentrated) 11630 19 21 6853 037 08Backward (competitive) 11630 29 30 6853 068 11Forward 11630 69 55 6853 238 26ln Demand 11630 189 14 6853 006 01H4 11630 5769 8444 6853 803 2093
TABLE 4mdashADDITIONAL SUMMARY STATISTICS FOR SPILLOVER VARIABLES
YearNumber ofindustries
Horizontal Backward Forward
MeanStandarddeviation Mean
Standarddeviation Mean
Standarddeviation
1996 20 1185 1292 362 305 329 2421997 20 1732 1570 517 403 427 2831998 20 2195 1558 602 459 616 3141999 20 2893 1993 772 493 881 4272000 20 3146 1920 813 500 1308 670
614 THE AMERICAN ECONOMIC REVIEW JUNE 2004
allow local suppliers to reap the benefits of scaleeconomies To separate this effect the regres-sion includes the demand for intermediates cal-culated based on information on sourcingpatterns from the input-output (IO) matrix andthe value of production in using sectors21 Apositive correlation between demand for inter-
mediates (Demand) and firm productivity isanticipated
Several econometric concerns need to be ad-dressed in the analysis The first is the omissionof unobserved variables There may exist firm-time- and region-specific factors unknown tothe econometrician but known to the firm thatmay affect the correlation between firm produc-tivity and foreign presence Examples of thesevariables include high-quality management in aparticular firm or better infrastructure in a givenregion This problem is addressed by followingHaskel et al (2002) and using time differencing
21 More precisely Demandjt yenk ajk Ykt where ajk isthe IO matrix coefficient indicating that in order to produceone unit of good k ajk units of good j are needed Ykt standsfor industry k output deflated by an industry-specificdeflator
FIGURE 3 CHANGE IN BACKWARD MEASURE 1996ndash2000
FIGURE 2 CHANGE IN HORIZONTAL MEASURE 1996ndash2000
615VOL 94 NO 3 JAVORCIK SPILLOVERS THROUGH BACKWARD LINKAGES
as well as a full set of fixed effects for yearindustry and region In addition to removingany fixed firm-specific unobservable variationdifferencing will remove fixed regional and in-dustrial effects such as infrastructure and tech-nological opportunity Time industry andregional dummy variables on the other handwill control for unobservables that may be driv-
ing changes in for instance attractiveness of aparticular region or industry22 Thus the speci-fication becomes
22 In this case the fixed effect for region r captures notjust the fact that region r is an attractive business locationbut also the fact that its attractiveness is changing over time
FIGURE 4 CHANGE IN FORWARD VARIABLE 1996ndash2000
TABLE 5mdashOLS WITH LAGGED AND CONTEMPORANEOUS SPILLOVER VARIABLES
All firms Domestic All firms Domestic
Foreign share 00025 00025(00002) (00003)
Backward 00105 00086(00048) (00051)
Backward lagged 00173 00177(00060) (00066)
Forward 00030 00001(00024) (00027)
Forward lagged 00029 00007(00040) (00044)
Horizontal 00029 00040(00013) (00014)
Horizontal lagged 00038 00046(00021) (00023)
Intercept 52323 52082 51599 51582(00805) (00876) (01007) (01108)
Number of observations 11630 10216 8214 7118R2 093 092 093 092
Notes Robust standard errors are presented in parentheses The dependent variable is ln firmoutput Each regression includes ln capital stock ln effective employment and ln materials aswell as industry region and year fixed effects
Significant at the 10-percent level Significant at the 5-percent level
Significant at the 1-percent level
616 THE AMERICAN ECONOMIC REVIEW JUNE 2004
(5) ln Yijrt 1 ln Kijrt 2 ln Lijrt
3 ln Mijrt 4 Foreign Shareijrt
5 Horizontaljt 6 Backwardjt
7 Forwardjt 8 H4jt
9 ln Demandjt t
r j ijrt
The above model is estimated in first secondand fourth differences The examination oflonger differences gives relatively more weightto more persistent changes in the variables ofinterest and hence reduces the influence ofnoise Its disadvantage is that longer time dif-ferences reduce the size of the sample As acompromise the above-mentioned sets of dif-ferences are employed but only the relationshipbetween contemporaneous changes in FDI andfirm-level total factor productivity is consid-ered because adding lags would seriously strainthe time span of the data set
Second Moulton showed that in the case ofregressions performed on micro units yet in-cluding aggregated market (or in this case in-dustry) variables the standard errors from OLSwill be underestimated As Moulton demon-strated failing to take this into account leads toa serious downward bias in the estimated errorsresulting in spurious findings of statistical sig-nificance for the aggregate variable of interestTo address this issue the standard errors arecorrected for a correlation between observa-tions belonging to the same industry in agiven year (in other words standard errors areclustered for all observations in the same in-dustry and year)
Finally it has been argued that the use ofOLS is inappropriate when estimating produc-tivity since this method treats labor and otherinputs as exogenous variables Griliches andJacques Mairesse (1995) have made a case thatinputs should be considered endogenous sincethey are chosen by firm based on its productiv-ity which is observed by the producer but notby the econometrician Not taking into ac-count the endogeneity of input choices maybias the estimated coefficients Since the fo-cus of this paper is on firm productivity the
consistency of the estimates is crucial for theanalysis
Therefore we employ the semiparametric es-timation procedure suggested by Olley andPakes which allows for firm-specific productiv-ity difference exhibiting idiosyncratic changesover time Following Olley and Pakes it isassumed that at the beginning of every period afirm chooses variable factors and a level ofinvestment which together with the currentcapital value determine the capital stock at thebeginning of the next period The capital accu-mulation equation is given by
(6) kit 1 1 kit iit
where k stands for capital i for investment and for the rate of depreciation
Consider the following Cobb-Douglas pro-duction function model
(7) yit l lit k kit
m mit it it
where yit lit and mit denote the logarithm ofoutput labor and material inputs respectivelyand subscripts i and t stand for firm and time itdenotes productivity and it stands for eithermeasurement error or a shock to productivitythat is not forecastable during the period inwhich labor can be adjusted Both it and it areunobserved The difference is that it is a statevariable in the firmrsquos decision problem and thusaffects the input demand while it does notLabor and materials are assumed to be freelyvariable inputs Capital is a fixed factor and isaffected only by the distribution of condi-tional on information at time t 1 and pastvalues of The fact that input choices aredetermined in part by the firmrsquos beliefs about itgives rise to simultaneity bias The positivecorrelation between it and inputs used inperiod t will cause an OLS estimation thatdoes not take into account unobserved pro-ductivity differences to provide upwardly bi-ased estimates of the coefficients on variableinputs
The insight of the Olley-Pakes method isthat the observable characteristics of the firmcan be modeled as a monotonic function of the
617VOL 94 NO 3 JAVORCIK SPILLOVERS THROUGH BACKWARD LINKAGES
productivity of the firm Since the investmentdecision depends on the capital stock and onfirm productivity
(8) iit iit it kit
by inverting the above equation one can ex-press unobserved productivity it as a functionof observable investment and capital and thuscontrol for it in estimation23
(9) it hit iit kit
By substituting (9) into (7) the equation to beestimated in the first stage of the procedure isobtained
(10) yit l lit k kit
m mit hiit kit it
The functional form of h() is not known There-fore the k coefficient cannot be estimated at
this stage A partially linear model including athird-order polynomial expansion in capital andinvestment to approximate the form of the h() isestimated From this stage the consistent esti-mates of the coefficients on labor and materialinputs as well as the estimate of the third-orderpolynomial in iit and kit (referred to as it) areobtained
(11) it k kit hiit kit
Thus
(12) hiit kit it k kit
The second step of the estimation procedureconsiders the expectation of yit1 m mit1 l lit1
(13) Eyit 1 m mit 1 l lit 1kit 1
k kit 1 Eit 1it
k kit 1 git
Assuming that it follows a first-order Markovprocess one can rewrite it1 as a function ofit letting it1 be the innovation in it1Using (9) and (12) equation (13) becomes afunction of iit and kit
23 Provided that iit 0 it is possible to show thatinvestment is strictly increasing in it and thus (8) can beinverted
TABLE 6mdashCOMPARISON OF COEFFICIENTS FROM OLS AND OLLEY-PAKES REGRESSIONS
Sector code 15 17 18 19 20 21 22 24 25
Panel AmdashCoefficients from Olley-Pakes Regressions
Number of observationsin Stage I
1150 271 498 68 828 66 610 174 311
ln(labor) 03395 03823 06211 03201 03658 01420 04380 02633 03843ln(materials) 05036 04356 02312 05256 04797 05272 03391 04601 04748ln(capital) 01002 00176 00221 00547 00679 01427 00862 01625 00444
Sum of coefficients 094 084 087 090 091 081 086 089 090
Panel BmdashCoefficients from OLS Regressions
ln(labor) 04114 04500 07357 03318 04558 02655 05048 03072 04360ln(materials) 05180 04816 02483 05490 04862 06103 03864 05277 05118ln(capital) 00396 00028 00003 00038 00214 00420 00512 00730 00357
Sum of coefficients 097 093 098 088 096 092 094 091 098
change in l coefficient change in m coefficient change in k coefficient
618 THE AMERICAN ECONOMIC REVIEW JUNE 2004
(14) yit 1 m mit 1 l lit 1
k kit 1 git k kit
it 1 it 1
where g is a third-order polynomial of it k kit This is the equation to be estimated inthe second stage of the procedure Only in thisstage it is possible to obtain consistent estimatesof k Since the capital in use in a given periodis assumed to be known at the beginning of theperiod and it1 is mean independent of allvariables known at the beginning of the periodit1 is mean independent of kit1 A nonlinearleast-squares method is used to estimate theabove equation
A production function with the Olley-Pakescorrection is estimated for each industry sepa-rately From the estimation the measure of totalfactor productivity which is the difference be-tween the actual and predicted output
(15) tfpit yit l lit k kit m mit
is recovered and used in the estimation of thebasic model24
The Olley-Pakes correction appears to beworking quite well If the procedure success-fully corrects for biases one would expect tofind a decrease in coefficients on labor andmaterial inputs and an increase in the capitalcoefficient relative to the OLS results Table 6presents a comparison of the estimation resultsfrom both methods The material and labor co-efficients move in the predicted direction in 17cases each while the magnitude of the capitalcoefficient increases in 16 of 20 cases
III Estimation Results from a Model inDifferences
A Baseline Specification
A model estimated in first differences pro-duces findings consistent with domestic firmsbenefiting from the foreign presence in sectorsthey supply The first two columns of Table 7contain the results for the full sample and thesubsample of domestic firms respectively Ow-ing to space constraints the coefficients on in-puts are not reported In both regressions a
24 While the Olley-Pakes method also allows for con-trolling for firm exit this option is not utilized here since
unfortunately the data set does not allow for distinguishingbetween firm exit from the sample due to liquidation andfirm exit due to not being included in the group of enter-prises surveyed in a given year
TABLE 6ndashContinued
26 27 28 29 30 31 32 33 34 35 36
Panel AmdashContinued
364 22 465 256 23 84 68 117 23 100 400
04478 06059 03917 04885 07412 04651 02845 03791 02739 05015 0400304804 05703 04475 03851 03394 04374 03833 05275 03497 02769 0446000307 00922 00528 00455 01521 00167 00132 00510 00850 00945 00737
096 108 089 092 093 089 068 096 071 078 092
Panel BmdashContinued
05134 07614 03970 05261 06215 04296 03429 04704 02542 05233 0456704804 02807 04910 04364 02122 05189 04611 05311 03531 03158 05030
00375 00606 00258 00617 01084 00527 00862 00339 01322 00326 00123
096 098 091 090 073 090 089 097 074 087 095
0
Significant at the 10-percent level Significant at the 5-percent level
Significant at the 1-percent level
619VOL 94 NO 3 JAVORCIK SPILLOVERS THROUGH BACKWARD LINKAGES
TABLE 7mdashRESULTS FROM OLS AND OLLEY-PAKES REGRESSIONS
Panel AmdashRegressions in First Differences
All Domestic
Olley-Pakes method
All Domestic
Foreign share 00006 00009(00007) (00007)
Backward 00382 00360 00407 00347(00101) (00103) (00163) (00193)
Forward 00050 00073 00060 00118(00033) (00034) (00055) (00063)
Horizontal 00003 00006 00019 00022(00013) (00013) (00025) (00024)
H4 00000 00000 00001 00001(00000) (00000) (00000) (00000)
Demand 06103 06752 03699 05341(01945) (01929) (02934) (02806)
Number of observations 6853 5916 3765 3084R2 049 049 008 008
Panel BmdashRegressions in Second Differences
All Domestic
Olley-Pakes method
All Domestic
Foreign share 00008 00003(00007) (00006)
Backward 00321 00301 00539 00523(00120) (00125) (00101) (00113)
Forward 00079 00088 00061 00039(00047) (00055) (00060) (00073)
Horizontal 00015 00013 00024 00012(00021) (00022) (00026) (00027)
H4 00000 00000 00000 00001(00000) (00000) (00000) (00000)
Demand 03527 03911 02464 04137(01869) (01872) (02970) (03003)
Number of observations 4551 3923 2379 1920R2 062 061 009 009
Panel CmdashRegressions in Fourth Differences
All Domestic
Olley-Pakes method
All Domestic
Foreign share 00015 00006(00010) (00008)
Backward 00232 00256 00590 00706(00105) (00111) (00080) (00087)
Forward 00027 00026 00004 00192(00067) (00040) (00067) (00041)
Horizontal 00103 00114 00108 00078(00013) (00015) (00011) (00012)
H4 00002 00003 00000 00003(00001) (00000) (00001) (00000)
Demand 02196 02344 03966 03806(01133) (01305) (01007) (01132)
Number of observations 1135 964 833 681R2 070 069 006 006
Notes Standard errors in parentheses have been corrected for clustering for each industry ineach year In the regressions without the Olley-Pakes correction the dependent variable is ln firm output and the right-hand side includes ln capital stock ln labor and lnmaterials In models employing the Olley-Pakes procedure the dependent variable is lntotal factor productivity All regressions include industry region and year fixed effects
Significant at the 10-percent level Significant at the 5-percent level
Significant at the 1-percent level
620 THE AMERICAN ECONOMIC REVIEW JUNE 2004
positive and significant coefficient on the proxyfor spillovers through backward linkages can befound The third and fourth columns present theresults from the regressions with the Olley-Pakes correction25 Again the estimations pro-duce a positive and significant coefficient on theBackward variable in both the full sample andthe subsample of domestic firms The size of thecoefficients is similar across columns and isslightly larger in the case of the full sample Themagnitude of the effect is economically mean-ingful A one-standard-deviation increase in theforeign presence in the sourcing sectors (that isan increase of 4 percentage points in the back-ward variable) is associated with a 15-percentrise in output of each domestic firm in thesupplying industry26
There is little evidence of spillovers takingplace through the other channels The coeffi-cient on the Horizontal variable does not appearto be statistically significant which is consistentwith the existing literature that fails to find apositive intraindustry effect in developing coun-tries (for example Aitken and HarrisonDjankov and Hoekman Konings) The For-ward variable on the other hand bears a neg-ative sign but appears to be statisticallysignificant in only two regressions
As for the other control variables there is noindication of a positive association betweenchanges in foreign equity share and productivitygrowth Similar to Aitken and Harrison theresults indicate that Foreign Share is positivelycorrelated with productivity levels (recall theresults from Table 5) but not with growth ratessuggesting that foreign firms may be investingin the most productive domestic enterprises27
Further a positive coefficient is found on the
demand in downstream sectors indicating theexistence of procyclical productivity effects Fi-nally the data suggest a positive correlationbetween industry concentration and productiv-ity growth but the results are statistically sig-nificant in only two cases28
To check the robustness of the results amodel in second and fourth differences is esti-mated next Since the sample covers only fiveyears of data the latter is the longest differencethat can be employed A positive and significantcoefficient on the Backward variable is found inall specifications which again constitutes evi-dence consistent with productivity spilloverstaking place through contacts between domesticfirms and their foreign customers in down-stream sectors There is no indication of theother type of vertical spillovers as the Forwardvariable appears to be insignificant in the ma-jority of cases As for intrasectoral spilloversonly the results on the long differences suggesttheir existence These results should howeverbe treated with caution as they are based on asmall number of observations The reduction inthe sample size may also be responsible for thechange in the sign of demand from downstreamsectors which in the fourth-difference specifi-cation appears to be negatively correlated withfirm productivity29
B Full Versus Partial Foreign Ownership
Next consider the hypothesis that backwardlinkages associated with partially owned for-eign projects lead to greater spillovers than link-ages associated with wholly owned foreignaffiliates because of different propensities toengage in local sourcing To examine this ques-tion two measures of backward linkages arecalculated for the two types of foreign invest-ments The proxy for fully owned foreignprojects is defined as
25 The number of observations is lower in these regres-sions as the Olley-Pakes procedure can be applied only tofirms reporting positive gross investment in a given year
26 The calculation is based on the coefficient from theregression with the Olley-Pakes correction estimated on thesubsample of domestic firms (Panel A column 4)
27 This conclusion is supported by the findings ob-tained by Djankov and Hoekman (2000) Note that Ait-ken and Harrison (1999) also report a similar pattern ofresults in their analysis of Indonesian data (p 617 foot-note 12) As an additional check we experimented withincluding an indicator variable for the cases when theforeign share increases from under 50 percent to above50 percent (thus giving the foreign investor majorityownership) but it did not appear to be statisticallysignificant
28 This finding would be consistent with Schumpeterian-style argument that more monopolistic firms can morereadily fund research and development expenditure becausethey face less market uncertainty and have a larger and morestable cash flow (see Robert C Levin et al 1985)
29 Note that this change is not due to multicolinearitywith the Backward variable as the correlation between thetwo is 03
621VOL 94 NO 3 JAVORCIK SPILLOVERS THROUGH BACKWARD LINKAGES
(16) Backward Full Ownershipjt
k if k j
jk i for all i k
WOSit
Foreign Shareit Yit
i for all i k
Yitwhere WOS is a dummy for wholly ownedsubsidiaries It is equal to one for firms with theshare of foreign capital equal to at least 99percent30 The measure for partially owned in-
vestments (those with foreign capital participa-tion above 10 but below 99 percent) is definedin an analogous manner
The results shown in Table 8 support thehypothesis A significant and positive correla-tion is found between changes in output ofdomestic firms and backward linkages associ-ated with partially foreign-owned projects butnot wholly foreign-owned affiliates The differ-ence between the magnitudes of the two coef-ficients is statistically significant in three out offour cases (in the case of the full sample at the1-percent level) These findings are consistentwith the observation that projects owned jointlyby domestic and foreign entities are more likelyto source locally thus creating greater scopefor spillovers to firms operating in upstreamsectors
The other variables exhibit patterns similar tothose observed in the previous table The onlyexception is the Forward measure which ap-pears to be negative and statistically significantin three out of four cases suggesting that for-
30 There are 342 observations pertaining to fully ownedforeign affiliates and a further 35 observations for firms withforeign capital share between 99 and 100 percent Togetherthey constitute 27 percent of all observations pertaining tofirms with foreign capital participation
TABLE 8mdashSHARE OF FOREIGN OWNERSHIP AND PRODUCTIVITY SPILLOVERS
Regressions in first differences
All Domestic
Olley-Pakes Method
All Domestic
Foreign share 00006 00010(00007) (00007)
Backward (Partial Ownership) 00444 00394 00499 00401(00085) (00096) (00146) (00190)
Backward (Full Ownership) 00040 00154 00020 00090(00110) (00133) (00171) (00223)
Forward 00053 00074 00066 00121(00030) (00032) (00053) (00062)
Horizontal 00009 00009 00025 00026(00012) (00012) (00024) (00023)
H4 00000 00000 00001 00001(00000) (00000) (00000) (00000)
Demand 06181 06817 03794 05427(01778) (01825) (02810) (02698)
Number of observations 6853 5916 3765 3084R2 049 049 008 008F-stat (BKFO BKPO) 1201 291 641 168Prob F 0 000 009 001 020
Notes Standard errors in parentheses have been corrected for clustering for each industry ineach year In the regressions without the Olley-Pakes correction the dependent variable is ln firm output and the right-hand side includes ln capital stock ln labor and lnmaterials In models employing the Olley-Pakes procedure the dependent variable is lntotal factor productivity All regressions include industry region and year fixed effectsBKFO Backward (Full Ownership) BKPO Backward (Partial Ownership)
Significant at the 10-percent level Significant at the 5-percent level
Significant at the 1-percent level
622 THE AMERICAN ECONOMIC REVIEW JUNE 2004
eign presence in upstream sectors has a negativeimpact on the performance of local firms inusing industries This finding is similar to thatobtained by Schoors and van der Tol (2001) Apossible explanation is that after buying outdomestic firms in supplying sectors foreignowners upgrade production facilities and man-ufacture more sophisticated products that arethen sold at a higher price Local firms in usingsectors that purchase these inputs may havelimited ability to benefit from their higher tech-nological content but are forced to bear thehigher cost
Another reason why the extent of foreignownership may matter for spillovers is the con-trol over company operations For instance for-eign owners may be more inclined to importintermediate inputs (for example due to theirfamiliarity with foreign suppliers) but may be inbetter position to do so in enterprises where theyhave majority ownership Thus as a robustnesscheck a model comparing the effect of minor-ity- versus majority-owned foreign investmentson spillovers through backward linkages wasestimated Since no significant difference be-tween vertical spillovers from the two types ofprojects was found the results are not reportedhere
To conclude the findings are consistent withthe observation that domestic capital participa-tion in FDI projects lowers foreign investorsrsquocosts of using local suppliers and thus results inmore local sourcing and greater productivityspillovers to domestic producers of intermediateinputs
C Robustness Checks
This section describes three additional exten-sions and robustness checks First it is conceiv-able though not very likely that the results onthe effect of backward linkages are driven bythe level of concentration in purchasing indus-tries (which may be correlated with foreignpresence) rather than genuine knowledge spill-overs from FDI For instance both domesticand foreign enterprises operating in concen-trated sectors may have more resources to pro-vide assistance to their suppliers although at thesame time may be less inclined to do so On theother hand firms in competitive industries mayhave fewer resources to support their suppliersbut may have a greater incentive to transfer
knowledge to downstream sectors in order toobtain higher quality or less expensive inputsThus ex ante the effect of concentration isambiguous
To eliminate the alternative explanationdriven by the above arguments a model is es-timated testing whether a differential effect offoreign presence in the two types of down-stream industries exists The US Departmentof Justice definition of concentrated sectors(those with the Herfindahl index for the largestfour firms exceeding 1800) is employed to cal-culate separate measures of Backward for con-centrated and competitive industries31 Theresults presented in Table 9 indicate that for-eign presence in both types of upstream indus-tries leads to positive spillovers to supplyingsectors The Backward variable is statisticallysignificant seven out of eight timesmdashthe onlyexception being the case of spillovers fromconcentrated industries in the regression withthe Olley-Pakes correction estimated on thesubsample of domestic firms In all four mod-els there is no statistically significant differ-ence between the magnitude of the backwardlinkage effect for the two types of sectorssuggesting that the level of concentration inupstream sectors is not a concern in themodel
Second the motivation for undertaking FDIis likely to affect the extent of local sourcing byforeign subsidiaries It has been suggested thatdomestic-market-oriented foreign affiliates tendto purchase more inputs locally than their export-oriented counterparts (Tilman Altenburg 2000UNCTC 2000) Exporting affiliates that arepart of international production networks aremore likely to be dependent on the globalsourcing policies of their parent company andthus may have less freedom to choose theirown suppliers Moreover quality and tech-nical requirements associated with goodstargeted for the domestic market may belower so local suppliers may find it easier toserve multinationals focused on the domestic
31 The following seven sectors fall into the concentratedcategory NACE 24 (chemicals and chemical products)NACE 27 (basic metals) NACE 30 (office machinery andcomputers) NACE 31 (electrical equipment and apparatus)NACE 32 (radio TV and communications equipment)NACE 34 (motor vehicles) and NACE 35 (other transportequipment)
623VOL 94 NO 3 JAVORCIK SPILLOVERS THROUGH BACKWARD LINKAGES
market On the other hand if multinationalsserving global markets impose more stringentcost and quality requirements and thus necessi-tate greater adjustments and larger productivityimprovements on the part of local suppliers onemay expect more spillovers to be associatedwith exporting multinationals This effectwould be reinforced by the fact that multina-tionals serving global markets may possesssuperior technologies creating greater opportu-nities for learning by local suppliers In sum-mary the theoretical predictions regardingthe relationship between export orien-tation of multinationals and spillovers areambiguous
To examine whether the export orientation offoreign affiliates matters for spillovers two sep-arate measures of backward linkages are calcu-lated one for affiliates focused mostly onexporting and one for foreign firms targeting thedomestic market The former variable is definedas follows
(17) Backward Export-Orientedjt
k if k j
jk i for all i k
Export-Orientedit
Foreign Shareit Yit
i for all i k
Yitwhere Export-Orientedit is equal to one if theshare of output exported by firm i is above 50percent and zero otherwise The measure fordomestic-market-oriented foreign affiliates isdefined analogously The results (not reportedhere) suggest that both types of foreign affiliatesare associated with spillovers to upstream sec-tors While the magnitude of the coefficient on
TABLE 9mdashCONCENTRATION IN DOWNSTREAM SECTORS AND PRODUCTIVITY SPILLOVERS
Regressions in first differences
All Domestic
Olley-Pakes Method
All Domestic
Foreign share 00006 00009(00007) (00007)
Backward (Concentrated) 00394 00360 00401 00258(00131) (00126) (00187) (00193)
Backward (Competitive) 00379 00360 00409 00383(00107) (00108) (00187) (00214)
Forward 00050 00073 00059 00115(00033) (00033) (00054) (00061)
Horizontal 00003 00006 00019 00020(00013) (00013) (00025) (00024)
H4 00000 00000 00001 00001(00000) (00000) (00000) (00000)
Demand 06158 06754 03684 05099(02210) (02203) (03107) (03032)
Number of observations 6853 5916 3765 3084R2 049 049 008 008F-stat (BK Concentrated
BK Competitive)002 000 000 033
Prob F 0 090 100 097 057
Notes Standard errors in parentheses have been corrected for clustering for each industry ineach year In the regressions without the Olley-Pakes correction the dependent variable is ln firm output and the right-hand side includes ln capital stock ln labor and lnmaterials In models employing the Olley-Pakes procedure the dependent variable is lntotal factor productivity All regressions include industry region and year fixed effects BK Backward
Significant at the 10-percent level Significant at the 5-percent level
Significant at the 1-percent level
624 THE AMERICAN ECONOMIC REVIEW JUNE 2004
domestic-market-oriented affiliates is larger inthree out of four cases the difference betweenthe two coefficients is not statistically signifi-cant The same exercise was performed for twoadditional cutoff points 66 and 90 percent ofoutput exported but only in regressions esti-mated with the Olley-Pakes correction on thesubsample of domestic firms was the coefficienton Backward (Domestic-Market-Oriented) sig-nificantly larger than the coefficient on the mea-sure of spillovers associated with exportingaffiliates Thus there is some indication ofdomestic-market-oriented FDI projects beingcorrelated with greater productivity spilloversto their local suppliers but the evidence is notvery robust
Finally to correct for potential biases in co-efficients on variable factor inputs the share offoreign capital as well as other sectoral vari-ables (Horizontal Backward Forward H4 andDemand) was included in the first stage of theOlley-Pakes procedure Thus for each of theexercises presented in Tables 7 through 9 aseparate Olley-Pakes procedure with the rele-vant spillover measures added to the first stagewas estimated The results from this estimationhowever led to exactly the same conclusions asthose presented here and are therefore notincluded in the paper A likely reason why thismodification did not produce significant changesto the results is that investment which entersthe first stage of the Olley-Pakes procedure inthe polynomial form picks up most of the ef-fect foreign entry and presence have on firmbehavior
IV Conclusions
In contrast to earlier literature which focusedon intraindustry spillovers from FDI this studytests for productivity spillovers taking placethrough backward linkages (contacts betweenforeign affiliates and their domestic suppliers)and forward linkages (interactions between for-eign suppliers of intermediate inputs and theirdomestic customers) The analysis based on afirm-level panel data set from Lithuania ad-dresses econometric issues that may have biasedthe findings of earlier research such as endoge-neity of input demand and correction of stan-dard errors to account for the fact that whileobservations pertain to firms the variables ofinterest are at the industry level
The results are consistent with the presenceof productivity spillovers taking place throughbackward linkages They suggest that a one-standard-deviation increase in the foreign pres-ence in downstream sectors is associated with a15-percent rise in output of each domestic firmin supplying industries Productivity benefitsare found to be associated with partially but notfully owned foreign projects which is in linewith the evidence suggesting a larger extent oflocal sourcing undertaken by the former type ofFDI Finally as was the case with the earlierfirm-level studies of developing countries noevidence of intrasectoral spillovers is foundNor is there any indication of spillovers stem-ming from multinational presence in sectorssupplying intermediate inputs
Certainly more research is needed to fullyunderstand the effect of FDI on host countriesIn particular it would be useful to confirm thefindings of this paper using data that allow foridentification of individual firms as suppliers tomultinationals rather than relying on input-output matrices to measure interactions betweensectors Moreover it would be interesting tolearn more about host country and investorcharacteristics that determine the extent of spill-overs operating through different channels It isto be hoped that improved data availability willallow researchers to examine these questions inthe future
REFERENCES
Aitken Brian J and Harrison Ann E ldquoDo Do-mestic Firms Benefit from Direct ForeignInvestment Evidence from VenezuelardquoAmerican Economic Review June 199989(3) pp 605ndash18
Aitken Brian Harrison Ann E and Lipsey Rob-ert E ldquoWages and Foreign Ownership AComparative Study of Mexico Venezuelaand the United Statesrdquo Journal of Interna-tional Economics May 1996 40(3ndash4) pp345ndash71
Altenburg Tilman ldquoLinkages and Spillovers be-tween Transnational Corporations and Smalland Medium-sized Enterprises in DevelopingCountries Opportunities and Best Policiesrdquoin UNCTAD TNC-SME linkages for de-velopment Issues-experiences-best prac-tices New York United Nations 2000 pp3ndash61
625VOL 94 NO 3 JAVORCIK SPILLOVERS THROUGH BACKWARD LINKAGES
Belderbos Rene Capannelli Giovanni andFukao Kyoji ldquoBackward Vertical Linkagesof Foreign Manufacturing Affiliates Evi-dence from Japanese Multinationalsrdquo WorldDevelopment January 2001 29(1) pp 189ndash208
Belkindas Misha Dinc Mustafa and IvanovaOlga ldquoStatistical Systems Need Overhaul inTransition Economiesrdquo Transition August1999 10(4) pp 22ndash24
Blalock Garrick ldquoTechnology from Foreign Di-rect Investment Strategic Transfer throughSupply Chainsrdquo Paper presented at the Em-pirical Investigations in International TradeConference at Purdue University November9ndash11 2001 (part of doctoral research at HaasSchool of Business University of CaliforniaBerkeley)
Blomstrom Magnus ldquoForeign Investment andProductive Efficiency The Case of MexicordquoJournal of Industrial Economics September1986 35(1) pp 97ndash110
Foreign investment and spilloversLondon Routledge 1989
Blomstrom Magnus and Kokko Ari ldquoMultina-tional Corporations and Spilloversrdquo Journalof Economic Surveys July 1998 12(2) pp1ndash31
Blomstrom Magnus Kokko Ari and ZejanMario Foreign direct investment Firm andhost country strategies London MacmillanPress 2000
Blomstrom Magnus and Persson Hakan ldquoFor-eign Investment and Spillover Efficiency inan Underdeveloped Economy Evidencefrom the Mexican Manufacturing IndustryrdquoWorld Development June 1983 11(6) pp493ndash501
Blomstrom Magnus and Wolff Edward N ldquoMul-tinational Corporations and ProductivityConvergence in Mexicordquo in William J Bau-mol Richard R Nelson and Edward NWolff eds Convergence of productivityCross-national studies and historical evi-dence Oxford Oxford University Press1994 pp 263ndash84
Caves Richard E ldquoMultinational Firms Com-petition and Productivity in Host-CountryMarketsrdquo Economica May 1974 41(162)pp 176ndash93
Djankov Simeon and Hoekman Bernard ldquoFor-eign Investment and Productivity Growthin Czech Enterprisesrdquo World Bank Eco-
nomic Review January 2000 14(1) pp49 ndash 64
European Bank for Reconstruction and Develop-ment (EBRD) Lithuania investment profile2001 London EBRD 2001
Girma Sourafel Greenaway David and WakelinKatharine ldquoWho Benefits from Foreign Di-rect Investment in the UKrdquo Scottish Journalof Political Economy May 2001 48(2) pp119ndash33
Gorg Holger and Strobl Eric ldquoMultinationalCompanies and Productivity Spillovers AMeta-Analysisrdquo Economic Journal Novem-ber 2001 111(475) pp 723ndash39
Griliches Zvi and Mairesse Jacques ldquoPro-duction Functions The Search for Identi-ficationrdquo National Bureau of Economic Re-search (Cambridge MA) Working Paper No5067 March 1995
Griliches Zvi and Ringstad Vidar Economies ofscale and the form of the production functionAmsterdam North-Holland 1971
Haddad Mona and Harrison Ann E ldquoAre TherePositive Spillovers from Direct Foreign In-vestment Evidence from Panel Data for Mo-roccordquo Journal of Development EconomicsOctober 1993 42(1) pp 51ndash74
Haskel Jonathan E Pereira Sonia C andSlaughter Matthew J ldquoDoes Inward ForeignDirect Investment Boost the Productivity ofDomestic Firmsrdquo National Bureau of Eco-nomic Research (Cambridge MA) WorkingPaper No 8724 January 2002
International Monetary Fund (IMF) Interna-tional financial statistics database Washing-ton DC IMF 2003
Javorcik Beata Smarzynska ldquoThe Compositionof Foreign Direct Investment and Protectionof Intellectual Property Rights Evidencefrom Transition Economiesrdquo European Eco-nomic Review February 2004 48(1) pp 39ndash62
Keller Wolfgang and Yeaple Stephen R ldquoMul-tinational Enterprises International Tradeand Productivity Growth Firm Level Evi-dence from the United Statesrdquo National Bu-reau of Economic Research (CambridgeMA) Working Paper No 9504 February2003
Konings Jozef ldquoThe Effects of Foreign DirectInvestment on Domestic Firmsrdquo Economicsof Transition November 2001 9(3) pp619ndash33
626 THE AMERICAN ECONOMIC REVIEW JUNE 2004
Kugler Maurice ldquoThe Diffusion of Externalitiesfrom Foreign Direct Investment TheoryAhead of Measurementrdquo Discussion Papersin Economics and Econometrics (Universityof Southampton UK) No 23 2000
Levin Richard C Cohen Wesley M and Mow-ery David C ldquoRampD Appropriability Oppor-tunity and Market Structure New Evidenceon Some Schumpeterian Hypothesesrdquo Amer-ican Economic Review May 1985 (Papersand Proceedings) 75(2) pp 20ndash24
Lin Ping and Saggi Kamal ldquoMultinationalFirms and Backward Linkages A Survey anda Simple Modelrdquo Unpublished manuscriptLingnan University and Southern MethodistUniversity 2004
Lipsey Robert E ldquoHome and Host Country Ef-fects of FDIrdquo National Bureau of EconomicResearch (Cambridge MA) Working PaperNo 9293 October 2002
Lithuanian Statistical Office Survey of Lithua-nian firms Vilnius 2001
Liu Xiaming Siler Pamela Wang Chengqi andWei Yingqi ldquoProductivity Spillovers fromForeign Direct Investment Evidence fromUK Industry Level Panel Datardquo Journal ofInternational Business Studies 3rd Qtr 200031(3) pp 407ndash25
Markusen James R and Venables Anthony JldquoForeign Direct Investment as a Catalyst forIndustrial Developmentrdquo European Eco-nomic Review February 1999 43(2) pp335ndash56
Moran Theodore H Parental supervision Thenew paradigm for foreign direct investmentand development Washington DC Institutefor International Economics 2001
Moulton Brent R ldquoAn Illustration of a Pitfall inEstimating the Effects of Aggregate Vari-ables on Micro Unitsrdquo Review of Economicsand Statistics May 1990 72(2) pp 334ndash38
Nickell Stephen ldquoCompetition and CorporatePerformancerdquo Journal of Political EconomyAugust 1996 104(4) pp 724ndash46
Olley Steven G and Pakes Ariel ldquoThe Dynam-ics of Productivity in the Telecommunica-tions Equipment Industryrdquo EconometricaNovember 1996 64(6) pp 1263ndash97
Organization for Economic Cooperation and De-velopment (OECD) ldquoLithuania Foreign Di-rect Investment Impact and Policy AnalysisrdquoParis OECD 2000
ldquoReviews of Foreign Direct Invest-ment Lithuaniardquo Paris OECD 2001
Rodrıguez-Clare Andres ldquoMultinationals Link-ages and Economic Developmentrdquo Ameri-can Economic Review September 199686(4) pp 852ndash73
Rodrik Dani ldquoThe New Global Economy andDeveloping Countries Making OpennessWorkrdquo Overseas Development Council(Baltimore MD) Policy Essay No 241999
Schoors Koen and van der Tol Bartoldus ldquoTheProductivity Effect of Foreign Ownership onDomestic Firms in Hungaryrdquo Paper pre-sented at the International Atlantic EconomicConference in Philadelphia PA October 11ndash14 2001
Toth Istvan Janos and Semjen Andras ldquoMarketLinks and Growth Capacity of Enterprises inA Transforming Economy The Case of Hun-garyrdquo in Istvan Janos Toth and AndrasSemjen eds Market links tax environmentand financial discipline of Hungarian enter-prises Budapest Institute of EconomicsHungarian Academy of Sciences 1999 pp1ndash37
Tybout James de Melo Jaime and Corbo Vit-torio ldquoThe Effects of Trade Reforms on Scaleand Technical Efficiencyrdquo Journal of Inter-national Economics November 1991 31(3ndash4) pp 231ndash50
United Nations Centre on Transnational Cor-porations (UNCTC) The competitivenesschallenge Transnational corporations andindustrial restructuring in developing coun-tries New York United Nations 2000
World investment report Promotinglinkages New York United Nations 2001
World Bank ldquoDeveloping Knowledge IntensiveSectors Technology Transfers and the Roleof FDIrdquo Foreign Investment Advisory Ser-vice 2003a
World development indicators data-base Washington DC World Bank 2003b
627VOL 94 NO 3 JAVORCIK SPILLOVERS THROUGH BACKWARD LINKAGES
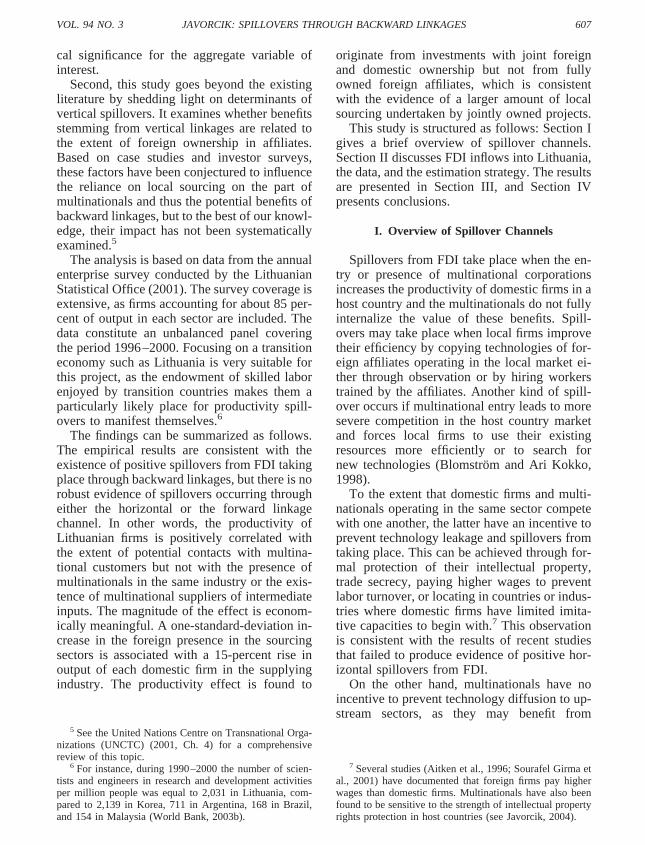
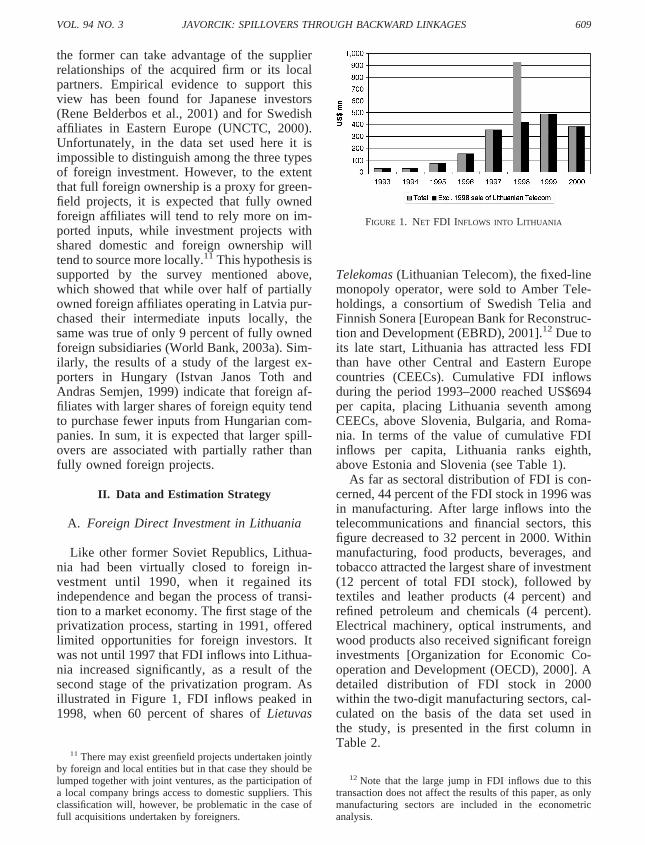
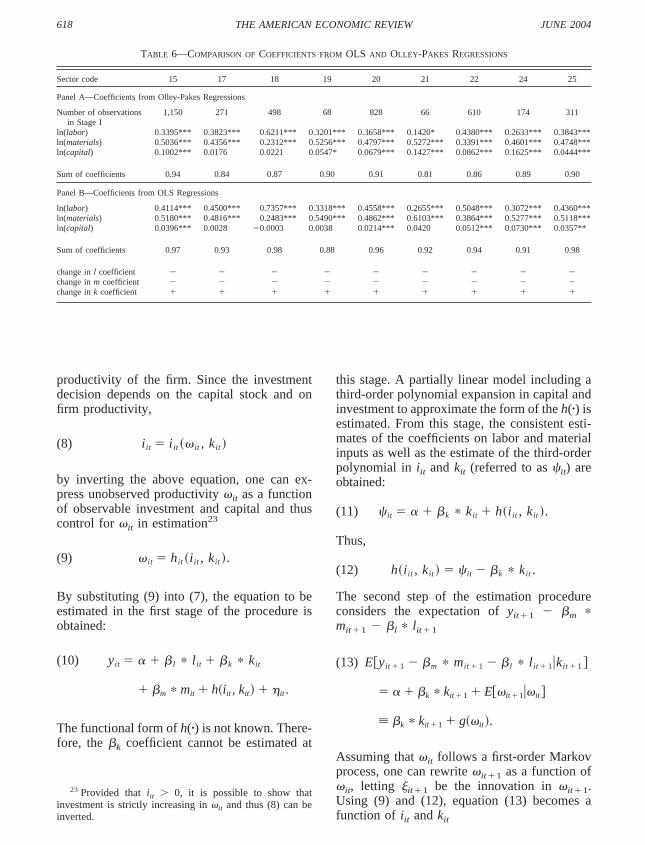
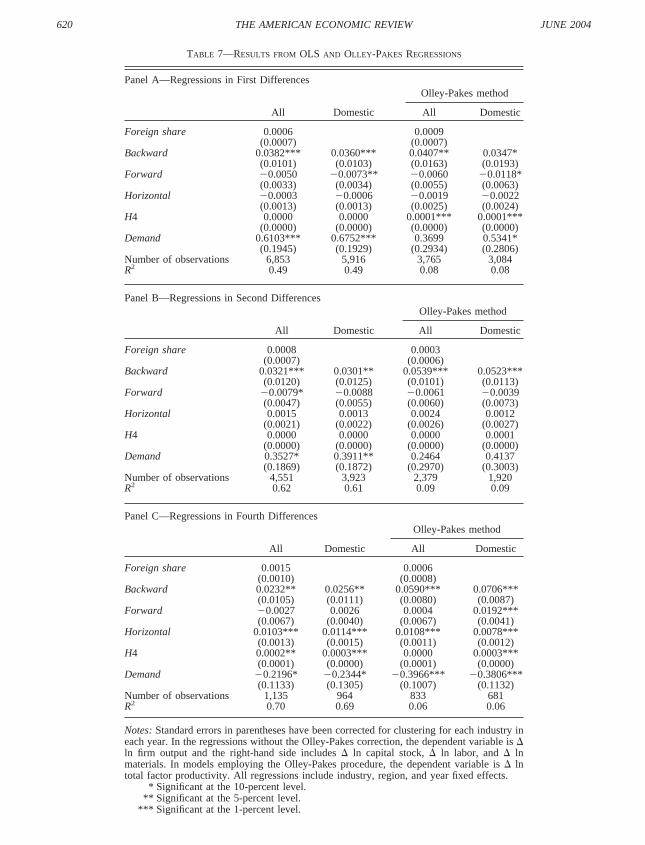