in-situ chemical oxidation (isco) using ozone sparging … · treatment of petroleum...
TRANSCRIPT
In-Situ Chemical Oxidation (ISCO) Using Ozone Sparging for
Treatment of Petroleum Hydrocarbon-Impacted Groundwater
Ryan Dominguez, E.I.T. October 19, 2012
Remediation Technology Symposium (RemTech) 2012
Authors and
Presenter
2
Authors:
Ryan Dominguez, E.I.T.,
Parsons
Jim Leu, Ph.D., P.E.,
Parsons
Mehdi Bettahar, Ph.D.,
Parsons
Presenter:
Ryan Dominguez, E.I.T. [email protected]
Presentation Overview
Site Background
Remedial Process Optimization
Bench Scale Testing
Capture Zone Analysis
Pilot Test - In-Situ Chemical Oxidation (ISCO) Using
Ozone
3
Site Background – Nature and Extent of Impacts
4
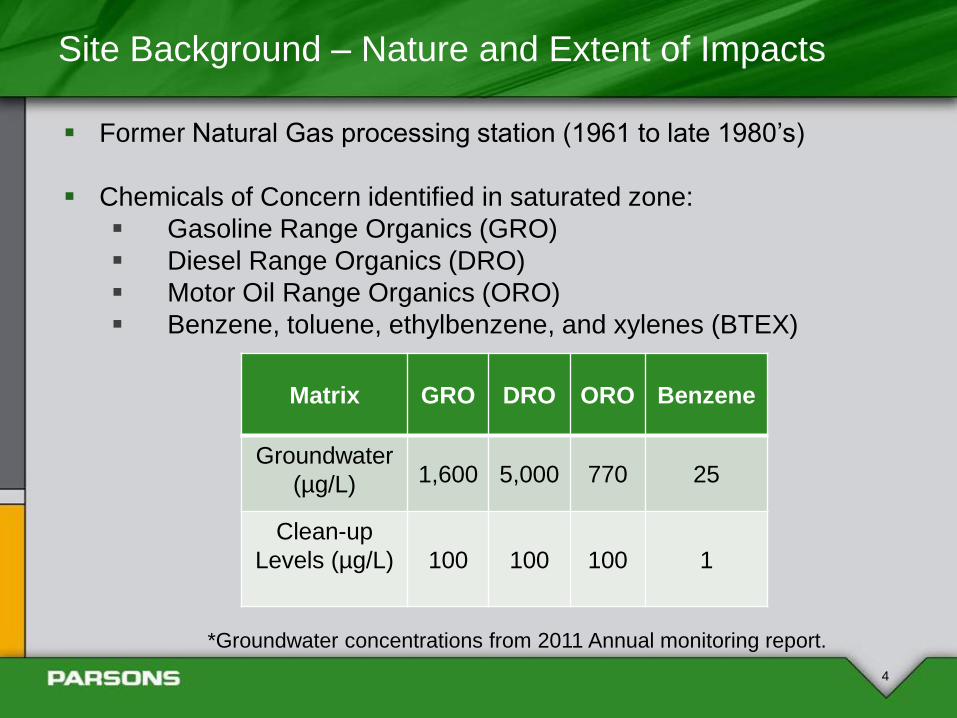
Former Natural Gas processing station (1961 to late 1980’s)
Chemicals of Concern identified in saturated zone:
Gasoline Range Organics (GRO)
Diesel Range Organics (DRO)
Motor Oil Range Organics (ORO)
Benzene, toluene, ethylbenzene, and xylenes (BTEX)
*Groundwater concentrations from 2011 Annual monitoring report.
Matrix GRO DRO ORO Benzene
Groundwater
(µg/L) 1,600 5,000 770 25
Clean-up
Levels (µg/L)
100 100 100 1
Site Background – Previous Relevant Activities
5
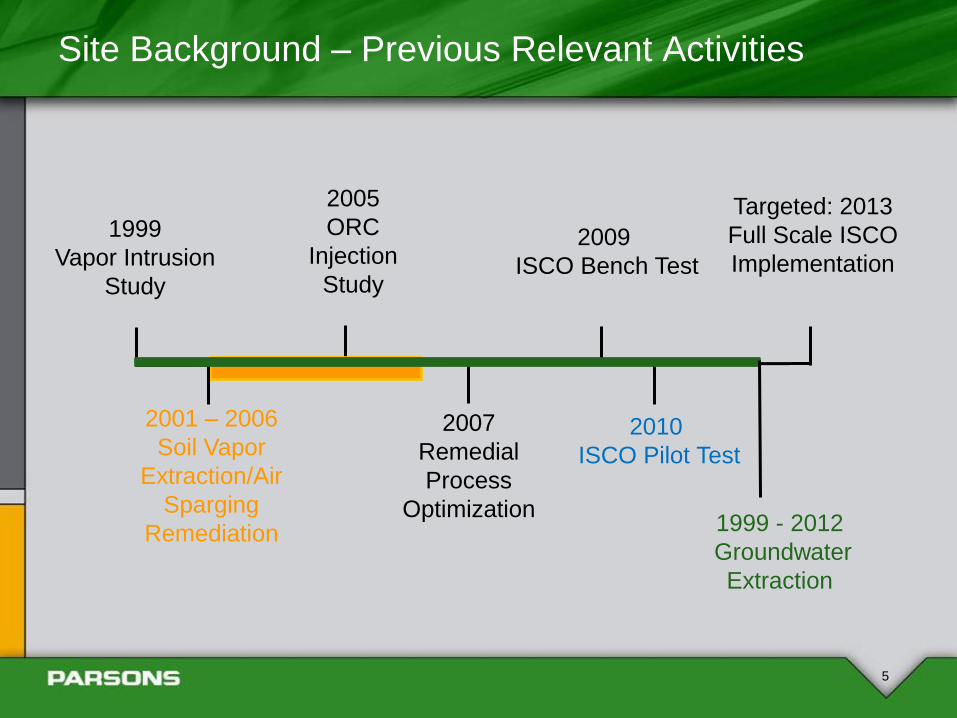
1999
Vapor Intrusion
Study
2005
ORC
Injection
Study
2007
Remedial
Process
Optimization
Targeted: 2013
Full Scale ISCO
Implementation
2001 – 2006
Soil Vapor
Extraction/Air
Sparging
Remediation
2009
ISCO Bench Test
2010
ISCO Pilot Test
1999 - 2012
Groundwater
Extraction
Remedial Process Optimization – Recommendations
6
Both the AS/SVE system and the groundwater extraction system
have reached the practical limits of COC mass removal and COC
concentration reduction and will not produce significant additional
COC mass removal.
Shut down the groundwater extraction system
Monitor the off-site groundwater concentrations
Conduct an in-situ chemical oxidation (ISCO) Pilot Study - Study
onsite conditions to evaluate the best ISCO product and approach
(potassium permanganate, persulfate, ozone, etc.)
7
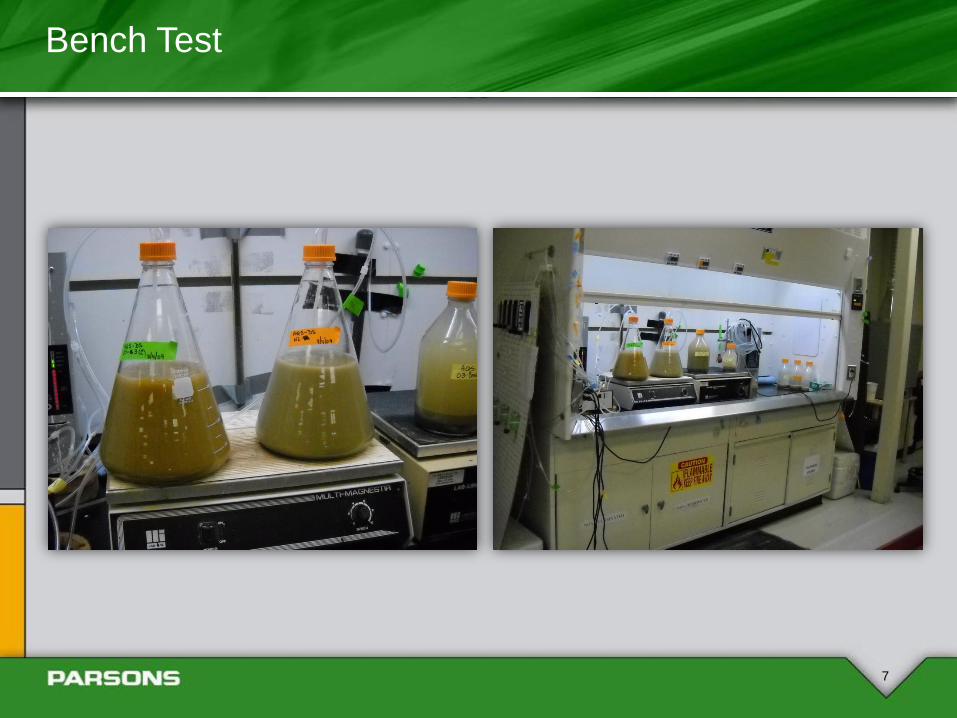
Bench Test
Bench Test Activities
8
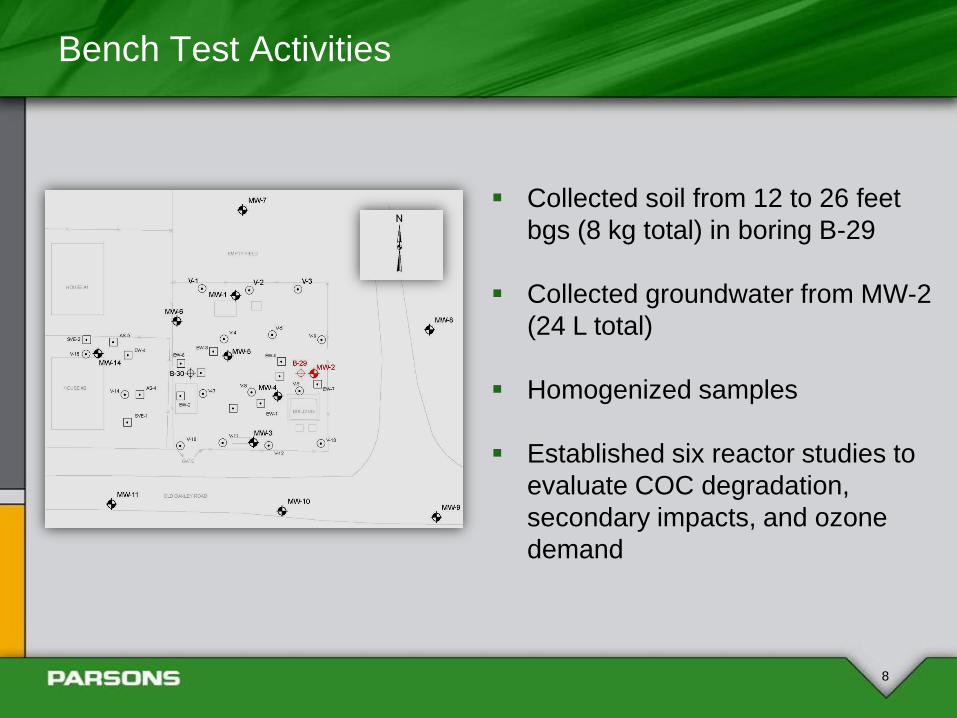
Collected soil from 12 to 26 feet
bgs (8 kg total) in boring B-29
Collected groundwater from MW-2
(24 L total)
Homogenized samples
Established six reactor studies to
evaluate COC degradation,
secondary impacts, and ozone
demand
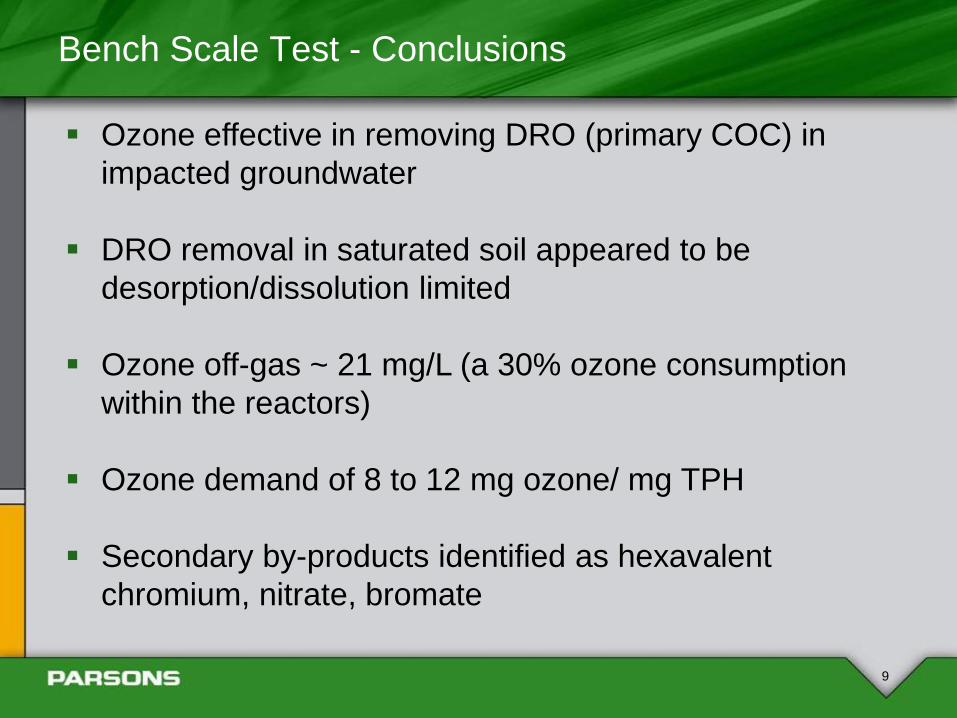
Bench Scale Test - Conclusions
9
Ozone effective in removing DRO (primary COC) in
impacted groundwater
DRO removal in saturated soil appeared to be
desorption/dissolution limited
Ozone off-gas ~ 21 mg/L (a 30% ozone consumption
within the reactors)
Ozone demand of 8 to 12 mg ozone/ mg TPH
Secondary by-products identified as hexavalent
chromium, nitrate, bromate
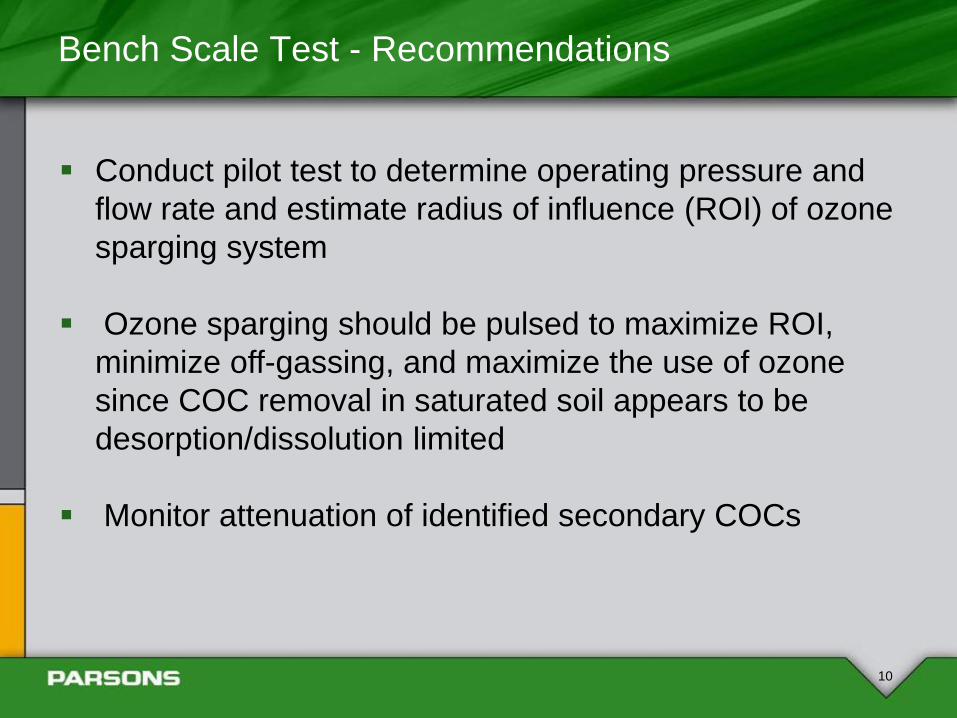
Bench Scale Test - Recommendations
10
Conduct pilot test to determine operating pressure and
flow rate and estimate radius of influence (ROI) of ozone
sparging system
Ozone sparging should be pulsed to maximize ROI,
minimize off-gassing, and maximize the use of ozone
since COC removal in saturated soil appears to be
desorption/dissolution limited
Monitor attenuation of identified secondary COCs
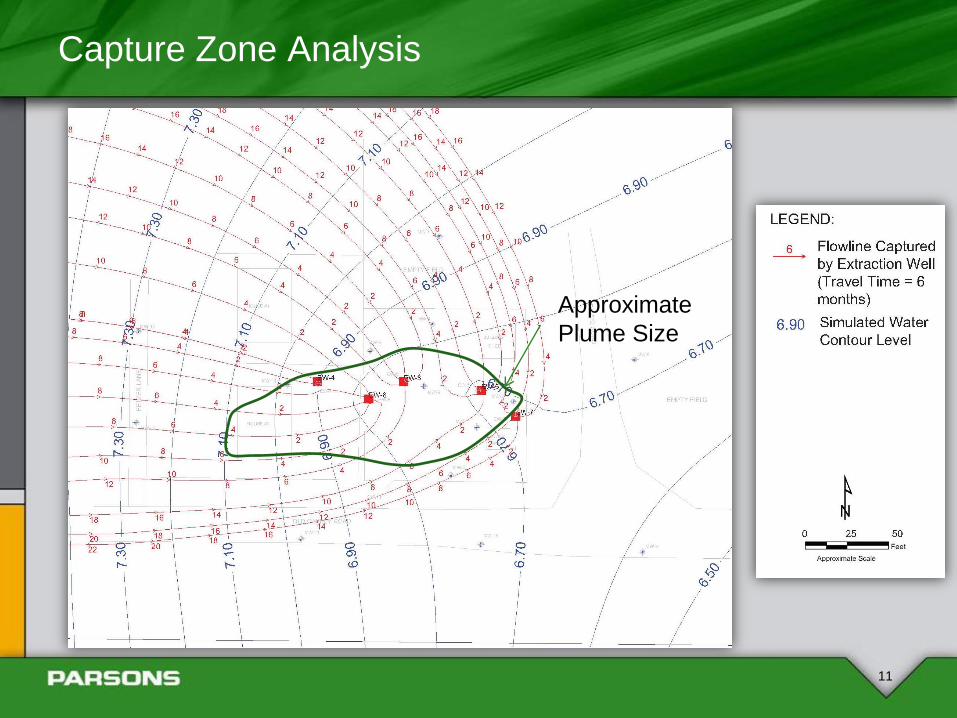
Capture Zone Analysis
11
Approximate
Plume Size
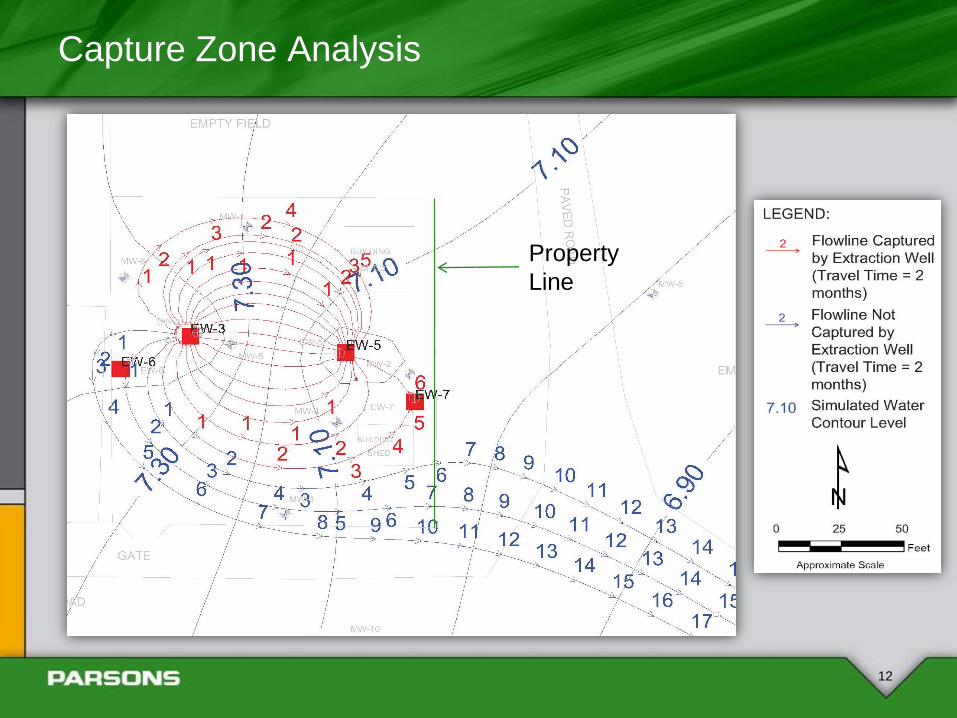
Capture Zone Analysis
12
Property
Line
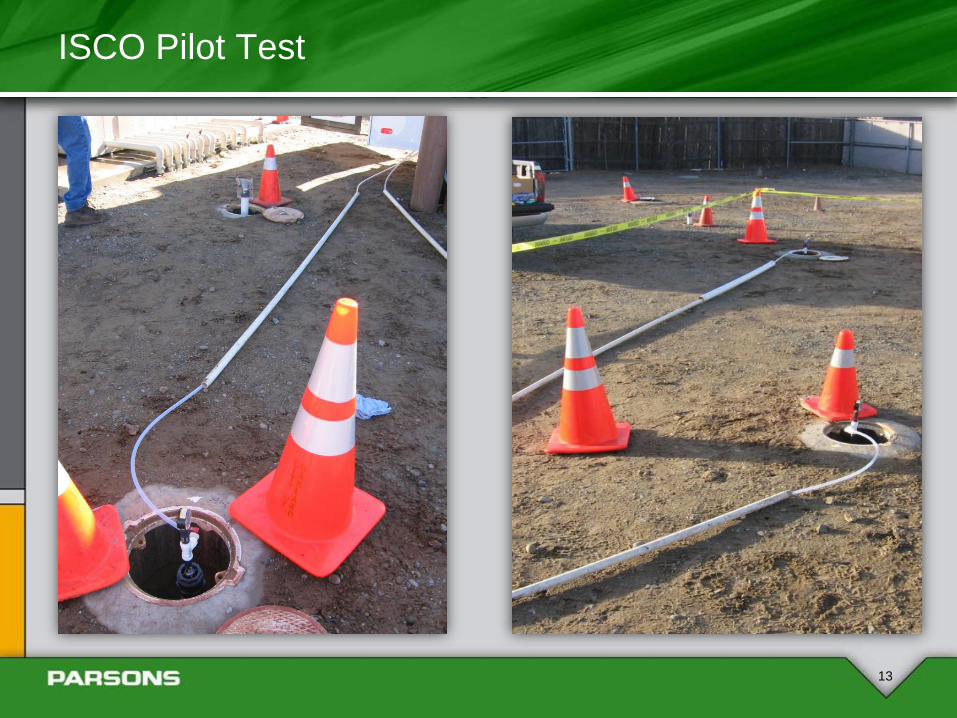
ISCO Pilot Test
13
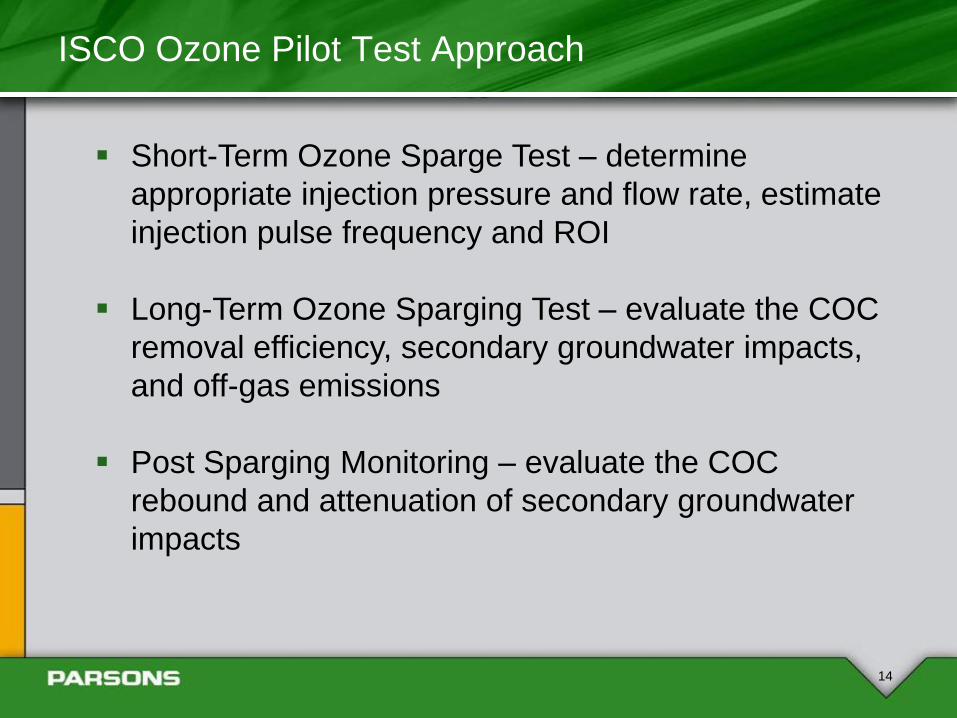
ISCO Ozone Pilot Test Approach
14
Short-Term Ozone Sparge Test – determine
appropriate injection pressure and flow rate, estimate
injection pulse frequency and ROI
Long-Term Ozone Sparging Test – evaluate the COC
removal efficiency, secondary groundwater impacts,
and off-gas emissions
Post Sparging Monitoring – evaluate the COC
rebound and attenuation of secondary groundwater
impacts
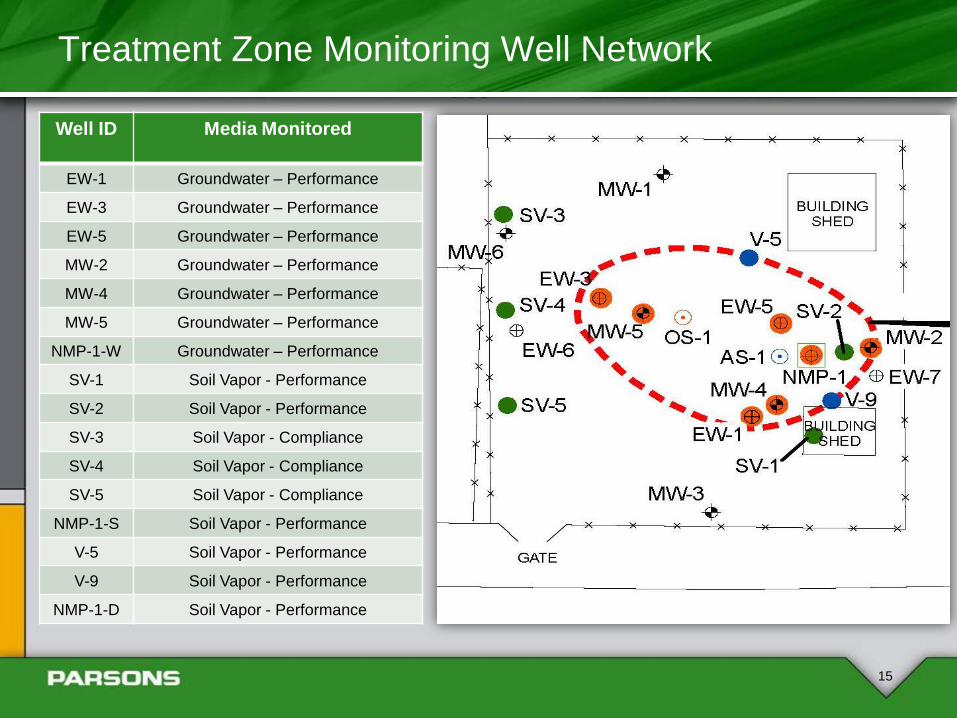
Treatment Zone Monitoring Well Network
15
Well ID Media Monitored
EW-1 Groundwater – Performance
EW-3 Groundwater – Performance
EW-5 Groundwater – Performance
MW-2 Groundwater – Performance
MW-4 Groundwater – Performance
MW-5 Groundwater – Performance
NMP-1-W Groundwater – Performance
SV-1 Soil Vapor - Performance
SV-2 Soil Vapor - Performance
SV-3 Soil Vapor - Compliance
SV-4 Soil Vapor - Compliance
SV-5 Soil Vapor - Compliance
NMP-1-S Soil Vapor - Performance
V-5 Soil Vapor - Performance
V-9 Soil Vapor - Performance
NMP-1-D Soil Vapor - Performance

Short Term Ozone Sparge Test
16
Well
Injection
Time
(hours)
%
Ozone
by
weight
Pressure
(psi)
Flow
Rate
(cfm)
Concentration
(g/m3)
Ozone
Delivered
(lbs/day)
AS-1 8 0.56 4.5-5.5 2.5 7.2 1.62
OS-1 7 0.55 6.0-6.5 2.5-3.0 6.8 1.50
Four rounds soil gas
O3, VOCs, O2, CO2, CH4
Three rounds groundwater
DO, dissolved O3, ORP, pH,
temperature, well head pressure,
depth to water
Monitoring Specifics
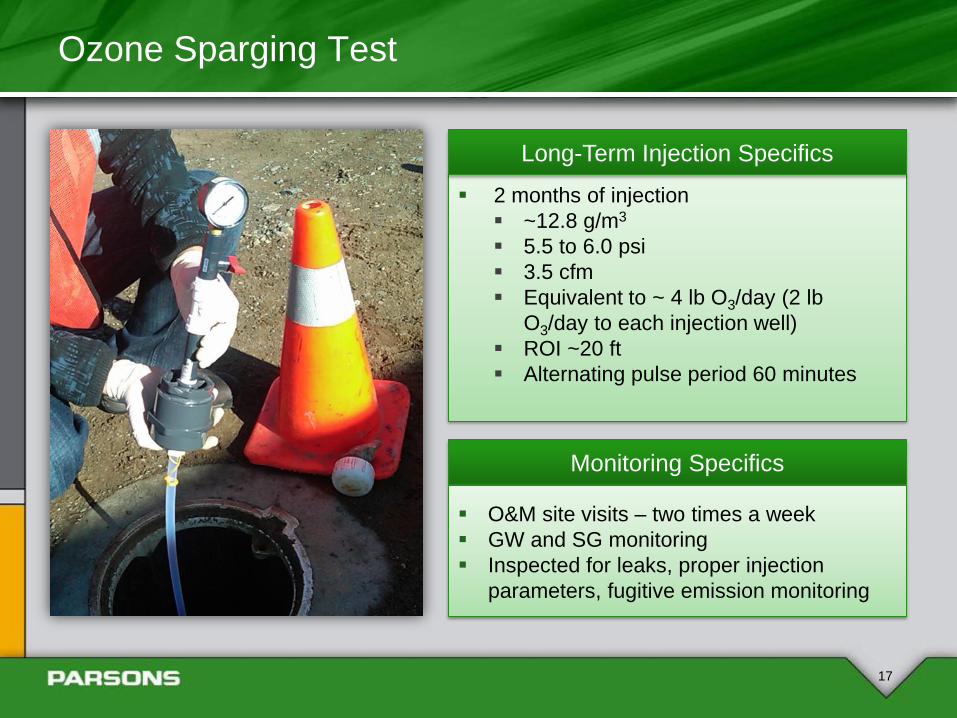
Ozone Sparging Test
17
2 months of injection
~12.8 g/m3
5.5 to 6.0 psi
3.5 cfm
Equivalent to ~ 4 lb O3/day (2 lb
O3/day to each injection well)
ROI ~20 ft
Alternating pulse period 60 minutes
Monitoring Specifics
O&M site visits – two times a week
GW and SG monitoring
Inspected for leaks, proper injection
parameters, fugitive emission monitoring
Long-Term Injection Specifics
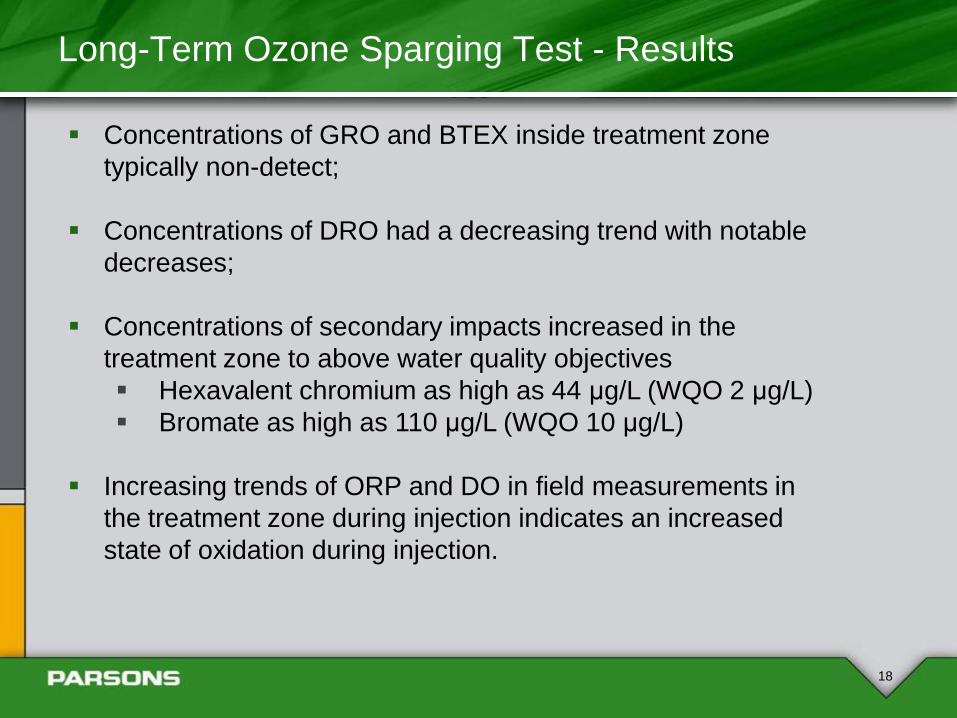
Long-Term Ozone Sparging Test - Results
18
Concentrations of GRO and BTEX inside treatment zone
typically non-detect;
Concentrations of DRO had a decreasing trend with notable
decreases;
Concentrations of secondary impacts increased in the
treatment zone to above water quality objectives
Hexavalent chromium as high as 44 μg/L (WQO 2 μg/L)
Bromate as high as 110 μg/L (WQO 10 μg/L)
Increasing trends of ORP and DO in field measurements in
the treatment zone during injection indicates an increased
state of oxidation during injection.
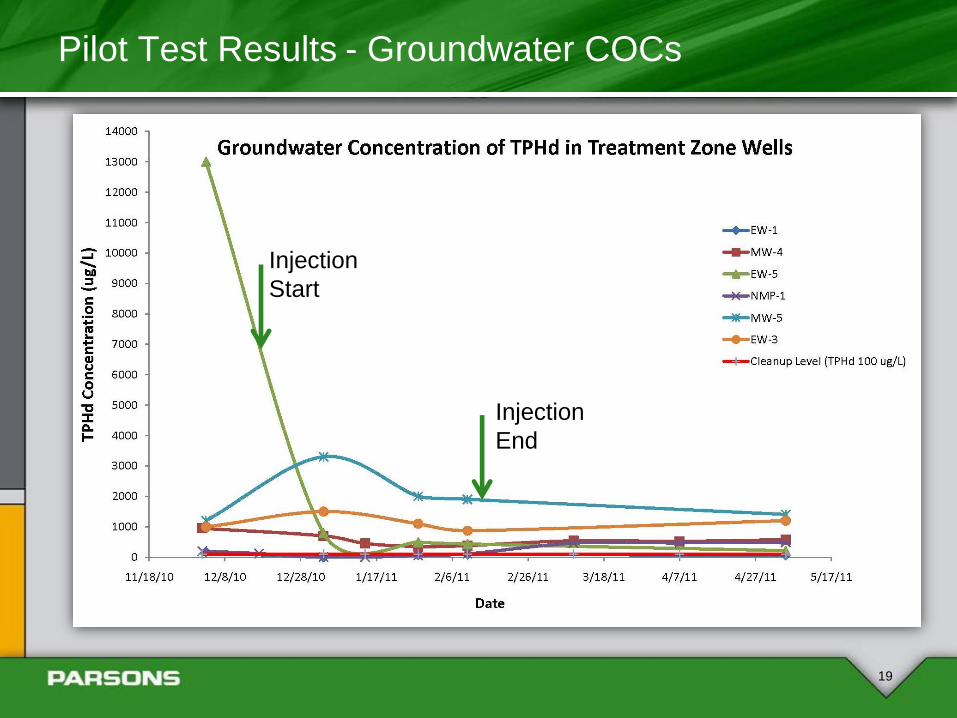
Pilot Test Results - Groundwater COCs
19
Injection
Start
Injection
End
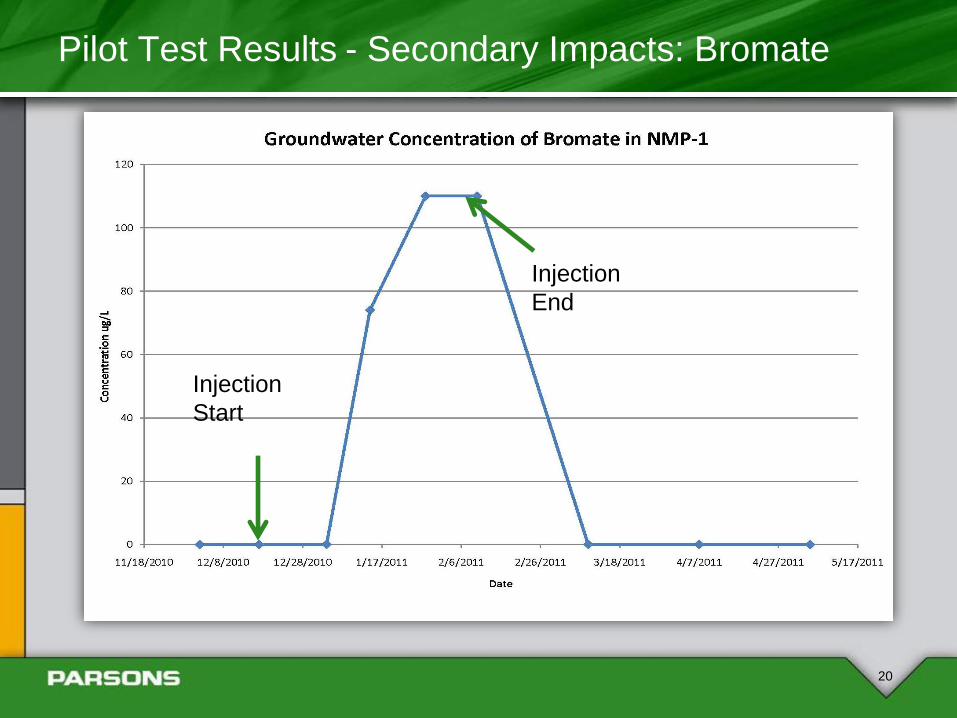
Pilot Test Results - Secondary Impacts: Bromate
20
Injection
Start
Injection
End
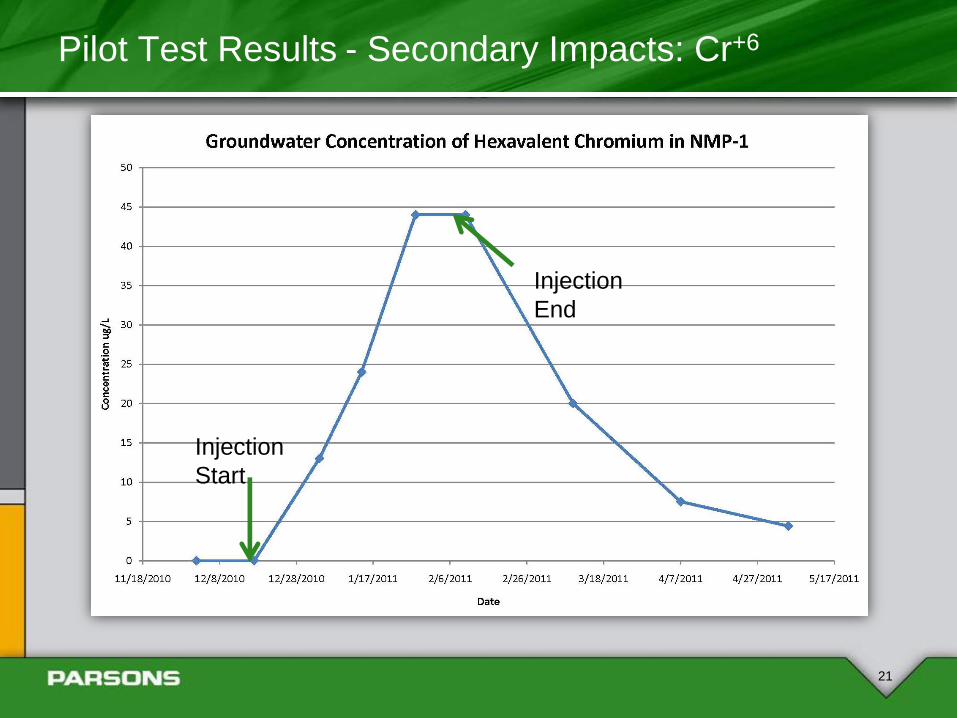
Pilot Test Results - Secondary Impacts: Cr+6
21
Injection
Start
Injection
End
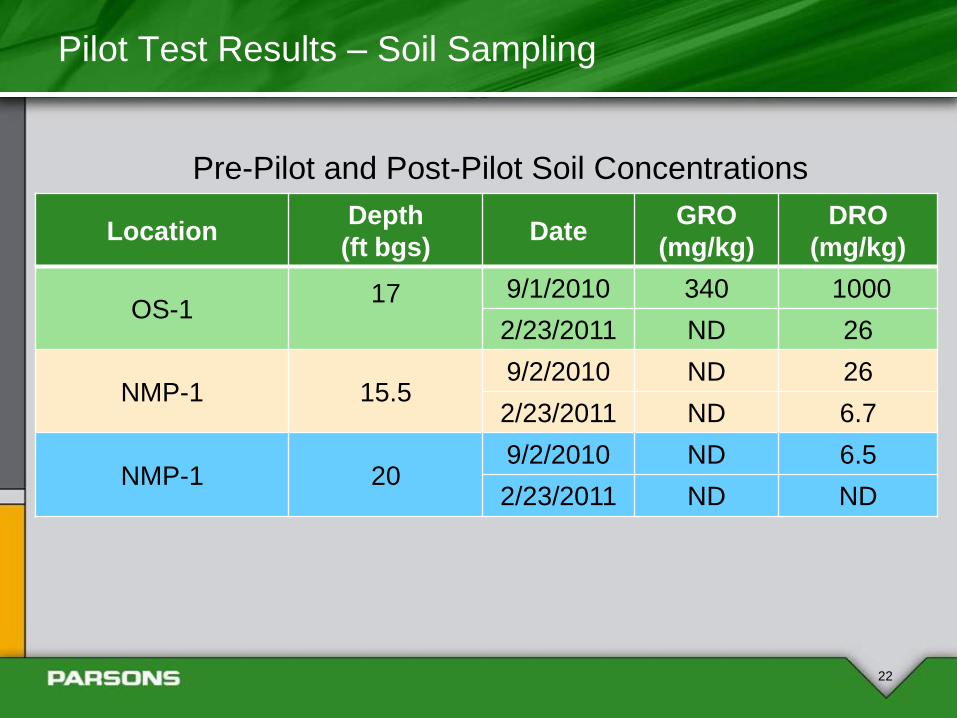
Pilot Test Results – Soil Sampling
22
Location Depth
(ft bgs) Date
GRO
(mg/kg)
DRO
(mg/kg)
OS-1 17
9/1/2010 340 1000
2/23/2011 ND 26
NMP-1 15.5 9/2/2010 ND 26
2/23/2011 ND 6.7
NMP-1 20 9/2/2010 ND 6.5
2/23/2011 ND ND
Pre-Pilot and Post-Pilot Soil Concentrations
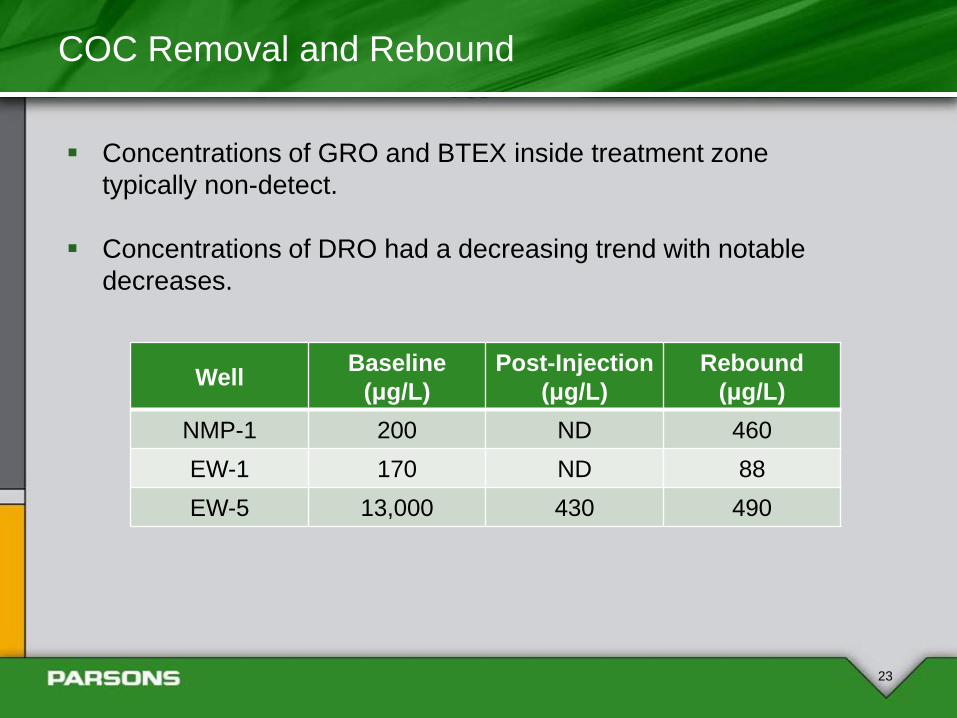
COC Removal and Rebound
23
Concentrations of GRO and BTEX inside treatment zone
typically non-detect.
Concentrations of DRO had a decreasing trend with notable
decreases.
Well Baseline
(μg/L)
Post-Injection
(μg/L)
Rebound
(μg/L)
NMP-1 200 ND 460
EW-1 170 ND 88
EW-5 13,000 430 490
Secondary Contaminants
24
Hexavalent Chromium and bromate detected in only NMP-1.
Increased above water quality objectives of 2 µg/L and 10 µg/L
respectively
Hexavalent Chromium decreased more than 50% the first month
and each month thereafter to reach baseline levels in three months
Bromate decreased more rapidly and was near baseline levels in
one month
Conclusions – Overall
25
ISCO using ozone successfully destroys COCs in saturated zone.
Ozone injection should be targeted to areas that experience large
rebound.
Groundwater secondary impacts attenuated to their background
levels without any secondary treatment.
Ozone/VOCs did not impact offsite residence and can be contained
within treatment zone by controlling injection rate without initiating a
mobile SVE system.
This technology is fit for this site and can be scaled up.
Materials selection is very important!
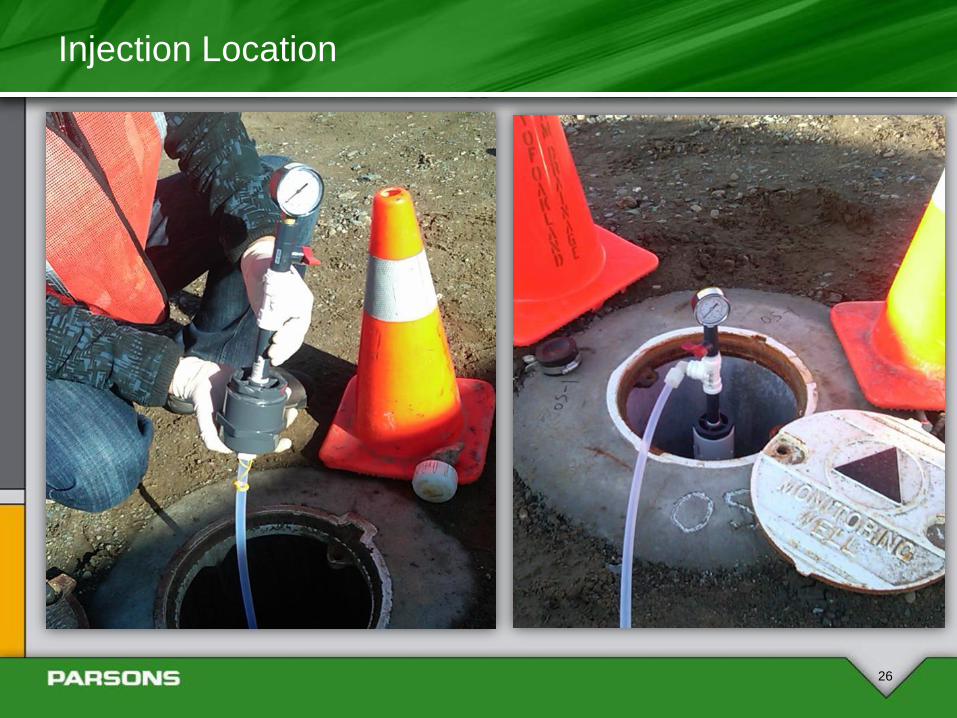
Injection Location
26
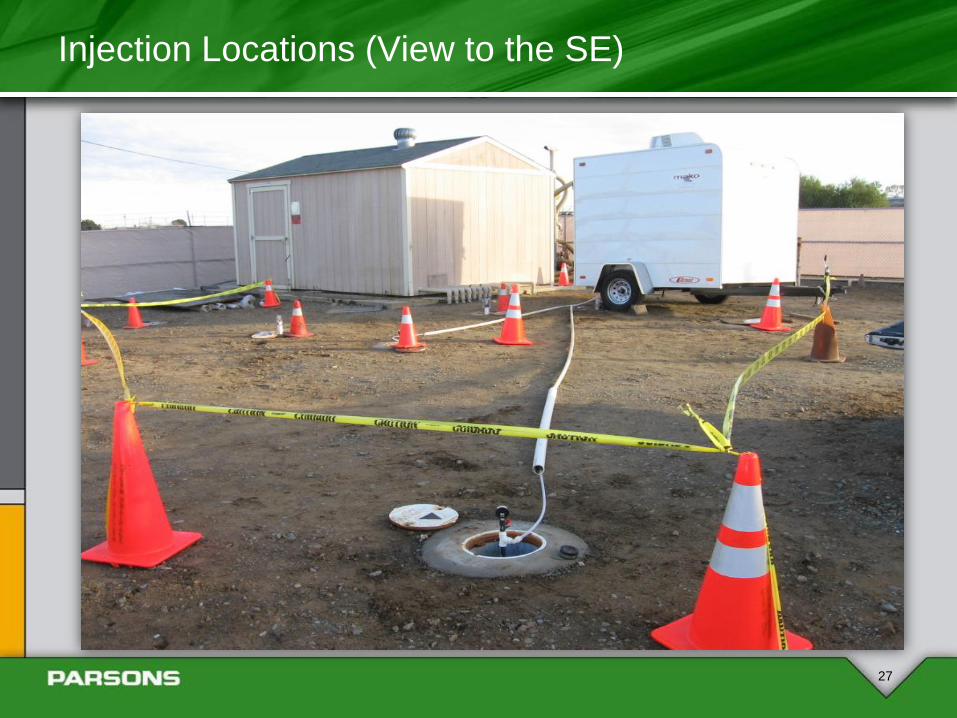
Injection Locations (View to the SE)
27
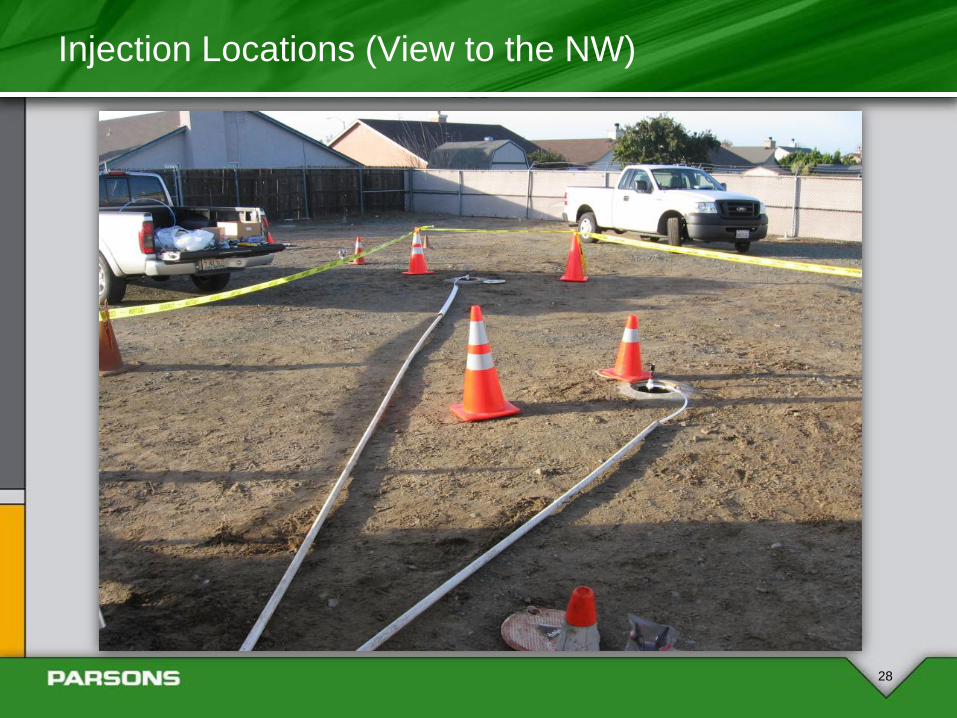
Injection Locations (View to the NW)
28

Questions
29
Thank You