in situ measurements of strains in composite battery...
TRANSCRIPT

Experimental MechanicsDOI 10.1007/s11340-014-9873-3
In Situ Measurements of Strains in Composite BatteryElectrodes during Electrochemical Cycling
E.M.C. Jones · M.N. Silberstein · S.R. White ·N.R. Sottos
Received: 21 June 2013 / Accepted: 21 February 2014© Society for Experimental Mechanics 2014
Abstract The cyclic stress in lithium-ion battery electrodesinduced by repeated charge and discharge cycles causeselectrode degradation and fracture, resulting in reducedbattery performance and lifetime. To investigate electrodemechanics as a function of electrochemical cycling, we uti-lize digital image correlation (DIC) to measure the strainsthat develop in lithium-ion battery electrodes during lithi-ation and delithiation processes. A composite graphiteelectrode is cycled galvanostatically (with constant cur-rent) in a custom battery cell while optical images ofthe electrode surface are captured in situ. The strain inthe electrode is computed using an in-house DIC code.On average, an unconstrained composite graphite electrodeexpands 1.41 % during lithiation and contracts 1.33 % dur-ing delithiation. These strain values compare favorably withpredictions based on the elastic properties of the composite
E.M.C. JonesDepartment of Mechanical Science and Engineering,University of Illinois at Urbana-Champaign,405 N. Mathews Ave., Urbana, IL 61801, USA
M.N. SilbersteinBeckman Institute for Advanced Science and Technology,University of Illinois at Urbana-Champaign,405 N. Mathews Ave., Urbana, IL 61801, USA
S.R. WhiteDepartment of Aerospace Engineering,Beckman Institute for Advanced Science and Technology,405 N. Mathews Ave., Urbana, IL 61801, USA
N.R. Sottos (�)Department of Materials Science and Engineering,Beckman Institute for Advanced Science and Technology,405 N. Mathews Ave., Urbana, IL 61801, USAe-mail: [email protected]
electrode and the expansion of graphite-lithium intercala-tion compounds (G-LICs). The establishment of this experi-mental protocol will enable future studies of the relationshipbetween electrode mechanics and battery performance.
Keywords Lithium-ion battery · Graphite compositeelectrode · Digital image correlation · Electrodemechanics · In situ strain measurement
AbbreviationsAPS – 3-aminopropyltriethoxysilaneCB – Carbon blackCMC – Carboxymethyl celluloseDIC – Digital image correlationDMC – Dimethyl carbonateEC – Ethylene carbonateG-LIC – Graphite-lithium intercalation compoundPCTFE – PolychlorotrifluoroethyleneRITC – Rhodamine B isothiocyanateSEI – Solid electrolyte interphaseTEOS – Tetraethoxysilane
Introduction
During the operation of lithium-ion batteries, lithium ionsdiffuse from the cathode to the anode when the battery ischarged, and from the anode to the cathode when the batteryis used as a power source and discharged. The intercalationof ions into and out of electrodes induces cyclic volumet-ric expansion and contraction of the electrodes, leadingto power and capacity fade via changes in the electrodeporosity and electrode fracture respectively [1].
The severity of the electrode degradation is related tothe magnitude of the volumetric expansion of the active

Exp Mech
material. Graphite, which is used in commercial electrodes,expands 10 % by volume when it is fully lithiated [2],leading to internal stresses small enough to allow manyhundreds of cycles before significant fracture occurs. Incontrast, high-capacity anode materials, such as silicon andtin, expand 200-300 % by volume [3] and can experiencecomplete capacity loss after only a few cycles.
Understanding the relationship between the mechanicalproperties of battery electrodes and battery performanceis critical for the development of high capacity electrodesand extended service life. The body of literature devotedto studying the mechanical response of different electrodesduring electrochemical cycling is growing rapidly. Using aunique nano-battery cycled inside a transmission electronmicroscope (TEM), Liu et al. [4] studied the expansion ofindividual silicon and tin nano-wires and nano-particles dur-ing lithiation and have shown that particles smaller thana certain threshold (ca. 150 nm) do not crack. Beaulieuet al. [3] adapted an atomic force microscope (AFM) tostudy the expansion and cracking of thin films of silicon andtin during lithiation. Sethuraman et al. [5] used a substratecurvature technique to track the stress in thin film siliconelectrodes during electrochemical cycling, and showed thecyclic development of compressive and tensile stresses.
Complementing the experimental work, theoretical stud-ies have been devoted to modeling the expansion and con-traction of individual particles of active material and theresulting internal stresses. Bower et al. [6] formulated acomplete set of field equations and constitutive equationsgoverning the coupled mechanics and electrochemistry ofthe lithiation and delithiation of silicon. Deshpande et al. [7]developed a mathematical model of diffusion-induced stressin nano-wire electrodes and found that surface effects candecrease diffusion-induced tensile stress, and thus reducethe probability of fracture.
In addition to studying model electrodes of individualparticles of active material, researchers have also investi-gated the mechanical behavior of composite electrodes. Liet al. [8] measured the mechanical properties of differentpolymer binders in composite silicon electrodes. Timmonset al. [9] observed particle motion and expansion in acomposite electrode qualitatively using optical microscopy.Sethuraman et al. [10, 11] adapted their substrate curva-ture technique to quantify the stresses in composite graphiteelectrodes harvested from a commercial battery and in com-posite silicon electrodes, and Qi et al. [12] used digitalimage correlation to measure full-field strains of a compos-ite graphite electrode harvested from a commercial battery.
In this paper, we further develop the application of digi-tal image correlation (DIC) to measure the strain in batteryelectrodes during electrochemical cycling. In contrast toQi et al., who studied a commercial composite graphiteelectrode on a current collector [12], we utilize a custom
battery cell with a free-standing graphite composite elec-trode without a current collector. The minimal constrainton the graphite electrode enables measurement of the freeexpansion of the electrode. In addition to our experimentalwork, we predict the strain that develops in a compos-ite graphite electrode during lithiation of graphite particlesand identify key parameters that influence the mechanicalresponse of the electrode.
Custom Battery Cell
Commercial Batteries
In commercial batteries, the electrodes are comprised ofa porous composite layer, 100-150 μm thick, on top ofa metal foil current collector, 10-25 μm thick. The com-posite contains particles of active material ca. 20 μmdiameter, a nano-size conductive additive, and a poly-mer binder. Metal oxides, such as LiCoO2, LiMnO2,and Li(Ni1/3Co1/3Mn1/3)O2, typically serve as the activematerial for cathodes, while graphite is usually the activematerial for anodes. Electrodes are fabricated in long rect-angular sheets that are stacked together, alternating cathode,separator, and anode. The separator is a porous, ionicallyconducting and electronically insulating polymer film, ca.25 μm thick, that prevents the electrodes from coming intocontact. The pores of the electrodes and the separator arefilled with a non-aqueous, liquid electrolyte that is ionicallyconducting and electronically insulating.
Custom Battery Cell Design
We designed and fabricated two custom battery cells toenable in situ, full-field strain measurements during lithi-ation and delithiation of the working electrode. Our initialcell design is shown in Fig. 1. Key features of the cellinclude side-by-side arrangement of electrodes and a quartzwindow that allows optical access to the electrodes duringcycling. No polymer separator is needed since the electrodesare separated by several millimeters. The working electrode,19 mm in diameter, is a graphite-based composite electrodefabricated on a copper current collector, similar to commer-cial batteries. It is adhered to a circular substrate with a thinlayer of rigid epoxy, and electrical connection is made tothe backside of the current collector by a spring placed ina hole in the substrate (Fig. 2). The counter electrode is aring of lithium metal surrounding the working electrode andis attached to stainless steel pins that protrude through thebase of the cell.
Two different configurations were examined for theattachment of the working electrode to the substrate. Inthe first configuration (Fig. 2(a)), the epoxy adhesive layeris approximately 18 mm in diameter, which completely

Exp Mech
A
B
C
D
E
F
G
x
y
AC
G
Region ofinterest
10 mm
Fig. 1 Representational front view (left) and schematic exploded view(right) of the initial design of the custom battery cell. (A) workingelectrode of a composite graphite electrode on a current collector,(B) stainless steel substrate for working electrode, (C) lithium metalcounter electrode, (D) stainless steel pins for mechanical and electri-cal connection of counter electrode, (E) PCTFE main body, (F) quartzwindow, (G) lid
constrains the working electrode in-plane, except at the veryedge of the electrode. In the second attachment configura-tion (Fig. 2(b)), the diameter of the epoxy adhesive layer isdecreased to 5 mm, which constrains only the center of theelectrode.
Based on the results from testing of the initial cell design(see section “Constrained electrode”), a second custom bat-tery cell was designed that uses a free-standing compositegraphite electrode without a current collector (Fig. 3). Thefree-standing electrode is cantilevered from the edge of astainless steel substrate and spot welded to the substrate atone end, creating a nearly unconstrained electrode. Electri-cal connection is made through the spot welds. Similar tothe initial cell design, lithium metal is used as the counterelectrode, and a quartz window provides optical access tothe electrodes during cycling.
Speckle Pattern
Composite graphite electrodes have a natural speckle pat-tern appropriate for DIC at large magnifications. Duringcycling, however, graphite changes color as a function oflithium content, and individual speckles appear, disappearand change size and shape as particles of graphite deformand undergo rigid body motion. These changes lead topoorly-correlated speckle patterns.
Here, a speckle pattern is generated by spincoating flu-orescent silica nano-particles on the electrode surface [13–15]. This method overcomes the issues with the natural
ABC
D
E
A
D
E
BC
(a) (b)
Fig. 2 Schematic cross-section view of the working electrode andsubstrate used in the initial custom battery cell. (A) graphite compos-ite electrode, (B) copper current collector, (C) thin epoxy adhesivelayer, (D) stainless steel substrate, and (E) spring for electrical connec-tion to the backside of the current collector. (a) - the epoxy adhesivelayer (18 mm) was approximately the same diameter as the workingelectrode (19 mm); (b) - the epoxy adhesive layer was small (5 mm)compared to the working electrode (19 mm)
speckle pattern and is general to electrode material andtype. The particles are synthesized in house using stan-dard particle processing techniques [16, 17], and have acore of silica coupled with a rhodamine-based fluorescentdye and a shell of pure silica to protect the dye frombleaching. Figure 4 shows a scanning electron micrographof a composite graphite electrode with the particles onits surface, and Fig. 5 shows a representative speckle pat-tern generated using the imaging parameters described insection “Imaging Parameters”.
Experimental Procedure
Materials
Plastic portions of the custom battery cells were fabricatedfrom polychlorotrifluoroethylene (PCTFE, Plastics Interna-tional), and steel portions of the electrode substrates werefabricated from 316 stainless steel. A Torr-Seal equiva-lent epoxy was used to adhere electrodes to the substratesin the initial cell design. Armor Crystal o-rings (ValquaAmerica) and a quartz window (99.995 % SiO2, 1.6 mmthick, McMaster-Carr) was used to seal the cell.
The electrolyte consisted of 1M lithium perchlorate(LiClO4, battery grade, dry, 99.99 %, Sigma-Aldrich) dis-solved in ethylene carbonate (EC, anhydrous, 99 %, Sigma-Aldrich) and dimethyl carbonate (DMC, anhydrous,>99 %,Sigma-Aldrich) in a 1:3 volume ratio. Lithium metal (0.75mm thick, Alfa Aesar) was used as a counter electrode.Composite graphite electrodes were fabricated from sodiumcarboxymethyl cellulose binder (CMC, average Mw ∼700,000, degree of substitution 0.8-0.95, Sigma-Aldrich),
Exp Mech
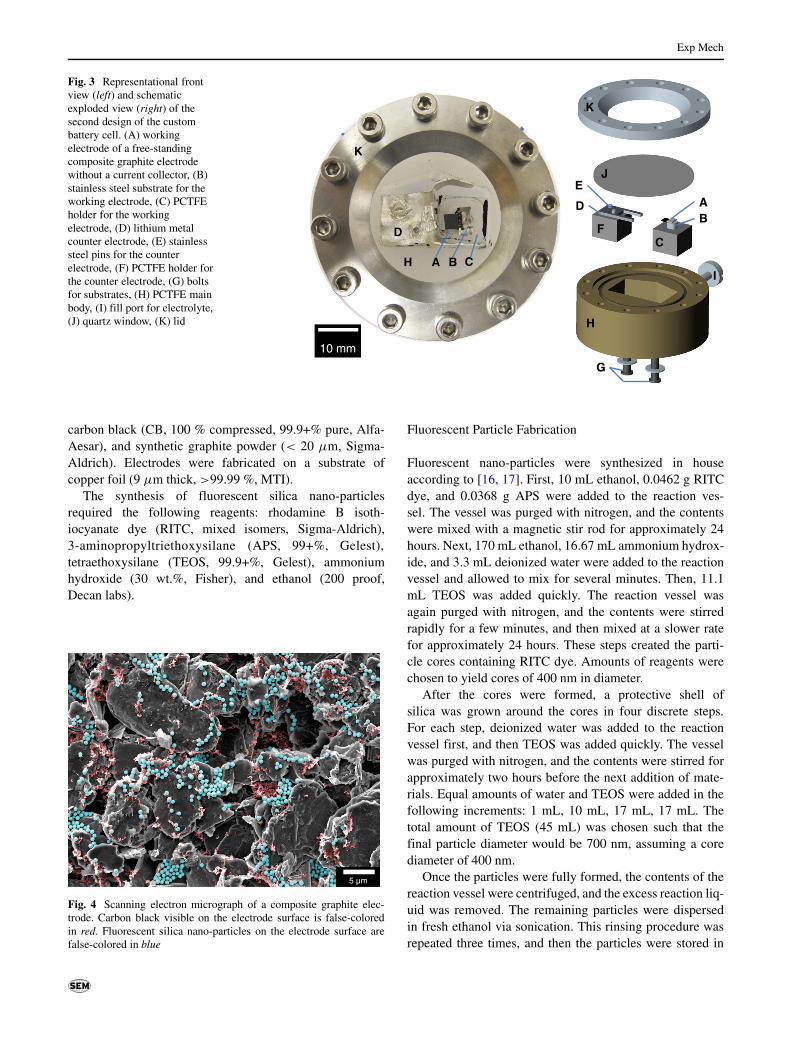
Fig. 3 Representational frontview (left) and schematicexploded view (right) of thesecond design of the custombattery cell. (A) workingelectrode of a free-standingcomposite graphite electrodewithout a current collector, (B)stainless steel substrate for theworking electrode, (C) PCTFEholder for the workingelectrode, (D) lithium metalcounter electrode, (E) stainlesssteel pins for the counterelectrode, (F) PCTFE holder forthe counter electrode, (G) boltsfor substrates, (H) PCTFE mainbody, (I) fill port for electrolyte,(J) quartz window, (K) lid
A
D
B
K
C
ADB
J
C
H
E
I
G
K
F
H
10 mm
carbon black (CB, 100 % compressed, 99.9+% pure, Alfa-Aesar), and synthetic graphite powder (< 20 μm, Sigma-Aldrich). Electrodes were fabricated on a substrate ofcopper foil (9 μm thick, >99.99 %, MTI).
The synthesis of fluorescent silica nano-particlesrequired the following reagents: rhodamine B isoth-iocyanate dye (RITC, mixed isomers, Sigma-Aldrich),3-aminopropyltriethoxysilane (APS, 99+%, Gelest),tetraethoxysilane (TEOS, 99.9+%, Gelest), ammoniumhydroxide (30 wt.%, Fisher), and ethanol (200 proof,Decan labs).
5 µm
Fig. 4 Scanning electron micrograph of a composite graphite elec-trode. Carbon black visible on the electrode surface is false-coloredin red. Fluorescent silica nano-particles on the electrode surface arefalse-colored in blue
Fluorescent Particle Fabrication
Fluorescent nano-particles were synthesized in houseaccording to [16, 17]. First, 10 mL ethanol, 0.0462 g RITCdye, and 0.0368 g APS were added to the reaction ves-sel. The vessel was purged with nitrogen, and the contentswere mixed with a magnetic stir rod for approximately 24hours. Next, 170 mL ethanol, 16.67 mL ammonium hydrox-ide, and 3.3 mL deionized water were added to the reactionvessel and allowed to mix for several minutes. Then, 11.1mL TEOS was added quickly. The reaction vessel wasagain purged with nitrogen, and the contents were stirredrapidly for a few minutes, and then mixed at a slower ratefor approximately 24 hours. These steps created the parti-cle cores containing RITC dye. Amounts of reagents werechosen to yield cores of 400 nm in diameter.
After the cores were formed, a protective shell ofsilica was grown around the cores in four discrete steps.For each step, deionized water was added to the reactionvessel first, and then TEOS was added quickly. The vesselwas purged with nitrogen, and the contents were stirred forapproximately two hours before the next addition of mate-rials. Equal amounts of water and TEOS were added in thefollowing increments: 1 mL, 10 mL, 17 mL, 17 mL. Thetotal amount of TEOS (45 mL) was chosen such that thefinal particle diameter would be 700 nm, assuming a corediameter of 400 nm.
Once the particles were fully formed, the contents of thereaction vessel were centrifuged, and the excess reaction liq-uid was removed. The remaining particles were dispersedin fresh ethanol via sonication. This rinsing procedure wasrepeated three times, and then the particles were stored in

Exp Mech
Fig. 5 Magnified view of acomposite graphite electrodespot welded to a stainless steelsubstrate (left) andrepresentative speckle patterngenerated by fluorescentnano-particles on the surface ofthe graphite electrode (right).The image on the right wastaken under fluorescent imagingconditions described insection “Imaging Parameters”
Region of interest
x
y
Spot welds
2 mm
ethanol at approximately -20◦ C. The final diameter of theparticles, as measured from a scanning electron micrograph,was 550-620 nm.
In order to generate a speckle pattern for DIC, the par-ticles were sonicated in ethanol immediately before use,and then spincoated at approximately 1000 RPM onto thesurface of the electrode prior to battery cell assembly.
Composite Graphite Electrode Fabrication
A suspension of CMC, CB and water in a 1:1:100 massratio was mixed for several days with a magnetic stir rodin order to fully disperse the CB. The complete electrodeslurry was made from 5.1 g of the CMC/CB suspension and0.4 g graphite, and was manually agitated and then mixedwith a magnetic stir rod for several days in order to fullyhomogenize the slurry.
A substrate of copper foil was cleaned with acetone andethanol. The electrode slurry was deposited onto the cop-per foil using a doctor blade to control the slurry thicknessand then allowed to dry under ambient conditions. Thefinal composition of the electrode was 8:1:1 mass ratioof graphite, CB, and CMC, with a measured density of1.0 g·cm−3. The porosity was calculated from the overallelectrode density, the density of individual electrode compo-nents, and the mass ratio of individual electrode componentsto be 52 % by volume.
Electrodes on a copper current collector for use in theinitial cell were prepared by punching pieces 19 mm indiameter from the electrode sheet. Excluding the mass ofthe copper current collector, electrodes were approximately8.9 mg, indicating 7.1 mg active material (graphite). Theelectrode on a current collector was adhered to its substrateby a thin layer of epoxy - either 18 mm or 5 mm in diameter- that was allowed to cure under ambient conditions for 24hours before the electrode was assembled into the custombattery cell.
In order to prepare electrodes for use in the secondcell design, the composite electrode was carefully peeled
off of the copper foil, creating a free-standing electrode,90-100 μm thick, with no current collector. The free-standing electrode was cut using a razor blade into piecesapproximately 3 × 5 mm. Electrodes typically massed1.5–2.5 mg total, indicating to 1.2–2 mg active material(graphite). The electrode was spot welded to its substrate at120 V through a piece of stainless steel foil.
Custom Cell Assembly
The composite graphite electrode (working electrode) on itssubstrate was assembled into the custom battery cell, and
laser zoom lens
camera
shutter(open position)
battery cell
filter
50 mm
laser beam expanding lens
Fig. 6 Imaging setup of custom battery cell during electrochemicalcycling. A 532 nm laser excites the fluorescent speckle pattern on theelectrode surface. Reflected laser light is filtered so that only the flu-orescent emitted light is captured in the images. A shutter blocks thelaser light during the majority of the test, and opens only when animage is being captured

Exp Mech
Fig. 7 Schematic of digitalimage correlation methodology.A grid of control points (purplecrosses) is defined over theregion of interest. Thenormalized cross-correlationcoefficient (equation (1)) iscomputed by convolving asubset in the deformed image(red box) with the correspondinglarger subset in the referenceimage (blue box). The actualdisplacement (u,v) is thedisplacement that maximizes thecorrelation coefficient
Deform specimen
Reference imagey
x
x’
y’
v’ u’
Deformed imagey
x
x’
y’
Ref. image subset Def. image subset Control points
Legend
the cell was transferred to a glovebox with an argon atmo-sphere with O2 and H2O levels both under 3 ppm. A piece oflithium metal (counter electrode) was pressed onto stainlesssteel pins on its substrate. The cavity of the main body ofthe cell was filled with approximately 5 mL electrolyte, andthe cell was sealed with a quartz window and an o-ring. Thesealed cell was then brought out of the glovebox for testing.
Battery Cycling Experiments
Charge and discharge experiments were performed on anArbin potentiostat/galvanostat. The custom battery wascycled galvanostatically (at a constant current) between 2 Vand 0.01 V vs Li/Li+ at C/5 rate1 (approximatley 530 μAfor electrodes on a current collector used in the initial celland approximately 90–150 μA for free-standing electrodesused in the second cell). At each voltage limit, the volt-age was held constant for 11 minutes in order to capturean image at the end of each lithiation and delithiation. Thecell was allowed to rest (no applied current or voltage) for10 seconds before the direction of current was switched.In order to prevent accumulation of gas on the workingelectrode surface from electrolyte decomposition during theformation of the solid electrolyte interphase (SEI) layer[18], the cell was oriented vertically during cycling.
Imaging Parameters
To excite the fluorescent nano-particles on the surface ofthe electrode, a 532 nm, 75 mW laser beam (Crystalaser)was expanded and directed onto the electrode at an angle of20◦, creating an oval spot size of approximately 4× 5 mm.
1The C-rate normalizes the current used to cycle a battery based onthe mass, m (g), and the theoretical specific capacity, Q (Ah·g−1), ofthe active material in the working electrode. For a C-rate of C/X, theworking electrode should fully lithiate in X hours with a current, I(A), defined by I = Qm/X.
Experiments were carried out under a blackout blanketto prevent ambient light effects. Images were capturedusing a Retiga camera (Q-Imaging) and a 12X zoom lens(Navitar), for an effective scale of 2.44 μm·pixel−1. A620 nm filter was placed directly in front of the zoom lensto filter reflected laser light so that only emitted fluorescentlight was captured in the images. Image exposure of 2-5 secwas used, and images were captured every 10 minutes, lead-ing to approximately 30 images per each lithiation and eachdelithiation of the working electrode. To prevent bleachingof the particles, the laser was shuttered during the majorityof the test, and only unshuttered during image capture.
Figure 5 shows an image of the working electrode spotwelded to its substrate in the second custom battery cell anda representative speckle pattern created by the fluorescent
y
x
η
ξ
6
1 11
15
5 13
12
14
16
4
9
10
2 87 3
(-1,-1)
(1,1)
Representative finite element drawn through control points
from image correlation16-node, bi-cubic master element
Finite element Displacement node Quadrature point
Legend
Fig. 8 Schematic of finite element methodology used in strain cal-culations. Given displacements at a grid of control points (blackcircles), a 16-node finite element (green box) is drawn through thecontrol points. This element is mapped to a master element, withlocal coordinates ξ and η, and the displacements are interpolatedover the master element using bi-cubic finite element shape functions(equations (3a and 3b)). The derivatives of the interpolated displace-ments are calculated at the nine Legendre-Gauss points of the element(green stars), and then mapped back to the original element

Exp Mech
nano-particles on the electrode surface. The region capturedin the images, outlined by the yellow rectangle, was 3 ×2.5 mm. Figure 6 shows the experimental configuration ofthe camera, zoom lens, laser, and custom battery cell duringelectrochemical cycling.
Digital Image Correlation
Displacement Calculations
The DIC code used in this work was adapted from open-source code by Eberl et al. [19], and a complete, work-ing copy is available online [20]. The code first convertsthe images into matrices, with each entry in the matrix
corresponding to the intensity value at a pixel in the image.A grid of evenly-spaced control points is generated over theregion of interest at the same coordinates in both the refer-ence image and the deformed images, relative to the localimage coordinate system. The origin of the local coordinatesystem is at the top-left corner of the image. For each controlpoint, a subset of pixels is taken around the control point inthe deformed image, and a larger subset (generally twice asbig) is taken around the same control point in the referenceimage, as shown in Fig. 7.
The code computes the normalized cross-correlationcoefficient, C, [21] for a range of theoretical displace-ments (u′, v′) in 1 pixel increments by convolving the subsetfrom the deformed image with the larger subset from thereference image according to:
C(u′, v′
) =∑
x ′,y ′[(r(x ′, y ′
) − ru′,v′) (d
(x ′ − u′, y ′ − v′
) − d)]
{∑x ′,y ′
[(r (x ′, y ′)− ru′,v′
)2] ∑
x ′,y ′[(d (x ′ − u′, y ′ − v′)− d
)2]}1/2
(1)
where r is the intensity of the pixels in the reference subset,d is the intensity of the pixels in the deformed subset, and(x ′, y ′) are local subset coordinate axes whose origin is atthe control point at the subset center. In order to calculatedisplacements to within 1/100 of a pixel, the nine discretecorrelation coefficients surrounding the absolute maximumcoefficient are interpolated using a second order polynomialin u′ and v′. The actual displacement (u, v) for a controlpoint is the theoretical displacement (u′, v′) correspondingto the maximum interpolated correlation coefficient. Theoutput of the code is discrete displacement values for eachcontrol point for each image.
Displacements are smoothed prior to calculating strainsto provide robustness against the noise inherent to DIC. Inorder to reduce edge effects, the borders of the region ofinterest are first padded by reflecting displacement valuesat the edge of the region of interest across the border suchthat the first derivative is continuous. Around each controlpoint, a smoothing kernel of approximately 11 × 11 controlpoints is taken. The displacements at these control points areweighted with a Gaussian distribution centered at the cen-tral control point and then averaged. The displacement at thecentral control point is replaced by the weighted average.To obtain smoother results, this process is repeated, usingthe averaged displacements from the previous smoothingiteration as inputs in the next smoothing iteration.
In this work, a grid of 88 by 114 control points withhorizontal and vertical spacing of 10 pixels (24.4 μm),and a subset size of 26 × 26 pixels (63.4 × 63.4 μm)are used during the image correlation. A reference image
is captured before cycling, and all displacement and straincalculations are computed with respect to the referenceimage. A smoothing kernel of 11 × 11 control points(244 × 244 μm) is used, and displacements are smoothedthree times.
Strain Calculations
Strains are calculated by interpolating displacements usingfinite element shape functions. A 16-node finite element isdrawn such that the nodes of the finite element correspondto the control points from the image correlation. This ele-ment is then mapped to a master element, as shown in Fig. 8,through:
(x, y) = f i(ξ, η) = N(ξ, η)Xi (2)
where (x, y) are the image coordinates, (ξ, η) are the localcoordinates of the master element, and f i is the mappingfunction, defined by the matrix multiplication of the finiteelement shape functions defined on the master element, N ,and the image coordinates of the nodes for element i, Xi .The sixteen bi-cubic finite element shape functions, Nj , aredefined according to:
Nj (ξ, η)=(aξ3+bξ2+cξ+d
) (eη3+f η2+gη+h
)(3a)
Nj (ξ, η) ={
1 at node j0 at all other nodes
(3b)

Exp Mech
where a, b, ..., h are constants. Displacements are inter-polated over the master element and mapped back to theoriginal element through:
UI (x, y)|(x,y)=f i(ξ,η) = N(ξ, η)UiEL (4)
where UI (x, y) are the interpolated displacements as afunction of image coordinates (x, y) and Ui
EL is a matrixcontaining displacements in x and y directions of theelement nodes for element i. The first partial derivatives,∇U(x, y), of the interpolated displacements are calculatedthrough:
∇U(x, y)|(x,y)=f i(ξ,η) = ∇N (ξ, η)[J i(ξ, η)
]−1Ui
EL (5)
where J i is the Jacobian of the mapping function forelement i, defined according to:
J i(ξ, η) =[f i(ξ, η)
]′ = ∇N(ξ, η)Xi (6)
The interpolation scheme is most accurate at the nineLegendre-Gauss points of the master element [22, 23],defined by combinations of (ξ, η) = {−√
3/5, 0,√
3/5}.The displacement derivatives are therefore calculated atthese discrete points for all possible elements that canbe drawn through the control points. Overlapping Gausspoints from neighboring elements are then averaged, giv-ing discrete displacement gradient values on a grid slightlysmaller than the grid of control points. Components ofthe Green-Lagrangian finite strain tensor, Eij , are thencalculated:
Eij = 1
2
(∂Ui
∂Xj
+ ∂Uj
∂Xi
+ ∂Uk
∂Xi
∂Uk
∂Xj
)(7)
Results and Discussion
Electrochemical Cycling
Figure 9 shows the electrochemical data for 5 cycles of afree-standing composite graphite working electrode cycledgalvanostatically at C/5 rate in the second custom batterycell (Fig. 3). Electrodes cycled in the initial cell (Fig. 1)and electrodes cycled without fluorescent nano-particles in aflooded beaker cell had qualitatively and quantitatively sim-ilar electrochemical performance. The red circle representsthe open circuit voltage of the cell before cycling. As lithiumions move from the lithium metal counter electrode to thegraphite working electrode, the voltage decreases (blacklithiation curve), and when lithium ions move in the reversedirection, the voltage increases (blue delithiation curve).
The capacity of the battery is equal to the integral of thecurrent over time, and is ideally a measure of the number
0 100 200 300 4000
0.5
1
1.5
2
2.5
Specific Capacity, Q (mAh/g)
Vol
tage
, V (
V v
s Li
/Li+
)
LithiationDelithiation
(a)
(b)
0 100 200 300 4000
0.05
0.1
0.15
0.2
0.25
0.3
Specific Capacity, Q (mAh/g)
Vol
tage
, V (
V v
s Li
/Li+
)
LithiationDelithiation
cycle 1
cycles 1 5
SEI formation & otherirreverisble capacity
increasingcycle number
cycles 2 5
Fig. 9 Voltage as a function of specific capacity for five cycles of anunconstrained composite graphite electrode cycled galvanostatically inthe second custom battery cell (Fig. 3) at C/5 rate. The capacity is nor-malized with respect to the mass of graphite in the working electrode.The red circle represents the start of cycling
of lithium ions that are transferred to and from the graphiteworking electrode. The lithiation portion of the first cycleshows an artificially high capacity due to irreversible chem-ical reactions that occur during the formation of the solidelectrolyte interphase (SEI) layer [18]. Subsequent cyclesare largely reversible, though the difference between thelithiation capacity and the delithiation capacity for eachcycle indicates the continual formation of the SEI or otherirreversible chemical reactions.
Strain Response
Constrained electrode
Figure 10 contains line scans of the strain that develops atthe end of the first lithiation of the constrained electrodecycled in the initial custom battery cell (Fig. 1) using thefirst attachment configuration (Fig. 2(a)). The line scanswere taken along a vertical line in the center of the regionof interest, marked by the red dashed line in the inset ofFig. 10. The horizontal normal strain, Exx , and the shear

Exp Mech
x
y
Fig. 10 Line scans of in-plane strain components at the end of thefirst lithiation of a graphite composite electrode cycled in the initialcell (Fig. 1) and attached to its substrate via a nearly complete layer ofepoxy (Fig. 2(a)). The line scans were taken along a vertical line (reddashed line) in the center of the region of interest (yellow rectangle)
strain, Exy , are both small over the entire region of interest.The vertical normal strain, Eyy , is concentrated in a ring lessthan 1 mm wide at the edge of the electrode, with negligiblestrain developing in the center of the electrode. It is hypothe-sized that the epoxy adhesive layer effectively constrains themajority of the electrode, and that significant strain devel-ops only in the edge of the electrode that is not constrainedby the epoxy.
When the constraint is relaxed and the electrode isattached to its substrate using the second attachment con-figuration (Fig. 2(b)), the electrode curls and uncurlsrepeatedly during lithiation and delithiation, preventingstrain measurements. The curling behavior of the bi-layerelectrode/current collector system arises as the graphiteelectrode expands and contracts while the copper currentcollector attempts to retain its size. It is analogous to the cur-vature change that occurs during a temperature change in abi-layer system made of materials with different coefficientsof thermal expansion, e.g., a bi-metallic thermostat.
Unconstrained electrode
A region of interest of 2.5 × 3.0 mm, with a DIC subsetsize of approximately 60 μm, was chosen for the presentwork. At this length scale, the composite response was con-sidered a homogeneous average of the individual particleresponse. Figure 11 contains contour plots and line scansof the strain components of the free-standing graphite elec-trode at the end of the first lithiation in the second custombattery cell (Fig. 3). The line scans were taken along a ver-tical line in the center of the region of interest, marked bythe red dashed line in the inset of Fig. 11(d). The horizontalnormal strain, Exx , is spatially uniform, while the verticalnormal strain, Eyy , is larger towards the unconstrained sideof the electrode (left) and smaller towards the side that was
Fig. 11 Contour plots and linescans of in-plane straincomponents at the end of the firstlithiation of an unconstrainedcomposite graphite electrodecycled in the second battery cell(Fig. 3). The line scans are takenalong a vertical line (red dashedline) in the center of the regionof interest (yellow rectangle),marked in the inset of (d)
Exx
X (μm)
Y (μm
)
500 1000 1500 2000 2500 3000
500
1000
1500
2000
Eyy
X (μm)
Y (μm
)
500 1000 1500 2000 2500 3000
500
1000
1500
2000
Eeqv
X (μm)
Y (μm
)
500 1000 1500 2000 2500 3000
500
1000
1500
2000
x
y
(d) (b)
(c) (a)
(%)
0.5
1.0
1.5
2.0
2.5

Exp Mech
spot welded to the substrate (right). The two normal strainsare of the same order of magnitude, and the shear strain,Exy , is negligible, as expected for an isotropic volumetricexpansion.
The state of strain of the electrode is given by therotationally invariant equivalent strain, defined accordingto:
Eeqv =[
3
2
(EijEij − 1
3EmmEnn
)]1/2
(8)
where Eij are the components of the two-dimensionalfinite-strain tensor. For each image captured during cycling,the equivalent strain is averaged over a vertical line in themiddle of the region of interest, indicated in Fig. 11(c) bythe red dashed line. The portion of the electrode in themiddle of the region of interest is sufficiently far from theconstraint of the spot welds to undergo nearly free expan-sion, yet is close enough to the support of the substratethat it does not undergo significant out-of-plane motiondue to electrode bending. Averaging the equivalent strainover a vertical line farthest from the spot weld constraint(left edge of the region of interest) increases the strainby less than 0.1 % while averaging over a vertical lineclosest to the spot weld constraint (right edge of the regionof interest) decreases the strain by approximately 0.2 %strain.
The average equivalent strain is plotted in Fig. 12 asa function of the working electrode capacity, normalizedwith respect to the mass of graphite in the working elec-trode. The start of the test is represented by the red circle.As the electrode is lithiated and the capacity increases, thestrain increases an average of 1.41 % per cycle (averagedover cycles 2-5). When the electrode is subsequently delithi-ated, the strain decreases an average of 1.33 % per cycle(averaged over cycles 2-5).
The expansion and contraction of the graphite electrodeis not completely reversible. During the first cycle in par-ticular, the electrode expands during lithiation more thanit contracts during delithiation, resulting in 0.30 % strainthat is not recovered. The total amount of non-recoverabledeformation increases with further cycles. Potential sourcesof the non-recoverable deformation, including plasticity,micro-fractures, and the formation of the solid electrolyteinterface, are currently being investigated.
Analytical Prediction of Composite ElectrodeExpansion
The elastic properties of a composite graphite electrode areestimated by treating the electrode as a graphite particulate-filled composite with a porous matrix of CB and CMC. The
0 100 200 300 4000
0.5
1
1.5
2
2.5
Specific Capacity, Q (mAh/g)
Equ
ival
ent S
trai
n, E
eqv (
%)
LithiationDelithiation
cycle 1
SEI formation & otherirreversible capacity
increasingcycle number
non−recoverabledeformation
Fig. 12 The equivalent strain (averaged along red dashed line inFig. 11(c)) of an unconstrained composite graphite electrode duringfive cycles of galvanostatic cycling in the second custom battery cell(Fig. 3) at C/5 rate. The capacity is normalized with respect to the massof graphite in the working electrode. The red circle represents the startof cycling
expansion of the composite electrode due to lithium inter-calation into graphite is modeled analogously to a thermalexpansion where lithium content is akin to a temperaturechange. Several assumptions are made to allow the problemto be analytically solvable:
– The electrode is fully unconstrained.– The electrode undergoes only elastic, reversible defor-
mation.– The electrode is fully lithiated and delithiated.– The lithiation and delithiation are spatially uniform.– The graphite particles, though individually anisotropic,
are oriented randomly within the electrode, causing theelectrode to be isotropic at the length scales consideredin the model.
– No electrochemical reactions occur other than the lithi-ation and delithiation of graphite.
– The electrolyte is free to move through the pores ofthe electrode without exerting significant forces on theelectrode.
Material Properties of the Composite Constituents
During lithium intercalation, graphite undergoes a seriesof smooth phase transitions between discrete, orderedgraphite-lithium intercalation compounds (G-LICs), mov-ing sequentially from unintercalated graphite to stage IV(LiC24), stage III (LiC18), dilute stage II (LiC18), stage II(LiC12), and finally stage I (LiC6) G-LIC [24, 25]. TheG-LICs are denoted both by roman numerals referring tothe number of graphite layers associated with each layerof intercalated lithium and by their chemical composition.Theoretically, the voltage of a graphite electrode is constantduring the phase transitions and decreases sharply when

Exp Mech
a complete phase is reached. In a given layer, there is atmost one lithium atom per six carbon atoms. A stage iscalled “dilute” if there are more than six carbon atoms perone lithium atom in intercalated layers. The structure of theG-LICs are shown schematically in Fig. 13.
Qi et al. used density functional theory (DFT) simu-lations to predict the average volume expansion, Young’smodulus and Poisson’s ratio for unintercalated graphite andstage III, dilute stage II, stage II, and stage I G-LICs [2].For our model, the stage III phase of the LiC18 compositionis used instead of the dilute stage II phase in order to corre-late the model with experimental results. Material propertiesof the G-LICs are linearly interpolated between the discretephases in order to have material properties for all lithiumcontents.
The Young’s modulus, Poisson’s ratio, and density of theCB and CMC are found in the literature [2, 8, 26–28]. Theelectrode porosity and volume fractions of each of the solidcomponents are calculated from the overall density of theelectrode (1.0 g·cm−3), the densities of the individual com-ponents, and the mass ratio of the solid components (8:1:1graphite:CB:CMC).
The bulk and shear moduli for all of the electrode compo-nents are calculated from the Young’s moduli and Poisson’sratios assuming isotropy. Additionally, the linear strain fromlithium intercalation of the G-LICs is computed from thevolumetric expansion assuming an isotropic expansion. Allmaterial properties are listed in Table 1.
Elastic Properties of the Composite Electrode
The lower bound of the effective shear moduli, Gm, andbulk moduli, Km, of a matrix containing CB particlesand CMC binder is calculated using the inverse rule ofmixtures [29]:
(1/Km) = (φm,cb/Kcb)+ (φm,cmc/Kcmc) (9a)
(1/Gm) = (φm,cb/Gcb)+ (φm,cmc/Gcmc) (9b)
with
φm,cb = φcb
φcb + φcmc
(10a)
φm,cmc = φcmc
φcb + φcmc
(10b)
where Kcb and Kcmc are the bulk moduli of the CB andCMC respectively, Gcb and Gcmc are the shear moduli ofthe CB and CMC respectively, φm,cb and φm,cmc are the vol-ume fractions within the CB/CMC matrix of the CB and theCMC respectively, and φcb and φcmc are the volume frac-tions within the complete composite electrode of the CB andthe CMC respectively.
Open cell theory for an isotropic porous solid [30] isadapted to compute the effective bulk modulus of a porous
IV III III
DII II II I
(c) Stage IV (LiC24) (d) Stage III (LiC18) (e) Stage II (LiC12) (f) Stage I (LiC6)
Side views
(a) Top View (b)
Carbon atom (A-layer)
Carbon atom (B-layer)
Lithium atom
Fig. 13 Structure of graphite-lithium intercalation compounds (G-LICs). (a) Top view showing the in-plane spatial arrangement of lithium atomsin a fully intercalated (not dilute) stage, with one lithium atom per six carbon atoms. (b) The theoretical voltage of a graphite electrode as afunction of lithium content. The voltage is constant during phase transitions and drops sharply once a stage is complete. (c)–(f) Side views showingthe arrangement of layers of lithium atoms between graphite layers for stage IV, stage III, stage II, and stage I G-LICs. The roman numerals referto the number of graphite layers associated with a single layer of intercalated lithium. Adjacent graphite layers adopt AB stacking while graphitelayers on either side of a layer of intercalated lithium adopt AA stacking

Exp Mech
Table 1 Material properties of the constituents of the graphite composite electrode
Young’s Poisson’s Bulk Shear Density Volumetric Linear Volume Reference
Modulus Ratio Modulusa Modulusa Expansion Straina Fraction
(GPa) (–) (GPa) (GPa) (g·cm−3) (%) (%) (–)
C (graphite) 32.47 0.315 29.25 12.35 2.2 0 0 0.36 [2, 28]
LiC18 (stage III) 28.57 0.39 43.26 10.23 – 3.6 1.2 – [2]
LiC12 (stage II) 58.06 0.34 60.48 21.66 – 4.6 1.5 – [2]
LiC6 (stage I) 108.67 0.24 69.66 43.82 – 10 3.2 – [2]
CMC 1.2 0.45 4.0 0.41 1.6 0 0 0.06 [8, 26]
CBb 32.47 0.315 29.25 12.35 1.9 0 0 0.06 [2, 27]
porosity – – – – – – – 0.52 –
aThe bulk and shear moduli were calculated from the Young’s modulus and the Poisson’s ratio, and the linear strain was calculated from the
volumetric expansion assuming isotropybThe Young’s modulus and Poisson’s ratio for carbon black are taken to be the same as unintercalated graphite
matrix, Kpm, with the previously defined CB and CMCmatrix as the solid part:
Kpm =(
1
3(1 − 2νpm)
)(9KmGm
3Km +Gm
)(ρpm
ρm
)2
(11)
with
ρm = φm,cbρcb + φm,cmcρcmc (12a)
ρpm = φpm,cbρcb + φpm,cmcρcmc (12b)
and
φpm,cb = φcb
φpm(13a)
φpm,cmc = φcmc
φpm(13b)
φpm = φcb + φcmc + φp = 1 − φg (13c)
where ρm is the density the solid portion of the CB/CMCmatrix, ρpm is the density of the porous matrix (CB, CMC,and porosity), φpm,cb and φpm,cmc are the volume frac-tions within the CB/CMC porous matrix of CB and CMCrespectively, φp is the porosity within the complete com-posite electrode, and φg and φpm are the volume fractionswithin the complete composite electrode of, respectively,the graphite and porous matrix (i.e. CB, CMC and porosity).The Poisson’s ratio of the porous matrix, νpm, is assumed tobe equal to 1/3 [30].
The bulk modulus, Ke, of the complete composite elec-trode is computed by applying the “S-Combining Rule” [29]for graphite particulates in a porous matrix according to:
Ke = Kpm
(1 + φgξlχ
)
1 − φgχ(14)
with
χ = Kg −Kpm
Kg + ξlKpm
(15a)
= 1 + φgφpm(1 − γφpm
) (Kg −Kpm
)(ξu − ξl)
Kg + ξu(φgKg + φpmKpm
) (15b)
ξu = 2(1 − 2νg
)Kg(
1 + νg)Kpm
(15c)
ξl = 2(1 − 2νpm
)
(1 + νpm
) (15d)
γ = 2λ∗ − 1
λ∗(15e)
where νg is the Poisson’s ratio of the G-LICs and Kg
is the bulk modulus of randomly oriented particles ofG-LICs, calculated from the Young’s modulus and Poisson’sratio assuming isotropy and linearly interpolated betweendiscrete phases. The critical volume fraction for randomclose packing of the particle filler, λ∗, is estimated as2/3 [29].
Predicted Expansion of the Composite Electrode
The linear strain due to lithium intercalation of the completecomposite electrode, εe, is estimated according to:
εe = εavg +(
εpm − εg
1/Kpm − 1/Kg
)[1
Ke
− 1
Kavg
](16)
with
εavg = φgεg + φpmεpm (17a)
1
Kavg
= φg
Kg
+ φpm
Kpm
(17b)

Exp Mech
where εg is the linear strain of G-LICs due to lithium inter-calation (calculated from the volume expansion assumingisotropy (Table 1) and linearly interpolated between discretephases), and where the rule of mixtures and inverse rule ofmixtures are used to calculate the volume-fraction averagesof the lithium-intercalation strain, εavg, and the bulk modu-lus, Kavg, of the composite electrode. Because the CB/CMCporous matrix does not lithiate, its lithium-intercalationstrain, εpm, is zero.
Equations (16)–(17b) are adapted from the thermalexpansion of a two-part composite where both the compos-ite and its constituents are isotropic [29, 31]. In our model,lithium content is akin to a temperature change.
Comparison to Experimental Results
The predicted linear lithium-intercalation strain of randomlyoriented G-LICs (interpolated between distinct phases), thepredicted linear strain of the composite electrode due tolithium intercalation of graphite (equation (16)), and thestrain from cycle 2 of the experimental results are com-pared in Fig. 14. The experimental strain was shifted downby 0.30 % on the y-axis in order to account for the non-recoverable deformation that occurred in the first cycle. Thevertical dashed lines represent the three phases of G-LICsused in the model (left to right, stage III LiC18, LiC12, andLiC6).
0 100 200 300 4000
0.5
1
1.5
2
2.5
3
3.5
4
Specific Capacity, Q (mAh/g)
Line
ar S
trai
n (%
)
Model − Composite (εe, Eqn. 14)
Model − G−LICs (εg, Table 1)
Exp − Lithiation 2, shiftedExp − Delithiation 2, shifted
(a) (b) (c)
Fig. 14 Predicted linear strain due to lithium intercalation of anunconstrained composite graphite electrode (red line) compared withthe predicted linear strain of randomly oriented graphite-lithium inter-calation compounds (G-LICs) (green line) and experimentally mea-sured strain of an unconstrained composite graphite electrode (blackand blue lines). The vertical dashed lines represent the three discretephases of G-LICs used in the model: (a) stage III LiC18, (b) LiC12, and(c) LiC6. The linear strain of G-LICs (green line) is based on linearinterpolation between values of the linear strain of each distinct phase(Table 1). The experimental data, from cycle 2 of Fig. 12, was shifteddown on the y-axis by 0.30 %, an amount equal to the non-recoverabledeformation of the first cycle. The capacity is normalized with respectto the mass of graphite in the working electrode
The model is insensitive to variations in the properties ofindividual components of the composite electrode. A sen-sitivity study of the Young’s modulus, Poisson’s ratio, anddensity of CMC, CB and G-LICs shows that for a changeof +/− 10 % in any property except the Poisson’s ratio ofthe porous matrix or the density of G-LICs, the maximumcomposite electrode strain remains at 1.92 %. A change of+/− 10 % in the assumed Poisson’s ratio of the porousmatrix of 1/3 leads to a maximum composite electrodestrain of 1.96 % to 1.87 % (a change of +/− 2 % fromthe original 1.92 % strain). For a given mass fraction ofgraphite, increasing the density of G-LICs by 10 % effec-tively decreases the volume fraction of G-LICs, which leadsto a decrease in the maximum composite strain to 1.78 % (achange of 7 % from the original 1.92 % strain); the oppositetrend holds for a decrease in the density of G-LICs.
The two experimentally adjustable composite parametersthat affect the strain significantly are the density of the elec-trode (essentially the porosity of the electrode) and the massratio of graphite, CB, and CMC. Changing either by +/−10 % results in a maximum strain in the composite electrodeof 2.06 % to 1.76 % (a change of +/− 8 % from the orig-inal 1.92% strain). By tailoring the electrode porosity andloading of graphite, the global strain in the composite elec-trode can be reduced to nearly half of the 3.2 % strain ofrandomly-oriented graphite particles.
The average experimentally measured strain that devel-ops per cycle is 1.41 % in expansion during lithiation and1.33 % in contraction during delithiation (averaged overcycles 2-5). Taking into account the reduced capacity theelectrode achieves experimentally (303 mAh·g−1 duringlithiation and 282 mAh·g−1 during delithiation), the experi-mental strain results agree well with the predicted compositestrain results. Three possible sources of experimental errorare the incomplete lithiation of the electrode, the mea-surement of the mass of graphite in the electrode and themeasurement of the electrode porosity. Because the modelassumes elastic, reversible deformation, it does not capturethe inelastic deformation seen experimentally. There arethree likely sources of inelastic deformation in the exper-iment, which are currently being investigated: plasticity,micro-fractures, and the formation of the solid electrolyteinterface.
Conclusions
A system has been developed to quantify the strainin lithium-ion battery electrodes during electrochemicalcycling. A free-standing, unconstrained composite graphiteelectrode was cycled in a custom battery cell that providesoptical access to the electrodes during cycling. A specklepattern for digital image correlation was generated using

Exp Mech
fluorescent silica nano-particles, and in-house DIC codewas used to correlate images captured in situ and calculatestrains.
Experimental results show that on average the compos-ite graphite electrode expands 1.41 % during lithiation ata capacity of 303 mAh·g−1 and contracts 1.33 % duringdelithiation at a capacity of 282 mAh·g−1. An analyticalmodel takes into account material properties of the poly-mer binder, carbon black, and graphite, as well as theporosity of the electrode and loading of graphite, and pre-dicts a strain at the composite length scale of 1.92 % at372 mAh·g−1 (theoretical capacity of graphite). Both theexperimental protocols and the analytical model developedhere will enable in the future more detailed measurementsand analysis of electrode mechanics during electrochemicalintercalation of lithium. With an enhanced understanding ofthe relationship between electrode mechanics and batteryperformance, new electrode compositions and architecturescan be engineered for improved batteries.
Acknowledgements This work was supported as part of the Centerfor Electrical Energy Storage - Tailored Interfaces, an Energy FrontierResearch Center funded by the U. S. Department of Energy, Office ofScience, Office of Basic Energy Sciences under Award Number 919DOE ANL 9F-31921NS. The authors would like to acknowledge theImaging Technology Group at the Beckman Institute for AdvancedScience and Technology for use of microscopy equipment, Dr. AndrewGewirth at the University of Illinois for insightful discussions, andDr. Joseph Lyding for use of spot welding equipment. E. Jones wassupported by the National Science Foundation Graduate Research Fel-lowship, and M. Silberstein was supported by the Arnold and MabelBeckman Foundation Postdoctoral Fellowship.
Appendix
Continuing the model in section “Analytical Prediction ofComposite Electrode Expansion”, the shear modulus of acomplete composite electrode, Ge, is estimated by applyingthe “S-Combining Rule” [29] for graphite particulates in aporous matrix according to:
Ge = Gpm
(1 + φgξGlχG
)
1 − φgGχG(18)
with
χG = Gg −Gpm
Gg + ξGlGpm
(19a)
G=1+φgφpm(1−γφpm
) (Gg−Gpm
)(ξGu−ξGl)
Gg+ξGu
(φgGg+φpmGpm
) (19b)
ξGu =(7 − 5νg
)Gg(
8 − 10νg)Gpm
(19c)
ξGl = 7 − 5νpm8 − 10νpm
(19d)
γ = 2λ∗ − 1
λ∗(19e)
where Gpm is the shear modulus of the CB/CMCporous matrix, calculated from the bulk modulus, Kpm
(equation (11)), and the Poisson’s ratio, νpm = 1/3, of theporous matrix assuming isotropy, and Gg is the shear mod-ulus of G-LICs, calculated from the bulk modulus, Kg , andthe Poisson’s ratio, νg , of the G-LICs assuming isotropy. Allother variables are defined in section “Analytical Predictionof Composite Electrode Expansion”.
The Young’s modulus of the porous composite electrodeis calculated from the predicted shear modulus, Ge, andbulk modulus, Ke, assuming isotropy. It was found to rangebetween 0.46 GPa and 0.48 GPa depending on the lithiumcontent of the G-LICs, which is two orders of magnitudesmaller than the modulus of G-LICs. Moreover, the Young’smodulus of the electrode is predicted to remain nearly con-stant for all lithium contents, despite a three-fold increase inthe modulus of G-LICs.
Zheng et al. experimentally measured the Young’s mod-ulus of unlithiated electrodes comprised of 88.8 wt.%graphite, 8 wt.% polyvinylidene difluoride (PVDF) binder,and 3.2 wt.% carbon black with 35 vol.% porosity [32].They found that the Young’s modulus lies in the range of0.26 GPa to 0.69 GPa. This is in good agreement with thepredicted modulus.
References
1. Vetter J, Novak P, Wagner M, Veit C, Moller K, BesenhardJ, Winter M, Wohlfahrt-Mehrens M, Vogler C, Hammouche A(2005) Ageing mechanisms in lithium-ion batteries. J PowerSources 147:269–281. doi:10.1016/j.jpowsour.2005.01.006
2. Qi Y, Guo H, Hector LG, Timmons A (2010) Threefold increasein the young’s modulus of graphite negative electrode dur-ing lithium intercalation. J Electrochem Soc 157(5):A558–A566.doi:10.1149/1.3327913
3. Beaulieu LY, Eberman KW, Turner RL, Krause LJ, DahnJR (2001) Colossal reversible volume changes in lithiumalloys. Electrochem Solid-State Lett 4(9):A137–A140.doi:10.1149/1.1388178
4. Liu XH, Huang JY (2011) In situ TEM electrochemistry of anodematerials in lithium ion batteries. Energy Environ Sci 4:3844–3860. doi:10.1039/c1ee01918j
5. Sethuraman VA, Chon MJ, Shimshak M, Srinivasan V, GuduruPR (2010) In situ measurements of stress evolution in silicon thinfilms during electrochemical lithiation and delithiation. J PowerSources 195:5062–5066. doi:10.1016/j.jpowsour.2010.02.013
6. Bower AF, Guduru PR, Sethuraman VA (2011) A finite strainmodel of stress, diffusion, plastic flow, and electrochemical reac-tions in a lithium-ion half-cell. J Mech Phys Solids 59:804–828.doi:10.1016/j.jmps.2011.01.003

Exp Mech
7. Deshpande R, Cheng YT, Verbrugge MW (2010) Modelingdiffusion-induced stress in nanowire electrode structures. J PowerSources 195:5081–5088. doi:10.1016/j.jpowsour.2010.02.021
8. Li J, Lewis RB, Dahn JR (2007) Sodium carboxymethylcellulose. Electrochem Solid-State Lett 10(2):A17–A20.doi:10.1149/1.2398725
9. Timmons A, Dahn JR (2006) In situ optical observations of par-ticle motion in alloy negative electrodes for Li-ion batteries. JElectrochem Soc 153(6):A1206–A1210. doi:10.1149/1.2194611
10. Sethuraman VA, Van Winkle N, Abraham DP, Bower AF,Guduru PR (2012) Real-time stress measurements in lithium-ion battery negative-electrodes. J Power Sources 206:334–342.doi:10.1016/j.jpowsour.2012.01.036
11. Sethuraman VA, Nguyen A, Chon MJ, Nadimpalli SPV,Wang H, Abraham DP, Bower AF, Shenoy VB, Guduru PR(2013) Stress evolution in composite silicon electrodes dur-ing lithiation/delithiation. J Electrochem Soc 160(4):A739–A746.doi:10.1149/2.021306jes
12. Qi Y, Harris SJ (2010) In situ observation of strains duringlithiation of a graphite electrode. J Electrochem Soc 157(6):A741–A747. doi:10.1149/1.3377130
13. Berfield TA, Patel JK, Shimmin RG, Braun PV, LambrosJ, Sottos NR (2006) Fluorescent image correlation fornanoscale deformation measurements. Small 2(5):631–635.doi:10.1002/smll.200500289
14. Berfield TA, Patel JK, Shimmin RG, Braun PV, Lambros J, SottosNR (2007) Micro- and nanoscale deformation measurement ofsurface and internal planes via digital image correlation. ExpMech 47:51–62. doi:10.1007/s11340-006-0531-2
15. Hamilton AR, Sottos NR, White SR (2010) Local strain con-centrations in a microvascular network. Exp Mech 50:255–263.doi:10.1007/s11340-009-9299-5
16. Van Blaaderen A, Vrij A (1992) Synthesis and characterization ofcolloidal dispersions of fluorescent, monodisperse silica spheres.Langmuir 8(12):2921–2931
17. Verhaegh NAM, Van Blaaderen A (1994) Dispersions ofrhodamine-labeled silica spheres: synthesis, characterization, andfluorescence confocal scanning laser microscopy. Langmuir10:1427–1438
18. Verma P, Maire P, Novak P (2010) A review of the features andanalyses of the solid electrolyte interphase in Li-ion batteries.Electrochim Acta 55:6332–6341. doi:10.1016/j.electacta.2010.05.072
19. Eberl C (2010) Digital image correlation and tracking. http://www.mathworks.com/matlabcentral/fileexchange/12413
20. Jones EMC (2013) Improved digital image correlation. http://www.mathworks.com/matlabcentral/fileexchange/43073-improved-digitalimage-correlation-dic
21. Mathworks (2012) Normalized 2-D cross-correlation (normx-corr2). http://www.mathworks.com/help/images/ref/normxcorr2.html
22. Barlow J (1976) Optimal stress locations in finite element models.Int J Num Methods Eng 10:243–251
23. Tortorelli DA (2010) Solid mechanics : analysis and design withthe finite element method. Electronic Publication, Urbana
24. Dahn JR (1991) Phase Diagram of LixC6. Phys Rev B44(17):9170–9177
25. Dahn JR, Fong R, Spoon MJ (1990) Suppression of staging inlithium-intercalated carbon by disorder in the host. Phys Rev B42(10):6424–6432
26. Chemical Book (2010) Carboxymethyl cellulose. http://www.chemicalbook.com/ChemicalProductProperty EN CB5.209844.htm
27. International Programme on Chemical Safety (2012) Carbonblack. http://www.inchem.org/documents/icsc/icsc/eics0471.htm
28. Matweb (2013) Graphite (Carbon C). www.matweb.com29. Whitney JM, McCullough RL (1990) Micromechanical materials
modeling. Technomic Publishing Company, Inc., Lancaster30. Gibson LJ, Ashby MF (1988) Cellular solids. Pergamon Press,
New York31. Rosen BW, Hashin Z (1970) Effective thermal expansion coeffi-
cients and specific heats of composite materials. Int J Engng Sci8:157–173
32. Zheng H, Zhang L, Liu G, Song X, Battaglia VS (2012)Correlationship between electrode mechanics and long-termcycling performance for graphite anode in lithium ion cells.J Power Sources 217:530–537. doi:10.1016/j.jpowsour.2012.06.045