in-situ self-aligned nacl-solution fluidic-integrated
TRANSCRIPT

Received October 4, 2020, accepted October 13, 2020, date of publication October 16, 2020, date of current version October 28, 2020.
Digital Object Identifier 10.1109/ACCESS.2020.3031864
In-Situ Self-Aligned NaCl-SolutionFluidic-Integrated Microwave Sensors forIndustrial and Biomedical ApplicationsNONCHANUTT CHUDPOOTI 1, (Member, IEEE), NATTAPONG DUANGRIT 2, (Member, IEEE),PATCHADAPORN SANGPET 3, PRAYOOT AKKARAEKTHALIN 3, (Member, IEEE),B. ULRIK IMBERG 4, IAN D. ROBERTSON 5, (Fellow, IEEE),AND NUTAPONG SOMJIT 5, (Senior Member, IEEE)1Research Center of Innovation Digital and Electromagnetic Technology (iDEMT), Department of Industrial Physics and Medical Instrumentation, Faculty ofApplied Science, King Mongkut’s University of Technology North Bangkok, Bangkok 10800, Thailand2Faculty of Engineering, Rajamangala University of Technology Lanna, Chiang Mai 50300, Thailand3Department of Electrical and Computer Engineering, Faculty of Engineering, King Mongkut’s University of Technology North Bangkok, Bangkok 10800,Thailand4Huawei Technologies Sweden AB, 164 40 Kista, Sweden5School of Electronic and Electrical Engineering, University of Leeds, Leeds LS2 9JT, U.K.
Corresponding author: Nutapong Somjit ([email protected])
This work was supported in part by the Thailand Research Fund and Office of the Higher Education Commission through the ResearchGrant for New Scholar under Grant MRG6280119, in part by the King Mongkut’s University of Technology North Bangkok underContract KMUTNB-64-KNOW-44, and in part by the Engineering and Physical Science Research Council under Grant EP/S016813/1 andGrant EP/N010523/1.
ABSTRACT This work presents, for the first time, an in-situ self-aligned fluidic-integrated microwavesensor for characterizing NaCl contents in NaCl-aqueous solution based on a 16-GHz bandpass comblinecavity resonator. The discrimination of the NaCl concentration is achievable by determining amplitudedifferences and resonant frequency translations between the incident and reflected microwave signals atthe input terminal of the cavity resonator based on the capacitive loading effects of the comb structure insidethe cavity introduced by the NaCl solution under test. Twelve NaCl-aqueous liquid mixture samples withdifferent NaCl concentrations ranging from 0% to 20% (0 – 200 mg/mL), which are generally exploited inmost industrial and biomedical applications, were prepared and encapsulated inside a Teflon tube performingas a fluidic channel. The Teflon tube is subsequently inserted into the cavity resonator through two smallholes, fabricated through the sidewalls of the cavity, which can be used to automatically align the fluidicsubsystem inside the combline resonator considerably easing the sensor setup. Based on at least five repeatedmeasurements, the NaCl sensor can discriminate the NaCl content of as low as 1% with the measurementaccuracy of higher than 96% and the maximum standard deviation of only 0.0578. There are severalsignificant advantages achieved by the novel NaCl sensors, e.g. high accuracy, traceability and repeatability;ease of sensor setup and integration to actual industrial and biomedical systems enabling in-situ and real-time measurements; noninvasive and noncontaminative liquid solution characterization as well as superiorsensor reusability due to a complete physical separation between the fluidic and microwave subsystems.
INDEX TERMS Microwave sensors, liquid material characterization, fluidic integration, comblineresonators.
I. INTRODUCTIONRecently, microwave sensors and characterizations havebecome a popular technique for fluidic and liquid-mixture
The associate editor coordinating the review of this manuscript and
approving it for publication was Wuliang Yin .
concentration sensing in various industrial applications, e.g.high-pressure liquid measurements [1], [2], material moisturecontent characterizations [3]–[6], continuous process moni-toring of biogas plants [7], [8] and determinations of mois-ture content in soil [5], [9]–[11]. Moreover, they have alsobeen proven very useful in many healthcare and biomedical
VOLUME 8, 2020 This work is licensed under a Creative Commons Attribution 4.0 License. For more information, see https://creativecommons.org/licenses/by/4.0/ 188897
N. Chudpooti et al.: In-Situ Self-Aligned NaCl-Solution Fluidic-Integrated Microwave Sensors
applications, e.g. real-time monitoring of glucose in diabeticpatients [12]–[15] and noninvasivemonitoring ofmedical flu-idic contents [12], [14], [16]. Normally, microwave sensorsoffer many advantages compared to other conventional liquidand fluidic sensors such as nondestructive and noninvasivemeasurements and, principally, requiring no additional chem-icals to be added into the systems [17], [18].
NaCl-aqueous solutions play a significant role in manychemical processes in a wide variety of chemical andbiological applications. Highly sensitive detection of NaClconcentration in aqueous solution may become a power-ful technique for studying many useful biological proper-ties of various liquid materials [19]–[23]. There are sev-eral techniques for sensing or classifying NaCl contentsin liquid solutions. Conventional techniques for monitor-ing the composition of aqueous solutions include standardUV/Vis/NIR measurements [24], [25], ion-sensitive elec-trodes and amperometric sensors [26]–[28]. However, thesetechniques take a long processing and measurement timeto classify the content of the NaCl in the liquid solu-tion and require additional chemical material for deter-mining the content of the NaCl. Commercial instrumentshave allowed characterizations of NaCl concentration withsufficient accuracy, for example; the micro-Raman spec-troscopy technique allows the determination of the NaClconcentration of an aqueous solution with an error ofapproximately ±5% [29]. The spectroscopy is, however,an expensive instrument that requires specialized personneltraining. With microwave measurement techniques, there areseveral methods to indicate liquid ingredients from liquid-mixture solutions, e.g., resonance frequency [18], [30]–[32],transmission level [17], [32], [33], phase and quality fac-tor (Q-factor) [23]. Various liquid-mixture sensors basedon microwave technologies have been extensively investi-gated, such as split-ring resonator [34]–[36], complemen-tary split-ring resonator (CSRR) structures [17], [31], [32],[37], [38], interdigital structures [8], substrate integrated-waveguide (SIW) structures [18], waveguide structures [30]and mushroom-like structures [23]. These techniques offer agood measurement accuracy [17], [18], [31], with, generally,nondestructive measurement and short assay time.
This article presents a cavity-based combline microwavesensor for highly accurate characterizations of the NaClconcentration in an aqueous-based liquid-mixture solution.The novel sensor is designed based on a combline structureoperating at 16 GHz, chosen as the best compromise betweenmeasurement sensitivity of the sensor and signal losses in theliquidmixture at various NaCl concentrations. The sensor candetect the percent concentration of NaCl in the liquid mixtureby determining the amplitude and frequency translations ofthe incident and reflected microwave signals at the input portof the compline cavity resonator. Twelve solution samples ofNaCl in aqueous-based liquid mixture, i.e. 1% (10 mg/mL),2% (20 mg/mL), 3% (30 mg/mL), 4% (40 mg/mL),5% (50 mg/mL), 6% (60 mg/mL), 7% (70 mg/mL),8% (80 mg/mL), 9% (90 mg/mL), 10% (100 mg/mL),
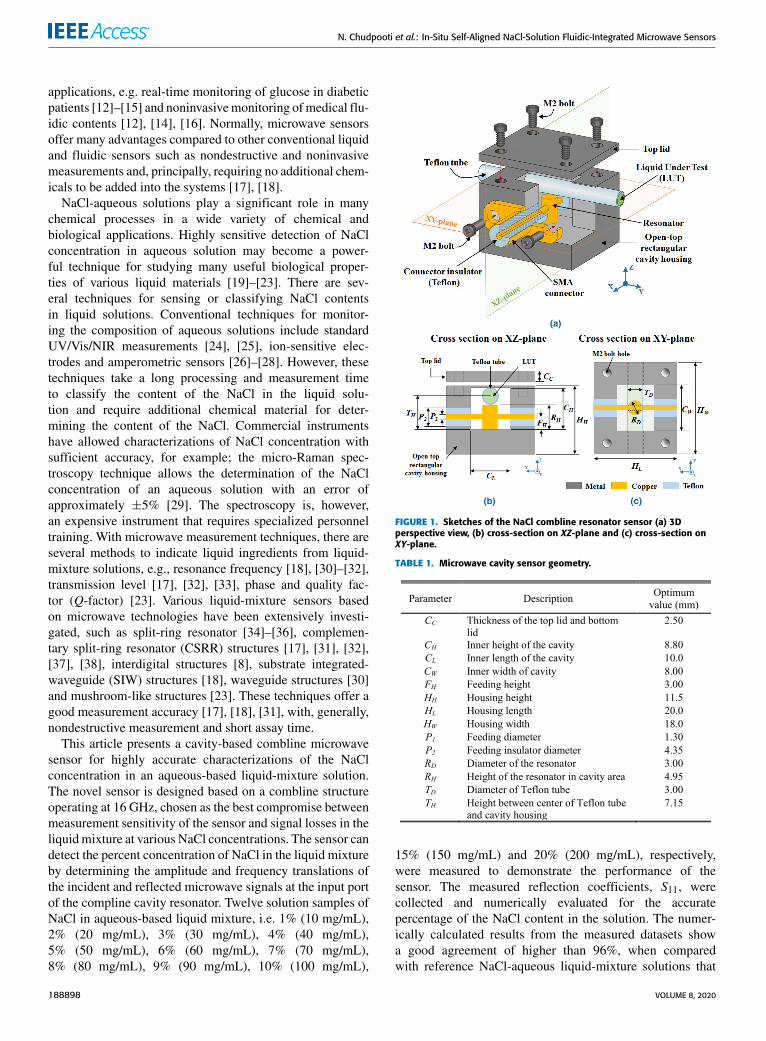
FIGURE 1. Sketches of the NaCl combline resonator sensor (a) 3Dperspective view, (b) cross-section on XZ-plane and (c) cross-section onXY-plane.
TABLE 1. Microwave cavity sensor geometry.
15% (150 mg/mL) and 20% (200 mg/mL), respectively,were measured to demonstrate the performance of thesensor. The measured reflection coefficients, S11, werecollected and numerically evaluated for the accuratepercentage of the NaCl content in the solution. The numer-ically calculated results from the measured datasets showa good agreement of higher than 96%, when comparedwith reference NaCl-aqueous liquid-mixture solutions that
188898 VOLUME 8, 2020

N. Chudpooti et al.: In-Situ Self-Aligned NaCl-Solution Fluidic-Integrated Microwave Sensors
FIGURE 2. Equivalent circuit model of the NaCl cavity sensor.
were prepared in an environmentally controlled laboratory.The novel NaCl sensor achieves several significant advan-tages, as compare to conventional NaCl sensors, e.g. highaccuracy, traceability and repeatability; ease of sensor setupand integration to actual industrial and biomedical systems,enabling in-situ and real-time measurements; nondestructiveand noncontaminative liquid solution characterization as wellas superior sensor reusability due to a complete physicalseparation between the fluidic and microwave subsystems.
II. WORKING PRINCIPLE, SENSOR DESIGN ANDFABRICATIONThe complete NaCl sensor system, as shown in Fig. 1 (a),consists of two different subsystems: a fluidic subsystemusing a Teflon tube to encapsulate the NaCl-aqueous liq-uid mixture solution under test and a 16-GHz custom-madecombline cavity resonator performing as the microwave sens-ing subsystem. The microwave cavity resonator is composedof three parts, which are the open-top rectangular cavityhousing, the top lid as the metallic cover on top of the cavityhousing and the cylindrical combline structure at the centerinside the cavity. The operational frequency of 16 GHz isselected as the best compromise between various key param-eters such as sensor sensitivity, size, fabrication cost andetc. The Teflon tube, performing as the liquid encapsulationchannel, is mounted into the rectangular cavity resonator bytwo pilot etched-through holes embedded into two sidewallsof the cavity. The pilot holes are also used to precisely alignand firmly positioned the Teflon tube to be on top of thecombline resonator achieving the best sensor sensitivity andmechanical reliability.
A. WORKING PRINCIPLEFigure 2 presents the equivalent circuit model of the comblinecavity resonator sensor integrated with the fluidic subsystem.An incident microwave signal is injected at the input termi-nal, port 1, and propagates towards the combline resonator,presented as the parallel RR, LR and CR, located at the centerof the rectangular cavity structure. The propagating incident
electromagnetic (EM) wave is subsequently modulated bythe NaCl liquid-mixer solution encapsulated inside the Teflontube mounted firmly on top of the combline resonator. Theencapsulated NaCl-aqueous solution can be represented witha basic variable parallel RC-resonant circuit with the resis-tor and capacitor values of RLUT and CLUT , respectively,depending on the NaCl concentration in the liquid mixersolution. The propagating incident microwave signal is thensplit into two signals, due to the impedance mismatch ofthe combline resonator; 1) the transmitted signal propagatingtowards port 2, the output terminal, and 2) the reflected signalpropagating back to the input port. Bymeasuring the reflectedsignal at the input terminal, the percent concentration ofthe NaCl in aqueous solution can be numerically computedfrom the amplitude attenuation and the resonant frequencyshift, as compared to the incident input signal, using resonanttechnique [18], [31]. The EM effect of the Teflon tube inthe measurement is negligible only when the combline NaClsensor is first calibrated with an empty Teflon tube used inthe measurement setup before an actual measurement with anunknown concentration of the NaCl-aqueous solution undertest is performed.
B. SENSOR DESIGN AND OPTIMIZATIONThe fluidic-integrated combline-resonator sensor, based onthe hollow rectangular cavity structure, was designed andoptimized by using a 3D full-wave EM simulator, namelyCST Studio Suite [39]. Figures 1 (b) and (c) show thecross-section visualizations on the XZ and XY-planes of theNaCl combline resonator sensor, respectively. The combline-resonator sensor was designed at the center frequency, f0, of16 GHz, bandwidth, fc, of 1 GHz and passband rippleof 0.5 dB. To ease the sensor design and fabrication, the orderof the resonator is fixed to n = 1. The Chebyshev g-valuesfor 1th order filter with 0.5-dB ripple [40] is g0 = 1.00,g1 = 0.6986 and g2 = 1.00. The Chebyshev g-values wereused to calculate the initial physical dimensions of the cavityresonator [41]. However, due to fabrication limitations of themanufacturing facility, the diameter of combline resonator,RD, was selected to 3.00 mm. The height of the comblineresonator, RH , is numerically optimized, by using parametricsweep process, to 4.95 mm. The optimized resonator heightof 4.95 mm is initially calculated to be approximately atλg/4, where λg is the guided wavelength of the EM wavespropagating inside the hollow cavity at the operational fre-quency of 16 GHz. The cylindrical combline resonator isdesigned and located at the center of the rectangular cav-ity. The inner dimensions of the hollow rectangular cavityhousing is calculated and optimized based on basic comblinebandpass filter design theory [41] to the length = 10.00 mm(CL)× width = 8.00 mm (CW )× height = 8.80 (CH ), whichcan be precisely manufactured into the cavity housing blockduring the fabrication process. The input and output portsare connected to the combline structure by inductive feedingtechnique to couple the EMwaves between the feed networksto the combline resonator. In the simulations, the feeding
VOLUME 8, 2020 188899
N. Chudpooti et al.: In-Situ Self-Aligned NaCl-Solution Fluidic-Integrated Microwave Sensors
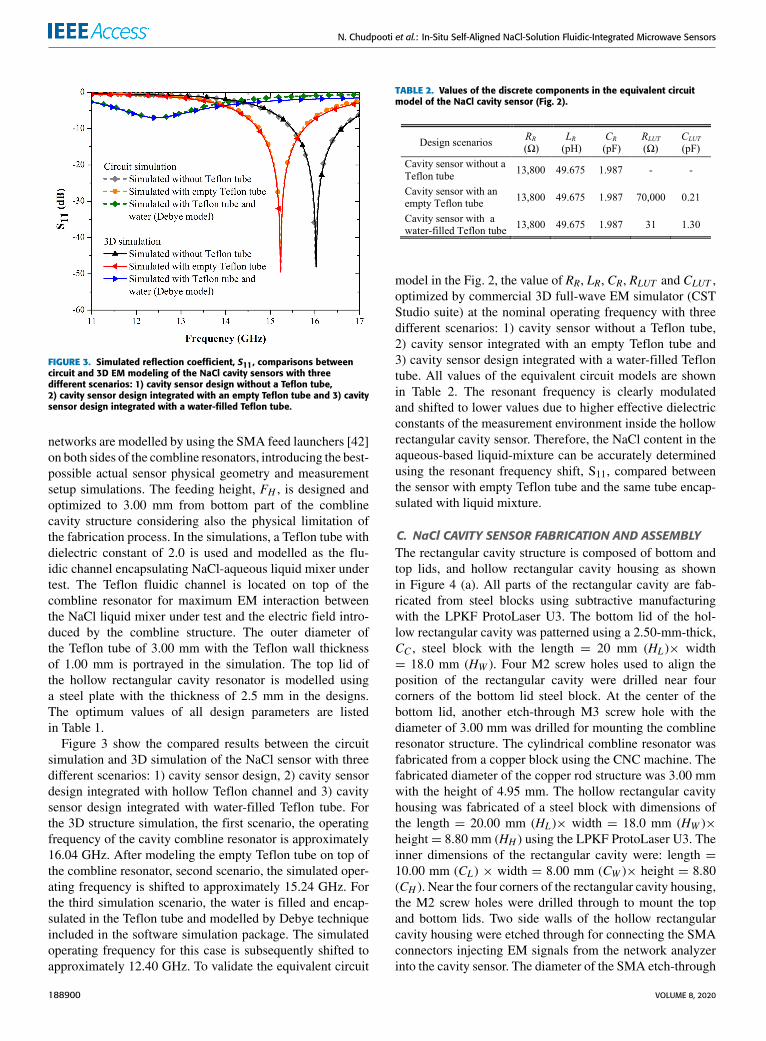
FIGURE 3. Simulated reflection coefficient, S11, comparisons betweencircuit and 3D EM modeling of the NaCl cavity sensors with threedifferent scenarios: 1) cavity sensor design without a Teflon tube,2) cavity sensor design integrated with an empty Teflon tube and 3) cavitysensor design integrated with a water-filled Teflon tube.
networks are modelled by using the SMA feed launchers [42]on both sides of the combline resonators, introducing the best-possible actual sensor physical geometry and measurementsetup simulations. The feeding height, FH , is designed andoptimized to 3.00 mm from bottom part of the comblinecavity structure considering also the physical limitation ofthe fabrication process. In the simulations, a Teflon tube withdielectric constant of 2.0 is used and modelled as the flu-idic channel encapsulating NaCl-aqueous liquid mixer undertest. The Teflon fluidic channel is located on top of thecombline resonator for maximum EM interaction betweenthe NaCl liquid mixer under test and the electric field intro-duced by the combline structure. The outer diameter ofthe Teflon tube of 3.00 mm with the Teflon wall thicknessof 1.00 mm is portrayed in the simulation. The top lid ofthe hollow rectangular cavity resonator is modelled usinga steel plate with the thickness of 2.5 mm in the designs.The optimum values of all design parameters are listedin Table 1.
Figure 3 show the compared results between the circuitsimulation and 3D simulation of the NaCl sensor with threedifferent scenarios: 1) cavity sensor design, 2) cavity sensordesign integrated with hollow Teflon channel and 3) cavitysensor design integrated with water-filled Teflon tube. Forthe 3D structure simulation, the first scenario, the operatingfrequency of the cavity combline resonator is approximately16.04 GHz. After modeling the empty Teflon tube on top ofthe combline resonator, second scenario, the simulated oper-ating frequency is shifted to approximately 15.24 GHz. Forthe third simulation scenario, the water is filled and encap-sulated in the Teflon tube and modelled by Debye techniqueincluded in the software simulation package. The simulatedoperating frequency for this case is subsequently shifted toapproximately 12.40 GHz. To validate the equivalent circuit
TABLE 2. Values of the discrete components in the equivalent circuitmodel of the NaCl cavity sensor (Fig. 2).
model in the Fig. 2, the value of RR, LR, CR, RLUT and CLUT ,optimized by commercial 3D full-wave EM simulator (CSTStudio suite) at the nominal operating frequency with threedifferent scenarios: 1) cavity sensor without a Teflon tube,2) cavity sensor integrated with an empty Teflon tube and3) cavity sensor design integrated with a water-filled Teflontube. All values of the equivalent circuit models are shownin Table 2. The resonant frequency is clearly modulatedand shifted to lower values due to higher effective dielectricconstants of the measurement environment inside the hollowrectangular cavity sensor. Therefore, the NaCl content in theaqueous-based liquid-mixture can be accurately determinedusing the resonant frequency shift, S11, compared betweenthe sensor with empty Teflon tube and the same tube encap-sulated with liquid mixture.
C. NaCl CAVITY SENSOR FABRICATION AND ASSEMBLYThe rectangular cavity structure is composed of bottom andtop lids, and hollow rectangular cavity housing as shownin Figure 4 (a). All parts of the rectangular cavity are fab-ricated from steel blocks using subtractive manufacturingwith the LPKF ProtoLaser U3. The bottom lid of the hol-low rectangular cavity was patterned using a 2.50-mm-thick,CC , steel block with the length = 20 mm (HL)× width= 18.0 mm (HW ). Four M2 screw holes used to align theposition of the rectangular cavity were drilled near fourcorners of the bottom lid steel block. At the center of thebottom lid, another etch-through M3 screw hole with thediameter of 3.00 mm was drilled for mounting the comblineresonator structure. The cylindrical combline resonator wasfabricated from a copper block using the CNC machine. Thefabricated diameter of the copper rod structure was 3.00 mmwith the height of 4.95 mm. The hollow rectangular cavityhousing was fabricated of a steel block with dimensions ofthe length = 20.00 mm (HL)× width = 18.0 mm (HW )×height= 8.80 mm (HH ) using the LPKF ProtoLaser U3. Theinner dimensions of the rectangular cavity were: length =10.00 mm (CL) × width = 8.00 mm (CW )× height = 8.80(CH ). Near the four corners of the rectangular cavity housing,the M2 screw holes were drilled through to mount the topand bottom lids. Two side walls of the hollow rectangularcavity housing were etched through for connecting the SMAconnectors injecting EM signals from the network analyzerinto the cavity sensor. The diameter of the SMA etch-through
188900 VOLUME 8, 2020

N. Chudpooti et al.: In-Situ Self-Aligned NaCl-Solution Fluidic-Integrated Microwave Sensors
FIGURE 4. (a) Fabricated NaCl sensor prototype before assembly, whichcomposed of the hollow rectangular housing and its top and bottom steellids. (b) Assembled NaCl sensor prototype without Teflon tube.
hole,P2, is 4.35mm. The other two sidewalls of the rectangu-lar cavity housingwere also etched through, with the diameterof 3.00 mm, used for inserting the Teflon tube. The drillingdistance, TH , between the pilot-holes guiding the Teflon tubeand the bottom plane of the rectangular hollow housing was7.15 mm. Finally, the top lid of the hollow rectangular cavityhousing was fabricated from 2.50-mm-thick, CC , steel blockwith length = 20 mm (HL)× width = 18.0 mm (HW ). Closeto the four corners of the top lid, four M2 screw holes with adiameter of 2 mm were drilled through and used to attachthe top lid to the cavity housing. The Fig. 4(b) shows theassembled NaCl rectangular cavity sensor prototype with twoSMA connectors and without Teflon tube fluidic channel.
D. NaCl SOLUTION PREPARATIONAll NaCl solutions were prepared in the environmentallycontrolled chemistry laboratory with the temperature of 25 ◦Cand the relative humidity of 50%. The NaCl solutions weremixed from 99.5% NaCl powder and DI water, which hadan electrical resistivity of more than 10 M�-cm. All glassbeakers and test tubes used in the liquid preparation were firstcleaned from organic contaminations using acetone and iso-propanol ensuring that no other organic substances will affectthe S-parameter measurement. Twelve NaCl-H2O solutionswere selected and mixed as NaCl-aqueous solution undertest. The NaCl content in the liquid mixer under test wasvaried in the range of 1% (10 mg/mL), 2% (20 mg/mL),3% (30 mg/mL), 4% (40 mg/mL), 5% (50 mg/mL),
6% (60 mg/mL), 7% (70 mg/mL), 8% (80 mg/mL), 9%(90 mg/mL), 10% (100 mg/mL), 15% (150 mg/mL) and 20%(200 mg/mL) by mixing the NaCl power to the DI water asfollows:
1. A 3-digit electronic precision balance was used to weigh30 grams of NaCl powder to be mixed with 150-ml DI water,creating the initial NaCl liquid substance at 20%w/v(200 mg/mL) NaCl liquid mixer, C1.2. The liquid dilution technique was used to prepare
the lower NaCl concentrations by mixing the 20%w/v(200 mg/mL) initial NaCl substance with different volumesof DI water as shown in Table 2. The formula of the dilutionmethod is calculated by:
C1V1 = C2V2 (1)
where, C1: initial concentration, V1: initial volume, C2: finaltargeted concentration, V2: final targeted volume.
3. Preparation of the targeted concentration of the NaClsolution,C2, and the required volume of the initial NaCl solu-tion, V1, by fixing the total targeted volume to the requiredNaCl concentration, V2, at 10 ml. The values of C2, V1, andthe DI water volume in each NaCl solution are calculated andshown in the Table 3.
4. The required volume of the initial NaCl solution, V1,and the DI water volume were diluted and mixed into the testtube by using the digital micropipette for high precision levelof NaCl liquid solutions.
III. MEAUREMENT RESULTSA. MEASUREMENT SETUPThe S-parameter measurements were performed by using aROHDE & SCHWARZ ZVB-20 Vector Network Analyzer(VNA). Two-port calibration technique was performed usingthe Thru-Open-Short-Match method (TOSM), in order toeliminate the systematic errors contributed by the VNA andconnecting cables. The frequency range of the VNA was setfrom 10 GHz to 17 GHz. The number of sampling frequencypoints was 7,001 points. The intermediate frequency (IF) fil-ter bandwidthwas set to 100Hz. To accurately feed the Teflontube with the NaCl solution under test, the liquid solutionwas carefully injected into the liquid channel by using anindustrial grade syringe, ensuring that no air bubbles weretrapped inside in the encapsulated liquid channel during thesensor measurement. The temperature of the liquid solutionsample was well maintained at a room temperature of 25 ◦C.At least five repeated individual measurements were con-ducted to ensure the measurement and sensor repeatability.Fig. 5 shows the measurement setup of the NaCl sensorsintegrated with Teflon fluidic channel. Fig. 6 compare theS11 measurement results to the simulation results of the NaClsensor with and without the empty Teflon tube, respectively.
B. DI-WATER/NaCl LIQUID MIXTURE MEASUREMENTThe verification of the NaCl concentration was investigatedusing different concentrations of the NaCl and DI water mix-ture. The concentration of NaCl solution in DI water varied
VOLUME 8, 2020 188901

N. Chudpooti et al.: In-Situ Self-Aligned NaCl-Solution Fluidic-Integrated Microwave Sensors
TABLE 3. The calculated volumes of the NaCl solutions, V1 and the DI water by using dilution method for the targeted NaCl concentrations.
FIGURE 5. Fabricated sensor after injecting the liquid solution sampleinto the Teflon tube and connecting the sensor to the coaxial cable andthat to the VNA.
FIGURE 6. Simulated (dashed line) and measured (solid line) reflectioncoefficients, S11, of the NaCl cavity sensor with and without an emptyTeflon tube.
from 0% – 20% (0 – 200 mg/mL). The 0% NaCl is DI water,which is the reference liquid solution. The full measurementconsists of the following steps:
1. Measure the reflection coefficient, S11, with DI water asthe reference measurement.
2. Measure the reflection coefficient, S11, with differentconcentration of the NaCl and calculate the resonant fre-quency change from |1fr | = |f(%NaCl) − f(DI water)|.3. Re-measure with same concentration of the NaCl five
times to find the accuracy of the measurement.Themeasured data were collected five times for each liquid
solution to ensure the repeatability of the proposed sensor.The corresponding S11 measurements of these samples areshown in Fig. 8. Due to the small difference in resonantfrequency between each liquid solution, the traces for the oddand even concentrations of the NaCl solution in DI water areseparated into Fig.7(a) and Fig.7(b), respectively, for clarity.
As discussed, injecting the NaCl solution sample into themicrowave cavity sensor causes the resonant frequency toshift towards and the return loss to decrease when comparedwith DI water as a reference measurement. When comparingthe lowest percentage, 1% (10 mg/mL), of NaCl in liquidmixture, with DI water as a reference measurement, the min-imum shift in resonant frequency is observed to be 31 MHz.On the other hand, the maximum shift in resonant frequencyis 616 MHz, for the 20% (200 mg/mL) NaCl solution. A plotof difference in resonant frequency, 1fr , as a function ofpercentage of NaCl in the liquid mixture is shown in Fig. 8.To validate the numerical equation for extracting the percent-age of NaCl in liquid mixture, all values of the differenceresonant frequencies,1fr , are fitted to a polynomial using thecommercial data analysis and visualization software packageOrigin. A 3rd order polynomial was used, yielding regressionvalue R2 of 0.9997. The polynomial itself was found to be:
%NaCl = 7.854× 10⁻⁸ (1fr )3 − 4.478× 10⁻⁵ (1fr )2
+ 2.985× 10⁻² (1fr )+ 0.109 (2)
where %NaCl is the percentage of NaCl in the liquid mix-ture and the change in resonant frequency, 1fr , has unitsof MHz. A summary of the measured and extracted data isgiven in Table 4. A good agreement is observed betweenthe extracted and known concentration of NaCl in the
188902 VOLUME 8, 2020

N. Chudpooti et al.: In-Situ Self-Aligned NaCl-Solution Fluidic-Integrated Microwave Sensors
FIGURE 7. Measured reflection coefficient, S11, in dB for NaClconcentration in the range from 0% to 20%. (a) the magnitude of S11 forNaCl concentration in the range of 0%, 1% (10 mg/mL), 3% (30 mg/mL),5% (50 mg/mL), 7% (70 mg/mL), 9% (90 mg/mL) and 15% (150 mg/mL) inDI water and (b) the magnitude of S11 for NaCl concentration in the rangeof 0%, 2% (20mg/mL), 4% (40 mg/mL), 6% (60 mg/mL), 8% (80 mg/mL),10% (100 mg/mL) and 20% (200 mg/mL) in DI water.
liquid mixture. The biggest difference in %NaCl was only3.42%. This shows that the sensor retains the accuracy offeredby the resonance technique. Table 5 shows the key parametersof the microwave cavity sensor compared with other pub-lished works, [16], [19]–[21], [44]. The key advantages of theproposed sensor are the real-time monitoring, ease of centersetup and integrated with the system, self-alignment betweenfluidic channel and microwave system, and unlimited life-cycle limitation. The self-aligned fluidic channel criteria,which is crucial key for sensor setup, was listed in Table 5.In [19] and this work, the liquid channel is integrated into thesystem to reduce the measurement error from measurementsetup. To implement the sensor with industrial or biomedicalapplications, the proposed sensor can easily integrate with the
FIGURE 8. Percentages of NaCl concentration in H2O-NaCl liquid mixturefitted as a function of resonant frequencies in MHz. The regression valueand fitted polynomial (dashed line) were calculated by Origin.
TABLE 4. Extracted results of various concentration of NaCl.
system when compared with other publishes [16], [19]–[21],[44] because other works need to modify the cover structureto protect the RF signal environment generation.
C. SENSOR REPEATABILITY AND LIMITATIONSTo measure the repeatability of the sensor, two experimentswere performed. Firstly, the liquid samples were injected fivetimes without any changes the system. The standard devia-tion of these measurements was calculated. The minimum,maximum and average standard deviations of the measuredreflection coefficient, S11, were 0.0017, 0.0578 and 0.0244,respectively. Secondly, the proposed sensor is taken out andre-mounted at both SMA ports (port 1, port 2) and the mea-surement repeated five times. The minimum, maximum andaverage of the standard deviation of measured the reflectioncoefficient, S11, were 0.0046, 0.0713 and 0.0367,respectively.
VOLUME 8, 2020 188903

N. Chudpooti et al.: In-Situ Self-Aligned NaCl-Solution Fluidic-Integrated Microwave Sensors
TABLE 5. Key factor comparison of measurement of this work and other works.
FIGURE 9. Two piecewise linear fitted plots for calculating the sensitivityof the proposed sensor in range of 1% - 20% (10 – 200 mg/mL) NaCl inthe liquid mixture.
The sensitivity of the sensor to the percentage of NaCl inthe liquid solution can be determined as the ratio between
the change of %NaCl and the difference in the resonantfrequency – in other words, the slope of the transfer functionin Fig. 9. Due to the non-linear function, two sections,e.g., the percentage of the NaCl in the range of 1% – 10%(10 – 100 mg/mL) and 10% – 20% (100 – 200 mg/mL), arecharacterized. The sensitivity of the percentage of NaCl inliquid mixture in range of 1% – 10% (10 – 100 mg/mL) and10% – 20% (100 – 200 mg/mL) were 0.02371 %NaCl/MHz(0.2371 g/L/MHz) and 0.04583 %NaCl/MHz(0.4583 g/L/MHz), respectively. However, to compare thesensitivity of this sensor with other works, the normalizedsensitivity [43] was calculated to 0.487%.
For the limitation of the proposed sensor for %NaCl deter-mination, in this article, the microwave cavity sensor can bedetected every 1% (10 mg/mL) of the NaCl in the liquidmixture. However, the minimum measurement percentageof the NaCl in the liquid solution depends on resolution inthe measurement setup. The frequency range of VNA wasset from 10 GHz to 17 GHz. The number of points was7,001. Using this measurement setup, a minimum frequencyshift of 1 MHz can be determined. The resolution can becalculated by using Eqn. (2). Substituting the value of 1frwith 1 MHz, from the measurement setup, shows that the
188904 VOLUME 8, 2020

N. Chudpooti et al.: In-Situ Self-Aligned NaCl-Solution Fluidic-Integrated Microwave Sensors
smallest percentage change of NaCl concentration that canbe theoretically detected is 0.14% (1.4 mg/mL). On theother hand, the maximum percentage of the NaCl is 36%(360 mg/mL) due to saturated point of NaCl in DI waterat room temperature. However, the number of points of thenetwork analyzer can be set to a maximum of 60,0001 points.The higher number of points will affect the measurementtime, however. In this article, 7,001 points were used as thebest compromise between measurement time and resolutionof the sensor due to the equipment available in the laboratory.
IV. CONCLUSIONAmicrowave cavity sensor for DI water/NaCl liquid-mixturecharacterization, operating at 16 GHz, has been proposed andits performance investigated. A single rod comb-line cavitysensor was found to be sufficient to classify the percentage ofNaCl in the liquid mixture with a step of 1%. The extractedliquid content of NaCl results from the develop numericalmodel show an excellent agreement of higher than 96%whencompared with NaCl solutions which were prepared in thelaboratory. Further advantages of the proposed sensor arereducedmeasurement time, ease of operation, and contactlessoperation. Finally, the frequency range of the sensor can bereadily extended to higher bands, improving its resolution.
ACKNOWLEDGMENTThe authors would like to thank Mr. Augustus Boadu forhis contributions in preliminary investigation of fluidic-integrated combline resonator sensors.
REFERENCES[1] W. Zhu, B. Cheng, Y. Li, R. Nygaard, and H. Xiao, ‘‘A fluidic-based high-
pressure sensor interrogated by microwave Fabry–Pérot interferometry,’’IEEE Sensors J., vol. 17, no. 14, pp. 4388–4393, Jul. 2017.
[2] C. Schuster, P. Schumacher, M. Schusler, A. Jimenez-Saez, and R. Jakoby,‘‘Passive chipless wireless pressure sensor based on dielectric resonators,’’in Proc. IEEE SENSORS, Glasgow, U.K., Oct. 2017, pp. 1–3.
[3] Y. Wu, G. Tian, and W. Liu, ‘‘Research on moisture content detec-tion of wood components through Wi-Fi channel state information anddeep extreme learning machine,’’ IEEE Sensors J., vol. 20, no. 17,pp. 9977–9988, Sep. 2020, doi: 10.1109/JSEN.2020.2989347.
[4] J. Zhang, D. Du, Y. Bao, J. Wang, and Z. Wei, ‘‘Developmentof multifrequency-swept microwave sensing system for moisturemeasurement of sweet corn with deep neural network,’’ IEEETrans. Instrum. Meas., vol. 69, no. 9, pp. 6446–6454, Sep. 2020,doi: 10.1109/TIM.2020.2972655.
[5] R. R. Mohan, A. Pradeep, S. Mridula, and P. Mohanan, ‘‘Microwave imag-ing for soil moisture content estimation,’’ in Proc. IEEE Int. Symp. Anten-nas Propag. (APSURSI), Fajardo, Puerto Rico, Jun. 2016, pp. 865–866.
[6] S. Seewattananpon, N. Promasa, N. Chudpooti, and P. Akkaraekthalin,‘‘Paddy moisture measurement system in hopper silo by using near-fieldtransmission technique,’’ in Proc. Int. Symp. Antennas Propag. (ISAP),Busan, South Korea, Oct. 2018, pp. 1–2.
[7] T. Nacke, A. Barthel, C. Pflieger, U. Pliquett, D. Beckmann, andA. Goller, ‘‘Continuous process monitoring for biogas plants usingmicrowave sensors,’’ in Proc. 12th Biennial Baltic Electron. Conf., Tallinn,Estonia, Oct. 2010, pp. 239–242.
[8] W. Krudpun, N. Chudpooti, P. Lorwongtragool, S. Seewattanapon,and P. Akkaraekthalin, ‘‘PSE-coated interdigital resonator for selectivedetection of ammonia gas sensor,’’ IEEE Sensors J., vol. 19, no. 23,pp. 11228–11235, Dec. 2019.
[9] A. Loew andW.Mauser, ‘‘On the disaggregation of passive microwave soilmoisture data using a priori knowledge of temporally persistent soil mois-ture fields,’’ IEEE Trans. Geosci. Remote Sens., vol. 46, no. 3, pp. 819–834,Mar. 2008.
[10] T. Zhang, L. Jiang, L. Chai, T. Zhao, and Q. Wang, ‘‘Estimating mixed-pixel component soil moisture contents using biangular observations fromthe HiWATER airborne passive microwave data,’’ IEEE Geosci. RemoteSens. Lett., vol. 12, no. 5, pp. 1146–1150, May 2015.
[11] S. Paloscia, P. Pampaloni, E. Santi, S. Pettinato, A. Della Vecchia,P. Ferrazzoli, and L. Guerriero, ‘‘Soil moisture effect on microwaveemission of forest canopies,’’ in Proc. Microw. Radiometry Remote Sens.Environ., Firenze, Italy, Mar. 2008, pp. 1–4.
[12] X. Xiao and Q. Li, ‘‘A noninvasive measurement of blood glucose concen-tration by UWB microwave spectrum,’’ IEEE Antennas Wireless Propag.Lett., vol. 16, pp. 1040–1043, 2017.
[13] C. G. Juan, E. Bronchalo, B. Potelon, C. Quendo, E. Ávila-Navarro, andJ. M. Sabater-Navarro, ‘‘Concentration measurement of microliter-volumewater–glucose solutions using Q factor of microwave sensors,’’ IEEETrans. Instrum. Meas., vol. 68, no. 7, pp. 2621–2634, Jul. 2019.
[14] M. Hofmann, G. Fischer, R. Weigel, and D. Kissinger, ‘‘Microwave-based noninvasive concentration measurements for biomedical applica-tions,’’ IEEE Trans. Microw. Theory Techn., vol. 61, no. 5, pp. 2195–2204,May 2013.
[15] G. Govind and M. J. Akhtar, ‘‘Metamaterial-inspired microwave microflu-idic sensor for glucose monitoring in aqueous solutions,’’ IEEE Sensors J.,vol. 19, no. 24, pp. 11900–11907, Dec. 2019.
[16] M. N. Rahman, S. A. Hassan, M. Samsuzzaman, M. S. J. Singh,and M. T. Islam, ‘‘Determination of salinity and sugar concentrationusing microwave sensor,’’ Microw. Opt. Technol. Lett., vol. 61, no. 2,pp. 361–364, Nov. 2018.
[17] N. Chudpooti, E. Silavwe, P. Akkaraekthalin, I. D. Robertson, andN. Somjit, ‘‘Nano-fluidic millimeter-wave Lab-on-a-Waveguide sensorfor liquid-mixture characterization,’’ IEEE Sensors J., vol. 18, no. 1,pp. 157–164, Jan. 2018.
[18] E. Silavwe, N. Somjit, and I. D. Robertson, ‘‘A microfluidic-integratedSIW Lab-on-Substrate sensor for microliter liquid characterization,’’ IEEESensors J., vol. 16, no. 21, pp. 7628–7635, Nov. 2016.
[19] T. Chretiennot, D. Dubuc, and K. Grenier, ‘‘Bi-frequency-basedmicrowave liquid sensor for multiple solutes quantification in aqueoussolution,’’ in Proc. 44th Eur. Microw. Conf., Rome, Italy, Oct. 2014,pp. 287–290.
[20] M. A. Ennasar, O. E. Mrabet, K. Mohamed, and M. Essaaidi, ‘‘Designand characterization of a broadband flexible polyimide RFID tag sen-sor for NaCl and sugar detection,’’ Prog. Electromagn. Res. C, vol. 94,pp. 273–283, 2019.
[21] C.-F. Liu, M.-K. Chen, M.-H. Wang, and L.-S. Jang, ‘‘Improved hair-pin resonator for microfluidic sensing,’’ Sensors Mater., vol. 30, no. 5,pp. 979–990, 2018.
[22] M. O. Pedrola, O. Korostynska, A. Mason, and A. I. Al-Shamma’a, ‘‘Real-time sensing of NaCl solution concentration at microwave frequenciesusing novel Ag patterns printed on flexible substrates,’’ in Proc. J. Phys.,Conf., vol. 450, 2013, Art. no. 012016.
[23] T. Pechrkool, N. Chudpooti, N. Duangrit, S. Chaimool, and P. Akkaraek-thalin, ‘‘Zeroth-order resonator based on mushroom-like structure forliquid mixture concentration sensing of sodium chloride solution,’’ inProc. IEEE Conf. Antenna Meas. Appl. (CAMA), Kuta, Bali, Indonesia,Oct. 2019, pp. 222–224.
[24] A. Stadler, ‘‘Analyzing UV/Vis/NIR spectra—Correct and efficient param-eter extraction,’’ IEEE Sensors J., vol. 10, no. 12, pp. 1921–1931,Dec. 2010.
[25] A. Stadler, ‘‘Analyzing UV/Vis/NIR spectra—Part II: Correct and effi-cient parameter extraction,’’ IEEE Sensors J., vol. 11, no. 4, pp. 897–904,Apr. 2011, doi: 10.1109/JSEN.2010.2057421.
[26] N. Honda, K. Emi, T. Katagiri, T. Irita, S. Shoji, H. Sato, T. Homma,T. Osaka, M. Saito, J. Mizuno, and Y. Wada, ‘‘3-D comb electrodes foramperometric immuno sensors,’’ in Proc. 12th Int. Conf. Solid-State Sen-sors, Actuat. Microsyst. Dig. Tech. Papers (TRANSDUCERS), Boston,MA,USA, Jun. 2003, pp. 1132–1135, doi: 10.1109/SENSOR.2003.1216969.
[27] P. Kassanos, S. Anastasova, and G.-Z. Yang, ‘‘A low-cost amperometricglucose sensor based on PCB technology,’’ in Proc. IEEE SENSORS,New Delhi, India, Oct. 2018, pp. 1–4.
[28] A. K. Samarao, M. J. Rust, and C. H. Ahn, ‘‘Rapid fabrication of anano interdigitated array electrode and its amperometric characterizationas an electrochemical sensor,’’ in Proc. IEEE Sensors, Atlanta, GA, USA,Oct. 2007, pp. 644–647.
VOLUME 8, 2020 188905

N. Chudpooti et al.: In-Situ Self-Aligned NaCl-Solution Fluidic-Integrated Microwave Sensors
[29] I. Duričković, M. Marchetti, R. Claverie, P. Bourson, J.-M. Chassot, andM. D. Fontana, ‘‘Experimental study of NaCl aqueous solutions by Ramanspectroscopy: Towards a new optical sensor,’’ Appl. Spectrosc., vol. 64,no. 8, pp. 853–857, Aug. 2010.
[30] B. Kapilevich and B. Litvak, ‘‘Optimized microwave sensor for onlineconcentration measurements of binary liquid mixtures,’’ IEEE Sensors J.,vol. 11, no. 10, pp. 2611–2616, Oct. 2011.
[31] N. Chudpooti, V. Doychinov, P. Akkaraekthalin, I. D. Robertson, andN. Somjit, ‘‘Non-invasive millimeter-wave profiler for surface heightmeasurement of photoresist films,’’ IEEE Sensors J., vol. 18, no. 8,pp. 3174–3182, Apr. 2018.
[32] N. Chudpooti, V. Doychinov, B. Hong, P. Akkaraekthalin, I. Robertson,and N. Somjit, ‘‘Multi-modal millimeter-wave sensors for plastic poly-mer material characterization,’’ J. Phys. D, Appl. Phys., vol. 51, no. 27,Jun. 2018, Art. no. 275103.
[33] K. Grenier, D. Dubuc, P.-E. Poleni, M. Kumemura, H. Toshiyoshi, T. Fujii,and H. Fujita, ‘‘Integrated broadband microwave and microfluidic sensordedicated to bioengineering,’’ IEEE Trans. Microw. Theory Techn., vol. 57,no. 12, pp. 3246–3253, Dec. 2009.
[34] P. Velez, J. Munoz-Enano, K. Grenier, J. Mata-Contreras, D. Dubuc,and F. Martin, ‘‘Split ring resonator-based microwave fluidic sensors forelectrolyte concentration measurements,’’ IEEE Sensors J., vol. 19, no. 7,pp. 2562–2569, Apr. 2019.
[35] D. J. Rowe, S. al-Malki, A. A. Abduljabar, A. Porch, D. A. Barrow, andC. J. Allender, ‘‘Improved split-ring resonator for microfluidic sens-ing,’’ IEEE Trans. Microw. Theory Techn., vol. 62, no. 3, pp. 689–699,Mar. 2014.
[36] P. Velez, L. Su, K. Grenier, J. Mata-Contreras, D. Dubuc, and F. Martin,‘‘Microwave microfluidic sensor based on a microstrip Splitter/Combinerconfiguration and split ring resonators (SRRs) for dielectric character-ization of liquids,’’ IEEE Sensors J., vol. 17, no. 20, pp. 6589–6598,Oct. 2017.
[37] A. Ebrahimi, W. Withayachumnankul, S. Al-Sarawi, and D. Abbott,‘‘High-sensitivity metamaterial-inspired sensor for microfluidic dielec-tric characterization,’’ IEEE Sensors J., vol. 14, no. 5, pp. 1345–1351,May 2014.
[38] P. Velez, K. Grenier, J. Mata-Contreras, D. Dubuc, and F. Martin, ‘‘Highly-sensitive microwave sensors based on open complementary split ring res-onators (OCSRRs) for dielectric characterization and solute concentrationmeasurement in liquids,’’ IEEE Access, vol. 6, pp. 48324–48338, 2018.
[39] CST-MW Studio, Comput. Simul. Technol., Framingham,MA, USA, 2017.[40] I. Robertson, N. Somjit, and M. Chongcheawchamnan, Microwave and
Millimeter-Wave Design for Wireless Communications. Hoboken, NJ,USA: Wiley, 2016.
[41] G. L. Matthael, L. Yong, and E. M. T. Lones, Miceowave Filters,Impedance-Matching Networks and Coupling Structures. North Bergen,NJ, USA: Artech House, Nov. 1985.
[42] Pasternack Enterprises. PE4128 CAD Drawing, SMA Female ConnectorSolder Attachments 2 Hole Flange Mount Stub. Terminal,.481inch Hole Spacing,.050 inch Diameter, Gold Plated. Accessed:Feb. 27, 2020. [Online]. Available: https://www.pasternack.com/images/ProductPDF/PE4128.pdf
[43] A. Ebrahimi, J. Scott, and K. Ghorbani, ‘‘Differential sensors usingmicrostrip lines loaded with two split-ring resonators,’’ IEEE Sensors J.,vol. 18, no. 14, pp. 5786–5793, Jul. 2018.
[44] A. Ebrahimi, J. Scott, and K. Ghorbani, ‘‘Highly sensitive microwave-based biosensor for electrolytic levelmeasurement inwater,’’ inProc. IEEEAsia–Pacific Microw. Conf. (APMC), Singapore, Dec. 2019, pp. 759–761.
NONCHANUTT CHUDPOOTI (Member, IEEE)received the B.Sc. degree (Hons.) in industrialphysics and medical instrumentation and thePh.D. degree in electrical engineering from theKing Mongkut’s University of Technology NorthBangkok, in 2012 and 2018, respectively. He wasappointed as a Lecturer at the Department ofIndustrial Physics and Medical Instrumentation,Faculty of Applied Science, King Mongkut’s Uni-versity of Technology North Bangkok, in 2018.
His main research interests include the application of microwave microflu-idic sensors, millimeter-wave substrate integrated circuit applications, andsubstrate integrated waveguide applications. He was a recipient of the BestPresentation Award from the Thailand-Japan Microwave, in 2015 and 2018,and the Young Researcher Encouragement Award, in 2016.
NATTAPONG DUANGRIT (Member, IEEE)was born in Chiang Mai, Thailand, in 1991.He received the B.Eng. degree in electronics andtelecommunications engineering from the Raja-mangala University of Technology Thanyaburi,in 2015, and the Ph.D. degree from the KingMongkut’s University of Technology NorthBangkok, in 2019. He is currently working as aLecturer with the Faculty of Engineering, Raja-mangala University of Technology Lanna. His
main research interests include application of 3D printing technology formillimeter-wave and THz devices and substrate integrated waveguide appli-cations.
PATCHADAPORN SANGPET was born in ChiangRai, Thailand, in 1992. She received the bachelor’sdegree in industrial physics and medicalequipment and the master’s degree in electri-cal and computer engineering from the KingMongkut’s University of Technology NorthBangkok, in 2013 and 2016, respectively, whereshe is currently pursuing the Ph.D. degree withthe Department of Electrical and Computer Engi-neering. Her research interests include microwave
sensor, 5G technology, and the antenna used active feedback devices.
PRAYOOT AKKARAEKTHALIN (Member, IEEE)received the B.Eng. and M.Eng. degrees in electri-cal engineering from the King Mongkut’s Univer-sity of Technology North Bangkok (KMUTNB),Bangkok, Thailand, in 1986 and 1990, respec-tively, and the Ph.D. degree from the Universityof Delaware, Newark, DE, USA, in 1998. From1986 to 1988, he was a Research and DevelopmentEngineer with Microtek Products Company Ltd.,Thailand. In 1988, he joined the Department of
Electrical Engineering, KMUTNB. He was the Head of the Senior ResearchScholar Project which is supported by the Thailand Research Fund, from2015 to 2017. He has authored or coauthored more than 40 internationaljournals, more than 200 conference papers, and four books/book chapters.His current research interests include RF/microwave circuits, wideband andmultiband antennas, telecommunication, and sensor systems. He is amemberof IEICE, Japan, ECTI, and the EEAAT Association, Thailand. He was theChairman of the IEEE MTT/AP/ED Thailand Joint Chapter, from 2007 to2010, and the Vice President and the President of the ECTI Association,Thailand, from 2012 to 2013 and 2014 to 2015, respectively. He was theEditor-in-Chief of the ECTI Transactions, from 2011 to 2013.
B. ULRIK IMBERG received the M.Sc. degreein applied physics and electrical engineering fromThe Institute of Technology, LinköpingUniversity,in 1997. He is currently leading the Huawei Tech-nologies Sweden AB Wireless Technology Plan-ning Team. His research interests include 5G and6G telecommunication systems and technologies,especially active antennas, antenna-near electron-ics, and photonics.
188906 VOLUME 8, 2020

N. Chudpooti et al.: In-Situ Self-Aligned NaCl-Solution Fluidic-Integrated Microwave Sensors
IAN D. ROBERTSON (Fellow, IEEE) received theB.Sc. (Eng.) and Ph.D. degrees from the King’sCollege London, London, U.K., in 1984 and 1990,respectively. From 1984 to 1986, he was with theGaAs MMIC Research Group, Plessey Research,Caswell, U.K. Then, he returned to the King’s Col-lege, initially as a Research Assistant working onthe T-SAT project and, then, as a Lecturer leadingthe MMIC Research Team, where he became aReader, in 1994. In 1998, he became a Professor
of microwave subsystems engineering with the University of Surrey, wherehe established the Microwave Systems Research Group and was a FoundingMember of the Advanced Technology Institute. In 2004, he was appointedas the Centenary Chair of microwave and millimetre-wave circuits with theUniversity of Leeds. He was the Director of learning and teaching, from2006 to 2011, and the Head of the School, from 2011 to 2016. He was theGeneral Technical Programme Committee Chair of the EuropeanMicrowaveWeek, in 2011 and 2016.
NUTAPONG SOMJIT (Senior Member, IEEE)received the Dipl.Ing. (M.Sc.) degree from theDresden University of Technology, in 2005, andthe Ph.D. degree from the KTH Royal Institute ofTechnology, in 2012.
Then, he returned to Dresden to lead a ResearchTeam in micro-sensors and MEMS ICs for theChair for Circuit Design and Network Theory.In 2013, he was appointed as a Lecturer (an Assis-tant Professor) with the School of Electronic and
Electrical Engineering, University of Leeds, where he is currently an Asso-ciate Professor/Reader. His main research interests include integrated smarthigh-frequency components, heterogeneous integration, and low-cost micro-fabrication processes. He was appointed as a member of the Engineering,Physical and Space Science Research Panel of the British Council in 2014.He was a recipient of the Best Paper Award (EuMIC prize) at the EuropeanMicrowaveWeek in 2009. He was awarded a Graduate Fellowship fromthe IEEE Microwave Theory and Techniques Society (MTT-S) in 2010 and2011, and the IEEE Doctoral Research Award from the IEEE Antennas andPropagation Society in 2012. In 2016, he was the Chair of the Student DesignCompetition for the European Microwave Week. Since 2013, he has been amember of the International Editorial Board of the International Journal ofApplied Science and Technology. In 2018, he was appointed as an AssociateEditor of IET Electronics Letters.
VOLUME 8, 2020 188907