in-situ x-ray microtomography characterization of damage
TRANSCRIPT

HAL Id: hal-00736300https://hal.archives-ouvertes.fr/hal-00736300
Submitted on 28 Sep 2012
HAL is a multi-disciplinary open accessarchive for the deposit and dissemination of sci-entific research documents, whether they are pub-lished or not. The documents may come fromteaching and research institutions in France orabroad, or from public or private research centers.
L’archive ouverte pluridisciplinaire HAL, estdestinée au dépôt et à la diffusion de documentsscientifiques de niveau recherche, publiés ou non,émanant des établissements d’enseignement et derecherche français ou étrangers, des laboratoirespublics ou privés.
In-situ X-ray microtomography characterization ofdamage in SiC/SiC minicomposites
Camille Chateau, Lionel Gélébart, Michel Bornert, Jérôme Crépin, ElodieBoller, C. Sauder, Wolfgang Ludwig
To cite this version:Camille Chateau, Lionel Gélébart, Michel Bornert, Jérôme Crépin, Elodie Boller, et al.. In-situ X-raymicrotomography characterization of damage in SiC/SiC minicomposites. Composites Science andTechnology, Elsevier, 2011, 71 (6), pp.916-924. �10.1016/j.compscitech.2011.02.008�. �hal-00736300�
Accepted Manuscript
In-situ X-ray microtomography characterization of damage in SiCf/SiC mini‐
composites
C. Chateau, L. Gélébart, M. Bornert, J. Crépin, E. Boller, C. Sauder, W. Ludwig
PII: S0266-3538(11)00075-3
DOI: 10.1016/j.compscitech.2011.02.008
Reference: CSTE 4933
To appear in: Composites Science and Technology
Received Date: 19 November 2010
Revised Date: 16 February 2011
Accepted Date: 20 February 2011
Please cite this article as: Chateau, C., Gélébart, L., Bornert, M., Crépin, J., Boller, E., Sauder, C., Ludwig, W., In-
situ X-ray microtomography characterization of damage in SiCf/SiC minicomposites, Composites Science and
Technology (2011), doi: 10.1016/j.compscitech.2011.02.008
This is a PDF file of an unedited manuscript that has been accepted for publication. As a service to our customers
we are providing this early version of the manuscript. The manuscript will undergo copyediting, typesetting, and
review of the resulting proof before it is published in its final form. Please note that during the production process
errors may be discovered which could affect the content, and all legal disclaimers that apply to the journal pertain.
In-situ X-ray microtomography characterization of damage in SiCf/SiC
minicomposites
C.Chateaua, L.Gélébarta*, M.Bornertb,c, J.Crépind, E.Bollere, C.Saudera, W.Ludwigf a CEA, DEN, SRMA, 91191 Gif-sur-Yvette, France
b Université Paris Est, Laboratoire Navier, Ecole des Ponts ParisTech, 77455 Marne-la-
Vallée Cedex, France c Solid Mechanics Laboratory, Ecole polytechnique, CNRS UMR 7649, 91128
Palaiseau Cedex, France d Centre des matériaux, Mines ParisTech, CNRS UMR 7633, BP 87, F-91003 Evry
Cedex, France e European Synchrotron Radiation Facility, 6 rue Jules Horowitz, 38043 Grenoble
Cedex, France f MATEIS, Université de Lyon, INSA Lyon, CNRS UMR 5510, 69621 Villeurbanne
Cedex, France
* Corresponding author: [email protected],tel: +33169081678, fax: +33169087167
Abstract
The purpose of the present study is to characterize matrix crack propagation and fiber
breaking occurrences within SiC/SiC minicomposite in order to validate later on a
multiscale damage model at the local scale. An in-situ X-ray microtomography tensile
test was performed at the European Synchrotron Radiation Facility (ESRF, ID19
beamline) in order to obtain 3-dimensional (3D) images at six successive loading levels.
Results reveal a slow and discontinuous propagation of matrix cracks, even after the
occurrence of matrix crack saturation. A few fiber failures were also observed.
However, radiographs of the whole length (14 mm) of the minicomposites under a load
and after the failure were more appropriate to get statistical data about fiber breaking.
Thus, observations before the ultimate failure revealed only a few fibers breaking
homogenously along the minicomposite. In addition, an increase in fiber breaking
density in the vicinity of the fatal matrix crack was observed after failure. These
experimental results are discussed in regards to assumptions used in usual 1-
dimensional (1D) models for minicomposites.
Keywords
A. Ceramic-matrix composites (CMCs), B. Matrix cracking, C. Damage mechanics, D.
X-ray computed microtomography (µ-CT).
Introduction
SiCf/SiC composites are prospective candidates for functional uses in future nuclear
reactors - such as gas cooled fast reactors (GFR) - because of their favorable mechanical
properties at high temperatures and after irradiation. The composites under investigation
are made from a 2D fibrous preform composed of the new near-stoechiometric SiC
fibers (Hi-Nicalon type S or Tyranno SA3 fibers), using the Chemical Vapor Infiltration
(CVI) process. The material exhibits a nonlinear behavior due to the accumulated
damage occurring between and inside the woven tows, such as through matrix cracking,
fiber/matrix debonding as well as fiber breaking. Thus, a characterization of damage
mechanisms within the tow is required to build and validate at local scale a multiscale
predictive model. Due to their simple geometry, minicomposites (unidirectional
composites containing a single bundle of fibers) are well suited to study these
mechanisms. They are also frequently used to optimize the fiber/matrix interphase
which dictates the matrix crack deflection along the fibers and consequently the
nonlinear behavior of the composite [1, 2, 3].
Several 1D statistical models of the evolutional damage have previously been reported
[4, 5, 6, 7, 8, 9, 10, 11]. They are based on matrix and fiber failure probability laws
(such as the Weibull law) and are complemented by a stress redistribution assumption in
the vicinity of matrix cracks. These models may lead to satisfactory predictions of the
macroscopic response. However, microscopic phenomena cannot be fully validated
because of the lack of experimental damage characterization. In fact, if the qualitative
damage evolution is accepted, then observations reported in other literature were limited
to the sample surface and were mostly collected after the ultimate failure [1, 6, 12, 13].
The purpose of this article is to present an experimental characterization of damage in
SiCf/SiC minicomposites under a tensile load using X-ray microtomography. As
reviewed by Stock [14], microtomography has been successfully used in material
research. In particular, it has been used to study damage or fatigue cracks [15] in several
materials such as fiber reinforced metal [16, 17, 18] or polymer [19, 20, 21] matrix
composites, aluminium alloys [22, 23] or polymers (PMMA) [24]. However,
tomography applied to SiCf/SiC composites has been limited to porosity observations
[25, 26, 27], crack observations requiring a very high resolution because openings are
smaller than 1 µm. In order to investigate matrix crack propagation through SiCf/SiC
minicomposite sections, 3D images of a minicomposite under several tensile loading
levels were acquired using the X-ray synchrotron source provided by the European
Synchrotron Radiation Facility (ESRF). These images, reconstructed from a large
number of radiographs, have been analyzed to detect matrix cracks within a small
volume. Therefore, the morphology and kinetics of crack propagation through the
minicomposite section can be described. In order to get statistical data on the fiber
failure locations, fiber breaking has also been directly observed using a single
radiograph of the entire sample. This was done for a single tensile loading level (about
80 % of the stress to failure) and after failure.
1. Material and methods
1.1. Minicomposites

The studied minicomposites were made [3] from a fibrous yarn constructed from 500
Hi-Nicalon type S fibers, with an average diameter of 13 �m. The 100 nm interphase
(pyrocarbon) and the SiC matrix were deposited on the fibers using the CVI process.
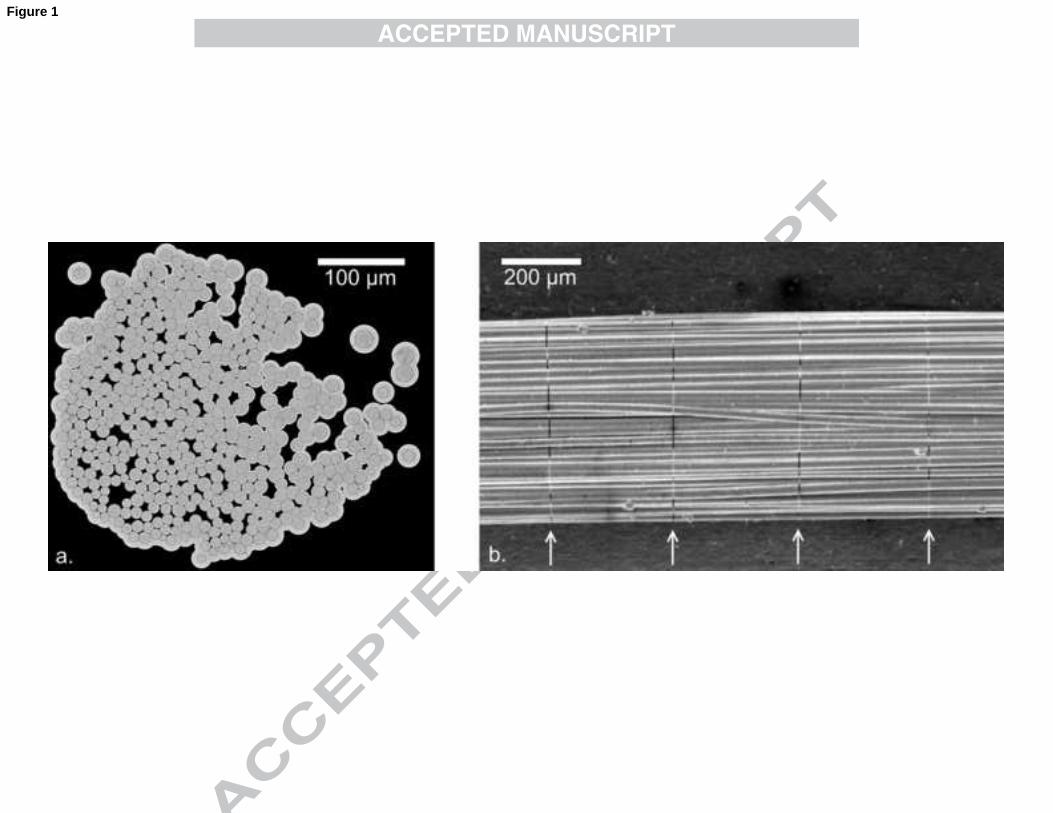
The residual porosity due to the CVI process, and fiber fractions were estimated at 0.12
(±0.04) and 0.58 (±0.09) from polished cross-section pictures (figure 1a).
Like the woven composite, minicomposites have an elastic, damageable behavior. Their
macroscopic behavior (figure 2) follows typical successive steps in accordance with
damage evolution [3, 12]. The first one is an elastic domain of the minicomposite
behavior: no cracking occurs. A second nonlinear step is associated with the matrix
cracking (figure 1b) until saturation of crack number density (reached for a total strain
of about 0.3%). A second linear domain associated with the additional elastic
deformation of fibers is then observed after matrix crack saturation. The final step is
characterized by a slight nonlinearity associated with fiber breaking just before the
ultimate failure (close to � 0.7%).
1.2. Experimental procedure
The in-situ microtomography tensile test was carried out on the ID19 beamline at the
ESRF, in Grenoble, France. A specific in-situ tensile testing machine dedicated to ID19
was used to manually load the specimen (called specimen #1). The minicomposite was
glued onto aluminium tabs and had a gauge length of 14 mm. Only the load was
monitored using a 500 N load cell. The test was interrupted at six successive loading
levels (50, 68, 74, 86, and 92 N) to record the tomography images. The corresponding
load levels are reported on the typical load-strain curve presented in figure 2, and were
obtained from another sample of the same batch with a classical macroscopic device.
Microtomography consists in recording a set of radiographs acquired at high resolution
and at various angular positions of the sample with respect to the X-ray beam [28].
Appropriate algorithms are then used to reconstruct the 3D image from this set of
radiographs. A high resolution was necessary to observe both cracks and the
microstructure of the tow. Such a resolution with moderate acquisition times could only
be reached through a synchrotron radiation, which gives a monochromatic, parallel and
high intensity beam. The highest resolution provided on the ID19 beamline at the ESRF
is a voxel (volumetric pixel) size of 0.28 �m, identical in all three directions. To observe
a 1.65 mm total length, three acquisitions at three successive axial positions were
required. In addition, these acquisitions, or scans, were performed at four distinct
distances (8, 14, 26 and 36 mm) from the sample to the camera (a Fast Readout Low
Noise – FreLoN – 14 bit CCD camera with a resolution of 2048 × 2048 pixels [29]),
using a 20.5 keV energy beam. From these four scans, two 3D images were
reconstructed from the radiographs recorded at the two shorter distances, using the
standard absorption mode (filtered back projection reconstruction) and a third one using
the holotomographic mode (based on phase contrast). 3D holotomographic images were
reconstructed by combining the four scans [30], using the specific algorithm proposed
by Langer [31, 32]. Finally, these scans were performed for each loading level (50, 68,
74, 80, 86 and 92 N). In total, the entire experiment required 72 scans (3 fields of view
x 4 distances x 6 loading levels) with each scan consisting of 1500 radiographs.
Due to the length of acquisition time for each scan (25 min), it was not possible to
observe the entire gauge length of the specimen. However, a simple radiograph for the
whole length was acquired at 92 N. Finally, another sample (called specimen #2) was
loaded until failure (115 N) with the same tensile device. A radiograph of the whole

specimen was acquired after failure. To summarize, three distinct kinds of observation
have been made:
A. the 3D images of a 1.65 mm long region of the specimen #1 observed at six
successive loading levels,
B. the radiograph of the whole specimen #1 (about 14 mm long) under tensile loading at
92 N,
C. the radiograph of the longest part of the broken specimen #2 (about 12 mm).
1.3. Damage detection
1.3.1. Matrix cracking (obs.A)
One goal of this study is to characterize the matrix crack morphology and its evolution
with a load increase. Indeed, as presented in figure 3 (the detection procedure is detailed
below), matrix cracks have a specific morphology which requires accurate locating.
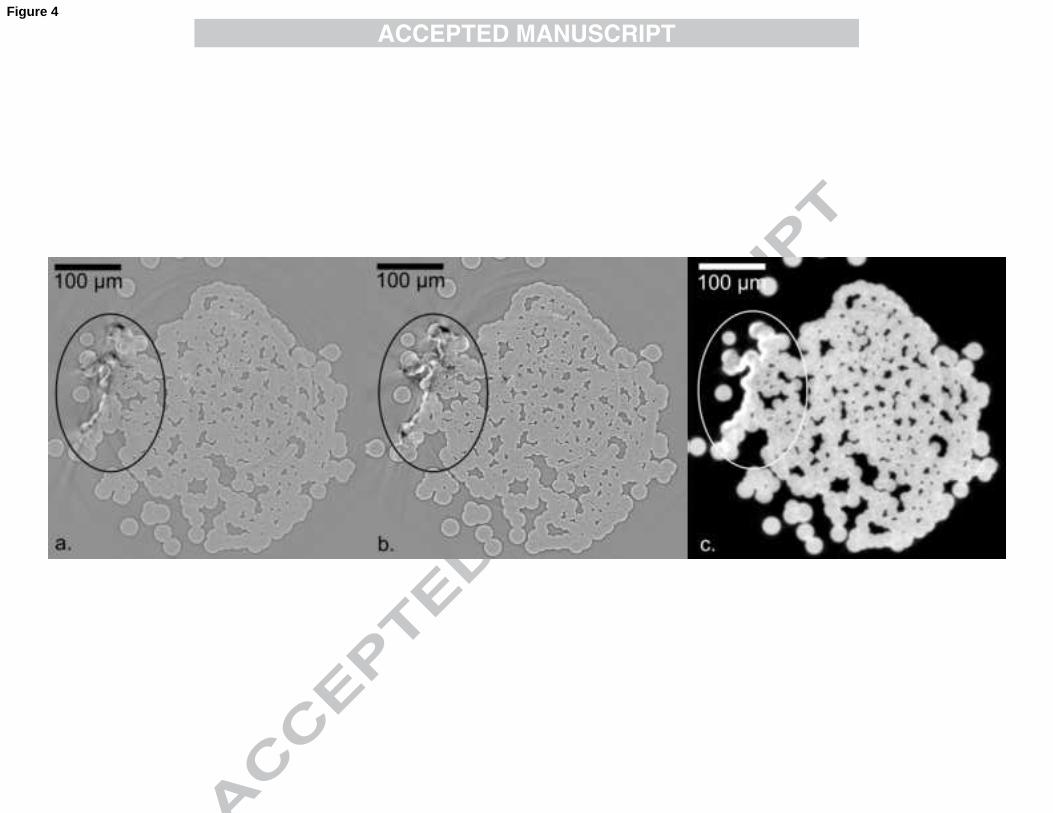
Such a result was obtained by spotting grey level variations in 3D images caused by the
crack (figure 4). These variations could be visually noticed by routine observation of
transverse slices of the tow. In the following, a “crack width” (along the axial direction)
is defined from the number of transverse slices crossed by the crack (see figure 3). Note
that crack openings cannot be characterized with accuracy because image resolution is
not sufficient.
Moreover, the crack effects are more noticeable on the images reconstructed from the
second distance radiographs than from the first. In fact, it is now well known that when
a synchrotron source is used, an additional phase contrast due to diffraction effects
appears on projections that improves the efficiency of damage detection [15, 33]. This
contrast, invisible at the zero distance, is enhanced as the sample/detector distance
increases. However, an increase in distance also emphasizes diffraction fringes on the

crack edges, making a quantitative observation of the crack more difficult. Although the
crack is less noticeable on holotomographic reconstructions, diffraction fringes do not
appear on these reconstructed images (figure 4) as the reconstruction procedure takes
into account their physical origin [15, 30]. In order to precisely locate the crack within
the section, a specific procedure was established to automatically detect the cracks in
the volume by combining the three distinct reconstructions.
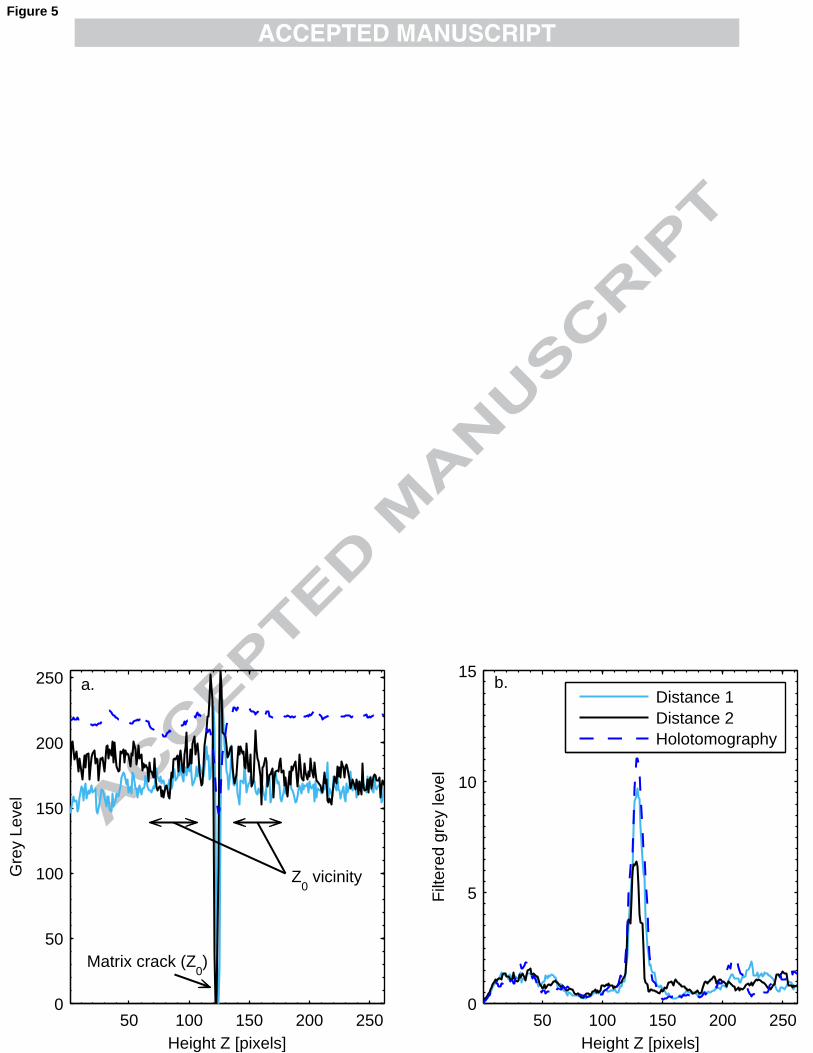
Considering a sub-volume containing a matrix crack (figure 1), the detection procedure
is based on the processing of the grey level variation in the axial (Z) direction for all
(X,Y) positions on the transverse plane. An example of such an evolution for a given
(X,Y) position is provided in figure 5a. The crack leads to an important variation of the
grey levels on a relatively short height among the three referenced reconstructions. The
aim of the automatic procedure is to spot and locate this fluctuation in the axial
direction, while reducing the detection of artifacts such as microstructure changes
(matrix/pore interface) or image noise effects. Thus, a specific filter has been developed
(figure 5b). It corresponds to the ratio of the norm of the grey level gradient along the Z-
direction to the average derivative in a vicinity along Z (defined in figure 5a). In
addition, the derivative was smoothed prior to the filtering in order to reduce the noise
effect, using a centered moving average (10 voxels window along the Z-direction). A
crack was then detected when the three global maxima (corresponding to the three
reconstructions) of the filtered grey levels were separated by less than 10 voxels, ie 2.8
µm, which specifies the accuracy of the crack location. Otherwise, the material is
considered healthy for the (X,Y) position and for all Z slices of the sub-volume. All
(X,Y) positions are processed independently this way.

A combination of the three reconstructed volumes allows for reducing the detection of
artifacts, like diffraction fringes at other interfaces. Moreover, the few number of
detections located in the porous phase were removed.
Besides the main cracks that are detectable using the automatic procedure, there are
small matrix cracking zones located on the periphery of the sample (isolated fiber
group) or within the minicomposite. These are called minor cracks. They lead to a far
smaller grey level variation along the Z axis, similar in intensity to image noise. As a
result, the automatic detection procedure could not be used. However, because of their
small size (about 5% of the global section) and their limited number, a manual axial
location based on a direct observation of the images was sufficient to characterize them.
The tomographic images resulting from observation A also show a few fiber failures
which were easy to detect visually. Nevertheless, the observed field of view was far too
small and the fiber breaking density too low to get statistically representative data about
fiber breaking. Fiber/matrix debonding was not observable on these images.
1.3.2. Fiber breaking (obs.B and C)
In order to study fiber break distribution under load (92 N) and after failure, simple
radiographs were useful to locate both fiber failures and main matrix cracks along the
entire minicomposite length, as shown on figure 6a. While a few minor cracks were
detected (they were harder to find on those images), they were not reported here. The
detection was limited to visual observation leading to an inventory of fiber break and
main matrix crack positions. Fiber crack openings and crack widths, as defined in
section 1.3.1, can also be estimated (figure 6).
2. Results and discussion
2.1. Matrix cracking

2.1.1. Matrix crack distribution
The axial distribution of main matrix cracks and fiber breaks (as defined in section 1.3)
are presented in figure 7 from radiograph observation performed at 92 N of the entire
minicomposite (obs. B). At this loading, the matrix cracking can be assumed to be
completed (see figure 2) so the average intercrack distance at saturation of crack
number density was estimated to be equal to 250 µm. This value is consistent with crack
spacing distances measured on similar minicomposites after classical tensile tests [3]
(173 µm to 350 µm) .The field of view of the tomography observations (obs. A) is also
reported in figure 7. Before studying matrix crack morphology and propagation in
detail, the evolution of the damage axial distribution was investigated by visual
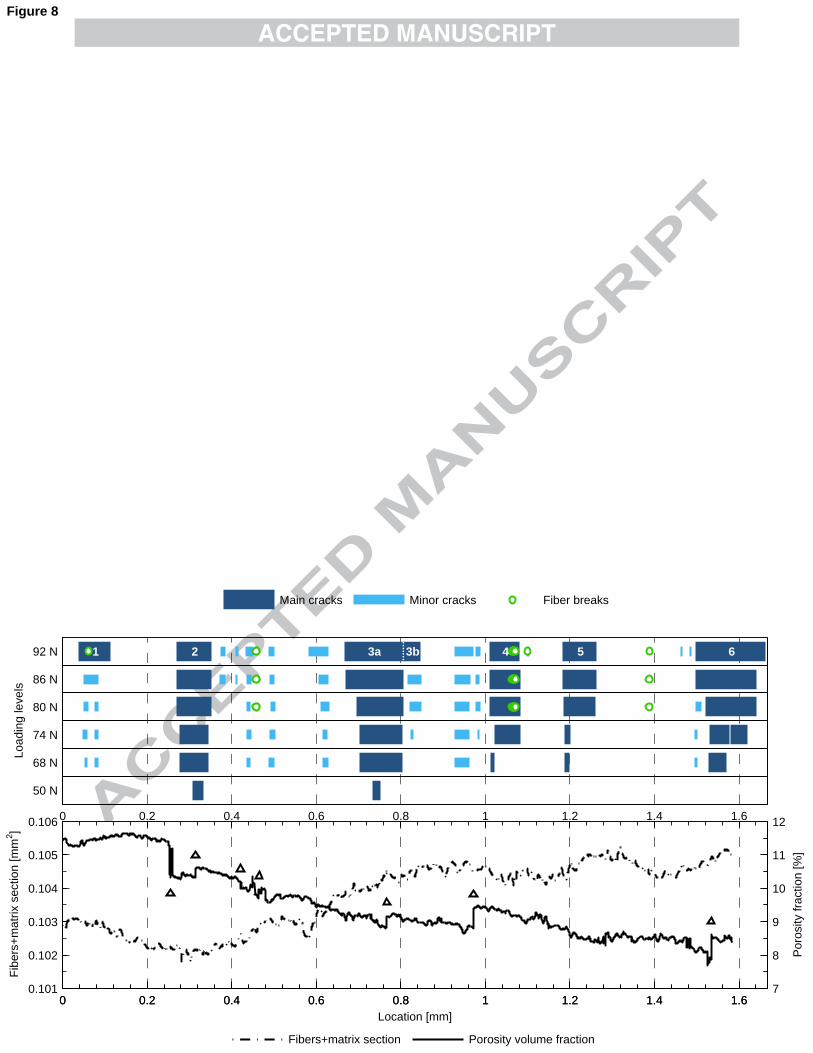
detection in the CT-reconstructions for the six different loading levels (figure 8). A first
observation is that most cracks evolve when the load is increasing, in the sense that their
width, as defined before, increases. Moreover, some of the minor cracks developed into
main cracks, but the majority remained isolated.
The damage distribution is then compared with the effective section and surface
porosity fraction variations in the axial direction (figure 8). The purpose is to study a
potential link between damage location and these global characterizations of the
microstructure. Both were estimated from a threshold of the holotomographic image.
The porosity of a section is here defined as the ratio of the closed pore area over the
largest connex part of the composite section. Open pores on the periphery are not taken
into account. These measurements are sensitive to the threshold choice. Its impact
(relative error) was estimated at ±2% for the effective section and ±10% for the porosity
fraction. The emphasis here is on the porosity variation along the minicomposite which

does not significantly depend on the threshold. Note also that the sharp porosity
variations correspond to openings or closings of peripheral pores.
These observations did not evidence any clear link between crack locations and these
global microstructure quantifications. Crack locations do generally not coincide with
local extrema of effective section or porosity. Crack 2 is an exception, as it coincides
with a local minimum of the effective section and thus a local maximum of average
axial stress, but this is far from a general features.
2.1.2. Matrix crack propagation
The automatic procedure described in section 1.3 was used to detect the six main cracks,
numbered in figure 8, for all of the six loading levels applied during observation A. Six
sub-volumes, centered on the six main cracks observed at 92 N, were defined to
compute the detection. Figure 9 describes the 3D geometry of the six detected cracks, in
the form of the height Z of each crack as a function of the (X,Y) positions on the
transverse plan. Only loading levels indicating crack propagation are presented (for
example crack 2 did not propagate between 68 N and 74 N).
Two preliminary comments can be made before going into detail. Firstly, projections of
cracks 1 and 6 are less clear than others. Contrast variations (like the one presented in
figure 5) were far less pronounced for these two cracks. This is probably a consequence
of a smaller crack opening. Secondly, the minor crack 3b presented in figure 10 and
main crack 3a are complementary. As presented in figure 8, the two cracked zones were
independent before the last loading step.
Concerning the crack morphology at 92 N, all six main cracks spread across the entire
minicomposite section. They are not flat and typically follow a spiral shape around the
fiber direction, except for crack 4 which presents an axial symmetry. Note also that the
crack elongation in the fiber direction – from 40 µm up to more than 100 µm – is quite
large with respect to the intercrack distance (250 µm at saturation).
Pertaining to crack propagation, two or three distinct propagation states were observed
depending on the crack. For example, cracks 2, 3, 4 and 6 propagation states followed
three typical steps: crack initiation in a localized peripheral zone of the minicomposite,
crack propagation on the entire periphery, and finally, propagation towards the section
center. Crack 5 also initialized on the periphery, but the intermediate propagation state
was not caught during observations. Lastly, although it was not revealed by the
detection process, crack 1 initiation was visually detected and occurred inside the
minicomposite section at 86 N.
Moreover, cracks 2, 3 and 4 did not propagate between 68 and 74 N. This revealed a
discontinuous propagation. Furthermore, even if the matrix cracking saturation was
supposed to be reached (ie no additional crack appears), the propagation was not
achieved at 74 N. These results contradict the usual 1D modeling of minicomposite [6,
9], which assumes that the matrix cracks suddenly spread across the entire section with
a uniform crack opening (ie propagation stage is ignored).
2.2. Fiber breaking
Radiographs resulting from observations B and C lead to statistical data about fiber
breaking along the minicomposite under loading (92 N) and after failure. Following
figure 7, fiber breaks appeared homogeneously along the minicomposite, mostly located
in the vicinity of the matrix cracks. The fiber break density was rather low, with 4.8
broken fibers per mm (ie less than 1% fibers per mm).

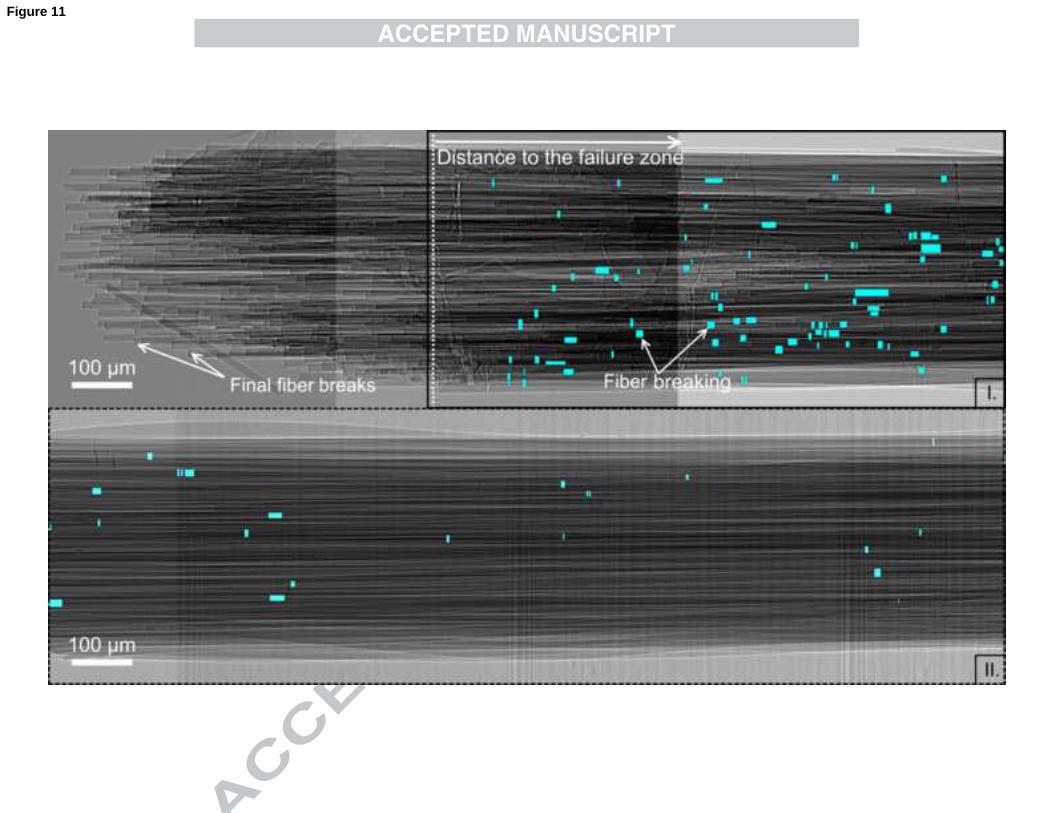
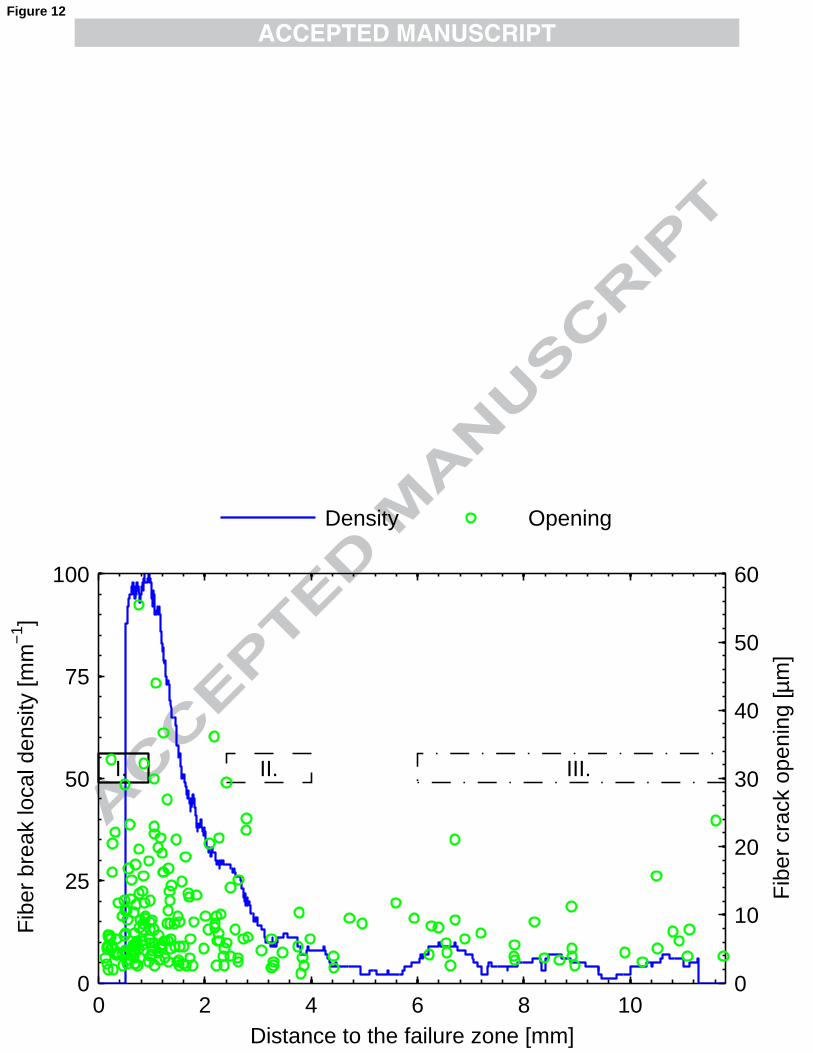
Considering post-failure observations without counting final breaks (figure 11),
approximately 220 fiber breaks were observed in the 12 mm long half minicomposite.
The break density is far less homogeneous (figure 12). In fact, most fiber breaks are
located within 2 mm of the failure zone. On the other hand, the fiber break distribution
is quite homogeneous at other locations. It has a density of approximately 5 breaks per
mm (calculated on region III in figure 12), very similar to the density at 92 N.
Additionally, observation A shows that the first fiber breaks observed with 3D
tomography appeared at 80 N (figure 8). This load matches the final stage of matrix
crack propagation inside the minicomposite.
To summarize, it appears that fiber breaking occurs at the completion of matrix cracking
propagation with a rather low density and a uniform distribution with preferred
locations near matrix cracks. At the load resulting in ultimate failure, fiber breaking was
centralized within an area (about 4 mm long) surrounding the ultimate failure location.
Finally, fiber crack openings reported on figure 12 are 7 µm long in average far from
the failure zone. Fiber breaks located near the failure zone exhibit larger openings (up to
50 µm).
In agreement with these observations, two different scenarios could be proposed. On the
one hand, a random uniform fiber breaking develops slowly as the stress increases and
the localization of the fiber density observed on figure 12 is the consequence of
dynamic effects during failure. On the other hand, the random fiber breaking starts with
a uniform distribution, then a localization of the break density occurs and leads to the
ultimate failure. This second scenario is in better agreement with the final slight non-
linearity observed on macroscopic curves, but additional experiments are required to
conclude. However, in both cases, this characterization shows that one fiber can fail
twice along the minicomposite. This has also been observed on a fiber in obs.A.
These experimental results are inconsistent with the assumption of the classical fiber
bundle model [34] used in some 1D models [6, 35] which supposes that once broken, a
fiber does not participate anymore to the load transfer throughout the whole composite
(and as a consequence breaks only once). Fiber break observations are rather in line
with works which take into account a sliding length around a break necessary for the
fiber to recover back its previously carried stress [36, 37, 11]. Moreover, those works
also emphasize a localization region around some plane weaker than the others along
the composite where fiber breakage will continue once final breakdown occurs there
[38, 39, 40].
3. Concluding remarks
Standard 2D techniques are not sufficient to characterize damage mechanisms such as
matrix crack propagation and fiber breaking occurring within the material. Therefore, an
in-situ tensile test was performed on a SiCf/SiC minicomposite under X-ray
microtomography to observe damage evolution. The matrix crack detection required the
use of a high resolution equipment available through synchrotron radiation at the ESRF.
Two observation techniques were used and resulted in the following damage
characterization:
- The tomography (absorption and holotomographic mode) performed on a
minicomposite at 6 successive loading levels was necessary to observe matrix crack
evolutions within the sample. A few fiber breaks may also be observed.
- Simple radiograph acquisition was much faster than tomography acquisition.
Therefore, the whole minicomposite observations could be performed under loading and
after failure. Matrix crack and fiber break characterizations are limited to their spatial
location along the sample, but it continues to be a useful way to get statistical data about
fiber breaking. Moreover, the resolution was sufficient to estimate fiber break openings.
These observations provided a deeper insight on damage mechanisms:
- Besides well known transverse cracks and fiber breaks, 3D images revealed minor
matrix cracks. These small matrix cracking zones located within the minicomposite
could become a transverse crack or could remain localized. However, the cracked
sections are so small that the influence on the macroscopic damageable behavior is
likely to be insignificant compared to main cracks.
- A specific automatic procedure was developed to detect and locate main cracks along
the minicomposite. Most of them are not flat but typically follow a spiral shape which is
quite elongated in the fiber direction. In addition, the matrix crack propagates slowly
and discontinuously within the bundle of fibers, even after the cracking saturation. They
mostly appear at first on the peripheral zone, and then propagate towards the center of
the section. This experimental evidence is contrary to common assumption of 1D
models which ignore crack propagation. Such assumptions that are appropriate for
microcomposites (containing a single fiber) [10], may be insufficient for
minicomposites.
- Fiber breaking seems to begin immediately after matrix crack propagation ends. Fibers
fail, at first homogeneously, and are typically located in the vicinity of matrix cracks.
Fiber break density stabilizes around 5 fiber failures per mm, except in a short zone (a
few millimeters) surrounding the ultimate failure where the break number density is
much greater. Fiber openings are also much larger in this area. Two scenarios have been
proposed to explain these observations, involving dynamic effects induced by the

ultimate failure or fiber breaking localization leading to the ultimate failure. Moreover,
experimental results suggest selecting models based on frictional load-sharing rather
than neglecting the contribution of broken fibers to the load transfer.
Acknowledgement
The authors are very grateful to M.Langer for his help in reconstructing
holotomographic images. The ID19 team is also acknowledged for its help during the
experiment at the ESRF.
References
[1] G. N. Morscher, Tensile stress rupture of SiCf/SiCm minicomposites with carbon
and boron nitride interphases at elevated temperatures in air, Journal Of The American
Ceramic Society 80 (8) (1997) 2029–2042.
[2] S. Bertrand, R. Pailler, J. Lamon, SiC/SiC minicomposites with nanoscale
multilayered fibre coatings, Composites Science And Technology 61 (3) (2001) 363–
367.
[3] C. Sauder, A. Brusson, J. Lamon, Influence of interface characteristics on the
mechanical properties of Hi-Nicalon type-S or Tyranno-SA3 fiber-reinforced SiC/SiC
minicomposites, International Journal Of Applied Ceramic Technology 7 (3) (2010)
291–303.
[4] C. Baxevanakis, D. Jeulin, J. Renard, Fracture statistics of a unidirectional
composite, International Journal Of Fracture 73 (2) (1995) 149–181.
[5] C. Y. Hui, S. L. Phoenix, M. Ibnabdeljalil, R. L. Smith, An exact closed-form
solution for fragmentation of weibull fibers in a single filament composite with
applications to fiber-reinforced ceramics, Journal Of The Mechanics And Physics Of
Solids 43 (10) (1995) 1551–1585.
[6] N. Lissart, J. Lamon, Damage and failure in ceramic matrix minicomposites:
Experimental study and model, Acta Materialia 45 (3) (1997) 1025–1044.
[7] A. T. DiBenedetto, M. R. Gurvich, Statistical simulation of fiber fragmentation in a
single-fiber composite, Composites Science And Technology 57 (5) (1997) 543–555.
[8] W. A. Curtin, B. K. Ahn, N. Takeda, Modeling brittle and tough stress-strain
behavior in unidirectional ceramic matrix composites, Acta Materialia 46 (10) (1998)
3409–3420.
[9] J. Lamon, Stochastic approach to multiple cracking in composite systems based on
the extreme-values theory, Composites Science And Technology 69 (10) (2009) 1607–
1614.
[10] E. Castelier, L. Gélébart, C. Lacour, C. Lantuéjoul, Three consistent approaches of
the multiple cracking process in 1D composites, Composites Science and Technology
70 (15) (2010) 2146–2153.
[11] S. L. Phoenix, Statistical issues in the fracture of brittle-matrix fibrous composites,
Composites Science and Technology 48 (1-4) (1993) 65–80.
[12] S. Bertrand, P. Forio, R. Pailler, J. Lamon, Hi-Nicalon/SiC minicomposites with
(pyrocarbon/SiC)(n) nanoscale multilayered interphases, Journal Of The American
Ceramic Society 82 (9) (1999) 2465–2473.
[13] J. Martinez-Fernandez, G. N. Morscher, Room and elevated temperature tensile
properties of single tow Hi-Nicalon, carbon interphase, CVI SiC matrix
minicomposites, Journal Of The European Ceramic Society 20 (14-15) (2000) 2627–
2636.
[14] S. R. Stock, Recent advances in X-ray microtomography applied to materials,
International Materials Reviews 53 (3) (2008) 129–181.
[15] J. Y. Buffière, E. Ferrié, H. Proudhon, W. Ludwig, Three-dimensional visualisation
of fatigue cracks in metals using high resolution synchrotron X-ray micro-tomography,
Materials Science And Technology 22 (9) (2006) 1019–1024.
[16] S. A. Mcdonald, M. Preuss, E. Maire, J. Y. Buffière, P. M. Mummery, P. J.
Withers, X-ray tomographic imaging of Ti/SiC composites, Journal Of Microscopy-
Oxford 209 (2003) 102–112.
[17] T. M. Breunig, J. H. Kinney, S. R. Stock, MicroCT (microtomography)
quantification of microstructure related to macroscopic behaviour - Part 2 - Damage in
SiC-Al monofilament composites tested in monotonic tension and fatigue, Materials
Science And Technology 22 (9) (2006) 1059–1067.

[18] Y. C. Hung, J. A. Bennett, F. A. Garcia-Pastor, M. Di Michiel, J. Y. Buffière, T. J.
A. Doel, P. Bowen, P. J. Withers, Fatigue crack growth and load redistribution in Ti/SiC
composites observed in situ, Acta Materialia 57 (2) (2009) 590–599.
[19] P. J. Schilling, B. P. R. Karedla, A. K. Tatiparthi, M. A. Verges, P. D. Herrington,
X-ray computed microtomography of internal damage in fiber reinforced polymer
matrix composites, Composites Science And Technology 65 (14) (2005) 2071–2078.
[20] D. R. B. Aroush, E. Maire, C. Gauthier, S. Youssef, P. Cloetens, H. D. Wagner, A
study of fracture of unidirectional composites using in situ high-resolution synchrotron
X-ray microtomography, Composites Science And Technology 66 (10) (2006) 1348–
1353.
[21] A. J. Moffat, P. Wright, J. Y. Buffière, I. Sinclair, S. M. Spearing,
Micromechanisms of damage in 0 degrees splits in a [90/0](s) composite material using
synchrotron radiation computed tomography, Scripta Materialia 59 (10) (2008) 1043–
1046.
[22] A. Guvenilir, T. M. Breunig, J. H. Kinney, S. R. Stock, New direct observations of
crack closure processes in Al-Li 2090 T8E41, Philosophical Transactions Of The Royal
Society Of London Series A-Mathematical Physical And Engineering Sciences 357
(1761) (1999) 2755–2775.
[23] E. Ferrié, J. Y. Buffière, W. Ludwig, A. Gravouil, L. Edwards, Fatigue crack
propagation: In situ visualization using X-ray microtomography and 3D simulation
using the extended finite element method, Acta Materialia 54 (4) (2006) 1111–1122.
[24] B. Muller, F. Pfrunder, L. Chiocca, N. D. Ruse, F. Beckmann, Visualising complex
morphology of fatigue cracks in voxel based 3D datasets, Materials Science And
Technology 22 (9) (2006) 1038–1044.
[25] S. B. Lee, S. R. Stock, M. D. Butts, T. L. Starr, T. M. Breunig, J. H. Kinney, Pore
geometry in woven fiber structures: 0 degrees/90 degrees plain-weave cloth layup
preform, Journal Of Materials Research 13 (5) (1998) 1209–1217.
[26] A. Morales-Rodriguez, P. Reynaud, G. Fantozzi, J. Adrien, E. Maire, Porosity
analysis of long-fiber-reinforced ceramic matrix composites using X-ray tomography,
Scripta Materialia 60 (6) (2009) 388–390.
[27] L. Gélébart, C. Chateau, M. Bornert, J. Crépin, E. Boller, X-ray tomographic
characterization of the macroscopic porosity of chemical vapor infiltration SiC/SiC

composites: Effects on the elastic behavior, International Journal Of Applied Ceramic
Technology 7 (3) (2010) 348–360.
[28] L. Salvo, P. Cloetens, E. Maire, S. Zabler, J. J. Blandin, J. Y. Buffière, W. Ludwig,
E. Boller, D. Bellet, C. Josserond, X-ray micro-tomography an attractive
characterisation technique in materials science, Nuclear Instruments & Methods In
Physics Research Section B-Beam Interactions With Materials And Atoms 200 (2003)
273–286.
[29] J. C. Labiche, O. Mathon, S. Pascarelli, M. A. Newton, G. G. Ferre, C. Curfs, G.
Vaughan, A. Homs, D. F. Carreiras, The fast readout low noise camera as a versatile X-
ray detector for time resolved dispersive extended X-ray absorption fine structure and
diffraction studies of dynamic problems in materials science, chemistry, and catalysis,
Review Of Scientific Instruments 78 (9) (2007) 091301.
[30] P. Cloetens, W. Ludwig, J. Baruchel, D. Van Dyck, J. Van Landuyt, J. P. Guigay,
M. Schlenker, Holotomography: Quantitative phase tomography with micrometer
resolution using hard synchrotron radiation X rays, Applied Physics Letters 75 (19)
(1999) 2912–2914.
[31] M. Langer, P. Cloetens, J. P. Guigay, F. Peyrin, Quantitative comparison of direct
phase retrieval algorithms in in-line phase tomography, Medical Physics 35 (10) (2008)
4556–4566.
[32] M. Langer, P. Cloetens, F. Peyrin, Regularization of phase retrieval with phase-
attenuation duality prior for 3-D holotomography, IEEE Transactions on Image
Processing 19 (9) (2010) 2428–2436.
[33] P. Cloetens, M. Pateyron-Salomé, J. Y. Buffière, G. Peix, J. Baruchel, F. Peyrin,
M. Schlenker, Observation of microstructure and damage in materials by phase
sensitive radiography and tomography, Journal Of Applied Physics 81 (9) (1997) 5878–
5886.
[34] H. E. Daniels, The statistical theory of the strength of bundles of threads .1.,
Proceedings of the Royal Society of London Series A-mathematical and Physical
Sciences 183 (995) (1945) 405–435.
[35] J. Lamon, A micromechanics-based approach to the mechanical behavior of brittle-
matrix composites, Composites Science And Technology 61 (15) (2001) 2259–2272.
[36] W. A. Curtin, Theory of mechanical-properties of ceramic-matrix composites,
Journal of the American Ceramic Society 74 (11) (1991) 2837–2845.
[37] S. L. Phoenix, R. Raj, Scalings in fracture probabilities for a brittle matrix fiber
composite, Acta Metallurgica Et Materialia 40 (11) (1992) 2813–2828.
[38] W. A. Curtin, Fiber pull-out and strain localization in ceramic matrix composites,
Journal of the Mechanics and Physics of Solids 41 (1) (1993) 35–53.
[39] W. A. Curtin, The tough to brittle transition in brittle matrix composites, Journal of
the Mechanics and Physics of Solids 41 (2) (1993) 217–245.
[40] S. L. Phoenix, M. Ibnabdeljalil, C. Y. Hui, Size effects in the distribution for
strength of brittle matrix fibrous composites, International Journal of Solids and
Structures 34 (5) (1997) 545–568.
Figure captions
Figure 1: SEM micrographs of (a) minicomposite polished cross section; (b) cracked
minicomposite under tension (75 N), arrows point out matrix cracks.
Figure 2: Macroscopic tensile behavior obtained with a macroscopic device. The
loading levels at which the tensile test was interrupted for the µ-CT observations are
also reported.
Figure 3: (a) Sub-volume containing a matrix crack; (b-c) Detected matrix crack from
two different angles of view.
Figure 4: Reconstruction of a transverse slice in absorption contrast (first two distances)
and holotomographic mode within a matrix crack.
Figure 5: Filtering of grey levels :(a) grey level evolution in the fiber direction through a
matrix crack; (b) filtering results.
Figure 6: (a) Radiograph of the minicomposite at a tensile load of 92 N (b) Zoom on a
fiber break.
Figure 7: Damage location along the entire minicomposite at 92 N as detected from the
radiographs (obs. B). Blue line widths are directly related to crack widths. The
minicomposite part focused on by observation A is framed with a dashed line.
Figure 8: Damage location along the minicomposite in the area observed by
tomography for the 6 successive loading levels (obs. A) compared to the variations of
the effective section (fibers and matrix, without porosity) and the surface porosity
fraction. Triangular markers point out peripheral pore openings or closings.
Figure 9: Results of main crack detections (projections onto the transverse plane). Color
scale corresponds to the local height of each cracked voxel (with respect to the lower
face of each sub-volume). Note that scale is different for each crack.

Figure 10: Projection onto the transverse plane of crack 3b, which is an extension of the
main crack 3a.
Figure 11: Radiographs after failure located near (I.) and far from the ultimate failure
zone (II.) (see figure 12). Fiber breaks are highlighted.
Figure 12: Fiber break local density and opening as a function of the distance to the
ultimate failure zone. The local density was computed over a 1 mm moving window.
Regions I. and II. designate radiograph locations presented in figure 11. Region III. is
the minicomposite part far from the failure zone when crack density appears uniform.

0 0.1 0.2 0.3 0.4 0.5 0.60
20
40
60
80
100
120
Global strain [%]
Load
[N]
Classical tensile testµ−CT tensile test
Figure 2
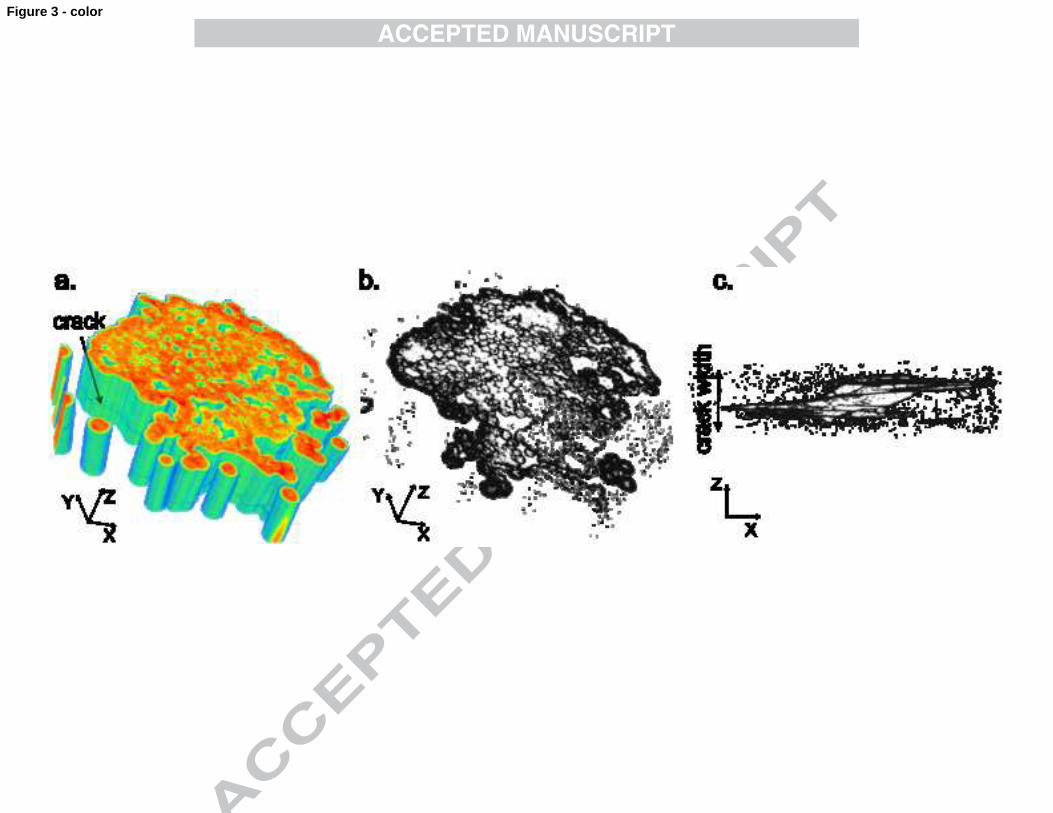
Figure 3 - color
50 100 150 200 2500
50
100
150
200
250
Height Z [pixels]
Gre
y Le
vel
Z0 vicinity
a.
Matrix crack (Z0)
50 100 150 200 2500
5
10
15b.
Height Z [pixels]
Filt
ered
gre
y le
vel
Distance 1Distance 2Holotomography
Figure 5


0 0.5 1 1.5 2 2.5 3 3.5 4 4.5
Par
t 1
5 5.5 6 6.5 7 7.5 8 8.5 9
Obs.A
Par
t 2
9.5 10 10.5 11 11.5 12 12.5 13 13.5Location along the gauge length [mm]
Par
t 3
Main cracks Fiber breaks
Figure 7
0 0.2 0.4 0.6 0.8 1 1.2 1.4 1.6
50 N
68 N
74 N
80 N
86 N
92 N 1 2 4 5 63a 3b
Load
ing
leve
ls
Main cracks Minor cracks Fiber breaks
0 0.2 0.4 0.6 0.8 1 1.2 1.4 1.60.101
0.102
0.103
0.104
0.105
0.106
Location [mm]
Fib
ers+
mat
rix s
ectio
n [m
m2 ]
0 0.2 0.4 0.6 0.8 1 1.2 1.4 1.67
8
9
10
11
12
Por
osity
frac
tion
[%]
Fibers+matrix section Porosity volume fraction
Figure 8
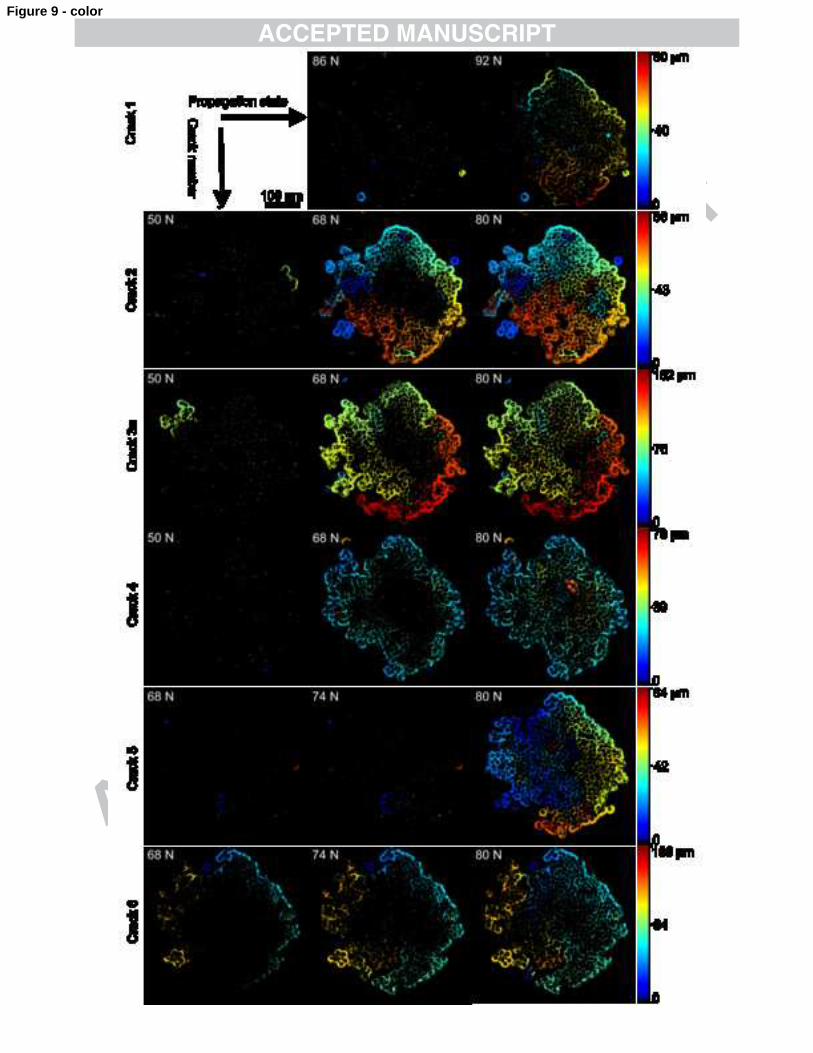
Figure 9 - color

Figure 10 - color
0 2 4 6 8 100
25
50
75
100
Fib
er b
reak
loca
l den
sity
[mm
−1 ]
Distance to the failure zone [mm]
I. II. III.
0
10
20
30
40
50
60
Fib
er c
rack
ope
ning
[µm
]
Density Opening
Figure 12