in the name of allah, - microsoft abdulkader al muhaidib ... in the name of allah, most...
TRANSCRIPT


In the name of Allah,
the Most Gracious, the Most Merciful

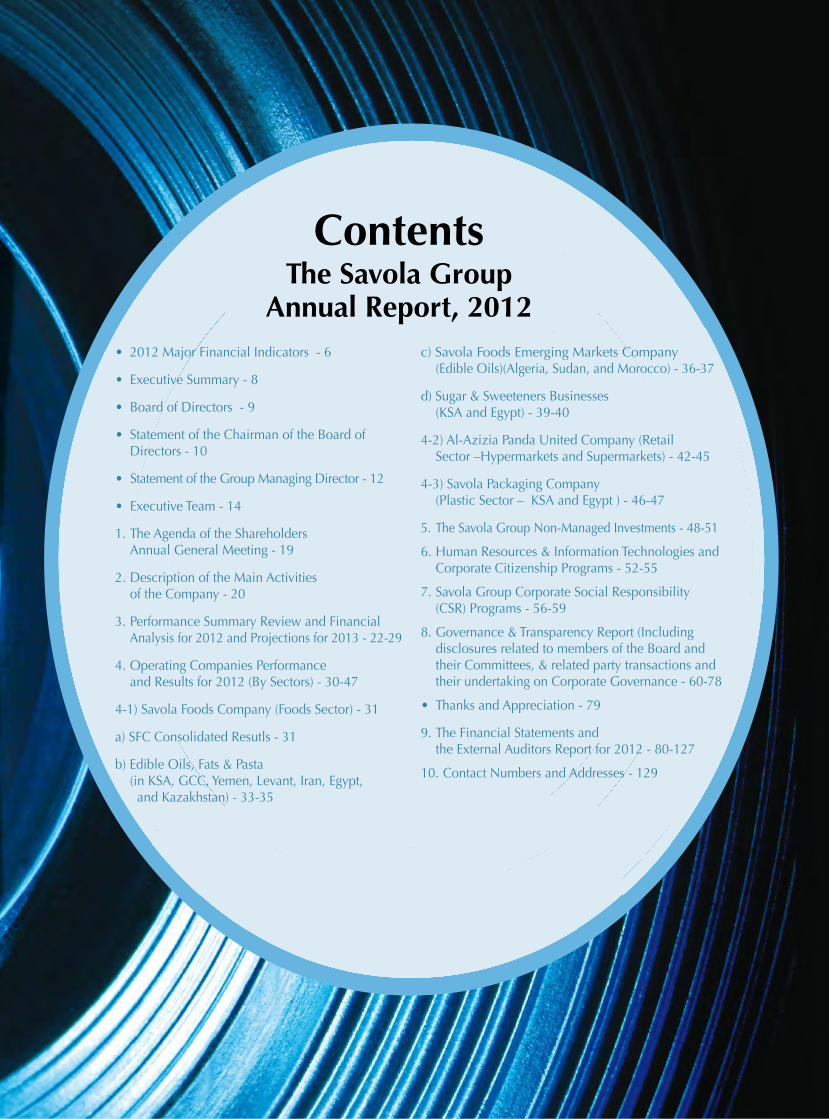
• 2012MajorFinancialIndicators-6
• ExecutiveSummary-8
• BoardofDirectors-9
• StatementoftheChairmanoftheBoardofDirectors-10
• StatementoftheGroupManagingDirector-12
• ExecutiveTeam-14
1.TheAgendaoftheShareholdersAnnualGeneralMeeting-19
2.DescriptionoftheMainActivitiesoftheCompany-20
3.PerformanceSummaryReviewandFinancialAnalysisfor2012andProjectionsfor2013-22-29
4.OperatingCompaniesPerformanceandResultsfor2012(BySectors)-30-47
4-1)SavolaFoodsCompany(FoodsSector)-31
a)SFCConsolidatedResutls-31
b)EdibleOils,Fats&Pasta(inKSA,GCC,Yemen,Levant,Iran,Egypt,andKazakhstan)-33-35
c)SavolaFoodsEmergingMarketsCompany(EdibleOils)(Algeria,Sudan,andMorocco)-36-37
d)Sugar&SweetenersBusinesses(KSAandEgypt)-39-40
4-2)Al-AziziaPandaUnitedCompany(RetailSector–HypermarketsandSupermarkets)-42-45
4-3)SavolaPackagingCompany(PlasticSector–KSAandEgypt)-46-47
5.TheSavolaGroupNon-ManagedInvestments-48-51
6.HumanResources&InformationTechnologiesandCorporateCitizenshipPrograms-52-55
7.SavolaGroupCorporateSocialResponsibility(CSR)Programs-56-59
8.Governance&TransparencyReport(IncludingdisclosuresrelatedtomembersoftheBoardandtheirCommittees,&relatedpartytransactionsandtheirundertakingonCorporateGovernance-60-78
• ThanksandAppreciation-79
9.TheFinancialStatementsandtheExternalAuditorsReportfor2012-80-127
10.ContactNumbersandAddresses-129
ContentsThe Savola Group
Annual Report, 2012
The Savola GroupAnnualReport,2012
1.2012MajorFinancialIndicators
2.ExecutiveSummary
3.StatementoftheChairmanoftheBoardofDirectors
4.StatementoftheGroupManagingDirector

1
The Savola Group Annual Report, 2012
6
أهم مؤشرات عام 2012 م
Main sectors contributions in the
Group’s overall revenues/sales for 2012.
38.1% 1.6%
19.4%
36.6% 3.8% 0.5%
Food Oils
Sugar
Plastic
Pasta
Retail
Others
Shareholders’ Equity
Total Assets
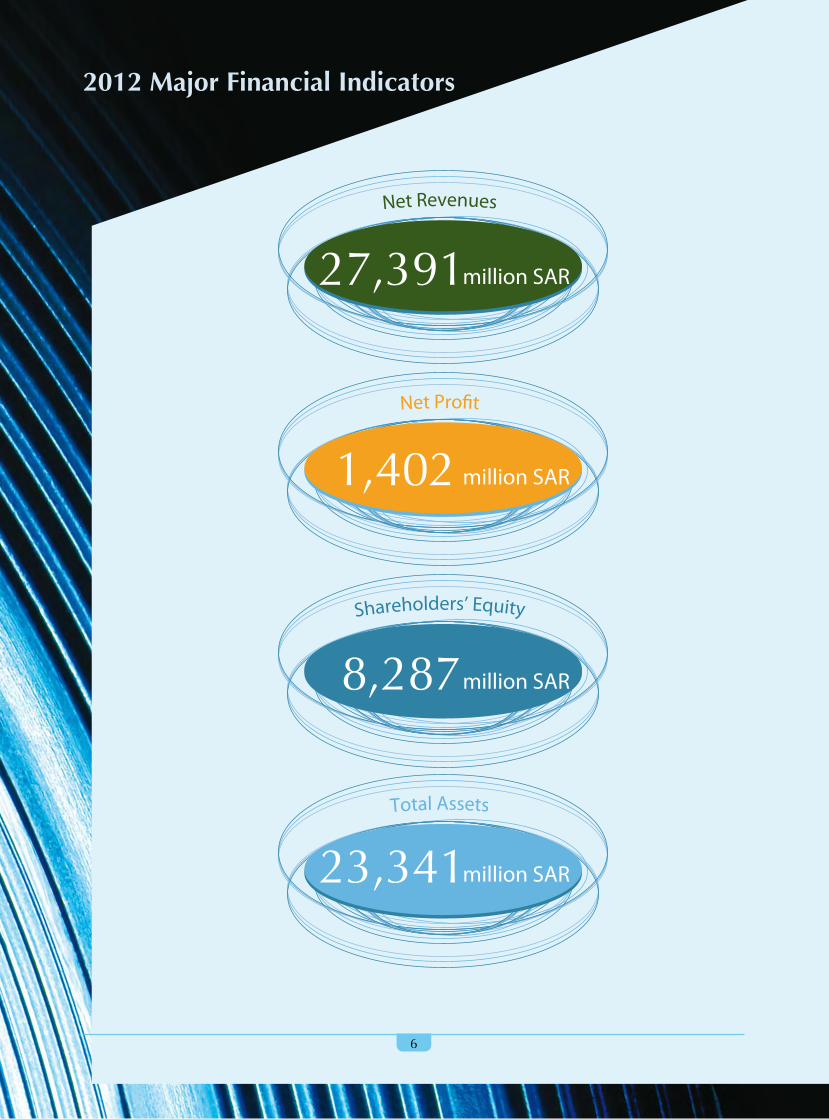
Net Revenues
Net Pro�t
1,402 million SAR
8,287million SAR
23,341 million SAR
27,391million SAR
27,39125,196
21,02917,917
13,821
1,2021,402
952202
887
Net Profit trend over five years ( 2008 - 2012 )
7,7228,287
6,9616,389
7,020
23,34120,101
20122011201020092008
20122011201020092008
20122011201020092008
20122011201020092008
17,78217,257
14,540
The Group’s Total Assets ( 2008 - 2012 ) ( in million SAR )
Shareholders’ Equity ( 2008 - 2012 ) ( in million SAR )
( in million SAR )
Revenues over five years ( 2008 - 2012 ) ( in million SAR )
2012 Major Financial Indicators
6

The Savola Group Annual Report, 2012
77
Main sectors contributions in the
Group’s overall revenues/sales for 2012.
38.1% 1.6%
19.4%
36.6% 3.8% 0.5%
Food Oils
Sugar
Plastic
Pasta
Retail
Others
Shareholders’ Equity
Total Assets
Net Revenues
Net Pro�t
1,402 million SAR
8,287million SAR
23,341 million SAR
27,391million SAR
27,39125,196
21,02917,917
13,821
1,2021,402
952202
887
Net Profit trend over five years ( 2008 - 2012 )
7,7228,287
6,9616,389
7,020
23,34120,101
20122011201020092008
20122011201020092008
20122011201020092008
20122011201020092008
17,78217,257
14,540
The Group’s Total Assets ( 2008 - 2012 ) ( in million SAR )
Shareholders’ Equity ( 2008 - 2012 ) ( in million SAR )
( in million SAR )
Revenues over five years ( 2008 - 2012 ) ( in million SAR )
7
Dear Respected Shareholders,
TheBoardof theSavolaGrouphas thehonor topresent theAnnualReport (theReport) for thefiscalyearended
December 31, 2012 for discussion and approval.This Report includes the Chairman’s andManagingDirector’s
statementsandasummaryoftheperformanceoftheGroupanditssubsidiariesacrossallbusinesssectors,locallyand
overseas.Inaddition,thisreportpresentstheGroup’sstrategicdirection,specificanalyses,performanceindicators
and2013financialprojections.ThisReportalsohighlightstheGroup’seffortsinCorporateSocialResponsibility(CSR);
CorporateGovernance(CG)application,HumanResourcesactivities,InformationTechnologyprogramsdeveloped
forthebenefitoftheemployeesandCSRprogramsadoptedbytheGroup.Further,theReportcontainsasummary
describing theGroup’s compliancewithCGdisclosures, andguidelines related to the formationof theBoardof
Directors, its remuneration, functions, structure, functionsof its sub-committees,SeniorExecutive’scompensation
andrelatedpartytransactionsinformation.ThereportalsoincludesdisclosurestatementsoftheBoardontheextent
ofthecompliancewiththeCorporateGovernanceregulationsissuedbytheSaudiCapitalMarketAuthority(CMA).
Finally, the conclusion includes a thankyounote to the Shareholders andEmployees across theGroup for their
support,effortandcontributiontowardstheexcellentperformancethatwasachievedbytheGroupduring2012.
ThisreporthasbeenpreparedinlinewiththerequirementsoftheCMAregulationsespeciallyArticle(43)ofCorporate
GovernanceandDisclosureStandards,ListingRulesArticle (9)and theCorporateGovernancecode. Inaddition,
regardhasbeengiventothelawsoftheMinistryofCommerceandIndustry(MOC&I)andotherregulations,andbest
internationalpracticesinthefieldofCorporateGovernanceandTransparency.
During2012, theGroupachieveda recordperformance in termsofnetprofit, revenuesandotherKPIs, thatare
detailedinthisreport.Moreover,theGroupBoardofDirectors,ExecutiveManagement,andwiththesupportofits
shareholdersandinvestorscontinueditseffortstoachieveoutstandingresultsinallitscoreoperatingactivities,while
monitoringcompliancewithapplicablelawsandregulations.
Finally,thisreportincludestheGroup’sAuditedFinancialStatements,theRelatedNotes,andtheAuditors'Reportfor
thefiscalyearendedDecember31,2012.
WehopethisreportwillreflecttheGroup’soverallperformanceandbusinessdevelopmentsduring2012,andwewill
bepleasedtoreceiveandansweryourquestionsrelatedtothecontentofthisreportduringtheGeneralShareholders
AssemblyMeetingscheduledonMarch16,2013.Wealsohopetoobtainyourratificationonthisreportduringthe
meeting,includingallfinancialandnon-financialinformation,strategicdirectionandagendadetailedherein.
Savola Group Board of Directors
February 2013
Executive Summary
8

BoardofDirectors
SittingLtoR:D
r.SamiM
ohsenBaroum
|Mr.SulaimanA.A
lMuhaidib.Chairm
an|H.E.Eng.A
bdullahM.R
ehaimi,ViceChairm
an|Dr.AbdulraoufM
oham
medM
annaa,GroupM
anagingDirector
StandingLtoR:M
r.Moham
medA
bdulqaderAlFadi|M
r.IbrahimM
oham
medA
lIssa|M
r.MousaO
mranAlOmran
|Mr.AbdulA
zizKh
aledA
lGhufaily|M
r.BadrA
bdullahAlIssa
|Dr.GhassanAhm
edAlSulaiman|Mr.AmmarAbdulW
ahedAlK
hudairy
The Savola Group Annual Report, 2012
10
In the Name of Allah, Most Compassionate, Most Merciful
Itgivesmegreatpleasure towelcomeallSavolashareholdersand investorsand to takeyou through theGroup’s2012AnnualReporthighlightingtheGroup’sperformanceandthedevelopmentofitsbusinessfortheyearendedDecember31,2012.IampleasedtosharewithyouthehistoricandunprecedentedresultsthatwereachievedbyourGroupduringtheyear2012withthegraceofAllahandwithyoursupport.TheGroupreportedSAR1.4billionnetprofitwhichisanincreaseof16.7%ascomparedtolastyearandanincreaseof12.5%over theannouncedprojectionsYouwillfindmoredetailsandanalysisontheGroup’sperformanceinthecontentsofthisannualreport.
AsaresultofthisrecordperformancebytheGroup,andincontinuationofitsdeclaredpolicytodistributequarterlycashdividendstoitsshareholders,theGroup’sBoardofDirectorsapprovedthedistributionofSAR250million,(i.e.SAR0.50pershare)asdividendsforthe4thquarterof2012.ThisbringsthetotalamountofcashdividendsdistributedtoSAR700million,representing50%ofthetotalnetprofitsachievedin2012.ThisrecommendationisincludedintheagendaoftheGeneralAssemblyforapprovalamongotheritems.
InaccordancewiththeGroup’spolicyofenhancingitsdisclosuresandtransparencywithitsshareholdersandinvestorsinthestockmarket,theGrouphasannounceditsfinancialprojectionsfortheyearending2013,wherebytheGroupisexpectedtoachieveSAR1.5billionnetprofit(beforecapitalgainsandexceptionalitems).Theforecastednetprofit(beforecapitalgainandexceptionalitems)forthe1stquarterof2013isexpectedtoreachSAR260million,Inshallah.TheGroupwillupdatethestockmarketwithregardstoprogressinachievingtheseprojectionsonaquarterlybasis.
InlinewiththeGroup’sstrategytodiversifyfinancingandliquiditysources,anExtraordinaryGeneralShareholdingAssembly,heldduring2012approvedthesetup,ofaShariahcompliantSukukprogrammewithavaluenotexceedingtheCompany’ssharecapitalofSAR5billion.WehavebeensuccessfulinJanuary2013inissuingthefirsttrancheoftheseSukukwithavalueofSAR1.5billion,achievinga260%oversubscription.
TheGroupcontinuedtheimplementationofitsstrategicplanswhichwereannouncedinitspreviousAnnualReport.ThisstipulatedthattheGroupwillcontinuetofocusonitscorebusinessesbygivingthemmoreindependenceandflexibilityinrunningtheirbusinessandcreatingtheirfuturestrategiesandplanswhichwillultimatelytransformtheSavolaGroupintoafinancialholdingcompany.TheBoardorganizedaseriesofworkshopsandmeetingsduring2012tocrystalizethestrategiesandtheambitiousplanstoreinforcethisstrategicdirectionandtosupporttheGroup’scompetitiveroleinthemarketsinwhichitoperates,takingintoconsiderationtheeconomicandpoliticalchangesthattheregioniswitnessingingeneralandinthemarketsinwhichSavolaoperatesinparticular.ThroughdoingthistheBoardofDirectorswillenhancetheperformanceofthesesectorswhilstallowingtheBoardtofocusonstrategicmattersand tocreatenewanddiverse investmentprojects thatwill addvalue to theGroupsexisting investmentportfolio.
Inconclusion,Iwouldliketotakethisopportunity,onbehalfofmycolleaguestheMembersoftheBoard,toexpressmydeepestappreciationandgratitudetoourwiseGovernmentanditsinstitutionsfortheircontinuoussupportoftheprivatesector.IwouldalsoliketothankourshareholdersandinvestorsfortheircontinuoussupportandtrustandequallywouldliketothanktheExecutiveTeamoftheGroupandstaffintheKingdomandoutsidefortheirsuperbeffortsandfortherecordresultsachievedbytheGroupduring2012andhopethattheseachievementswillcontinuein2013.IlookforwardtoseeingyouintheupcomingShareholders’GeneralAssemblyscheduledtotakeplaceonMarch16,2013Inshallahtoanswerallyourqueriesandanyrelatedquestionsregardingthisreport.
MayAllahtheAllMightygrantussuccess.
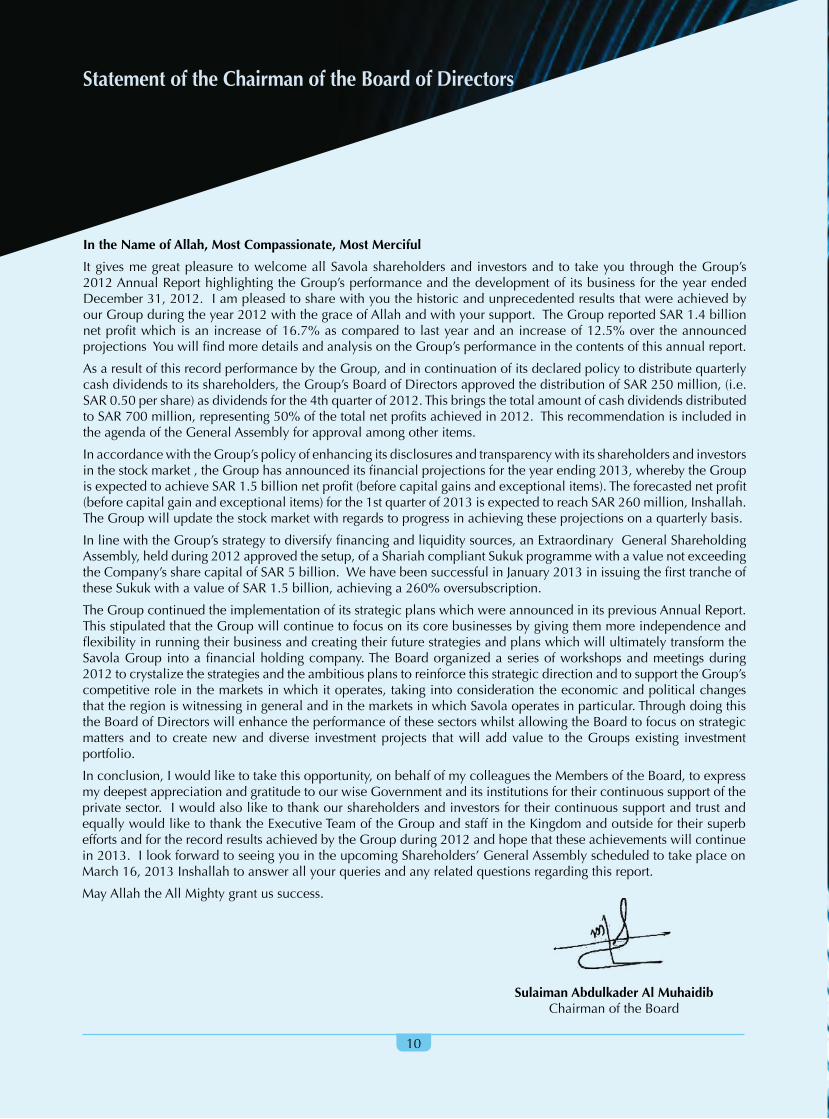
Sulaiman Abdulkader Al MuhaidibChairmanoftheBoard
10
Statement of the Chairman of the Board of Directors

The Savola Group Annual Report, 2012
11

The Savola Group Annual Report, 2012
12
Dr. Abdulraouf M. MannaaGroupManagingDirector
12
Distinguished Savola Group Shareholders,In the Name of Allah, Most Compassionate, Most MercifulIampleasedtowelcomeyou,toTheSavolaGroupAnnualReportfor2012,inwhichwealwaysfocusonmakingyoufamiliarwiththeGroup’sperformanceandprovidingthelatestupdatesacrossthevariousbusinessesandactivitiesinsideandoutsidetheKingdom.YourGroup,withtheGraceofAllah,wasabletoachieverecordresultsin2012.TheGroupreportedSAR1.4billionnetprofitwhichisanincreaseof16.7%ascomparedtolastyearandanincreaseof12.5%overtheannouncedprojectionsfor2012ofSAR1.32billion.Theincreaseinnetprofitsin2012comparedtothesameperiodlastyearisattributedtotheoutstandingandunprecedentedperformanceoftheGroup’sFoodsSectoroperationsoutsideKSAaswellasincreasedsalesacrossallsectorsofthegroup.In 2012, the SavolaGroup successfully acquired additional shares inAlmarai Company for SAR 2 billion increasing its totalshareholdinginthecompanyfrom29.95%to36.52%.ThisincreasereinforcestheGroup’sstrategytorealizegreatergrowthandexpansioninitsCoreinvestments,whichincludestheFoodSector,whileatthesametimereflectingtheGroup’sconfidenceintheleadershipofAlmaraiCompany.ThisreporthighlightstheFoodSectorscontinuousfocusandexpansionofitsoperationsinsideandoutsidetheKingdom,despitetheeconomicandpoliticalchallengesinthemarketsinwhichitoperates.TheSectorachievedoutstandingresultsinmostofitsbusiness-linesincludingedibleoils,ghee,pasta,andsugarbothlocallyandregionally.Pandasucceededinincreasingthenumberofitshypermarketsandsupermarketsto181outlets,ofwhich145areintheKingdomandtheremainingareoverseas.ThiswasachieveddespitethestrongcompetitionintheretailsectorintheKingdom.ThePlasticsSectorwasabletomaintainitsprofitability,increasingitssalesanddiversifyingitsproductbaseandsecuringnewlocalandregionalcustomers.Thiswasachieveddespitetheincreaseinthepriceofrawmaterialsandtheincreaseincompetitioninthemarketsinwhichitoperates.YouwillseemoredetailsontheperformanceofeachoftheCoresectorsandthenon-managedSavolainvestmentsinsidethisAnnualReport.Withregardstohumanresources,theGrouptakesprideinemploying5,500Saudinationalsamongstitsworkforceof13,500withintheKingdom,thisrepresentsa40%SaudisationlevelofitstotalworkforceintheKingdom.ThemajorityoftheexecutiveteamswithintheGroupcompriseofhighlyqualifiedSaudinationals.Inthiscontext,theGroupcontinuedimplementingitsstrategyofemployingSaudinationals.During2012,theGrouphired40SaudimanagementtraineesfreshoutofuniversityintheGroupanditsoperatingcompaniesintheKingdom.EffortswillcontinuetoaccommodatemoreSaudinationalsin2013aspartoftheGroup’sinitiativetodevelopmanagersandinjectanewbreedoffutureleaderswithintheGroupanditssubsidiaries.InthefieldofCorporateGovernanceandCorporateSocialResponsibility,moreeffortshavebeenmadetoservethecommunityby facilitating theemploymentofpeoplewithdisabilities through theGroup’sCenter forEmpowering peoplewithDisabilities(Makeen)aswellasotherSavolaprograms,named (SavolaBridges),whichwillbehighlighted later in this report. TheGroupcontinues its commitment to implement its CorporateGovernance practices and all relevant procedures and best practices toreinforcetheGroup’sTransparencyandDisclosure,andtherebycontributetopreservingshareholderrights.We thank theAlmightyAllah forwhathasbeenachieved in reportinga recordperformanceandresults in2012,ashasbeenhighlightedinthisreport,andtherebyprovidingyouwithacomprehensiveoverviewofthedevelopmentoftheGroup’sbusinessinordertohelpyoumakeyourinvestmentdecisionsandunderstandSavola’sbusinessandstrategicdirectionfor2013.We ask theAlmightyAllah to grant us success and, for us to achieve better results andoutstanding performance to fulfill theannounced2013financialprojectionsindicatedbytheChairmanoftheBoardinhisstatement,aspartoftheGroup’scommitmenttoachieveahigherreturnforourshareholders,serveournationaleconomy,andparticipateinthedevelopmentofthecommunity.ItgivesmepleasuretoexpressmyappreciationandgratitudetothewiseleadershipofthisnationforitscontinuoussupportofthebusinesssectorandtoourshareholdersandSukukholdersfortheirconfidenceandcontinuedsupportandallSavolaemployeesinsideandoutsidetheKingdomfortheirvaluedeffortswhichhavehelpedtoachievetheunprecedentedresultsthatwehavedetailedinthisreport.Thankyouallandbestregards,
Statement of the Group Managing Director
The Savola Group Annual Report, 2012
13
The Savola Group Annual Report, 2012
14
Exe
cutiv
eTe
amDr. Abdulraouf Mohammed Manna Group ManagingDirector
Mr. Abderrahim Maaraf ChiefExecutiveOfficerSavolaFoodsCompany
The Savola Group Annual Report, 2012
15
Mr. Mahmoud M. Abdul Ghaffar ChiefofCorporateAffairs&BoardSecretary
Eng. Azhar M. Kenji ChiefExecutiveOfficer-PlasitcSector
Mr. Gerard Lawlor ChiefFinancialOfficer(CFO)
Mr. Muwaffaq M. Jamal ChiefExecutiveOfficer-AziziaPandaUnitedCo.
The Savola Group Annual Report, 2012
16
The Directors Report:1) AgendaoftheShareholdersAnnualGeneralMeeting
2) DescriptionoftheMainActivitiesoftheCompany
3) PerformanceSummaryReviewandFinancialAnalysisfor2012andProjectionsfor2013
4) OperatingcompaniesPerformanceandResultsfor2012(BySectors)
5) TheSavolaGroupNon-ManagedInvestments
6) HumanResources&InformationTechnologiesandCorporateCitizenshipPrograms
7) SavolaGroupCorporateSocialResponsibility(CSR)Programs
8) Governance&TransparencyReport

The Savola Group Annual Report, 2012
17
2
The Savola Group Annual Report, 2012
18
1) Agenda of the Shareholders Annual General Meeting

The Savola Group Annual Report, 2012
19
1) Agenda of the Shareholders Annual General Meeting AspartofthisAnnualDirector’sReport,thefollowingtableshowstheAgendaoftheShareholdersAssemblyMeetingfor2012whichwillbeheldonSaturday16thofMarch,2013:
1)Discussionandapprovalof theFinal (Audited)AccountsandAuditors’Report for thefiscalyearendedDecember31,2012.
2)Discussionandapprovalof theBoardofDirectors’AnnualReport for theyearendedDecember31,2012.
3)
ApprovaloftheBoardofDirectors’recommendationtodistributecashdividendsforthefourthquarteroftheyear2012amountingtoSAR250million(SAR0.50pershare-whichisequalto5%oftheCompany’snominalsharecapital), inadditiontotheratificationofthetotaldividendsalreadydistributedtotheshareholdersforthefirstthreequartersoftheyear2012amountingtoSAR450million(SAR0.90pershare,whichisequalto9%oftheCompany’snominalsharecapital).Thus,thetotaldividendpersharefortheyear2012willequalto(SAR1.40pershare),raisingthetotaldividendsalreadypaidandtobepaidtoSAR700million,whichisequalto14%oftheCompany’snominalsharecapital.Thematuritydateforthefourth-quarter2012cashdividendswillbedistributedtoshareholdersregisteredintheCompanybooksatthecloseoftradingonthedateoftheGeneralAssemblyMeetingonMarch16,2013.ThedateofdistributionwillbeannouncedaftersecuringtheapprovaloftheshareholdersattheGeneralAssemblyMeeting.
4)AbsolvetheBoardofDirectorsfromanyliabilitypertainingtothemanagementoftheCompanyfortheyearendedDecember31,2012.
5)Approve to pay the Board ofDirectors Remuneration for the FiscalYear 2012 in theamountofSAR2.2million(i.eSAR200,000foreachDirector).
6)Approvetherecommendationof theAuditCommitteetoappointtheGroup’sexternalauditor,andspecifyingtheirfees,forauditingtheGroup’squarterlyandfinalaccountsfortheyearendedDecember31,2013.
7)
Ratificationofrelatedpartiestransactionsandcontractsthatwereexecutedwithrelatedpartiesduring2012andrenewthemfor thecomingyear,asoutlined in theBoardofDirectors’AnnualReportfor2012(seeitem(i)pageNo.73)andalsoaspublishedontheTadawulwebsite.
8)
Approvaltoamenditem(K)ofArticle(3)(TheCompany'sObjectives)inthecompany’sarticlesofassociation,byaddingtheword“sell”tobereadasfollows:
“To purchase& sell land, real estate and factories required for the realization of theCompany'sobjectives.”
9)ElecttheBoardofDirectorsforthenewofficeterm,tocommencefromJuly1,2013,foraperiodofthreeyears,asperthenomineeslistapprovedbytheMinistryofCommerce&Industry.

The Savola Group Annual Report, 2012
20
2) Description of the Main Activities of the Company
The Savola Group Annual Report, 2012
21
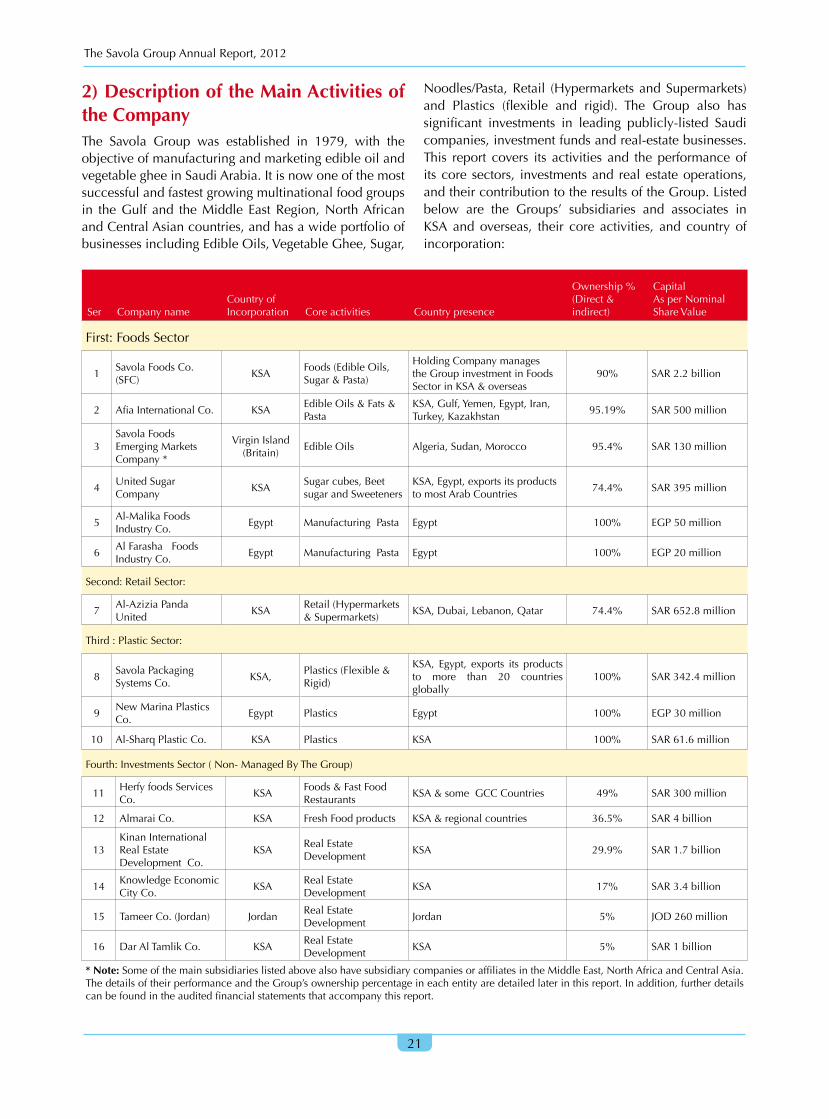
2) Description of the Main Activities of the CompanyThe Savola Group was established in 1979, with theobjectiveofmanufacturingandmarketingedibleoilandvegetablegheeinSaudiArabia.Itisnowoneofthemostsuccessfulandfastestgrowingmultinationalfoodgroupsin theGulf and theMiddle EastRegion,NorthAfricanandCentralAsiancountries,andhasawideportfolioofbusinessesincludingEdibleOils,VegetableGhee,Sugar,
Noodles/Pasta,Retail (HypermarketsandSupermarkets)and Plastics (flexible and rigid). The Group also hassignificant investments in leading publicly-listed Saudicompanies,investmentfundsandreal-estatebusinesses.This report covers its activities and theperformanceofitscore sectors, investmentsand realestateoperations,andtheircontributiontotheresultsoftheGroup.Listedbelow are the Groups’ subsidiaries and associates inKSA andoverseas, their core activities, and country ofincorporation:
Ser CompanynameCountryofIncorporation Coreactivities Countrypresence
Ownership%(Direct&indirect)
CapitalAsperNominalShareValue
First:FoodsSector
1SavolaFoodsCo.(SFC)
KSAFoods(EdibleOils,Sugar&Pasta)
HoldingCompanymanagestheGroupinvestmentinFoodsSectorinKSA&overseas
90% SAR2.2billion
2 AfiaInternationalCo. KSAEdibleOils&Fats&Pasta
KSA,Gulf,Yemen,Egypt,Iran,Turkey,Kazakhstan
95.19% SAR500million
3SavolaFoodsEmergingMarketsCompany*
VirginIsland(Britain)
EdibleOils Algeria,Sudan,Morocco 95.4% SAR130million
4UnitedSugarCompany
KSASugarcubes,BeetsugarandSweeteners
KSA,Egypt,exportsitsproductstomostArabCountries
74.4% SAR395million
5Al-MalikaFoodsIndustryCo.
Egypt ManufacturingPasta Egypt 100% EGP50million
6AlFarashaFoodsIndustryCo.
Egypt ManufacturingPasta Egypt 100% EGP20million
Second:RetailSector:
7Al-AziziaPandaUnited
KSARetail(Hypermarkets&Supermarkets)
KSA,Dubai,Lebanon,Qatar 74.4% SAR652.8million
Third:PlasticSector:
8SavolaPackagingSystemsCo.
KSA,Plastics(Flexible&Rigid)
KSA, Egypt, exports its productsto more than 20 countriesglobally
100% SAR342.4million
9NewMarinaPlasticsCo.
Egypt Plastics Egypt 100% EGP30million
10 Al-SharqPlasticCo. KSA Plastics KSA 100% SAR61.6million
Fourth:InvestmentsSector(Non-ManagedByTheGroup)
11HerfyfoodsServicesCo.
KSAFoods&FastFoodRestaurants
KSA&someGCCCountries 49% SAR300million
12 AlmaraiCo. KSA FreshFoodproducts KSA®ionalcountries 36.5% SAR4billion
13KinanInternationalRealEstateDevelopmentCo.
KSARealEstateDevelopment
KSA 29.9% SAR1.7billion
14KnowledgeEconomicCityCo.
KSARealEstateDevelopment
KSA 17% SAR3.4billion
15 TameerCo.(Jordan) JordanRealEstateDevelopment
Jordan 5% JOD260million
16 DarAlTamlikCo. KSARealEstateDevelopment
KSA 5% SAR1billion
* Note:SomeofthemainsubsidiarieslistedabovealsohavesubsidiarycompaniesoraffiliatesintheMiddleEast,NorthAfricaandCentralAsia.ThedetailsoftheirperformanceandtheGroup’sownershippercentageineachentityaredetailedlaterinthisreport.Inaddition,furtherdetailscanbefoundintheauditedfinancialstatementsthataccompanythisreport.

The Savola Group Annual Report, 2012
22
3) Performance Summary Review and Financial Analysis for 2012 and Projections for 2013
The Savola Group Annual Report, 2012
23
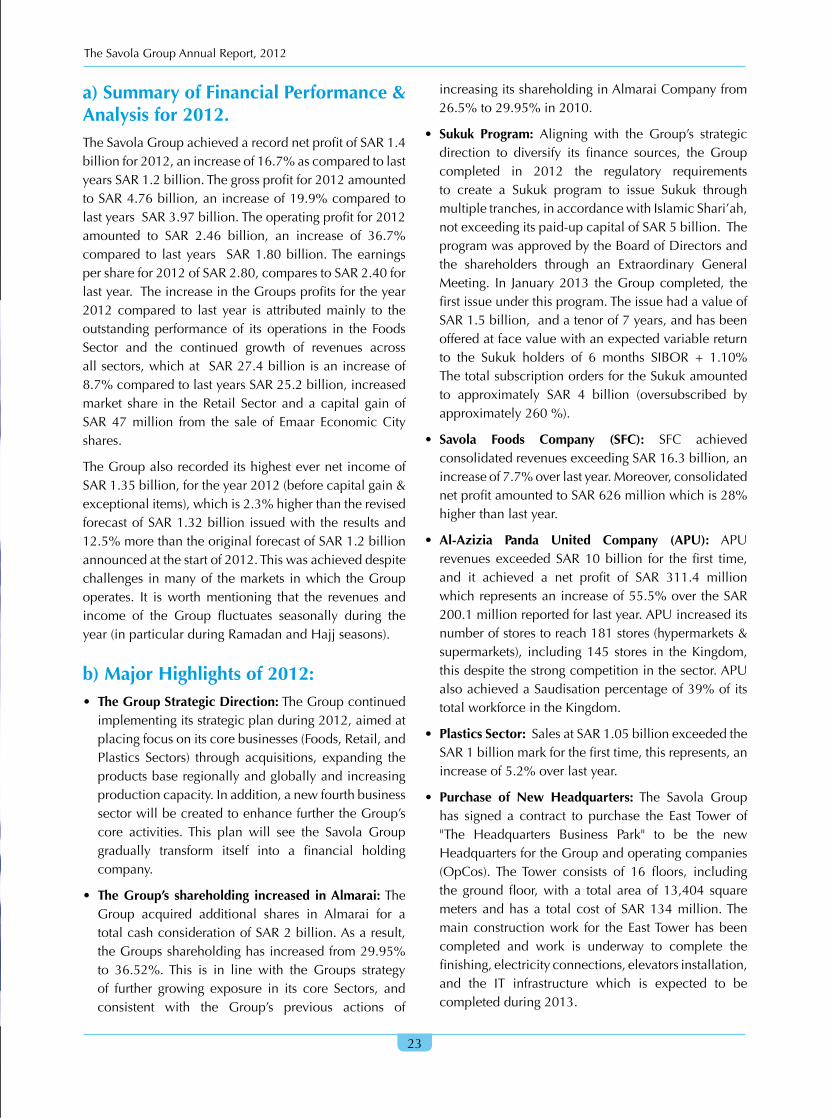
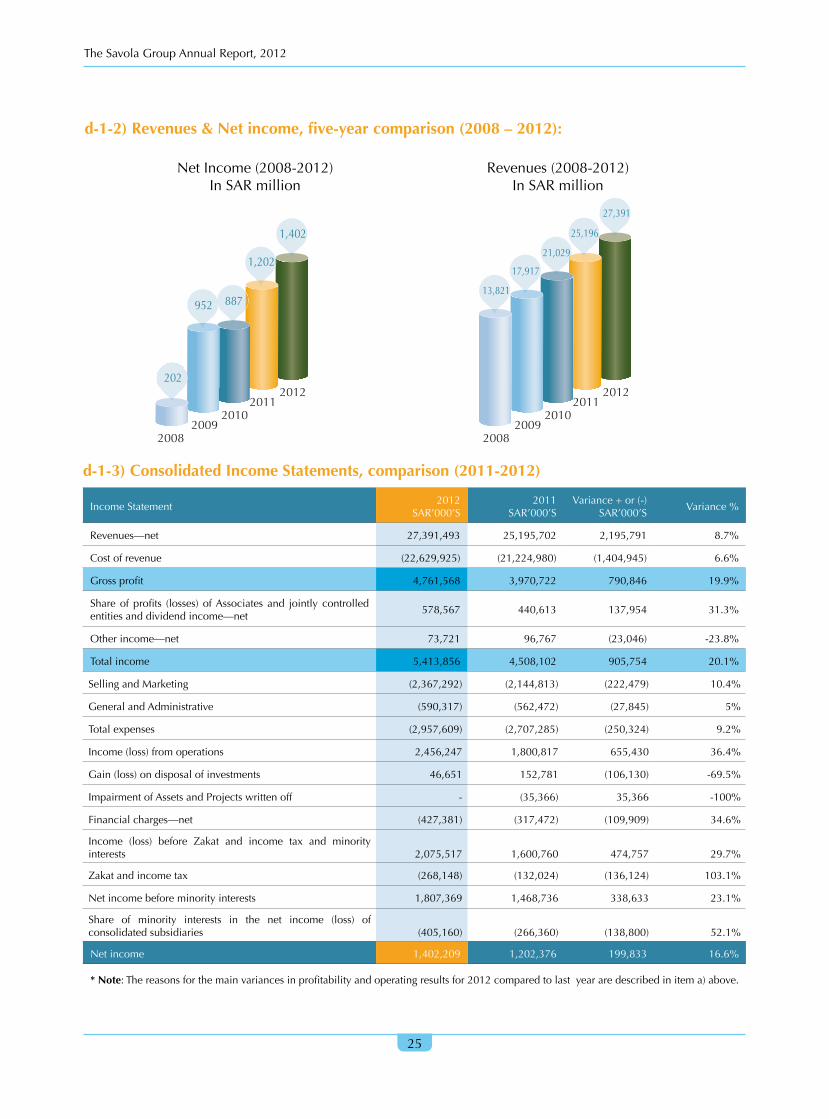
a) Summary of Financial Performance & Analysis for 2012.TheSavolaGroupachievedarecordnetprofitofSAR1.4billionfor2012,anincreaseof16.7%ascomparedtolastyearsSAR1.2billion.Thegrossprofitfor2012amountedtoSAR4.76billion,anincreaseof19.9%comparedtolastyearsSAR3.97billion.Theoperatingprofitfor2012amounted to SAR 2.46 billion, an increase of 36.7%compared to lastyears SAR1.80billion.Theearningspersharefor2012ofSAR2.80,comparestoSAR2.40forlastyear.TheincreaseintheGroupsprofitsfortheyear2012 compared to last year is attributedmainly to theoutstandingperformanceof its operations in the FoodsSector and the continued growth of revenues acrossallsectors,whichatSAR27.4billionisanincreaseof8.7%comparedtolastyearsSAR25.2billion,increasedmarket share in theRetail Sector anda capital gainofSAR 47million from the sale of Emaar EconomicCityshares.
TheGroupalsorecordeditshighestevernetincomeofSAR1.35billion,fortheyear2012(beforecapitalgain&exceptionalitems),whichis2.3%higherthantherevisedforecastofSAR1.32billionissuedwith theresultsand12.5%morethantheoriginalforecastofSAR1.2billionannouncedatthestartof2012.Thiswasachieveddespitechallenges inmanyof themarkets inwhich theGroupoperates. It isworthmentioning that the revenues andincome of the Group fluctuates seasonally during theyear(inparticularduringRamadanandHajjseasons).
b) Major Highlights of 2012:• The Group Strategic Direction:TheGroupcontinued
implementingitsstrategicplanduring2012,aimedatplacingfocusonitscorebusinesses(Foods,Retail,andPlastics Sectors) through acquisitions, expanding theproductsbaseregionallyandgloballyandincreasingproductioncapacity.Inaddition,anewfourthbusinesssectorwillbecreatedtoenhancefurthertheGroup’score activities.This plan will see the Savola Groupgradually transform itself into a financial holdingcompany.
• The Group’s shareholding increased in Almarai:TheGroup acquired additional shares in Almarai for atotalcashconsiderationofSAR2billion.Asaresult,theGroupsshareholdinghasincreasedfrom29.95%to 36.52%.This is in line with the Groups strategyof further growing exposure in its core Sectors, andconsistent with the Group’s previous actions of
increasingitsshareholdinginAlmaraiCompanyfrom26.5%to29.95%in2010.
• Sukuk Program: Aligning with the Group’s strategicdirection to diversify its finance sources, the Groupcompleted in 2012 the regulatory requirementsto create a Sukuk program to issue Sukuk throughmultipletranches,inaccordancewithIslamicShari’ah,notexceedingitspaid-upcapitalofSAR5billion.TheprogramwasapprovedbytheBoardofDirectorsandthe shareholders through an Extraordinary GeneralMeeting. In January2013 theGroupcompleted, thefirstissueunderthisprogram.TheissuehadavalueofSAR1.5billion,andatenorof7years,andhasbeenofferedatfacevaluewithanexpectedvariablereturnto the Sukuk holders of 6 months SIBOR + 1.10%ThetotalsubscriptionordersfortheSukukamountedto approximately SAR 4 billion (oversubscribed byapproximately260%).
• Savola Foods Company (SFC): SFC achievedconsolidatedrevenuesexceedingSAR16.3billion,anincreaseof7.7%overlastyear.Moreover,consolidatednetprofitamountedtoSAR626millionwhichis28%higherthanlastyear.
• Al-Azizia Panda United Company (APU): APUrevenues exceeded SAR10billion for thefirst time,and it achieved a net profit of SAR 311.4 millionwhichrepresentsanincreaseof55.5%overtheSAR200.1millionreportedforlastyear.APUincreaseditsnumberofstorestoreach181stores(hypermarkets&supermarkets), including145 stores in theKingdom,thisdespitethestrongcompetitioninthesector.APUalsoachievedaSaudisationpercentageof39%ofitstotalworkforceintheKingdom.
• Plastics Sector:SalesatSAR1.05billionexceededtheSAR1billionmarkforthefirsttime,thisrepresents,anincreaseof5.2%overlastyear.
• Purchase of New Headquarters: The Savola Grouphas signed a contract to purchase the EastTower of"The Headquarters Business Park" to be the newHeadquartersfortheGroupandoperatingcompanies(OpCos).TheTower consists of 16 floors, includingthe groundfloor,with a total areaof 13,404 squaremeters andhasa total costof SAR134million.Themainconstructionwork for theEastTowerhasbeencompleted and work is underway to complete thefinishing,electricityconnections,elevatorsinstallation,and the IT infrastructure which is expected to becompletedduring2013.

The Savola Group Annual Report, 2012
24
IncomeStatement2012
SAR’000’S2011
SAR’000’S2010
SAR’000’S2009
SAR’000’S2008
SAR’000’S
Revenues—net 27,391,493 25,195,702 21,029,472 17,917,202 13,821,377
Costofsales (22,629,925) (21,224,980) (17,614,233) (14,809,887) (12,007,054)
Grossprofit 4,761,568 3,970,722 3,415,239 3,107,315 1,814,323
Shareofprofits(losses)ofAssociatesandjointlycontrolledentitiesanddividendincome—net 578,567 440,613 459,522 352,799 335,174
Otherincome—net 73,721 96,767 97,340 79,877 110,526
Totalincome 5,413,856 4,508,102 3,972,101 3,539,991 2,260,023
SellingandMarketing (2,367,292) (2,144,813) (1,870,153) (1,533,574) (1,123,033)
GeneralandAdministrative (590,317) (562,472) (603,138) (628,783) (465,491)
Totalexpenses (2,957,609) (2,707,285) (2,473,291) (2,162,357) (1,588,524)
Income(loss)fromOperations 2,456,247 1,800,817 1,498,810 1,377,634 671,499
Gain(loss)onDisposalofInvestments 46,651 152,781 195,055 318,116 147,980
ImpairmentofAssetsandProjectsWritten-off - (35,366) (283,716) (221,596) (442,406)
Financialcharges—net (427,381) (317,472) (244,260) (227,337) (153,658)
Income(loss)beforeZakatandincometaxandminorityinterests 2,075,517 1,600,760 1,165,889 1,246,817 223,415
Zakatandincometax (268,148) (132,024) (140,146) (63,323) (53,387)
Net income before Zakat, income tax andminorityinterests
1,807,369 1,468,736 1,025,743 1,183,494 170,028
Share ofminority interests in the net income(loss)ofconsolidatedsubsidiaries
(405,160) (266,360) (139,041) (231,929) 32,330
Netincome 1,402,209 1,202,376 886,702 951,565 202,358
• Corporate Governance and Social Responsibility: During 2012 The Group continued its efforts inCorporate Social Responsibility (Savola Bridges) bycontributing to the development of the communitythrough its major initiative Makeen Center fortraining and employingpeoplewithdisabilities andother CSR bridges. The Group’s efforts to enhanceCorporate Governance under its initiative (SavolaPledges)continuedbyadoptingandcomplyingwithSaudiCapitalMarket (CMA) regulations,MinistryofCommerceandIndustrylawsandotherinternationalbestpractices in theareaofCorporateGovernance.The main objectives of the Group in enhancingCorporate Governance is to protect Shareholdersrights, to fulfill the roles and responsibilities of theBoard of Directors and its sub-committees and tofurtherenhanceDisclosuresandTransparencythrougheffectivecorporatecommunicationchannelssuchasTadawul,Savolaandsubsidiarieswebsites,andothermediachannels.
c) Forecast for 2013:TheGroup expects to achieve SAR1.5 billion (beforecapitalgainandexceptionalitems)bytheendof2013,andtheforecastednetincome(beforecapitalgainandexceptionalitems)forthe1stquarterof2013isexpectedtoreachSAR260million,Inshallah.
d) Overall Financial Performance Review & Comparison for 2012: ThefollowingisatablewhichpresentstheGroup’soverallfinancialperformanceandeachsectors’contributiontotheoverallresultsfor2012.
d-1) Overall Financial Performance Review for 2012:
d-1-1) Consolidated Income Statement, five-year comparison (2008-2012):
The Savola Group Annual Report, 2012
25
IncomeStatement2012
SAR’000’S2011
SAR’000’SVariance+or(-)
SAR’000’SVariance%
Revenues—net 27,391,493 25,195,702 2,195,791 8.7%
Costofrevenue (22,629,925) (21,224,980) (1,404,945) 6.6%
Grossprofit 4,761,568 3,970,722 790,846 19.9%
Shareofprofits (losses) ofAssociates and jointly controlledentitiesanddividendincome—net
578,567 440,613 137,954 31.3%
Otherincome—net 73,721 96,767 (23,046) -23.8%
Totalincome 5,413,856 4,508,102 905,754 20.1%
SellingandMarketing (2,367,292) (2,144,813) (222,479) 10.4%
GeneralandAdministrative (590,317) (562,472) (27,845) 5%
Totalexpenses (2,957,609) (2,707,285) (250,324) 9.2%
Income(loss)fromoperations 2,456,247 1,800,817 655,430 36.4%
Gain(loss)ondisposalofinvestments 46,651 152,781 (106,130) -69.5%
ImpairmentofAssetsandProjectswrittenoff - (35,366) 35,366 -100%
Financialcharges—net (427,381) (317,472) (109,909) 34.6%
Income (loss) before Zakat and income tax and minorityinterests 2,075,517 1,600,760 474,757 29.7%
Zakatandincometax (268,148) (132,024) (136,124) 103.1%
Netincomebeforeminorityinterests 1,807,369 1,468,736 338,633 23.1%
Share of minority interests in the net income (loss) ofconsolidatedsubsidiaries (405,160) (266,360) (138,800) 52.1%
Netincome 1,402,209 1,202,376 199,833 16.6%
* Note:Thereasonsforthemainvariancesinprofitabilityandoperatingresultsfor2012comparedtolastyeararedescribedinitema)above.
d-1-3) Consolidated Income Statements, comparison (2011-2012)
d-1-2) Revenues & Net income, five-year comparison (2008 – 2012):
Revenues(2008-2012)InSARmillion
NetIncome(2008-2012)InSARmillion
20082009
20102011
2012
13,821
17,917
21,029
25,196
27,391
20082009
20102011
2012202
1,202
952 887
1,402

The Savola Group Annual Report, 2012
26
ByCountry ByProducts/Brands 2012 2011
EdibleOil&VegetableGheeSales SAR’000’S SAR’000’S
KSA,Gulf&YemenAfia,Al-Arabi,Olite,Almaida, Shams, SunGlow,Dalal,CanolaAfia
2,444,083 2,524,929
Egypt Rawabi,Afia,Ganna,Slite,Helwa 1,111,564 1,049,533
Iran Ladan,Aftab,Bahar,Afia 4,404,416 3,361,119
Kazakhstan Lito,Khazayoushka 174,013 210,684
Sudan AlTaeb,Sabah,Sudani 615,351 550,968
Morocco Afia,Hala, 279,877 279,316
Turkey YudumandSirma 887,353 813,698
Algeria Afia,Olyour 661,544 524,022
IntercompanySalesElimination (13,524) (2,328)
TotalofEdibleOilSales(1) 10,564,677 9,311,941
PastaProductsSales:
TotalofPastaProductsSales(2) Malika,Macaronto,Italiano *449,100 50,616
SugarSales:
-KSA,GCCandYemen AlOsra,Ziadah,Safaa,Nehar,Halla,Sweeva 3,766,872 4,082,008
-Egypt(USCE) AlOsra 1,608,033 1,779,353
TotalofSugarProductsSales(3) 5,374,905 5,861,361
RetailSales(PandaStores)
-KSA HyperPanda&SupermarketPanda(APU) 9,519,050 8,574,156
-UnitedArabEmirates/Dubai HyperPanda 309,553 310,700
-LebanonRepublic Supermarket 327,919 296,695
TotalofRetailSales(4) 10,156,522 9,181,551
PlasticsDivisionSales
-KSA-Jeddah&RiyadhFactoriesTheplasticsdivisionmanufacturesawidevarietyofproductsasrequestedbyclients
933,665 872,181
-Egypt(NewMarina)Theplasticsdivisionmanufacturesawidevarietyofproductsasrequestedbyclients
126,082 131,942
IntercompanySales (6,564) (2,590)
TotalofPlasticSales(5) 1,053,183 1,001,533
Others
-RealEstate-KSA 138,535 122,815
TotalofOtheractivities(6) 138,535 122,815
TotalRevenues 27,736,922 25,529,817
IntercompanySales (345,429) (334,115)
TotalRevenues/Sales 27,391,493 25,195,702
*Note:Thereasonforthelargeincreaseinpastasalesin2012comparedto2011isthatpastasalesfor2012representtheresultofthewholeyear,whereassalesfor2011representapartofthatyearasthePastabusinesswasaquiredduringthefourthquarterof2011.
d-1-4) Geographical analysis of revenues/sales of The Group and its subsidiaries by product family/brand for 2012 compared to last year:

The Savola Group Annual Report, 2012
27
BalanceSheet2012
SAR’000’S2011
SAR’000’S2010
SAR’000’S2009
SAR’000’S2008
SAR’000’S
Currentassets(A) 8,544,892 7,773,813 5,910,643 5,633,507 4,764,430
Currentliabilities(B) 9,302,929 7,740,279 6,724,128 6,313,432 6,001,606
WorkingcapitalC=(A-B) (758,037) 33,534 (813,485) (679,925) (1,237,176)
Currentassets 8,544,892 7,773,813 5,910,643 5,633,507 4,764,430
Othernon-currentassets 9,016,692 6,943,133 7,132,076 6,086,256 5,525,059
Property,plantandequipment(fixedassets) 5,779,951 5,384,430 4,739,217 5,536,761 4,250,663
Totalassets 23,341,535 20,101,376 17,781,936 17,256,524 14,540,152
Currentliabilities 9,302,929 7,740,279 6,724,128 6,313,432 6,001,606
Long-termloans 3,612,246 2,821,494 2,394,807 1,996,202 1,117,136
Otherliabilities 544,308 468,786 448,133 418,979 284,730
Totalliabilities 13,459,483 11,030,559 9,567,068 8,728,613 7,403,472
Paid-upcapital 5,000,000 5,000,000 5,000,000 5,000,000 5,000,000
Retainedearningsandreserves 3,286,670 2,722,467 2,020,037 1,960,628 1,389,165
Shareholders'equity 8,286,670 7,722,467 7,020,037 6,960,628 6,389,165
Minorityinterests 1,595,382 1,348,350 1,194,831 1,567,283 747,515
Totalliabilitiesandshareholders'equity
23,341,535 20,101,376 17,781,936 17,256,524 14,540,152
d-1-5) Sector contribution by percentage to the Group’s overall revenues/sales for 2012
d-1-6) Consolidated Balance Sheets, five-year comparison (2008-2012):
EdibleOils 38.1%
Sugar 19.4%
Plastic 3.8%
Pasta 1.6%
Retails 36.6%
Others 0.5%

The Savola Group Annual Report, 2012
28
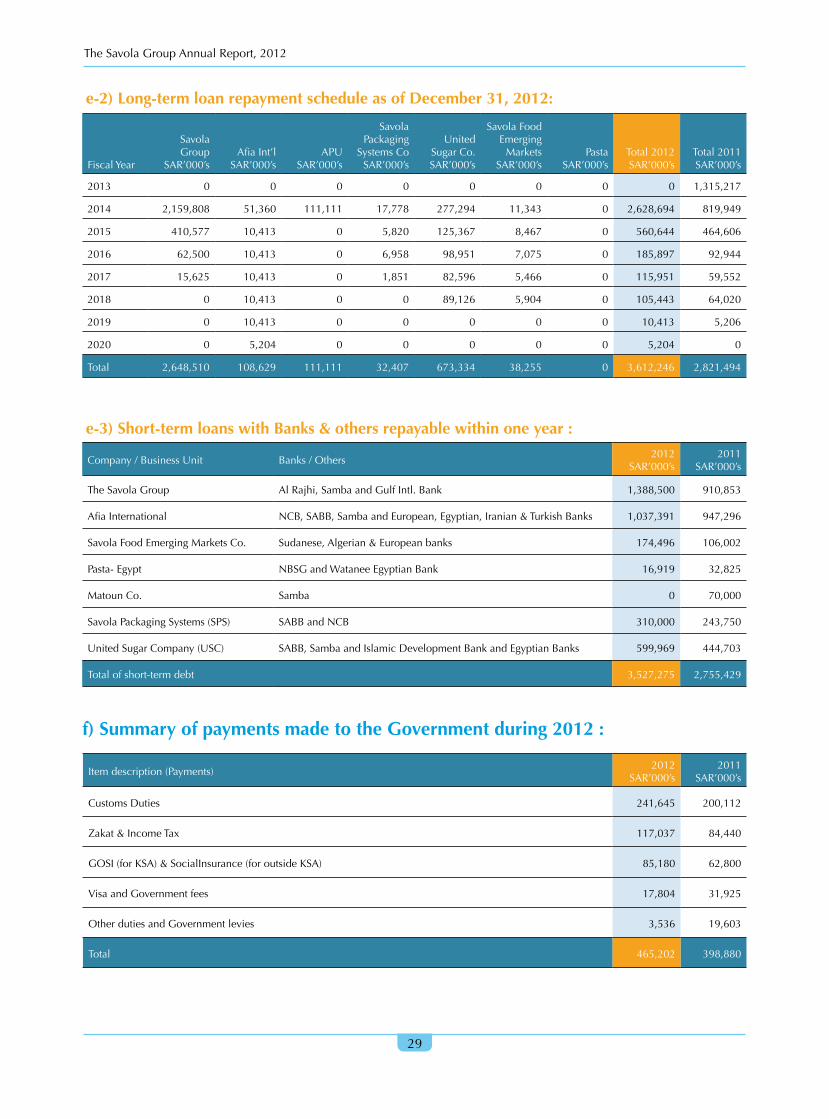
e) Details of long and short-term loans of the Group and its Subsidiaries and payments made to Government Agencies:TheGroup’spolicyhasalwaysbeentoadoptIslamicShari’ahcompliantprocessesinallitsfinancialtransactions.AllloansanddepositswithintheKingdomarefullyShari’ahcompliant.Thefollowingarethedetailsoflongandshort-termloansoutstandingasofDecember31,2012.
e-1) Long-term Loans, as at December 31, 2012
d-1-7) Shareholders’ Equity and Total Assets (as per the previous table):
TheGroup’sTotalAssetsChangesFortheYears2008to2012
(inSARmillions)
Shareholders’equityChangesFortheYears2008to2012
(inSARmillions)
Company/BusinessUnit Banks/Others2012
SAR’000’s2011
SAR’000’s
SaudiIndustrialDevelopmentFund(SIDF):
SavolaPackagingSystemsCo. SaudiIndustrialDevelopmentFund 19,689 23,829
TotalSIDF(A) 19,689 23,829
Commercialbanks
TheSavolaGroup Samba,SaudiFransiBank,SaudiInvestmentBankandAlJazirahBank 3,112,693 1,831,250
AlAziziaPandaUnitedCo. NCB,SABB 262,222 370,000
AfiaInternationalCo. NCB,Samba,HSBCinTurkey 198,101 337,187
SavolaFoodsEmergingMarketsCo.
AlgerianandSociétéGénérale,FrenchBank 38,255 30,764
UnitedSugarCo.SABB,Samba,CommercialIntl.BankofEgypt,StandardCharteredBankEgypt.
836,682 813,598
Pasta HSBC,NationalBank,NBSG,SociétéGénérale,NCB - 10,969
SavolaPackagingSystemsCo. SABB,Samba 55,556 60,000
TotalCommercialBanks(B) 4,503,509 3,453,768
Totallong-termdebt(A+B) 4,523,198 3,477,597
Lesscurrentportion:
SIDF (5,060) (4,140)
Commercialbanks (905,892) (651,963)
Long-termdebt 3,612,246 2,821,494
20082009
20102011
2012
6,389
6,961
7,020
7,722
8,287
20082009
20102011
2012
14,450
17,257
17,782
20,101
23,341
The Savola Group Annual Report, 2012
29
e-2) Long-term loan repayment schedule as of December 31, 2012:
e-3) Short-term loans with Banks & others repayable within one year :
f) Summary of payments made to the Government during 2012 :
FiscalYear
SavolaGroup
SAR’000’sAfiaInt’l
SAR’000’sAPU
SAR’000’s
SavolaPackaging
SystemsCoSAR’000’s
UnitedSugarCo.SAR’000’s
SavolaFoodEmergingMarkets
SAR’000’sPasta
SAR’000’sTotal2012SAR’000’s
Total2011SAR’000’s
2013 0 0 0 0 0 0 0 0 1,315,217
2014 2,159,808 51,360 111,111 17,778 277,294 11,343 0 2,628,694 819,949
2015 410,577 10,413 0 5,820 125,367 8,467 0 560,644 464,606
2016 62,500 10,413 0 6,958 98,951 7,075 0 185,897 92,944
2017 15,625 10,413 0 1,851 82,596 5,466 0 115,951 59,552
2018 0 10,413 0 0 89,126 5,904 0 105,443 64,020
2019 0 10,413 0 0 0 0 0 10,413 5,206
2020 0 5,204 0 0 0 0 0 5,204 0
Total 2,648,510 108,629 111,111 32,407 673,334 38,255 0 3,612,246 2,821,494
Company/BusinessUnit Banks/Others2012
SAR’000’s2011
SAR’000’s
TheSavolaGroup AlRajhi,SambaandGulfIntl.Bank 1,388,500 910,853
AfiaInternational NCB,SABB,SambaandEuropean,Egyptian,Iranian&TurkishBanks 1,037,391 947,296
SavolaFoodEmergingMarketsCo. Sudanese,Algerian&Europeanbanks 174,496 106,002
Pasta-Egypt NBSGandWataneeEgyptianBank 16,919 32,825
MatounCo. Samba 0 70,000
SavolaPackagingSystems(SPS) SABBandNCB 310,000 243,750
UnitedSugarCompany(USC) SABB,SambaandIslamicDevelopmentBankandEgyptianBanks 599,969 444,703
Totalofshort-termdebt 3,527,275 2,755,429
Itemdescription(Payments)2012
SAR’000’s2011
SAR’000’s
CustomsDuties 241,645 200,112
Zakat&IncomeTax 117,037 84,440
GOSI(forKSA)&SocialInsurance(foroutsideKSA) 85,180 62,800
VisaandGovernmentfees 17,804 31,925
OtherdutiesandGovernmentlevies 3,536 19,603
Total 465,202 398,880
The Savola Group Annual Report, 2012
30
BelowisadetailedreportontheperformanceoftheSGkeysegmentsandOperatingCompaniesbothinsideandoutsideSaudiArabia
4) Operating companies Performance and Results for 2012 (By Sectors)

The Savola Group Annual Report, 2012
31
4-1) Foods Sector Savola Foods Company:
During 2012, SFC started the process of conversion
fromalimitedliabilitycompanytoaclosedjointstock
company;thelegalprocessisexpectedtobecompleted
during2013.
TheFoodsSector is theflagshipoperatingsectorof the
Savola Group. Operating under the umbrella of the
Savola FoodsCompany (SFC), SFCowns andmanages
subsidiarieswithproductionfacilitiesacross8countries
covering the North African, Middle Eastern and the
Central Asian regions. SFC owns top brands in high
quality edible oil, ghee and sugar products marketed
across30countriesglobally,withmarket leadership in
mostofthecountriesinwhichitoperates.
a) SFC Consolidated Results
TheCompanyreportedconsolidatedrevenuesinexcess
of SAR 16.3 billion, representing a 7.7% growth over
lastyear.Net IncomereachedSAR626million,which
is 28% above the SAR 489million reported last year.
Amidsttoughmarketconditions,coupledwithregional
politicalunrest,devaluationof localcurrenciesagainst
theUS dollar and the inability to pass on high global
commodityprices,thesectorperformedreasonablywell
inallmaturemarketsaswellaswitnessingaturnaround
insomeofitsemergingmarkets.
Savola Foods Company achieved consolidated sales exceedingSAR 16.3 billion and recorded a net profit of SAR 626 million in 2012, this
was an increase of 28% over the previous year
TheEdibleOilsfactoryinSaudiArabia,Jeddah

The Savola Group Annual Report, 2012
32
Total production capacityfor Edible Oils factory reached
More Than 2.1 Million Tons Per Year
The Savola Group Annual Report, 2012
33
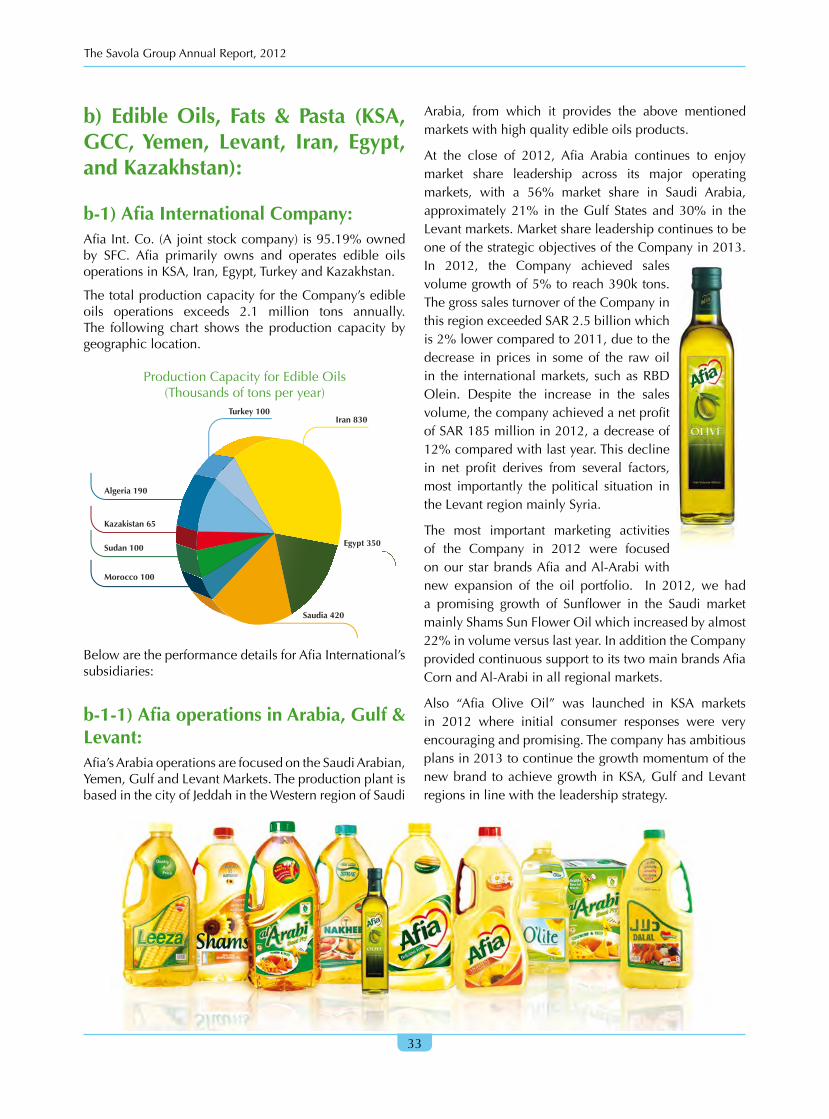
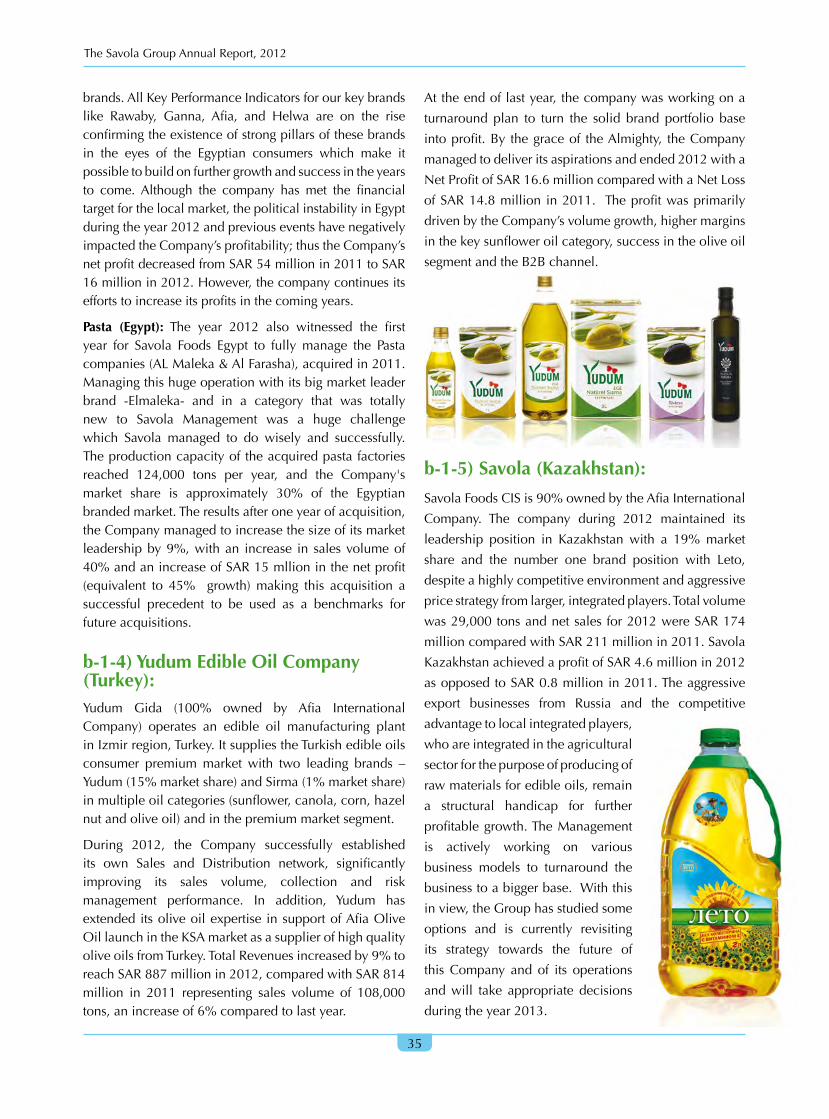
b) Edible Oils, Fats & Pasta (KSA, GCC, Yemen, Levant, Iran, Egypt, and Kazakhstan):
b-1) Afia International Company: AfiaInt.Co.(Ajointstockcompany)is95.19%ownedby SFC. Afia primarily owns and operates edible oilsoperationsinKSA,Iran,Egypt,TurkeyandKazakhstan.
ThetotalproductioncapacityfortheCompany’sedibleoils operations exceeds 2.1 million tons annually.The following chart shows the production capacity bygeographiclocation.
BelowaretheperformancedetailsforAfiaInternational’ssubsidiaries:
b-1-1) Afia operations in Arabia, Gulf & Levant: Afia’sArabiaoperationsarefocusedontheSaudiArabian,Yemen,GulfandLevantMarkets.TheproductionplantisbasedinthecityofJeddahintheWesternregionofSaudi
Arabia, from which it provides the above mentionedmarketswithhighqualityedibleoilsproducts.
At the close of 2012, Afia Arabia continues to enjoymarket share leadership across its major operatingmarkets, with a 56% market share in Saudi Arabia,approximately 21% in theGulf States and30% in theLevantmarkets.MarketshareleadershipcontinuestobeoneofthestrategicobjectivesoftheCompanyin2013.In 2012, the Company achieved salesvolumegrowthof5%toreach390ktons.ThegrosssalesturnoveroftheCompanyinthisregionexceededSAR2.5billionwhichis2%lowercomparedto2011,duetothedecrease in prices in someof the rawoilin the internationalmarkets, suchasRBDOlein. Despite the increase in the salesvolume,thecompanyachievedanetprofitofSAR185millionin2012,adecreaseof12%comparedwithlastyear.Thisdeclinein net profit derives from several factors,most importantly the political situation intheLevantregionmainlySyria.
The most important marketing activitiesof the Company in 2012 were focusedonour starbrandsAfiaandAl-Arabiwithnew expansion of the oil portfolio. In 2012, we hada promising growth of Sunflower in the Saudi marketmainlyShamsSunFlowerOilwhichincreasedbyalmost22%involumeversuslastyear.InadditiontheCompanyprovidedcontinuoussupporttoitstwomainbrandsAfiaCornandAl-Arabiinallregionalmarkets.
Also “Afia Olive Oil” was launched in KSA marketsin 2012 where initial consumer responses were veryencouragingandpromising.Thecompanyhasambitiousplansin2013tocontinuethegrowthmomentumofthenewbrand toachievegrowth inKSA,GulfandLevantregionsinlinewiththeleadershipstrategy.
2006
47%
20072008
20092010
20112012
54%
78%
82%
87%
90%
98%
20082009
20102011
2012
6,389
6,961
7,020
7,722
8,287
Iran 830Turkey 100
Egypt 350Sudan 100
Morocco 100
Saudia 420
Kazakistan 65
Algeria 190
1^250 IóL ôµ°S IÉØ°üeôéæÑdG ôµ°S ™æ°üe
180 (AÉ°ûfE’G â–)ájQóæµ°SC’ÉH
Ú©dG ôµ°S IÉØ°üe800 ¢ùjƒ°ùdG áæî°ùdG
ProductionCapacityforEdibleOils(Thousandsoftonsperyear)

The Savola Group Annual Report, 2012
34
b-1-2) Savola Behshahr Company (SBC) – Iran: Afia International Company owns 80% of SavolaBehshahr Company, Iran (SBC), a holding companywhichownsandoperates2plants in Iran through twosubsidiaries,namely,BehshahrIndustrialCompanyandMargarineManufacturingCompanywithmarketleadingbrandsLadan,BaharandAftab.
2012provedtobearecordbreakingoneforSBCas itachieved unprecedented results in the areas ofmarketshare, sales volume, net revenues, profit and otherbusinessKPIsdespite thewell-knownchallenges facedby the business in respect of International sanctions,highercostofdistributionandutilitiesandmanyotherbusinessenvironmenthurdles.Thedecisionstooptimizesalesmix,maximizecostefficiencies, strongmarketingactivities and effective working capital managementwere the drivers behind these results. The Companyachievedanextraordinarynetprofitcomparedwiththepreviousyear.
During 2012 total market share and brand equitycontinued to grow as SBC consolidated its marketleadership by increasing itsmarket share from40% in2011to48.7%in2012.IntheConsumerMarket,itsStarbrandLadanGhee’sshareofthesegmentincreasedfrom86%to92%.AlsotheB2Bsegmentreachedahistoricalhighof50%from37%comparedwith2011intheaddedvalueshorteningandmargarinesegments.
SBC’snetrevenueincreasedbySAR1.1billiontoreachSAR 4.4 billion, an increase of 31% compared to lastyear, on account of higher volumes and controlledincreaseinsellingprices.Duringtheyear2012,SBCtookthe initiative to establish a wholly ownedDistributionCompanywhichwillbethesoledistributorforbothitsplantsfrom2013pavingthewaytoachievesupplychain
anddistributioncost relatedefficiencies in thecomingyears.
The Board would like to highlight the key risks andchallenges that the Islamic Republic of Iran currentlyfaces due to Economic Sanctions imposed on Irancoupled with the difficulty of importing rawmaterialsand thecontinuousdecline in IraniancurrencyagainsttheUSdollaranditscollectiveimpactontheCompany'sactivity. Hence the Board of Directors would like toreassure you that it closelymonitors the situation andutilizes efficient management techniques to mitigatetheserisks.
b-1-3) Afia International (Egypt): Egypt has gone through many changes during 2012,someofwhichwereregardedaspositivedevelopments,whileotherswereseenashindrances,preventingEgyptfromunleashingitsfullandgreatpotential.Inthebiggerschemeof things,Egypt isstill regardedasapromisingandhighpotentialmarketinthemediumandlongtermduetoitslargepopulationandhighconsumptionpatternparticularly, in thosecategorieswhichSavolaprimarilyoperatesin.
In 2012, Savola Foods’ Egypt performance in the gheeand oil category (Afia International Egypt) hasmarkedsignificantdevelopments in theEgyptianmarket,beingablenotonlytomaintainbutalsotogrowitsleadershipposition in the massive Ghee segment. 2012 has alsowitnessed a significant increase in the Company’scompetitivepositionintheoilsegmentastheCompanysize grew by 9% collectively while our flagship Afiabrandincreasedslightlycomparedtolastyear.
The above was achieved as the Company investedsufficiently in its most valuable assets which are our
The Savola Group Annual Report, 2012
35
brands.AllKeyPerformanceIndicatorsforourkeybrandslike Rawaby, Ganna, Afia, and Helwa are on the riseconfirmingtheexistenceofstrongpillarsofthesebrandsin the eyes of the Egyptian consumers which make itpossibletobuildonfurthergrowthandsuccessintheyearsto come. Although the company has met the financialtargetforthelocalmarket,thepoliticalinstabilityinEgyptduringtheyear2012andpreviouseventshavenegativelyimpactedtheCompany’sprofitability;thustheCompany’snetprofitdecreasedfromSAR54millionin2011toSAR16millionin2012.However,thecompanycontinuesitseffortstoincreaseitsprofitsinthecomingyears.
Pasta (Egypt): The year 2012 also witnessed the firstyear for Savola Foods Egypt to fullymanage the Pastacompanies(ALMaleka&AlFarasha),acquiredin2011.Managingthishugeoperationwithitsbigmarketleaderbrand -Elmaleka- and in a category that was totallynew to Savola Management was a huge challengewhich Savola managed to do wisely and successfully.Theproductioncapacityoftheacquiredpastafactoriesreached 124,000 tons per year, and the Company'smarket share is approximately 30% of the Egyptianbrandedmarket.Theresultsafteroneyearofacquisition,theCompanymanagedtoincreasethesizeofitsmarketleadershipby9%,withan increase in salesvolumeof40%andanincreaseofSAR15mllioninthenetprofit(equivalent to 45% growth)making this acquisition asuccessful precedent to be used as a benchmarks forfutureacquisitions.
b-1-4) Yudum Edible Oil Company (Turkey):Yudum Gida (100% owned by Afia InternationalCompany) operates an edible oil manufacturing plantinIzmirregion,Turkey.ItsuppliestheTurkishedibleoilsconsumer premiummarket with two leading brands –Yudum(15%marketshare)andSirma(1%marketshare)inmultipleoilcategories(sunflower,canola,corn,hazelnutandoliveoil)andinthepremiummarketsegment.
During 2012, the Company successfully establishedits own Sales and Distribution network, significantlyimproving its sales volume, collection and riskmanagement performance. In addition, Yudum hasextendeditsoliveoilexpertise insupportofAfiaOliveOillaunchintheKSAmarketasasupplierofhighqualityoliveoilsfromTurkey.TotalRevenuesincreasedby9%toreachSAR887millionin2012,comparedwithSAR814million in 2011 representing sales volume of 108,000tons,anincreaseof6%comparedtolastyear.
Attheendoflastyear,thecompanywasworkingona
turnaround plan to turn the solid brand portfolio base
intoprofit.By thegraceof theAlmighty, theCompany
managedtodeliveritsaspirationsandended2012witha
NetProfitofSAR16.6millioncomparedwithaNetLoss
ofSAR14.8million in2011. Theprofitwasprimarily
drivenbytheCompany’svolumegrowth,highermargins
inthekeysunfloweroilcategory,successintheoliveoil
segmentandtheB2Bchannel.
b-1-5) Savola (Kazakhstan):
SavolaFoodsCISis90%ownedbytheAfiaInternational
Company. The company during 2012 maintained its
leadership position in Kazakhstan with a 19%market
share and the number one brand position with Leto,
despiteahighlycompetitiveenvironmentandaggressive
pricestrategyfromlarger,integratedplayers.Totalvolume
was29,000tonsandnetsalesfor2012wereSAR174
millioncomparedwithSAR211millionin2011.Savola
KazakhstanachievedaprofitofSAR4.6millionin2012
asopposedtoSAR0.8millionin2011.Theaggressive
export businesses from Russia and the competitive
advantagetolocalintegratedplayers,
whoareintegratedintheagricultural
sectorforthepurposeofproducingof
rawmaterialsforedibleoils,remain
a structural handicap for further
profitablegrowth.TheManagement
is actively working on various
business models to turnaround the
businesstoabiggerbase.Withthis
inview,theGrouphasstudiedsome
options and is currently revisiting
its strategy towards the future of
thisCompany and of its operations
andwill take appropriate decisions
duringtheyear2013.
The Savola Group Annual Report, 2012
36
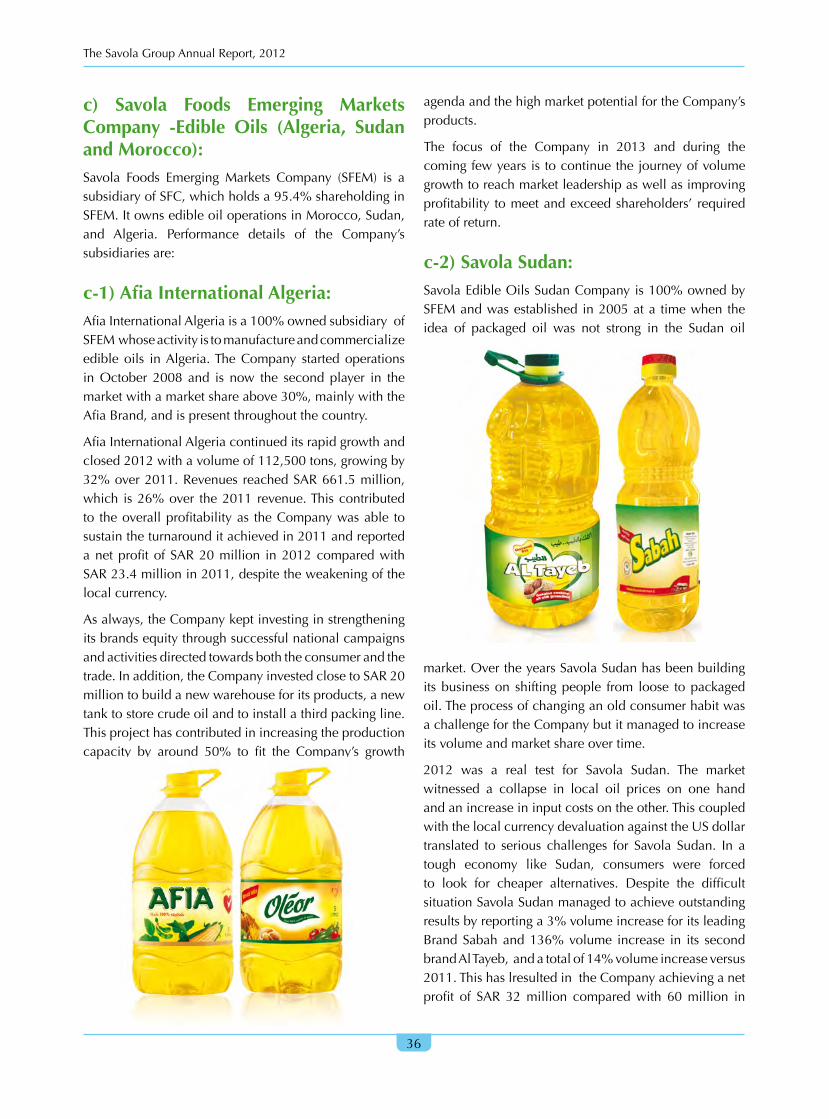
c) Savola Foods Emerging Markets Company -Edible Oils (Algeria, Sudan and Morocco): Savola Foods EmergingMarkets Company (SFEM) is asubsidiaryofSFC,whichholdsa95.4%shareholdinginSFEM.ItownsedibleoiloperationsinMorocco,Sudan,and Algeria. Performance details of the Company’ssubsidiariesare:
c-1) Afia International Algeria: AfiaInternationalAlgeriaisa100%ownedsubsidiaryofSFEMwhoseactivityistomanufactureandcommercializeedible oils inAlgeria.TheCompany startedoperationsinOctober 2008 and is now the second player in themarketwithamarketshareabove30%,mainlywiththeAfiaBrand,andispresentthroughoutthecountry.
AfiaInternationalAlgeriacontinueditsrapidgrowthandclosed2012withavolumeof112,500tons,growingby32%over2011.RevenuesreachedSAR661.5million,which is26%over the2011 revenue.Thiscontributedto theoverallprofitabilityas theCompanywasable tosustaintheturnarounditachievedin2011andreportedanetprofitofSAR20million in2012comparedwithSAR23.4millionin2011,despitetheweakeningofthelocalcurrency.
Asalways,theCompanykeptinvestinginstrengtheningitsbrandsequitythroughsuccessfulnationalcampaignsandactivitiesdirectedtowardsboththeconsumerandthetrade.Inaddition,theCompanyinvestedclosetoSAR20milliontobuildanewwarehouseforitsproducts,anewtanktostorecrudeoilandtoinstallathirdpackingline.Thisprojecthascontributedinincreasingtheproductioncapacity by around 50% to fit the Company’s growth
agendaandthehighmarketpotentialfortheCompany’sproducts.
The focus of the Company in 2013 and during thecomingfewyearsistocontinuethejourneyofvolumegrowthtoreachmarketleadershipaswellasimprovingprofitability tomeetandexceedshareholders’ requiredrateofreturn.
c-2) Savola Sudan: SavolaEdibleOilsSudanCompanyis100%ownedbySFEMandwasestablished in2005ata timewhen theidea of packaged oil was not strong in the Sudan oil
market.OvertheyearsSavolaSudanhasbeenbuildingitsbusinesson shiftingpeople from loose topackagedoil.TheprocessofchanginganoldconsumerhabitwasachallengefortheCompanybutitmanagedtoincreaseitsvolumeandmarketshareovertime.
2012 was a real test for Savola Sudan. The marketwitnessed a collapse in local oil prices on one handandanincreaseininputcostsontheother.ThiscoupledwiththelocalcurrencydevaluationagainsttheUSdollartranslated to serious challenges for Savola Sudan. In atough economy like Sudan, consumers were forcedto look for cheaper alternatives. Despite the difficultsituationSavolaSudanmanagedtoachieveoutstandingresultsbyreportinga3%volumeincreaseforitsleadingBrandSabahand136%volume increase in its secondbrandAlTayeb,andatotalof14%volumeincreaseversus2011.ThishaslresultedintheCompanyachievinganetprofit of SAR 32million comparedwith 60million in

The Savola Group Annual Report, 2012
37
2012.Althoughitwasatoughyear,theCompanyisnow
assuredthattheworkdonebehinditsbrandbuildinghas
givenit2strongpillarstofacetheunstableatmosphere
whichthecountryisnowin.
Theobjective in2013willbeon furtherconversionof
consumersfromloosetobrandedoilthroughour2brands
byappealingtoboththeirdesiredoilcharacteristicsand
suitablesizesandpacks.
c-3) Savola Morocco:
Savola Morocco is 100% owned by SFEM, it started
operations in 2004 as a Greenfield Company after
liberalizationoftheedibleoilmarketinMorocco.
Today, Savola Morocco is ranked third with a market
share of 12% through its flagship trademarksAFIA&
HALA.
Indifficult adversemarket conditions, SavolaMorocco
managed to stabilize its sales volume at 45,000 tons
during2012.However,due tosomeunforeseenevents
suchasthefinancialimpactofcumulativetaxexpenses,
highercrudeoilpricesanddevaluationintheexchange
rate, it reported net losses of SAR6.7million in 2012
comparedwithnetlossofSAR5.9millionfor2011.The
Companywill undergo further reviews during 2013 to
taketheappropriatedecisionsinlightoftheresultsofits
operationsfor2012.EdibleOilsfactoryinSudan

The Savola Group Annual Report, 2012
38
Production Capacity of Sugar Factories in the Group reached more than
2 Million Tons Per Year

The Savola Group Annual Report, 2012
39
d-1) United Sugar Company (USC) (Saudi Arabia): UnitedSugarCompany(USC)operatesfromtheJeddahIslamic Port and is 74.4% owned by Savola IndustrialInvestmentsCompany,which in turn is95%ownedbySavola FoodsCompany.USCoperates the third largestsugar refinery in the world, with annual productioncapacityofapproximately1.3milliontons.ThecompanyhasbuiltastrongmarketingbaseintheMiddleEastonitscorebrand–“AlOsra”andholds75%marketshareinSaudiArabia.Thecompanyisadominantleaderintheimportant B2Bmarketswith solid partnership relationsinmanyfoodindustries.ThetotalproductioncapacityofGroup’ssugarrefinerieshasreachedmorethan2milliontonsannually;thefollowinggraphshowsthedistributionoftheproductioncapacityofitssugarrefineriesinSaudiArabiaandEgypt:
As part of the diversification of its product portfolio,theCompany entered into the sweetener category andlaunched the “Sweeva” brand in 2011, which wasprimarily created to provide a sugar alternative forconsumerswhoare looking foraproduct thatfits theirdesiresandhealthneeds.
Inthedifficultcontextoftheregionin2012,theCompany’ssalesvolumewasstableat1.34milliontons,withexportsaccountingfor368thousandtonsanincreaseof3%.The
netrevenueforthebusinessexceededSAR3.77billion,which was 8% lower as compared to last year. TheCompany’snet income for theyear2012 reachedSAR251million,adecreaseof1%comparedwithlastyear.
d-2) United Sugar Company of Egypt: UnitedSugarCompanyofEgypt(USCE)isa57%ownedsubsidiaryofUSC;SavolaGrouphasalsoadirect19%shareholding in the Company. The Egyptian businessbegan its operations in 2008 with a new 750,000-tonsugar refinery at Ain Al Sokhna port, the capacity ofwhichincreasedduring2010toreach800,000tons,salesvolumesat600,000tonsremainedthesame,as2011.
In2012,theirregularitiesinEgyptonthelaborandunionfrontsaffectedouroperationsaswefacedlaborstrikesinthefactorylocatedintheareainEgyptwhichwitnessedthehighestrateoflaborunrestthroughouttheyear.Asaresult,thefinancialresultsweredramaticallyaffectedandmorethan150,000MTofproductionandsaleswerelostalongwith incurring a heavy cost relating to shipmentwash out and financing costs during the stoppageperiod. The operationswere resumed after manyefforts with the concernedauthorities,whichresultedinanagreementbeingreachedwiththeLaborUnionsunderthe auspices of theMinisterof Labor. Operations haveresumed since and areuninterruptedforsixmonthsinarow.
Due to the labor problemsand the instability in Egypt,thecompanyrecordedanetlossofSAR72millionversusanetprofitofSAR2millionlastyear.
ProductionCapacityforSugarRefineries(thousandsoftonsperyear)
Jeddah KSA1,250Alexandria (Beet sugar)
(Under Construction)180
Ain Alsukhnah,Egypt 800
d) Sugar and Sweeteners Business (KSA and Egypt):
The Savola Group Annual Report, 2012
40
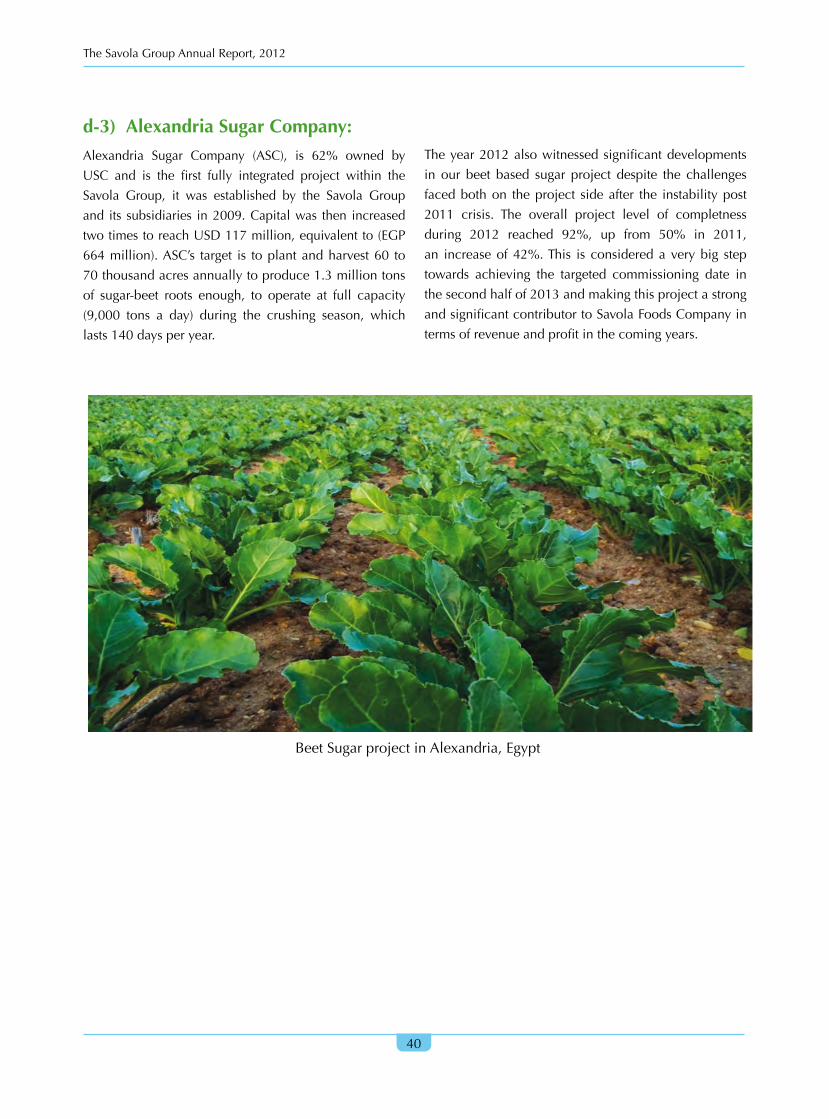
d-3) Alexandria Sugar Company:Alexandria Sugar Company (ASC), is 62% owned by
USC and is the first fully integrated project within the
Savola Group, it was established by the Savola Group
and its subsidiaries in2009.Capitalwas then increased
twotimestoreachUSD117million,equivalentto(EGP
664million).ASC’s target is toplantandharvest60 to
70thousandacresannuallytoproduce1.3milliontons
of sugar-beet roots enough, to operate at full capacity
(9,000 tons a day) during the crushing season, which
lasts140daysperyear.
Theyear2012alsowitnessedsignificantdevelopments
in our beet based sugar project despite the challenges
facedbothon theproject sideafter the instabilitypost
2011 crisis. The overall project level of completness
during 2012 reached 92%, up from 50% in 2011,
an increaseof42%.This is considereda verybig step
towards achieving the targeted commissioning date in
thesecondhalfof2013andmakingthisprojectastrong
andsignificantcontributortoSavolaFoodsCompanyin
termsofrevenueandprofitinthecomingyears.
BeetSugarprojectinAlexandria,Egypt

The Savola Group Annual Report, 2012
41

The Savola Group Annual Report, 2012
42
Sales of Al-Azizia Panda United Companyexceeded SAR 10 Billion and Reported a Net Profit of
SAR 311.4 Million, an increase of 55.5% over last yearIt also managed to increase the number of its stores (Hypermarkets
and Supermarkets) to 181,145 out of them are located in the Kingdom

The Savola Group Annual Report, 2012
43
4-2) Retail Sector- Al-Azizia Panda United Company (APU):Al-AziziaPandaUnitedCompany"APU",isaclosedjointstockcompany,operatingin thegroceryretailsector, itisowned74.4%bySavolaGroup (aSaudi joint stockcompany). Panda succeeded inopening14new storesin 2012 and, by the endof year 2012,APU’s networkof storeshas reached181stores,outofwhich145arelocated in the Kingdom of Saudi Arabia, one store inDubaiand35storesinLebanon,makingitamongsttheleadingretailersinthegroceryretailsectorintheMiddleEastregion.APUisplanningtoopen20storesin2013,(15supermarketsand5hypermarkets),thusbringingthetotalnumberofstoresto201bytheendoftheyear.
During the year 2012, Panda revenues grew by 11%over2011resultinginagrowthofSAR1.0billion.TotalrevenuesfortheyearexceededtheSAR10billionmarkforthefirsttimeinitshistorytoreachSAR10.2billioncomparedwithSAR9.2billionin2011.
Anotheroutstandingandhistoricalachievement for theyear 2012was delivering over 3.0% net profitmarginfor the first time and realizing net profit of SAR 311.4millioncomparedtoSAR200.1millionintheyear2011(anoutstandinggrowthof55.5%).
Pandaalsoincreasedthetotalsellingareaofitsstoresto527,000squaremeterswhichrepresentedanincreaseof6.0%overthepreviousyear.Thisincreaseresultedfrom14newstoreopeningsinSaudiArabiacomprisingof4hypermarketsand10supermarkets.ThecustomerbaseofPandagrewby4.8%versuslastyeartoreach91million
customershoppingtransactionsduringtheyear2012.
Pandamaintained its ranking as number one in “PricePerception”inSaudiArabiaaccordingtoawidecustomersurveywhich benchmarks the competitiveness, qualityandstandardofservicesprovidedbyPandatowardsitscustomers.Panda’smarketshareinyear2012reached8.0%in theSaudigrocery retailmarket,and21.4%inthemoderngroceryretailmarket(asofSeptember2012)making it the leading company in the grocery retailsectorinKSA.
Panda is aspiring to further enhance its market sharein the coming 3 years (2013 -2015) through superiorperformance of its existing stores and through thecontinued ongoing strategic focus on opening of newstores.Thiswillfurtherexpanditsgeographicalfootprintthroughout thecountrywhichcurrentlyspans33citiesacrossSaudiArabia.
Thecompany’sgrowthinnumberofstoresisillustratedbelow:
GrowthTrendofPanda’sSupermarkets(KSA)
GrowthTrendofPanda’sHypermarkets(KSA)
2006
47
20072008
20092010
20112012
54
78
8287
90
98
2004
1
20072008
20092010
20112012
8
19
31
37
41
47

The Savola Group Annual Report, 2012
44
The Savola Group Annual Report, 2012
45
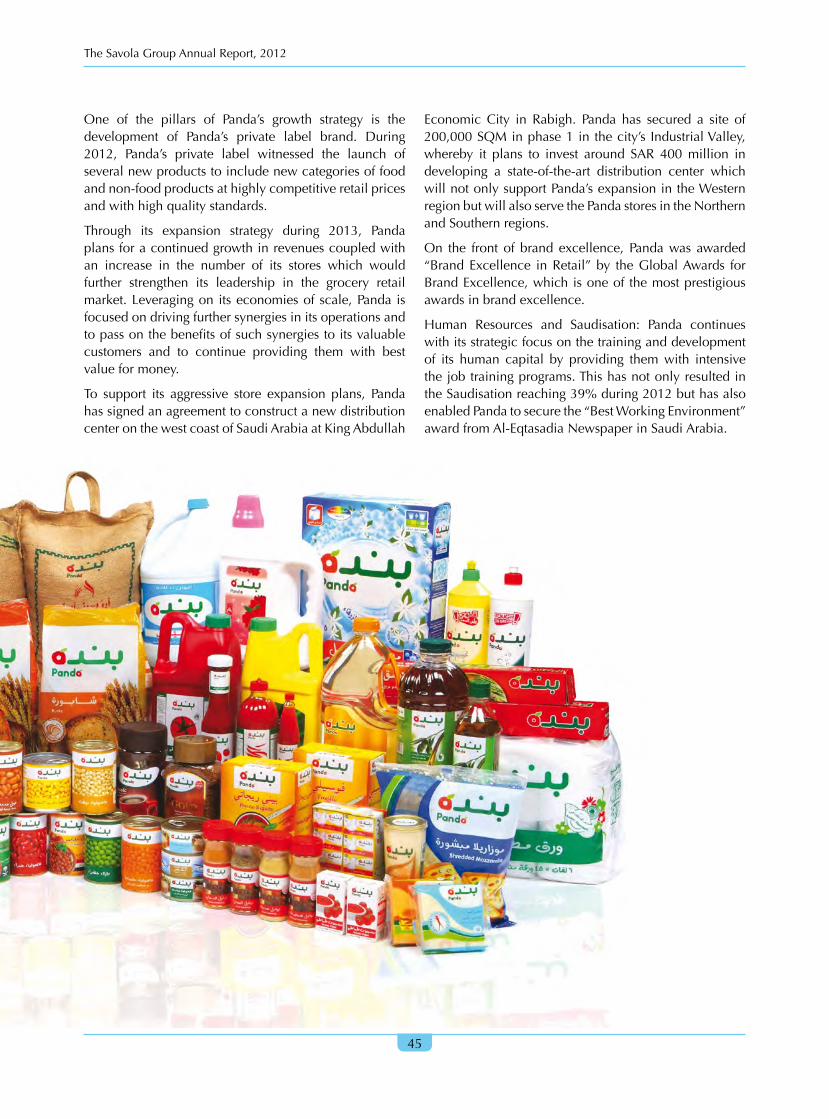
One of the pillars of Panda’s growth strategy is thedevelopment of Panda’s private label brand. During2012, Panda’s private label witnessed the launch ofseveralnewproductstoincludenewcategoriesoffoodandnon-foodproductsathighlycompetitiveretailpricesandwithhighqualitystandards.
Through its expansion strategy during 2013, Pandaplansforacontinuedgrowthinrevenuescoupledwithan increase in the number of its stores which wouldfurther strengthen its leadership in the grocery retailmarket.Leveragingon itseconomiesofscale,Panda isfocusedondrivingfurthersynergiesinitsoperationsandtopassonthebenefitsofsuchsynergiestoitsvaluablecustomers and to continue providing them with bestvalueformoney.
To support its aggressive store expansion plans, PandahassignedanagreementtoconstructanewdistributioncenteronthewestcoastofSaudiArabiaatKingAbdullah
EconomicCity in Rabigh. Panda has secured a site of200,000SQMinphase1in thecity’s IndustrialValley,whereby it plans to invest around SAR 400million indeveloping a state-of-the-art distribution center whichwillnotonlysupportPanda’sexpansionintheWesternregionbutwillalsoservethePandastoresintheNorthernandSouthernregions.
On the front of brand excellence, Pandawas awarded“BrandExcellence inRetail”by theGlobalAwards forBrandExcellence,whichisoneof themostprestigiousawardsinbrandexcellence.
Human Resources and Saudisation: Panda continueswithitsstrategicfocusonthetraininganddevelopmentof its human capital by providing themwith intensivethejobtrainingprograms.ThishasnotonlyresultedintheSaudisationreaching39%during2012buthasalsoenabledPandatosecurethe“BestWorkingEnvironment”awardfromAl-EqtasadiaNewspaperinSaudiArabia.

The Savola Group Annual Report, 2012
46
The production capacity of Plastic Sector Factories
Reached approximately 200,000 Tons per year
Sales of the Plastic Sector exceeded SAR 1 Billion mark, reaching SAR 1.05 Billion, this is an increase of 5.2% over last year
The Savola Group Annual Report, 2012
47
4-3) Plastic Sector - Savola Packaging Company (SPC):
SPC is a limited liability companywhichmanages the
Plastics Sector, its Headquarters is located in Jeddah,
anditsowned100%bySavolagroup.During2012,SPC
startedtheprocessofconversionfromalimitedliability
Company to a closed joint stock company, the legal
processisexpectedtobecompletedduring2013.SPC
isamongst the leadingplayers in the rigidandflexible
plasticmarket in the region. SPC has awide range of
customerswho are located inmore than 35 countries
withatotalproductionequalto200,000tonsannually
anditsproductsarepresentinalmostallofthecontinents
oftheworld.
SPCmanagesandoperatessevenmanufacturingfacilities,
one in Jeddah, four inRiyadh, and two inAlexandria,
Egypt. Itsuppliespre-forms,bottles,closures,filmsand
containersforthedairy&juicesector,water,carbonated
soft drinks, petrochemicals, health & personal care
products,lubricants,edibleoilandretailsectortolocal
andexportcustomers.
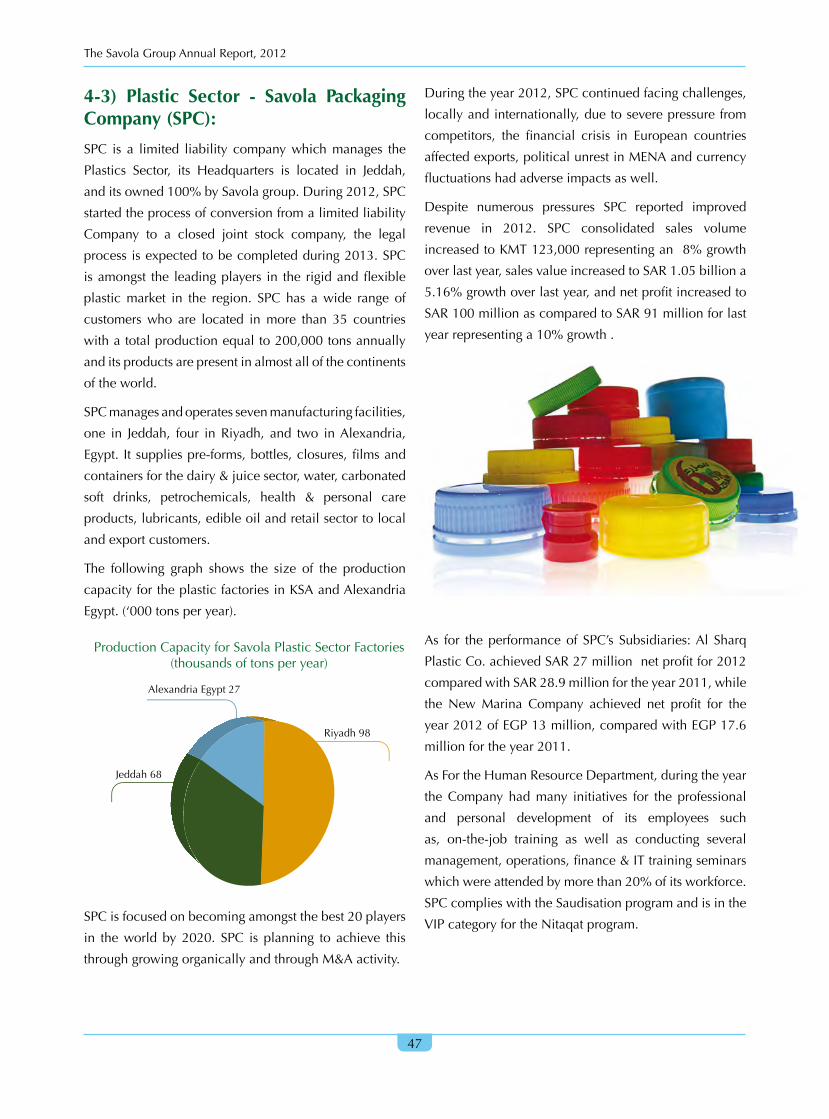
The following graph shows the size of the production
capacityfortheplasticfactoriesinKSAandAlexandria
Egypt.(‘000tonsperyear).
SPCisfocusedonbecomingamongstthebest20players
in theworld by 2020. SPC is planning to achieve this
throughgrowingorganicallyandthroughM&Aactivity.
Duringtheyear2012,SPCcontinuedfacingchallenges,
locallyandinternationally,duetoseverepressurefrom
competitors, the financial crisis in European countries
affectedexports,politicalunrestinMENAandcurrency
fluctuationshadadverseimpactsaswell.
Despite numerous pressures SPC reported improved
revenue in 2012. SPC consolidated sales volume
increasedtoKMT123,000representingan8%growth
overlastyear,salesvalueincreasedtoSAR1.05billiona
5.16%growthoverlastyear,andnetprofitincreasedto
SAR100millionascomparedtoSAR91millionforlast
yearrepresentinga10%growth.
As for theperformanceof SPC’s Subsidiaries:Al Sharq
PlasticCo.achievedSAR27millionnetprofitfor2012
comparedwithSAR28.9millionfortheyear2011,while
the NewMarina Company achieved net profit for the
year2012ofEGP13million,comparedwithEGP17.6
millionfortheyear2011.
AsFortheHumanResourceDepartment,duringtheyear
theCompany hadmany initiatives for the professional
and personal development of its employees such
as, on-the-job training as well as conducting several
management,operations,finance&ITtrainingseminars
whichwereattendedbymorethan20%ofitsworkforce.
SPCcomplieswiththeSaudisationprogramandisinthe
VIPcategoryfortheNitaqatprogram.
ProductionCapacityforSavolaPlasticSectorFactories(thousandsoftonsperyear)
Alexandria Egypt 27
Riyadh 98
Jeddah 68

The Savola Group Annual Report, 2012
48
5) The Savola Group Non-Managed Investments

The Savola Group Annual Report, 2012
49
a) Almarai Dairy Company: TheSavolaGroup’sinvestmentinAlmarai,aSaudibasedpublicly listed company, is considered to be a corestrategic investment for theGroup in the Foods sector.Asmentionedelsewhere in this report , asa result theGroupincreaseditsinvestmentinAlmaraiCompanybyan amount of SAR2billionwhichincreased its shareholding from29.95%to36.52%.
Almarai is a leading food andbeverage company in the MiddleEast and, under the brand nameAlmarai, it enjoys an outstandingreputationforhigh-qualityproductsin GCC and Middle EasternCountries. It produces dairyproducts,beverage,bakery,poultryandinfantmilk.
Almarai achieved outstanding results for 2012 with
its net profit for the year reaching SAR 1.4 billioncomparedtoSAR1.1billionfor2011,whichrepresentsan increase of 26.42%, as per the Company’s resultsas announced to the Saudi Stock Exchange (Tadawul)on January19,2013.Thus,AlmaraiBoardofDirectorshas recommended distributing SAR 500 million ascashdividendsfor thefiscalyearendedDecember31,
2012. This recommendationwill be proposed in theAlmaraiShareholders Annual GeneralMeetingforapproval.AsAlmaraiisapubliclylistedcompanyontheSaudi Stock Exchange (Tadawul),all information and detailsabout its performance, businessdevelopment, and financialresults are available in its 2012AnnualReportaspresentedbyits
Board of Directors and announced through the SaudiStockExchangewebsite(Tadawul).
Savola Group increased its shareholding in Almarai Company from 29.95% to 36.52% during 2012. The additional
investment was SAR 2 Billion.

The Savola Group Annual Report, 2012
50
b) Herfy Foods Company: Herfy Food Services Company (a Saudi Public listedCompany), is 49% owned by Savola (directly &indirectly),itoperatesafastfoodrestaurantchainacrossthekingdomandoverseas.Thecompanyalsoproducesbakeryandmeatproducts,hasanextensivedistributionnetwork and a well-established supplies division, andownsaspecialcateringservicesdivision. Ithasspecialexpertiseinthisareagainedthroughlongexperienceofmorethan31years.
Herfy FoodServicesCompanyachievedanetprofitofSAR181.2millionfortheyear2012ascomparedtoSAR146.6millionfor2011,whichrepresentsanincreaseof23.5%,thisisaspertheCompany’sannouncedresultsonSaudiStockExchange(Tadawul)onJanuary19,2013.Moreover, the Company opened 13 new restaurantsduringtheyear2012,bringingthetotalnumberofHerfyrestaurantsto190in5differentcountries.Inaddition,the
Company’sfacilitieshavegainedISO22000certification,and began production from the first bread line at itsnew factory.AsHerfy is a publicly listed company ontheSaudiStockExchange(Tadawul),allinformationanddetailsaboutitsperformance,businessdevelopment,andfinancialresultsareavailableinits2012AnnualReportpresented by its Board of Directors and announcedthroughtheSaudiStockExchangewebsite(Tadawul).
c) Real Estate Business:
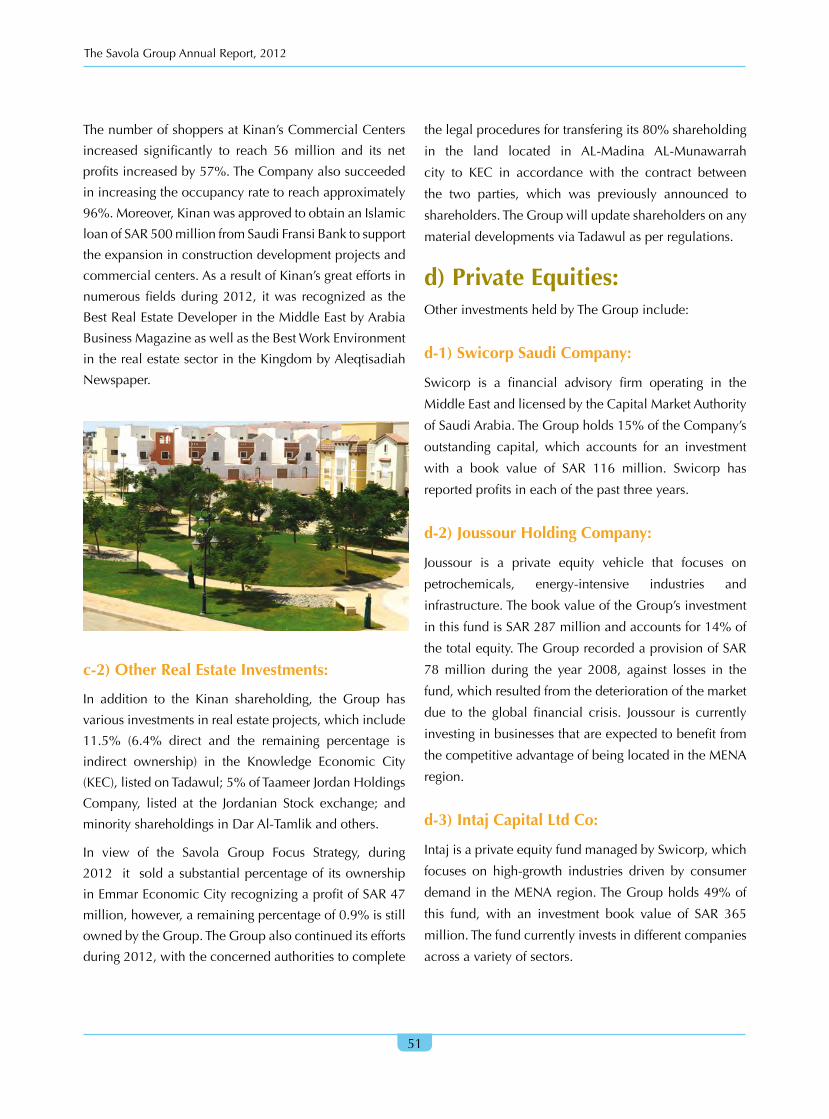
c-1) Kinan International for Real Estate Development:
The Kinan Company, which is 29.9% owned by the
Savola Group, recorded outstanding achievements
in 2012, whereby the Company reported a net profit
exceeding SAR 104 million, which represents an
increase of 5% compared to last year. Based on these
results, the company has distributed cash dividends to
itsshareholdersatarateof3.7%oftheCompany’sshare
capital for the second consecutive year. In addition,
Kinanmanagedsuccessfully to sell itsMasharifproject
first phase residential units which is considered a
major residential development project, located in the
northeast of Jeddah. It is worth mentioning that 146
villas were constructed and handed over in line with
the project timeline. Furthermore, the Company was
able to complete the infrastructurework for its second
residentialdevelopmentproject,MasharifHillswhichis
located in thenorthofRiyadh.TheMasharifHillsarea
covers 906,000 squaremeters and the Company aims
tostartsellingtheresidentialunitsofthisprojectbythe
secondquarterof2013.Kinanisplanningtorevealtwo
new residential unit projects in Jeddah, bringing the
total areaof allprojects that theCompany is currently
developingtoapproximatelyfivemillionsquaremeters,
whichmakesKinanoneofthelargestresidentialproject
developersinSaudiArabia.
The Savola Group Annual Report, 2012
51
ThenumberofshoppersatKinan’sCommercialCenters
increased significantly to reach 56million and its net
profitsincreasedby57%.TheCompanyalsosucceeded
inincreasingtheoccupancyratetoreachapproximately
96%.Moreover,KinanwasapprovedtoobtainanIslamic
loanofSAR500millionfromSaudiFransiBanktosupport
theexpansioninconstructiondevelopmentprojectsand
commercialcenters.AsaresultofKinan’sgreateffortsin
numerousfieldsduring2012, itwas recognizedas the
BestRealEstateDeveloperintheMiddleEastbyArabia
BusinessMagazineaswellastheBestWorkEnvironment
intherealestatesectorintheKingdombyAleqtisadiah
Newspaper.
c-2) Other Real Estate Investments:
In addition to the Kinan shareholding, the Group has
variousinvestmentsinrealestateprojects,whichinclude
11.5% (6.4% direct and the remaining percentage is
indirect ownership) in the Knowledge Economic City
(KEC),listedonTadawul;5%ofTaameerJordanHoldings
Company, listed at the Jordanian Stock exchange; and
minorityshareholdingsinDarAl-Tamlikandothers.
In view of the Savola Group Focus Strategy, during
2012it soldasubstantialpercentageofitsownership
inEmmarEconomicCityrecognizingaprofitofSAR47
million,however,aremainingpercentageof0.9%isstill
ownedbytheGroup.TheGroupalsocontinueditsefforts
during2012,withtheconcernedauthoritiestocomplete
thelegalproceduresfortransferingits80%shareholding
in the land located in AL-Madina AL-Munawarrah
city to KEC in accordance with the contract between
the two parties, which was previously announced to
shareholders.TheGroupwillupdateshareholdersonany
materialdevelopmentsviaTadawulasperregulations.
d) Private Equities:OtherinvestmentsheldbyTheGroupinclude:
d-1) Swicorp Saudi Company:
Swicorp is a financial advisory firm operating in the
MiddleEastandlicensedbytheCapitalMarketAuthority
ofSaudiArabia.TheGroupholds15%oftheCompany’s
outstanding capital, which accounts for an investment
with a book value of SAR 116 million. Swicorp has
reportedprofitsineachofthepastthreeyears.
d-2) Joussour Holding Company:
Joussour is a private equity vehicle that focuses on
petrochemicals, energy-intensive industries and
infrastructure.ThebookvalueoftheGroup’sinvestment
inthisfundisSAR287millionandaccountsfor14%of
thetotalequity.TheGrouprecordedaprovisionofSAR
78million during the year 2008, against losses in the
fund,whichresultedfromthedeteriorationofthemarket
due to the global financial crisis. Joussour is currently
investinginbusinessesthatareexpectedtobenefitfrom
thecompetitiveadvantageofbeinglocatedintheMENA
region.
d-3) Intaj Capital Ltd Co:
IntajisaprivateequityfundmanagedbySwicorp,which
focuses on high-growth industries driven by consumer
demandintheMENAregion.TheGroupholds49%of
this fund, with an investment book value of SAR 365
million.Thefundcurrentlyinvestsindifferentcompanies
acrossavarietyofsectors.

The Savola Group Annual Report, 2012
52
6) Human Resources & Information Technologies and Corporate Citizenship Programs

The Savola Group Annual Report, 2012
53
6) Human Resources and Information Technologies and Corporate Citizenship Programs: a) Workforce and Communication Program with Employees:a-1) Workforce: Employing and developing localtalentremainsacornerstoneoftheGroup’scorestrategy.As at the end of 2012, theGroup’s total overseas andlocalworkforce exceeded 18,500 employees ofwhich13,500werebasedinKSA(ofwhich5,500wereSaudimenandwomen).Accordingly, theoverall Saudisationpercentage reached approximately 40%. Efforts arecontinuingtoaccommodatemoreyoungSaudinationalsin thecomingyears.Themajorityof theexecutiveandleadership positions are occupied by competent andqualifiedSaudis.
Demonstratingitscommitmenttodevelopfutureleaderswithin the Savola Group, 40 Management TraineeshavejoinedSavolain2012andarebeingpreparedanddeveloped to become future leaders and executiveswithin the Group and its subsidiaries as part of theGroup’s Management Trainees Program. The Group’sgreateffortstohiremoreyoungSaudimalesandfemaleswillcontinueduring2013.
a-2) The Group’s Annual Conference for Exec-utives and Managers:During2012theGroupconducteditsAnnualConferencefor its Executives and Managers in Saudi Arabia andoverseas. The Group holds this event on an annualbasis.DuringtheConference,theparticipantsreviewedand discussed the Group and sector performance andkey lessons from the previous year. The review alsoincludedare-focusonthestrategicobjectives,programsandplansoftheGroupandsectorsintheKingdomandinternational operations for the fiscal year 2012. Inaddition,thechallenges,potentialrisks,andmechanismsofimplementationwerediscussed.Duringtheevent,thebestperformingteamsfromallsectorswerehonoredfortheiroutstandingperformanceduringtheyear.EmployeeswhohadservedtheCompanywerealsohonoredduringtheConference.TheGroupisplanningtoholditsAnnualConference for the year 2013 during the month ofFebruary2013 todiscuss theGroup’sachievements forlastyearanditsplansfor2013.
a-3) Information Technology (IT):TheGroupmanagesitsITservicesthroughanin-housedivisioncalledSavolaSharedInformationServices(SSIS).In-linewiththeGroup’sbusinessstrategy,Savolaaimstoprovideuptodate,reliable,costeffective,highqualityand secure IT services to the Group and its OpCos.Thisdivision ismanagedby talentedexperts in ITwhocontributesignificantlytoachievingtheGroupobjectivesandstrategy.
b) Special Programs developed for Employees:AsoneoftheGroup’scorevaluestowardsitsemployeesis ‘Birr’(practicing justice), theGroup has developed anumberofprogramsforitsemployeesdesignedtoretain,motivateandimproveperformance.
b-1) Employee Home Loan Scheme:Thisprogramwasfirstintroducedin1992,andisdesignedtoretainandmotivatetheemployeesoftheGroupanditssubsidiaries’.Aninterest-freeloanof50basicsalaries,at aminimum of SAR 500,000 andmaximum of SAR2.5million, isprovidedby theGroup tobepaidbackover120months.Thisprogramhelpsemployeestobuytheirownhomesafterfulfillingcertainrequirementsandcriteria.Almost100Savolaemployeeshadparticipatedand benefited from this scheme up to December 31,2012.
b-2) Employee Co-operative/Takaful Program for Death and Permanent or Partial Disability: In cooperation with Saudi British Bank (SABB), in thecaseofemployeedeath,permanentorpartialdisability,Savolacompensatesanequivalentto24basicsalaries.Allcasessubmittedin2012havebeensettledaccordingly.
b-3) Employee Takaful Fund: This fund helps junior staff (non-managers) deal withfinancial emergencies they or their families mightencounter that put them in urgent need of financialassistance. The fund is financed through voluntarymonthly contributions by the different grades of staff.Savolaalsocontributesbymatchingemployees’monthlypayments.TheFundsupportedallcasesthatfulfilledthecriteriaduring2012.About100caseswereassistedbytheFundduringtheyear2012comparedwith185casesinthepreviousyear.
AgroupphotooftheyoungSaudimanagementtraineeswiththeGroupManagingDirectorandtheExecutiveManagementduringtheirintroductoryworkshop.

The Savola Group Annual Report, 2012
54
The Group’sAnnual Conference for
Executives and Managers:During 2013 the Group conducted its Annual
Conference for its Executives and Managers fromSaudi Arabia and overseas. The Group holds thisevent on an annual basis. During the Conference, theparticipants reviewed and discussed the Group andsector performance and key lessons from the previousyear.Thereviewalsoincludedare-focusonthestrategicobjectives,programsandplansoftheGroupandsectorsintheKingdomandinternationaloperationsforthefiscalyear2012.Inaddition,thechallenges,potentialrisks,andmechanismsofimplementationwerediscussed.Duringtheevent,thebestperformingteamsfromallsectorswerehonoredfortheiroutstandingperformance during the year. Employees
whohadservedtheCompanywerealso honored during the
Conference.

The Savola Group Annual Report, 2012
55
AgroupphotooftheattendeesattheSavolaAnnualC
onference2013,
with
theGroupM
anagingDirectorandtheExecutiveManagem
ent

The Savola Group Annual Report, 2012
56
7) Savola Group Corporate Social Responsibility (CSR) Programs

The Savola Group Annual Report, 2012
57
7) Savola Group Corporate Social Responsibility (CSR) Programs:
Aspartof itscommitment toserve thecommunity, the
GroupcontinuedtoimplementarangeofCSRprograms
during2012.KeyprojectsintheCSRinitiativeare:The
SavolaCenter for EmpoweringPeoplewithDisabilities
(Makeen); Leave The Change for Them Program in
association with The Disabled Children’s Association;
Leadership Programs through, Al-Madina Institute of
Leadership & Entrepreneurship (MILE); and other CSR
initiatives administered in collaboration with various
non-profit organizations, theGovernment, and various
medical and educational institutions. Recognizing
the importance of Savola’s involvement in developing
communitieswhereitoperates,theGroupBoardadopted
aresolutiontoallocate1%ofannualoperatingnetprofits
fromitscoresectorstosupportCSRprograms.
TheGroupCSRProgramsincludethefollowing:
a) The Savola Center for Empowering People with Disability (Makeen):
TheCenterwasestablishedtotrainandemploypeople
withdisabilitiesandassisttheminsecuringappropriate
jobs whether, in the Group’s Operating Companies
or in the private sector. In 2012, the Center trained
and employed 120 people with disabilities within the
Groupandotherentitiesintheprivatesector.Makeen
Centerhasanambitiousplan to trainandemploy200
peopleduring2013, Inshallah.TheCenterwasable to
accommodate306peopleintotheMakeenPilotProgram
duringthepasttwoyears.
MakeenCenterinitiativeswereasfollows:
1) The Savola Total Accessibility Project:
Attheendof2012,TheSavolaGrouphasannouncedthat
itis100%pecialneedsfriendlythroughthecompletion
of itsUniversalAccessibility Projectwhich covered its
operationalcompaniesAfia International,UnitedSugar
CompanyandSavolaPackagingallofwhicharelocated
inJeddah.
Theprojectaimstoensureanaccessibleworkplacefor
peoplewithdisabilitiesandallfacilitieswereassessed
by the Global Alliance on Accessible Technologies &
Environments (GAATES), an organization with a vast
experienceinUniversalAccessibility.,Allthecompanies
received the Compatibility Certificate confirming that
theymeetGlobalAccessibilityStandards.This strategic
initiativeaims todevelopappropriateconditions in the

The Savola Group Annual Report, 2012
58
work environment that better serve the needs of thedisabledcommunity;italsoaimstoensureeasymobilityof employees and customers with disabilities withinthe various buildings and facilities of its OperatingCompanies and factories. The Group will continueduring 2013 to invest in projects that create a better
environmentforpeoplewithdisabilities.
2) The Mentor and Buddy System:TheMakeen Center has organized a training programtitled“TheConceptand Implementationof theMentorandBuddySystem,”whichtookplaceinalltheGroup’s,KSAbased,OperatingCompanies.Thetrainingprogramaimstospreadtheawarenessofdealingwithemployeeswith disabilities and to secure accessible workplacesfor them. 85 employees from Human Resources andProductionDepartmentshaveparticipatedinthistrainingprogram.
3) The Global Reporting Initiative (GRI):TheGrouppublisheditsfirstSustainabilityReportin2012,which covers all theGroup’s activities in the previousyear,accordingtotheGRI(GlobalReportingInitiative).TheReportwasreviewedbytheCenterforSustainabilityandExcellence (CSE),anon-profitorganizationaimingto enhance economic sustainability, and the Group
achievedaB+ratingforGRI.TheGlobalInitiativeReportprovidesdatarelatingto theeconomic,environmental,and socialperformanceoforganizations.These reportsare produced by companies to enhance and reinforcetransparencyandaccountabilityintheorganizationandtoassesstheirCSRandenvironmentalpractices.
b) Leave the Change for Them (Within Panda’s CSR Programs)Pandacontinued its strategy to support thecommunitythorough various strategic initiatives such as “Leavethe Change for Them”, “Panda Caravan”, and “EidClothingDonation”.Inaddition,Pandarecentlyadoptednew strategic projects such as “Panda-Friend of theEnvironment” and many other socially responsiblestrategicprojects.
“LeavetheChangeforThem”whichfirststartedin2006to support a number of charities such as theDisabledChildrenAssociationsuccessfullyraisedSAR6.7millionin 2012. In addition, Panda continues its strategy ofdeveloping its human resources by offering extensivetrainingprogramswhichhelpedtoraise itsSaudisationlevels to 39% in 2012 as well as to win the awardfor “BestWorking Environment inKSA” sponsoredbyAleqtisadiahNewspaper.
Panda’sExecutiveManagementteamandDisabledChildrenAssociation’steamduringtheoccassionofhandingoverthecollectionfromthe“LeaveTheChangeForThem”campaign.

The Savola Group Annual Report, 2012
59
c) Saudi Injaz Entrepreneurs Project: Injaz-SaudiArabia is amember nation of JuniorAchievementsWorldwide.This is theworld’s largest non-profitorganizationdedicatedtoeducatingstudentsandpreparingthemfortheworkplace.Itrunshands-onprogramsintheareasof:Entrepreneurship,FinancialLiteracy,andWorkforceReadinessaimingtoprepareelementary,middleschool,highschoolanduniversitystudentstodealwithbusinessdemandsthroughdevelopingtheirpersonalandpracticalskillsby training theminworkshops ledbyprivatesectorvolunteers. Injaz-SaudiArabia’smission isdedicated toinspire and prepare Saudi youth to succeed in a global, knowledge based economywith a vision of deliveringpioneering,hands-onprogramsto250,000maleandfemaleSaudistudentsKingdom-wideby2018,inpartnershipwiththebusinesscommunity,Ministries,educatorsandvolunteers.TheGroupisoneofthelargestsupportersoftheInjazprogram,andanumberofSavolansvolunteeredtoparticipateinInjazcampaignsin2012,spendinganaverage
of1,123volunteerhourstotrain1,727students.
d) Other BridgesTheGroupcontinuedtosponsorMILEincollaborationwithAl-MadinaKnowledgeEconomicCityCo.(KEC).MILEaimstodevelopseniormanagementresourcesinSaudiArabia,aswellasinotherArabandMuslimcountries.AlsotheGroupsupportedanumberofcommunitygroups suchasZamzamAssociation forvoluntaryhealth services,CapabilitiesChildhoodPrograms(CAP),JeddahAutismCenter(Al-FaysaliyahAssociation),Al-BirrAssociationJeddah,JeddahCenterforSpeechandHearing,andmanyotherbridges.

The Savola Group Annual Report, 2012
60
8) Governance & Transparency Report

The Savola Group Annual Report, 2012
61
8) Governance and Transparency Report:As part of the Group’s commitment to enhance bothTransparency and Corporate Communication with itsshareholdersandthepublic,theGroupcontinuedduringtheyear2012toimplementandcomplywithCorporateGovernance regulations issued by the CMA and otherrelevant regulations. The Board is pleased thereforeto disclose, in addition to theGroup’s results, Sectors’performance,HR,ITandCSRperformance,thefollowinginformation,aspartoftheGroup’scompliancewithCGguidelines:
a) Shareholders’ Rights and Communication
The Group pays special attention to the rights ofshareholders and investors by including such rights inthe Group’s Articles of Association and its CorporateGovernanceManual,whichwasdevelopedin2004andhas since been continually refined. These documentsoutlineshareholders’Rights,asdetailedintheapplicablerules and regulations, and which can be reviewed onSavola’s website (www.savola.com). The Companypublishesfinancialandnon-financial reportsandotherdataon theTadawulwebsite, in thedailynewspapers,the Annual Directors report, and in Savola’s quarterlynewsletter(SavolaNewsletter)whichareissuedinbothArabic and English languages, and are distributed to awide rangeof people as an insert in oneof the localnewspapers, it is also communicated electronicallyvia email tomany investors and also can be accessedthrough Savola’s website. A dedicated department tomanageanddealwithshareholders’affairshasbeeninexistencesincetheGroupsfoundation.
a-1) Company Dividends Policy
The Company’s Articles of Association, article # (43),dealingwithDividendsPolicy,authorizes:
1.Allocating10%ofnetprofitstostatutoryreserves.TheGeneralAssemblymeetingisauthorizedtomaintainthis allocation until the reserve is equal to half theCompany’scapital.
2.Oftheremainingnetprofits,afirstpaymentat5.0%ofpaidupcapitalisdistributedtoshareholders.
3.7.5%ofthebalanceisallocatedasremunerationformembersoftheBoardofDirectors.
4.Thebalancecouldthenbedistributedtoshareholdersasadditionaldividends.
In linewith theabovepolicy, andbasedon theBoardof Directors recommendations, the Group distributedquarterly cash dividends to shareholders during 2012amounting to SAR700million at a rate of 1.40 SaudiRiyalspershare,whichrepresents14%oftheCompanysharecapital (nominalvalue).TheGroupwillcontinueto apply its Dividends Distribution Policy in 2013and declare dividends on a quarterly basis.The Boardof Directors specifies the date of entitlement to suchdividends, announced through “Tadawul”Website andlocalnewspapersinaccordancewiththeregulations.
For the Board members’ annual remuneration, this isstipulated in thecompany’sArticlesofAssociationandmentioned above in the Dividends Policy, the GroupcomplieswithMinisterialResolutionNo1071dated1412AH,specifyingaceilingnotexceedingSAR200,000foreachBoardMemberasannualremuneration.
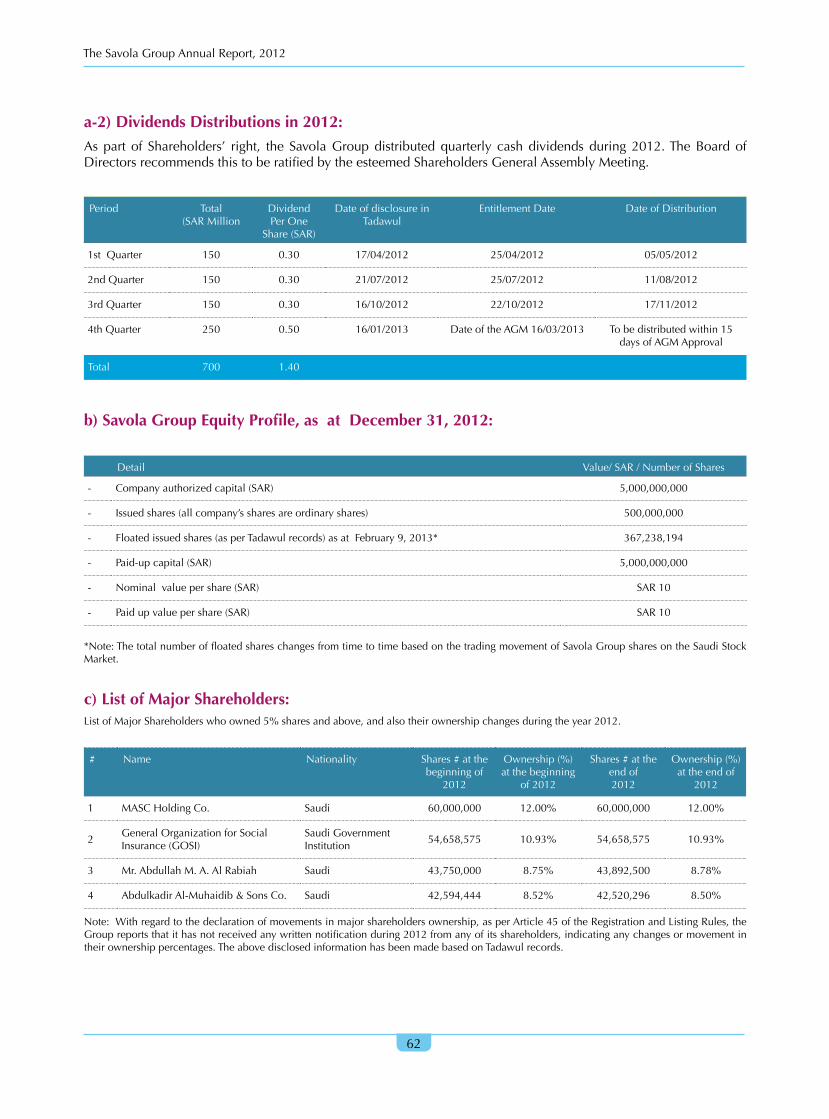
The Savola Group Annual Report, 2012
62
a-2) Dividends Distributions in 2012:Aspart of Shareholders’ right, the SavolaGroupdistributedquarterly cashdividendsduring2012.TheBoardofDirectorsrecommendsthistoberatifiedbytheesteemedShareholdersGeneralAssemblyMeeting.
Period Total(SARMillion
DividendPerOne
Share(SAR)
DateofdisclosureinTadawul
EntitlementDate DateofDistribution
1stQuarter 150 0.30 17/04/2012 25/04/2012 05/05/2012
2ndQuarter 150 0.30 21/07/2012 25/07/2012 11/08/2012
3rdQuarter 150 0.30 16/10/2012 22/10/2012 17/11/2012
4thQuarter 250 0.50 16/01/2013 DateoftheAGM16/03/2013 Tobedistributedwithin15daysofAGMApproval
Total 700 1.40
b) Savola Group Equity Profile, as at December 31, 2012:
Detail Value/SAR/NumberofShares
- Companyauthorizedcapital(SAR) 5,000,000,000
- Issuedshares(allcompany’ssharesareordinaryshares) 500,000,000
- Floatedissuedshares(asperTadawulrecords)asatFebruary9,2013* 367,238,194
- Paid-upcapital(SAR) 5,000,000,000
- Nominalvaluepershare(SAR) SAR10
- Paidupvaluepershare(SAR) SAR10
*Note:ThetotalnumberoffloatedshareschangesfromtimetotimebasedonthetradingmovementofSavolaGroupsharesontheSaudiStockMarket.
c) List of Major Shareholders: ListofMajorShareholderswhoowned5%sharesandabove,andalsotheirownershipchangesduringtheyear2012.
# Name Nationality Shares#atthebeginningof
2012
Ownership(%)atthebeginning
of2012
Shares#attheendof2012
Ownership(%)attheendof
2012
1 MASCHoldingCo. Saudi 60,000,000 12.00% 60,000,000 12.00%
2GeneralOrganizationforSocialInsurance(GOSI)
SaudiGovernmentInstitution
54,658,575 10.93% 54,658,575 10.93%
3 Mr.AbdullahM.A.AlRabiah Saudi 43,750,000 8.75% 43,892,500 8.78%
4 AbdulkadirAl-Muhaidib&SonsCo. Saudi 42,594,444 8.52% 42,520,296 8.50%
Note:Withregardtothedeclarationofmovementsinmajorshareholdersownership,asperArticle45oftheRegistrationandListingRules,theGroupreportsthatithasnotreceivedanywrittennotificationduring2012fromanyofitsshareholders,indicatinganychangesormovementintheirownershippercentages.TheabovedisclosedinformationhasbeenmadebasedonTadawulrecords.

The Savola Group Annual Report, 2012
63
d) Expected Dates of Key Events for Shareholders for the Fiscal Year of 2013:
# Dates,2013 KeyEventsfor2013 Notes
1. February13 BoardofDirectorsMeeting. Toapprovethefinancialresultsfortheyear2012andthedividendsbased on the Audit Committee recommendation, and call theShareholdersforAGM.
2. February19 AnnualConferencefortheSavolaExecutivesandManagers.
ToreviewSavola’sperformance for theyear2012andstrategies for2013.
3. March16 SuggestedscheduleforAGMtobeapproved. FirsttobeannouncedinTadawul,uploadedontheCompany’swebsiteandpublishedinthedailynewspapers.
FirstQuarterEvents,2013
4. April17 BoardofDirectors'meeting(Firstquarter). Toapprovethefinancialresultsforthefirstquarterof2013andthedividendsbasedontheAuditCommitteerecommendation.
5. April17-21 Publishingfinancialresultsforthefirstquarter. FirsttobeannouncedinTadawul,uploadedontheCompany’swebsiteandpublishedinthedailynewspapers.
6. April17-21 Announce the Board’s decision for first quarterdividendstoshareholders.
Dividends payment made within 15 days from the maturity datementionedinTadawulannouncement.
7. April 21 toMay6
IssueSavolaNewsletter(Arabic/Englishversion)forthefirstquarter.
The newsletter incudes full coverage of Company’s & Sectors’performance for the quarter. It is expected to be published anddistributed as anAppendix with one of the daily newspapers andplacedontheSavolawebsite.Itisalsocommunicatedviae-mailtoalargenumberofinvestors.
SecondQuarterEvents,2013
8. July16 BoardofDirectors'meeting(secondquarter). Toapprovethefinancialresultsforthesecondquarter2013andthedividendsbasedontheAuditCommitteerecommendation.
9. July16-20 Publishingfinancialresultsforthesecondquarter. Seeitem(5)inthecolumn’snotes.
10. July16-20 AnnouncetheBoarddecisionforsecondquarterdividendstotheshareholders.
Seeitem(6)inthecolumn’snotes.
11. July 20 toAugust5
IssueSavolaNewsletter(Arabic/Englishversion)forthesecondquarter.
Seeitem(7)inthecolumn’snotes.
ThirdQuarterEvents,2013
12. October 23-28
Publishingfinancialresultsforthethirdquarter. Seeitem(5)inthecolumn’snotes.
13. October 23-28
AnnouncetheBoard’sdecisionforthethirdquarterdividendstotheshareholders.
Seeitem(6)inthecolumn’snotes.
14. October30-November10
IssueSavolaNewsletterforthethirdquarter(Arabic/Englishversion).
Seeitem(7)inthecolumn’snotes.
FourthQuarterEvents,2013
15. December11 BoardofDirectors'meeting(toapprovetheBusinessPlanandBudgetfor2014).
Toapproveplan&budgetfor2014.
Note:Somedatesaboveareapproximateandmaychangeaccordingtonotificationsreceivedfromofficialauthorities.
The Savola Group Annual Report, 2012
64
e) Disclosures Related to Board of Directors and Executive Management:Themain role and responsibilities of the Board are to establish overall corporate strategies, plans, policies andfinancialobjectivesandensuretheeffectivenessofinternalcontrolsacrosstheGroup.TheBoardapprovesfinancialprovisionsandbudgets,oversees,andmonitorstheperformanceoftheGroupandensurespropermechanismstomanagerisks.TheBoardprotectstheinterestsoftheshareholdersandotherrelevantpartiesbyensuringcompliancewithallapplicablerulesandregulations.TheGroupfollowsallrequirementsstipulatedbytheCompany’sArticlesofAssociation,itsCorporateGovernanceCodeandotherinternalpolicies.ThedetailedroleoftheBoardhasbeenarticulatedintheCompany’sArticlesofAssociationandCorporateGovernanceManual,whichareavailableontheCompany’swebsite(www.savola.com).
e-1) Board Composition, Qualifications and other Joint Stock Companies' Board Memberships:
Article (16)of theSavolaGroupCompany’sArticlesofAssociation, states that,TheBoardofDirectorscomprises11members,whichcomplieswithparagraph (a),Article (12)of theCorporateGovernanceRegulation issuedbyCapitalMarketAuthority.TheGroupBoardMemberswereelectedforthenewcycle,whichcommencedonJuly1st,2010andwillcontinueforthreeyearsendingonJune30th,2013.AllareNon-executivesandIndependentwiththeexceptionoftheGroupManagingDirector.Thetablebelowalsoincludesdetailsofotherjoint-stockcompanieswhereSavolaDirectorscurrentlyholdBoardpositions:
# MemberName Membership
Classification
Qualifications CompaniesMembership(Listed&Unlisted)whereSavolaDirectorscurrentlyholdBoardMembership(ExcludingSavolaGroup)Memberships
1 Mr.SulaimanA.K.
Al-Muhaidib
(ChairmanoftheBoard)
Non-Executive SecondClass,FacultyofMedicines(1985).
Hehasextensiveexperienceinthefield
ofBusinessandContracting,heisalsothe
ChairmanoftheBoardofDirectorsofAl-
MuhaidibHoldingGroup.
Listed:AlmaraiCo.,ArabianPipeLine
Co.,SaudiBritishBank.TheNational
IndustrializationCompany.
Unlisted:A.AbdulgadirAlMuhaidib&Sons
Co.,TatwearAlAoulaCo.,JoussourSwicorp
Co.,InternationalCo.forWaterandPower
Developments.TheMiddleEastCo.for
PaperIndustry.
2 H.E.Eng.Abdullah
MohammedNoorRehaimi
ViceChairman
(RepresentingPublic
InvestmentsFund)
Non-Executive BachelorofMechanicalEngineering,King
FahadUniversityofPetroleumandMinerals
SciencesinDhahran,SaudiArabia(1975).
HeisaformerPresidentoftheGeneral
AuthorityofCivilAviation.
Listed:ALujainCo..
3. Dr.AbdulraoufM.Mannaa
(ManagingDirector)
Executive Ph.DUniversityofWashington,Seattle,USA(1982).
M.Eng.UniversityofCalifornia,Berkeley,USA
M.ScUniversityofCalifornia,Berkeley,USA(1976)
B.Sc.UniversityofPetroleumandMinerals,KSA.(1973)
Listed:AlmaraiCo.,SaudiInvestmentBank,HerfyFoodServicesCo.,KnowledgeEconomicCityCo..
Unlisted:KinanforRealEstateDevelopment,Al-AzizyahUnitedCompany“Panda”,RepresentingSavolaGroup.
GeneralOrganizationforSocialInsurance(“GOSI”).

The Savola Group Annual Report, 2012
65
# MemberName Membership
Classification
Qualifications CompaniesMembership(Listed&Unlisted)whereSavolaDirectorscurrentlyholdBoardMembership(ExcludingSavolaGroup)Memberships
4. Mr.IbrahimM.AlIssa Non-Executive BachelorofBusinessAdministration,
ChapmanUniversity,California,USA.
(1974).
Listed:YanbuCementCo,TaibahHolding
Group,SaudiFransiBank,andAlmaraiCo.
5. Dr.SamiM.Baroum Non-Executive Ph.D.inOperationsManagementandMIS
fromIndianaUniversity(1992);MBAwith
distinctionfromtheWhartonSchoolof
Business,UniversityofPennsylvania(1985).
Listed:KnowledgeEconomicCityCo.Herfy
FoodServicesCo.
Unlisted:Al-AziziaPandaUnitedCo.
representingtheSavolaGroup,TadawulCo.
JeddahInternationalCollege.
6. Mr.AbdulazizK.Al
Ghufaily(representing
GeneralOrganizationfor
SocialInsurance)(GOSI)
Non-Executive MasterofEconomics,USA(1990);Bachelor
ofEconomics,KingSaudUniversity(1981).
Listed:AlRajhiBank,HerfyFoodsServices
Co.
7. Mr.MousaO.AlOmran Non-Executive MasterofBusinessAdministration,Saint
Edward(1994);andBachelorofIndustrial
Engineering-KingSaudUniversity(1990),
DiplomaofAmericanInstitute(AIB),USA.
Listed:AlmaraiCo.,SaudiFransiBank.
Unlisted:Al-AziziaPandaUnitedCompany,
representingSavolaGroup.
8. Mr.AmmarA.AlKhudairy Independent MasterofEngineeringAdministration,
GeorgeWashingtonUniversity(1984),
USA,BachelorofEngineering,George
WashingtonUniversity,USA.(1984).
Listed:AlTayyarGroupforTravel&Tourism,
AlDeraaAl-ArabiCo.forcooperative
insurance,MobileTelecommunications
Company(“Zain“).
Unlisted:MorganStanleyCo.
9. Dr.GhassanAhmed.Al
Sulaiman
Independent Ph.D.inStrategicManagement,University
ofHull,U.K.(2004);MasterofBusiness
Administration(HonorDegree),University
ofSanFrancisco,USA(1980);Bachelorof
ScienceinBusinessAdministration,Menlo
College,California,USA,(1978).
Listed:ArabianCementCo.
Unlisted:Al-MagrabiGroupofHospitals,
OniazahforInvestments,SaudiVenture
CapitalInvestmentsCo.
10. Mr.MohammadA.AlFadl Independent BachelorofEconomicsandMarketing
Sciences,UniversityofSanFranciscoUSA,
(1977).
Listed:none.
Unlisted:JeddahHoldingCo.,DarAL
Tamlik,KinanInternationalCo.
11. Mr.BadrAbdullahAl-Issa Independent MasterofBusinessAdministration,Rice
University,USA(2006);BachelorofArts
inEconomics,UniversityofVirginia,USA
(2001).CertifiedFinancialAnalyst(CFA).
Listed:TheSaudiHotels&ResortAreasCo.
Unlisted:AlQeeqRealEstate
DevelopmentCo.,AseelahInvestmentsCo.,
andSaudiFransiCapital.
*FormoredetailsontheBoardmembers,theirC.Vs.andexperience,pleasevisittheGroupWebsite:www.savola.com.TheabovetableconfirmsthatnomemberoftheBoardofDirectorsoftheGrouphasmembershipinmorethanfivepubliclylistedcompanyBoardsatthesametime.
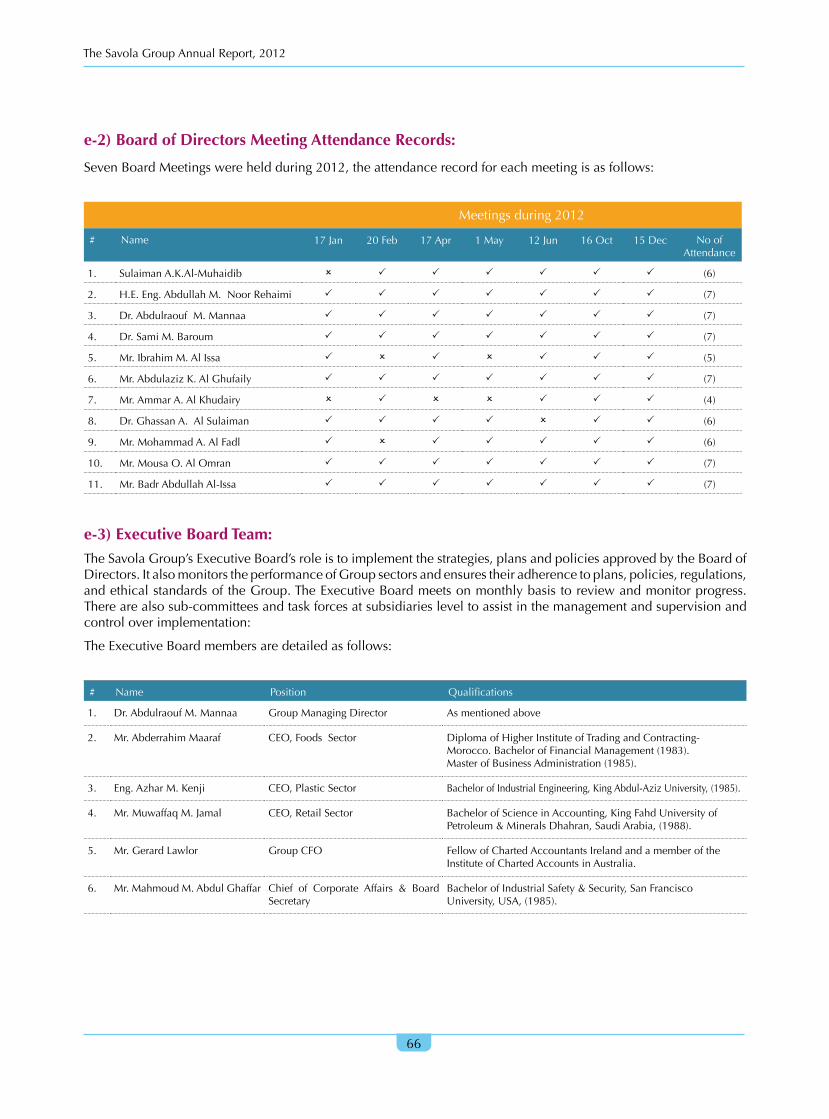
The Savola Group Annual Report, 2012
66
e-2) Board of Directors Meeting Attendance Records:
SevenBoardMeetingswereheldduring2012,theattendancerecordforeachmeetingisasfollows:
Meetingsduring2012
# Name 17Jan 20Feb 17Apr 1May 12Jun 16Oct 15Dec NoofAttendance
1. SulaimanA.K.Al-Muhaidib O P P P P P P (6)
2. H.E.Eng.AbdullahM.NoorRehaimi P P P P P P P (7)
3. Dr.AbdulraoufM.Mannaa P P P P P P P (7)
4. Dr.SamiM.Baroum P P P P P P P (7)
5. Mr.IbrahimM.AlIssa P O P O P P P (5)
6. Mr.AbdulazizK.AlGhufaily P P P P P P P (7)
7. Mr.AmmarA.AlKhudairy O P O O P P P (4)
8. Dr.GhassanA.AlSulaiman P P P P O P P (6)
9. Mr.MohammadA.AlFadl P O P P P P P (6)
10. Mr.MousaO.AlOmran P P P P P P P (7)
11. Mr.BadrAbdullahAl-Issa P P P P P P P (7)
e-3) Executive Board Team:TheSavolaGroup’sExecutiveBoard’sroleistoimplementthestrategies,plansandpoliciesapprovedbytheBoardofDirectors.ItalsomonitorstheperformanceofGroupsectorsandensurestheiradherencetoplans,policies,regulations,andethicalstandardsoftheGroup.TheExecutiveBoardmeetsonmonthlybasistoreviewandmonitorprogress.Therearealsosub-committeesandtaskforcesatsubsidiariesleveltoassistinthemanagementandsupervisionandcontroloverimplementation:
TheExecutiveBoardmembersaredetailedasfollows:
# Name Position Qualifications
1. Dr.AbdulraoufM.Mannaa GroupManagingDirector Asmentionedabove
2. Mr.AbderrahimMaaraf CEO,FoodsSector DiplomaofHigherInstituteofTradingandContracting-Morocco.BachelorofFinancialManagement(1983).MasterofBusinessAdministration(1985).
3. Eng.AzharM.Kenji CEO,PlasticSector BachelorofIndustrialEngineering,KingAbdul-AzizUniversity,(1985).
4. Mr.MuwaffaqM.Jamal CEO,RetailSector BachelorofScienceinAccounting,KingFahdUniversityofPetroleum&MineralsDhahran,SaudiArabia,(1988).
5. Mr.GerardLawlor GroupCFO FellowofChartedAccountantsIrelandandamemberoftheInstituteofChartedAccountsinAustralia.
6. Mr.MahmoudM.AbdulGhaffar Chief of Corporate Affairs & BoardSecretary
BachelorofIndustrialSafety&Security,SanFranciscoUniversity,USA,(1985).

The Savola Group Annual Report, 2012
67
e-4) Board of Directors and Senior Executive Remuneration:TheGrouppaysannualremuneration,meetingsattendancefees,andotherexpensesforitsBoardsandsub-committeemembersbasedontherulesandregulationsstipulatedbytheMinistryofCommerce&IndustryandinaccordancewiththeGroupArticleofAssociationandtheGroup’sCorporateGovernanceManual,whichtheBoardrecommendstoberatifiedbytheesteemedAGMasdetailedbelow.Italsopayssalariesandbenefitstoitsexecutivesbasedonthecontractssignedbythem.SummariesofthecompensationandbenefitspaidtoBoardMembersandSeniorExecutivesduring2012areasfollows:
e-4-1) Board Members’ Remuneration for 2012, (Saudi Riyals):
# NameofBoardmember Board&CommitteesMeetingsattendancefees&otherallowances
SAR
AnnualRemuneration
SAR
Total
SAR
1. Mr.SulaimanA.K.Al-Muhaidib(Chairman) 43,040 200,000 243,040
2. Eng.AbdullahM.NoorRehaimi(ViceChairman)* 65,000 200,000 265,000
3. Dr.AbdulraoufM.Mannaa(ManagingDirector) 80,000 200,000 280,000
4. Dr.SamiM.Baroum 45,000 200,000 245,000
5. Mr.IbrahimM.AlIssa 25,000 200,000 225,000
6. Mr.AbdulazizK.AlGhufaily 91,300 200,000 291,300
7. Mr.AmmarA.AlKhudairy 60,060 200,000 260,060
8. Dr.GhassanA.AlSulaiman 63,530 200,000 263,530
9. Mr.MohammadA.AlFadl 43,530 200,000 243,530
10. Mr.MousaO.AlOmran 43,530 200,000 243,530
11. Mr.BadrAbdullahAl-Issa 114,528 200,000 314,528
Total 674,518 2,200,000 2,874,518
e-4-2) Senior Executive compensation for 2012 (Saudi Riyals): # Description GroupManagingDirector
(Dr.AbdulraoufM.MannaaasCEO)SAR
OtherExecutivesintheGroup(5membersincludingtheCFO)
SAR
1. Salaries 3,000,000 5,828,000
2. Allowances 1,120,460 2,237,337
3. ExceptionalRemuneration 0 430,300
4. RegularandAnnualRemuneration 13,718,858 4,947,500
Total 17,839,318 13,443,137
*Note:TheamountmentionedintheaboveTable(e-4-2)representstheannualremunerationfortheGroupManagingDirectorpaidtohiminhiscapacityasGroup’sCEOaccordingtothecontractsignedwithhiminthisconnection.TheCEOperformancebonusiscalculatedbasedoncertainagreedcriteriaandKPIsasperthecontract.ThisamountdoesnotincludetheremunerationpaidtotheCEOinhiscapacityasaBoardMember,whichwasdetailedinTable#(e4-1).

The Savola Group Annual Report, 2012
68
f) Board of Directors Committees:TheSavolaGroupBoardhasfivesub-committees,themembershipofwhichcomprisesofBoardMembers,ExternalIndependent Specialists, andSavola Senior Executives, theseCommitteeshave special charters, approvedby theGroupBoard,togoverntheirscopeofworkandrelatedprocedures,theseCommitteesarefollows:
f-1) Audit Committee:
TheGroup’sAuditCommittee (theCommittee) consists of fourNon-executiveMembers, including specialists infinancialandaccountingaffairs.During2012,theCommitteeheldfivemeetingswiththeprimaryobjectiveofassistingtheBoardofDirectors(BoD)infulfillingitsoversightresponsibilitiesasdefinedbylawsandregulations.Duringthesemeetings,theCommitteemonitoredtheGroup’sexternalandinternalauditactivitiestoobtainreasonableassuranceregardingtheeffectivenessof internalcontrolprocedures, thereliabilityoffinancialreportsandcompliancewithapplicablelawsandregulations.ThefollowingsummarizestheCommitteeMembers’names,rolesandnumberofmeetingsattendedduringtheyear:
Meetingsheldduring2012
NameofCommitteeMember Position(1)
17Jan.(2)
20Feb.(3)
17Apr.(4)
18July(5)
16Oct.Total
1.Mr.AbdulazizK.AlGhufaily(SavolaGroupBoDMember)
Chairman P P P P P 5
2.Mr.BaderAbdullahAl-Issa(SavolaGroupBoDMember)
Member P P P P P 5
3.Dr.MuhammedAliIkhwan(IndependentExternalMember)
Member P P P P P 5
4.Mr.BandarSaeedOmarAl-Esayi(IndependentExternalMember)
Member P P × P P 4
5.MahmoudM.AbdulGhaffar(ChiefofCorporateAffairs&BoardSecretary)
CommitteeSecretary
P P P P P 5
MainDuties&Responsibilities
TheCommittees’maindutiesandresponsibilities includeoversightof : (1)Theintegrityof theGroup’sfinancialstatements, (2)The appointment, remuneration, qualifications, independence and performance of the ExternalAuditorsandtheintegrityoftheauditprocessasawhole,(3)Theeffectivenessofthesystemsofinternalcontrolandadequacyofriskmanagementframework,(4)TheperformanceandleadershipoftheInternalAuditfunction,(5)TheGroup’scompliancewithapplicablelawsandregulations.Inadditiontothoseexpresslysetforthherein,theCommitteehassuchotherdutiesandresponsibilitiesasarerequiredbytherulesandregulationsoftheCapitalMarketAuthorityintheKingdomofSaudiArabia.
The Committee’s remuneration:TheannualpaymentstotheMembersoftheCommitteeamountedtoSAR198,000,outofwhichSAR100,000representsannualremunerationandSAR98,000representsmeetingattendancefeesandtravelexpenses.(TheGroup’spolicyisthatmembersoftheCommitteewhoarealsomembersoftheGroup’sBoDdonotreceiveannualremunerationfortheirmembershipoftheCommittee,butratherattendancefeesonly).
As part of the Committee main duties and responsibilities, the Committee recommended to the BoD the re-appointmentofPricewaterhouseCoopers(PwC)astheGroup’sExternalAuditorsforafeeofSAR210,000toreviewthequarterlyaccountsandaudit theyearlyaccountsof theSavolaGroup for2012.TheCommitteereviews theGroup’saccountswith theExternalAuditorsandrecommendedto theBoDthedistributionofprofitsduring theyear.TheCommitteealsoreviewstheGroup’sannualfinancialstatements,clarificationnotesandExternalAuditor’sIndependentReport,toensurethattheaccountingpoliciesappliedbytheGroupinthepreparationofitsfinancialstatementsareinaccordancewiththestandardsissuedbytheSaudiOrganizationforCertifiedPublicAccountants(SOCPA).PwCattendsallmeetingsoftheCommittee.Ateachmeeting,PwCreportsonthefindingsofitsauditand/orinterimreviewwork.TheHeadoftheInternalAudit&RiskManagementfunctionformallypresentstotheCommitteetheresultsoftheInternalAudit&RiskManagementactivitiesduringtheyearonaregularbasis.

The Savola Group Annual Report, 2012
69
The Annual Review of the effectiveness of internal control procedures of the Group is based on the following procedures:
• TheExecutiveManagementoftheGroupanditssubsidiariescertifiesonanannualbasistheirresponsibilityforestablishingandmaintaininginternalcontrolproceduresdesignedtoprovidereasonableassuranceregardingtheeffectivenessandefficiencyofoperations, thereliabilityoffinancial reportingandcompliancewithapplicablelawsandregulations.
• TheInternalAudit&RiskManagementfunctionattheGroupanditssubsidiariesexecutetheAnnualAuditPlanapprovedbytheCommittee toevaluate theexistingconditionof internalcontrolprocedures throughselectingrandomlyasamplewith theobjectiveof testing theeffectivenessandefficiencyof internalcontrolproceduresoperatingduringtheyear.
Basedon theresultsof theAnnualReviewof internalcontrolproceduresselected for testingduring2012by theCommitteeandtheGroup’sInternalAudit&RiskManagementfunction,nothingcametotheCommittee’sattentionthat caused them to believe that there is a need to disclose any significant deficiency in the internal controlproceduresestablishedby theGroupand its subsidiaries’ ExecutiveManagement. However,weemphasize thatduetothegeographicalspreadoftheGroup'soperationslocallyandregionallywecannotconcludeexclusivelyonthecomprehensivenessoftheinternalcontrolproceduresreviewperformedbecausetheinternalauditactivities,insubstance,relyonselectingrandomsamplesasabovementioned.Accordingly,theCommittee’seffortsarefocusedcontinuously to develop and improve the effectiveness and efficiency of the internal control procedures reviewmechanismthatareinplace.
f-2) Compensation, Nominations & Corporate Governance Committee:
The committee consists of four members, three Non-executive Members and one Independent Member. TheCommitteeheldonlyonemeetingduring2012,and the listofmembers,attendance recordsand the roleof the
Committeearesummarizedbelow:
MeetingDateduring2012
# Name Position 19thNovember NumberofMeetings
1. Dr.GhassanA.AlSulaiman Chairman P 1
2. H.E.Eng.AbdullahMohammedNoorRehaimi Member P 1
3. Mr.MousaO.AlOmran Member O -
4. Mr.MohammadA.AlFadl Member P 1
5. Mr.MahmoudM.AbdulGhaffar CommitteeSecretary P 1
MainRoles&Responsibilities
TorecommendtotheBoardofDirectors’themembershipappointmentsforBoard,sub-BoardandCommitteesinaccordancewith theGrouprequiredstandards.ToconductanAnnualReviewof thesuitableskills required forBoardMembership, prepare a description of the capabilities and qualifications required for suchmembership.To review the structure of the Board and determine areas of strength andweakness in the Board ofDirectorsperformanceandrecommendchanges.Inaddition,theCommitteedrawsclearpoliciesregardingtheindemnities,remunerationsandsuccessionplanoftheBoardMembersandtopexecutivestoensurethatsuchpoliciesmeettheGroup’sperformancestandards.Inaddition,theCommitteefollowsuptheimplementationofthesepoliciesandensuresBoardindependenceonannualbasis.Also,theCommitteeisresponsibleforcompliancewithCorporateGovernanceregulationsandinvestigationandsettlementsofgrievancescasesofemployees.
The Committee Remuneration:MembersreceivedtheamountofSAR15,000,whichrepresentsmeetingattendancefees for themeeting held during the year, (TheGroup policy is thatMembers of theCommitteewho are alsoMembersof theGroupBoarddonotreceiveannualremunerations for theirmembershipof theCommittee,butratherattendancefeesonly).
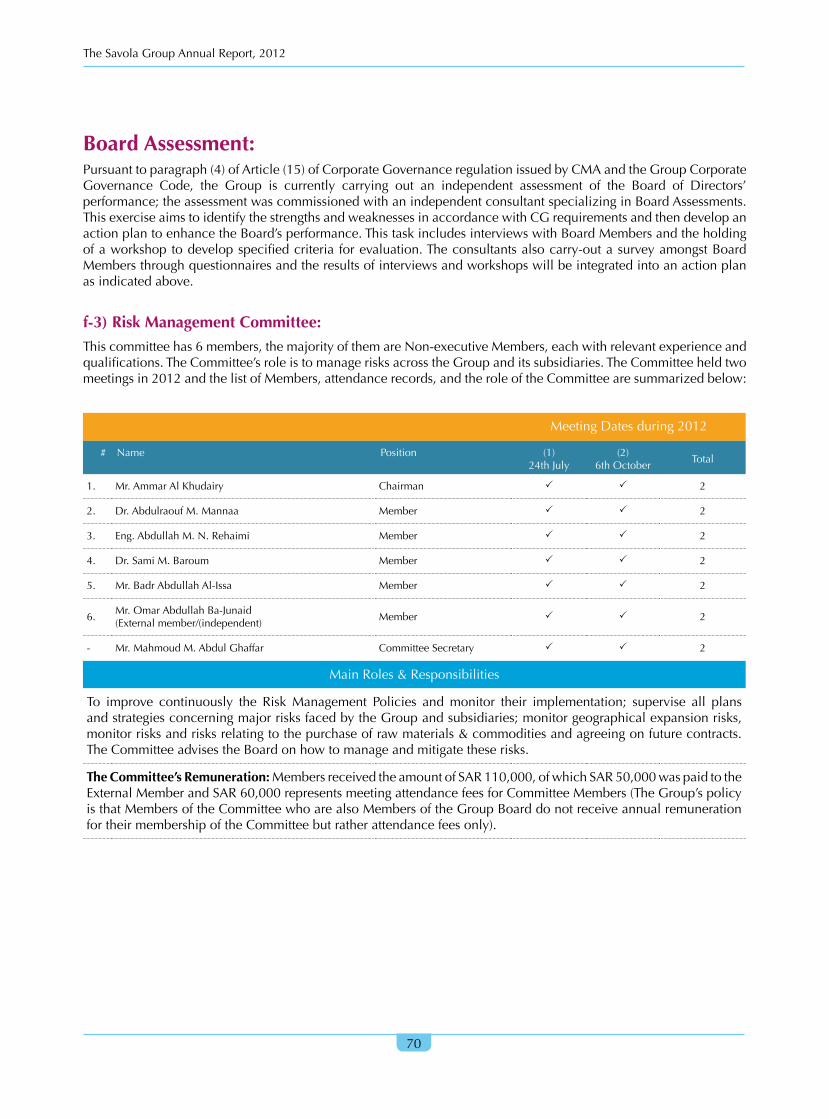
The Savola Group Annual Report, 2012
70
Board Assessment: Pursuanttoparagraph(4)ofArticle(15)ofCorporateGovernanceregulationissuedbyCMAandtheGroupCorporateGovernance Code, the Group is currently carrying out an independent assessment of the Board of Directors’performance;theassessmentwascommissionedwithanindependentconsultantspecializinginBoardAssessments.ThisexerciseaimstoidentifythestrengthsandweaknessesinaccordancewithCGrequirementsandthendevelopanactionplantoenhancetheBoard’sperformance.ThistaskincludesinterviewswithBoardMembersandtheholdingofaworkshoptodevelopspecifiedcriteriaforevaluation.Theconsultantsalsocarry-outasurveyamongstBoardMembersthroughquestionnairesandtheresultsofinterviewsandworkshopswillbeintegratedintoanactionplanasindicatedabove.
f-3) Risk Management Committee:Thiscommitteehas6members,themajorityofthemareNon-executiveMembers,eachwithrelevantexperienceandqualifications.TheCommittee’sroleistomanagerisksacrosstheGroupanditssubsidiaries.TheCommitteeheldtwomeetingsin2012andthelistofMembers,attendancerecords,andtheroleoftheCommitteearesummarizedbelow:
MeetingDatesduring2012
# Name Position (1)24thJuly
(2)6thOctober
Total
1. Mr.AmmarAlKhudairy Chairman P P 2
2. Dr.AbdulraoufM.Mannaa Member P P 2
3. Eng.AbdullahM.N.Rehaimi Member P P 2
4. Dr.SamiM.Baroum Member P P 2
5. Mr.BadrAbdullahAl-Issa Member P P 2
6.Mr.OmarAbdullahBa-Junaid(Externalmember/(independent)
Member P P 2
- Mr.MahmoudM.AbdulGhaffar CommitteeSecretary P P 2
MainRoles&Responsibilities
To improve continuously the RiskManagement Policies andmonitor their implementation; supervise all plansandstrategiesconcerningmajorrisksfacedbytheGroupandsubsidiaries;monitorgeographicalexpansionrisks,monitorrisksandrisksrelatingtothepurchaseofrawmaterials&commoditiesandagreeingonfuturecontracts.TheCommitteeadvisestheBoardonhowtomanageandmitigatetheserisks.
The Committee’s Remuneration:MembersreceivedtheamountofSAR110,000,ofwhichSAR50,000waspaidtotheExternalMemberandSAR60,000representsmeetingattendancefeesforCommitteeMembers(TheGroup’spolicyisthatMembersoftheCommitteewhoarealsoMembersoftheGroupBoarddonotreceiveannualremunerationfortheirmembershipoftheCommitteebutratherattendancefeesonly).
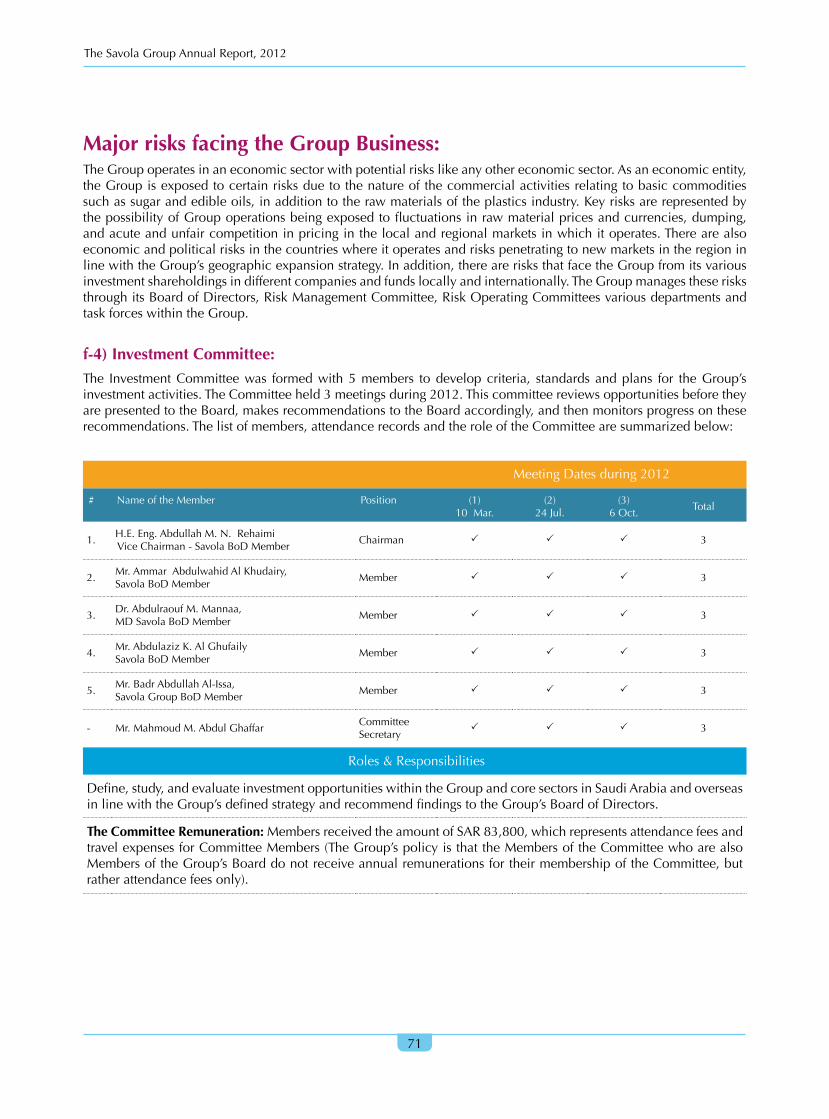
The Savola Group Annual Report, 2012
71
Major risks facing the Group Business: TheGroupoperatesinaneconomicsectorwithpotentialriskslikeanyothereconomicsector.Asaneconomicentity,theGroupisexposedtocertainrisksduetothenatureofthecommercialactivitiesrelatingtobasiccommoditiessuchassugarandedibleoils,inadditiontotherawmaterialsoftheplasticsindustry.KeyrisksarerepresentedbythepossibilityofGroupoperationsbeingexposedtofluctuationsinrawmaterialpricesandcurrencies,dumping,andacuteandunfaircompetitioninpricinginthelocalandregionalmarketsinwhichitoperates.TherearealsoeconomicandpoliticalrisksinthecountrieswhereitoperatesandriskspenetratingtonewmarketsintheregioninlinewiththeGroup’sgeographicexpansionstrategy.Inaddition,therearerisksthatfacetheGroupfromitsvariousinvestmentshareholdingsindifferentcompaniesandfundslocallyandinternationally.TheGroupmanagestheserisksthroughitsBoardofDirectors,RiskManagementCommittee,RiskOperatingCommitteesvariousdepartmentsandtaskforceswithintheGroup.
f-4) Investment Committee: The InvestmentCommitteewas formedwith5members todevelopcriteria, standards andplans for theGroup’sinvestmentactivities.TheCommitteeheld3meetingsduring2012.ThiscommitteereviewsopportunitiesbeforetheyarepresentedtotheBoard,makesrecommendationstotheBoardaccordingly,andthenmonitorsprogressontheserecommendations.Thelistofmembers,attendancerecordsandtheroleoftheCommitteearesummarizedbelow:
MeetingDatesduring2012
# NameoftheMember Position (1)10Mar.
(2)24Jul.
(3)6Oct.
Total
1.H.E.Eng.AbdullahM.N.RehaimiViceChairman-SavolaBoDMember
Chairman P P P 3
2.Mr.AmmarAbdulwahidAlKhudairy,SavolaBoDMember
Member P P P 3
3.Dr.AbdulraoufM.Mannaa,MDSavolaBoDMember
Member P P P 3
4.Mr.AbdulazizK.AlGhufailySavolaBoDMember
Member P P P 3
5.Mr.BadrAbdullahAl-Issa,SavolaGroupBoDMember
Member P P P 3
- Mr.MahmoudM.AbdulGhaffarCommitteeSecretary
P P P 3
Roles&Responsibilities
Define,study,andevaluateinvestmentopportunitieswithintheGroupandcoresectorsinSaudiArabiaandoverseasinlinewiththeGroup’sdefinedstrategyandrecommendfindingstotheGroup’sBoardofDirectors.
The Committee Remuneration:MembersreceivedtheamountofSAR83,800,whichrepresentsattendancefeesandtravelexpensesforCommitteeMembers(TheGroup’spolicyisthattheMembersoftheCommitteewhoarealsoMembersoftheGroup’sBoarddonotreceiveannualremunerationsfortheirmembershipoftheCommittee,butratherattendancefeesonly).
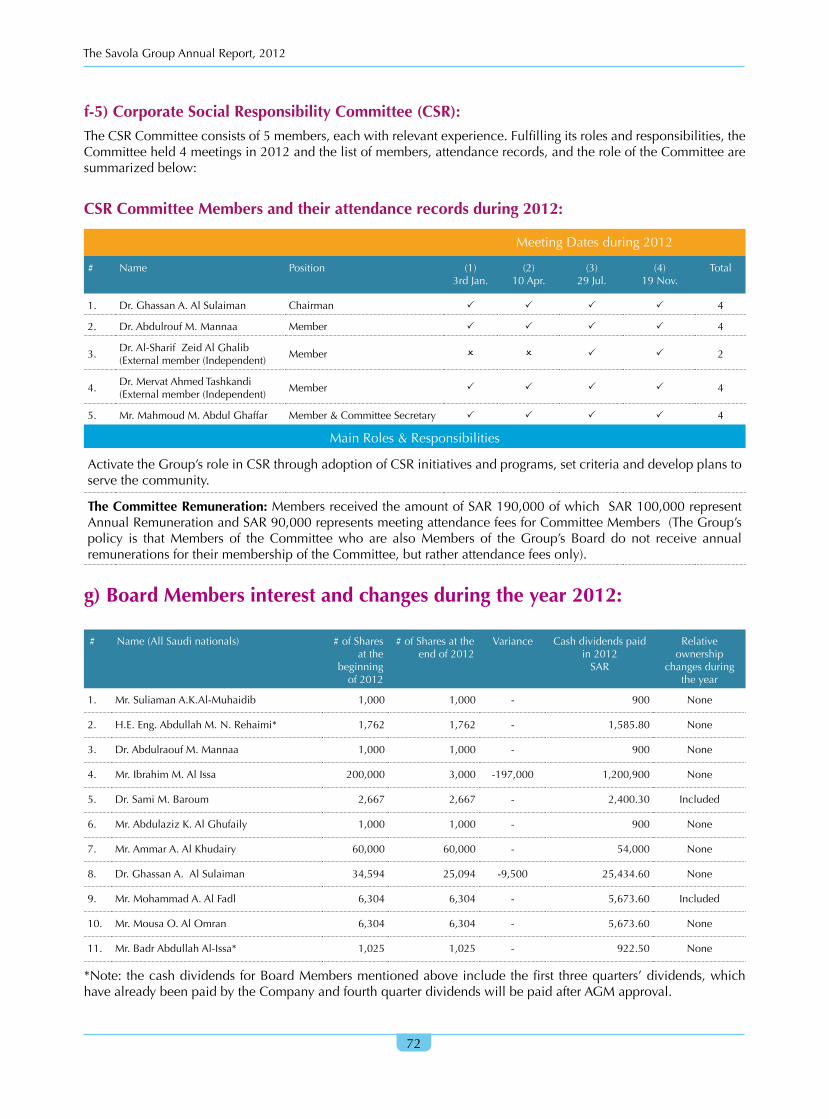
The Savola Group Annual Report, 2012
72
f-5) Corporate Social Responsibility Committee (CSR):TheCSRCommitteeconsistsof5members,eachwithrelevantexperience.Fulfillingitsrolesandresponsibilities,theCommitteeheld4meetingsin2012andthelistofmembers,attendancerecords,andtheroleoftheCommitteearesummarizedbelow:
CSR Committee Members and their attendance records during 2012:
MeetingDatesduring2012
# Name Position (1)3rdJan.
(2)10Apr.
(3)29Jul.
(4)19Nov.
Total
1. Dr.GhassanA.AlSulaiman Chairman P P P P 4
2. Dr.AbdulroufM.Mannaa Member P P P P 4
3.Dr.Al-SharifZeidAlGhalib(Externalmember(Independent)
Member O O P P 2
4.Dr.MervatAhmedTashkandi(Externalmember(Independent)
Member P P P P 4
5. Mr.MahmoudM.AbdulGhaffar Member&CommitteeSecretary P P P P 4
MainRoles&Responsibilities
ActivatetheGroup’sroleinCSRthroughadoptionofCSRinitiativesandprograms,setcriteriaanddevelopplanstoservethecommunity.
The Committee Remuneration:MembersreceivedtheamountofSAR190,000ofwhichSAR100,000representAnnualRemunerationandSAR90,000representsmeetingattendancefeesforCommitteeMembers(TheGroup’spolicy is thatMembers of the Committeewho are alsoMembers of theGroup’s Board do not receive annualremunerationsfortheirmembershipoftheCommittee,butratherattendancefeesonly).
g) Board Members interest and changes during the year 2012:
# Name(AllSaudinationals) #ofSharesatthe
beginningof2012
#ofSharesattheendof2012
Variance Cashdividendspaidin2012SAR
Relativeownership
changesduringtheyear
1. Mr.SuliamanA.K.Al-Muhaidib 1,000 1,000 - 900 None
2. H.E.Eng.AbdullahM.N.Rehaimi* 1,762 1,762 - 1,585.80 None
3. Dr.AbdulraoufM.Mannaa 1,000 1,000 - 900 None
4. Mr.IbrahimM.AlIssa 200,000 3,000 -197,000 1,200,900 None
5. Dr.SamiM.Baroum 2,667 2,667 - 2,400.30 Included
6. Mr.AbdulazizK.AlGhufaily 1,000 1,000 - 900 None
7. Mr.AmmarA.AlKhudairy 60,000 60,000 - 54,000 None
8. Dr.GhassanA.AlSulaiman 34,594 25,094 -9,500 25,434.60 None
9. Mr.MohammadA.AlFadl 6,304 6,304 - 5,673.60 Included
10. Mr.MousaO.AlOmran 6,304 6,304 - 5,673.60 None
11. Mr.BadrAbdullahAl-Issa* 1,025 1,025 - 922.50 None
*Note:thecashdividendsforBoardMembersmentionedaboveincludethefirst threequarters’dividends,whichhavealreadybeenpaidbytheCompanyandfourthquarterdividendswillbepaidafterAGMapproval.
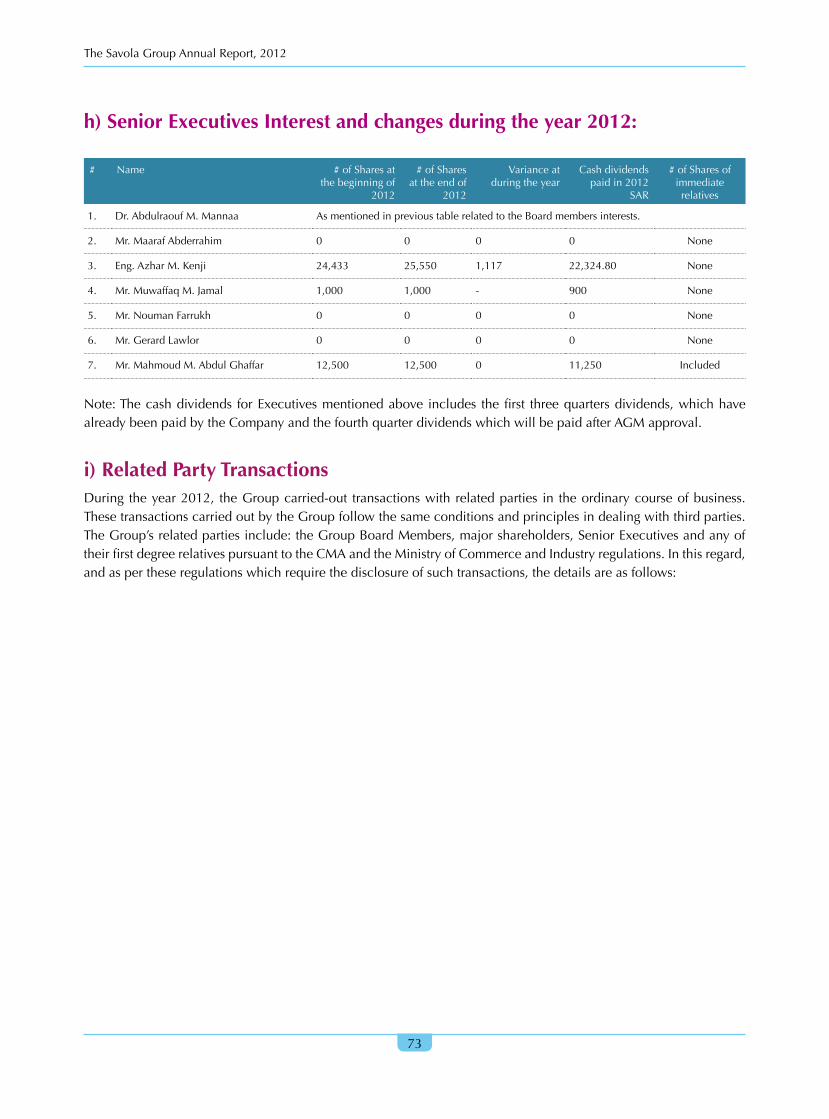
The Savola Group Annual Report, 2012
73
h) Senior Executives Interest and changes during the year 2012:
# Name #ofSharesatthebeginningof
2012
#ofSharesattheendof
2012
Varianceatduringtheyear
Cashdividendspaidin2012
SAR
#ofSharesofimmediaterelatives
1. Dr.AbdulraoufM.Mannaa AsmentionedinprevioustablerelatedtotheBoardmembersinterests.
2. Mr.MaarafAbderrahim 0 0 0 0 None
3. Eng.AzharM.Kenji 24,433 25,550 1,117 22,324.80 None
4. Mr.MuwaffaqM.Jamal 1,000 1,000 - 900 None
5. Mr.NoumanFarrukh 0 0 0 0 None
6. Mr.GerardLawlor 0 0 0 0 None
7. Mr.MahmoudM.AbdulGhaffar 12,500 12,500 0 11,250 Included
Note:Thecashdividends forExecutivesmentionedabove includes thefirst threequartersdividends,whichhavealreadybeenpaidbytheCompanyandthefourthquarterdividendswhichwillbepaidafterAGMapproval.
i) Related Party Transactions During theyear2012, theGroupcarried-out transactionswith relatedparties in theordinarycourseofbusiness.ThesetransactionscarriedoutbytheGroupfollowthesameconditionsandprinciplesindealingwiththirdparties.TheGroup’srelatedpartiesinclude:theGroupBoardMembers,majorshareholders,SeniorExecutivesandanyoftheirfirstdegreerelativespursuanttotheCMAandtheMinistryofCommerceandIndustryregulations.Inthisregard,andaspertheseregulationswhichrequirethedisclosureofsuchtransactions,thedetailsareasfollows:

The Savola Group Annual Report, 2012
74
# TheRelatedParty Relation TypeoftheTransaction
1) Abdulkader Al-Muhaidib & Sons Co.,
which owns 8.5% of Savola Group
and chaired by Mr. Suliaman A. Al-
Muhaidib,whoisalsotheChairmanof
SavolaGroup’sBoardofDirectors.
Major
Shareholder
&Board
Membership
Duringthefiscalyear2012,theGroupthroughitsSubsidiaries(inRetailand
Foods sectors) executed transactions & entered into commercial contracts
withAbdulgadirAl-Muhaidib&SonsCo.,thetotalvalueofthesetransactions
amountedtoSAR185milliondetailsofwhichareasfollows:
• TheUnitedSugarCompany(asubsidiaryofSavolaGroup)underspecific
supplycontracts,soldsugarproductstoAl-MuhaidibFoodsCompany(a
subsidiaryofMuhaidib&SonsCo.)withatotalvalueofSAR92million.
• Al-AziziaPandaUnitedCo.(aSubsidiaryofSavolaGroup)underSupply
Contracts,purchasedfoodsproductsfromAl-MuhaidibFoodCompany
withatotalvalueofSAR93million.
It is tobenotedthatsuchdealswereinplacebetweenthetwoCompanies
beforetheappointmentofMr.SuliamanAl-MuhaidibasaBoardMemberof
the SavolaGroupBoardofDirectors, and theBoard recommends ratifying
thesetransactionsandrenewingthesesupplycontractsforthecomingyear
2) HerfyFoodServicesCo.,apubliclisted
company,inwhichSavolaGroupowns
49% (direct and indirect); Savola has
four members on the Herfy Board of
DirectorswhoarealsoMembersofthe
SavolaGroupBoardofDirectors.
Board
membership
andSavola
directlyowns
over30%of
theCompany
TheGroup through its Subsidiaries (in theFood,Retail andPlastic Sectors)
executed some transactions andcommercial contractswithHerfyCo.with
a total value of SAR 37.66 million, the Board recommends ratifying the
transactions listed below and authorize their renewal for the coming year.
Detailsofthetransactionsandcontractsareasfollows:
• AcontractwithatotalvalueofSAR35.2million,whichrepresentsrental
ofshopsandretailsalesoffoodproducts)betweenHerfyFoodsServices
Co.andAl-AziziaPandaUnitedCompany(asubsidiaryofSavolaGroup)
• A contract with a total value of SAR 2.17 million, which represents
edibleoilsproducts,soldbyAfiaInternationalCo.(asubsidiaryofSavola
Group)toHerfy.
• AcontractwithatotalvalueofSAR290.4thousand,whichrepresents
Plastic Products sold byAl-Sharq Plastics Co. (awholly subsidiary of
SavolaGroup)toHerfy.
3) Almarai Co., a public listed company,
inwhichSavolaGroupowns36.52%;
Savola Group has two representatives
ontheAlmaraiBoardofDirectorswho
arealsoMembersoftheSavolaGroup
BoardofDirectors.
Board
Representation
&Major
Shareholder
owningover
30%ofAlmarai
Company
TheGrouprepresentedbyitssubsidiariesexecutedduringtheyear2012with
Almarai, transactions and supply contracts for food products forAl-Azizia
PandaStoresintheordinarycourseofbusiness,withatotalvalueofSAR511.7
million,theBoardrecommendstoratifythesetransactionsandauthorizesthe
renewalofthesedealingsforthecomingyear.
• AlAziziaPandaUnited(OneoftheSavolaGroupsubsidiaries)purchased
foodsgoodsfromAlmaraiwithatotalvalueofSAR321.3million.
• Afia International Company (one of Savola Group’s subsidiaries) sold
edibleoilproductswithatotalvalueofSAR500thousand.
• United Sugar Company (One of Savola Group’s subsidiaries) sold to
AlmaraiwhitesugarwithatotalvalueofSAR74.5million.
• SavolaPlasvticCompanyhadcommercialdealswithAlmarai in2012
withatotalvalueofSAR115.4million.
Related Party Transactions (Continued..)
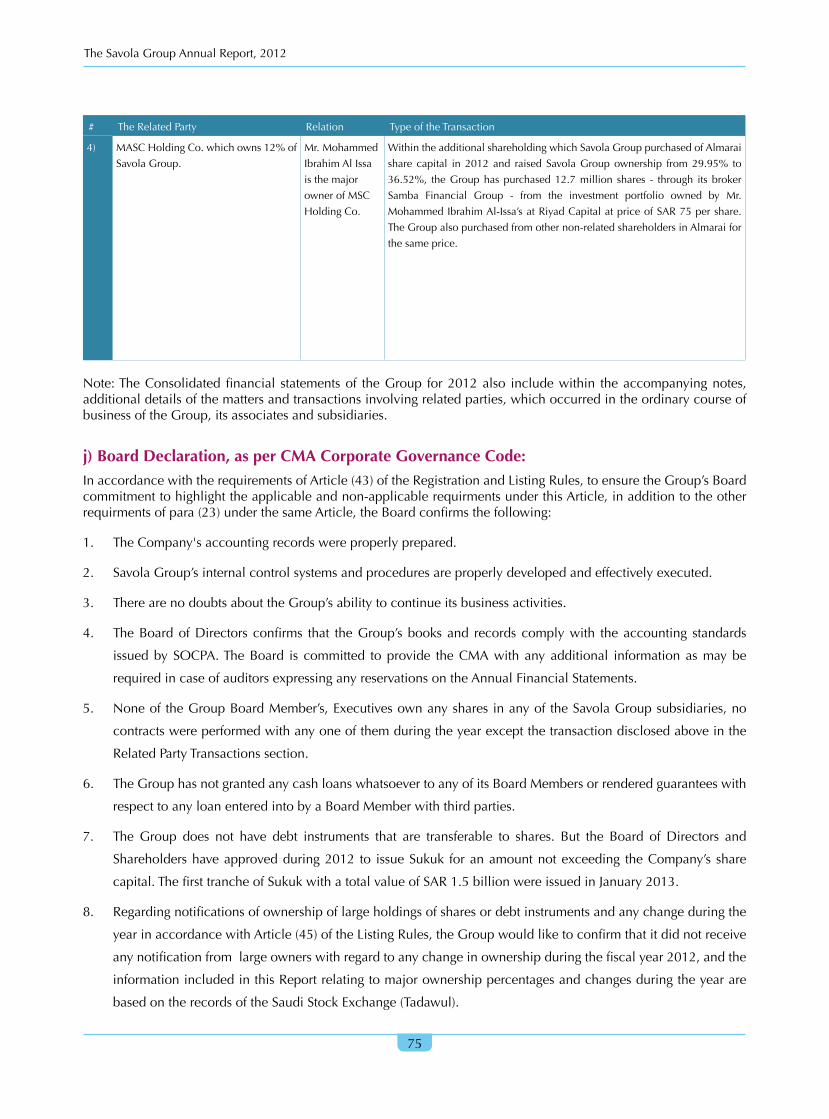
The Savola Group Annual Report, 2012
75
# TheRelatedParty Relation TypeoftheTransaction
4) MASCHoldingCo.whichowns12%of
SavolaGroup.
Mr.Mohammed
IbrahimAlIssa
isthemajor
ownerofMSC
HoldingCo.
WithintheadditionalshareholdingwhichSavolaGrouppurchasedofAlmarai
share capital in 2012 and raised SavolaGroupownership from29.95% to
36.52%, theGrouphaspurchased12.7million shares - through its broker
Samba Financial Group - from the investment portfolio owned by Mr.
MohammedIbrahimAl-Issa’satRiyadCapitalatpriceofSAR75pershare.
TheGroupalsopurchasedfromothernon-relatedshareholdersinAlmaraifor
thesameprice.
Note:TheConsolidatedfinancial statementsof theGroup for2012also includewithin theaccompanyingnotes,additionaldetailsofthemattersandtransactionsinvolvingrelatedparties,whichoccurredintheordinarycourseofbusinessoftheGroup,itsassociatesandsubsidiaries.
j) Board Declaration, as per CMA Corporate Governance Code:InaccordancewiththerequirementsofArticle(43)oftheRegistrationandListingRules,toensuretheGroup’sBoardcommitmenttohighlighttheapplicableandnon-applicablerequirmentsunderthisArticle,inadditiontotheotherrequirmentsofpara(23)underthesameArticle,theBoardconfirmsthefollowing:
1. TheCompany'saccountingrecordswereproperlyprepared.
2. SavolaGroup’sinternalcontrolsystemsandproceduresareproperlydevelopedandeffectivelyexecuted.
3. TherearenodoubtsabouttheGroup’sabilitytocontinueitsbusinessactivities.
4. TheBoardofDirectors confirms that theGroup’sbooksand recordscomplywith theaccounting standards
issuedbySOCPA.TheBoard is committed toprovide theCMAwith anyadditional informationasmaybe
requiredincaseofauditorsexpressinganyreservationsontheAnnualFinancialStatements.
5. NoneoftheGroupBoardMember’s,ExecutivesownanysharesinanyoftheSavolaGroupsubsidiaries,no
contractswereperformedwithanyoneofthemduringtheyearexceptthetransactiondisclosedaboveinthe
RelatedPartyTransactionssection.
6. TheGrouphasnotgrantedanycashloanswhatsoevertoanyofitsBoardMembersorrenderedguaranteeswith
respecttoanyloanenteredintobyaBoardMemberwiththirdparties.
7. TheGroup does not have debt instruments that are transferable to shares. But the Board of Directors and
Shareholdershaveapprovedduring2012 to issueSukuk foranamountnotexceeding theCompany’s share
capital.ThefirsttrancheofSukukwithatotalvalueofSAR1.5billionwereissuedinJanuary2013.
8. Regardingnotificationsofownershipoflargeholdingsofsharesordebtinstrumentsandanychangeduringthe
yearinaccordancewithArticle(45)oftheListingRules,theGroupwouldliketoconfirmthatitdidnotreceive
anynotificationfromlargeownerswithregardtoanychangeinownershipduringthefiscalyear2012,andthe
informationincludedinthisReportrelatingtomajorownershippercentagesandchangesduringtheyearare
basedontherecordsoftheSaudiStockExchange(Tadawul).

The Savola Group Annual Report, 2012
76
9. No contract or agreement or any arrangement has beenmadeunderwhich a shareholder,Director, Senior
ExecutiveoranemployeeoftheGroupcanwaivehisorherdividendsoranyemolumentorcompensation.
10. Therearenopunishments,penaltiesorpreventiverestrictionsimposedonthecompanybytheCMAoranyother
supervisory,regulatoryorjudiciarybody.
11. TheGroupdoes not have preferred shares or shareswith special priority in voting, issued to shareholders,
Directorsoremployees.AllsharesoftheGroupareordinarysharesofequalnominalvalueandrankequallyin
votingandotherrightsasperregulations.
12. TheGroupissubjecttoZakataccordingtotheregulationsoftheDepartmentofZakat&IncomeTax(DZIT).The
GrouprecordsitsZakatprovisionandchargesittotheIncomeStatement.Anyamendmentsresultingfromthe
finalassessmentarerecordedatthetimetheassessmentsarefinalizedandagreedwiththeDZIT.
13. TheexternalAuditorsdidnotprovideconsultancyservicestotheGroupduring2012anddidnotreceiveany
feesinthisregard.
k) Compliance with Corporate Governance regulations issued by the CMA for the year 2012: (Comply & Explain)TheBoardacknowledgesthattheGroupduringtheyear2012implementedallthelawsofCorporateGovernanceissuedby theCapitalMarketAuthority (CMA), except for thearticle concerning thecumulativevoting style.Thefollowingtableshowswhathasbeenappliedfromthelawsandregulationsandwhatisnotappliedandthereasonsfornon-application,whichismainlyduetothenon-applicabilityofcertainArticles.
Compliance in Corporate Governance with regulations issued by the CMA for the year 2012 (As per Form 8)
SN ArticlenumberinaccordancewithCorporateGovernanceRegulations
Numberof
Clauses
Complied PartiallyComplied
NotComplied
N/A ReasonsforNonorPartialCompliance
1 Article3andParagraph(A)ofArticle4. General Rights of Shareholdersand Facilitation of Shareholders’Exercise of Rights and Access toInformation
6 6
2 Paragraph(B)ofArticle4.Facilitationof Shareholders’ Exercise of RightsandAccesstoInformation
3 3
3 Article 5. Shareholders RightsRelatedtotheGeneralAssembly
10 10
4 Article6.VotingRights 3 2 1clause(b)
Article6,clause(b):TheCompany’sArticles of Association do notshow that the cumulative votingtechnique is applied in votingin the General Assembly for thenominationoftheBoardMembers,asthishasbeenvotedagainstbytheGeneralAssembly.
In addition, the Group has notconducted any nomination for itsBoard Members for year 2012, asthecurrentBoardCyclewillexpireonJune30,2013.
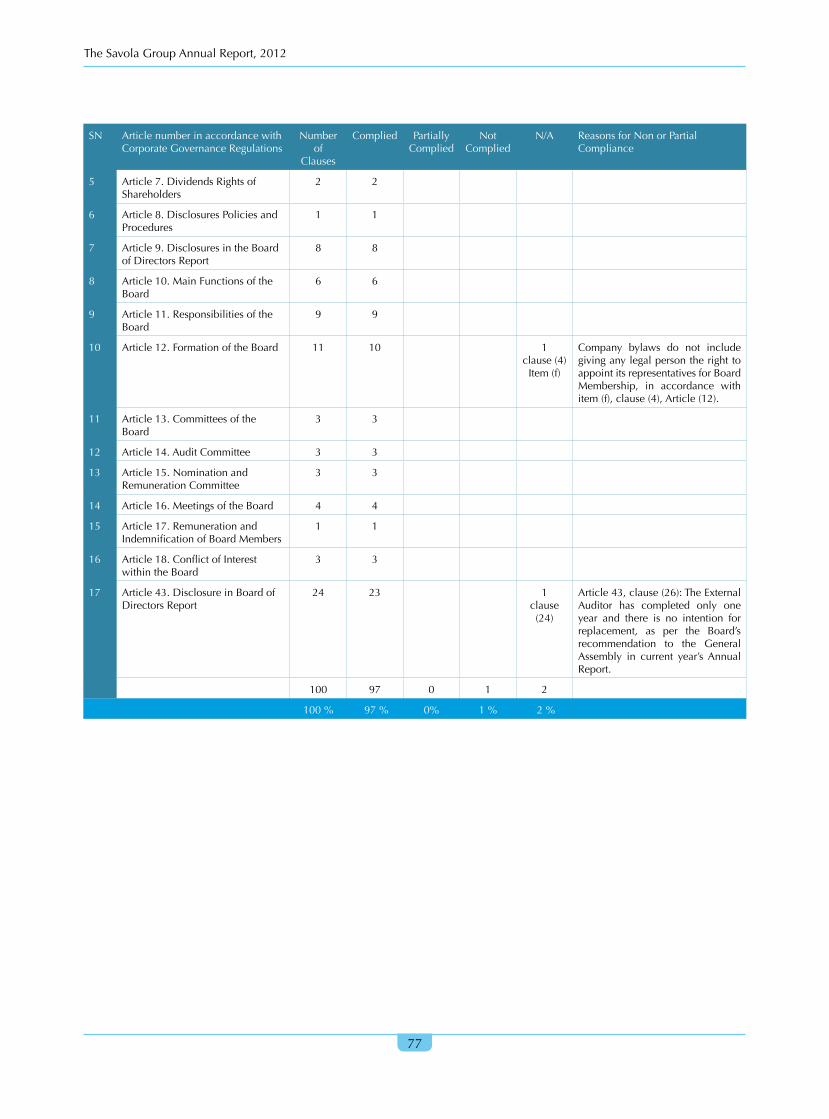
The Savola Group Annual Report, 2012
77
SN ArticlenumberinaccordancewithCorporateGovernanceRegulations
Numberof
Clauses
Complied PartiallyComplied
NotComplied
N/A ReasonsforNonorPartialCompliance
5 Article7.DividendsRightsofShareholders
2 2
6 Article8.DisclosuresPoliciesandProcedures
1 1
7 Article9.DisclosuresintheBoardofDirectorsReport
8 8
8 Article10.MainFunctionsoftheBoard
6 6
9 Article11.ResponsibilitiesoftheBoard
9 9
10 Article12.FormationoftheBoard 11 10 1clause(4)Item(f)
Company bylaws do not includegivinganylegalpersontherighttoappointitsrepresentativesforBoardMembership, in accordance withitem(f),clause(4),Article(12).
11 Article13.CommitteesoftheBoard
3 3
12 Article14.AuditCommittee 3 3
13 Article15.NominationandRemunerationCommittee
3 3
14 Article16.MeetingsoftheBoard 4 4
15 Article17.RemunerationandIndemnificationofBoardMembers
1 1
16 Article18.ConflictofInterestwithintheBoard
3 3
17 Article43.DisclosureinBoardofDirectorsReport
24 23 1clause(24)
Article43,clause(26):TheExternalAuditor has completed only oneyear and there is no intention forreplacement, as per the Board’srecommendation to the GeneralAssembly in current year’sAnnualReport.
100 97 0 1 2
100% 97% 0% 1% 2%

The Savola Group Annual Report, 2012
78
Below is a chart summarizing the results of the Independent Assessment of Savola Compliance with Corporate Governance Regulations for the year 2012 compared to 2011:
Toconfirmtheresultsoftheaboveassessment,andthebasisoftheprincipleofindependenceinassessingandthe
Company'scommitmenttoCorporateGovernancestandards,theGrouphasappointedErnst&Young(EY)tocarry
outacomparisonofthecurrentCorporateGovernancepracticeappliedbytheGroupduring2012withthecode
ofCorporateGovernanceissuedbytheSaudiArabianCapitalMarketAuthority(CMA)pursuanttoResolutionno.
1-212-2006dated21Shawwal1427HcorrespondingtoNovember12,2006.ThisexercisecomparestheGroup’s
commitmentduringtheyear2012totheCGcodeissuedbytheCMA,whichcontains100ArticlesandtheGroup’s
compliancewiththeseArticleswas97%.
2011 2012
FullyComplied93.4% FullyComplied97%
PartlyComplied5.5% NotApplicable2%
NotComplied1.1% NotComplied1%
The Savola Group Annual Report, 2012
79
Thanks and Appreciation
TheBoardofDirectorstakethisopportunitytoextendthanks
andappreciationtotheCustodianoftheTwoHolyMosques
and toHisRoyalHighnessTheCrownPrince–Godbless
them- for their special endeavors in furthering thewelfare
and the stabilityof thecountry.TheBoardalsoextends its
appreciationandthankstotheGovernmentoftheCustodian
of theTwo Holy Mosques for its continuous support and
encouragementprovidedtotheindustrialandprivatesector
intheKingdom.TheBoardwouldalsoliketothankallSaudi
citizensforthetrustandloyaltytheyhaveplacedinSavolaand
itsproducts.TheBoardfurtherthanksSavola’sshareholders,
thegroup’smanagement,subsidiariesandemployeesfortheir
efforts, support, and commitment during 2012.The Board
looksforwardtofurtherachievementsin2013.
WepraytoAlmightyGodforcontinuoussuccess.
TheSavolaGroup,BoardofDirectors.
The Savola Group Annual Report, 2012
80
Consolidated Financial Statements For The Year Ended December 31, 20121. IndependentAuditors’Report
2. ConsolidatedBalanceSheet
3. ConsolidatedIncomeStatement
4. ConsolidatedCashFlowStatement
5. ConsolidatedStatementofChangesinShareholders’Equity
6. NotestotheConsolidatedFinancialStatements

The Savola Group Annual Report, 2012
81
3
Consolidated Financial Statements
82
INDEPENDENT AUDITORS’ REPORTTo the Shareholders of Savola Group Company:
(A Saudi Joint Stock Company)
Scope of audit
We have audited the accompanying consolidated balance sheet of Savola Group Company (the “Company”) and Subsidiaries (collectively the “Group”) as of December 31, 2012 and the related consolidated statements of income, cash flows and changes in shareholders’ equity for the year then ended, and the notes which form an integral part of the consolidated financial statements. These consolidated financial statements, which were prepared by the Company in accordance with Article 123 of the Regulations for Companies and presented to us with all information and explanations which we required, are the responsibility of the Group’s management. Our responsibility is to express an opinion on these consolidated financial statements based on our audit.
We conducted our audit in accordance with auditing standards generally accepted in Saudi Arabia. Those standards require that we plan and perform the audit to obtain reasonable assurance about whether the financial statements are free of material misstatement. An audit includes examining, on a test basis, evidence supporting the amounts and disclosures in the financial statements. An audit also includes assessing the accounting principles used and significant estimates made by management, as well as evaluating the overall financial statement presentation. We believe that our audit provides a reasonable basis for our opinion.
Unqualified opinion
In our opinion, such consolidated financial statements taken as a whole:
Present fairly, in all material respects, the financial position of the Group as of December 31, 2012 and the results of its operations and its cash flows for the year then ended in conformity with accounting principles generally accepted in Saudi Arabia appropriate to the circumstances of the Group; and
Comply, in all material respects, with the requirements of the Regulations for Companies and the Company’s Bylaws with respect to the preparation and presentation of consolidated financial statements.
February 16, 2013 By: Ibrahim R. Habib License Number 383
PricewaterhousecoopersJameel Sq., Tahlia St., P. O. 164 15, Jeddah 21464, Kindgomd of Saudi Arabia.Tel. : +966-2-610 4400Fax: +966-2-610 4411
www.pwc.com/middle-east
PricewaterhouseCoopers، License No. (25)Licensed Partners: Omar M. Al Sagga (369), Khalid A. Mahdhar (368),
Mohammed Al. Al Obaidi (367), Ibrahim R. Habib (383).
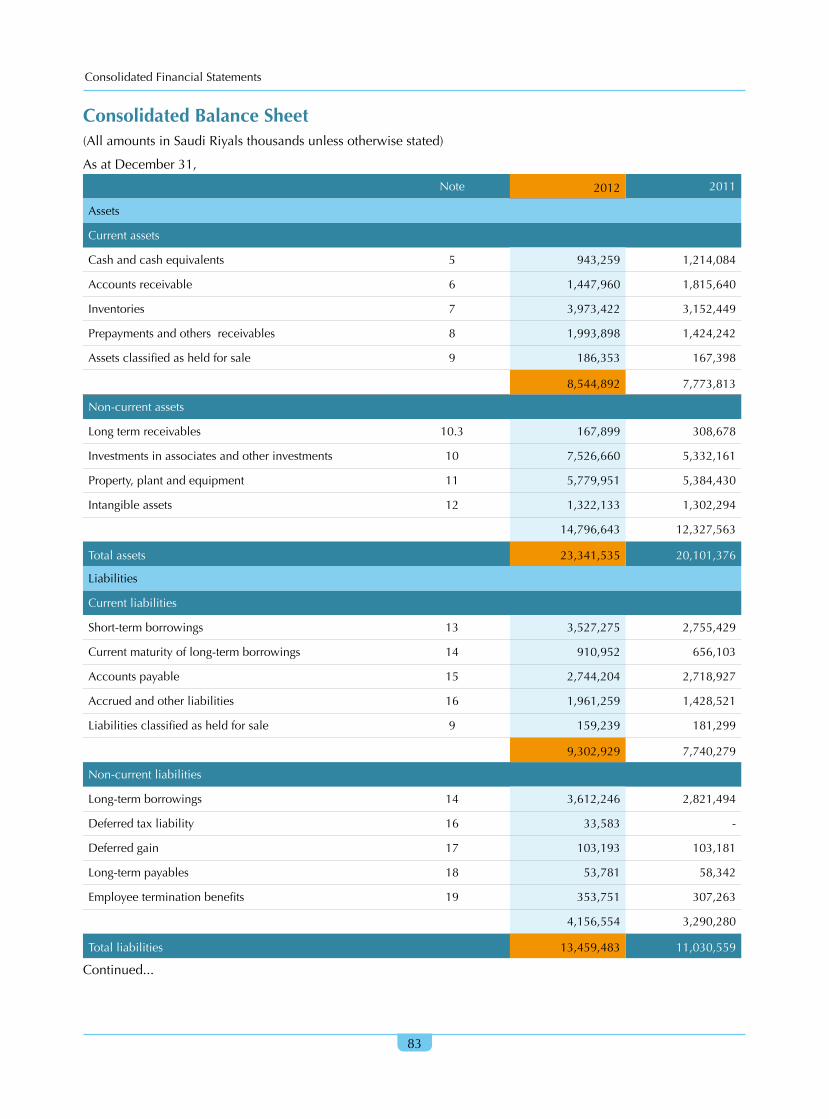
Consolidated Financial Statements
83
Consolidated Balance Sheet(All amounts in Saudi Riyals thousands unless otherwise stated)
As at December 31,
Note 2012 2011
Assets
Current assets
Cash and cash equivalents 5 943,259 1,214,084
Accounts receivable 6 1,447,960 1,815,640
Inventories 7 3,973,422 3,152,449
Prepayments and others receivables 8 1,993,898 1,424,242
Assets classified as held for sale 9 186,353 167,398
8,544,892 7,773,813
Non-current assets
Long term receivables 10.3 167,899 308,678
Investments in associates and other investments 10 7,526,660 5,332,161
Property, plant and equipment 11 5,779,951 5,384,430
Intangible assets 12 1,322,133 1,302,294
14,796,643 12,327,563
Total assets 23,341,535 20,101,376
Liabilities
Current liabilities
Short-term borrowings 13 3,527,275 2,755,429
Current maturity of long-term borrowings 14 910,952 656,103
Accounts payable 15 2,744,204 2,718,927
Accrued and other liabilities 16 1,961,259 1,428,521
Liabilities classified as held for sale 9 159,239 181,299
9,302,929 7,740,279
Non-current liabilities
Long-term borrowings 14 3,612,246 2,821,494
Deferred tax liability 16 33,583 -
Deferred gain 17 103,193 103,181
Long-term payables 18 53,781 58,342
Employee termination benefits 19 353,751 307,263
4,156,554 3,290,280
Total liabilities 13,459,483 11,030,559
Continued...
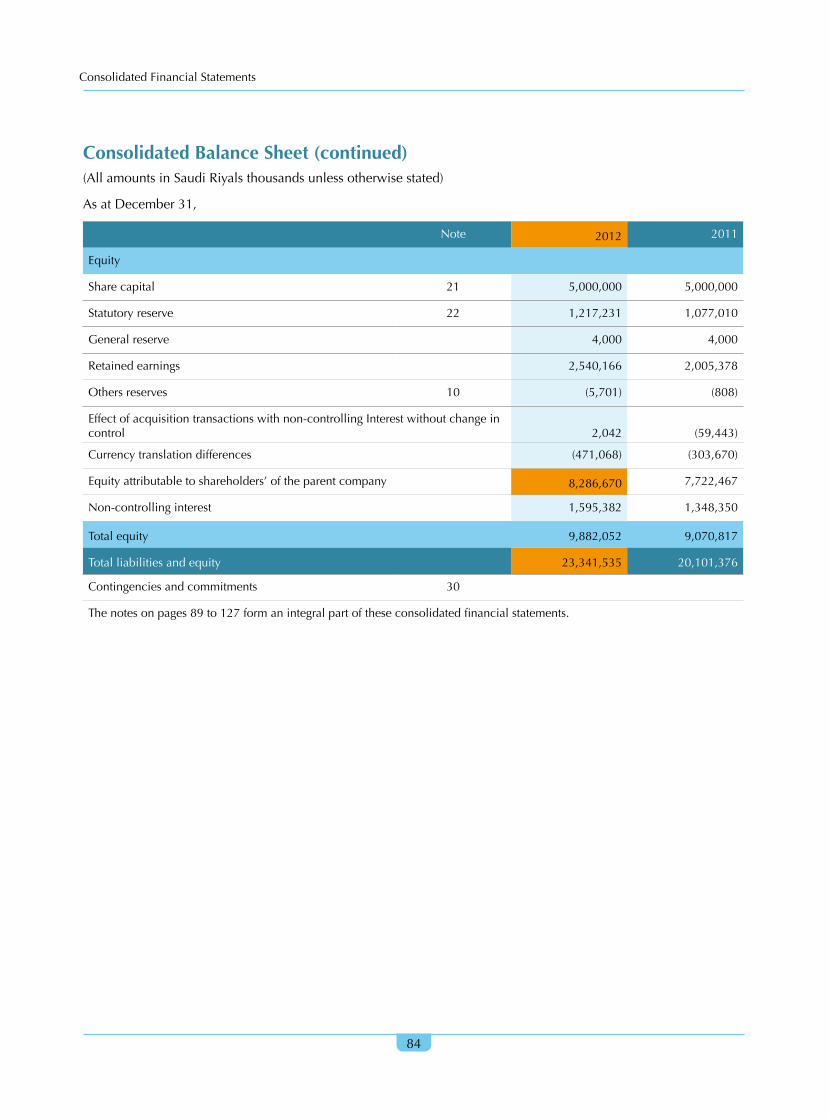
Consolidated Financial Statements
84
Consolidated Balance Sheet (continued)(All amounts in Saudi Riyals thousands unless otherwise stated)
As at December 31,
Note 2012 2011
Equity
Share capital 21 5,000,000 5,000,000
Statutory reserve 22 1,217,231 1,077,010
General reserve 4,000 4,000
Retained earnings 2,540,166 2,005,378
Others reserves 10 (5,701) (808)
Effect of acquisition transactions with non-controlling Interest without change in control 2,042 (59,443)
Currency translation differences (471,068) (303,670)
Equity attributable to shareholders’ of the parent company 8,286,670 7,722,467
Non-controlling interest 1,595,382 1,348,350
Total equity 9,882,052 9,070,817
Total liabilities and equity 23,341,535 20,101,376
Contingencies and commitments 30
The notes on pages 89 to 127 form an integral part of these consolidated financial statements.

Consolidated Financial Statements
85
Consolidated Income Statement(All amounts in Saudi Riyals thousands unless otherwise stated)
Year ended December 31,
Note 2012 2011
Revenues 4, 20 27,391,493 25,195,702
Cost of sales 20 (22,629,925) (21,224,980)
Gross profit 4,761,568 3,970,722
Share in net income of associates and dividend income of available-for-sale investment - net 10.1, 10.2 578,567 440,613
Other income - net 25 73,721 96,767
Total Income 5,413,856 4,508,102
Operating expenses
Selling and marketing 20, 23 (2,367,292) (2,144,813)
General and administrative 20, 24 (590,317) (562,472)
Total expenses (2,957,609) (2,707,285)
Income from operations 2,456,247 1,800,817
Other income (expenses)
Gain on disposal of investments 10 46,651 152,781
Impairment loss and cost of projects written off 12 - (35,366)
Financial charges - net 26 (427,381) (317,472)
Income before zakat and foreign income tax 2,075,517 1,600,760
Zakat and foreign income tax 16 (268,148) (132,024)
Net income for the year 1,807,369 1,468,736
Net income attributable to:
Shareholders’ of the parent company 1,402,209 1,202,376
Non-controlling interest’s share of year’s net income in subsidiaries 405,160 266,360
Net income for the year 1,807,369 1,468,736
Earnings per share (in Saudi Riyals): 28
• Operating income 4.91 3.60
• Net income for the year attributable to the shareholders’ of the parent company
2.80 2.40
The notes on pages 89 to 127 form an integral part of these consolidated financial statements.

Consolidated Financial Statements
86
Consolidated Cash Flow Statement(All amounts in Saudi Riyals thousands unless otherwise stated) Year ended December 31,
2012 2011
Cash flow from operating activities
Net income for the year 1,807,369 1,468,736
Adjustments for non-cash items
Depreciation, amortization, impairment and amortization of deferred gain
564,007 558,234
Share in net income of associates (568,793) (436,863)
Financial charges - net 427,381 317,472
Gain from disposal of investments (46,651) (152,781)
Gain on sale of property, plant and equipment (3,542) (10,087)
Changes in working capital
Accounts receivable 367,680 (71,319)
Inventories (820,973) (596,908)
Prepayments and other receivables (661,925) 174,191
Accounts payable 25,277 486,910
Accrued and other liabilities 554,871 (195,281)
Employee termination benefits 46,488 31,157
Net cash generated from operating activities 1,691,189 1,573,461
Cash flow from investing activities
Dividends received 228,098 222,303
Proceeds from sale of investments 173,049 142,069
Change in long term receivables 140,779 -
Effect of acquisition transaction with non-controlling interest without change in control
61,485 -
Proceeds from sale of property, plant and equipment 55,853 94,807
Addition to deferred charges (51,309) (37,054)
Purchase of property, plant and equipment (1,070,183) (674,044)
Additions to investments (1,997,832) (219,892)
Cash effect of consolidation of an associate - 141,313
Acquisition of subsidiaries, net of cash - (445,642)
Net change in other investments - 7,864
Net cash utilized in investing activities (2,460,060) (768,276)
Continued...

Consolidated Financial Statements
87
Consolidated Cash Flow Statement (continued)(All amounts in Saudi Riyals thousands unless otherwise stated) Year ended December 31,
2012 2011
Cash flow from financing activities
Net change in short-term borrowings 771,846 644,686
Additions to long-term borrowings 1,550,000 1,045,010
Repayments of long-term borrowings (504,399) (909,257)
Net change in restricted deposits financing 8,479 (20,963)
Changes in non-controlling interest (158,128) (112,841)
Financial charges - net (427,381) (317,472)
Dividends paid (742,371) (497,678)
Net cash generated from (utilized in) financing activities 498,046 (168,515)
Net change in cash and cash equivalents (270,825) 636,670
Cash and cash equivalents at beginning of year 1,214,084 577,414
Cash and cash equivalents at end of year 943,259 1,214,084
Supplemental schedule of non-cash information
Directors’ remuneration 2,200 2,200
Other reserves 10 (4,893) 89,304
Currency translation differences 10 (167,398) (73,244)
Investment properties classified as held for sale 8 - 467,359
The notes on pages 89 to 127 form an integral part of these consolidated financial statements,

Consolidated Financial Statements
88
Not
es to
the
cons
olid
ated
fina
ncia
l sta
tem
ents
for
the
year
end
ed D
ecem
ber
31, 2
012
Con
solid
ated
sta
tem
ent o
f cha
nges
in s
hare
hold
ers’
equ
ity
(All
amou
nts
in S
audi
Riy
als
thou
sand
s un
less
oth
erw
ise
stat
ed)
Not
eSh
are
capi
tal
Stat
utor
y re
serv
eG
ener
al
Rese
rve
Oth
er re
serv
es
Effe
ct o
f acq
uisit
ion
trans
actio
n w
ith n
on-
cont
rolli
ng in
tere
st w
ithou
t cha
nge
in
cont
rol
Cur
renc
y tra
nsla
tion
diffe
renc
es
Reta
ined
ea
rnin
gs
Tota
l sh
areh
olde
rs
equi
ty
Non
-co
ntro
lling
in
tere
stTo
tal e
quity
Janu
ary
1, 2
012
5,00
0,00
01,
077,
010
4,00
0(8
08)
(59,
443)
(303
,670
)2,
005,
378
7,72
2,46
71,
348,
350
9,07
0,81
7
Net
inco
me
for t
he y
ear
-
-
-
-
-
-
1,40
2,20
91,
402,
209
405
,160
1,80
7,36
9
Tran
sfer t
o sta
tuto
ry re
serv
e22
- 1
40,2
21
-
-
-
-(1
40,2
21)
-
-
-
Div
iden
ds29
-
-
-
-
-
-
(725
,000
)(7
25,0
00)
-(7
25,0
00)
Oth
er re
serv
es a
djus
tmen
t10
-
-
-(4
,893
)
-
-
-
(4,8
93)
-(4
,893
)
Cur
renc
y tra
nsla
tion
diffe
renc
es
-
-
-
-
-
(167
,398
)
-
(167
,398
)
-
(167
,398
)
Dire
ctor
s rem
uner
atio
n20
--
-
-
-
-
(2,2
00)
(2,2
00)
-(2
,200
)
Acq
uisit
ion
of n
on-c
ontro
lling
in
tere
st w
ithou
t cha
nge
in c
ontro
l
-
-
-
- 6
1,48
5
-
- 6
1,48
5
-
61,
485
Oth
er c
hang
es in
non
-con
trolli
ng
inte
rests
-
-
-
-
-
-
-
-
(158
,128
)(1
58,1
28)
Dec
embe
r 31,
201
25,
000,
000
1,21
7,23
14,
000
(5,7
01)
2,0
42(4
71,0
68)
2,5
40,1
668,
286,
670
1,5
95,3
82 9
,882
,052
Janu
ary
1, 2
011
5,00
0,00
0 9
56,7
724,
000
(90,
112)
(45,
637)
(230
,426
) 1
,425
,440
7,02
0,03
7 1
,194
,831
8,2
14,8
68
Net
inco
me
for t
he y
ear
-
-
-
-
-
-
1,2
02,3
761,
202,
376
266
,360
1,4
68,7
36
Tran
sfer t
o sta
tuto
ry R
eser
ve22
-12
0,23
8
-
-
-
-(1
20,2
38)
-
-
-
Div
iden
ds29
-
-
-
-
-
-
(500
,000
)(5
00,0
00)
-(5
00,0
00)
Oth
er re
serv
es a
djus
tmen
t10
-
-
-89
,304
-
-
-
89,3
04
- 8
9,30
4
Cur
renc
y tra
nsla
tion
diffe
renc
es
-
-
-
-
-
(73,
244)
-(7
3,24
4)
-
(73,
244)
Dire
ctor
s rem
uner
atio
n20
-
-
-
-
-
-
(2,2
00)
(2,2
00)
-(2
,200
)
Acq
uisit
ion
of n
on-c
ontro
lling
in
tere
st
with
out c
hang
e in
co
ntro
l
-
--
-(1
3,80
6)
-
- (1
3,80
6)
-
(13,
806)
Oth
er c
hang
es in
non
-con
trolli
ng
inte
rests
-
-
-
-
-
-
-
-(1
12,8
41)
(112
,841
)
Dec
embe
r 31,
201
15,
000,
000
1,07
7,01
0 4,
000
(808
)(5
9,44
3)(3
03,6
70)
2,00
5,37
8 7
,722
,467
1,3
48,3
50
9,07
0,81
7
The
note
s on
page
s 89
to 1
27 fo
rm a
n in
tegr
al p
art o
f the
se c
onso
lidat
ed fi
nanc
ial s
tate
men
ts.

Consolidated Financial Statements
89
1- General Information Savola Group Company (the “Company”) and its subsidiaries (collectively the “Group”) consist of the Company and its various Saudi Arabian and foreign subsidiaries. The objectives of the Company along with its subsidiaries includes the manufacturing and sale of vegetable oils and to set up related industries, retail outlets, dairy products, fast foods, packing materials, exports and imports, commercial contracting, trade agencies, development of agricultural products and real estate related investment activities.
The Company is a Saudi Joint Stock company registered in the Kingdom of Saudi Arabia under Commercial Registration No, 4030019708 issued in Jeddah on Rajab 21, 1399H (corresponding to June 16, 1979), The Company was formed under the Regulations for Companies in the Kingdom of Saudi Arabia per Royal Decree number M/21 dated Rabi-ul-Awal 29, 1398H (March 9, 1978). The registered address of the Company is Saudi Business Centre, Madinah Road, Jeddah, Kingdom of Saudi Arabia, Kingdom of Saudi Arabia.
At December 31, the Group has investments in the following subsidiaries (collectively referred to as “the Group”):
a) Direct Subsidiaries of The Company
(i) Operating subsidiaries
Subsidiary nameCountry ofincorporation
Principal businessActivity
Ownership interest (%) at December 31
2012 2011
Savola Foods Company (“SFC”) Saudi Arabia Foods 90 90
Al-Azizia Panda United Company (“APU”)
Saudi Arabia Retail 74,4 74,4
Savola Packaging Systems Limited ("SPS")
Saudi ArabiaManufacturing of Plastic packaging products
100 100
Al Matoun International for Real Estate Investment Holding Company
Saudi Arabia Real Estate 80 80
United Sugar Company, Egypt (“USCE”)
Egypt Manufacturing of Sugar 19,1 19,1
Giant Stores Trading Company (“Giant”)
Saudi Arabia Retail 8 8
United Company for Central Markets (“UCCM”)
Lebanon Retail 8 8
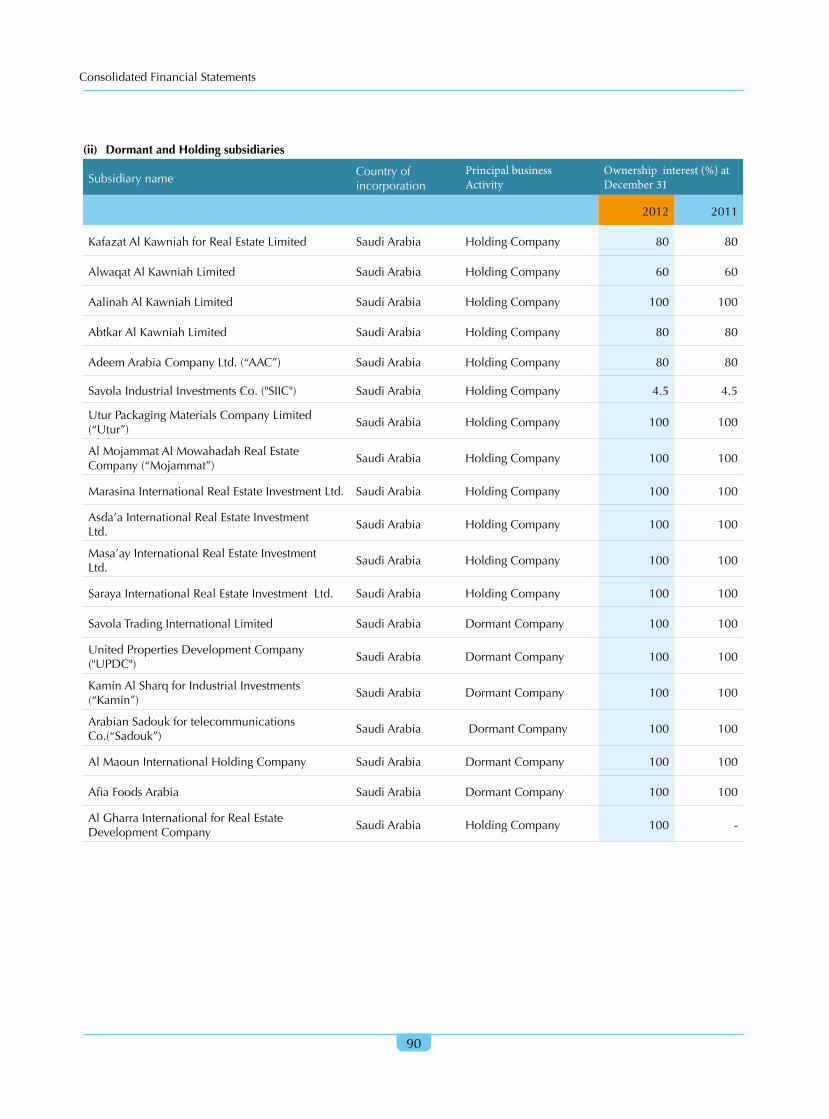
Consolidated Financial Statements
90
(ii) Dormant and Holding subsidiaries
Subsidiary nameCountry of incorporation
Principal business Activity
Ownership interest (%) at December 31
2012 2011
Kafazat Al Kawniah for Real Estate Limited Saudi Arabia Holding Company 80 80
Alwaqat Al Kawniah Limited Saudi Arabia Holding Company 60 60
Aalinah Al Kawniah Limited Saudi Arabia Holding Company 100 100
Abtkar Al Kawniah Limited Saudi Arabia Holding Company 80 80
Adeem Arabia Company Ltd. (“AAC”) Saudi Arabia Holding Company 80 80
Savola Industrial Investments Co. ("SIIC") Saudi Arabia Holding Company 4.5 4.5
Utur Packaging Materials Company Limited (“Utur”)
Saudi Arabia Holding Company 100 100
Al Mojammat Al Mowahadah Real Estate Company (“Mojammat”)
Saudi Arabia Holding Company 100 100
Marasina International Real Estate Investment Ltd. Saudi Arabia Holding Company 100 100
Asda’a International Real Estate Investment Ltd.
Saudi Arabia Holding Company 100 100
Masa’ay International Real Estate Investment Ltd.
Saudi Arabia Holding Company 100 100
Saraya International Real Estate Investment Ltd. Saudi Arabia Holding Company 100 100
Savola Trading International Limited Saudi Arabia Dormant Company 100 100
United Properties Development Company ("UPDC")
Saudi Arabia Dormant Company 100 100
Kamin Al Sharq for Industrial Investments (“Kamin”)
Saudi Arabia Dormant Company 100 100
Arabian Sadouk for telecommunications Co.(“Sadouk”)
Saudi Arabia Dormant Company 100 100
Al Maoun International Holding Company Saudi Arabia Dormant Company 100 100
Afia Foods Arabia Saudi Arabia Dormant Company 100 100
Al Gharra International for Real Estate Development Company
Saudi Arabia Holding Company 100 -

Consolidated Financial Statements
91
b) Subsidiaries Controlled Through SFC
Subsidiary nameCountry of incorporation
Principal business Activity
Ownership interest (%) at December 31
2012 2011
Afia International Company (“AIC”) Saudi ArabiaManufacturing of Edible oil
95.19 95.19
SIIC Saudi Arabia Holding Company 95 95
Savola Foods Emerging Markets Company Limited (“SFEM”)
British Virgin Islands Holding Company 95.4 95.4
Savola Foods for Sugar Company (“SFSC”) Cayman Islands Holding Company 95 95
El Maleka for Food Industries Company (“El Maleka”)
EgyptManufacturing of Pasta
100 100
El Farasha for Food Industries Company (“El Farasha”)
EgyptManufacturing of Pasta
100 100
Savola Foods Company International (“SFCI”) Limited
UAE Holding Company 100 -
International Foods Industries Company Limited (“IFI”)
Saudi ArabiaManufacturing of Specialty fats
60 -
Alexandria Sugar Company Egypt (“ASCE”) EgyptManufacturing of Sugar
19 19
SIIC
United Sugar Company (“USC”) Saudi ArabiaManufacturing of Sugar
74.48 74.48
USC
USCE EgyptManufacturing of Sugar
56.75 56.75
ASCE EgyptManufacturing of Sugar
62 62
Beet Sugar Industries Cayman Islands Dormant Company 100 100
USCE
ASCE EgyptManufacturing of Sugar
19 19
SFEM
Savola Morocco Company MoroccoManufacturing of Edible oils
100 100
Savola Edible Oils (Sudan) Ltd. SudanManufacturing of Edible oils
100 100
AFIA International Company – Algeria AlgeriaManufacturing of Edible oils
100 100
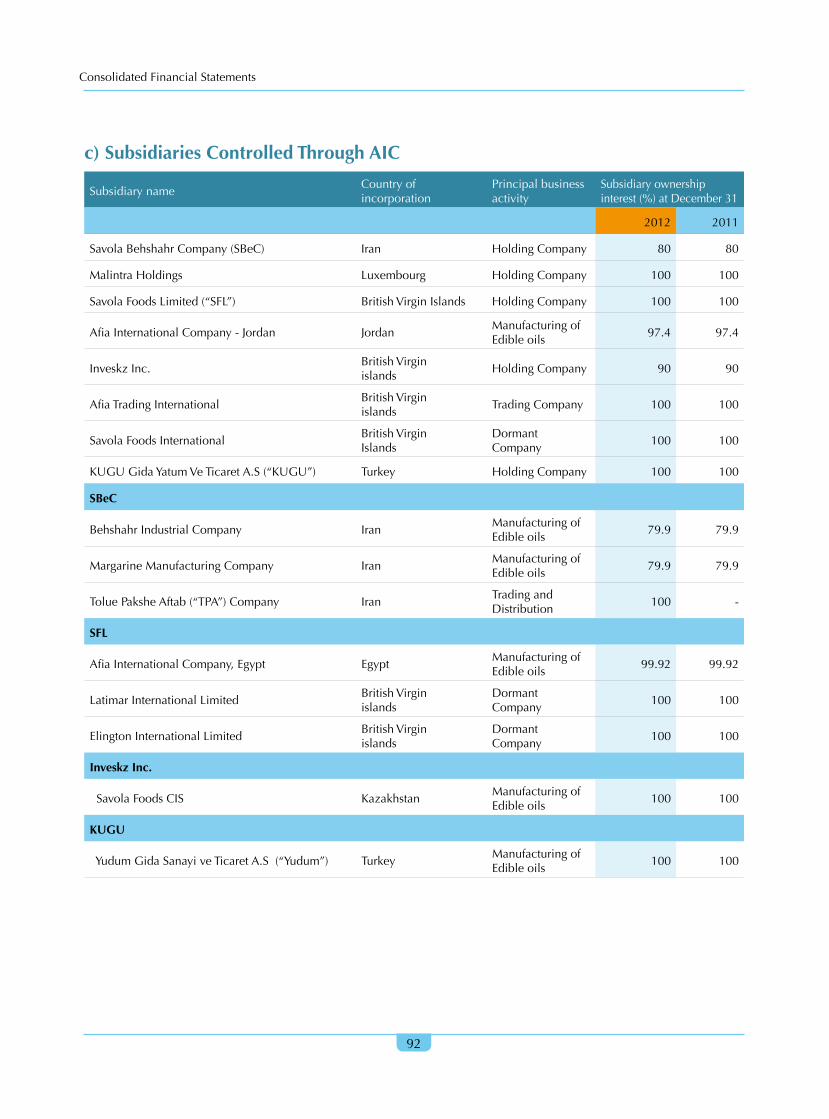
Consolidated Financial Statements
92
c) Subsidiaries Controlled Through AIC
Subsidiary nameCountry of incorporation
Principal business activity
Subsidiary ownershipinterest (%) at December 31
2012 2011
Savola Behshahr Company (SBeC) Iran Holding Company 80 80
Malintra Holdings Luxembourg Holding Company 100 100
Savola Foods Limited (“SFL”) British Virgin Islands Holding Company 100 100
Afia International Company - Jordan JordanManufacturing of Edible oils
97.4 97.4
Inveskz Inc. British Virgin islands
Holding Company 90 90
Afia Trading International British Virgin islands
Trading Company 100 100
Savola Foods InternationalBritish Virgin Islands
Dormant Company
100 100
KUGU Gida Yatum Ve Ticaret A.S (“KUGU”) Turkey Holding Company 100 100
SBeC
Behshahr Industrial Company IranManufacturing of Edible oils
79.9 79.9
Margarine Manufacturing Company IranManufacturing of Edible oils
79.9 79.9
Tolue Pakshe Aftab (“TPA”) Company IranTrading and Distribution
100 -
SFL
Afia International Company, Egypt EgyptManufacturing of Edible oils
99.92 99.92
Latimar International LimitedBritish Virgin islands
Dormant Company
100 100
Elington International LimitedBritish Virgin islands
Dormant Company
100 100
Inveskz Inc.
Savola Foods CIS KazakhstanManufacturing of Edible oils
100 100
KUGU
Yudum Gida Sanayi ve Ticaret A.S (“Yudum”) TurkeyManufacturing of Edible oils
100 100
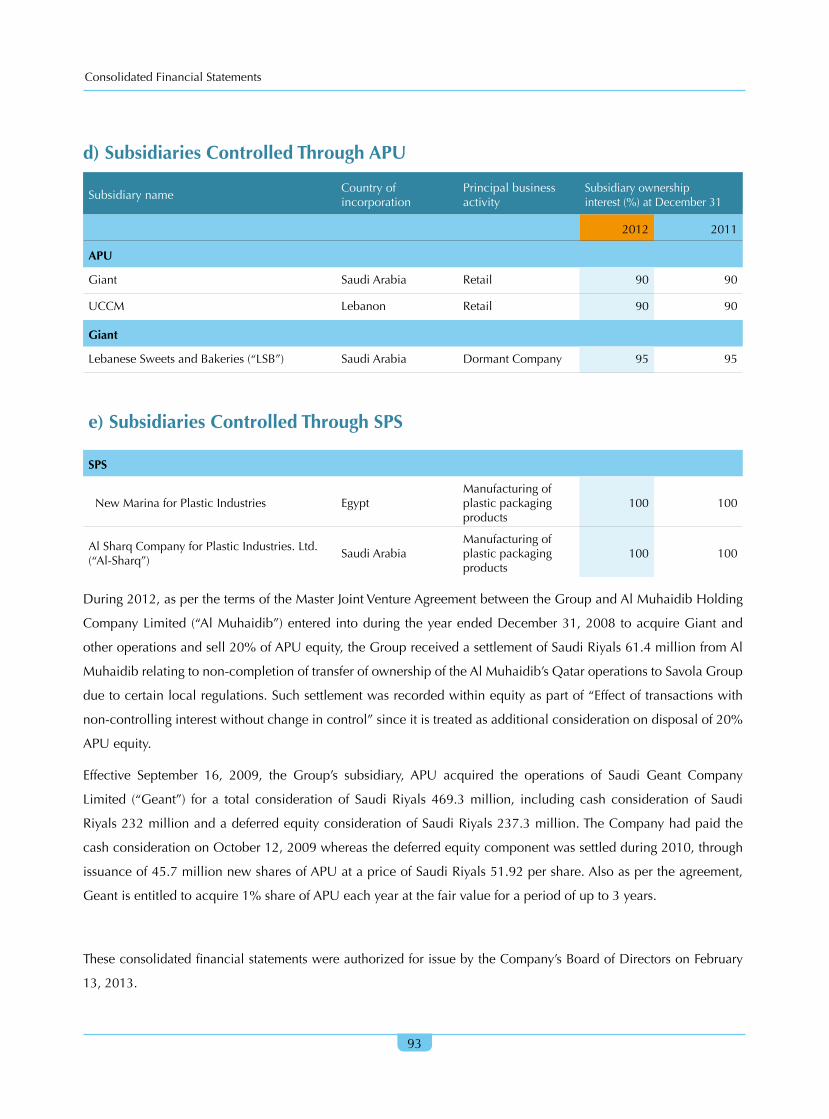
Consolidated Financial Statements
93
d) Subsidiaries Controlled Through APU
Subsidiary nameCountry of incorporation
Principal business activity
Subsidiary ownershipinterest (%) at December 31
2012 2011
APU
Giant Saudi Arabia Retail 90 90
UCCM Lebanon Retail 90 90
Giant
Lebanese Sweets and Bakeries (“LSB”) Saudi Arabia Dormant Company 95 95
e) Subsidiaries Controlled Through SPS
SPS
New Marina for Plastic Industries EgyptManufacturing of plastic packaging products
100 100
Al Sharq Company for Plastic Industries. Ltd. (“Al-Sharq”)
Saudi ArabiaManufacturing of plastic packaging products
100 100
During 2012, as per the terms of the Master Joint Venture Agreement between the Group and Al Muhaidib Holding
Company Limited (“Al Muhaidib”) entered into during the year ended December 31, 2008 to acquire Giant and
other operations and sell 20% of APU equity, the Group received a settlement of Saudi Riyals 61.4 million from Al
Muhaidib relating to non-completion of transfer of ownership of the Al Muhaidib’s Qatar operations to Savola Group
due to certain local regulations. Such settlement was recorded within equity as part of “Effect of transactions with
non-controlling interest without change in control” since it is treated as additional consideration on disposal of 20%
APU equity.
Effective September 16, 2009, the Group’s subsidiary, APU acquired the operations of Saudi Geant Company
Limited (“Geant”) for a total consideration of Saudi Riyals 469.3 million, including cash consideration of Saudi
Riyals 232 million and a deferred equity consideration of Saudi Riyals 237.3 million. The Company had paid the
cash consideration on October 12, 2009 whereas the deferred equity component was settled during 2010, through
issuance of 45.7 million new shares of APU at a price of Saudi Riyals 51.92 per share. Also as per the agreement,
Geant is entitled to acquire 1% share of APU each year at the fair value for a period of up to 3 years.
These consolidated financial statements were authorized for issue by the Company’s Board of Directors on February
13, 2013.

Consolidated Financial Statements
94
2- Summary of Significant Accounting Policies
The principal accounting policies applied in the preparation of these consolidated financial statements are set out
below. These policies have been consistently applied to all years presented, unless otherwise stated.
2.1 Basis Of Preparation
The accompanying consolidated financial statements have been prepared under the historical cost convention on
the accrual basis of accounting, as modified by revaluation of available-for-sale investments and derivative financial
instruments to fair value, and in compliance with accounting standards promulgated by Saudi Organization for
Certified Public Accountants.
2.2 Critical Accounting Estimates And Judgments
The preparation of financial statements in conformity with generally accepted accounting principles requires the use
of certain critical estimates and assumptions that affect the reported amounts of assets and liabilities and disclosure
of contingent assets and liabilities at the reporting date and the reported amounts of revenues and expenses during
the reporting period. Estimates and judgments are continually evaluated and are based on historical experience and
other factors, including expectations of future events that are believed to be reasonable under the circumstances.
The Group makes estimates and assumptions concerning the future. The resulting accounting estimates will, by
definition, seldom equal the related actual results. The estimates and assumptions that have a significant risk of
causing a material adjustment to the carrying amounts of assets and liabilities within the next financial year are
discussed below:
(a) Impairment of goodwill
The Group tests annually whether goodwill has suffered any impairment, in accordance with the accounting policy
stated in Note 2.3. The recoverable amounts of cash generating units have been determined based on value-in-use
calculations. These calculations require the use of estimates.
(b) Impairment of available for sale investments
The Group exercises judgment to calculate the impairment loss of available for sale investments as well as their
underlying assets. This includes the assessment of objective evidence which causes an other than temporary decline
in the value of investments. Any significant and prolonged decline in the fair value of equity investment below its cost
is considered as objective evidence for the impairment. The determination of what is ‘significant’ and ‘prolonged’
requires judgment. The Group also considers impairment to be appropriate when there is evidence of deterioration
in the financial health of the investee, industry and sector performance, changes in technology, and operational and
financing cash flows.
Consolidated Financial Statements
95
(c) Provision for doubtful debts
A provision for impairment of account receivables is established when there is objective evidence that the Group
will not be able to collect all amounts due according to the original terms of the receivables. Significant financial
difficulties of the debtor, probability that the debtor will enter bankruptcy or financial reorganization, and default or
delinquency in payments are considered indicators that the trade receivable is impaired. For significant individual
amounts, assessment is made at individual basis. Amounts which are not individually significant, but are overdue, are
assessed collectively and a provision is recognized considering the length of time considering the past recovery rates.
(d) Provision for inventory obsolescence
The Group determines its provision for inventory obsolescence based upon historical experience, expected
inventory turnover, inventory aging and current condition, and current and future expectations with respect to sales.
Assumptions underlying the provision for inventory obsolescence include future sales trends, and the expected
inventory requirements and inventory composition necessary to support these future sales and offerings. The estimate
of the Group’s provision for inventory obsolescence could materially change from period to period due to changes
in product offerings of those products.
2.3 Investments
(a) Subsidiaries
Subsidiaries are entities over which the Group has the power to govern the financial and operating policies to obtain
economic benefit generally accompanying a shareholding of more than one half of the voting rights. The existence
and effect of potential voting rights that are currently exercisable or convertible are considered when assessing
whether the Group controls another entity. Subsidiaries are fully consolidated from the date on which control is
transferred to the Group. They are de-consolidated from the date that control ceases.
The purchase method of accounting is used to account for the acquisition of subsidiaries. The cost of an acquisition
is measured as the fair value of the assets given or liabilities incurred or assumed at the date of acquisition, plus costs
directly attributable to the acquisition. The excess of the cost of acquisition over the fair value of the Group’s share
of the identifiable net assets acquired is recorded as goodwill. Goodwill arising from acquisition of subsidiaries is
reported under “intangible assets” in the accompanying balance sheet. Goodwill is tested annually for impairment
and carried at cost, net of any accumulated amortization and impairment losses, if any. The subsidiaries over which
Group control is temporary are not consolidated and are accounted for as an associates.
Inter-company transactions, balances and unrealized gains on transactions between Group companies are eliminated.
Unrealized losses are also eliminated. Accounting policies of subsidiaries have been changed where necessary to
ensure consistency with the policies adopted by the Group.
Changes in a group’s ownership interest in a subsidiary after acquiring control, is accounted as equity transactions
and the carrying amounts of the minority interests is adjusted against the fair value of the consideration paid and
any difference is recognized directly in equity under “Effect of acquisition transactions with non-controlling interest
without change in control”.
Consolidated Financial Statements
96
(b) Associates
Associates are entities over which the Group has significant influence but not control, generally accompanying a
shareholding of between 20% and 50% of the voting rights. Investments in associates are accounted for using the
equity method of accounting and are initially recognized at cost. The Group’s investment in associates includes
goodwill identified on acquisition, net of any accumulated amortization and impairment losses, if any.
The Group’s share of its associates’ post-acquisition income or losses is recognized in the income statement, and its
share of post-acquisition movements in reserves is recognized in reserves. The cumulative post-acquisition movements
are adjusted against the carrying amount of the investment. When the Group’s share of losses in associate companies
equals or exceeds its interest in the associate and jointly-controlled company, including any other unsecured
receivables, the Group does not recognize further losses, unless it has incurred obligations or made payments on
behalf of the associate.
Dilution gains and losses arising in investments in associates are recognized in the income statement.
(c) Investment in available-for sale investments
Available-for-sale investments principally consist of less than 20% equity investments in certain quoted/unquoted
investments. These investments are included in non-current assets unless management intends to sell such
investments within twelve months from the balance sheet date. These investments are initially recognized at cost and
are subsequently re-measured at fair value at each reporting date as follows:
(i) Fair values of quoted securities are based on available market prices at the reporting date adjusted for any
restriction on the transfer or sale of such investments; and
(ii) Fair values of unquoted securities are based on a reasonable estimate determined by reference to the current
market value of other similar quoted investment securities or are based on the expected discounted cash flows.
Cumulative adjustments arising from revaluation of these investments are reported as a separate component of equity,
as other reserves until the investment is disposed.
Consolidated Financial Statements
97
2.4 Segment Reporting
(a) Business segment
A business segment is group of assets, operations or entities:
(i) Engaged in revenue producing activities;
(ii) Results of its operations are continuously analyzed by management in order to make decisions related to resource
allocation and performance assessment; and
(iii) Financial information is separately available.
(b) Geographical segment
A geographical segment is group of assets, operations or entities engaged in revenue producing activities within
a particular economic environment that are subject to risks and returns different from those operating in other
economic environments.
2.5 Foreign Currency Translations
(a) Reporting currency
These consolidated financial statements are presented in Saudi Riyals which is the reporting currency of the Group.
(b) Transactions and balances
Foreign currency transactions are translated into Saudi Riyals using the exchange rates prevailing at the dates of
the transactions. Foreign exchange gains and losses resulting from the settlement of such transactions and from the
translation at the year-end exchange rates of monetary assets and liabilities denominated in foreign currencies are
recognized in the income statement.
(c) Group companies
The results and financial position of foreign subsidiaries and associates having reporting currencies other than Saudi
Riyals are translated into Saudi Riyals as follows:
(i) Assets and liabilities for each balance sheet presented are translated at the closing exchange rate at the date of
that balance sheet;
(ii) Income and expenses for each income statement are translated at average exchange rates; and
(iii) Components of the equity accounts are translated at the exchange rates in effect at the dates that the related items
originated.

Consolidated Financial Statements
98
Cumulative adjustments resulting from the translations of the financial statements of foreign subsidiaries and associates
into Saudi Riyals are reported as a separate component of equity.
Any goodwill arising on acquisition of foreign subsidiaries and any subsequent fair value adjustments to the carrying
values of assets and liabilities arising on the acquisition are treated as assets and liabilities of the foreign subsidiaries
and translated at the closing rate and recognized in the equity.
Dividends received from associates are translated at the exchange rate in effect at the transaction date and related
currency translation differences are realized in the income statement.
When investments in foreign subsidiaries and associates are partially disposed off or sold, currency translation
differences that were recorded in equity are recognized in income as part of gain or loss on disposal or sale.
2.6 Cash And Cash Equivalents
Cash and cash equivalents include cash in hand and with banks and other short-term highly liquid investments with
maturities of three months or less from the purchase date.
2.7 Accounts Receivable
Accounts receivable are carried at original invoice amount less provision for doubtful debts. A provision against
doubtful debts is established when there is objective evidence that the Group will not be able to collect all amounts
due according to the original terms of the receivables. Such provisions are charged to the income statement and
reported under “General and administrative expenses”. When an account receivable is uncollectible, it is written-off
against the provision for doubtful debts. Any subsequent recoveries of amounts previously written-off are credited
against “General and administrative expenses” in the income statement.
2.8 Inventories
Inventories are carried at the lower of cost or net realizable value. Cost is determined using the weighted average
method. The cost of finished products include the cost of raw materials, labor and production overheads. Inventories
in transit are valued at cost. Stores and spares are valued at cost, less any provision for slow moving items.
Net realizable value is the estimated selling price in the ordinary course of business, less the costs of completion and
selling expenses.

Consolidated Financial Statements
99
2.9 Property, Plant And Equipment
Property, plant and equipment are carried at cost less accumulated depreciation except construction in progress
which is carried at cost. Land is not depreciated. Depreciation is charged to the income statement, using the straight-
line method, to allocate the costs of the related assets to their residual values over the following estimated useful lives:
Years
Buildings 12.5 - 33
Leasehold improvements 3 - 33
Plant and equipment 3 - 30
Furniture and office equipment 3 - 16
Vehicles 4 - 10
Gains and losses on disposals are determined by comparing proceeds with carrying amount and are included in the
income statement.
Maintenance and normal repairs which do not materially extend the estimated useful life of an asset are charged to
the income statement as and when incurred. Major renewals and improvements, if any, are capitalized and the assets
so replaced are retired.
2.10 Investment Property
Property held for long-term rental yields or for capital appreciation or both, which is not occupied by the Group is
classified as investment property and is reported under “Other investments”. Investment property comprises land,
buildings and lease hold improvements. Investment property is recorded at historical cost, net of accumulated
depreciation. Historical cost includes expenditure that is directly attributable to the acquisition of the assets.
Subsequent costs are included in the asset’s carrying amount or recognized as a separate asset, as appropriate, only
when it is probable that future economic benefits associated with the asset will flow to the Group and the cost of
the asset can be measured reliably. The carrying amount of the replaced part is derecognized. All other repairs and
maintenance costs are charged to the income statement during the financial period in which they are incurred. Land
is not depreciated.
Consolidated Financial Statements
100
2.11 Deferred Charges
Costs that are not of benefit beyond the current period are charged to the income statement, while costs that will
benefit future periods are capitalized. Deferred charges, reported under “Intangible assets” in the accompanying
balance sheet, include certain indirect construction costs incurred by the Group in relation to setting up its retail
outlets. Such costs are amortized over periods which do not exceed five years.
2.12 Impairment of Non-Current Assets
Non-current assets are reviewed for impairment whenever events or changes in circumstances indicate that the
carrying amount may not be recoverable. An impairment loss is recognized for the amount by which the carrying
amount of the asset exceeds its recoverable amount which is the higher of an asset’s fair value less cost to sell
and value in use. For the purpose of assessing impairment, assets are grouped at lowest levels for which there are
separately identifiable cash flows (cash-generating units). Non-current assets other than intangible assets that suffered
impairment are reviewed for possible reversal of impairment at each reporting date. Where an impairment loss
subsequently reverses, the carrying amount of the asset or cash-generating unit is increased to the revised estimate
of its recoverable amount, but the increased carrying amount should not exceed the carrying amount that would
have been determined, had no impairment loss been recognized for the assets or cash-generating unit in prior years.
A reversal of an impairment loss is recognized as income immediately in the income statement. Impairment losses
recognized on intangible assets are not reversible.
2.13 Assets And Liabilities Classified As Held For Sale
Assets held for sale comprise of assets and liabilities or a disposal group that are expected to be recovered primarily
through sale rather than through continuing use. Immediately before classification as held for sale, all assets in a
disposal group are measured at the lower of their carrying amount and fair value less costs to sell. Subsequent to
initial recognition, any impairment loss on a disposal group is first allocated to goodwill, (if there is any) and then to
the remaining assets and liabilities on pro rata basis. However, no loss is allocated to financial assets, which continue
to be measured in accordance with their initial accounting policies. Gains or losses on disposal of such assets or
disposal group are currently recognized in the consolidated income statement.
2.14 Borrowings
Borrowings are recognized as the proceeds received, net of transaction costs incurred, if any. Borrowing costs that
are directly attributable to the acquisition, construction or production of qualifying assets are capitalized as part of
those assets. Other borrowing costs are charged to the income statement.

Consolidated Financial Statements
101
2.15 Accounts Payable And Accruals
Liabilities are recognized for amounts to be paid for goods and services received, whether or not billed to the Group.
2.16 Provisions
Provisions are recognized when; the Group has a present legal or constructive obligation as a result of a past event;
it is probable that an outflow of resources will be required to settle the obligation; and the amount can be reliably
estimated.
2.17 Zakat And Taxes
The Company is subject to zakat in accordance with the regulations of the Department of Zakat and Income Tax
(“DZIT”). Foreign shareholders in consolidated Saudi Arabian subsidiaries are subject to income taxes. Income
tax provisions related to the foreign shareholders in such subsidiaries are charged to the minority interest in the
accompanying consolidated financial statements. Provision for zakat for the Company and zakat related to the
Company’s ownership in the Saudi Arabian subsidiaries is charged to the income statement. Additional amounts
payable, if any, at the finalization of final assessments are accounted for when such amounts are determined.
The Company and its Saudi Arabian subsidiaries withhold taxes on certain transactions with non-resident parties in
the Kingdom of Saudi Arabia as required under Saudi Arabian Income Tax Law.
Foreign subsidiaries are subject to income taxes in their respective countries of domicile. Such income taxes are
charged to consolidated income statement.
Deferred income tax assets are recognized on carry-forward tax losses and on all major temporary differences between
financial income and taxable income to the extent that it is probable that future taxable profit will be available against
which such carry-forward tax losses and the temporary differences can be utilized. Deferred income tax liabilities
are recognized on significant temporary differences expected to result in an income tax liability in future periods.
Deferred income taxes are determined using tax rates which have been enacted by the balance sheet date and are
expected to apply when the related deferred income tax asset is realized or the deferred income tax liability is settled.

Consolidated Financial Statements
102
2.18 Employee Termination BenefitsEmployee termination benefits required by Saudi Labor and Workman Law are accrued by the Company and its Saudi Arabian subsidiaries and charged to the income statement. The liability is calculated; as the current value of the vested benefits to which the employee is entitled, should the employee leave at the balance sheet date. Termination payments are based on employees’ final salaries and allowances and their cumulative years of service, as stated in the laws of Saudi Arabia.
Foreign subsidiaries currently provide for employee termination and other benefits as required under the laws of their respective countries of domicile. There are no funded or unfunded benefit plans established by the foreign subsidiaries.
2.19 Revenues Revenues are recognized upon delivery of products and customer acceptance, if any, or on the performance of services. Revenues are shown net of discounts and transportation expenses, and after eliminating sales within the Group.
Rental income from operating leases is recognized in the income statement on a straight-line basis over the lease term. Promotional and display income is comprised of income earned from promotion and display of various products by vendors within the Group’s retail stores, and is recognized in the period in which the product is listed.
Dividend income is recognized when the right to receive payment is established.
2.20 Selling, Marketing And General And Administrative Expenses Selling, marketing and general and administrative expenses include direct and indirect costs not specifically part of production costs as required under generally accepted accounting principles. Allocations between selling, marketing and general and administrative expenses and production costs, when required, are made on a consistent basis.

Consolidated Financial Statements
103
2.21 Dividends
Dividends are recorded in the financial statements in the period in which they are approved by shareholders of the
Group.
2.22 Derivative Financial Instruments
The Group uses derivative financial instruments (commodity future contracts) to hedge its price risk of raw material
in the Sugar business. Derivatives are measured at fair value, and changes in the fair value of a derivative hedging
instrument are recognized in the income statement under cost of sales as an adjustment to the carrying amount of
the hedged item, inventory.
2.23 Operating Leases
Rental expenses under operating leases are charged to the income statement over the period of the respective lease.
3- Financial Instruments And Risk Management
The Group’s activities expose it to a variety of financial risks: market risks (including currency risk, fair value and cash
flow interest rate risks and price risk), credit risk and liquidity risk. The Group’s overall risk management program
focuses on the unpredictability of financial markets and seeks to minimize potential adverse effects on the Group’s
financial performance. The Group uses derivative financial instruments to hedge certain risk exposures.
Risk management is carried out by senior management under policies approved by the board of directors. Senior
management identifies, evaluates and hedges financial risks in close co-operation with the Group’s operating units.
The most important types of risk are credit risk, currency risk and fair value and cash flow interest rate risks.
Financial instruments carried on the balance sheet include cash and cash equivalents, accounts receivable,
investments, long term receivables, short-term and long-term borrowings, accounts payable and accrued and other
current liabilities. The particular recognition methods adopted are disclosed in the individual policy statements
associated with each item.
Financial assets and liabilities are offset and net amounts reported in the financial statements, when the Group has a
legally enforceable right to offset the recognized amounts and intends either to settle on a net basis, or to realize the
assets and liabilities simultaneously.

Consolidated Financial Statements
104
3.1 Currency Risk
Currency risk is the risk that the value of a financial instrument will fluctuate due to changes in foreign exchange rates.
The Group’s transactions are principally in Saudi Riyals, US Dollars, Iranian Riyals, Egyptian Pounds, and Turkish Lira.
The Group operates internationally and is exposed to foreign exchange risk arising from various currency exposures.
The Group also has investments in foreign subsidiaries and associates, whose net assets are exposed to currency
translation risk. Currently, such exposures are mainly related to exchange rate movements between Saudi Riyals
against Turkish Lira, Egyptian Pounds and Iranian Riyals. Such exposures are recorded as a separate component of
shareholders’ equity in the accompanying financial statements. The Group’s management monitors such exposures
and considers the use of forward exchange contracts and borrowings denominated in the relevant foreign currency
to hedge the foreign currency exposures.
3.2 Fair Value And Cash Flow Interest Rate Risks
Fair value and cash flow interest rate risks are the exposures to various risks associated with the effect of fluctuations
in the prevailing interest rates on the Group’s financial positions and cash flows. The Group’s interest rate risks arise
mainly from its short-term deposits and bank borrowings, which are at floating rates of interest and are subject to
re-pricing on a regular basis. Management monitors the changes in interest rates and believes that the fair value and
cash flow interest rate risks to the Group are not significant.
3.3 Price Risk
The risk that the value of a financial instrument will fluctuate as a result of changes in market prices, whether those
changes are caused by factors specific to the individual instrument or its issuer or factors affecting all instruments
traded in the market. The Group is exposed to equity securities price risk because the Group holds investments
in certain listed equities which are classified on the balance sheet as available-for-sale investments. The Group
diversifies its portfolio to manage its price risk arising from investments in equity securities.
Consolidated Financial Statements
105
3.4 Credit Risk
Credit risk is the risk that one party to a financial instrument will fail to discharge an obligation and cause the other
party to incur a financial loss. The Group has no significant concentration of credit risk. Cash and cash equivalents
are placed with banks with sound credit ratings. Accounts receivable are carried net of provision for doubtful debts.
3.5 Liquidity Risk
Liquidity risk is the risk that an enterprise will encounter difficulty in raising funds to meet commitments associated
with financial instruments. Liquidity risk may result from an inability to sell a financial asset quickly at an amount
close to its fair value. Liquidity risk is managed by monitoring on a regular basis that sufficient funds are available
through committed credit facilities to meet any future commitments.
As at December 31, 2012, the Group has unused bank financing facilities amounting to Saudi Riyals 3.2 billion
(2011: Saudi Riyals 3.4 billion)
3.6 Fair Value
Fair value is the amount for which an asset could be exchanged, or a liability settled between knowledgeable willing
parties in an arm’s length transaction. As the Group’s financial instruments are compiled under the historical cost
convention, except for available-for-sale investments which are carried at fair values, differences can arise between
the book values and fair value estimates. Management believes that the fair values of the Group’s financial assets and
liabilities are not materially different from their carrying values.
4. Segment Information
The Group operates principally in the following major business segments:
• Foods - includes manufacturing and sale of Edible oils, Sugar and Pasta products.
• Retail - includes Group’s hyper and super markets operations.
• Plastic - includes manufacturing and sale of Plastic products for industrial and commercial use.
Investment and other activities segment - includes Group subsidiaries which are engaged in real estate activities,
investments in associates, available-for-sale investments and other investments.
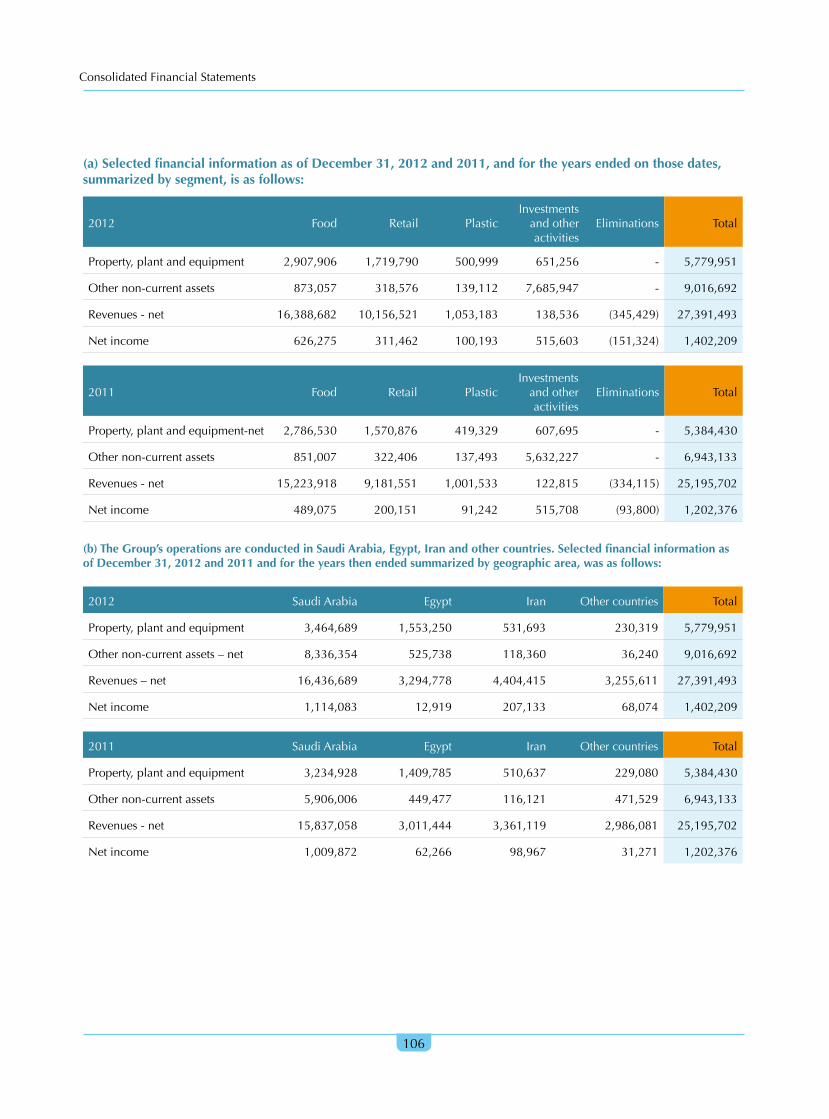
Consolidated Financial Statements
106
(a) Selected financial information as of December 31, 2012 and 2011, and for the years ended on those dates, summarized by segment, is as follows:
2012 Food Retail PlasticInvestments
and other activities
Eliminations Total
Property, plant and equipment 2,907,906 1,719,790 500,999 651,256 - 5,779,951
Other non-current assets 873,057 318,576 139,112 7,685,947 - 9,016,692
Revenues - net 16,388,682 10,156,521 1,053,183 138,536 (345,429) 27,391,493
Net income 626,275 311,462 100,193 515,603 (151,324) 1,402,209
2011 Food Retail PlasticInvestments
and other activities
Eliminations Total
Property, plant and equipment-net 2,786,530 1,570,876 419,329 607,695 - 5,384,430
Other non-current assets 851,007 322,406 137,493 5,632,227 - 6,943,133
Revenues - net 15,223,918 9,181,551 1,001,533 122,815 (334,115) 25,195,702
Net income 489,075 200,151 91,242 515,708 (93,800) 1,202,376
(b) The Group’s operations are conducted in Saudi Arabia, Egypt, Iran and other countries. Selected financial information as of December 31, 2012 and 2011 and for the years then ended summarized by geographic area, was as follows:
2012 Saudi Arabia Egypt Iran Other countries Total
Property, plant and equipment 3,464,689 1,553,250 531,693 230,319 5,779,951
Other non-current assets – net 8,336,354 525,738 118,360 36,240 9,016,692
Revenues – net 16,436,689 3,294,778 4,404,415 3,255,611 27,391,493
Net income 1,114,083 12,919 207,133 68,074 1,402,209
2011 Saudi Arabia Egypt Iran Other countries Total
Property, plant and equipment 3,234,928 1,409,785 510,637 229,080 5,384,430
Other non-current assets 5,906,006 449,477 116,121 471,529 6,943,133
Revenues - net 15,837,058 3,011,444 3,361,119 2,986,081 25,195,702
Net income 1,009,872 62,266 98,967 31,271 1,202,376
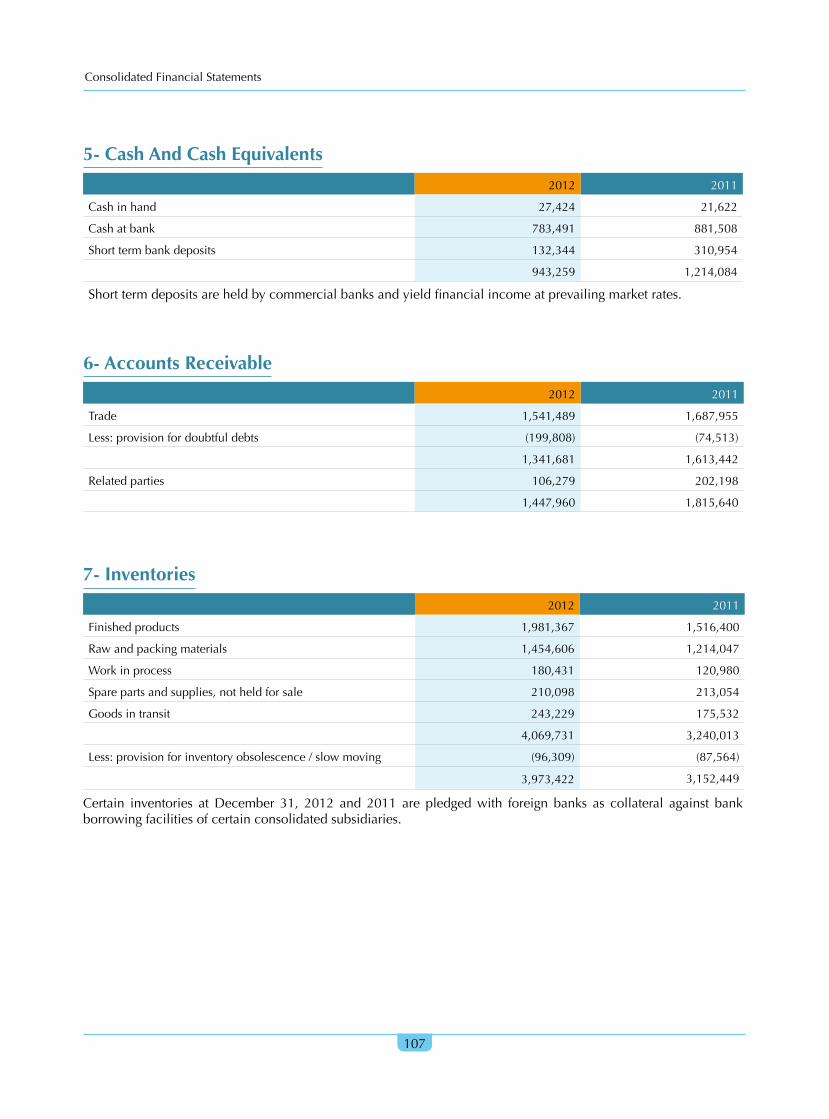
Consolidated Financial Statements
107
5- Cash And Cash Equivalents
2012 2011
Cash in hand 27,424 21,622
Cash at bank 783,491 881,508
Short term bank deposits 132,344 310,954
943,259 1,214,084
Short term deposits are held by commercial banks and yield financial income at prevailing market rates.
6- Accounts Receivable
2012 2011
Trade 1,541,489 1,687,955
Less: provision for doubtful debts (199,808) (74,513)
1,341,681 1,613,442
Related parties 106,279 202,198
1,447,960 1,815,640
7- Inventories
2012 2011
Finished products 1,981,367 1,516,400
Raw and packing materials 1,454,606 1,214,047
Work in process 180,431 120,980
Spare parts and supplies, not held for sale 210,098 213,054
Goods in transit 243,229 175,532
4,069,731 3,240,013
Less: provision for inventory obsolescence / slow moving (96,309) (87,564)
3,973,422 3,152,449
Certain inventories at December 31, 2012 and 2011 are pledged with foreign banks as collateral against bank borrowing facilities of certain consolidated subsidiaries.
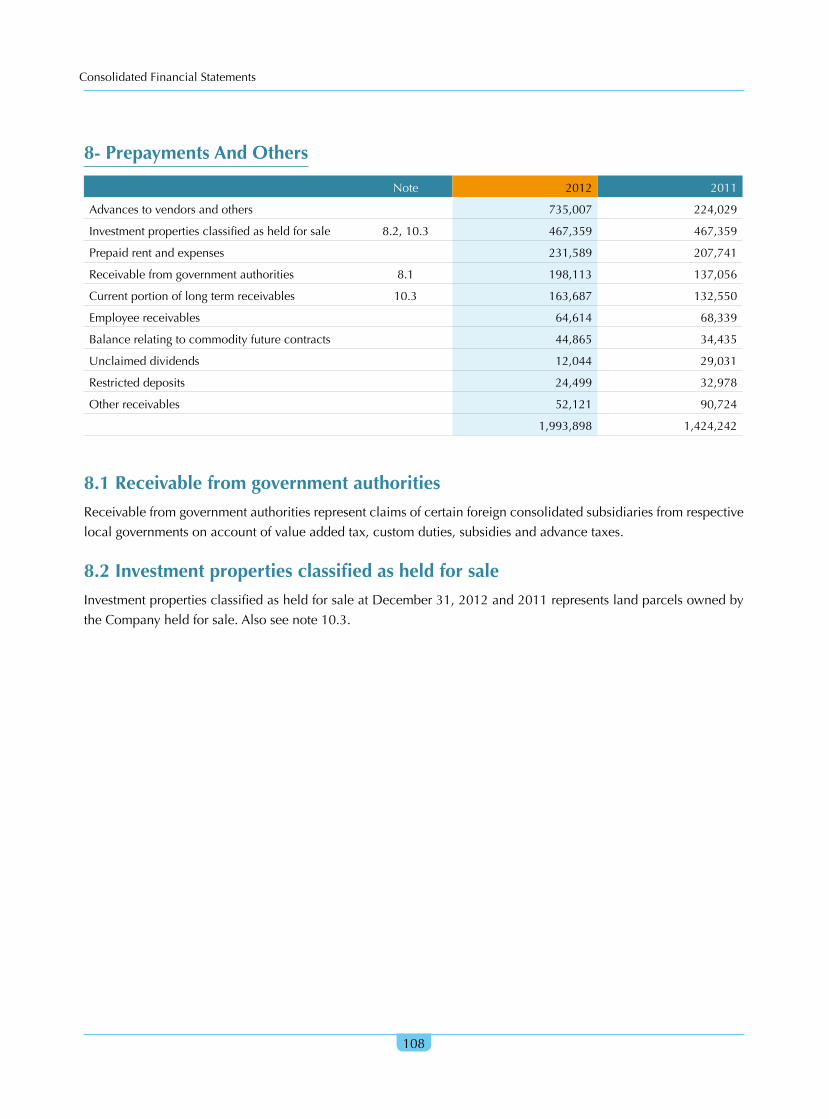
Consolidated Financial Statements
108
8- Prepayments And Others
Note 2012 2011
Advances to vendors and others 735,007 224,029
Investment properties classified as held for sale 8.2, 10.3 467,359 467,359
Prepaid rent and expenses 231,589 207,741
Receivable from government authorities 8.1 198,113 137,056
Current portion of long term receivables 10.3 163,687 132,550
Employee receivables 64,614 68,339
Balance relating to commodity future contracts 44,865 34,435
Unclaimed dividends 12,044 29,031
Restricted deposits 24,499 32,978
Other receivables 52,121 90,724
1,993,898 1,424,242
8.1 Receivable from government authoritiesReceivable from government authorities represent claims of certain foreign consolidated subsidiaries from respective
local governments on account of value added tax, custom duties, subsidies and advance taxes.
8.2 Investment properties classified as held for sale Investment properties classified as held for sale at December 31, 2012 and 2011 represents land parcels owned by
the Company held for sale. Also see note 10.3.
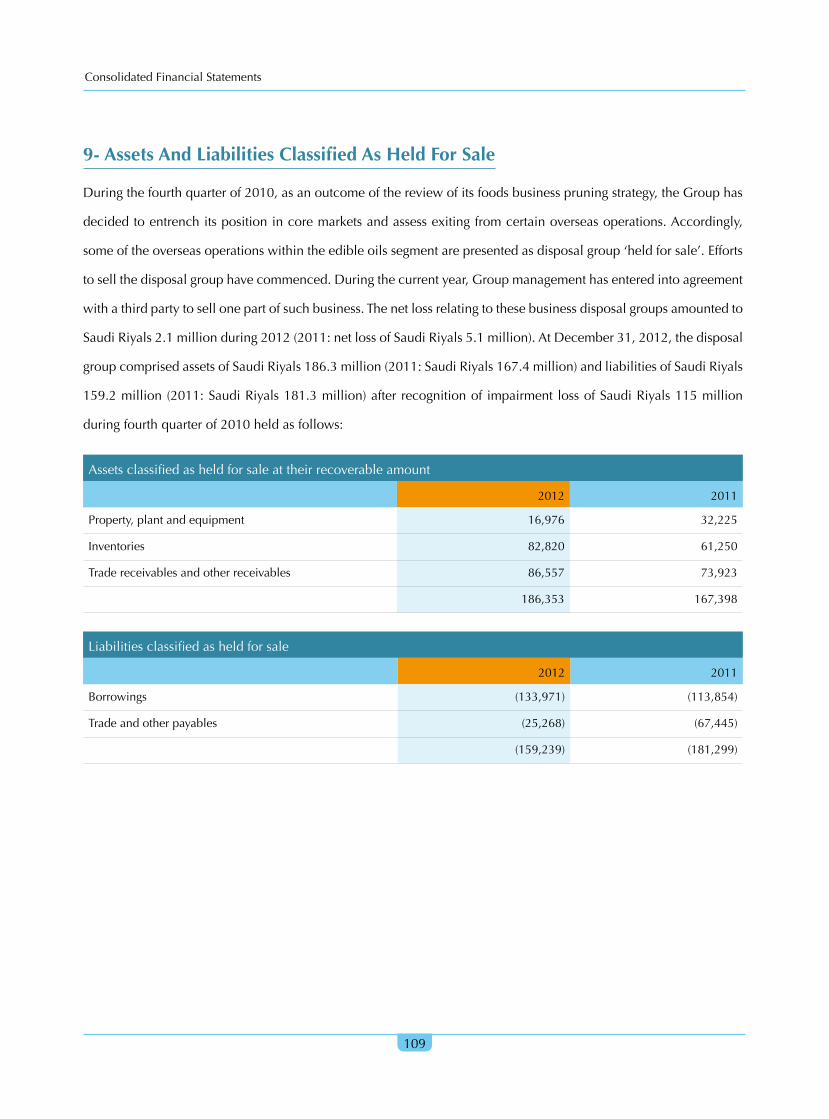
Consolidated Financial Statements
109
9- Assets And Liabilities Classified As Held For Sale
During the fourth quarter of 2010, as an outcome of the review of its foods business pruning strategy, the Group has
decided to entrench its position in core markets and assess exiting from certain overseas operations. Accordingly,
some of the overseas operations within the edible oils segment are presented as disposal group ‘held for sale’. Efforts
to sell the disposal group have commenced. During the current year, Group management has entered into agreement
with a third party to sell one part of such business. The net loss relating to these business disposal groups amounted to
Saudi Riyals 2.1 million during 2012 (2011: net loss of Saudi Riyals 5.1 million). At December 31, 2012, the disposal
group comprised assets of Saudi Riyals 186.3 million (2011: Saudi Riyals 167.4 million) and liabilities of Saudi Riyals
159.2 million (2011: Saudi Riyals 181.3 million) after recognition of impairment loss of Saudi Riyals 115 million
during fourth quarter of 2010 held as follows:
Assets classified as held for sale at their recoverable amount
2012 2011
Property, plant and equipment 16,976 32,225
Inventories 82,820 61,250
Trade receivables and other receivables 86,557 73,923
186,353 167,398
Liabilities classified as held for sale
2012 2011
Borrowings (133,971) (113,854)
Trade and other payables (25,268) (67,445)
(159,239) (181,299)
Consolidated Financial Statements
110
10- Investments
Note 2012 2011
Investment in associates 10.1 6,806,659 4,528,075
Available for sale investments 10.2 694,234 795,472
Other investments 10.3 25,767 8,614
7,526,660 5,332,161
10.1 Investment In Associates
2012 2011
January 1 4,528,075 4,567,301
Additions 1,980,679 219,892
Share in net income 568,793 436,863
Other reserves adjustment (41,205) 17,894
Disposal (1,748) -
Dividends (228,098) (222,303)
Effect of consolidation of ASCE - (436,358)
Other adjustments 163 (55,214)
December 31 6,806,659 4,528,075
Effective ownership interest (%)
2012 2011 2012 2011
Almarai Company Ltd (“Almarai”) (see below) 36.52 29.95 5,200,273 2,961,937
Kinan International for Real Estate Development Company (“Kinan International”)
29.9 30 511,857 507,160
Intaj Capital Limited (“Intaj”) 49 49 365,044 374,324
Diyar Al Mashreq (“Diyar”) 30 30 263,230 259,353
Al-Seera City Company for Real Estate Development
40 40 164,578 164,578
Herfy Foods Services Company (“Herfy”) 49 49 282,477 241,166
Knowledge Economic City Development Company
17 17 17,200 17,200
Other Various Various 2,000 2,357
6,806,659 4,528,075
During October, 2012, the Company acquired 6.57% additional equity in Almarai amounting to Saudi Riyals 1.98 billion. The acquisition resulted in on the increase in the Company’s ownership interest in Almarai to 36.52% at December 31, 2012.

Consolidated Financial Statements
111
10.2 Available-For-Sale Investments
AFS investments at December 31, principally comprise the following:
2012 2011
Quoted investments
Emaar the Economic City (“Emaar”) 61,782 183,751
Knowledge Economic City 273,672 238,920
Taameer Jordan Holding Company 9,534 23,555
Unquoted investments
Swicorp Joussour Company 208,819 208,819
Swicorp, Saudi Arabia 115,674 115,674
Others 24,753 24,753
694,234 795,472
Movement in the available-for-sale investments was as follows:
2012 2011
January 1 795,472 725,572
Disposals (124,650) (1,510)
Other reserves adjustments 36,312 71,410
Other Adjustment (12,900) -
December 31 694,234 795,472
During 2012, the Group partially disposed its investment in Emaar at a capital gain of Saudi Riyals 46.7 million.
Available-for-sale investments are denominated in the following currencies:
2012 2011
Saudi Riyals 684,700 771,916
Jordanian Dinar 9,534 23,556
694,234 795,472
Consolidated Financial Statements
112
10.3 Other Investments2012 2011
Long term bank deposits of SBeC 25,767 8,614
Investment properties - -
25,767 8,614
Movement in investment properties is as follows:
Note 2012 2011
January 1 - 803,998
Additions - 3,239
Assets held for sale 8 - (467,359)
Disposals - (339,878)
December 31 - -

Consolidated Financial Statements
113
Investment properties represent land parcels owned by the Company in Saudi Arabia. During 2011, the Company’s
land parcels located in Riyadh having a carrying value of Saudi Riyals 340 million were sold to Kinan International
(an Associate company) at a total price of Saudi Riyals 608 million. The Company made a gain of Saudi Riyals 152.8
million on these sales. As per the terms of the agreement, Kinan International will pay the price in installments
ranging up to the year 2014. Total payments of Saudi Riyals 261.9 million have been received by the Company as at
December 31, 2012.
The above mentioned receivable amounts from Kinan International are discounted at their respective present
values and are disclosed as Long term receivables on the balance sheet. The schedules for the receipt of remaining
installments for the above transactions are due as follows:
2012
2013 (Included in prepayments and other receivables) 163,687
2014 (Disclosed as long term receivables) 167,899
331,586
The installments due in 2014 amounting to Saudi Riyals 167.97 million are classified as long term receivables in the
accompanying consolidated financial statements.
Also, during 2011 the Company entered into an agreement to sell the remaining land parcels amounting to Saudi
Riyals 467 million to KEC and accordingly these have been classified as held for sale (Note 8) in the accompanying
consolidated financial statements. Under the agreement, the Company will transfer its ownership in two land parcels
located in the Madina Al Munawarah to Mojammat at a sale value of Saudi Riyals 631.3 million and subsequently
sell its 80% equity ownership in Mojammat to KEC. Pursuant to the agreement, KEC paid an advance amount of
Saudi Riyals 16.3 million to the Company upon signing of the agreement and remaining amount will be paid upon
completion of transferring of land ownership deeds to Mojammat and the completion of formalities for transfer of
80% equity ownership of Mojammat to KEC. Accordingly, Mojammat was not consolidated in the accompanying
consolidated financial statements as at December 31, 2012.

Consolidated Financial Statements
114
11- Property, Plant And Equipment
Land Buildings LeaseholdPlant and
equipment
Furniture and office
equipment Vehicles
Construction work in
progressTotal
Cost
January 1, 2012
662,288 1,751,401 542,294 3,651,355 1,230,677 281,993 899,616 9,019,624
Additions 50,166 32,953 16,155 75,130 67,543 36,012 792,224 1,070,183
Disposals (30,731) (15,802) (1,061) (32,982) (19,375) (9,819) (2,664) (112,434)
Transfer from / (to) CWIP
- 8,748 122,605 41,277 92,286 170 (265,086) -
Currency translation adjustment
(2,224) (34,119) (1,680) (85,561) (5,018) (3,957) (30,349) (162,908)
December 31, 2012
679,499 1,743,181 678,313 3,649,219 1,366,113 304,399 1,393,741 9,814,465
Accumulated depreciation
January 1, 2012
(397) (603,747) (161,437) (1,970,637) (720,989) (162,492) - (3,619,699)
Additions - (51,764) (63,428) (210,794) (153,174) (54,579) - (533,739)
Disposals - 8,918 295 25,373 16,973 8,564 - 60,123
Currency translation adjustment
- 9,368 (470) 45,443 7,821 13,615 - 75,777
December 31, 2012
(397) (637,225) (225,040) (2,110,615) (849,369) (194,892) - (4,017,538)
NBV of assets held for sale
(3,573) (13,104) - - - - (299) (16,976)
December 31, 2012
675,529 1,092,852 453,273 1,538,604 516,744 109,507 1,393,442 5,779,951
December 31, 2011
658,313 1,145,710 380,955 1,668,826 510,932 120,078 899,616 5,384,430
Consolidated Financial Statements
115
(i) Additions include Saudi Riyals 31 million in respect of finance costs capitalized during 2012 (2011: Saudi Riyals 0.4 million). The average rate used to determine the amount of finance costs capitalized during 2012 was 9.0% (2011: 2.4%).
(ii) Construction work in progress relates to the construction of supermarkets and hypermarkets for APU and upgrading and enhancing the production facilities of SFC, SPS and some of their subsidiaries.
(iii) Under the terms of land lease agreements with Jeddah Industrial City, Jeddah Islamic Port, Riyadh Industrial City, and Industrial zone, Sokhna port, Egypt, certain subsidiaries have renewable operating leases for lands on which their production facilities are located. Annual lease and service charge payments to the lessor are nominal.
(iv) Certain property, plant and equipment of the Group are pledged as collateral with Saudi Industrial Development Fund and commercial banks. Also see Note 14.
12- Intangible Assets
GoodwillDeferred charges
Other intangible assets(Note 12.1)
Total
Cost
January 1, 2012 1,153,250 603,674 - 1,756,924
Additions - 51,309 - 51,309
Adjustments (181,177) - 181,177 -
Write-off - (4,683) - (4,683)
Currency translation adjustment (1,190) - - (1,190)
December 31, 2012 970,883 650,300 181,177 1,802,360
Amortization
January 1, 2012 - (454,630) - (454,630)
Additions - (25,597) - (25,597)
December 31, 2012 - (480,227) - (480,227)
Net balance 970,883 170,073 181,177 1,322,133

Consolidated Financial Statements
116
Goodwill Deferred charges Total
Cost
January 1, 2011 836,516 601,986 1,438,502
Additions 338,949 37,054 376,003
Currency translation adjustment (22,215) - (22,215)
Write-offs - (35,366) (35,366)
December 31, 2011 1,153,250 603,674 1,756,924
Amortization
January 1, 2011 - (413,681) (413,681)
Additions - (40,949) (40,949)
December 31, 2011 - (454,630) (454,630)
Net balance as at December 31, 2011 1,153,250 149,044 1,302,294
12.1 Other Intangible Assets
As disclosed in Note 1 of the accompanying consolidated financial statements, during 2011, the Group acquired
100% ownership interest in El Maleka and El Farasha. The details are as follows:
Purchase Consideration paid 453,434
Net assets acquired (66,599)
Fair value adjustment (65,794)
Total net assets acquired (132,393)
Excess of purchase consideration paid over net assets acquired 321,041
Less: allocated to other intangible assets (181,177)
Goodwill 139,864
Subsequent to Group’s acquisition in 2011 of 100% ownership interest El Maleka and El Farasha in Egypt, for a
total consideration of Saudi Riyals 453 million, and payment of total amount of excess of purchase consideration
paid over net assets acquired of Saudi Riyals 321 million; the Group has carried out an initial fair valuation of assets
acquired on the basis of which an amount of Saudi Riyals 65.8 million has already been allocated to property, plant
and equipment. However, a formal study of Purchase Price Allocation was completed during 2012 and upon its
finalization an amount of Saudi Riyals 181.1 million was allocated to ‘Other Intangible Assets’ mainly representing
the value of brands acquired.
Consolidated Financial Statements
117
12.2 Goodwill
Impairment tests for goodwill
The recoverable amount of goodwill is determined based on fair value calculations. These calculations use cash flow projections based on financial budgets approved by management covering a five year period.
The key assumptions used for fair value calculations are as follows:
(i) Budgeted gross margin.
(ii) Weighted average growth rate
(ii) Discount rate applied to the cash flow projections.
Management determined budgeted gross margin and weighted average growth rates based on past performance and its expectations of market development. The discount rates used are pre-zakat and pre-income tax reflect specific risks relating to the industry. The results of impairment test at December 31, 2012 indicated no impairment charge.
13- Short-Term Borrowings These represent borrowing facilities obtained from various commercial banks and bear financial charges at prevailing market rates which are based on inter-bank offer rates. Certain short-term bank loans at December 31, 2012 were guaranteed by corporate guarantees of the Company.
14- Long-Term Borrowings
Note 2012 2011
Commercial bank loans 14.1 4,503,509 3,453,768
SIDF loans 14.2 19,689 23,829
4,523,198 3,477,597
Current maturity shown under current liabilities
(910,952) (656,103)
3,612,246 2,821,494
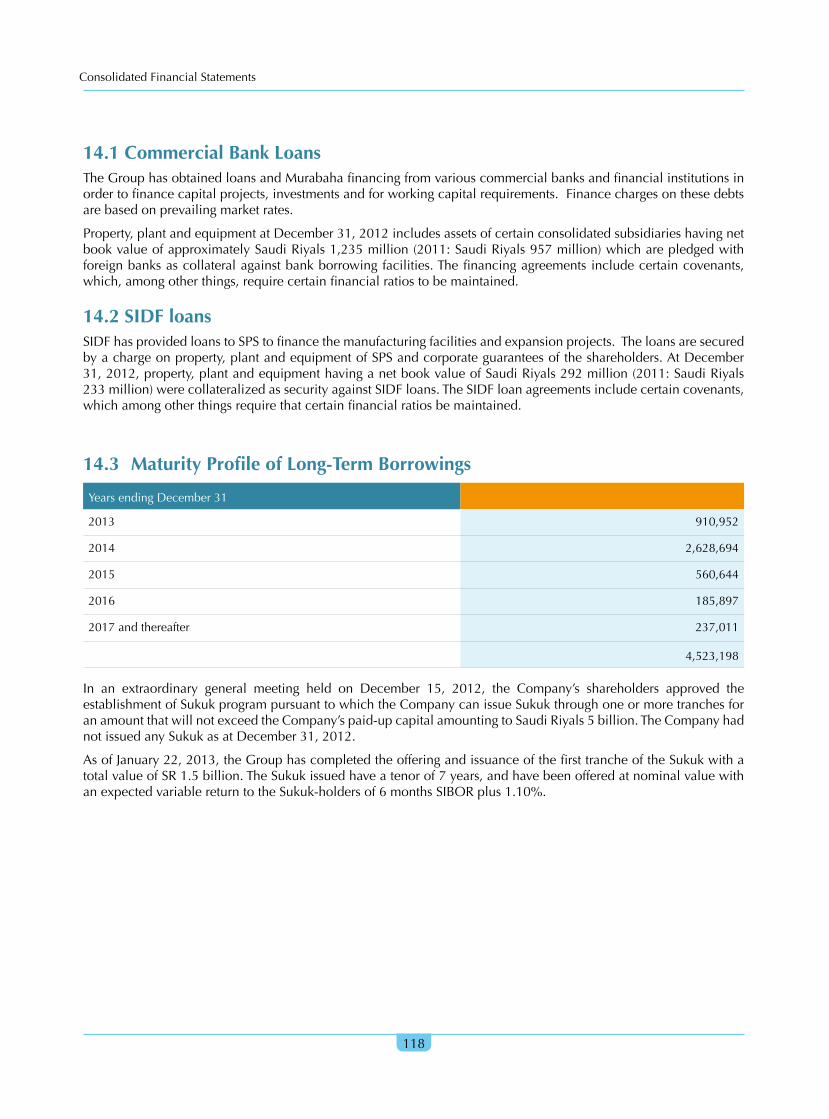
Consolidated Financial Statements
118
14.1 Commercial Bank Loans The Group has obtained loans and Murabaha financing from various commercial banks and financial institutions in order to finance capital projects, investments and for working capital requirements. Finance charges on these debts are based on prevailing market rates.
Property, plant and equipment at December 31, 2012 includes assets of certain consolidated subsidiaries having net book value of approximately Saudi Riyals 1,235 million (2011: Saudi Riyals 957 million) which are pledged with foreign banks as collateral against bank borrowing facilities. The financing agreements include certain covenants, which, among other things, require certain financial ratios to be maintained.
14.2 SIDF loansSIDF has provided loans to SPS to finance the manufacturing facilities and expansion projects. The loans are secured by a charge on property, plant and equipment of SPS and corporate guarantees of the shareholders. At December 31, 2012, property, plant and equipment having a net book value of Saudi Riyals 292 million (2011: Saudi Riyals 233 million) were collateralized as security against SIDF loans. The SIDF loan agreements include certain covenants, which among other things require that certain financial ratios be maintained.
14.3 Maturity Profile of Long-Term Borrowings
Years ending December 31
2013 910,952
2014 2,628,694
2015 560,644
2016 185,897
2017 and thereafter 237,011
4,523,198
In an extraordinary general meeting held on December 15, 2012, the Company’s shareholders approved the establishment of Sukuk program pursuant to which the Company can issue Sukuk through one or more tranches for an amount that will not exceed the Company’s paid-up capital amounting to Saudi Riyals 5 billion. The Company had not issued any Sukuk as at December 31, 2012.
As of January 22, 2013, the Group has completed the offering and issuance of the first tranche of the Sukuk with a total value of SR 1.5 billion. The Sukuk issued have a tenor of 7 years, and have been offered at nominal value with an expected variable return to the Sukuk-holders of 6 months SIBOR plus 1.10%.
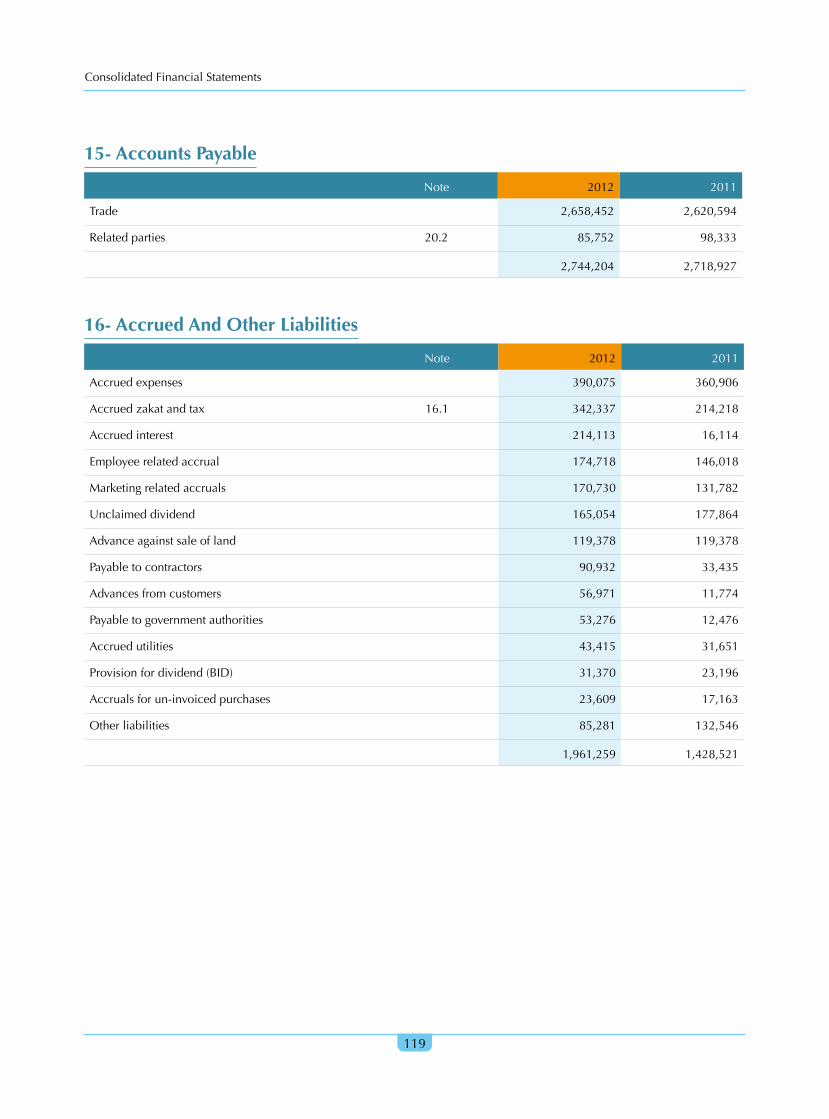
Consolidated Financial Statements
119
15- Accounts Payable
Note 2012 2011
Trade 2,658,452 2,620,594
Related parties 20.2 85,752 98,333
2,744,204 2,718,927
16- Accrued And Other Liabilities
Note 2012 2011
Accrued expenses 390,075 360,906
Accrued zakat and tax 16.1 342,337 214,218
Accrued interest 214,113 16,114
Employee related accrual 174,718 146,018
Marketing related accruals 170,730 131,782
Unclaimed dividend 165,054 177,864
Advance against sale of land 119,378 119,378
Payable to contractors 90,932 33,435
Advances from customers 56,971 11,774
Payable to government authorities 53,276 12,476
Accrued utilities 43,415 31,651
Provision for dividend (BID) 31,370 23,196
Accruals for un-invoiced purchases 23,609 17,163
Other liabilities 85,281 132,546
1,961,259 1,428,521

Consolidated Financial Statements
120
16.1 Zakat And Tax Matters
Zakat and taxes included in the consolidated income statement are comprised of the following:
2012 2011
Income tax 202,963 88,948
Zakat 42,193 43,076
Deferred tax 22,992 -
268,148 132,024
The movement in the accrual for zakat and taxes are as follows:
2012 2011
January 1 214,218 166,634
Charge 245,156 132,024
Payments (117,037) (84,440)
December 31 342,337 214,218
16.1.1 Components of zakat base
The Group’s Saudi Arabia subsidiaries file separate zakat and income tax declarations on unconsolidated basis. The
significant components of the zakat base of each company under zakat and income tax regulation are principally
comprised of shareholders’ equity, provisions at the beginning of year, long-term borrowings and estimated taxable
income, less deductions for the net book value of property, plant and equipment, investments and certain other items.
16.1.2 Status of Final Assessments
(a) Zakat status
The Company has finalized its zakat status up to the year 2004. The Company has filed the Zakat returns for the years
2005 to 2011.

Consolidated Financial Statements
121
The DZIT issued the assessment for the year 2009 and claimed zakat differences of Saudi Riyals 1.3 million. The
Company has paid for such zakat differences and is also appealing such differences with the DZIT.
The Company’s Saudi subsidiaries received final zakat certificates for certain years and provisional zakat certificates
for other years. They have also received queries from the DZIT for the open years, for which replies have been / will
be filed by the respective companies.
Some Saudi consolidated subsidiaries received assessments from the DZIT concerning their zakat declarations for the
open years, in which the DZIT assessed additional zakat liabilities of approximately Saudi Riyals 20.1 million (2011:
Saudi Riyals 62.3 million).
The subsidiaries have objected to such assessments and the matter is pending with the DZIT and Appeal Committees.
Management of the Company and the subsidiaries believe that such additional assessments will not result in the
additional liability and no provisions have been made for such assessments.
(b) Income tax status
The Group’s foreign subsidiaries are obliged to pay income tax as per applicable tax laws of their countries of
incorporation. Some of the subsidiaries are currently tax exempt. Tax paying subsidiaries determine their liabilities
based on applicable corporate rates to the adjusted taxable income for the year. Certain foreign subsidiaries are also
obliged to pay quarterly advanced tax determined on prior year tax liability bases.
Certain subsidiaries have received final tax assessments for certain years and provisional tax assessments for other
years. They have also received queries from departments of income tax after their assessment or inspections for open
years, for which replies have been filed.
The Group management believes that there are no significant amounts under protest with departments of income tax
in any foreign operation.
16.2 Deferred Tax Liability
Deferred tax liability is calculated on temporary difference on end of service provision, deferred rent payable and
property, plant and equipment under the liability method using effective tax rate.
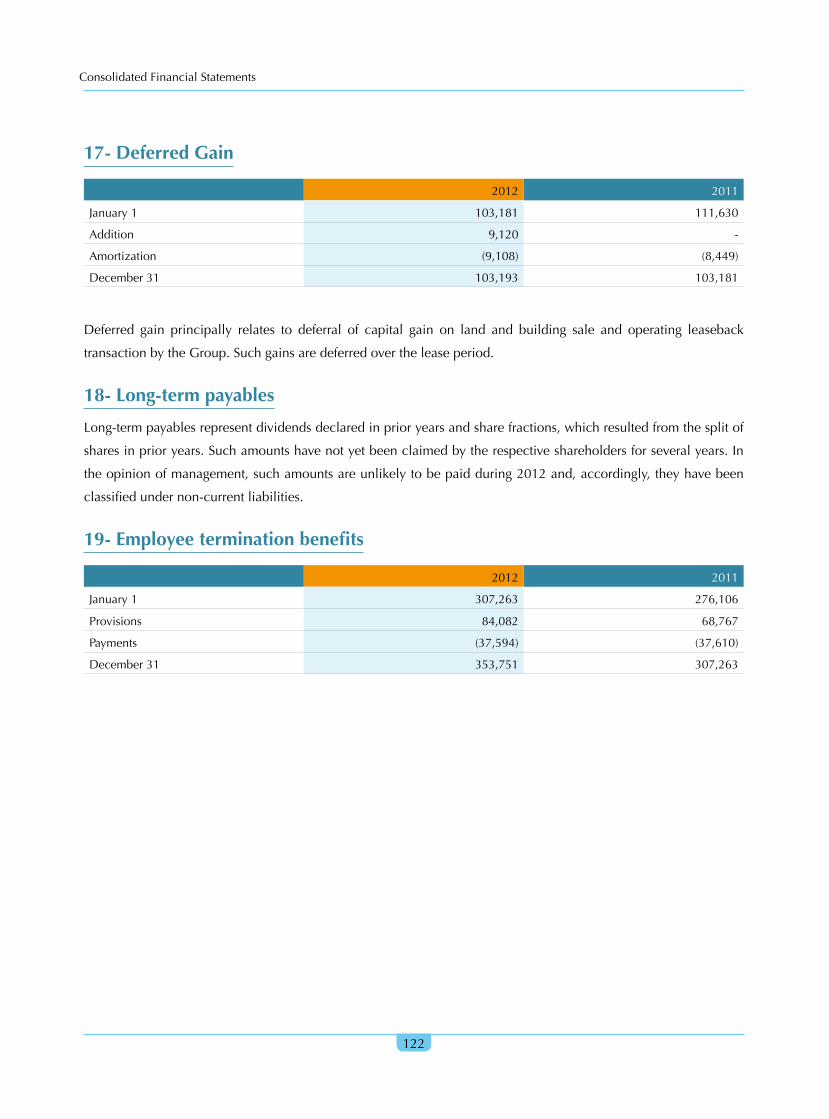
Consolidated Financial Statements
122
17- Deferred Gain
2012 2011
January 1 103,181 111,630
Addition 9,120 -
Amortization (9,108) (8,449)
December 31 103,193 103,181
Deferred gain principally relates to deferral of capital gain on land and building sale and operating leaseback
transaction by the Group. Such gains are deferred over the lease period.
18- Long-term payables
Long-term payables represent dividends declared in prior years and share fractions, which resulted from the split of
shares in prior years. Such amounts have not yet been claimed by the respective shareholders for several years. In
the opinion of management, such amounts are unlikely to be paid during 2012 and, accordingly, they have been
classified under non-current liabilities.
19- Employee termination benefits
2012 2011
January 1 307,263 276,106
Provisions 84,082 68,767
Payments (37,594) (37,610)
December 31 353,751 307,263
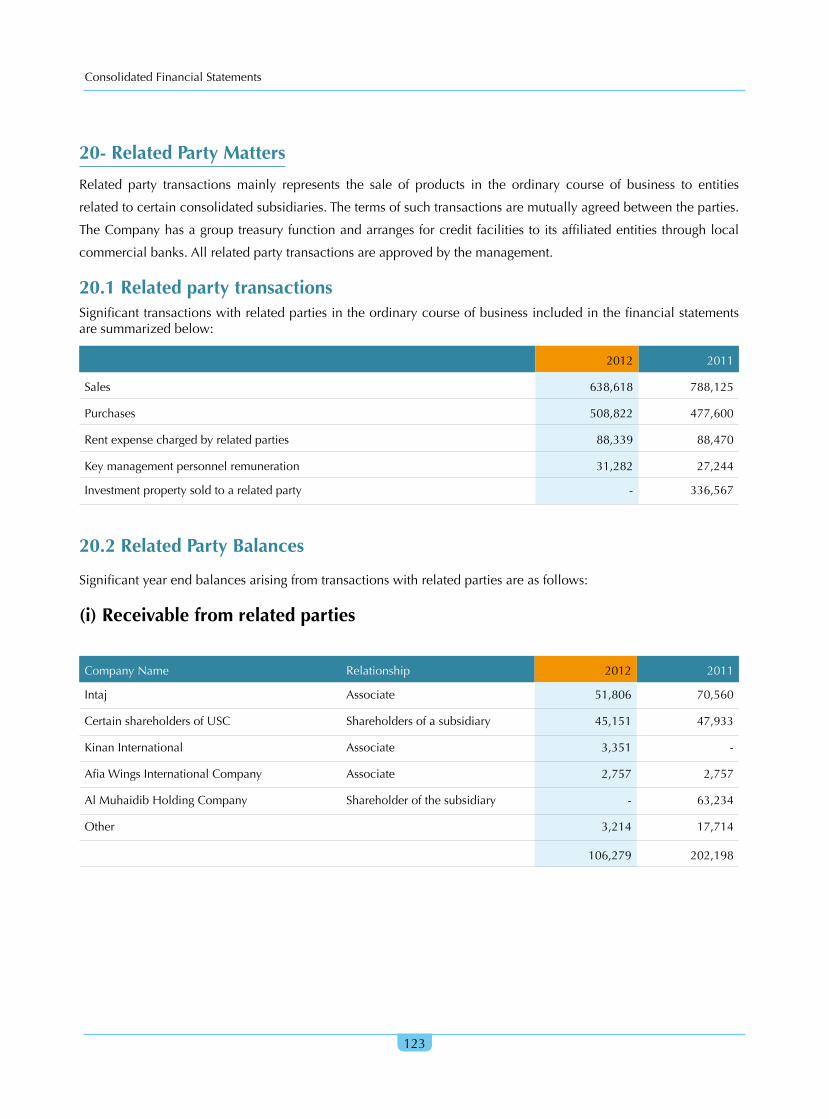
Consolidated Financial Statements
123
20- Related Party Matters
Related party transactions mainly represents the sale of products in the ordinary course of business to entities
related to certain consolidated subsidiaries. The terms of such transactions are mutually agreed between the parties.
The Company has a group treasury function and arranges for credit facilities to its affiliated entities through local
commercial banks. All related party transactions are approved by the management.
20.1 Related party transactions Significant transactions with related parties in the ordinary course of business included in the financial statements are summarized below:
2012 2011
Sales 638,618 788,125
Purchases 508,822 477,600
Rent expense charged by related parties 88,339 88,470
Key management personnel remuneration 31,282 27,244
Investment property sold to a related party - 336,567
20.2 Related Party Balances
Significant year end balances arising from transactions with related parties are as follows:
(i) Receivable from related parties
Company Name Relationship 2012 2011
Intaj Associate 51,806 70,560
Certain shareholders of USC Shareholders of a subsidiary 45,151 47,933
Kinan International Associate 3,351 -
Afia Wings International Company Associate 2,757 2,757
Al Muhaidib Holding Company Shareholder of the subsidiary - 63,234
Other 3,214 17,714
106,279 202,198

Consolidated Financial Statements
124
(ii) Payable to related parties
Company name Relationship 2012 2011
Abdul Kadir Al Muhaidib CompanyShareholder of the Company
33,433 41,597
Almarai Company Associate 27,871 24,229
Herfy Associate 7,375 9,498
Hail Agricultural Development Company
Associate 4,329 4,533
Diyar Associate - 13,699
Other 12,744 4,777
85,752 98,333
20.3 Board of Directors Remuneration
Board of Directors’ remuneration for the year ended December 31, 2012 amounting to Saudi Riyals 2.2 million
(2011: Saudi Riyals 2.2 million) has been calculated in accordance with the Company’s By laws and is considered as
appropriation shown in the statement of changes in shareholders’ equity. Attendance allowances and other expenses
to the directors and members of various board committees for the year ended December 31, 2012 amounting to
Saudi Riyals 636 thousand (2011: Saudi Riyals 634 thousand) are charged to expenses and included under general
and administrative expenses.
21- Share Capital
The share capital of the Company as of December 31, 2012 and 2011 comprised of 500 million shares stated at Saudi
Riyals 10 per share.
22- Statutory Reserve
In accordance with the Regulations for Companies in the Kingdom of Saudi Arabia, the Company transfers 10% of
the net income for the year to a statutory reserve until such reserve equals 50% of its share capital. The statutory
reserve in the accompanying consolidated financial statements is the statutory reserve of the Company. This reserve
currently is not available for distribution to the shareholders of the Company.

Consolidated Financial Statements
125
23- Selling And Marketing Expenses
2012 2011
Salaries, wages and benefits 817,932 713,265
Advertisement 410,483 387,252
Rent 380,639 339,086
Depreciation and amortization 276,024 272,085
Utilities 154,504 151,108
Commission 116,093 79,329
Maintenance 109,014 91,735
Transportation 10,552 6,890
Provision for doubtful debts 2,603 3,150
Other 89,448 100,913
2,367,292 2,144,813
24- General And Administrative Expenses
2012 2011
Salaries, wages and benefits 394,657 351,066
Professional fees 28,048 25,996
Depreciation 24,226 32,875
Traveling 12,750 10,632
Rent 12,225 11,292
Utilities, telephone and communication cost 10,967 10,511
Insurance 10,704 14,207
Training 10,327 9,350
Repairs and maintenance 9,165 7,968
Transportation 8,634 5,116
Supplies and packaging 4,480 4,150
Information technology 4,205 6,201
Inter-Company write-offs - 9,266
Other 59,929 63,842
590,317 562,472

Consolidated Financial Statements
126
25- Other Income (expenses)
2012 2011
Scrap sales 30,381 26,751
Product listing and opening fees 30,144 29,344
Amortization of deferred gain 9,108 8,449
Gains on disposal of property and equipment 3,542 10,087
Insurance recoveries - 3,824
Rental income - 1,401
Other 546 16,911
73,721 96,767
Product listing fees represents the fee received from suppliers to list their products in new retail store openings and are recognized in the period they are earned.
26- Financial Charges
Note 2012 2011
Bank commission on loans and other borrowings 13,14,20 456,174 328,244
Income earned on short-term bank deposits 5 (28,793) (10,772)
427,381 317,472
27- Operating LeasesThe Group has various operating leases for its offices, warehouses and production facilities. Rental expenses for the year ended December 31, 2012 amounted to Saudi Riyals 393 million (2011: Saudi Riyals 371 million). Future rental commitments at December 31, 2012 under these operating leases are as follows:
2012 2011
Within one year 497,685 397,886
Between two and five years 2,611,474 1,673,237
More than five years 4,149,669 4,095,107
7,258,828 6,166,230
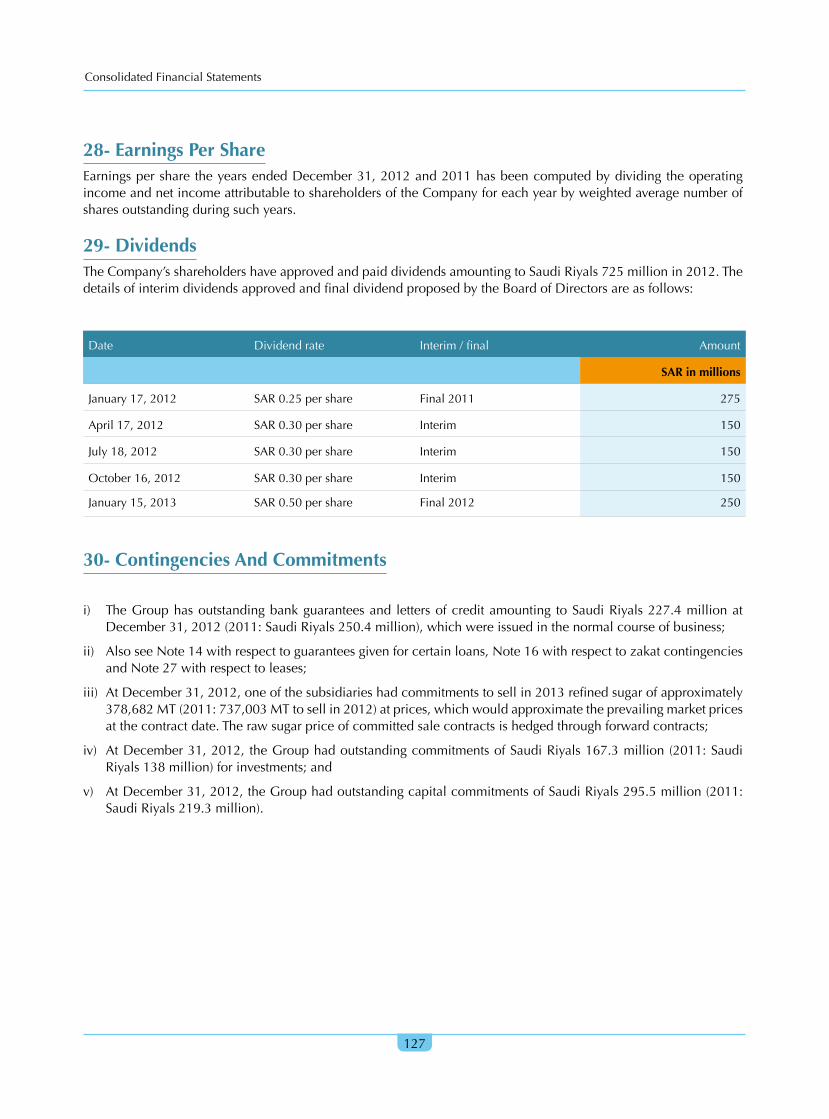
Consolidated Financial Statements
127
28- Earnings Per ShareEarnings per share the years ended December 31, 2012 and 2011 has been computed by dividing the operating income and net income attributable to shareholders of the Company for each year by weighted average number of shares outstanding during such years.
29- Dividends The Company’s shareholders have approved and paid dividends amounting to Saudi Riyals 725 million in 2012. The details of interim dividends approved and final dividend proposed by the Board of Directors are as follows:
Date Dividend rate Interim / final Amount
SAR in millions
January 17, 2012 SAR 0.25 per share Final 2011 275
April 17, 2012 SAR 0.30 per share Interim 150
July 18, 2012 SAR 0.30 per share Interim 150
October 16, 2012 SAR 0.30 per share Interim 150
January 15, 2013 SAR 0.50 per share Final 2012 250
30- Contingencies And Commitments
i) The Group has outstanding bank guarantees and letters of credit amounting to Saudi Riyals 227.4 million at December 31, 2012 (2011: Saudi Riyals 250.4 million), which were issued in the normal course of business;
ii) Also see Note 14 with respect to guarantees given for certain loans, Note 16 with respect to zakat contingencies and Note 27 with respect to leases;
iii) At December 31, 2012, one of the subsidiaries had commitments to sell in 2013 refined sugar of approximately 378,682 MT (2011: 737,003 MT to sell in 2012) at prices, which would approximate the prevailing market prices at the contract date. The raw sugar price of committed sale contracts is hedged through forward contracts;
iv) At December 31, 2012, the Group had outstanding commitments of Saudi Riyals 167.3 million (2011: Saudi Riyals 138 million) for investments; and
v) At December 31, 2012, the Group had outstanding capital commitments of Saudi Riyals 295.5 million (2011: Saudi Riyals 219.3 million).

● Saudi Arabia● Egypt● Iran● Turkey● Sudan● Algeria
● Kazakhistan
● Morocco
● Jordon
● UAE
● Lebanon
Savola Group's operations are spread widely in a number of countries
in the Middle East, North Africa and Central Asia
Savola Group's operations are spread widely in a number of countries
in the Middle East, North Africa and Central Asia
It also exports its high quality products of edible oils, margarine,
sugar and plastic to more than 30 countries around the world.
THE SAVOLA GROUP AND SUBSIDIARIES CONTACTS AND ADDRESSES
The Savola Group welcomes your constructive comments and suggestions that might enhance the quality of services provided to our valued shareholders and customers.You may contact our toll free number 8002440204, visit our website: www.savola.com or write to the following addresses:
The Savola Group Headquarters
8th Floor, Saudi Business Center,Madinah Road, JeddahP.O. Box 14455 Jeddah 21424Tel: +966 2 6573333Fax: +966 2 6484119
Foods Sector
Savola Foods Company- Edible Oils
Industrial Area – Phase 3P.O.Box 30439 Jeddah 21477Tel: +966 2 6350000Fax: +966 2 6373015
Mahmoud Mansour Abdul Ghaffar
Chief of Corporate Affairs & Board SecretaryTel: +966 2 2687773Fax: +966 2 6482053 [email protected]
United Sugar Company
Jeddah Islamic PortP.O.Box 23023 Jeddah 21426Tel: +966 2 6492222Fax: +966 2 6490088
Gerard Lawlor
Group Chief Financial OfficerTel: +966 2 2687724Fax: +966 2 6526693 [email protected]
Retail Sector
Al-Azizia Panda United Company City Plaza- Prince Sultan StreetP.O.Box 30900 Jeddah 21487Tel: +966 2 6916644Fax: +966 2 6926159
Shareholders Affairs Department
Saudi Business Center, Mezzanine FloorMadinah Road, JeddahP.O.Box 14455 Jeddah 21424Tel: +966 2 6573333 Ext. 802Or Direct: +966 2 2687800 Fax: +966 2 6514827
Plastic Sector
Savola Packaging Systems Company6th Floor- Saudi Business CenterP.O.Box 34495 Jeddah 21468Tel: +966 2 2687782Fax: +966 2 6526680
Management & Editing:
Mr. Mahmoud Mansour Abdul GhaffarChief of Corporate Affairs & Board Secretary [email protected]
Mr. Alnour Ali Saad Senior Director, Corporate Governance & Board Affairs [email protected]
Note: (Chamber of Commerce Membership No 3012, C.R. 4030019708 Jeddah)