in the name of godarafei/library/irncdrfs.en.pdf · policy making and program planning at national...
TRANSCRIPT


in the name of god


Non-communicable Diseases
Risk Factors surveillance System
Ministry of Health and Medical EducationHealth Deputy
Authors:Dr. Jalil Koohpayehzadeh Isfahani
Asgari FereshtehAzimi Sayede Sara
Rafei AliBejani Soraya
Editor:Abbas pariani
under supervision of:Dr. Alireza Mesdaghinia
Dr. Koorosh Etemad
Center for Non-Communicable Disaeses Control2012


Contents
Foreword 1Introduction 3NCD Risk Factors surveillance system 4Network of Iranian STEPs 5Objectives 5 Strategies 6Methodology 6Opportunities 8Domains of future efforts 8Expectation of the international community 8NCD Risk Factors statues in IR Iran 9References 12NCD Risk Factors appendices 13Trend of Iranian NCD Risk Factors during 2006-2009 14Comparing the situation of NCD risk factors in Iran with EMRO countries 21Comparing the situation of NCD risk factors in Iran with the world 24

Non-communicable diseases (NCDs) prevalence is rapidly growing in the world and the incidences are rising significantly in the Eastern Mediterranean Region as well. Currently, 47% of the Regional burden of diseases is due to NCDs and it is expected that will rise to 60% by the years 2020.
To response to the global and national request for NCD risk factors information, National NCD risk factors surveillance system of Iran has been established based on WHO Stepwise approach (STEPs) since 2004, through which 5 national large-scale surveillance surveys conducted to find out the existing situation of NCD risk factors aged 15 to 64 Iranian citizens, and following the trend of these risk factors. 6th round of national survey will be completed by the end of 2011.
The overall goals of NCD risk factors surveillance system are capacity building to conduct risk factors surveillance within the frame work of an integrated, systematic and regularly approach aimed sustainable monitoring of NCDs interventions to health policy making and program planning at national level.
Dr. J Koohpayezade isfahani
Head of NCD Risk Factors Surveillance office
Foreword

2 Non-communicable Diseases Risk Factors surveillance System
Contributors:Asgari Fereshte. MD. MPH
Azimi Sayede Sara. MSc of Epidemiology
Rafei Ali. MSc student in Biostatistics
Bejani Soraya. BSc of Translation

3Non-communicable Diseases Risk Factors surveillance System
IntroductionNon-communicable diseases became the top health challenges in the world. Coronary Heart diseases, Cerebrovascular diseases, cancers and type 2 diabetes due to 60% of global mortality and 43% of global burden of diseases. The Epidemiological transition characterized by a gradual shift from communicable to non-communicable disease, health care implications as well as socioeconomic consequences with the increased life expectancy and rapid ageing of the population in most middle income countries, lead us to be prepared to combat with this world epidemic. The main way is focusing on the major risk factors which are common in our country.Despite the increase in the prevalence and impact of NCDs, developing countries remain ill-prepared for the management of these diseases. In these countries the increase in NCDs burden is largely their result of an increase in the prevalence of risk factors and a relative lack of access to the interventions. Also Policy makers need evidence based advice for decisions on potential interventions and population based prevention strategies.The modifiable risk factors of NCDs include smoking, unhealthy diet inactivity, obesity and high lipids are the root causes of the global epidemic in NCDs. Although the relative importance of these may vary in different populations, these conventional risk factors may explain 75% of chronic conditions.In Iran Non-communicable diseases cause the most diseases burden; 45% for males and 33% for females, from all-causes of total burden for both sexes. Obesity and overweight, hypertension, inadequate physical activity, hypercholesterolemia, and addiction

4 Non-communicable Diseases Risk Factors surveillance System
are the first 5 risk factors causing the highest proportion of burden; 68% of risk factors burden, which is 11% of total burden of disease, with 1.6 million DALYs ‘(Ministry of Health’s burden of Disease Study, 2003). NCD Risk Factors:• Behavioral Risk Factors: unhealthy diets, physical inactivity and
tobacco use• Biological Risk Factors: raised blood pressure, high lipids and
glucose, obesity and overweight. • Underlying Behavioral Risk Factors: social, economical and
cultural changes due to globalization, industrialization, population adding, poverty and stress.
NCD Risk Factors surveillance systemSince resources for NCDs treatment costs are high, optimal priority setting for preventive interventions is necessary. Management of all intervention strategies requires assessment of the related risk factors of disease. According to the approvals of 53th regional meeting of EMR health ministers that was held in Iran in 2006, in the health sector policy document of 4th and 5th national development program of the country that stresses on reduction of NCD major risk factors is one of the main goals. STEP wise approach of risk factors surveillance is a tool recommended to NCDs control and prevention by WHO. National NCD risk factorssurveillance system of Iran has been established since 2004. This system is sustainable and coordinated approach for risk factors surveillance which will guarantee permanent data collection. This approach is responsible for providing information on
5Non-communicable Diseases Risk Factors surveillance System
recognizing and determining epidemiological dimensions of current non-communicable diseases and analyzing social, economical and behavioral factors to make guidance on political and legal affairs in public health for health authorities.Five national large-scale surveillance surveys conducted, from 2004 to 2009, to find out the trends. NCD risk factorssurveillance information led to capacity building for running three national policies; to counter low physical activity, unhealthy diet and smoking, by considering a national strategy which included all intra and extra sector coordination affairs.
Network of Iranian STEPs:Iranian STEPs was planned as a nationwide system all over the country in cooperation with all medical sciences universities, to obtain a valid and continues evidence to assist the effective affairs of prevention and control programs represented 15-64 years age group risk factors pattern.
Objectives:• To develop infrastructure for NCDs risk factorssurveillance
and strengthen the monitoring and evaluating of NCDs control intervention program
• To provide national and provincial reliable and up-to-date information resources on risk factors to map prevalence, trend and distribution
• To prepare a tool for evidence-based public health decision making with the ultimate aim of containing and reducing the emerging epidemic of non- communicable diseases
• To prepare a supportive infrastructure for NCD preventive

6 Non-communicable Diseases Risk Factors surveillance System
research to view effective interventions• To promote the level of knowledge, reinforcement and
enlargement of public health capacity in NCDs prevention and PHC services
Strategies:• Training and educating staffs in different levels regarding risk
factors surveillance system• Providing political, legal and technical infrastructures to continue
executive program of NCD risk factors surveillance system• Developing job description to sustain NCD risk factors
surveillance system• Providing necessary resources for NCD risk factors surveillance
system• Reinforcement & enlargement of public health capacity in NCDs
prevention and PHC services• Focus on advocacy and link to supportive national policies• Improving research vision based on epidemiological pattern of
NCD Risk Factors to plan effective interventions• Expanding inter and intra-sectoral collaboration.
Methodology:All rounds of national STEPs were conducted based on “WHO Stepwise approach” to determine NCD risk factors with respect of standardized data collection as well as sufficient flexibility in appropriate a variety of country situations and setting.All selected participants were invited to participate by receiving informed consent. These surveys were conducted by using a cluster sampling. Each cluster was selected randomly and stratified by age

7Non-communicable Diseases Risk Factors surveillance System
and sex stratum.This sample size approximates a 0.06 % sampling fraction of the target population in the 15-64 year age group. It was agreed that approximately 1000 samples participate in each province in urban/ rural population size proportionally.
Steps questionnaire:The core questions in 3 steps instrument remained unchanged. Additional items relating to NCDs control and prevention to be included by survey team agreement as optional and expanded questions.Step 1: Demographic and Behavioral AssessmentsData for step 1 has collected in 6 different domains: demographic information, diet, physical activity, tobacco use, history of hypertension and diabetes. Occupation, sex, age, province and area of evidence have been included in demographic information and diet information; consist of fruit and vegetable servings consumed per day for a usual week and common type of oil or fat used by the family.Step 2: Physical measurementsWeight, height, waist circumference and blood pressure have been measured.Step 3: Biochemical measurementsFasting plasma glucose, triglycerides, total cholesterol, high density lipoprotein, low density lipoprotein level have been determined every 3 years. Quality control for each measurement has been monitored through periodic checks conducted by STEPs team supervisors in provinces.Data has been analyzed using Stata version 10 and weighted

8 Non-communicable Diseases Risk Factors surveillance System
frequency estimates have been presented with 95% confidence interval and significant P values less than 0.05 for all variables by 5 age groups and sex in each provinces.
Opportunities:• Priority action on NCD common risk factors via STEPs survey,
stronger emphasis on data analysis, interpretation and dissemination
• Promoting the level of translating knowledge of NCD risk factors to prevention interventions
Domains of future efforts: • Strengthening national policy making to fill the Existing gaps of
NCD Risk Factors prevention • Implementation NCD Risk Factors prevention policies as culture
of community • Properly distributing man power for expanding NCD Risk Factors
prevention programme• Capacity building and promoting in PHC for integrated non
communicable diseases management based on common NCD risk factors
Expectation of the international community:• Sharing successful experiences NCDs risk factor’s Preventive
interventions• Providing technical support for NCDs risk factor’s Preventive
interventions

9Non-communicable Diseases Risk Factors surveillance System
NCD Risk Factors statues in IR. Iran
According to Iranian STEPs ResultsThe information has been published and distributed all over the country by considering provincial and national reports in the frame of fact sheets and data books for every year which are available at; http://www.ncdinfobase.ir. The summary of results for the latest survey is as fallow:
Tobacco use:• The prevalence of current smoking was 11.79% overall with the
higher proportion for males (22.06%) than females (1.26%).• Among all respondents, 10.82% were daily smokers: 20.39% of
males and 1.02% of females.• The mean age at which daily smoking started was 20.12 years.• Among current smokers, the average number of manufactured
cigarettes smoked per day was 13.10%; 13.29% of males and 12.91 % of females, without significant difference.
Fruits and vegetables consumption:The overall prevalence of eating less than 5 servings of fruit and vegetables reported per day was 88.20%; 90.03% for males and 86.33% for females.
Physical activity:The report of physical activity is based on work, transport and recreation frequency and duration in MET-minute, as a standard
10 Non-communicable Diseases Risk Factors surveillance System
unit adjusted for vigorous compared with moderate activity.• The mean minute of total physical activity on average per day
was 116.58 min. This was highest amount among men with 161.76 min than women with 70.30 min
• The greatest amount of activity reported in both sex was in the transport domain with 48.05%. It was in work domain for men with 38.26% and in transport domain for women with 58.39%.
• No moderate and vigorous physical activity at work: 55.00%; for male: 49.52% and for female: 60.60 %
• No physical activity at transport: 28.34%; for male: 29.68% and for female: 26.96
• No moderate and vigorous physical activity at recreation: 64.45%; for male: 51.72% and for female: 77.49%
Overweight and obesity:Body mass index (BMI) categories classified as; underweight and normal weight (BMI: <25.0 kg/m2), overweight (BMI: 25.0 to <30.0 kg/m2), and obese (BMI: ≥30.0 kg/m2), computed as the weight in kilograms divided by the square of height in meters.• Overall mean BMI was 25.66 kg/m2 for female and 24.22 kg/m2
for male• The proportion of overweight or obese was 43.95% in both sex;
48.99% in female and 39.04% in male• A significant proportion of underweight is 12.84% in 15-24 age
group compared with 6.79 in all age groups• 15.22% of respondents were obese, with more proportion in
females: 20.47%, than males: 10.10%

11Non-communicable Diseases Risk Factors surveillance System
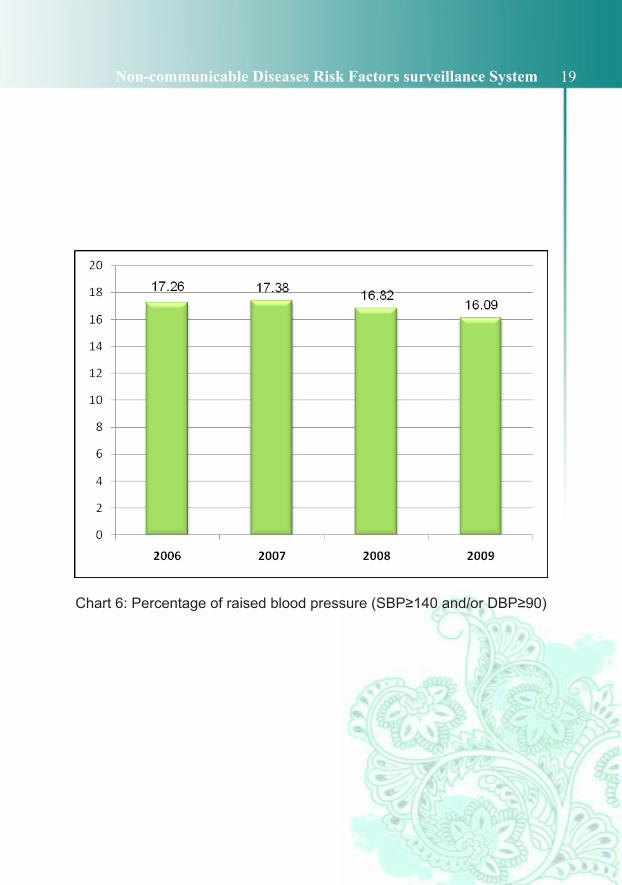
High blood pressure:• 16.09% of all had raised blood pressure (SBP≥140 or DBP≥90
or currently on anti- hypertensive medication).• The total proportion was: 16.07% for males and 16.12% for
females while the difference was significant in age group proportion by sex.
Biochemical measurements information is related to survey has been conducted 2007.
Cholesterol:• Mean cholesterol was 185.5 (mg/dl) in aged 25-64 years. It is
increased with age for both genders.• Mean cholesterol levels were higher across all age groups for
females: 189.9(mg/dl) than males: 181.4 (mg/dl).• The overall prevalence of elevated cholesterol (≥5.2 mmol/L)
was 32.9%, higher for females: 36.38% than males: 29.51%.• Raised blood glucose: • The all-ages (25-64 years) prevalence of defined single fasting
blood glucose ≥126 mg/dl (7.0 mmol/L): 9.69%; in male: 9.41% and in female: 9.97.
Raised risk for NCDs:Five common and critical risk factors for NCDs were selected to assess STEPs NCD risk factors- raised risk by WHO recommendation: current daily smokers, overweight or obese.• (BMI≥25.0kg/m2), raised blood pressure (SBP≥140 and/or
DBP≥90 mmHg or currently on medication for raised blood pressure), consuming less than 5 servings of fruits and vegetables per day and low level of physical activity (<600 MET-

12 Non-communicable Diseases Risk Factors surveillance System
minutes).• 7.11% of 15-44 years were low risk to NCDs (none of the 5 risk
factors), compared with 5.50% in 45-64 years which is significant in men than women.
• 21.64% of those aged 15-44 in comparison with 52.87% in 45-64 years had raised risk (at least 3 of the 5 risk factors) which is more prevalent.
References
1-Nom-communicable Diseases Risk Factors Surveillance Provincial Report, Islamic Republic of Iran. Ministry of Health and Medical Education, Deputy for Health, Nom-communicable Diseases Control and Management; 2007.2-Asgari F., Mirzazadeh A., Heidarian H. Nom-communicable Diseases Risk Factors Surveillance Data Book for 2007. Ministry of Health and Medical Education, Deputy for Health, Nom-communicable Diseases Control and Management; 2009.3-Global Health Risks: Mortality and burden of disease attributable to selected major risks, World Health Organization 2009.4-Gaziano, T.A. Reducing the Growing Burden of Cardiovascular Disease in the Developing World. Health Aff, Millwood, 2007; 26(1): 13–24.5-Mackay,J, Mensah,G. (). Atlas of Heart Disease and Stroke, World Health Organization, No serial Publication, 2011; 18- 63.

13Non-communicable Diseases Risk Factors surveillance System
NCD Risk Factors appendices

14 Non-communicable Diseases Risk Factors surveillance System
Trend of Iranian NCD Risk Factors during 2006-2009
Chart 1: Percentag of current daily smoker

15Non-communicable Diseases Risk Factors surveillance System
Chart 2: Average age started smoking (year)

16 Non-communicable Diseases Risk Factors surveillance System
Chart 3: Percentage of low physical activity (<600 MET-minutes)

17Non-communicable Diseases Risk Factors surveillance System
Chart 4: Percentage of overweight and obesity

18 Non-communicable Diseases Risk Factors surveillance System
Chart 5: Percentage of low daily fruit and vegetable intake
19Non-communicable Diseases Risk Factors surveillance System
Chart 6: Percentage of raised blood pressure (SBP≥140 and/or DBP≥90)

20 Non-communicable Diseases Risk Factors surveillance System
Map1: Percentage of men with 3 or more risk factors, the deviation from national average 2007
Map2: Percentage of women with 3 or more risk factors, the deviation from national average 2007

21Non-communicable Diseases Risk Factors surveillance System
Comparing the situation of NCD risk factors in Iran with EMRO countries
Chart 7: DALYS (‘000) in Iran Comparison with EMRO, 2000-2003

22 Non-communicable Diseases Risk Factors surveillance System
Chart 8: Comparing the situation of Diabetes, Hypertension, hypercholesterolemia, Overweight and Obesity in Iran with EMRO
countries, based on 2003 – 2007 information

23Non-communicable Diseases Risk Factors surveillance System
Chart 9: Comparing the situation of Smoking, Low physical activity and Low intake of fruit and vegetables in Iran with EMRO countries based on
2003 – 2007 information

24 Non-communicable Diseases Risk Factors surveillance System
Comparing the situation of NCD risk factors in Iran with the world
Chart10: Comparing Iran NCD risk factors prevalence (2007) with the world(2004), both sex

25Non-communicable Diseases Risk Factors surveillance System
Chart11: Comparing Iran NCD risk factors prevalence (2007) with the world (2004), men

26 Non-communicable Diseases Risk Factors surveillance System
Chart12: Comparing Iran NCD risk factors prevalence (2007) with the world (2004), women

27Non-communicable Diseases Risk Factors surveillance System
IRAN STEPS Survey 2009Fact Sheet 1388
Results for adults aged 15-64 years (incl. 95% CI) Both Sexes Males Females
Step 1 Tobacco Use
Percentage who currently smoke tobacco daily 10.82[10.24,11.43]
20.39[19.84,20.95]
1.02[0.87,1.19]
For those who smoke tobacco daily
Average age started smoking (years) 20.13[19.42,20.84]
19.30[18.96,19.65]
20.98[19.62,22.34]
Average years of smoking 13.82[13.26,14.38]
14.46[14.14,14.78]
13.17[12.11,14.23]
Mean number of manufactured cigarettes smoked per day
13.10[11.74,14.46]
13.29[12.59,13.99]
12.91[10.28,15.55]
Step 1 Fruit and Vegetable Consumption (in a typical week)
Mean number of servings of fruit consumed per day 1.32[1.27,1.38]
19.30[18.96,19.65]
1.38[1.31,1.44]
Mean number of servings of vegetables consumed per day
1.45[1.38,1.53]
14.46[14.14,14.78]
1.54[1.46,1.61]
Percentage who ate 5 or more combined servings of fruit & vegetables per day
11.8[10.43,13.33]
9.97[8.50,11.67]
13.67[12.14,15.37]
Step 1 Physical ActivityPercentage with low levels of activity (defined as <600 MET-minutes/week)
38.97[37.38,40.58]
28.28[27.41,29.17]
49.91[48.92,50.9]
Median time spent in work-related physical activity per day (minutes)
0 2.85 0
Median time spent in transport-related physical activity per day (minutes)
15 17.14 12.85
Step 2 Physical Measurements
Mean body mass index - BMI (kg/m2) 24.93[24.83,25.03]
24.22[24.10,24.33]
25.66[25.50,25.82]
Percentage who are overweight or obese (BMI ≥ 25 kg/m2) 43.95[43,44.91]
39.04[38.36,39.72]
48.99[48.34,49.63]
Percentage who are obese (BMI ≥ 30 kg/m2) 15.22[14.54,15.92]
10.1[9.697,10.51]
20.46[19.96,20.98]
Average waist circumference (cm) 84.75[84.40,85.10]
85.57[85.14,85.99]
83.91[83.44,84.39]
Mean systolic blood pressure - SBP (mmHg) 118.06[117.70,118.42]
121.60[121.19,122.02]
114.43[113.97,114.89]
Mean diastolic blood pressure - DBP (mmHg) 76.93[76.65,77.21]
77.36[77.01,77.71]
76.48[76.16,76.81]
Percentage with raised BP (SBP ≥ 140 and/or DBP ≥ 90 mmHg)
16.09[15.39,16.82]
16.07[15.55,16.61]
16.12[15.72,16.52]
Percentage with raised BP (SBP ≥ 170 and/or DBP ≥ 100 mmHg)
6.12[5.75,6.52]
5.12[4.87,5.39]
7.15[6.89,7.41]
Percentage with low risk (i.e. none of the risk factors included above)
3.27[2.79,3.84]
3.15[2.86,3.47]
3.39[3.07,3.76]
Percentage with raised risk (i.e. at least three of the risk factors included above) distributed in the age groups below
Percentage with raised risk, aged 15 to 44 years old 21.64[20.67,22.65]
20.86[20.21,21.53]
22.44[21.79,23.1]
Percentage with raised risk, aged 45 to 64 years old 52.87[51.11,54.62]
49.81[48.64,50.99]
55.94[54.81,57.07]

28 Non-communicable Diseases Risk Factors surveillance SystemIRAN STEPS Survey 2009Fact Sheet 1388
Results for adults aged 15-64 years (incl. 95% CI) Both Sexes Males Females
Step 1 Tobacco Use
Percentage who currently smoke tobacco daily 11.39[10.82,11.99]
21.65[21.11,22.21]
0.88[0.74,1.04]
For those who smoke tobacco daily
Average age started smoking (years) 20.19[19.52,20.87]
19.49[19.16,19.82]
20.92[19.57,22.26]
Average years of smoking 13.11[12.40,13.82]
14.00[13.66,14.34]
12.20[10.78,13.62]
Mean number of manufactured cigarettes smoked per day
11.62[10.32,12.93]
12.26[11.75,12.77]
10.97[8.36,13.57]
Step 1 Fruit and Vegetable Consumption (in a typical week)
Mean number of servings of fruit consumed per day 1.40[1.34,1.46]
1.40[1.32,1.47]
1.40[1.33,1.46]
Mean number of servings of vegetables consumed per day
1.40[1.33,1.46]
1.34[1.27,1.41]
1.45[1.38,1.53]
Percentage who ate 5 or more combined servings of fruit & vegetables per day
12.98[11.71,14.37]
12.08[11.40,12.78]
13.91[13.10,14.76]
Step 1 Physical ActivityPercentage with low levels of activity (defined as <600 MET-minutes/week)
35.21[33.79,36.65]
24.32[23.56,25.10]
46.36[45.40,47.31]
Median time spent in work-related physical activity per day (minutes) 5.71 21.42 0
Median time spent in transport-related physical activity per day (minutes) 15 20 12.85
Step 2 Physical Measurements
Mean body mass index - BMI (kg/m2) 25.09[24.98,25.19]
24.31[24.18,24.45]
25.88[25.73,26.03]
Percentage who are overweight or obese (BMI ≥ 25 kg/m2)
46.00[44.99,47.02]
40.39[39.68,41.10]
51.75[51.09,52.40]
Percentage who are obese (BMI ≥ 30 kg/m2) 16.74[15.96,17.55]
11.25[10.77,11.74]
22.37[21.82,22.93]
Average waist circumference (cm) 84.59[84.26,84.90]
85.47[85.03,85.91]
83.69[83.32,84.06]
Mean systolic blood pressure - SBP (mmHg) 119.5[119.1,119.8]
123.0[122.6,123.5]
115.9[115.5,116.4]
Mean diastolic blood pressure - DBP (mmHg) 77.1[76.8,77.4]
77.0[76.6,77.3]
77.3[77.0,77.6]
Percentage with raised BP (SBP ≥ 140 and/or DBP ≥ 90 mmHg)
17.38[16.72,18.05] 17.63 [17.17,18.10] 17.12
[16.74,17.50]Percentage with raised BP (SBP ≥ 170 and/or DBP ≥ 100 mmHg)
6.42[6.09,6.78]
5.48[5.23,5.75]
7.39[7.17,7.61]
Step 3 Biochemical Measurements
Mean fasting blood glucose (mmol/L) 89.24[88.64,89.84]
89.51[88.69,90.34]
88.96[88.22,89.69]
Percentage with raised blood glucose (≥ 7.0 mmol/L)
9.69[8.92,10.52]
9.41[8.84,10.02] 9.97 [9.46,10.51]
Mean total blood cholesterol (mmol/L) 185.5[184.4,186.7]
181.4[179.9,182.8]
189.7[188.2,191.2]
Percentage with raised total cholesterol (≥ 5.2 mmol/L)
32.84[31.60,34.10]
29.50[28.65,30.36]
36.26[35.43,37.10]
Percentage with raised total cholesterol (≥ 6.5 mmol/L)
7.20[6.63,7.82]
5.60[5.29,5.92]
8.86[8.41,9.33]
Percentage with low risk (i.e. none of the risk factors included above)
3.84[3.39,4.36]
4.36[4.02,4.73]
3.31[3.04,3.61]
Percentage with raised risk (i.e. at least three of the risk factors included above) distributed in the age groups belowPercentage with raised risk, aged 15 to 44 years old 22.21
[21.21,23.24]21.24
[20.62,21.86]23.21
[22.48,23.95]Percentage with raised risk, aged 45 to 64 years old 52.29
[50.58,53.99]47.70
[46.61,48.79]56.90
[55.81,57.99]

29Non-communicable Diseases Risk Factors surveillance SystemIRAN STEPS Survey 2009Fact Sheet 1388
Results for adults aged 15-64 years (incl. 95% CI) Both Sexes Males Females
Step 1 Tobacco Use
Percentage who currently smoke tobacco daily 11.39[10.82,11.99]
21.65[21.11,22.21]
0.88[0.74,1.04]
For those who smoke tobacco daily
Average age started smoking (years) 20.19[19.52,20.87]
19.49[19.16,19.82]
20.92[19.57,22.26]
Average years of smoking 13.11[12.40,13.82]
14.00[13.66,14.34]
12.20[10.78,13.62]
Mean number of manufactured cigarettes smoked per day
11.62[10.32,12.93]
12.26[11.75,12.77]
10.97[8.36,13.57]
Step 1 Fruit and Vegetable Consumption (in a typical week)
Mean number of servings of fruit consumed per day 1.40[1.34,1.46]
1.40[1.32,1.47]
1.40[1.33,1.46]
Mean number of servings of vegetables consumed per day
1.40[1.33,1.46]
1.34[1.27,1.41]
1.45[1.38,1.53]
Percentage who ate 5 or more combined servings of fruit & vegetables per day
12.98[11.71,14.37]
12.08[11.40,12.78]
13.91[13.10,14.76]
Step 1 Physical ActivityPercentage with low levels of activity (defined as <600 MET-minutes/week)
35.21[33.79,36.65]
24.32[23.56,25.10]
46.36[45.40,47.31]
Median time spent in work-related physical activity per day (minutes) 5.71 21.42 0
Median time spent in transport-related physical activity per day (minutes) 15 20 12.85
Step 2 Physical Measurements
Mean body mass index - BMI (kg/m2) 25.09[24.98,25.19]
24.31[24.18,24.45]
25.88[25.73,26.03]
Percentage who are overweight or obese (BMI ≥ 25 kg/m2)
46.00[44.99,47.02]
40.39[39.68,41.10]
51.75[51.09,52.40]
Percentage who are obese (BMI ≥ 30 kg/m2) 16.74[15.96,17.55]
11.25[10.77,11.74]
22.37[21.82,22.93]
Average waist circumference (cm) 84.59[84.26,84.90]
85.47[85.03,85.91]
83.69[83.32,84.06]
Mean systolic blood pressure - SBP (mmHg) 119.5[119.1,119.8]
123.0[122.6,123.5]
115.9[115.5,116.4]
Mean diastolic blood pressure - DBP (mmHg) 77.1[76.8,77.4]
77.0[76.6,77.3]
77.3[77.0,77.6]
Percentage with raised BP (SBP ≥ 140 and/or DBP ≥ 90 mmHg)
17.38[16.72,18.05] 17.63 [17.17,18.10] 17.12
[16.74,17.50]Percentage with raised BP (SBP ≥ 170 and/or DBP ≥ 100 mmHg)
6.42[6.09,6.78]
5.48[5.23,5.75]
7.39[7.17,7.61]
Step 3 Biochemical Measurements
Mean fasting blood glucose (mmol/L) 89.24[88.64,89.84]
89.51[88.69,90.34]
88.96[88.22,89.69]
Percentage with raised blood glucose (≥ 7.0 mmol/L)
9.69[8.92,10.52]
9.41[8.84,10.02] 9.97 [9.46,10.51]
Mean total blood cholesterol (mmol/L) 185.5[184.4,186.7]
181.4[179.9,182.8]
189.7[188.2,191.2]
Percentage with raised total cholesterol (≥ 5.2 mmol/L)
32.84[31.60,34.10]
29.50[28.65,30.36]
36.26[35.43,37.10]
Percentage with raised total cholesterol (≥ 6.5 mmol/L)
7.20[6.63,7.82]
5.60[5.29,5.92]
8.86[8.41,9.33]
Percentage with low risk (i.e. none of the risk factors included above)
3.84[3.39,4.36]
4.36[4.02,4.73]
3.31[3.04,3.61]
Percentage with raised risk (i.e. at least three of the risk factors included above) distributed in the age groups belowPercentage with raised risk, aged 15 to 44 years old 22.21
[21.21,23.24]21.24
[20.62,21.86]23.21
[22.48,23.95]Percentage with raised risk, aged 45 to 64 years old 52.29
[50.58,53.99]47.70
[46.61,48.79]56.90
[55.81,57.99]
IRAN STEPS Survey 2009Fact Sheet 1388
Results for adults aged 15-64 years (incl. 95% CI) Both Sexes Males Females
Step 1 Tobacco Use
Percentage who currently smoke tobacco daily 11.13[10.58,11.71]
21.19[20.66,21.74]
0.81[0.71,0.93]
For those who smoke tobacco daily
Average age started smoking (years) 20.67[19.89,21.45]
19.45[19.03,19.87]
21.91[20.40,23.43]
Average years of smoking 13.15[12.49,13.81]
14.48[14.16,14.79]
11.79[10.44,13.13]
Mean number of manufactured cigarettes smoked per day
9.14[8.51,9.78]
12.29[11.69, 12.90]
5.91[4.80,7.03]
Step 1 Fruit and Vegetable Consumption (in a typical week)
Mean number of servings of fruit consumed per day 1.44[1.38,1.49]
1.41[1.35,1.47]
1.46[1.40,1.52]
Mean number of servings of vegetables consumed per day
1.40[1.31,1.48]
1.34[1.26,1.42]
1.46[1.36,1.56]
Percentage who ate 5 or more combined servings of fruit & vegetables per day
11.75[10.49,13.13]
11.15[10.46,11.89]
12.35[11.64,13.10]
Step 1 Physical Activity
Percentage with low levels of activity (defined as <600 MET-minutes/week)
38.10[36.80,39.42]
26.60[25.86,27.36]
49.88[49.02,50.75]
Median time spent in work-related physical activity per day (minutes) 0 4.28 0
Median time spent in transport-related physical activity per day (minutes) 15 17.14 11.42
Step 2 Physical Measurements
Mean body mass index - BMI (kg/m2) 24.91[24.81,25.02]
24.16[24.04,24.28]
25.68[25.53,25.83]
Percentage who are overweight or obese (BMI ≥ 25 kg/m2)
44.25[43.26,45.25]
38.78[38.17,39.40]
49.85[49.14,50.57]
Percentage who are obese (BMI ≥ 30 kg/m2) 14.86[14.17,15.58]
9.68[9.26,10.12]
20.17[19.69,20.66]
Average waist circumference (cm) 84.33[83.99,84.68]
85.18[84.78,85.58]
83.47[83.01,83.93]
Mean systolic blood pressure - SBP (mmHg) 118.41[118.05,118.76]
121.71[121.24,122.17]
115.02[114.56,115.49]
Mean diastolic blood pressure - DBP (mmHg) 77.08[76.81,77.35]
77.32[76.96,77.67]
76.84[76.52,77.17]
Percentage with raised BP (SBP ≥ 140 and/or DBP ≥ 90 mmHg)
16.82[16.12,17.55]
16.55[16.05,17.07]
17.10[16.69,17.51]
Percentage with raised BP (SBP ≥ 170 and/or DBP ≥ 100 mmHg)
6.50[6.13,6.88]
5.08[4.85,5.32]
7.95[7.66,8.25]
Percentage with low risk (i.e. none of the risk factors included above)
3.19[2.69,3.77]
3.58[3.27,3.92]
2.78[2.50,3.10]
Percentage with raised risk (i.e. at least three of the risk factors included above) distributed in the age groups below
Percentage with raised risk, aged 15 to 44 years old 22.47[21.47,23.49]
20.98[20.37,21.6]
24.00[23.30,24.72]
Percentage with raised risk, aged 45 to 64 years old 50.15[48.48,51.81]
45.84[44.69,46.99]
54.48[53.43,55.52]

30 Non-communicable Diseases Risk Factors surveillance SystemIRAN STEPS Survey 2009Fact Sheet 1388
Results for adults aged 15-64 years (incl. 95% CI) Both Sexes Males Females
Step 1 Tobacco Use
Percentage who currently smoke tobacco daily 10.96[10.45-11.50]
20.82[20.30-21.36]
0.86[0.75-0.98]
For those who smoke tobacco daily
Average age started smoking (years) 23.05[20.46-25.65]
19.78[19.49-20.06]
26.41[21.16-31.66]
Average years of smoking 10.87[8.28-13.47]
13.85[13.55-14.16]
7.82[2.57-13.08]
Mean number of manufactured cigarettes smoked per day
12.03[10.32-13.74]
12.66[11.99-13.33]
11.38[8.00-14.75]
Step 1 Fruit and Vegetable Consumption (in a typical week)
Mean number of servings of fruit consumed per day 1.22[1.16-1.27]
1.14[1.08-1.20]
1.29[1.23-1.35]
Mean number of servings of vegetables consumed per day
1.25[1.19-1.31]
1.16[1.09-1.23]
1.34[1.27-1.41]
Percentage who ate 5 or more combined servings of fruit & vegetables per day
11.36[10.18,12.65]
9.74[9.07,10.45]
13.01[12.30,13.75]
Step 1 Physical Activity
Percentage with low levels of activity (defined as <600 MET-minutes/week)
30.85[29.72-32.01]
21.60[20.89-22.32]
40.34[39.48-41.20]
Median time spent in work-related physical activity per day (minutes) 6.42 17.14 0
Median time spent in transport-related physical activity per day (minutes) 17.14 25 15
Step 2 Physical Measurements
Mean body mass index - BMI (kg/m2) 24.92[24.82-25.02]
24.11[23.98-24.23]
25.75[25.60-25.91]
Percentage who are overweight or obese (BMI ≥ 25 kg/m2)
44.44[43.46-45.42]
38.61[37.93-39.30]
50.42[49.76-51.07]
Percentage who are obese (BMI ≥ 30 kg/m2) 15.17[14.50-15.87]
9.73[9.32-10.16]
20.74[20.20-21.29]
Average waist circumference (cm) 84.28[83.97-84.59]
84.62[84.18-85.07]
83.93[83.52-84.33]
Mean systolic blood pressure - SBP (mmHg) 115.44[115.05-115.84]
118.23[117.78-118.68]
112.58[112.06-113.11]
Mean diastolic blood pressure - DBP (mmHg) 74.22[73.80-74.64]
76.19[75.69-76.68]
72.21[71.73-72.68]
Percentage with raised BP (SBP ≥ 140 and/or DBP ≥ 90 mmHg)
17.36[16.48,18.28]
18.56[17.9-19.25]
16.14[15.66,16.62]
Percentage with raised BP (SBP ≥ 170 and/or DBP ≥ 100 mmHg)
6.62[6.21-7.06]
5.44[5.15-5.75]
7.84[6.21-7.06]
Percentage with low risk (i.e. none of the risk factors included above)
3.38[2.93,3.88]
3.11[2.84,3.41]
3.64[3.32,4.00]
Percentage with raised risk (i.e. at least three of the risk factors included above) distributed in the age groups below
Percentage with raised risk, aged 15 to 44 years old 20.58 [19.61,21.58]
20.56 [19.80,21.34]
20.60 [19.94,21.27]
Percentage with raised risk, aged 45 to 64 years old 49.09 [47.44,50.75]
45.82 [44.61,47.02]
52.39 [51.30,53.47]