in the red - aarp® official site · forty-nine percent of americans age 50+ report that car...
TRANSCRIPT

In the Red: Older Americans and Credit Card Debt
Amy Traub Dēmos

ACKNOWLEDGMENTS
The author would like to thank the staff of the AARP Public Policy Institute for their insightful comments and suggestions: Lori Trawinski, Susan Reinhard, Elizabeth Costle, Donald Redfoot, Richard Deutsch, and Claire Noel-Miller. The author also appreciates the invaluable assistance of Catherine Ruetschlin and Tamara Draut at Dēmos.
At the request of CEO Barry Rand, the AARP Public Policy Institute (PPI) conducted a year-long, multi-disciplinary exploration of the well-being of America’s middle class with a focus on prospects for financially secure retirement. The Middle Class Security Project offers insight, analysis, and an agenda for policymakers to consider. The project team included:
Susan C. Reinhard, Senior Vice President, Project Lead Donald Redfoot, Senior Strategic Policy Advisor, Project Team Coordinator Richard Deutsch, Communications and Outreach Director
Elizabeth Costle, Director Consumer and State Affairs Enid Kassner, Director Independent Living and Long Term Care Gary Koenig, Director Economics Lina Walker, Director Health Claire Noel-Miller, Senior Strategic Policy AdvisorN. Lee Rucker, Senior Strategic Policy Advisor Lori Trawinski, Senior Strategic Policy Advisor Mikki Waid, Senior Strategic Policy Advisor Diane Welsh, Project Specialist
The Middle Class Project Team would like to thank Debra Whitman, AARP’s Executive Vice President for Policy, Strategy and International Affairs, for her guidance, expertise and contributions to the success of this initiative.

AARP’S MIDDLE CLASS SECURITY PROJECT www.aarp.org/security
The following reports were conducted or commissioned by AARP’s Public Policy Institute as part of the Middle Class Security Project:
Building Lifetime Middle-Class Security Donald L. Redfoot, AARP Public Policy Institute Susan C. Reinhard, SVP and Director, AARP Public Policy Institute Debra Whitman, EVP for Policy, Strategy and International Affairs, AARP
What Are the Retirement Prospects of Middle-Class Americans? Barbara Butrica, Urban Institute Mikki Waid, AARP Public Policy Institute
Assets and Debt across Generations: The Middle-Class Balance Sheet 1989–2010 Lori A. Trawinski, AARP Public Policy Institute
Tracking the Decline: Middle-Class Security in the 2000s Tatjana Meschede, IASP Research Director, Brandeis University Laura Sullivan, IASP Research Associate, Brandeis University Donald L. Redfoot, AARP Public Policy Institute Enid Kassner, AARP Public Policy Institute
The Elusive Middle in America—What Has Happened to Middle-Class Income? Gary Koenig, AARP Public Policy Institute
In the Red: Older Americans and Credit Card Debt Amy Traub, Dēmos
The Effects of Rising Health Care Costs on Middle-Class Economic Security Harriet Komisar, Georgetown University
The Loss of Housing Affordability Threatens Financial Stability for Older Middle-Class Adults
Rodney Harrell, AARP Public Policy Institute Shannon Guzman, AARP Public Policy Institute
How Older Americans Are Dealing with New Economic Realities Tresa Undem, Lake Research Partners
See also:
Video Portraits of Middle-Class Americans at www.aarp.org/security


In the Red: Older Americans and Credit Card Debt
Amy Traub Dēmos
#2013-02 January 2013 © 2013, AARP Reprinting with permission only
AARP Public Policy Institute 601 E Street, NW, Washington, DC 20049 http://www.aarp.org/ppi
AARP’s Public Policy Institute informs and stimulates public debate on the issues we face as we age. Through research, analysis, and dialogue with the nation’s leading experts, PPI promotes development of sound, creative policies to address our common need for economic security, health care, and quality of life.
The views expressed herein are for information, debate, and discussion, and do not necessarily represent official policies of AARP.

Table of Contents
Executive Summary ........................................................................................................ 1
Introduction ..................................................................................................................... 3
Methodology .................................................................................................................... 5
Credit Card Debt by Age ................................................................................................. 5
Reasons for Credit Card Debt among Older Americans ............................................. 6
The Impact of Medical Expenses ................................................................................... 7
Older Americans’ Strategies for Reducing Credit Card Debt ..................................... 9
Negative Consequences of Debt ................................................................................. 11
The Impact of the CARD Act on Older Americans ..................................................... 12
Conclusion ..................................................................................................................... 13
Appendix ........................................................................................................................ 14

List of Tables
Table 1. Percentage of Families with Credit Card Debt (By age of head) .................................. 3
Table 2. "How long do you think it will take before you are completely out of credit card debt?" .......................................................................................................... 9
Table 3. “How often do you pay only the minimum payment due each month on all of your credit cards?” ............................................................................................. 10
Table 4. Impact of the CARD Act on Households in the Past Two Years ............................... 12
Table A-1. Income Breakdowns for 2012 Indebted Sample ......................................................... 14
Table A-2. Sample Size for 2012 Indebted Sample by Age ......................................................... 15
Table A-3. Indebted Sample by Age and Race/Ethnicity, Unweighted Sample Totals ................ 15
Table A-4. Indebted Sample by Age and Educational Attainment, Unweighted Sample Totals .. 15
List of Figures
Figure 1. Change in Average Household Credit Card Debt by Age: "What is the total amount of credit card debt that you currently have?" ................................................................ 5
Figure 2. APR on the Credit Card with the Highest Balance, for the Indebted 50+ Population: "What do you estimate is the annual percentage rate that you pay on the credit card with the highest balance?" ............................................................................................ 6
Figure 3. Expenses Contributing to Current Credit Card Debt, By Age (question did not include medical expenses)............................................................................................ 7
Figure 4. Medical Expenses Contributing to Current Credit Card Debt ..................................... 8
Figure 5. Skipping Care or Treatment to Cut Medical Expenses: "In the past year, have you or a member of your household tried to reduce medical expenses by doing any of the following?" ................................................................................................................... 8
Figure 6. Strategies for Paying Down Debt in the Last Year (Percentage of households by age)....10
Figure 7. Negative Consequences of Debt (Percentage of households) .................................... 11
Figure 8. Percentage of Indebted Households 50+ that Accrued Late Fees in the Past Year ... 12

In the Red: Older Americans and Credit Card Debt
1
EXECUTIVE SUMMARY
Middle-income Americans age 50 and older carry more credit card debt, on average, than younger people, according to new analysis of Dēmos’ 2012 National Survey on Credit Card Debt of Low- and Middle-Income Households.1 The results are based on a nationally representative sample of 997 American households that carried credit card debt for three months or more.2 The research examines how the recession, its aftermath, and implementation of new consumer credit card protections have affected the relationship between Americans and credit card debt, with a focus on differences by age bracket.
Key Findings Among middle-income households carrying credit card debt for three months or
more:
Older Americans now have higher overall credit card debt than younger people—a reversal of the trend Dēmos found in its 2008 survey: Americans age 50+ have an average combined balance of $8,278 on all of their cards in 2012, compared with $6,258 for the under-50 population.
Half of Americans age 50+ carry medical expenses on their credit cards, with an average of $893, compared with $746 among younger households; prescription medications and dental expenses were the highest contributors for the 50+ population.
Forty-nine percent of Americans age 50+ report that car repairs contributed to their credit card debt, and 38 percent report that home repairs contributed.
Thirty-four percent of Americans age 50+ use credit cards to pay for basic living expenses such as rent or mortgage payments, groceries, utilities, or insurance because they do not have enough money in their checking or savings accounts.
Older Americans are significantly less likely than younger people to run up credit card debt purchasing nonessential goods and services.
Nearly one-quarter of people age 50+ say that job loss contributed to their credit card debt; 15 percent report that it was the single biggest contributor.
Eighteen percent of people age 50 to 64—people who are nearing retirement—report that they drew on retirement funds to pay off credit card debt.
Older Americans are more likely to take on credit card debt in an effort to assist other family members: About 23 percent of people age 50+ report that money given to, or used to pay the debts of relatives added to the balance on their credit cards, compared to just 11 percent of those under age 50.
1 Throughout this report we will use the term middle-income to refer to the respondents in this study,
since 95 percent of the people in the study were middle income. 2 Credit cards include bank, store, and gas credit cards on which the entire balance is not required to be
paid off by the end of the month.

In the Red: Older Americans and Credit Card Debt
2
Sixteen percent of Americans age 50+ used their home equity to pay down credit card debt in the past year by refinancing, obtaining a second mortgage, or taking out a home equity loan.
The 2009 Credit Card Accountability, Responsibility, and Disclosure (CARD) Act appears to have influenced the way consumers manage their credit card debt by helping them to pay down balances faster and avoid late fees and over-the-limit fees.
This report suggests that credit card debt among older Americans is primarily a reflection of difficult economic times, not a lack of personal financial responsibility.

In the Red: Older Americans and Credit Card Debt
3
INTRODUCTION
“My husband and I are both 60. His hours were slashed at work so we lost income. We used credit cards to pay for things we needed and now we have more debt than we’re comfortable with. What’s the best way to manage this and get by with less money coming in?”3
The response to this question, published in AARP Bulletin’s Ask the Experts column in 2011, offered suggestions for reducing expenses, negotiating a lower interest rate, and seeking debt counseling. But it also noted that the questioner’s situation was very common. The long-term trend over the past two decades shows that the percentage of older Americans with credit card debt has increased from 1989 to 2010. However, since the financial crisis and the Great Recession, the percentage of both older and younger families with credit card debt has decreased since 2007, with the notable exception of families headed by someone age 75+.
Dēmos conducted studies of credit card debt in 2005 and 2008.4 These studies found that low- and middle-income households without assets to fall back on often relied on credit cards as a privatized “plastic safety net” to get through hard times. Many households faced stagnant or declining incomes while costs of living, especially for health care, were increasing.5 Older households in particular relied on credit cards to cover the growing out-of-pocket cost of medical care and to repair cars and fix aging homes.
Beginning in 2006, problems in the housing market became evident and house prices peaked. In 2008, the financial crisis changed the way households of all ages relate to credit. During the height of the housing bubble, lenders offered easy credit and increasing numbers of subprime loans, many of which were deceptive, that ultimately proved dangerous to the entire economy. When the financial crisis hit, broad-ranging fallout struck consumers in quick succession: Home values declined, people lost their jobs, recession set in, and credit card lenders started tightening standards, cutting off credit, and canceling cards. Between 2007 and 2011 alone, more than 1.5 million Americans age 50+ lost their
3 http://www.aarp.org/money/credit-loans-debt/info-02-2011/how-to-control-credit-card-debt.html. 4 Tamara Draut and Jose Garcia, “The Plastic Safety Net: How Households are Coping in a Fragile
Economy” (New York, NY: Dēmos, 2009); “The Plastic Safety Net: The Reality Behind Debt in America,” (New York, NY: Dēmos and the Center for Responsible Lending, 2005).
5 Draut and Garcia, “The Plastic Safety Net,” p. 1.
Table 1 Percentage of Families with Credit Card Debt
(By age of head)
Age 1989 1998 2007 2010 Difference 2010–2007
<35 44.5% 50.7% 48.5% 38.7% -9.8% 35–44 50.5% 51.3% 51.7% 45.7% -6.0% 45–54 49.3% 52.5% 53.6% 46.2% -7.4% 55–64 32.9% 45.7% 49.9% 41.3% -8.6% 65–74 27.2% 29.2% 37.0% 31.9% -5.1% 75+ 10.1% 11.2% 18.8% 21.7% 2.9%
Source: Survey of Consumer Finances.

In the Red: Older Americans and Credit Card Debt
4
homes as a result of the mortgage crisis.6 While older Americans have generally enjoyed a lower unemployment rate than people under age 50, those who do lose their jobs are, on average, out of work longer than their younger counterparts.7 In addition, older workers who do find employment are often hired at a lower salary than the one they had lost.
This report examines the impact on older households since the crisis, as declining home values caused trillions of dollars in household wealth to disappear and tighter lending practices made it harder to keep borrowing. According to the Federal Reserve Bank of New York, the outstanding credit card debt of American consumers fell from $858 billion in the third quarter of 2008 to $679 billion in the first quarter of 2012, around the same time the survey was conducted.8 Part of this deleveraging can be explained by tighter lending standards that reduced credit card limits and the number of accounts. Aggregate credit card limits totaled $2.8 trillion in first quarter 2012, down from $3.7 trillion as of third quarter 2008.9 The number of credit card accounts fell to 386.3 million as of first quarter 2012, down from 492.2 million as of third quarter 2008.10 Aggregate credit card debt levels also decrease when credit card debt is written off as uncollectible.11 From 2009 through first quarter 2012, lenders wrote off $211.1 billion of credit card debt.12 Deleveraging also occurs when consumers change their behavior by charging less and/or paying off more of their outstanding debt. The survey sheds light on the deleveraging that has occurred over the past four years among older middle-income Americans.
Another significant event taking place during the survey period was the implementation of the Credit Card Accountability, Responsibility, and Disclosure (CARD) Act, which took effect in February 2010.13 Known as the credit cardholders’ Bill of Rights, this new legislation empowered people to take control of their finances by increasing the fairness and transparency of the credit card industry. The act limited the discretion of credit card companies over billing and fees that previously took cardholders by surprise. It created a new standard of clarity in disclosure, including unambiguous breakdowns of costs and fees to appear on monthly statements, and 45-day notice before implementing interest rate hikes. It limited the circumstances under which credit card companies can impose retroactive rate increases and established additional criteria for appropriate, proportional penalties and fees.
6 Lori A. Trawinski, Nightmare on Main Street: Older Americans and the Mortgage Market Crisis
(Washington, DC: AARP Public Policy Institute, 2012), http://www.aarp.org/money/credit-loans-debt/info-07-2012/nightmare-on-main-street-AARP-ppi-cons-prot.html.
7 Sara E. Rix, The Employment Situation, September 2012: Overall Drop in Unemployment Does Not Extend to the Older Workforce, Fact Sheet 272 (Washington, DC: AARP Public Policy Institute, October 2012).
8 Federal Reserve Bank of New York, Household Credit Panel, “Household Debt and Credit Report, http://www.newyorkfed.org/householdcredit/index.html.
9 Ibid. 10 Ibid. 11 Although credit card issuers write off credit card debt, they continue trying to collect the debt or use
debt collectors. 12 CardHub Q1 2012 Credit Card Debt Study, http://www.cardhub.com/edu/q1-2012-credit-card-debt-study/. 13 Consumer Finance Protection Bureau, CARD Act Fact Sheet, February 2011,
http://www.consumerfinance.gov/credit-cards/credit-card-act/feb2011-factsheet/.

In the Red: Older Americans and Credit Card Debt
5
METHODOLOGY
The survey was carried out by GfK Knowledge Networks in February and March 2012 and included 997 households that had carried credit card debt for more than three months. Another survey was conducted for households that did not carry credit card debt. This report presents results for the indebted sample only, which consists of 565 people age 50+ and 432 people under age 50. Approximately 95 percent of the survey respondents were middle income, having incomes between $20,000 and $99,000. This is the middle-income range based on the middle three income quintiles of the Current Population Survey. See the appendix for details regarding the survey methodology and sample characteristics.
Throughout this report, references to “Americans age 50+” or “people under age 50” refer to these age groups within the population of predominately middle-income households carrying credit card debt for three months or longer.
CREDIT CARD DEBT BY AGE
Economists have called it the Great Deleveraging: Americans are tightening their belts and paying down debt.14 Although the survey did not collect data on the amount of debt written off, it found that 19 percent of people age 50+ had entered into a settlement agreement with a credit card company. Among low- and middle-income Americans who carried credit card debt, the survey found that credit card balances fell 28 percent between 2008 and 2012. But the decline was far less dramatic among older Americans who carried credit card debt: The 50+ population saw their credit card balance decline just 16 percent. Their counterparts under age 50 saw a 37 percent decline. The result is that older Americans now have higher overall credit card debt than younger people—a reversal of the trend Dēmos found in its 2008 survey. Credit card debt, too often portrayed as a problem of irresponsible young people who get carried away at the mall, must now be recognized as a serious issue for people age 50+.
Among middle-income Americans who carried credit card debt, the 50+ population had an average combined balance of $8,278 on all of their cards in 2012. This compares to overall credit card debt of $6,258 for the under-50 population. Both groups report having an average of three to four current credit cards in addition to one canceled or expired card for which they are still paying off debt.
14 See, for example, Meta Brown, Andrew Haughwout, Donghoon Lee, and Wilbert van der Klaauw, Have
Consumers Been Deleveraging? (New York, NY: Federal Reserve Bank of New York, March 21, 2011), http://libertystreeteconomics.newyorkfed.org/2011/03/have-consumers-become-more-frugal.html.
Figure 1 Change in Average Household Credit
Card Debt by Age "What is the total amount of credit card debt
that you currently have?"
Indebted households 50+
Indebted households
under 50
$9,817 $9,956 $8,278
$6,258
2008 (in 2011 dollars) 2012

In the Red: Older Americans and Credit Card Debt
6
All of this borrowing comes at a cost. Households reported that the average annual percentage rate (APR) today on their credit card with the highest balance is 16.13 percent. The 50+ population averaged a slightly lower APR of 15.95 percent, while people under 50 paid an average APR of 16.27 percent. However, APRs are higher for all groups than they were in 2008. Nearly one-quarter of indebted adults age 50+, and a similar proportion of the population under age 50, are paying interest rates above 20 percent.
REASONS FOR CREDIT CARD DEBT AMONG OLDER AMERICANS
During difficult times, Americans of all ages turn to credit cards for protection against economic instability and stagnant or declining income.15 Among middle-income Americans with credit card debt, adults age 50+ were less likely to rely on their credit cards to pay for basic costs of living than their younger counterparts. Yet older Americans are still borrowing to make ends meet with troubling frequency: Just over a third of indebted households headed by someone 50+ report that in the past year they used credit cards to pay for basic living expenses such as rent or mortgage payments, groceries, utilities, or insurance because they did not have enough money in their checking or savings accounts. Forty-six percent of the under-50 population said the same.
In addition to managing daily expenses, Americans 50+ use credit cards as a high-interest “plastic safety net” to cope with contingencies such as emergency car and home repairs or unexpected medical bills, which are among the top reasons older Americans reported that they had amassed credit card debt. Dealing with loss of employment was also a major reason that older Americans turned to credit cards: Nearly a quarter of the 50+ population say that job loss contributed to their credit card debt in the last three years, and 15 percent report that it was the single biggest contributor, a percentage statistically identical to the rate among younger people.
15 Draut and Garcia, “The Plastic Safety Net.”
Figure 2 APR on the Credit Card with the Highest Balance, for the Indebted 50+ Population
"What do you estimate is the annual percentage rate that you pay on the credit card with the highest balance?"
NOTE: APR percentages are statistically identical for the population under age 50.
APR 10% or less 21%
APR 10.1% - 15% 25%
APR 15.1% - 20% 22%
APR Over 20% 24%
Don’t Know 8%

In the Red: Older Americans and Credit Card Debt
7
Older Americans are significantly less likely than younger people to run up credit card debt making smaller purchases of nonessential goods and services. Just 16 percent of the 50+ population say that small purchases of items such as meals at restaurants, movies, DVDs, and clothes are the biggest contributor to their current credit card debt, compared to 27 percent of the under-50 population. Older Americans are also less likely than younger people to cite paying for college expenses as a contributor to credit card debt. Conversely, with their higher rate of homeownership, 38 percent of older Americans noted that home repairs contributed to their credit card debt over the last three years, versus 25 percent of people under age 50.
Older Americans are also more likely to take on credit card debt in an effort to assist other family members: About 23 percent of people age 50+ report that money given to, or used to pay the debts of relatives added to the balance on their credit cards, compared to just 11 percent of the population under age 50. This reflects a common economic reality: Younger people facing financial stress often turn to their parents for help, and in doing so, sometimes weaken the financial security of the older generation.
THE IMPACT OF MEDICAL EXPENSES
Out-of-pocket medical expenses are a major contributor to credit card debt for Americans of all ages, as the growing cost of health care put pressure on household budgets. Americans struggle to keep up with rising premiums, copayments, and deductibles, or to find economical options if they are uninsured. Persistently high unemployment rates add to this stress, since workers who are out of a job cannot rely on employer-provided health insurance. When medical expenses arise they are often unplanned and unavoidable, forcing households to take on debt to cover the cost.
Figure 3 Expenses Contributing to Current Credit Card Debt, By Age
(Question did not include medical expenses)
11%
18%
11%
17%
37%
53%
27%
25%
42%
6%
9%
23%
23%
29%
41%
23%
38%
49%
Starting up a new business or running an existing business
College tuition/expenses
Money given to, or used to pay the debts of relatives
Major household appliance purchase
Major purchase of a non-essentials
Smaller purchases of non-essentials
Layoff or loss of a job
Home repairs
Car repairs
Percentage of indebted households 50+ with current credit card debt from the expensePercentage of indebted households under 50 with current credit card debt from the expense

In the Red: Older Americans and Credit Card Debt
8
Medical expenses are ubiquitous. More than four in five Americans age 50+ who are carrying credit card debt incurred some out-of- pocket medical expense in the last three years. Among these households, six in ten said of out-of-pocket medical spending contributed to their current credit card debt. Half of all indebted households headed by an older American carried medical debt on their credit cards, with an average of $893 of credit card medical debt, compared with $746 among younger households.
People age 50+ mentioned dental expenses most frequently as a source of credit card debt, with 32 percent of older Americans citing them as a debt factor, compared to just 22 percent of younger people. The out-of-pocket cost of prescription medications contributed to credit card debt for 29 percent of older Americans in the survey; younger people were less likely to take on debt to buy medicine, but the difference was within the margin of error. Other medical expenses, such as visits to the doctor (a debt contributor for 24 percent of the 50+ population), hospital stays (15 percent), and emergency room visits (13 percent) contributed to the credit card debt of older and younger people at statistically identical rates.
Figure 4 Medical Expenses Contributing to
Current Credit Card Debt
13%
22%
10%
19%
22%
13%
32%
15%
29%
24%
Emergency room visits
Dental expenses
Hospital stays
Prescription medications
Visits to the doctor
Percentage of indebted households 50+ with current credit card debt from the expense
Percentage of indebted households under 50 with current credit card debt from the expense
Figure 5 Skipping Care or Treatment to Cut Medical Expenses
"In the past year, have you or a member of your household tried to reduce medical expenses by doing any of the following?"
Did not fill a prescription or postponed filling a
prescription
Did not go see doctor or visit a clinic when you had
a medical problem
Skipped medical test, treatment or follow up
32% 31% 36%
33%
45%
37%
Percentage of indebted households 50+ Percentage of indebted households under 50

In the Red: Older Americans and Credit Card Debt
9
The use of credit cards to pay medical expenses is an indicator of the financial stress that these expenses place on many families. Concern about medical expenses and the potential for medical debt induced half of Americans carrying credit card debt to cut back on medical care, often in ways that could negatively affect their health. About one-third of indebted households reported that they decided to forgo a medical test or treatment, and 36 percent said that they skipped or postponed filling a prescription in an effort to reduce medical costs. The proportions of people over and under age 50 were statistically identical. In addition, 31 percent of the 50+ population said they tried to cut costs by opting not to see a doctor or visit a clinic when they had a medical problem. Among younger people with credit card debt, the rate was even higher at 45 percent.
OLDER AMERICANS’ STRATEGIES FOR REDUCING CREDIT CARD DEBT
Digging out of debt can be a slow process, but a strong majority—62 percent—of middle-income indebted adults believe they will become free of credit card debt within the next year. Seventy-eight percent estimate that they will be debt-free within two years; older and younger Americans are equally optimistic about their ability to pay down their debt.
Older Americans have higher overall levels of credit card debt to begin with, but on average they also report making larger payments each month: $674 per month, compared to just $448 for the under-50 population. In addition, older adults are significantly more likely to report that they make more than the minimum payment on their credit cards—a practice that is essential for paying down debt. More than half—56 percent of the population age 50+—say they “rarely” or “never” pay only the minimum due each month on all of their cards, compared to just 39 percent of younger people.
In addition to drawing on their current incomes, households reported a range of strategies for paying off their credit card debt in the past year. Using a tax refund, dipping into savings, working an extra job, or taking on extra hours are the most popular tactics for all age groups. However, there are significant differences in the percentages of older and younger Americans reporting that they pursued each strategy. For example, people under age 50 are more likely to say they used money from a tax refund or worked more to pay down credit card debt.
Meanwhile, members of the 50+ population are more likely to say that they drew on retirement funds to pay their debt. This is a potentially troubling development, as 22 percent of older Americans—more than one in five—used retirement funds to pay down current credit card debt. However, it is worth noting that many of those who report using retirement funds to pay their credit cards are over 65 and may already be retired—for them, retirement funds may be the only income available. The more worrisome statistic is that 18 percent of the population age 50 to 64—people on the cusp of retirement who will need to live off their retirement savings in the near future—turn to their retirement funds to pay their credit cards.
Table 2 "How long do you think it will take before
you are completely out of credit card debt?" Less than 6 months 43% 6 months–1 year 19% 13 months–2 years 16% 25 months–5 years 13% 5 years–10 years 5% More than 10 years 3%
Note: Proportions of older and younger Americans estimating the time to pay off debt are statistically identical.

In the Red: Older Americans and Credit Card Debt
10
With mortgage interest rates at record lows, home equity was sometimes used to pay off large amounts of credit card debt. In our sample of middle-income Americans with credit card debt, people age 50+ are significantly more likely to be homeowners (81 percent) than their counterparts under age 50 (58 percent). Eleven percent of these older homeowners report that sometime in the last five years they cashed out home equity—by refinancing their home, getting a second home mortgage, or taking out a home equity line of credit—and used some of the resulting funds to pay down their credit card debt. On average, these older homeowners paid off $8,481 in credit card debt. However, this approach may turn out to be a short-term solution: These households carried a higher-than-average credit card balance of $10,310 even after the payoff.
It may not be a good move to trade unsecured credit card debt for home-secured debt, since unsecured debt can be eliminated in a bankruptcy filing while primary home mortgage debt cannot be eliminated or modified in bankruptcy. At the same time, turning
Figure 6 Strategies for Paying Down Debt in the Last Year
(Percentage of households by age)
56%
37%
41%
9%
13%
21%
8%
2%
6%
2%
7%
14%
1%
6%
43%
39%
29%
22%
14%
12%
9%
9%
7%
7%
6%
5%
2%
1%
Tax refund
Savings
Worked extra hours/Got extra job
Retirement Funds
Sold car or other valuable items
Money from a family member or friend
A loan from a bank or credit union
A home equity line of credit
Refinanced or a second mortgage
Life Insurance
Pawn shop, payday or auto title loan, etc.
Money from Earned Income Tax Credit
Money from a savings group
Stopped going to school50+
< 50
Table 3 “How often do you pay only
the minimum payment due each month on all of your credit cards?”
Percentage of Indebted Households
50+
Percentage of Indebted Households
Under 50 Always 10% 15% Usually 16% 18% Sometimes 17% 24% Rarely 24% 20% Never 32% 19% Don’t Know/ No answer 1% 4%
In the Red: Older Americans and Credit Card Debt
11
credit card debt into mortgage debt carries the added risk of losing the home if the new mortgage payments become too high to manage. Even if the home is not lost, this tactic reduces home equity, which is often people’s most valuable asset. Home equity is often relied upon in retirement to finance unexpected needs, especially major expenses associated with disabilities and the need for additional healthcare and long-term services and supports.
NEGATIVE CONSEQUENCES OF DEBT
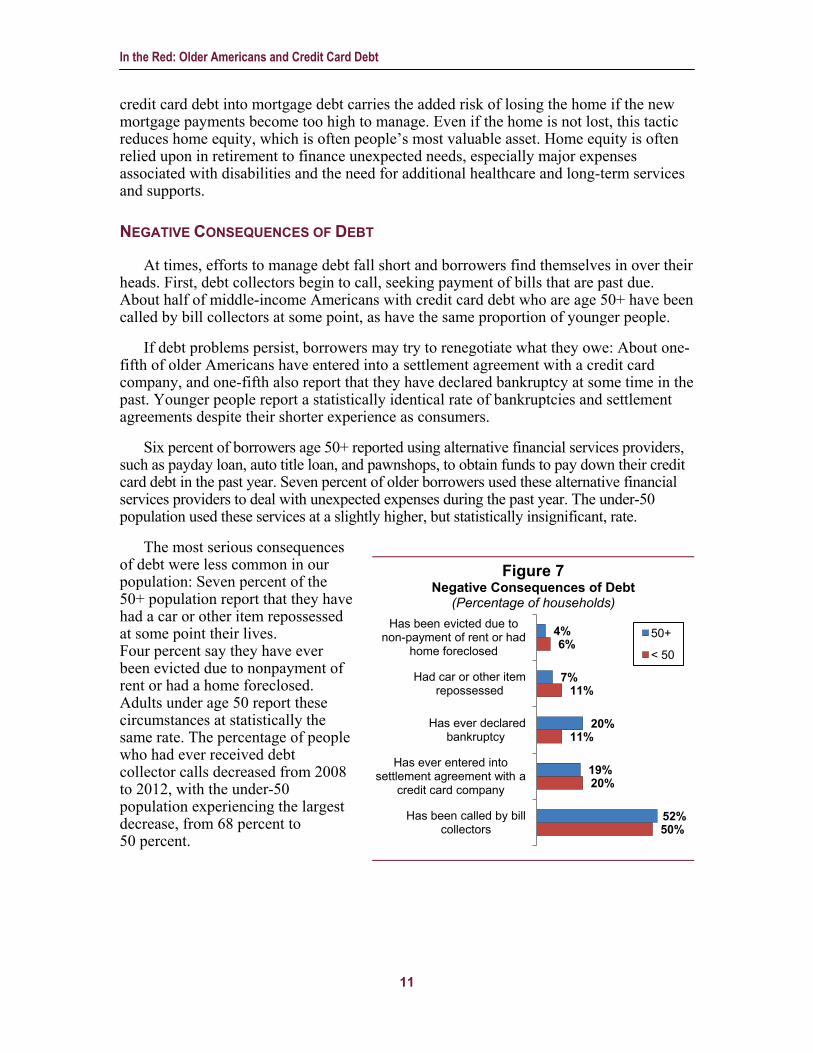
At times, efforts to manage debt fall short and borrowers find themselves in over their heads. First, debt collectors begin to call, seeking payment of bills that are past due. About half of middle-income Americans with credit card debt who are age 50+ have been called by bill collectors at some point, as have the same proportion of younger people.
If debt problems persist, borrowers may try to renegotiate what they owe: About one-fifth of older Americans have entered into a settlement agreement with a credit card company, and one-fifth also report that they have declared bankruptcy at some time in the past. Younger people report a statistically identical rate of bankruptcies and settlement agreements despite their shorter experience as consumers.
Six percent of borrowers age 50+ reported using alternative financial services providers, such as payday loan, auto title loan, and pawnshops, to obtain funds to pay down their credit card debt in the past year. Seven percent of older borrowers used these alternative financial services providers to deal with unexpected expenses during the past year. The under-50 population used these services at a slightly higher, but statistically insignificant, rate.
The most serious consequences of debt were less common in our population: Seven percent of the 50+ population report that they have had a car or other item repossessed at some point their lives. Four percent say they have ever been evicted due to nonpayment of rent or had a home foreclosed. Adults under age 50 report these circumstances at statistically the same rate. The percentage of people who had ever received debt collector calls decreased from 2008 to 2012, with the under-50 population experiencing the largest decrease, from 68 percent to 50 percent.
Figure 7 Negative Consequences of Debt
(Percentage of households)
50%
20%
11%
11%
6%
52%
19%
20%
7%
4%
Has been called by bill collectors
Has ever entered into settlement agreement with a
credit card company
Has ever declared bankruptcy
Had car or other item repossessed
Has been evicted due to non-payment of rent or had
home foreclosed 50+
< 50

In the Red: Older Americans and Credit Card Debt
12
THE IMPACT OF THE CARD ACT ON OLDER AMERICANS
The CARD Act set new regulations for clarity and disclosure in monthly billing statements. The survey shows that 90 percent of middle-income households with credit card debt have noticed the change on their monthly statements, regardless of age. While the new disclosures did not lead to a change in behavior for all people, one-third of older Americans are responding by paying down their balances faster, while only 2 percent pay less toward their balance in a typical month.
In addition to encouraging debtors to pay down high balances, the CARD Act offered consumers a reprieve from the assorted charges and fees that accompanied many accounts. In 2012, 25 percent of Americans age 50+ reported paying late fees—a significant decline from the 43 percent of indebted households that accrued these fees in 2008. Of older adults who experienced late fees, 35 percent saw interest rates go up on that card as a result, down from 51 percent in 2008, and only 11 percent experienced interest rate increases on other cards.
The CARD Act nearly eliminated over-the-limit fees. Instead of denying transactions that exceeded a consumer’s credit limit, credit card companies used to process them and charged consumers a fee—whether the consumers wanted to go above their credit limit or not. The CARD Act requires consumer authorization for exceeding credit limits. In 2012, only 2 percent of Americans age 50+ reported that they paid over-the-limit fees more often in the past two years.
Some observers have linked the recent overall increase in credit card interest rates to the implementation of the CARD Act.16 Since the act reduced card issuers’ profit from fees and other practices, they contend, credit card companies raised rates and reduced the availability of credit. This survey does find an
16 See, for example, Kenneth J. Clayton, “ABA Statement on Meeting at the Consumer Financial
Protection Bureau,” http://www.aba.com/Press/Pages/022211CFPBMeeting.aspx.
Table 4 Impact of the CARD Act on Households in the Past Two Years
Percentage of Indebted Households
50+
Percentage of Indebted Households
under 50 Paid More Toward Credit Card Balances in the Typical Month 32% 34%
Charged Late Fees Less Often 28% 24% Charged Over-the-limit Fees Less Often 23% 20%
Figure 8 Percentage of Indebted Households 50+ that Accrued Late Fees in the Past Year
2008 2012
43%
25%

In the Red: Older Americans and Credit Card Debt
13
increase in credit card interest rates compared to 2008. In addition, 22 percent of indebted adults of all age groups report that they had their credit limit reduced in the last three years. However, this survey does not examine the causes of this constriction of credit. It should be noted that lenders across many industry sectors, such as mortgage, auto loan, and small business—types of lending not subject to the CARD Act—also tightened lending standards during this period in an effort to reduce risk associated with loan defaults in the wake of the financial crisis.17
CONCLUSION
Coping with increasing medical expenses, costs of car repairs and home repairs, and stagnant incomes or job loss, middle-income Americans age 50+ are carrying higher average credit card balances than the under-50 population. In recent years, as many households have deleveraged, older Americans have done so at a slower pace than the under-50 population. While approaching an age when many Americans are hoping to achieve a measure of financial stability, one-third of indebted households headed by someone age 50+ report that they used credit cards to pay for basic living expenses such as rent or mortgage payments, groceries, utilities, or insurance in the past year because they did not have enough money in their checking or savings accounts.
The overall picture is one of precariousness, of a population often turning to a high-interest “plastic safety net” during difficult times. This instability has troubling implications for the retirement security of older Americans who carry credit card debt. Indeed, older Americans report that in order to pay off their credit card debt and deal with unexpected expenses, they dug into their savings—including retirement funds that they might soon need to live on. Some older households decided they had to forgo medical care, and others declared bankruptcy.
One positive finding is that consumers have become more aware of the fees and costs associated with credit card borrowing. It appears that the implementation of the CARD Act, which made credit cards safer, fairer, and more transparent, has saved consumers money on late fees and over-the-limit charges, while encouraging consumers of all ages to pay down their credit card balances faster.
17 For documentation of this trend, see Board of Governors of the Federal Reserve System,
http://www.federalreserve.gov/boarddocs/SnLoanSurvey/200808/fullreport.pdf.

In the Red: Older Americans and Credit Card Debt
14
APPENDIX
The survey was carried out by GfK Knowledge Networks in February and March 2012 and covered 1,997 households, including 997 households that had carried credit card debt for more than three months (the indebted sample) and 1,000 households that had credit cards but no credit card debt at the time of the survey (the nondebted sample). This report presents results for the indebted sample only, which consists of 565 people age 50+ and 432 people under age 50.
Respondents were randomly sampled using Knowledge Panel—a nationally representative panel that incorporates the views and opinions of all Americans and is not susceptible to the biases of “opt-in” panels. Knowledge Panel utilizes an online questionnaire, achieving a probability sample based on random digital dial sampling and address-based sampling, and providing computer and Internet access to households that are not online. For this survey, low to middle income is defined as a total household income between 50 percent and 120 percent of the local (county-level) median income. Because median incomes vary widely across geographic regions, local data were used to capture an equivalent standard of living for low- and middle-income households. Ninety-five percent of households in the indebted sample had an annual income between $20,000 and $100,000.
All respondents were at least 18 years of age. In order to ensure that the indebted sample captures households that carry credit card debt, as opposed to households carrying a temporary balance, we included only households that reported having a balance for more than three months. The margin of error for the indebted sample is +/- 3.9 percentage points. The margin of error for the indebted sample population under 50 years of age is +/- 5.8 percentage points, while the margin of error for the age 50+ sample is +/- 5.1 percentage points.
The 2012 survey was developed based on Dēmos’ 2008 telephone survey on household debt. The majority of the questionnaire remained identical in order to maintain trend information, but some questions were added to gain further insights on the CARD Act and credit cards and loans. The comparison to data from the 2008 survey on credit card debt was cross-sectional—the surveys included different nationally representative samples of households. In order to make the 2008 and 2012 results comparable, a subset of the 2012 sample was surveyed by telephone to account for the change in the survey medium and allow for calibration.
Calibration was required because the 2008 survey was entirely telephone-based, while the 2012 survey took place mainly via computer. To ensure that the differences between the two surveys were due to changes in the experience of the sample populations and not due to changes in the survey method, the 2012 survey incorporated a subsample of telephone-based responses. These responses were compared to the rest of the
Table A-1 Income Breakdowns for 2012 Indebted Sample
All
Age Under
50
Ages 50 and
Older Less than $20,000 3.33% 2.59% 4.22% $20,000–$99,999 94.92% 95.84% 93.79% $100,000 or more 1.75% 1.56% 1.98%

In the Red: Older Americans and Credit Card Debt
15
2012 survey population to determine how respondents may differ depending on the medium of participation. GfK Knowledge Networks factored this comparison into the determination of the overall weighting of the data. The weighting was based on nationally representative statistics for age, race and ethnicity, education, income, household size, and homeownership, as well as several key questions from the survey.
Table A-2 Sample Size for 2012 Indebted Sample by Age
Age Under 50
Ages 50–64
Ages 65+
Unweighted Base 432 357 208 Weighted Base 545 295 158
Table A-3 Indebted Sample by Age and Race/Ethnicity,
Unweighted Sample Totals
Age Under 50
Ages 50–64
Ages 65+
White, Non-Hispanic 287 269 167 Black, Non-Hispanic 38 41 18 Other, Non-Hispanic 18 9 5 Hispanic 77 25 11 2+ Races, Non-Hispanic 12 13 7
Table A-4 Indebted Sample by Age and Educational Attainment,
Unweighted Sample Totals
Age Under 50
Ages 50–64
Ages 65+
Less Than High School 30 15 21 High School 103 111 79 Some College 158 150 63 Bachelor’s Degree or Higher 141 81 45
Unfortunately, reliable comparisons of subpopulations within each age category—such as those based on age and race/ethnicity or age and education level—are not possible due to the scale of the survey. In many cases, the sample sizes of such subgroups are too small to allow for significance testing. In others, where significance testing is possible, the margin of error is too great to allow meaningful statements about differences between subgroups.
