in the supreme court of florida · 2014-12-18 · in the supreme court of florida case no....
TRANSCRIPT

Americas 90350386 1
IN THE SUPREME COURT OF FLORIDA
CASE NO. SC14-1905
THE LEAGUE OF WOMEN VOTERS OF FLORIDA, et al., Appellants, L.T. Case No. 1D14-3953 vs. KEN DETZNER, et al., Appellees. ______________________________/
_______________________________________________________________
ON DISCRETIONARY REVIEW OF AN ORDER OF THE CIRCUIT COURT OF THE SECOND JUDICIAL CIRCUIT IN AND FOR LEON COUNTY,
FLORIDA, CERTIFIED BY THE FIRST DISTRICT COURT OF APPEAL AS PASSING UPON A QUESTION OF GREAT PUBLIC IMPORTANCE
_______________________________________________________________
APPENDIX TO THE LEGISLATIVE PARTIES’ UNOPPOSED MOTION TO SUPPLEMENT RECORD ON APPEAL
_______________________________________________________________
Filing # 21731969 Electronically Filed 12/17/2014 04:03:45 PM
RECEIVED, 12/17/2014 16:08:46, John A. Tomasino, Clerk, Supreme Court

League of Women Voters of Florida, et al. v. Detzner, et al. Case No. SC14-1905
Americas 90350386
2
Raoul G. Cantero Florida Bar No. 552356 Jason N. Zakia Florida Bar No. 698121 Jesse L. Green Florida Bar No. 95591 White & Case LLP Southeast Financial Center 200 S. Biscayne Blvd., Suite 4900 Miami, Florida 33131-2352 Telephone: (305) 371-2700 Facsimile: (305) 358-5744 E-mail: [email protected] E-mail: [email protected] E-mail: [email protected] George T. Levesque Florida Bar No. 555541 General Counsel, The Florida Senate 305 Senate Office Building 404 South Monroe Street Tallahassee, Florida 32399-1100 Telephone: (850) 487-5237 E-mail: [email protected] Attorneys for Appellees, Florida Senate and President Andy Gardiner
Charles T. Wells Florida Bar No. 086265 George N. Meros, Jr. Florida Bar No. 263321 Jason L. Unger Florida Bar No. 0991562 Andy Bardos Florida Bar No. 822671 GrayRobinson, P.A. Post Office Box 11189 Tallahassee, Florida 32302 Telephone: (850) 577-9090 E-mail: [email protected] E-mail: [email protected] E-mail: [email protected] E-mail: [email protected] Matthew J. Carson Florida Bar No. 827711 General Counsel, The Florida House of Representatives 422 The Capitol 402 South Monroe Street Tallahassee, Florida 32399-1300 Telephone: 850-717-5500 E-mail: [email protected] Attorneys for Appellees, the Florida House of Representatives and Speaker Steve Crisafulli
League of Women Voters of Florida, et al. v. Detzner, et al. Case No. SC14-1905
Americas 90350386
3
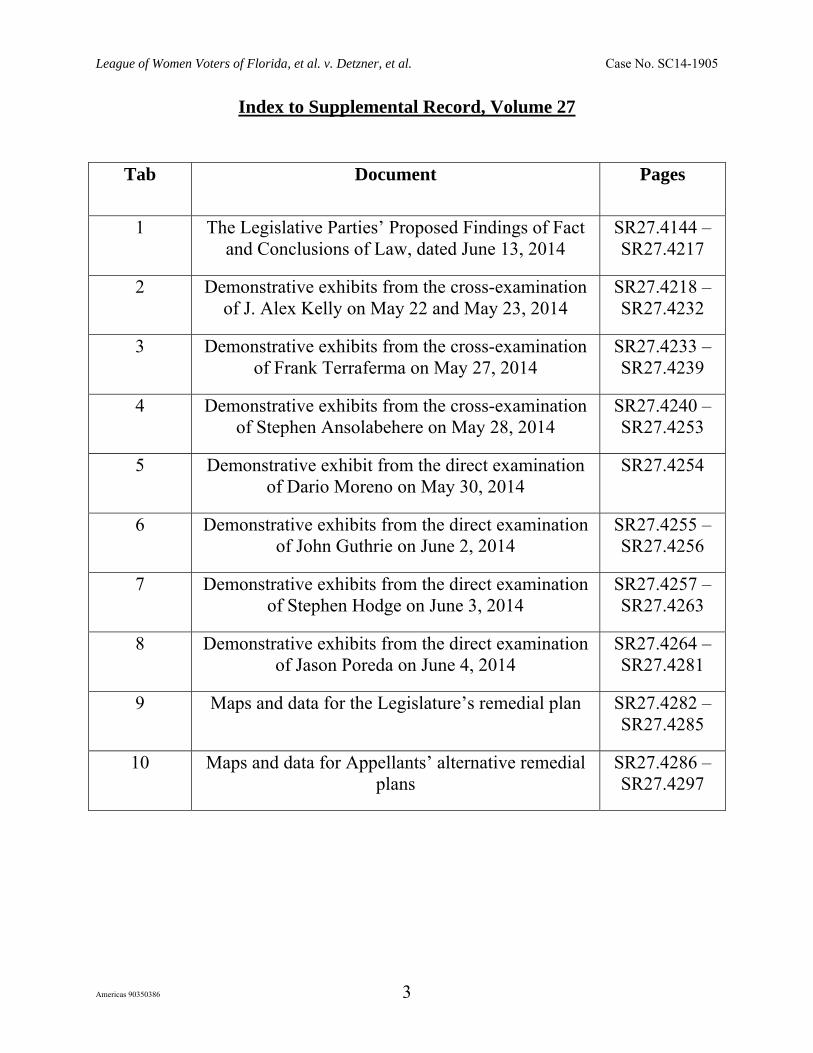
Index to Supplemental Record, Volume 27
Tab Document Pages
1 The Legislative Parties’ Proposed Findings of Fact and Conclusions of Law, dated June 13, 2014
SR27.4144 – SR27.4217
2 Demonstrative exhibits from the cross-examination of J. Alex Kelly on May 22 and May 23, 2014
SR27.4218 – SR27.4232
3 Demonstrative exhibits from the cross-examination of Frank Terraferma on May 27, 2014
SR27.4233 – SR27.4239
4 Demonstrative exhibits from the cross-examination of Stephen Ansolabehere on May 28, 2014
SR27.4240 – SR27.4253
5 Demonstrative exhibit from the direct examination of Dario Moreno on May 30, 2014
SR27.4254
6 Demonstrative exhibits from the direct examination of John Guthrie on June 2, 2014
SR27.4255 – SR27.4256
7 Demonstrative exhibits from the direct examination of Stephen Hodge on June 3, 2014
SR27.4257 – SR27.4263
8 Demonstrative exhibits from the direct examination of Jason Poreda on June 4, 2014
SR27.4264 – SR27.4281
9 Maps and data for the Legislature’s remedial plan SR27.4282 – SR27.4285
10 Maps and data for Appellants’ alternative remedial plans
SR27.4286 – SR27.4297

TAB 1
1 MIAMI 1014554
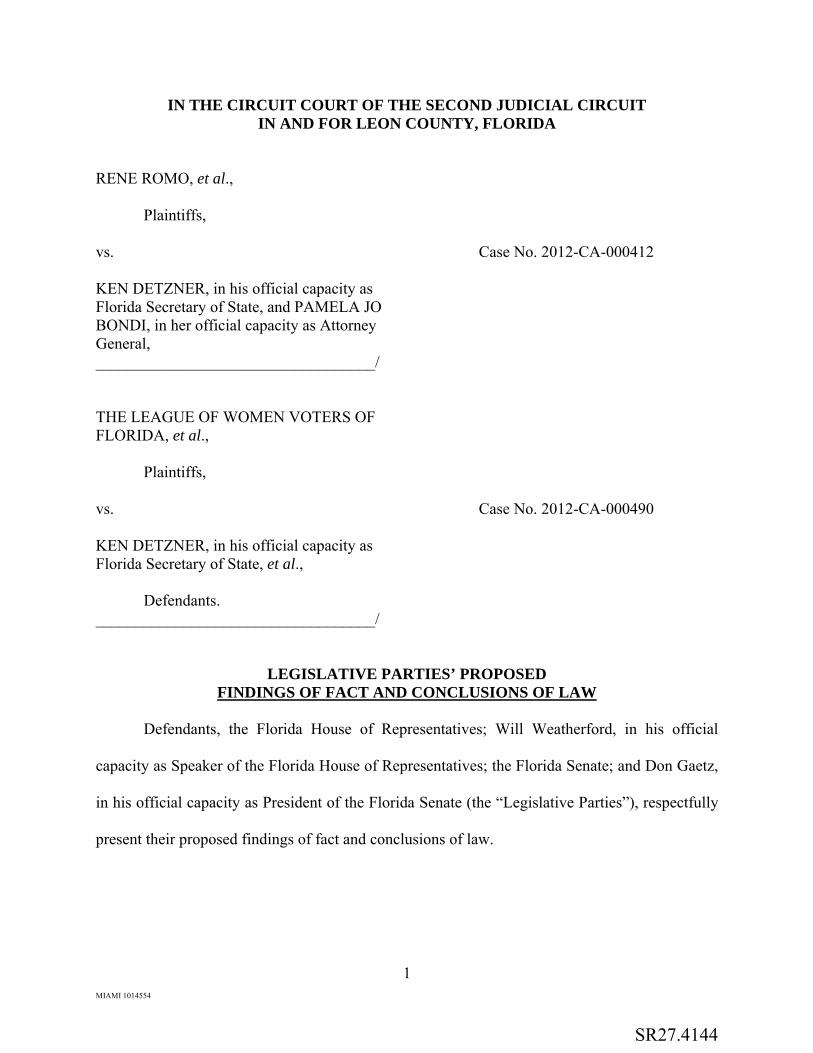
IN THE CIRCUIT COURT OF THE SECOND JUDICIAL CIRCUIT IN AND FOR LEON COUNTY, FLORIDA
RENE ROMO, et al.,
Plaintiffs, vs. Case No. 2012-CA-000412 KEN DETZNER, in his official capacity as Florida Secretary of State, and PAMELA JO BONDI, in her official capacity as Attorney General, ___________________________________/ THE LEAGUE OF WOMEN VOTERS OF FLORIDA, et al.,
Plaintiffs, vs. Case No. 2012-CA-000490 KEN DETZNER, in his official capacity as Florida Secretary of State, et al., Defendants. ___________________________________/
LEGISLATIVE PARTIES’ PROPOSED FINDINGS OF FACT AND CONCLUSIONS OF LAW
Defendants, the Florida House of Representatives; Will Weatherford, in his official
capacity as Speaker of the Florida House of Representatives; the Florida Senate; and Don Gaetz,
in his official capacity as President of the Florida Senate (the “Legislative Parties”), respectfully
present their proposed findings of fact and conclusions of law.
SR27.4144
Romo, et al. v. Detzner, et al. Case No. 2012-CA-000412 League of Women Voters, et al. v. Detzner, et al. Case No. 2012-CA-000490
2 MIAMI 1014554
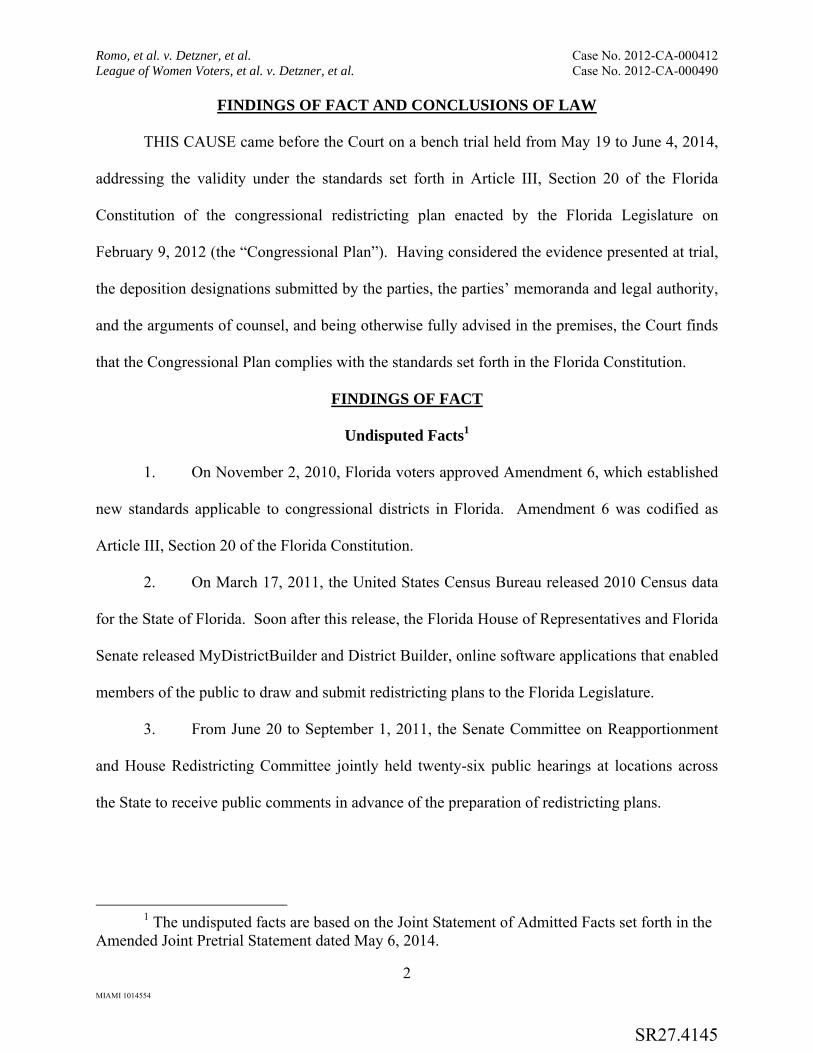
FINDINGS OF FACT AND CONCLUSIONS OF LAW
THIS CAUSE came before the Court on a bench trial held from May 19 to June 4, 2014,
addressing the validity under the standards set forth in Article III, Section 20 of the Florida
Constitution of the congressional redistricting plan enacted by the Florida Legislature on
February 9, 2012 (the “Congressional Plan”). Having considered the evidence presented at trial,
the deposition designations submitted by the parties, the parties’ memoranda and legal authority,
and the arguments of counsel, and being otherwise fully advised in the premises, the Court finds
that the Congressional Plan complies with the standards set forth in the Florida Constitution.
FINDINGS OF FACT
Undisputed Facts1
1. On November 2, 2010, Florida voters approved Amendment 6, which established
new standards applicable to congressional districts in Florida. Amendment 6 was codified as
Article III, Section 20 of the Florida Constitution.
2. On March 17, 2011, the United States Census Bureau released 2010 Census data
for the State of Florida. Soon after this release, the Florida House of Representatives and Florida
Senate released MyDistrictBuilder and District Builder, online software applications that enabled
members of the public to draw and submit redistricting plans to the Florida Legislature.
3. From June 20 to September 1, 2011, the Senate Committee on Reapportionment
and House Redistricting Committee jointly held twenty-six public hearings at locations across
the State to receive public comments in advance of the preparation of redistricting plans.
1 The undisputed facts are based on the Joint Statement of Admitted Facts set forth in the
Amended Joint Pretrial Statement dated May 6, 2014.
SR27.4145
Romo, et al. v. Detzner, et al. Case No. 2012-CA-000412 League of Women Voters, et al. v. Detzner, et al. Case No. 2012-CA-000490
3 MIAMI 1014554
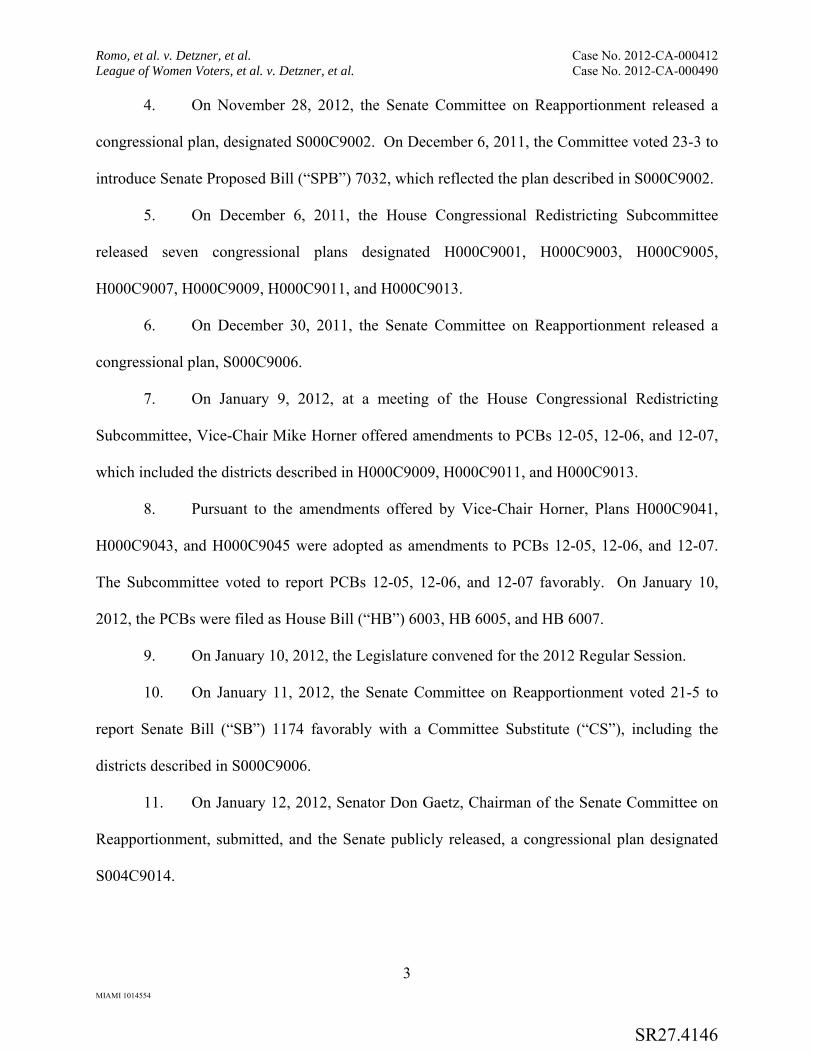
4. On November 28, 2012, the Senate Committee on Reapportionment released a
congressional plan, designated S000C9002. On December 6, 2011, the Committee voted 23-3 to
introduce Senate Proposed Bill (“SPB”) 7032, which reflected the plan described in S000C9002.
5. On December 6, 2011, the House Congressional Redistricting Subcommittee
released seven congressional plans designated H000C9001, H000C9003, H000C9005,
H000C9007, H000C9009, H000C9011, and H000C9013.
6. On December 30, 2011, the Senate Committee on Reapportionment released a
congressional plan, S000C9006.
7. On January 9, 2012, at a meeting of the House Congressional Redistricting
Subcommittee, Vice-Chair Mike Horner offered amendments to PCBs 12-05, 12-06, and 12-07,
which included the districts described in H000C9009, H000C9011, and H000C9013.
8. Pursuant to the amendments offered by Vice-Chair Horner, Plans H000C9041,
H000C9043, and H000C9045 were adopted as amendments to PCBs 12-05, 12-06, and 12-07.
The Subcommittee voted to report PCBs 12-05, 12-06, and 12-07 favorably. On January 10,
2012, the PCBs were filed as House Bill (“HB”) 6003, HB 6005, and HB 6007.
9. On January 10, 2012, the Legislature convened for the 2012 Regular Session.
10. On January 11, 2012, the Senate Committee on Reapportionment voted 21-5 to
report Senate Bill (“SB”) 1174 favorably with a Committee Substitute (“CS”), including the
districts described in S000C9006.
11. On January 12, 2012, Senator Don Gaetz, Chairman of the Senate Committee on
Reapportionment, submitted, and the Senate publicly released, a congressional plan designated
S004C9014.
SR27.4146

Romo, et al. v. Detzner, et al. Case No. 2012-CA-000412 League of Women Voters, et al. v. Detzner, et al. Case No. 2012-CA-000490
4 MIAMI 1014554
12. On January 17, 2012, CS/SB 1174 was considered on the Senate floor. Plan
S004C9014 was adopted as an amendment, and CS/SB 1174 passed the Senate 34-6.
13. On January 27, 2012, at a meeting of the House Redistricting Committee, Vice-
Chair Precourt offered an amendment to HB 6005. The amendment included the districts
described in H000C9047. The Committee adopted the amendment offered by Vice-Chair
Precourt. The House Redistricting Committee then voted 14-6 to report CS/HB 6005 favorably.
14. On February 2, 2012, the House approved the districts described in H000C9047
as an amendment to CS/SB 1174. On February 3, 2012, the House passed the bill, as amended,
80-37.
15. On February 9, 2012, the Senate concurred in the House amendment. The vote on
final passage of CS/SB 1174 (H000C9047) was 32-5.
16. On February 16, 2012, Florida Governor Rick Scott signed the Congressional
Plan into law (Chapter 2012-2, Laws of Florida).
Preparation of the Congressional Plan
17. The Congressional Plan was drawn by professional committee staff of the Florida
Legislature. Alex Kelly and Jason Poreda, staff members of the House Redistricting Committee,
and John Guthrie, staff director of the Senate Committee on Reapportionment, were the primary
architects of the Congressional Plan (June 2 Tr. 150:14-18; June 4 AM Tr. 18:14-22).
18. The Legislature directed their respective professional staff to adhere to the
requirements of the law and afforded professional staff substantial discretion to develop a
compliant redistricting plan. Mr. Guthrie, Mr. Kelly, and Mr. Poreda each testified at trial that,
in the preparation of the Congressional Plan, they did not intend to favor or disfavor a political
party or an incumbent (May 23 Tr. 39:19-23, June 2 Tr. 177:10-13, 234:4-15, June 4 Tr. 92:15-
SR27.4147

Romo, et al. v. Detzner, et al. Case No. 2012-CA-000412 League of Women Voters, et al. v. Detzner, et al. Case No. 2012-CA-000490
5 MIAMI 1014554
24). Except as necessary to perform a functional analysis of minority districts, professional staff
did not review political performance data or conduct any political performance analysis (June 2
Tr. 166:17-167:11, June 4 Tr. 72:22-25). Mr. Guthrie, Mr. Kelly, and Mr. Poreda each testified
that no outside political consultant, including Republican consultants Marc Reichelderfer, Pat
Bainter, Frank Terraferma, and Rich Heffley, provided redistricting maps, performance
information, or other map-drawing advice to, or in any way influenced the map-drawing
decisions of, professional staff (May 23 Tr. 39:7-18; June 2 Tr. 232:25-234:3; June 4 AM Tr.
92:22-14). The Court finds the testimony of Mr. Guthrie, Mr. Kelly, and Mr. Poreda to be
credible.
19. Throughout the legislative process, professional staff worked continuously to
improve the objective metrics and legal compliance of the Congressional Plan. In the Senate, the
basic metrics2 of the final, enacted plan were equal to or superior to earlier Senate proposals:
Plan Reock Score Convex
Hull Score Split Counties
Split Municipalities
S000C9002 0.40 0.71 23 63 S000C9006 0.39 0.71 24 45 S000C9014 0.39 0.71 24 46 H000C9047 0.40 0.72 21 27
20. Similarly, in the House, the objective metrics of the proposal that advanced at
each stage were superior to those of the other proposals. The seven proposals initially
considered by the House Congressional Redistricting Subcommittee reflected the following data:
2 Unless otherwise noted, the statistics for maps discussed in this Order are incorporated as part of Joint Exhibit 1.
SR27.4148

Romo, et al. v. Detzner, et al. Case No. 2012-CA-000412 League of Women Voters, et al. v. Detzner, et al. Case No. 2012-CA-000490
6 MIAMI 1014554
Plan Reock Score Convex
Hull Score Split Counties
Split Municipalities
H000C9001 0.39 0.74 24 51 H000C9003 0.40 0.74 26 57 H000C9005 0.39 0.73 22 50 H000C9007 0.40 0.73 24 55 H000C9009 0.41 0.75 26 52 H000C9011 0.42 0.74 22 48 H000C9013 0.40 0.74 23 58
The Subcommittee reported three maps—H000C9009, H000C9011, and H000C9013—to the
House Redistricting Committee. The Committee amended each of the proposals and reported
H000C9043, the objective metrics of which were again superior to the competing proposals:
Plan Reock Score Convex
Hull Score Split Counties
Split Municipalities
H000C9041 0.41 0.74 26 44 H000C9043 0.42 0.74 22 39 H000C9045 0.40 0.74 23 48 The final revision—H000C9047—reflected further improvement. While its compactness scores
decreased slightly, the plan preserved one additional county and twelve additional municipalities:
Plan Reock Score Convex
Hull Score Split Counties
Split Municipalities
H000C9047 0.40 0.72 21 27
21. The consequence of the Congressional Plan was to disrupt and inconvenience
Republican incumbents (May 19 Tr. 198:22-204:5; May 20 Tr. 116:18-117:8; May 27 AM Tr.
91:25-93:1, 93:9-94:3-20, 95:8-96:2; Holder Dep. 192:21-193:1-5, 193:8-13, 194:5-8).
Republican incumbents John Mica and Sandy Adams were paired, and Mica defeated Adams in
the primary election. Republican incumbents Cliff Stearns and Ted Nugent were paired, forcing
Stearns to run in a district that did not include his home town, and Stearns was defeated by a
challenger in the primary election. Republican incumbent Dan Webster ran in a district that
included only 56.2% of the population that resided in his former district, did not include his
SR27.4149

Romo, et al. v. Detzner, et al. Case No. 2012-CA-000412 League of Women Voters, et al. v. Detzner, et al. Case No. 2012-CA-000490
7 MIAMI 1014554
home, and narrowed his margin of victory from 17.9% to 3.4%. Republican Mario Diaz-Balart’s
home was placed in a district that included only 18.2% of his former constituents; he ran in a
different district that was populated by only 51.1% of his former constituents. Republican
incumbent David Rivera’s home was placed into the district from which Diaz-Balart chose to
run, forcing Rivera to run in a different district, and Rivera was defeated in the general election
by Democratic challenger Joe Garcia. Republican Allen West sought reelection in a district 40
miles from his home and was defeated by Democratic challenger Patrick Murphy. And
Republican incumbent Tom Rooney sought reelection 30 miles from his home in a district with
only 37.1% of his former constituents.
Congressional District 5
22. Benchmark CD3 was a historically performing district entitled to constitutional
protection. With a Black VAP of 49.86%, Benchmark CD3 and its predecessor districts had
consistently elected the African-American candidate of choice for the previous 20 years.
23. In the Congressional Plan, CD5 has a Black VAP of 50.06%. It includes the
African-American community of Sanford. This community has been an integral part of the
benchmark district since it was first created by a federal district court in 1992. Plaintiffs contend
that inclusion of the African-American community of Sanford in CD5 indicates an intent to favor
the Republican Party and violates the Tier-Two standards of the Florida Constitution.
24. Plaintiffs offer two alternative configurations of CD5, both of which extend from
Jacksonville to the Chattahoochee River west of Tallahassee. The testimony establishes that no
one has shown how to draw a majority-minority district in northeast Florida without including
urban populations of Jacksonville, Orlando, Gainesville, and Sanford, as well as smaller
communities in between that historically have been included in the district (June 2 Tr. 190:19-
192:14). Plaintiffs offered no evidence to suggest that a district that travels south from
SR27.4150

Romo, et al. v. Detzner, et al. Case No. 2012-CA-000412 League of Women Voters, et al. v. Detzner, et al. Case No. 2012-CA-000490
8 MIAMI 1014554
Jacksonville can stop short of Orlando and avoid diminishment in the ability of minorities to
elect their preferred candidates.
25. The Legislature drew CD5 as a majority-minority district in part to satisfy the
“majority-minority rule” announced in Bartlett v. Strickland, 556 U.S. 1 (2009). The Legislature
was well aware of the implications of Bartlett, which construed Section 2 of the Voting Rights
Act (“VRA”). In 2009 and 2010, Speaker Cannon chaired the Select Policy Council on Strategic
and Economic Planning, which held several meetings at which the implications of Bartlett were
discussed (May 28 AM Tr. 67:10-68:13. When the House and Senate conferred in January 2012
to reconcile their redistricting plans, there was agreement that, to avoid Section 2 liability, the
Legislature should draw CD5 as a majority-minority district (May 20 Tr. 179:24-180:2, 182:2-
22, 183:18-25, 184:24-185:15, 193:25-194:4; May 21 Tr. 150:24-151:3, 151:24-152:5, 229:4-8;
May 22 Tr. 200:15-22; June 2 Tr. 193:19-194:6). Mr. Poreda and Mr. Guthrie prepared the final
plan and found it possible to draw CD5 as a majority-minority district and minimize its impact
on other districts (June 2 Tr. 197:18-198:18, June 4 Tr. 66:22-67:16).
26. The minority communities that comprise CD5 share common challenges and
common needs, interests, and characteristics. The expert testimony of Professors Darryl Paulson
and Robert Cassanello and the fact testimony of the witnesses of Defendant-Intervenor, Florida
State Conference of NAACP Branches, establishes that the communities comprising CD5 share
both a common history of discrimination and present, common challenges, needs, interests, and
characteristics. Turner Clayton of Seminole County, Evelyn Foxx of Alachua County, Whitfield
Jenkins of Marion County, George Young of Duval County, Beverlye Neal of Orange County,
and Sanford City Commissioner Velma Williams, citizens with a history of civic engagement,
testified credibly about the social, historical, and political conditions that black voters confront in
SR27.4151
Romo, et al. v. Detzner, et al. Case No. 2012-CA-000412 League of Women Voters, et al. v. Detzner, et al. Case No. 2012-CA-000490
9 MIAMI 1014554
their communities. Collectively, their testimony establishes that the minority communities in
CD5 share political objectives and are united by economic and other challenges apart from race.
27. The minority populations in these communities are therefore reasonably compact
as determined in Martinez v. Bush, 234 F. Supp. 2d 1275, 1301 (S.D. Fla. 2002). In addition, as
both the NAACP’s expert witness, Dr. Richard Engstrom, and Plaintiffs’ expert, Dr. Stephen
Ansolabehere, agree, voting is racially polarized in Northeast Florida, including CD5 (May 28
PM Tr. 93:6-9; June 2 Tr. 83:7-84:22, 85:14-19, 86:3-7).
28. Professional staff of the House performed a functional analysis of CD5, as well as
the other minority districts in the Congressional Plan. Professional staff reviewed the same data
that the Florida Supreme Court found relevant in Apportionment I, and performed the same
functional analysis on congressional districts as it performed on State House districts (May 23
Tr. 59:5-13; June 4 Tr. 30:14-20).
Congressional District 10
29. District 10 includes an extension into Orlando. The extension is situated between
two minority districts—CD5, a historically performing African-American district, and CD9, a
new Hispanic opportunity district centered in Osceola County.
30. The extension from District 10 into Orlando contains approximately 105,000
people, of whom more than 70% are white. The addition of this population to CD5 or CD9
would have compromised the ability of minorities in those districts to elect the candidates of
their choice. While some drafts considered in the Legislature did not include the extension, CD9
in those drafts divided Osceola County and did not achieve 40% Hispanic VAP. There is no
evidence that these objectives could have been achieved and the extension eliminated.
SR27.4152

Romo, et al. v. Detzner, et al. Case No. 2012-CA-000412 League of Women Voters, et al. v. Detzner, et al. Case No. 2012-CA-000490
10 MIAMI 1014554
Congressional Districts 13 and 14
31. Benchmark CD11 preceded CD14. It is uncontested that, in Benchmark CD11,
minority voters were able to elect the candidate of their choice. Blacks and Hispanics vote
cohesively in this area, and together comprised approximately 50% of the VAP of CD11.
32. Benchmark CD11 included parts of Hillsborough, Pinellas, and Manatee
Counties. In new CD14, the Legislature eliminated the extension into Manatee County. The
Legislature concluded, however, that, given the history of preclearance in Florida, CD14 could
not be further removed from Pinellas County without a diminishment in minority voting strength
(May 23 Tr. 73:18-24).
33. In enacting CD14, the Legislature stated that CD14 is consistent with Section 5 of
the VRA and “does not deny or abridge the equal opportunity of racial or language minorities to
participate in the political process or diminish their ability to elect representatives of their
choice.” Ch. 2012-2, at 4, Laws of Fla. The Legislature included a discussion of CD14 in its
preclearance application, and the Department of Justice precleared the Congressional Plan.
34. Compared to Benchmark CD11, CD14 in Plaintiffs’ alternative maps reduces the
combined black and Hispanic share of the Democratic primary electorate from 44.1 to 35.0%.
Thus, Plaintiffs remove more than one-fifth of the minority population from the Democratic
primary. The alternative maps also decrease the compactness of the entire region of the State:
Reock Score Convex Hull Score Congressional Plan Romo Maps Congressional Plan Romo Maps
CD12 0.40 0.38 0.81 0.79 CD13 0.46 0.57 0.82 0.91 CD14 0.36 0.28 0.69 0.60 CD15 0.44 0.33 0.75 0.67 CD16 0.42 0.32 0.81 0.80 CD17 0.67 0.39 0.82 0.68 MEAN 0.46 0.38 0.78 0.74
SR27.4153

Romo, et al. v. Detzner, et al. Case No. 2012-CA-000412 League of Women Voters, et al. v. Detzner, et al. Case No. 2012-CA-000490
11 MIAMI 1014554
Plaintiffs’ map-drawer testified that the lesser compactness of these districts is a function of
CD13 and CD14, as drawn in the alternative maps (Hawkins Dep. at 272:15-275:22.) In the
same region, Plaintiffs divide Charlotte County, which the Congressional Plan preserves.
Congressional Districts 21 and 22
35. Districts 21 and 22, which have a vertical orientation in the Congressional Plan,
have Reock scores of 0.28 and 0.18 and Convex Hull scores of 0.60 and 0.61, respectively.
Plaintiffs’ alternative maps contain the same vertical pattern. Plaintiffs’ map-drawer testified
that the vertical orientation was acceptable and appropriate (Hawkins Dep. at 271:11-272:14.)
Plaintiffs’ expert, Dr. Ansolabehere, testified that the configuration made sense (May 28 PM Tr.
155:8-19).
Congressional District 25
36. The configuration of CD25 depends in part on the configuration of neighboring
CD20. The predecessor of CD20—Benchmark CD23—was a majority-minority district in
which African-American voters were able to elect their preferred candidates. Benchmark CD23
included part of Hendry County—one of five counties protected by Section 5 of the VRA.
37. If the Legislature had excluded from CD20 the part of Hendry County that was
contained in Benchmark CD23, it would have removed African-Americans in a protected county
from a minority district in which they previously possessed the ability to elect the candidates of
their choice. Plaintiffs’ alternative maps do so, and assign Hendry County in its entirety to
CD25. Dr. Ansolabehere, however, was unable to cite any authority to suggest that the
Department of Justice would have precleared the alternative configuration: “I don’t know how
they would treat this particular issue. I don’t know how the Department would treat this issue”
(May 28 PM Tr. 140:23-25).
SR27.4154
Romo, et al. v. Detzner, et al. Case No. 2012-CA-000412 League of Women Voters, et al. v. Detzner, et al. Case No. 2012-CA-000490
12 MIAMI 1014554
Congressional Districts 26 and 27
38. Hispanic voters are less cohesive politically than African-American voters. In
addition, approximately one half of Florida’s Hispanics are foreign born and, unless naturalized,
are not entitled to vote, while some Hispanic populations in Florida exhibit low rates of turnout.
For these and other, similar reasons, the creation of Hispanic districts generally requires careful
consideration of primary election data, and usually a supermajority Hispanic population.
39. The Legislature drew CD26 and CD27 to preserve the ability of Hispanics to elect
the candidates of their choice (May 23 Tr. 63:23-64:3). The Legislature attempted to keep whole
the City of Homestead, but concluded that the preservation of Homestead would have diminished
the ability of Hispanic voters to elect the candidates of their choice, and made the region less
compact (June 4 Tr. 78:15-79:2). Professor Moreno testified that Plaintiffs’ alternative maps,
which preserve Homestead, diminish the ability of Hispanics to elect their preferred candidates
(May 30 PM Tr. 24:21-25:7).
The Activities of Political Consultants
40. At trial, Plaintiffs attempted to establish the existence of a secret, parallel process
in which Republican political consultants advised legislators and legislative staff with respect to
the drawing of districts with the intent to favor or disfavor a political party or an incumbent.
Two Meetings
41. In December 2010 and January 2011, two meetings occurred between political
consultants and legislative staff and attorneys, and, in the latter meeting, two legislators. The
purpose of the meetings, which were approved in advance by then-Speaker Dean Cannon, was to
evaluate the effect of Amendments 5 and 6, which had then recently been adopted, on the
redistricting process. In Speaker Cannon’s view, it was important to clarify even before the
redistricting process commenced—and before the release of data by the Census Bureau—the
SR27.4155
Romo, et al. v. Detzner, et al. Case No. 2012-CA-000412 League of Women Voters, et al. v. Detzner, et al. Case No. 2012-CA-000490
13 MIAMI 1014554
nature of any participation by the political consultants in the approaching redistricting process
(May 28 AM Tr. 19:6-20).
42. The unrebutted testimony of all witnesses who attended the meetings is that the
consultants were advised and directed at the second meeting not to interfere or attempt to
participate in the drawing of districts (May 19 Tr. 16:6-16; 25:6-19; 42:23-43:10; 44:11-14; May
20 Tr. 155:6-11, 158:16-24; May 21 Tr. 18:10-18; May 28 AM Tr. 75:6-11; May 29 AM Tr.
21:9-12; May 29 PM Tr. 109:11-16). Far from supporting Plaintiffs’ contention that the
Legislature cooperated with political consultants to draw districts with an intent to favor or
disfavor a political party or incumbent, the evidence establishes that at this early stage the
Legislature informed the political consultants, to their great disappointment, that the consultants
would not be permitted to participate in the preparation of the Legislature’s redistricting plans.
This directive was delivered to the political consultants at different times by Senator Don Gaetz,
Representative Will Weatherford, and Speaker Dean Cannon, and supports the Legislature’s
contention that the Congressional Plan was not drawn with impermissible intent (May 21 Tr.
99:15-21; May 20 Tr. 155:15-20; May 28 Tr. 75:6-11; June 4 PM Tr. 68:14-18).
43. The meetings in December 2010 and January 2011 occurred months before the
Census Bureau released the data necessary to draw districts (May 19 Tr. 195:10-22; May 22 Tr.
73:5-8; May 23 Tr. 7:15-19; May 28 AM Tr. 12:15-20). The testimony confirms that no districts
or district configurations were discussed at the meetings, and Plaintiffs offered no evidence of
similar meetings occurring after January 2011, when the consultants were informed that their
participation in the map-drawing process was not welcome and would not be permitted (May 28
Tr. 75:6-11).
SR27.4156

Romo, et al. v. Detzner, et al. Case No. 2012-CA-000412 League of Women Voters, et al. v. Detzner, et al. Case No. 2012-CA-000490
14 MIAMI 1014554
Kirk Pepper and Marc Reichelderfer
44. Beginning in November 2011, Kirk Pepper, the Deputy Chief of Staff for
External Affairs to Speaker Dean Cannon, sent a series of draft maps prepared by professional
staff to Marc Reichelderfer, a political consultant. The transmissions occurred before the maps
were available to the public.
45. Mr. Pepper and Mr. Reichelderfer were personal friends. Mr. Pepper was not a
map-drawer and did not advise the map-drawers with respect to the configuration of districts
(May 20 Tr. 106:16-107:3, 110:24-111:4-10, May 23 Tr. 42:21-43:2, May 28 AM Tr. 69:19-
70:7, June 4 AM Tr. 12:6-14). Mr. Pepper, however, worked in the Speaker’s Office, and
therefore had access to maps prepared by professional staff of the House, and maps received by
professional staff of the House from professional staff of the Senate. Mr. Pepper provided the
maps to Mr. Reichelderfer because Mr. Reichelderfer, as a political consultant, made his
livelihood in campaigns, and advance knowledge of the Legislature’s redistricting plans might
advance Mr. Reichelderfer’s professional standing (May 19 Tr. 54:16-23; 184:16-185:3). Mr.
Reichelderfer testified that he never provided advice to legislators or legislative staff regarding
the drawing of districts (May 20 Tr. 106:16-107:3, 110:24-111:4-10). The testimony was
consistent, moreover, that neither Speaker Cannon nor professional staff were aware that Mr.
Pepper was providing draft redistricting maps to Mr. Reichelderfer (May 23 Tr. 144:13-16; May
28 AM Tr. 31:10-17).
46. Plaintiffs offered no evidence that Mr. Reichelderfer or Mr. Pepper participated in
drawing the Congressional Plan. Plaintiffs offered no evidence that Mr. Reichelderfer provided
legislators or professional staff, or even Mr. Pepper, with advice about district configurations or
political performance.
SR27.4157

Romo, et al. v. Detzner, et al. Case No. 2012-CA-000412 League of Women Voters, et al. v. Detzner, et al. Case No. 2012-CA-000490
15 MIAMI 1014554
47. Plaintiffs note that some of the earliest draft maps prepared by professional staff
of the House (eight files that contain the letters “JAK”) appear on Mr. Reichelderfer’s computer
but are no longer in the possession of the House. Professional staff, however, frequently
modified maps and changed their file names, and Mr. Kelly and Mr. Poreda both recognized
features of those maps, as well as their naming conventions (May 22 Tr. 92:23-25, 93:20-23,
June 4 AM Tr. 48:11-21, 49:16-19). Plaintiffs note that several of these maps contain a District
5 with a Black VAP in excess of 50%, and that Mr. Kelly testified that he did not draw such a
district so early in the map-drawing process. Plaintiffs theorize that Mr. Reichelderfer drew
these districts. The forensic evidence establishes, however, that Mr. Reichelderfer did not
modify these files after they were placed on his computer (Jt. Exh. 2.). Mr. Poreda explained
that these maps were compiled by Jeff Silver, a legislative staff member, from public
submissions, and that the iteration of District 5 in these maps correlates to a district presented by
Nicholas Ortiz, a member of the public who made the first public submission, HPUBC0001
(June 4 Tr. 52:17-53:10, 54:23-55:11).
48. The fact that no draft maps produced by the House in discovery bear a “date
modified” between November 1 and November 18, 2011, is consistent with Mr. Poreda’s
testimony that professional staff was continuously engaged in the preparation of the initial House
proposals during this period (June 4 AM Tr. 33:3-7). The date modified reflects only the last
date on which a file is modified, and of course does not reflect the intermediate changes made by
House staff throughout this period and incorporated into the same electronic file. A file with a
date modified of November 19 might have been modified innumerable times in the preceding
weeks; the “date modified” would not reflect this activity.
SR27.4158
Romo, et al. v. Detzner, et al. Case No. 2012-CA-000412 League of Women Voters, et al. v. Detzner, et al. Case No. 2012-CA-000490
16 MIAMI 1014554
Political Consultants’ Maps
49. Plaintiffs presented evidence that certain political consultants discussed
redistricting and drew their own redistricting maps, and that, in some cases, districts contained in
the political consultants’ maps appeared in maps submitted by members of the public through the
public portal on the House and Senate websites.
50. There is no evidence that legislators or legislative staff were aware of the map-
drawing activities of the political consultants. In fact, the testimony established that legislators
and legislative staff were unaware of the map-drawing efforts of political consultants, and that
these efforts occurred separately from the official preparation of the Congressional Plan (May 23
Tr. 39:7-18; June 2 Tr. 232:25-234:3; June 4 AM Tr. 92:10-14)
51. Mr. Reichelderfer drew some districts on his own. He testified that he never drew
a complete map, but used publicly available maps as a baseline for modifications (46:25-47:3).
Plaintiffs offered no evidence that Mr. Reichelderfer’s drafts were ever transmitted to the
Legislature. Plaintiffs contend that, in some drafts, Mr. Reichelderfer drew District 5 with a
black voting-age population (“VAP”) in excess of 50%, and that the Legislature ultimately did
the same. Mr. Reichelderfer’s maps also reflect iterations of District 5 in which Black VAP was
less than 50%. The Black VAP of the benchmark district—District 3—was 49.9%.
52. Mr. Terraferma also drew redistricting maps, as did Mr. Bainter’s consulting firm,
Data Targeting. Mr. Terraferma, Mr. Heffley, and Mr. Bainter shared these drafts among
themselves and with other political consultants. They encouraged members of the public to
submit maps to the Legislature through the public portal made available by the House and
Senate. Two redistricting maps submitted under the name “Alex Posada” and designated
SR27.4159
Romo, et al. v. Detzner, et al. Case No. 2012-CA-000412 League of Women Voters, et al. v. Detzner, et al. Case No. 2012-CA-000490
17 MIAMI 1014554
HPUBC0132 and HPUBC0133 contain several districts that may match districts in a draft map
drawn by Mr. Terraferma. These districts do not appear in the enacted Congressional Plan.
53. Districts 3, 4, and 13 in the Congressional Plan are similar to districts contained in
HPUBC0132 and HPUBC0133, but none of these districts is found in Mr. Terraferma’s map.
Plaintiffs do not individually challenge Districts 3 and 4. A district similar to District 13
appeared in the Benchmark and many public submissions, including HPUBC0003, HPUBC0006,
HPUBC0031, HPUBC0065, HPUBC0069, HPUBC0130, HPUBC0131, HPUBC0165,
HPUBC0166, HPUBC0167, HPUBC0168, HPUBC0172, HPUBC0173, and HPUBC0174.
54. Plaintiffs offered no evidence to show that any legislator or legislative staff
member was aware that HPUBC0132 and HPUBC0133 were influenced by political consultants,
that there was some inherent constitutional infirmity involving those submissions, or that any
district was incorporated into the Congressional Plan for the purpose of influencing Republican
interests (May 23 Tr. 39:7-18; June 2 Tr. 232:25-234:3; June 4 AM Tr. 12:6-24, 16:3-7).
Email Correspondence
55. Plaintiffs introduced email correspondence between Speaker Cannon, Mr. Pepper,
and Mr. Reichelderfer in November 2011. In one email, sent one day before the Senate publicly
disclosed its first congressional plan proposal, Speaker Cannon wrote to Mr. Reichelderfer: “As
long as the Senate accommodates the concerns that you and Rich [Heffley] identified in the map
that they put out tomorrow, then we are in fine shape.” Plaintiffs suggest that this email
indicates coordination between consultants and the Legislature regarding the drawing of districts.
56. The testimony contradicts this suggestion. Speaker Cannon, Mr. Pepper, and Mr.
Reichelderfer each testified that, during the period in question, relations between the House and
Senate were strained and characterized by mistrust (May 19 Tr. 130:3-4; May 20 Tr. 22:20-23:3;
SR27.4160

Romo, et al. v. Detzner, et al. Case No. 2012-CA-000412 League of Women Voters, et al. v. Detzner, et al. Case No. 2012-CA-000490
18 MIAMI 1014554
May 28 AM Tr. 38:7-10). The parties were concerned that the Senate’s proposal, which the
Senate had not shared with the House, would reflect a line-drawing approach so different from
the approach adopted by the House that ultimate reconciliation of the House and Senate
proposals would be difficult or impossible (May 28 AM Tr. 38:1-10). And the testimony is
undisputed that the “concerns” addressed in the email are not about the draft map, but rather
whether the Senate and House would be able to cooperate during a time of distrust between the
chambers to achieve a mutually agreeable plan (May 28 AM 40:10-41:3, 41:16-25, 42:22-43:10).
As Speaker Cannon testified, “the concerns were that the House and Senate not approach the
initial rollout of the congressional maps with completely different approaches or that were
designed to show defects in the other side’s map” (May 28 Tr. 43:1-5). No substantive
comments about draft maps were offered (May 28 AM 88:4-8). The testimony is confirmed by
the fact that only later did Mr. Pepper provide Mr. Reichelderfer the Senate’s draft proposal,
suggesting that Mr. Reichelderfer had not seen the Senate’s proposal and was therefore unable to
express “concerns” regarding particular features of that map. Speaker Cannon had not seen the
Senate’s draft congressional map before the email correspondence in question took place.
Alleged Spoliation
57. Plaintiffs also ask the Court to assume that documents discarded in the regular
course of legislative business contained incriminating information.
58. The Constitution empowers each house of the Legislature to adopt rules
regulating legislative records, Art. I, § 24(c), Fla. Const., and to “determine its own rules of
procedure,” id. Art. III, § 4(a). Furthermore, each house is constitutionally obligated to keep and
publish a journal of its proceeding. Art. III, § 4(c). Consistent with the long-standing practice of
adopting legislative rules at the biennial organization session, on November 16, 2010, the House
SR27.4161

Romo, et al. v. Detzner, et al. Case No. 2012-CA-000412 League of Women Voters, et al. v. Detzner, et al. Case No. 2012-CA-000490
19 MIAMI 1014554
and Senate adopted the rules that would govern their proceedings until the next general election.
See Fla. H.R. Jour. 6-23 (Org. Sess. Nov. 16, 2010); Fla. S. Jour. 6-38 (Org. Sess. Nov. 16,
2010). As is customary, these rules included provisions that regulated the retention and disposal
of legislative records. See Fla. H.R. Rule 14.2 (2010-2012); Fla. S. Rule 1.444 (2010-2012). By
their terms, these record-retention policies applied evenhandedly to all legislative business and
all areas of legislative concern, including congressional redistricting. The record-retention
policies in the biennially adopted legislative rules have remained substantially unchanged for
nearly two decades.
59. At trial, every legislator or legislative staff member who testified about their
retention practices indicated that they did so in accordance with House or Senate rules (May 21
Tr. 93:15-16; May 22 Tr. 22:8-11; May 23 Tr. 140:2-4; May 28 AM 63:12-18, 217:17-23, 218:7-
11; Holder Dep. 52:11-16, Precourt Dep. 159:18-160:13). Plaintiffs offered no evidence that
documents related to redistricting were selectively discarded, or that documents were discarded
because of their contents. Plaintiffs offered no evidence that any material documents are
unavailable due to any spoliation of evidence by the Legislative Parties. Indeed, the
completeness and veracity of the official legislative record has never been challenged. Nor do
Plaintiffs allege any violation of the Sunshine Law.
Plaintiffs’ Experts
60. Plaintiffs called three experts in an attempt to show that the enacted map is biased
in favor of Republicans, and asked the Court to infer improper intent from that bias.
61. Jonathan Katz, a professor of social sciences and statistics at the California
Institute of Technology, testified that the enacted map contained significant levels of Republican
bias.
SR27.4162

Romo, et al. v. Detzner, et al. Case No. 2012-CA-000412 League of Women Voters, et al. v. Detzner, et al. Case No. 2012-CA-000490
20 MIAMI 1014554
62. Dr. Katz admitted, however, that he was not offering any opinion on the issue of
intent (May 27 AM Tr. 136:10-14; May 27 PM Tr. 2:15-17).
63. Dr. Katz also admitted that his analysis did not take into account the constraints of
geography, and that he did not study how the compactness requirement or the natural packing of
Democrats could affect the presence of Republican bias (May 27 PM 4:14-16, 4:17-20, 7:20-23,
9:17-20).
64. Moreover, the predictive value of Dr. Katz’s analysis was dubious. Dr. Katz
predicted low Democratic performance in areas won by Democrats. Dr. Katz’s analysis also
varied greatly depending on which election data he selected to use as a basis of his model.
65. Jonathan Rodden, a professor of political science at Stanford University, testified
that according to computer simulations he developed with Jowei Chen, the enacted map was a
statistical outlier because it contained 17 districts that voted for John McCain in 2008.
66. At trial, however, Dr. Rodden admitted that his analysis could not discern the
Legislature’s intent (May 27 PM 169:22-170:3).
67. Dr. Rodden agreed that to serve as a fair comparison, a simulation must observe
the same constraints as the enacted map. (May 27 PM 136:16-137:6).
68. Dr. Rodden admitted, however, that his simulations did not satisfy the
constitutional standards, including the equal population requirements (May 27 PM 137:7-14,
152:8-19, 155:4-13). Dr. Rodden also acknowledged that his simulations created districts that
are not visually compact (May 27 PM Tr. 176:2-14, 177:24-178:1, 185:10-13, 185:23-186:6).
69. The testimony of Stephen Hodge, meanwhile, demonstrated that Dr. Rodden’s
algorithms are not truly random, fail to create Hispanic-performing districts, and fail to match the
enacted plan on objective metrics, such as compactness and split cities.
SR27.4163

Romo, et al. v. Detzner, et al. Case No. 2012-CA-000412 League of Women Voters, et al. v. Detzner, et al. Case No. 2012-CA-000490
21 MIAMI 1014554
70. Dr. Rodden also admitted that the natural packing of Democrats, as well as the
creation of minority protection districts, could create a Republican bias (May 27 PM Tr. 134:1-
16).
71. Dr. Nolan McCarty testified that Dr. Rodden’s conclusions were inconsistent with
his earlier research. Among other things, Dr. McCarty noted that Dr. Rodden’s work relies on
the results of the 2008 presidential election, but Dr. Rodden failed to apply a uniform swing that
he employed in his earlier work. When a uniform swing is applied, the enacted plan is not
statistically anomalous.
72. Dr. McCarty also found that if other statewide election results were used, there
was “dramatic variation” in the results obtained (June 3 PM Tr. 76:14-16).
73. Moreover, under Dr. Rodden’s own analysis, the Romo maps are also statistical
outliers that create a disproportionate number (15) of McCain districts. Indeed, using 2012 data,
the enacted map and the Romo plans all produced 16 districts that voted in favor of the
Republican presidential candidate, Mitt Romney.
74. Finally, Dr. Stephen Ansolabehere, a professor of government at Harvard
University, testified about the Romo Plaintiffs’ alternative plans, which he helped design.
75. Dr. Ansolabehere admitted, however, that the alternative plans have similar
performance data using the 2012 election results, even though Dr. Ansolabehere did not intend to
favor any political party or incumbent (May 28 PM Tr. 56:8-23).
76. The political performance of the alternative plans presented by Plaintiffs is similar
to the political performance of the Congressional Plan. In all three plans, Governor Romney
received more votes than President Obama in sixteen congressional districts. In the seven
statewide races held in 2010 and 2012, Republican statewide candidates received more votes
SR27.4164
Romo, et al. v. Detzner, et al. Case No. 2012-CA-000412 League of Women Voters, et al. v. Detzner, et al. Case No. 2012-CA-000490
22 MIAMI 1014554
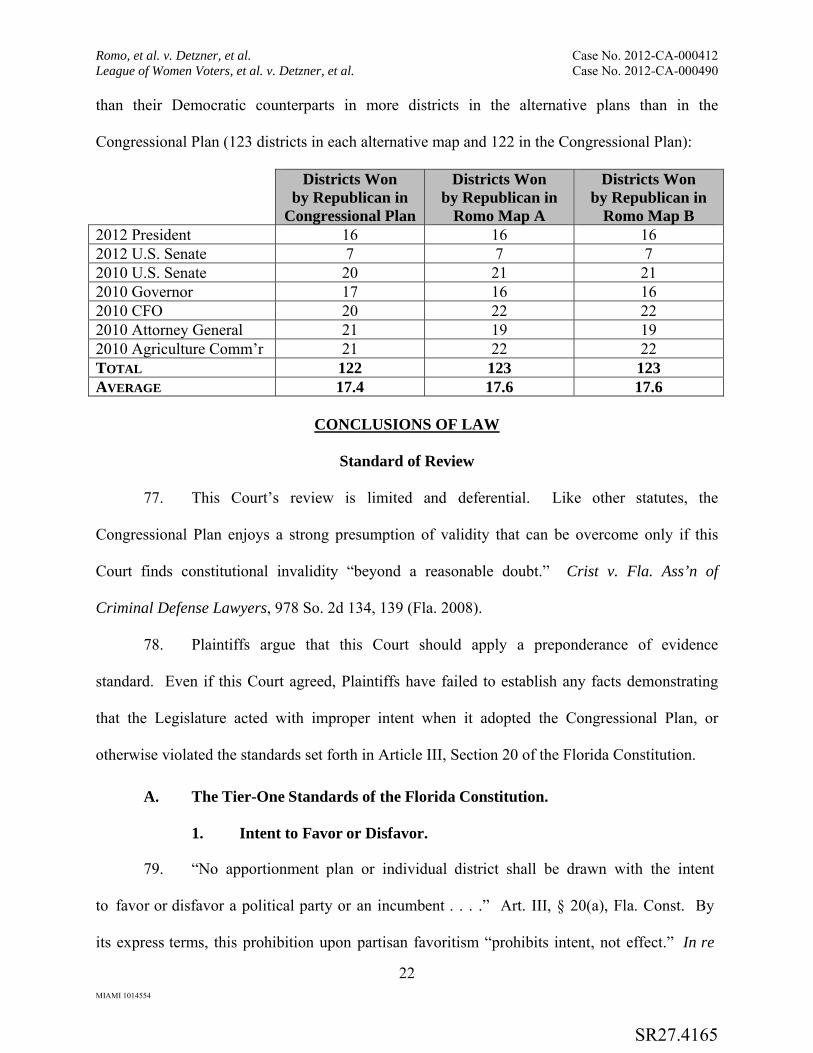
than their Democratic counterparts in more districts in the alternative plans than in the
Congressional Plan (123 districts in each alternative map and 122 in the Congressional Plan):
Districts Won by Republican in
Congressional Plan
Districts Won by Republican in
Romo Map A
Districts Won by Republican in
Romo Map B 2012 President 16 16 16 2012 U.S. Senate 7 7 7 2010 U.S. Senate 20 21 21 2010 Governor 17 16 16 2010 CFO 20 22 22 2010 Attorney General 21 19 19 2010 Agriculture Comm’r 21 22 22 TOTAL 122 123 123 AVERAGE 17.4 17.6 17.6
CONCLUSIONS OF LAW
Standard of Review
77. This Court’s review is limited and deferential. Like other statutes, the
Congressional Plan enjoys a strong presumption of validity that can be overcome only if this
Court finds constitutional invalidity “beyond a reasonable doubt.” Crist v. Fla. Ass’n of
Criminal Defense Lawyers, 978 So. 2d 134, 139 (Fla. 2008).
78. Plaintiffs argue that this Court should apply a preponderance of evidence
standard. Even if this Court agreed, Plaintiffs have failed to establish any facts demonstrating
that the Legislature acted with improper intent when it adopted the Congressional Plan, or
otherwise violated the standards set forth in Article III, Section 20 of the Florida Constitution.
A. The Tier-One Standards of the Florida Constitution. 1. Intent to Favor or Disfavor. 79. “No apportionment plan or individual district shall be drawn with the intent
to favor or disfavor a political party or an incumbent . . . .” Art. III, § 20(a), Fla. Const. By
its express terms, this prohibition upon partisan favoritism “prohibits intent, not effect.” In re
SR27.4165

Romo, et al. v. Detzner, et al. Case No. 2012-CA-000412 League of Women Voters, et al. v. Detzner, et al. Case No. 2012-CA-000490
23 MIAMI 1014554
Senate Joint Resolution of Legislative Apportionment 1176, 83 So. 3d 597, 617 (Fla. 2012). The
political consequences of a redistricting plan do not, therefore, establish a violation. Id. at 642
(explaining that “mere effect will not necessarily invalidate a plan”). The Florida Supreme
Court appropriately recognized that “any redrawing of lines, regardless of intent, will
inevitably have an effect on the political composition of a district and likely whether a political
party or an incumbent is advantaged or disadvantaged.” Id. Thus, redistricting will
“inherently have political consequences, regardless of the intent used in drawing the lines.” Id.
80. Similarly, partisan imbalance might result from “a legitimate effort to comply
with VRA principles or other constitutional requirements.” Id. Where minority voters
disproportionately affiliate with one political party, the creation of minority districts tends to
concentrate the voters of that party into a small number of districts. Thus, demography,
residential patterns, and legal compliance can introduce an unintended partisan bias into a
redistricting plan.
81. The Constitution recognizes “no acceptable level of improper intent.” Id. at
617. The relevant intent, though, is the intent of the Legislature as a collective body—not
the isolated intent of an individual legislator or staff member. See, e.g., Apportionment IV, 132
So. 3d at 139 (“[T]he Florida Constitution prohibits the Legislature from drawing an
apportionment plan or individual district ‘with the intent to favor or disfavor a political party
or an incumbent’ . . . .” (emphasis added)). 3
3 In this Order, the Court refers to the Florida Supreme Court’s first decision interpreting the new standards—In re Senate Joint Resolution of Legislative Apportionment 1176, 83 So. 3d 597 (Fla. 2012)—as “Apportionment I.” It refers to the subsequent decision upholding the State Senate plan—In re Senate Joint Resolution of Legislative Apportionment 2- B, 89 So. 3d 872 (Fla. 2012)—as “Apportionment II,” and to the decision allowing limited discovery of legislators and legislative staff members—League of Women Voters of Florida v. Florida House of Representatives, 132 So. 3d 135 (Fla. 2013)—as “Apportionment IV.”
SR27.4166
Romo, et al. v. Detzner, et al. Case No. 2012-CA-000412 League of Women Voters, et al. v. Detzner, et al. Case No. 2012-CA-000490
24 MIAMI 1014554
82. To assess the Legislature’s collective intent, the Court must consider both direct
and circumstantial evidence of intent. Apportionment I, 83 So. 3d at 617. In Apportionment I,
with respect to political parties, the Supreme Court considered “the effects of the plan, the
shape of district lines, and the demographics of an area,” while noting that the Constitution
“does not prohibit political effect.” Id. With respect to incumbents, the Court weighed “the
shape of the district in relation to the incumbent’s legal residence,” the “maneuvering of district
lines in order to avoid pitting incumbents against one another in new districts,” as well as
“the drawing of a new district so as to retain a large percentage of the incumbent’s former
district.” Id. at 618-19.
83. A redistricting plan’s degree of compliance with the traditional redistricting
principles in Tier Two—equality of population, compactness, and adherence to political and
geographical boundaries—can illuminate legislative intent. Id. at 618. At the same time, a
lesser degree of compliance with the Tier-Two standards does not necessarily indicate improper
intent. Id. at 640. For example, state and federal protections for minorities “may require the
preservation or creation of non-compact districts or may help to explain the shape of a
challenged district.” Id. Because unusually shaped districts “may be the result of legitimate
efforts by the Legislature to comply” with the VRA or with the Tier-One protections in the
Florida Constitution, the creation of minority districts “could be misinterpreted as an action
intended to favor (or disfavor) a political party or an incumbent.” Id. But if “adherence to a
tier-one requirement explains the irregular shape of a given district, a claim that the district has
been drawn to favor or disfavor a political party can be defeated.” Id. at 641. The evidence of
intent must be viewed together. See id. at 618 (“One single piece of evidence in isolation
may not indicate intent . . . .”)
SR27.4167

Romo, et al. v. Detzner, et al. Case No. 2012-CA-000412 League of Women Voters, et al. v. Detzner, et al. Case No. 2012-CA-000490
25 MIAMI 1014554
84. The isolated communications of legislators and legislative staff members
are not probative of legislative intent unless those communications are “part of a broader
process to develop portions of the map.” Apportionment IV, 132 So. 3d at 150 (“[T]he
communications of individual legislators or legislative staff members, if part of a broader
process to develop portions of the map, could directly relate to whether the plan as a whole or
any specific districts were drawn with unconstitutional intent.” (emphasis added)). Any
challenger who relies on such communications must, therefore, show that the communications
were part of a broader process to develop portions of the map and, with improper intent, actually
affected the enacted districts.
2. Protection of Racial and Language Minorities.
85. Consistent with Florida’s commitment to the protection of minorities in the
redistricting process, the Constitution places minority protection in Tier One. Specifically,
districts shall not be drawn either (i) with the intent or result of denying or abridging the
equal opportunity of racial or language minorities to participate in the political process, or (ii)
to diminish their ability to elect representatives of their choice. Art. III, § 20(a), Fla. Const.
86. Notably, these protections are contained in Tier One and therefore take
precedence, to the extent of any conflict, over the standards in Tier Two.
87. Tier One contains two distinct protections for minorities: prevention of “vote
dilution” and prevention of “diminishment” in a minority group’s ability to elect candidates of
its choice. Id. at 685. The two standards, both modeled upon provisions of the Voting Rights
Act, are discussed below.
SR27.4168
Romo, et al. v. Detzner, et al. Case No. 2012-CA-000412 League of Women Voters, et al. v. Detzner, et al. Case No. 2012-CA-000490
26 MIAMI 1014554
a. Vote Dilution.
88. The constitutional mandate that districts not deny or abridge the equal
opportunity of minorities to participate in the political process “is essentially a restatement of
Section 2 of the Voting Rights Act,” which prohibits vote dilution. Id. at 619 (citing 42 U.S.C.
§ 1973(b)). The vote-dilution standard in Tier One thus embraces the principles of Section 2 of
the VRA, and its interpretation is “guided by prevailing United States Supreme Court
precedent.” Id. at 620.
89. The essential feature of the vote-dilution standard is that, in some cases, it
requires the creation of a majority-minority district. Id. at 623 (“A successful vote dilution
claim under Section 2 requires a showing that a minority group was denied a majority-
minority district that, but for the purported dilution, could have potentially existed.”). A
majority-minority district is a district in which minorities are a “numerical, working majority
of the voting-age population.” Bartlett v. Strickland, 556 U.S. 1, 13 (2009) (plurality opinion),
quoted in Apportionment I, 83 So. 3d at 623. It is insufficient to show that the Legislature
might have created an additional influence district—i.e., a district in which minorities are a
minority and, though perhaps able to influence elections, are unable to elect their preferred
candidates. Apportionment I, 83 So. 3d at 623. It is also insufficient to show that the
Legislature might have drawn a crossover district—i.e., a district in which minorities, though
not a majority of the voting-age population, might be large enough, with the aid of white
voters who “cross over,” to elect their preferred candidates. Id. Under the vote-dilution
standard, “what is required is that ‘the minority population in the potential election district be
greater than 50 percent.’” Id. (quoting Bartlett, 556 U.S. at 19-20).
SR27.4169
Romo, et al. v. Detzner, et al. Case No. 2012-CA-000412 League of Women Voters, et al. v. Detzner, et al. Case No. 2012-CA-000490
27 MIAMI 1014554
90. Generally speaking, the vote-dilution standard is aimed at the practices of
“cracking” and “packing.” For example, “packing” is cognizable when a minority group that
could have comprised a majority in multiple districts instead is a supermajority in fewer
districts. Apportionment I, 83 So. 3d at 622 (noting that packing “might occur when a minority
group has ‘sufficient numbers to constitute a majority in three districts’ but is ‘packed into two
districts in which it constitutes a super-majority’” (quoting Voinovich v. Quilter, 507 U.S. 146,
153 (1993))). One court found vote dilution where minorities comprised 86% of one district and
23% of another, but might have formed majorities in two districts—not one. Bone Shirt v.
Hazeltine, 336 F. Supp. 2d 976, 984-85 (D.S.D. 2004), aff’d, 461 F.3d 1011 (8th Cir. 2006). In
either case, the central question is whether an additional majority-minority district might be
created. See Apportionment I, 83 So. 3d at 655 (finding no vote dilution in Senate plan
because challengers did not show “that an additional majority-minority district can be created”).
91. The vote-dilution standard does not require the creation of a majority-minority
district wherever possible, but only where certain conditions—conditions first announced in
Thornburg v. Gingles, 478 U.S. 30, 50-51 (1986)—are satisfied. First, three preconditions must
be present: (i) the minority population is sufficiently large and geographically compact to be a
majority of the voting-age population; (ii) the minority population is politically cohesive; and
(iii) the majority population votes sufficiently as a bloc to enable it usually to defeat the
candidates preferred by minorities. Apportionment I, 83 So. 3d at 622 (citing Gingles, 478 U.S.
at 50-51). If all three preconditions exist, and if, in the “totality of circumstances,” the
minority group has less electoral opportunity than other members of the electorate, then a
majority-minority district must be created. Id.; accord LULAC v. Perry, 548 U.S. 399, 425-26
(2006).
SR27.4170

Romo, et al. v. Detzner, et al. Case No. 2012-CA-000412 League of Women Voters, et al. v. Detzner, et al. Case No. 2012-CA-000490
28 MIAMI 1014554
92. As noted above, under the first Gingles precondition, the minority population
must be “sufficiently large . . . to be a majority.” In 2009, the United States Supreme Court
rejected a contention that the VRA’s vote-dilution standard requires the creation of districts in
which minorities are less than a majority. See Bartlett, 556 U.S. 1. Bartlett clarified that the
relevant measure is whether minorities can constitute a majority of a district’s voting-age
population. See id. at 18 (“[T]he majority-minority rule relies on an objective, numerical test:
Do minorities make up more than 50 percent of the voting-age population in the relevant
geographic area?”).
93. Moreover, to satisfy the majority-minority requirement of Section 2, the
minority population must consist of a single minority group. Perry v. Perez, 132 S. Ct. 934,
944 (2012) (per curiam). A coalition of minority voters who together, but not separately, are
sufficiently large to constitute a numerical majority in a district cannot prevail on a vote-dilution
claim. Id.
94. As noted above, the Gingles preconditions also require that the minority
population be “geographically compact.” Id. at 622. In the context of vote dilution,
“compactness” does not refer to the geographical shape of the district. “The first Gingles
condition refers to the compactness of the minority population, not to the compactness of the
contested district,” LULAC, 548 U.S. at 433, and a minority population is compact if it is either
geographically concentrated or united by common characteristics, needs, and interests, id. at
435 (“[I]t is the enormous geographical distance separating the Austin and Mexican border
communities, coupled with the disparate needs and interests of these populations—not either
factor alone—that renders District 25 noncompact . . . .”). The compactness requirement serves
to deny protection to districts in which “the only common index is race.” Id. If the minority
SR27.4171
Romo, et al. v. Detzner, et al. Case No. 2012-CA-000412 League of Women Voters, et al. v. Detzner, et al. Case No. 2012-CA-000490
29 MIAMI 1014554
population is geographically concentrated or united through common characteristics, needs,
and interests, then it is compact for purposes of vote dilution.
95. For example, in Martinez v. Bush, 234 F. Supp. 2d 1275, 1301 (S.D. Fla. 2002),
the United States District Court for the Southern District of Florida held that the black
population of Northeast Florida that comprised Benchmark District 3—the predecessor to
current District 5— was “reasonably compact” under the vote-dilution standard.
96. Thus, “members of a minority group who live in separate enclaves may still be
included in a single district where it can be shown that they constitute a single community
having similar interests.” De Grandy v. Wetherell, 794 F. Supp. 1076, 1085 (N.D. Fla. 1992).
The requirement of compactness is a “‘practical’ or ‘functional’ concept, which must be
considered in relation to § 2’s laudatory national mission of opening up the political process to
those minorities that have been historically denied such.” Dillard, 686 F. Supp. at 1466.
97. The second and third Gingles preconditions—that the minority population be
politically cohesive and that the majority population vote sufficiently as a bloc to enable it
usually to defeat the candidates preferred by minorities—describe racial polarization. Whether
voting is racially polarized—in other words, whether voters of different races exhibit a
consistent preference for different candidates, see Gingles, 478 U.S. at 54 n.21—is usually the
subject of expert analysis.
b. Diminishment. 98. The constitutional mandate that districts not diminish the ability of minorities
to elect the representatives of their choice reflects the standard codified in Section 5 of the
Voting Rights Act. Apportionment I, 83 So. 3d at 619-20. Like the vote-dilution standard,
SR27.4172
Romo, et al. v. Detzner, et al. Case No. 2012-CA-000412 League of Women Voters, et al. v. Detzner, et al. Case No. 2012-CA-000490
30 MIAMI 1014554
interpretation of the diminishment standard relies on “prevailing United States Supreme Court
precedent.” Id. at 620.
99. As the word “diminish” implies, the diminishment standard entails a comparison
between the prior redistricting plan, known as the “benchmark” plan, and the enacted plan. Id.
at 624. The diminishment standard prohibits a diminishment—or an erosion or weakening—
in the voting strength of minorities in the so-called “ability-to-elect districts”—districts in which
minorities were previously able, under the benchmark plan, to elect their preferred candidates.
100. Florida’s diminishment standard was patterned after language that Congress
added to Section 5 of the VRA in 2006. See Apportionment I, 83 So. 3d at 625 (“This amended
language mirrors the language of Florida’s provision.”). Congress amended Section 5 to
overrule Georgia v. Ashcroft, 539 U.S. 461 (2003), in which the Court had construed Section 5
to permit States to “trade off ‘safe’ districts with ‘influence or coalition districts,’”
Apportionment I, 83 So. 3d at 624 (quoting Ashcroft, 539 U.S. at 482), and thus “risk having
fewer minority representatives,” Ashcroft, 539 U.S. at 484. Congress concluded that “trade-
offs” in which safe districts are weakened to create neighboring influence or coalition districts
“would allow the minority community’s own choice of preferred candidates to be trumped by
political deals struck by State legislators purporting to give ‘influence’ to the minority
community while removing that community’s ability to elect candidates.” Id. (quoting H.R.
Rep. No. 109-478, at 44 (2006)); see also S. Rep. No. 109-295, at 20 (2006) (concluding that if
States are permitted to “break up” majority-minority districts “and replace them with vague
concepts such as influence, coalition, or opportunity[,] . . . this may actually facilitate racial
discrimination against minority voters”).
SR27.4173

Romo, et al. v. Detzner, et al. Case No. 2012-CA-000412 League of Women Voters, et al. v. Detzner, et al. Case No. 2012-CA-000490
31 MIAMI 1014554
101. The new language enacted by Congress imposed a “more stringent” mandate—
one that “prohibit[s] more conduct than before.” Shelby Cnty. v. Holder, 133 S. Ct. 2612, 2617,
2621 (2013). Under the new language, the controlling question is “whether the electoral power
of the minority community was more, less, or just as able to elect a preferred candidate of
choice after a voting change as before.” Apportionment I, 83 So. 3d at 624-25 (quoting H.R.
Rep. No. 109-478, at 44 (2006)) (emphasis added). As Congress explained, a redistricting plan
that leaves minorities “less able to elect a preferred candidate of choice” violates the amended
Section 5. Id. at 625 (quoting H.R. Rep. No. 109-478, at 44 (2006)). In other words, a change
that decreases the likelihood that the candidate preferred by minorities will be elected is a
diminishment.
102. The Florida Constitution reflects the same diminishment standard. “Florida has
now adopted the retrogression principle as intended by Congress in the 2006 amendment.” Id.
(emphasis added). As a result, “the Legislature cannot eliminate majority-minority districts or
weaken other historically performing districts where doing so would actually diminish a
minority group’s ability to elect its preferred candidates.” Id.; accord id. at 655 (noting that
the State Senate plan contained “as many” ability-to-elect districts as the benchmark, and that
the voting ability of minorities in the new districts was “commensurate” with their former voting
ability).
103. The diminishment standard protects any district in which minorities were able
to elect their preferred candidates in the Benchmark—i.e., any “historically performing”
district. Id. at 625. In addition to majority-minority districts, the diminishment standard
protects “coalition or crossover districts that previously provided minority groups with the
ability to elect a preferred candidate under the benchmark plan.” Id. Coalition and
SR27.4174

Romo, et al. v. Detzner, et al. Case No. 2012-CA-000412 League of Women Voters, et al. v. Detzner, et al. Case No. 2012-CA-000490
32 MIAMI 1014554
crossover districts are districts in which a minority group, though not a majority, is able to
elect its preferred candidates with the support of other minorities (coalition) or white voters
(crossover). Id. at 623. The diminishment standard does not protect influence districts. In
influence districts, minorities are unable to elect their preferred candidates and thus have no
“ability to elect” that can be protected from diminishment.
104. To determine whether a district diminishes the voting strength of minorities,
courts do not consider voting-age population in isolation. Rather, a court must examine
political data as well as population data to gauge the voting ability of minorities. Id. at 625.
This broader analysis of data to assess the voting strength of minorities—and to predict how the
district will “function”—is referred to as a “functional analysis.” Id. The diminishment
standard requires a functional analysis “because a minority group’s ability to elect a
candidate of choice depends upon more than just population figures.” Id.; accord id. at 626-27
(same). In addition to voting- age population, a court must consider voter registration, voter
turnout, and election results. Id. at 627. A district with a lower minority voting-age population
might nevertheless afford minorities a superior ability to elect the candidates of their choice if,
for example, the minority population is more cohesive politically or is more galvanized and
exhibits higher turnout. A “slight change” in minority VAP is permissible if the district,
according to all data viewed collectively, does not in fact diminish the likelihood that minority-
preferred candidates will prevail. Id. at 625. The Constitution does not, however, permit even
slight changes that diminish the ability to elect. It would defeat the purpose of Tier One to
permit successive, incremental erosions of minority voting strength.
105. In Apportionment I, the objectors argued that the diminishment standard does not
(as its plain words imply) prohibit a diminishment in the ability of minorities to elect the
SR27.4175
Romo, et al. v. Detzner, et al. Case No. 2012-CA-000412 League of Women Voters, et al. v. Detzner, et al. Case No. 2012-CA-000490
33 MIAMI 1014554
candidates of their choice, but only a total destruction of the ability of minorities to elect. In
other words, the objectors asserted that the Legislature may erode or weaken the voting power of
minorities, as long as minorities maintain an ability to elect of some kind—though a much
lessened or impaired ability. Under this view, a diminishment is permissible unless it crosses an
arbitrary line and wholly deprives minorities of the ability to elect. The Supreme Court rejected
this position and recognized that diminishment in the ability to elect is a question of degree.
See id. at 624-25 (noting that the question is whether minorities are “more, less, or just as able
to elect” their candidates); id. at 625 (noting that a redistricting plan is invalid if minorities
are “less able to elect a preferred candidate of choice”); id. (noting that the redistricting plan
may not “weaken” historically performing minority districts); id. at 655 (requiring
“commensurate voting ability”).
106. The Court’s interpretation is supported by the language and history of the
diminishment provision. In the interpretation of constitutional amendments, the Supreme Court
looks to dictionary definitions because “in general, a dictionary may provide the popular and
common-sense meaning of the terms presented to the voters.” In re Adv. Op. to Att’y Gen. re
Use of Marijuana for Certain Med. Conditions, 132 So. 3d 786 (2014) (quoting Adv. Op. to
Governor–1996 Amendment 5 (Everglades), 706 So. 2d 278, 282 (Fla. 1997)). For example, in
Apportionment I, the Court turned to dictionary definitions of the word “compact.” See 83 So.
3d at 632; see also id. at 631 (“[A] fundamental tenet of constitutional construction . . . is that the
Court will construe a constitutional provision in a manner consistent with the intent of the
framers and the voters and will interpret its terms in their most usual and obvious meaning.”).
107. “Diminish” means “to make smaller or less.” See THE AMERICAN HERITAGE
DICTIONARY OF THE ENGLISH LANGUAGE (1979). The Constitution thus prohibits districts that
SR27.4176
Romo, et al. v. Detzner, et al. Case No. 2012-CA-000412 League of Women Voters, et al. v. Detzner, et al. Case No. 2012-CA-000490
34 MIAMI 1014554
make smaller or make less the ability of minorities to elect their preferred candidates—precisely
as Congress and the Supreme Court intended. Plaintiffs rewrite the Constitution to provide that
the Legislature may diminish, as long as it does not completely abolish, the ability of minorities
to elect their preferred candidates. The Constitution, however, does not permit a diminishment
(as Plaintiffs wish) from existing levels down to the absolute minimum predicted to be necessary
to enable minorities to elect their candidates. The Constitution prohibits diminishment, period.
It therefore ensures that minorities will be as likely as before to elect their preferred candidates.
108. The Supreme Court’s interpretation also comports with the history of the
diminishment language and its genesis in the amendments by Congress to the VRA in 2006. In
2006, Congress created a stronger standard than existed before, as the word “diminish” became a
part of Section 5 for the first time. Congress intended the new diminishment standard to prohibit
trade-offs in which minority districts are weakened in order to create influence districts.
Apportionment I, 83 So. 3d at 624. In interpreting citizen initiatives, courts consider the
materials that were available to the voters “as a predicate for their collective decision.” Williams
v. Smith, 360 So. 2d 417, 420 n.5 (Fla. 1978); accord Dep’t of Envtl. Prot. v. Millender, 666 So.
2d 882, 886 (Fla. 1996). This history, filled with content, was available as a guide when the
voters adopted Amendment 6.
109. The Supreme Court’s interpretation is also consistent with the commonsense
realities of elections. One recognized expert in redistricting explained the diminishment concept
as follows:
In reality, the ability to elect preferred candidates, like the ability to play the violin, is a matter of degree, not a difference in kind. Some districts have a near-100% ability to elect (so-called performing or safe districts); in others, minorities’ ability to elect their preferred candidates might be closer to 50% or next to nothing. Districts can be arrayed along a continuum according to their ability to perform. Diminishing a district’s ability to elect does not necessarily mean
SR27.4177

Romo, et al. v. Detzner, et al. Case No. 2012-CA-000412 League of Women Voters, et al. v. Detzner, et al. Case No. 2012-CA-000490
35 MIAMI 1014554
reducing it from a safe district to a hopeless district (i.e., a move from a guaranteed district to one where minorities have no chance of electing their preferred candidates). It could mean reducing a safe district to a competitive district, or a competitive district to a hopeless district or any downward shifts along that very wide spectrum.
Nathaniel Persily, The Promise and Pitfalls of the New Voting Rights Act, 117 YALE L.J. 174,
243-44 (2007). In reality, there is not a single, minimum point of voting strength that enables
minorities to elect their candidates of choice. The results of elections fluctuate with countless
circumstances, including the attributes and qualifications of candidates and the financing of
campaigns. A degree of voting strength that is sufficient in one election might be woefully
insufficient in another. The Constitution does not indulge the fiction that there is one minimum,
ascertainable threshold of voting strength that is “necessary” to enable minorities to elect.
Rather, it directs that minority voting strength—whatever it may have been—not be diminished.
110. A federal court has confirmed this interpretation. In Alabama Legislative
Black Caucus v. Alabama, __ F. Supp. 2d )), 2013 WL 6925681 (M.D. Ala. Dec. 20, 2013),
prob. juris. noted, 82 U.S.L.W. 3456 (U.S. June 2, 2014) (Nos. 13-895, 13-1138), the Court
concluded that the “relevant question now is whether the candidate minorities voted for in the
general election under the benchmark plan is equally likely to win under the new plan.” Id. at
*73 (emphasis added). The Court rejected the contention that, as long as the legislature
maintained the same number of minority districts, it might weaken minority voting strength
within those districts. Id. at *74. The diminishment standard requires the legislature both to
maintain the existing number of ability-to-elect districts and the “same relative percentages of
black voters in those districts.” Id. The legislature may not “spread black voters out to other
districts and substantially reduce the percentages of black voters within the majority-black
districts because that change, by definition, would diminish black voters’ ability to elect their
preferred candidates.” Id. at *73.
SR27.4178

Romo, et al. v. Detzner, et al. Case No. 2012-CA-000412 League of Women Voters, et al. v. Detzner, et al. Case No. 2012-CA-000490
36 MIAMI 1014554
111. Another misconstruction is that the diminishment provision prohibits an increase
in a district’s minority voting strength. Plaintiffs invert the prohibition upon diminishing into a
prohibition upon increasing minority voting strength. The Supreme Court has rejected this
backward reading.
112. In Apportionment I, the Court stated that districts that “increase minority
voting strength” are consistent with Section 5 of the VRA, and it applied the “same principle”
under the Tier One. 83 So. 3d at 645; accord id. at 655 (“Districts that increase minority voting
strength when compared to the benchmark are entitled to preclearance under Section 5, and we
conclude that the same principle applies under Florida law.”). Thus, the Court found no defect in
the State House plan, which contained 28 majority-minority districts—an increase of four from
the Benchmark. Id. at 645-46. And it found no violation of the minority protections in the State
Senate plan, which increased by two the number of majority-Hispanic districts. Id. at 655.
113. The Florida Constitution’s diminishment provision differs from Section 5 of the
VRA in at least two respects. First, Section 5 required States to submit redistricting plans to the
United States Department of Justice or the United States District Court for the District of
Columbia prior to its implementation, and placed a burden on the State to prove compliance with
Section 5. Shelby Cnty. v. Holder, 133 S. Ct. 2612, 2620 (2013). The Florida Constitution, by
contrast, neither requires “preclearance” nor places the burden of proof on the State. Id. at 624
n.26.
114. Second, unlike Florida’s diminishment provision, which applies statewide,
Section 5 protected minorities in specified jurisdictions only—in Florida, minorities in Collier,
Hardee, Hendry, Hillsborough, and Monroe Counties. Apportionment I, 83 So. 3d at 624; accord
id. at 652-53 (noting that Section 5 protected “minority voting strength only in those counties”).
SR27.4179
Romo, et al. v. Detzner, et al. Case No. 2012-CA-000412 League of Women Voters, et al. v. Detzner, et al. Case No. 2012-CA-000490
37 MIAMI 1014554
Thus, in 2002, the Department of Justice denied preclearance to Florida’s State House plan
because “Collier County Hispanics” who, in the prior redistricting plan, had been united with
Miami-Dade Hispanics in a performing district, were instead connected to Broward County.
Letter from Ralph F. Boyd, Jr., to John M. McKay and Tom Feeney (July 1, 2002), available at
http://www.justice.gov/crt/about/vot/sec_5/ltr/l_070102.php. Under Section 5, the question was
“how a proposed change . . . affects minority voters within a covered county. Our analysis here
only goes to the effect of the change within Collier, and on that county’s minority residents.” Id.
Because Collier County Hispanics were part of a performing district in the benchmark plan, the
State was required to include Collier County Hispanics in a performing district in the new plan,
even if it required their joinder with minorities who resided outside of the covered counties.4
3. Contiguity. 115. Tier One also requires that districts “consist of contiguous territory.” Art. III,
§ 20(a), Fla. Const. To be contiguous, a district must consist of a single geographical area.
“A district lacks contiguity when a part is isolated from the rest by the territory of another
district or when the lands mutually touch only at a common corner or right angle.”
Apportionment I, 83 So. 3d at 628 (marks omitted).
B. The Tier-Two Standards of the Florida Constitution. 116. Tier One prohibits an intent to favor or disfavor political parties or incumbents,
protects the rights of minorities, and ensures that districts are contiguous. Art. III, § 20(a),
4 In Shelby County v. Holder, which was decided after the redistricting process
concluded, the United States Supreme Court declared that the so-called “coverage formula” in Section 4 of the VRA—the formula by which Congress selected the jurisdictions that Section 5 covered—exceeded Congress’s enforcement authority under the Fifteenth Amendment. 133 S. Ct. 2612 (2013). The preclearance process established by Section 5 of the VRA is thus no longer in effect. Shelby County does not, however, affect the validity of the statewide diminishment standard in the Florida Constitution. Shelby County’s holding regarding the enforcement powers of Congress has no application to a statewide standard embodied in state law.
SR27.4180
Romo, et al. v. Detzner, et al. Case No. 2012-CA-000412 League of Women Voters, et al. v. Detzner, et al. Case No. 2012-CA-000490
38 MIAMI 1014554
Fla. Const. Tier Two requires that districts be as nearly equal in population as practicable, that
districts be compact, and that, where feasible, districts utilize existing political and geographical
boundaries. Id. § 20(b). In case of conflict, Tier-One standards take precedence; the
Constitution expressly establishes the primacy of Tier One. See id. § 20(b) (“Unless
compliance with the standards in this subsection conflicts with the standards in subsection (a)
. . . .”); accord Apportionment I, 83 So. 3d at 639 (“[The Constitution] provides that the tier-two
standards are subordinate and shall give way where compliance conflicts with the tier-one
standards . . . .” (marks omitted)); id. at 653 (“The tier-two requirements of compactness and
utilizing existing political and geographical boundaries must yield when necessary in order to
avoid conflict with tier-one requirements.”). As discussed below, however, Tier-Two standards
yield only to the extent necessary. Id. at 626.
1. Equality of Population. 117. Tier Two requires that districts “be as nearly equal in population as is
practicable.” Art. III, § 20(b), Fla. Const. Though located in Tier Two, this standard is, in
effect, superior to all others because it mirrors the equal-population requirement that Article
I, Section 2 of the United States Constitution imposes on congressional districts. As construed
by the United States Supreme Court, the Federal Constitution requires that congressional
“districts be apportioned to achieve population equality ‘as nearly as is practicable.’” Karcher v.
Daggett, 462 U.S. 725, 730 (1983) (quoting Wesberry v. Sanders, 376 U.S. 1, 7-8 (1964)).
States must “make a good-faith effort to achieve precise mathematical equality.” Kirkpatrick
v. Preisler, 394 U.S. 526, 530-31 (1969). Under this strict standard, all avoidable variances
from precise mathematical equality, however small, must be justified. Id. at 531; accord
Apportionment I, 83 So. 3d at 629 n.29.
SR27.4181

Romo, et al. v. Detzner, et al. Case No. 2012-CA-000412 League of Women Voters, et al. v. Detzner, et al. Case No. 2012-CA-000490
39 MIAMI 1014554
2. Compactness. 118. Tier Two states that “districts shall be compact.” Art. III, § 20(b), Fla.
Const. The purpose of the compactness requirement is to “ensure that districts are logically
drawn and that bizarrely shaped districts are avoided.” Apportionment I, 83 So. 3d at 636.
By restricting the Legislature’s line-drawing discretion, it opposes obstacles to intentional
political favoritism. Id. at 632. Compactness is “almost universally recognized as an
appropriate anti-gerrymandering standard.” Id. (quoting Schrage v. State Bd. of Elections, 430
N.E.2d 483, 486 (Ill. 1981)).
119. Compactness “refers to the shape of the district.” Id. at 685. Compactness is
assessed, first and foremost, by the so-called “ocular” test: a simple, visual examination of
the general shape of the district. Id. at 634 (“[A] review of compactness begins by looking at
the shape of a district.”). “Compact districts should not have an unusual shape, a bizarre
design, or an unnecessary appendage unless it is necessary to comply with some other
requirement.” Id.
120. In addition to a visual inspection, quantitative measures of compactness can
assist courts in assessing compactness. Id. at 635. The Supreme Court relied on two
common, quantitative measures of compactness: the Reock and Convex Hull methods. Id. at
635.
121. The Florida Constitution does not require perfect or maximum compactness—
only that districts be “compact.” Thus, the Constitution “does not mandate . . . that
districts within a redistricting plan achieve the highest mathematical compactness scores.” Id.
at 635. A compact district is not unconstitutional merely because it can be redrawn in a more
compact fashion.
SR27.4182

Romo, et al. v. Detzner, et al. Case No. 2012-CA-000412 League of Women Voters, et al. v. Detzner, et al. Case No. 2012-CA-000490
40 MIAMI 1014554
122. Compactness “cannot be considered in isolation.” Id. A district that appears
bizarre or yields low compactness scores is not per-se unconstitutional, but calls for further
investigation into the reasons that dictated or influenced its shape. Id. at 636 (explaining that
non-compact districts “require close examination”); id. at 641 (explaining that, where Tier
One does not justify a non-compact district, “further inquiry into the Legislature’s intent
becomes necessary”).
123. For example, the Supreme Court has recognized that “the requirement of
compactness must yield when necessary to avoid a conflict with the tier-one standard of
protecting minority voting.” Id. at 675; accord id. at 640 (noting that “both federal and state
minority voting-rights protections may require the preservation or creation of non-compact
districts.”). Id. at 640. “Therefore, the reason for drawing lines a certain way may be the result
of legitimate efforts by the Legislature to comply with federal law or Florida’s tier-one
imperative.” Id.; see also id. at 641 (“Where adherence to a tier-one requirement explains the
irregular shape of a given district, a claim that the district has been drawn to favor or disfavor a
political party can be defeated.”). Tier One is superior to Tier Two and, so far as necessary,
prevails in case of conflict. Id. at 640.
124. The State’s geography can also produce non-compactness. Id. at 635. “Given
Florida’s unique shape, some of Florida’s districts have geographical constraints, such as those
located in the Florida Keys, that affect the compactness calculations.” Id.; accord id. at 646
(“We also note that District 120 includes the unusual geography of the Florida Keys and will
therefore necessarily score low on the compactness scales.”). Similarly, a degree of non-
compactness might “result from the Legislature’s desire to follow political or geographical
SR27.4183
Romo, et al. v. Detzner, et al. Case No. 2012-CA-000412 League of Women Voters, et al. v. Detzner, et al. Case No. 2012-CA-000490
41 MIAMI 1014554
boundaries or to keep municipalities wholly intact.” Id. at 635. Adherence to county and
municipal boundaries is one method of achieving compactness.
125. The Supreme Court rejected the contention that adherence to municipal
boundaries—though many municipalities are quite non-compact—will necessarily violate the
constitutional compactness requirement. Id. at 638. “In a compactness analysis, we are
reviewing the general shape of a district; if a district has a small area where minor
adjustments are made to follow either a municipal boundary or a river, this would not
violate compactness.” Id. “Thus, if an oddly shaped district is a result of the state’s
irregular geometry and the need to keep counties and municipalities whole, these explanations
may serve to justify the shape of the district in a logical and constitutionally permissible way.”
Id. at 636.
3. Political and Geographical Boundaries. 126. Tier Two also provides that “districts shall, where feasible, utilize existing
political and geographical boundaries.” Art. III, § 20(b), Fla. Const. The mandate to
utilize political and geographical boundaries where feasible is expressly subordinate to the
standards in Tier One. Id. “Political boundaries” refers to county and municipal lines.
Apportionment I, 83 So. 3d at 636-37. The ballot summary of Amendment 6 referred to
“city, county and geographical boundaries,” id. at 603, and protection for counties and
municipalities is consistent with the purpose of the standards to respect existing community
lines, id. at 636-37 (citing Adv. Op. to Att’y Gen. re Standards For Establishing Legislative
Dist. Boundaries, 2 So. 3d 175, 187-88 (2009)). In Apportionment I, while it noted that the
standards might be balanced differently, id. at 653, the Court endorsed the House’s
implementation, which emphasized respect for county integrity, id. at 637.
SR27.4184
Romo, et al. v. Detzner, et al. Case No. 2012-CA-000412 League of Women Voters, et al. v. Detzner, et al. Case No. 2012-CA-000490
42 MIAMI 1014554
127. “Geographical boundaries” refers to boundaries that are “easily ascertainable
and commonly understood, such as rivers, railways, interstates, and state roads.” Id. at 638
(marks omitted).
128. Seldom, if ever, will the total population of one county, or a combination of
counties, equal the ideal population of a district. Thus, counties must inevitably be divided to
satisfy the equal-population mandate of the United States Constitution. Many
municipalities, moreover, have unusual boundaries that cannot easily be accommodated.
129. Accordingly, in Apportionment I, the Court recognized that “[t]here will be
times when districts cannot be drawn to follow county lines or to include the entire
municipalities within a district,” and that “not every split of a municipality will violate” the
Constitution. Id.; see also id. at 680 (recognizing that in some regions of the State “the splitting
of municipalities was necessitated by population sizes and the close proximity between major
municipalities”); id. at 682 (“[T]he Florida Constitution does not require the Legislature to use
every municipality.”).
130. The requirement to utilize political and geographical boundaries where
feasible must also be balanced with compactness. Both standards are contained in Tier Two,
and standards within Tier Two are of equal rank. See Art. III, § 20(c), Fla. Const.;
Apportionment I, 83 So. 3d at 599 (“The order in which the constitution lists the standards in
tiers one and two is not to be read to establish any priority of one standard over the other
within that tier.” (marks omitted)). In fact, respect for county and municipal boundaries is one
method of achieving compactness.
131. Because “no standard has priority over the other within each tier,” the
“Legislature is tasked with balancing the tier-two standards together in order to strike a
SR27.4185

Romo, et al. v. Detzner, et al. Case No. 2012-CA-000412 League of Women Voters, et al. v. Detzner, et al. Case No. 2012-CA-000490
43 MIAMI 1014554
constitutional result.” Id. at 638. Sometimes a desire to follow political and geographical
boundaries will result in lower compactness scores, id. at 635, or require minor adjustments to
a district boundary, id. at 638. At other times, the constraints of the State’s geography or
demography will require the Legislature to make choices between political boundaries and
geographical boundaries.
132. Courts, therefore, remain appropriately “sensitive to the complex interplay of
forces that enter a legislature’s redistricting calculus.” Id. (quoting Miller v. Johnson, 515 U.S.
900, 915-16 (1995)).
C. The Relevance of Alternative Redistricting Plans. 133. The constitutional duty of the Legislature is to enact a redistricting plan that
complies with the minimum, threshold requirements of the Florida Constitution—not to
enact the best conceivable plan. Thus, the responsibility of a Court is “not to select the best
plan, but rather to decide whether the one adopted by the legislature is valid.” Id. at 608
(quoting In re Senate Joint Resolution 2G, Special Apportionment Session 1992, 597 So. 2d 276,
285 (Fla. 1992)).
134. Rather, an objector must first demonstrate that the redistricting plan adopted by
the Legislature violates a constitutional standard. Then, the objector must demonstrate,
through an alternative plan, that disregard of that standard was not necessary, and that it would
have been possible to implement that standard. “That is to say, an alternative plan that
achieves all of Florida’s constitutional criteria without subordinating one standard to another
demonstrates that it was not necessary for the Legislature to subordinate a standard in its plan.”
Apportionment I, 83 So. 3d at 641. Thus, an alternative plan does not become relevant
SR27.4186
Romo, et al. v. Detzner, et al. Case No. 2012-CA-000412 League of Women Voters, et al. v. Detzner, et al. Case No. 2012-CA-000490
44 MIAMI 1014554
unless the objector first establishes that the challenged plan disregards, or subordinates, a
constitutional standard.
D. The Validity of the Enacted Plan as a Whole. 135. With respect to the enacted congressional plan as a whole, Plaintiffs have failed
to demonstrate that the Legislature acted with improper intent to favor or disfavor a political
party or incumbent.
136. Plaintiffs presented evidence that political consultants otherwise excluded from
the map-drawing process attempted to draw maps that apparently were submitted through the
public processes established by the Legislature. But Plaintiffs offered no evidence that links
those efforts to the Congressional Plan enacted by the Legislature, and the efforts of third
parties—Republicans or Democrats—to influence the process cannot be ascribed to the
Legislature.
137. Plaintiffs offered no evidence that the Legislature received or accepted any
advice from political consultants regarding the configuration of districts, or that the Legislature
knew that any maps submitted through the public process were created even in part by political
consultants. Nor have Plaintiffs demonstrated that a single line in the enacted map is based on
any map drawn by a political consultant.
138. Plaintiffs’ other evidence attempting to show a link between the activities of
political consultants and the Legislature is unavailing. Plaintiffs rely on the fact Kirk Pepper
sent Marc Reichelderfer draft congressional maps before they were available to the public, but
Plaintiffs offer no evidence that Mr. Reichelderfer provided comments to Mr. Pepper about the
draft maps, or that Mr. Pepper himself had any role in the drawing of maps. In fact, on both
points, the testimony shows the contrary.
SR27.4187

Romo, et al. v. Detzner, et al. Case No. 2012-CA-000412 League of Women Voters, et al. v. Detzner, et al. Case No. 2012-CA-000490
45 MIAMI 1014554
139. Plaintiffs’ remaining evidence—such as meetings with consultants before
Census data was even available, or emails containing public hearing schedules or political
cartoons—do not lend any support to Plaintiffs’ assertion that the Congressional Plan is the
product of a secret, parallel process. The two meetings occurred before it was possible to draw
districts, and the result of those meetings was a directive to political consultants to avoid any
involvement in the map-drawing process.
140. Moreover, throughout the trial, Plaintiffs focused on the activities of only three
legislators—Speaker Cannon, Speaker Weatherford, and President Gaetz—and disregarded the
intent of the 157 other members of the Legislature. Even if Plaintiffs had established that those
three legislators acted with improper intent (which they could not), their intent cannot be
ascribed to the Legislature as a whole. Plaintiffs failed to demonstrate the improper intent of a
single legislator or map-drawer, and of course have failed to demonstrate the improper intent of
the Legislature as a collective body.
141. Plaintiffs’ expert evidence also fails to demonstrate that the Legislature acted with
improper intent. Dr. Katz did not opine as to intent, and admitted that he did not study whether
standards such as compactness led to Republican bias. Dr. Rodden admitted that his simulations
did not meet the very constitutional standards at issue in this litigation. And the conclusions of
both Dr. Rodden and Plaintiffs’ third expert, Dr. Ansolabehere, are undercut by the fact that
Plaintiffs’ alternative maps exhibit similar levels of political performance as the enacted map.
142. Plaintiffs’ contention that the Congressional Plan was drawn with improper intent
is contradicted by the evidence. The testimony of Mr. Guthrie, Mr. Kelly, and Mr. Poreda,
which this Court finds credible, established that the Legislature entrusted the development of
congressional maps to its professional staff. The Legislature insulated staff from partisan
SR27.4188
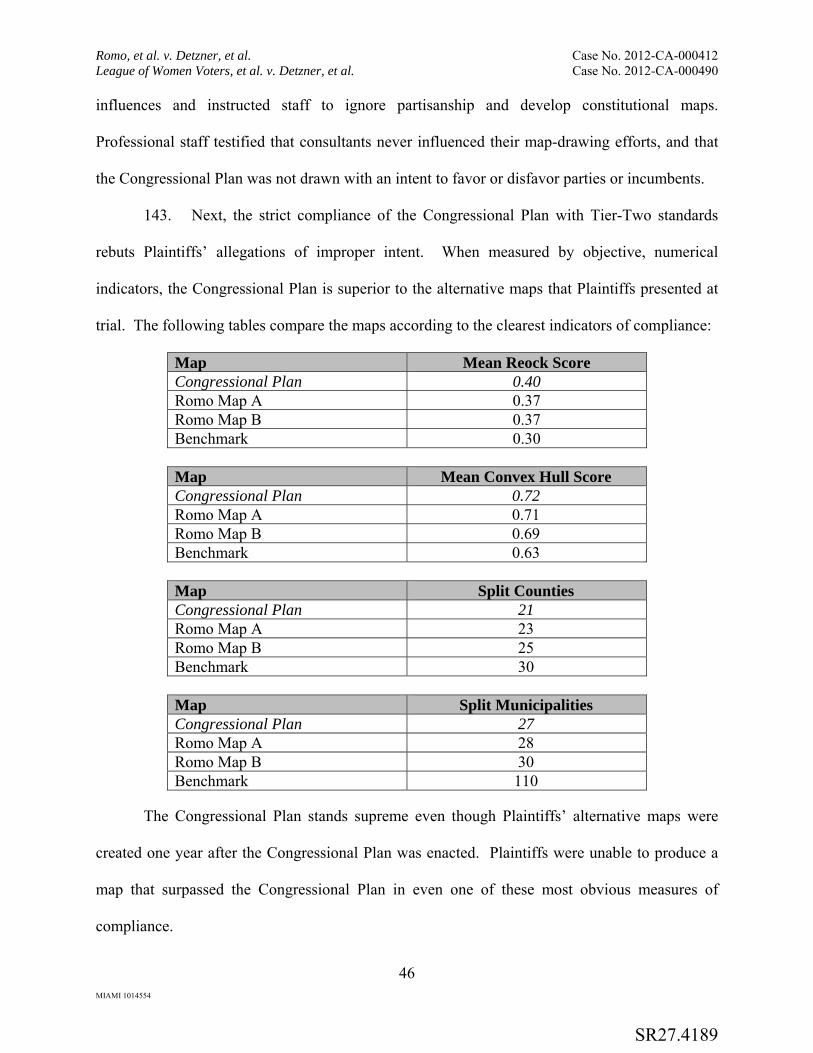
Romo, et al. v. Detzner, et al. Case No. 2012-CA-000412 League of Women Voters, et al. v. Detzner, et al. Case No. 2012-CA-000490
46 MIAMI 1014554
influences and instructed staff to ignore partisanship and develop constitutional maps.
Professional staff testified that consultants never influenced their map-drawing efforts, and that
the Congressional Plan was not drawn with an intent to favor or disfavor parties or incumbents.
143. Next, the strict compliance of the Congressional Plan with Tier-Two standards
rebuts Plaintiffs’ allegations of improper intent. When measured by objective, numerical
indicators, the Congressional Plan is superior to the alternative maps that Plaintiffs presented at
trial. The following tables compare the maps according to the clearest indicators of compliance:
Map Mean Reock Score Congressional Plan 0.40 Romo Map A 0.37 Romo Map B 0.37 Benchmark 0.30
Map Mean Convex Hull Score Congressional Plan 0.72 Romo Map A 0.71 Romo Map B 0.69 Benchmark 0.63
Map Split Counties Congressional Plan 21 Romo Map A 23 Romo Map B 25 Benchmark 30
Map Split Municipalities Congressional Plan 27 Romo Map A 28 Romo Map B 30 Benchmark 110
The Congressional Plan stands supreme even though Plaintiffs’ alternative maps were
created one year after the Congressional Plan was enacted. Plaintiffs were unable to produce a
map that surpassed the Congressional Plan in even one of these most obvious measures of
compliance.
SR27.4189
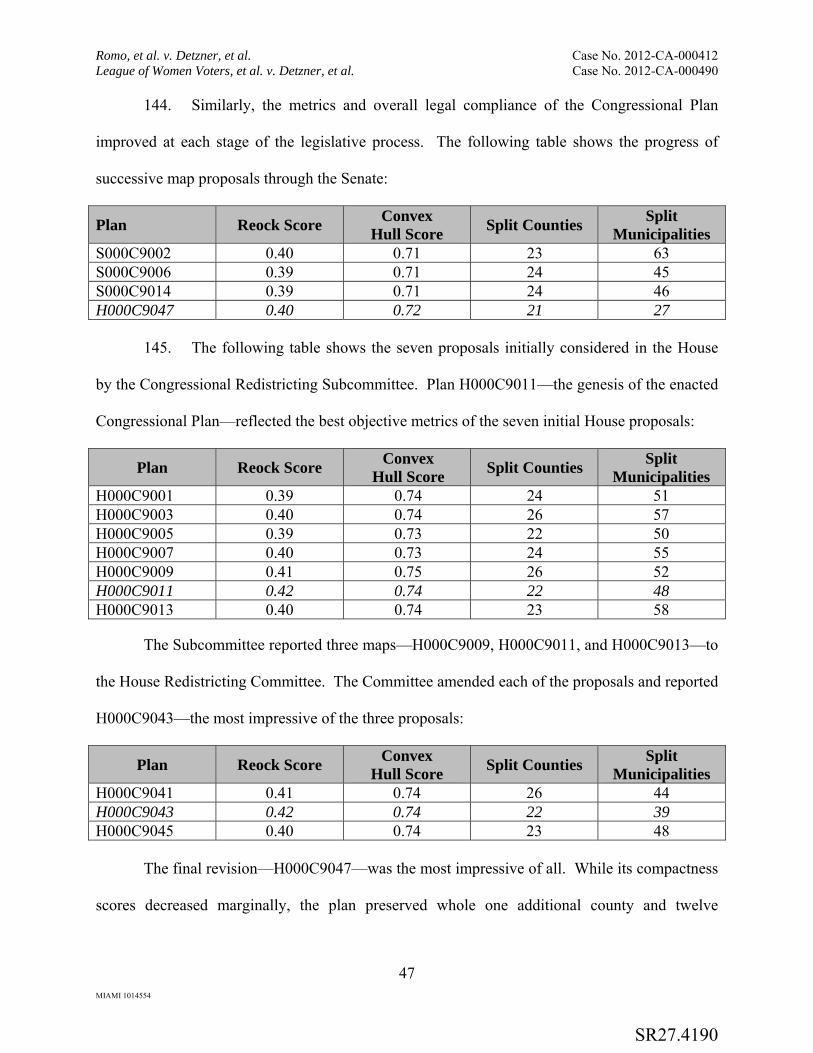
Romo, et al. v. Detzner, et al. Case No. 2012-CA-000412 League of Women Voters, et al. v. Detzner, et al. Case No. 2012-CA-000490
47 MIAMI 1014554
144. Similarly, the metrics and overall legal compliance of the Congressional Plan
improved at each stage of the legislative process. The following table shows the progress of
successive map proposals through the Senate:
Plan Reock Score Convex
Hull Score Split Counties
Split Municipalities
S000C9002 0.40 0.71 23 63 S000C9006 0.39 0.71 24 45 S000C9014 0.39 0.71 24 46 H000C9047 0.40 0.72 21 27
145. The following table shows the seven proposals initially considered in the House
by the Congressional Redistricting Subcommittee. Plan H000C9011—the genesis of the enacted
Congressional Plan—reflected the best objective metrics of the seven initial House proposals:
Plan Reock Score Convex
Hull Score Split Counties
Split Municipalities
H000C9001 0.39 0.74 24 51 H000C9003 0.40 0.74 26 57 H000C9005 0.39 0.73 22 50 H000C9007 0.40 0.73 24 55 H000C9009 0.41 0.75 26 52 H000C9011 0.42 0.74 22 48 H000C9013 0.40 0.74 23 58
The Subcommittee reported three maps—H000C9009, H000C9011, and H000C9013—to
the House Redistricting Committee. The Committee amended each of the proposals and reported
H000C9043—the most impressive of the three proposals:
Plan Reock Score Convex
Hull Score Split Counties
Split Municipalities
H000C9041 0.41 0.74 26 44 H000C9043 0.42 0.74 22 39 H000C9045 0.40 0.74 23 48
The final revision—H000C9047—was the most impressive of all. While its compactness
scores decreased marginally, the plan preserved whole one additional county and twelve
SR27.4190

Romo, et al. v. Detzner, et al. Case No. 2012-CA-000412 League of Women Voters, et al. v. Detzner, et al. Case No. 2012-CA-000490
48 MIAMI 1014554
additional municipalities, while ensuring compliance with the Constitution’s Tier-One
requirements:
Plan Reock Score Convex
Hull Score Split Counties
Split Municipalities
H000C9047 0.40 0.72 21 27
146. Plaintiffs’ alternative maps provide additional, compelling evidence that the
Legislature did not draw the Congressional Plan with improper intent. The political performance
of Plaintiffs’ alternative maps is identical to the political performance of the Congressional Plan.
In each, Governor Mitt Romney received more votes than President Obama in sixteen districts.
In fact, in seven statewide races held in 2010 and 2012, Republican statewide candidates won
more districts under Plaintiffs’ maps (17.6 on average) than under the Congressional Plan (17.4).
Thus, while Plaintiffs contend that the Congressional Plan is a Republican gerrymander, the
empirical evidence shows that their own alternative maps are more favorable to Republicans.
147. The comparable performance of the alternative maps is telling because the
alternative maps were drawn and approved by national Democratic interests. Because the
performance of the Congressional Plan is consistent with the performance of alternatives drawn
for the Democratic Party, the assertion that the Congressional Plan was drawn to favor
Republicans rings hollow.
148. The effect of the Congressional Plan on incumbents is further evidence that the
Congressional Plan was not drawn with an intent to favor a political party or its incumbents. As
detailed above, the Congressional Plan caused extensive disruption for Republicans. Under the
Congressional Plan, four Republican incumbents were defeated—two in the primary and two in
the general election. Under the Congressional Plan, Democrats gained four seats in 2012,
reducing the Republican share of congressional seats from 76% (19 of 25) to 63% (17 of 27).
SR27.4191

Romo, et al. v. Detzner, et al. Case No. 2012-CA-000412 League of Women Voters, et al. v. Detzner, et al. Case No. 2012-CA-000490
49 MIAMI 1014554
149. Accordingly, Plaintiffs have failed to meet their burden to demonstrate that the
Legislature as a whole acted with improper intent when it adopted the Congressional Plan.
E. The Validity of Individual Districts. 150. Plaintiffs have not offered sufficient evidence to demonstrate that any district
within the enacted congressional map violates the standards set forth in Article III, Section 20
of the Florida Constitution.
District 5
151. Plaintiffs have failed to show that District 5 violates Article III, Section 20 of the
Florida Constitution. The Court cannot find that the establishment of CD5 as a majority-
minority district, and the continued inclusion of the African-American community of Sanford, is
prohibited by the Constitution. The evidence supports the Legislature’s position that it made a
reasonable legislative judgment when it drew CD5 with a modest increase in Black VAP—from
49.9% to 50.1%—to satisfy the “majority-minority rule” announced in Bartlett v. Strickland.
152. The Legislature’s decision to create a majority-minority district was appropriate.
First, the Legislature appropriately concluded that CD5—with a Black VAP of 50.1% and the
African-American community of Sanford—better guards against a diminishment of minority
voting ability, and better ensures that minorities will be as likely as in the benchmark district to
elect their preferred candidates, than a district that excludes the African-American community of
Sanford from a historically performing district and reduces the district’s Black VAP to 48%.
153. Plaintiffs incorrectly characterize the decision to redraw CD5 as a majority-
minority district as a radical step. It is not. A change (whether an increase or a decrease) of less
than 0.2% in Black VAP is not extraordinary and is well within the constitutional discretion of
the Legislature, especially considering the Legislature’s First-Tier responsibility to ensure that
SR27.4192

Romo, et al. v. Detzner, et al. Case No. 2012-CA-000412 League of Women Voters, et al. v. Detzner, et al. Case No. 2012-CA-000490
50 MIAMI 1014554
minority voting strength is not diminished. The Constitution did not deprive the Legislature of
the ability to preserve this minority district, or to include in the district the minority community
of Sanford, which had been represented by a candidate of its choice since the district was first
drawn by a federal court in 1992. The emergence of new majority-minority districts did not
offend the Supreme Court in Apportionment I, see 83 So. 3d at 645-46, 655 (noting with
approval the emergence of new majority-minority districts in state legislative plans), and it does
not offend the Constitution. The Legislature, moreover, conducted a proper functional analysis
to ensure that minority voting strength was not decreased, and that the district could not be
drawn much more compactly while preserving the same degree of minority voting strength.
154. Further, the Legislature appropriately concluded that the creation of CD5 as a
majority-minority district secured minorities against vote dilution and the Legislature against a
vote-dilution challenge. Given the recent holding of Bartlett v. Strickland, 556 U.S. 1 (2009),
that only majority-minority districts satisfy Section 2, the Legislature reasonably concluded that
the exclusion of Sanford and resulting failure to create a majority-minority district would have
invited allegations of vote dilution. In fact, ten years earlier, the predecessor district had been
challenged under Section 2. See Martinez v. Bush, 234 F. Supp. 2d 1275, 1301 (S.D. Fla. 2002).
Because the Black VAP of Benchmark CD3 was 49.9%, the Legislature made an appropriate and
responsible decision to increase CD5’s Black VAP from 49.9 to 50.1%, achieving majority-
minority status and ensuring compliance with the state and federal vote-dilution standards.
155. The legislative judgment that the Gingles preconditions were satisfied was sound
and is entitled to respect. First, as CD5 demonstrates, the minority population is sufficiently
SR27.4193
Romo, et al. v. Detzner, et al. Case No. 2012-CA-000412 League of Women Voters, et al. v. Detzner, et al. Case No. 2012-CA-000490
51 MIAMI 1014554
large to comprise a numerical majority in a single district.5 Second, both Dr. Engstrom and
Plaintiffs’ own expert, Dr. Ansolabehere, testified that voting in Northeast Florida is racially
polarized. Finally, the Legislature appropriately concluded that the minority population is
“reasonably compact” for vote-dilution purposes. In 2002, a three-judge federal district court so
held. See Martinez v. Bush, 234 F. Supp. 2d at 1301. Indeed, in the vote-dilution context,
compactness refers not to the shape of a district, but to the characteristics of a minority
population. Even if the boundaries of CD5 are not compact under Tier Two, it would not follow
that the minority population is not “compact” under vote-dilution principles. For vote-dilution
purposes, a district is compact if the minority population shares common characteristics, needs,
and interests. See LULAC, 548 U.S. at 435. The testimony presented at trial resoundingly
demonstrates that the minority communities that comprise CD5 form a single community.6
5 Plaintiffs suggest that the relevant measure is citizen voting-age population (“CVAP”)
and that, by this measure, CD5 is not a majority-minority district. CVAP is the relevant measure, if at all, “only where there is reliable information indicating a significant difference in citizenship rates between the majority and minority populations.” Negron v. City of Miami Beach, Fla., 113 F.3d 1563, 1569 (11th Cir. 1997); but see Bartlett, 556 U.S. at 18 (“[T]he majority-minority rule relies on an objective, numerical test: Do minorities make up more than 50 percent of the voting-age population in the relevant geographic area?”); id. at 27-28 (Souter, J., dissenting) (contending that CVAP is the relevant measure). Plaintiffs reach their result, however, only by (1) failing to consider Census estimates showing that for CD5, unlike the state as a whole, citizenship rates among blacks are in fact higher than those for the overall voting age population and (2) failing to account for multi-race black voters. If multi-race black voters are included, as they should be, see Ashcroft, 539 U.S. at 473 n.1, then CD5 has a Black CVAP in excess of 50%.
6 In LULAC, the Court concluded that a 300-mile district that extended from Austin to the Rio Grande Valley was not reasonably compact for vote-dilution purposes. Essential to its holding, however, was that the Hispanic populations concentrated at the two extremities of the district had “different characteristics, needs, and interests” and that the “practical consequence” of drawing a district to incorporate both disparate communities was that “one or both groups will be unable to achieve their political goals.” See 548 U.S. at 434. Here, fact and expert testimony supports the conclusion that the minority population in CD5 shares common characteristics, needs, and interests, and is effectively represented in Congress by their common representative.
SR27.4194

Romo, et al. v. Detzner, et al. Case No. 2012-CA-000412 League of Women Voters, et al. v. Detzner, et al. Case No. 2012-CA-000490
52 MIAMI 1014554
156. Because the Legislature reasonably concluded that the Gingles preconditions are
satisfied, and because the expert and fact testimony presented at trial shows that, in the totality of
circumstances, minorities in Northeast Florida have less opportunity than other members of the
electorate to participate in the political process and elect the candidates of their choice, the
Legislature correctly drew CD5 with a modest increase in Black VAP, from 49.9% to 50.1%.
157. The fact that the Legislature did not draw CD5 as a majority-minority district in
earlier drafts considered during the legislative process is immaterial. The enacted Congressional
Plan reflects the Legislature’s most deliberate consideration of applicable legal standards. It is
equally immaterial for vote-dilution purposes that Benchmark CD3 was not a majority-minority
district. Nothing about the previous district matters in a vote-dilution claim. What matters is
whether another majority-minority district can be drawn. Apportionment I, 83 So. 2d at 623.
158. The Legislature stated its intent to comply with the diminishment and vote-
dilution standards in Chapter 2012-2, Laws of Florida:
WHEREAS, it is the intent of the Legislature to establish Congressional District 5, which is equal in population to other districts; is consistent with Section 2 of the federal Voting Rights Act; does not deny or abridge the equal opportunity of racial or language minorities to participate in the political process or diminish their ability to elect representatives of their choice; preserves the core of the existing district in accordance with public testimony and ties communities in Northeast Florida of similar socioeconomic characteristics; includes portions of Alachua, Clay, Duval, Lake, Marion, Orange, Putnam, and Seminole Counties; includes all of the municipalities of Eatonville, Green Cove Springs, Hawthorne, McIntosh, Palatka, and Reddick; improves the use of county and city boundaries as compared to the comparable district in the benchmark plan; and uses the St. Johns River and other waterways as portions of its eastern boundary . . . .
Ch. 2012-2, Laws of Fla., at 2 (2012) (emphasis added).
159. While Plaintiffs complain that CD5 divides Seminole County to include Sanford,
their alternative maps contain an alleged minority district that does the same thing. Plaintiffs
assert that their Alternative District 10 was drawn to present minority voters an opportunity to
SR27.4195

Romo, et al. v. Detzner, et al. Case No. 2012-CA-000412 League of Women Voters, et al. v. Detzner, et al. Case No. 2012-CA-000490
53 MIAMI 1014554
elect their candidate of choice. It has a combined Black and Hispanic VAP of 47.1%. It too
enters Seminole County, and even extends further, crossing into Volusia County.
160. Plaintiffs’ alternatives to CD5 are less faithful to Tier-One standards and are no
more compact than Enacted CD5. In fact, Plaintiffs’ alternatives are worse because, unlike
Enacted CD5, the alternatives wreak havoc on the compactness of surrounding districts.
161. CD5 in Romo Map A reduces Black VAP from 49.9% in the Benchmark to
45.1%. It removes approximately 20,000 black residents from CD5 in the Congressional Plan.
At the same time, CD5 in Romo Map A has an admittedly non-compact shape, as its own creator
testified. The district is more than 200 miles long—longer than Enacted CD5 by 62 miles—and
stretches from Jacksonville to the Chattahoochee River, 50 miles west of Tallahassee.
162. CD5 in Romo Map B is even less compact. It reduces Black VAP to 47.3% and
contains a perpendicular arm that extends to Gainesville and Ocala. Thus, while Plaintiffs
complain that Enacted CD5 extends from Jacksonville to Orlando, their own alternatives, if
oriented in the same direction, would extend past Orlando to the City of Sebring.
163. Plaintiffs’ alternatives make no improvement to the compactness of CD5:
Area Perimeter Length CD5 – Congressional Plan 1,536 sq. miles 707 miles 144 miles CD5 – Romo Map A 3,911 sq. miles 711 miles 206 miles CD5 – Romo Map B 4,440 sq. miles 931 miles 204 miles
164. Plaintiffs contend that their reductions in Black VAP do not diminish minority
voting strength, but they do. The alternative maps increase the district’s single-race white VAP
from 37.2% in Benchmark CD3 to 45.8% and 44.5%—increases of 8.6% and 7.3%. While
Black VAP exceeded White VAP in Benchmark CD3 by a large margin (12.7%), it falls behind
White VAP in one of the alternative districts, and exceeds White VAP by a mere 2.8% in the
other. In an area of the State that exhibits racially polarized voting, these changes are not trivial.
SR27.4196

Romo, et al. v. Detzner, et al. Case No. 2012-CA-000412 League of Women Voters, et al. v. Detzner, et al. Case No. 2012-CA-000490
54 MIAMI 1014554
165. Plaintiffs’ alternative maps do violence to other districts. Because Alternative
CD5 extends into the Panhandle, CD2 is forced to the South and to the East. Alternative CD2 is
enormous, extending from the Choctawhatchee River west of Bay County to Bradford and Levy
Counties. The damage that Plaintiffs inflict on the compactness of CD2 far outweighs any small
improvement that the alternative maps might achieve in the compactness of any other district:
Reock Convex
Hull Area Perimeter Length
CD 2 – Congressional Plan 0.46 0.78 10,076 sq. mi. 550 miles 167 miles CD 2 – Romo Map A 0.29 0.62 13,146 sq. mi. 1,010 miles 241 miles CD 2 – Romo Map B 0.31 0.63 13,022 sq. mi. 966 miles 232 miles
166. The changes that Plaintiffs propose would undermine the substantial progress in
voting rights over recent decades. Until 1992, African Americans in Florida had no ability to
elect a candidate of their choice. Until that time, redistricting plans had splintered CD5’s black
population into various “influence” districts. In fact, since Reconstruction, Florida had not
elected a single African American to Congress.
167. This history changed only after the intervention of a federal court. See De
Grandy v. Wetherell, 794 F. Supp. 1076 (N.D. Fla. 1992) (Hatchett, Stafford, and Vinson, JJ.).
In 1992, the Legislature failed to enact a congressional redistricting plan, so the federal court
performed the task. Id. The Court began by noting that Florida’s “minorities have had very little
success in being elected to either the United States Congress or the Florida Legislature. An
African-American has not represented Florida in Congress in over a century.” Id. at 1079. To
remedy that unfortunate history, the Court endeavored to draw performing minority districts:
The approach of fracturing the African-American community in order to create influence districts does not further Congress’s intent of completely remedying the prior dilution of minority voting strength and providing a meaningful opportunity to participate in the political process. It is not enough for minority groups to be able to influence elections because, under the Voting Rights Act, they must be
SR27.4197
Romo, et al. v. Detzner, et al. Case No. 2012-CA-000412 League of Women Voters, et al. v. Detzner, et al. Case No. 2012-CA-000490
55 MIAMI 1014554
able to determine the outcome of elections and elect representatives of their choice.
Id. at 1085-86. Democrats in the Legislature resisted that effort and submitted a plan which,
according to the Court, “elevate[d] the secondary criteria of compactness, coherent communities
of shared interest, and respect for traditional political boundaries over the primary principle of
ensuring that minority voting strength is not diluted.” Id. at 1087. The Court rejected this
approach, finding that a plan that “fractures the African-American community into influence
districts would merely continue the past dilution of minority voting strength.” Id. at 1085.
168. The Court adopted an expert’s plan. The court-approved plan created CD3
(CD5’s predecessor) as a majority-minority district, along with a second majority-black district.
Id. at 1088. Like CD5, the Black VAP of original CD3 exceeded 50%. As a result of this new
map, Floridians had their first African-American member of Congress since Reconstruction.
169. In 1996, another three-judge court invalidated CD3 on an Equal Protection
grounds, finding that CD3 “was drawn for predominately race-based reasons.” Johnson v.
Mortham, 926 F. Supp. 1460, 1466 (N.D. Fla. 1996) (three-judge court). Over Judge Hatchett’s
dissent, the majority invalidated CD3 but allowed the Legislature to enact a valid substitute. Id.
The three-judge court then approved the newly drawn version of CD3. See Johnson v. Mortham,
No. 94-40025, 1996 WL 297280, at *1 (N.D. Fla. May 31, 1996). The court-approved district
had a different shape but maintained a substantial Black VAP. Like its predecessor and its
successors, the district connected Jacksonville and Orlando, and part Seminole County.7
7 Plaintiffs rely on Johnson’s conclusion that the original CD3, as established by a federal
three-judge court in 1992, was not reasonably compact for vote-dilution purposes. But Johnson invalidated the earlier wishbone configuration and approved the general configuration of current CD5. Id. Johnson, moreover, preceded both Martinez, which found the minority population of redrawn CD3 to be compact, and LULAC, which clarified the vote-dilution compactness inquiry.
SR27.4198

Romo, et al. v. Detzner, et al. Case No. 2012-CA-000412 League of Women Voters, et al. v. Detzner, et al. Case No. 2012-CA-000490
56 MIAMI 1014554
170. In 2002, the Legislature again drew CD3 to protect minority rights, and, with a
Black VAP of 46.8%, the district continued to perform for minorities. That plan was challenged,
but all challenges were rejected. See Martinez v. Bush, 234 F. Supp. 2d 1275 (N.D. Fla. 2002)
(three-judge court). The plaintiffs claimed that “the newly drawn performing districts are either
not sufficiently likely to perform or are excessively packed so as to ‘waste’ minority votes.” Id.
at 1298. The Court found that the “legislature recognized that adopting districts that would not
dilute black or Hispanic voting strength was fully consistent with—perhaps even essential to—
the goal of adopting a plan that would withstand legal challenges.” Id. at 1301. It also found it
likely that newly redrawn CD3 would “in fact perform for black candidates of choice, and that
black candidates of choice will be elected in [CD3] throughout the coming decade.” Id. That
finding proved correct, as CD3 continued to elect the African-American candidate of choice.
171. Between 2000 and 2010, population changes in CD3 increased its Black VAP.
The 2010 Census revealed that, during the preceding decade, the district’s Black VAP had
increased from 46.8 to 49.9%. In 2012, finding it possible to create a majority-minority district,
the Legislature drew the district with a modest, 0.2% increase in Black VAP. Redrawn CD3
maintains the same basic shape and minority voting strength as its predecessors.
172. Plaintiffs claim that CD5 is analogous to Senate District 6, which the Supreme
Court invalidated in Apportionment I. But aside from touching Jacksonville, the districts are not
analogous.
173. The Supreme Court invalidated District 6 because, while the district’s stated
justification was minority protection, the Senate “never performed an appropriate functional
analysis.” 83 So. 3d at 666. In invalidating District 6, the Court noted that neither District 6 nor
SR27.4199

Romo, et al. v. Detzner, et al. Case No. 2012-CA-000412 League of Women Voters, et al. v. Detzner, et al. Case No. 2012-CA-000490
57 MIAMI 1014554
its benchmark was a majority-minority district. Id. at 666-67. The Court stated that “this is not a
district where the Senate’s goal was to create a majority-minority district.” Id. at 667.
174. After reviewing election data as part of a functional analysis, the Supreme Court
concluded that a reduction in Black VAP in District 6 from 46.9% in the benchmark to the
42.4% drawn by challengers would not actually diminish the ability to elect in District 6. Id. at
667; see also id. at 625 (holding that “a slight change” in minority VAP “does not necessarily
have a cognizable effect on a minority group’s ability to elect” because the “ability to elect a
candidate of choice depends upon more than just population figures”). And because it was not
possible to establish a majority-minority district, vote-dilution principles were not implicated.
175. On the other hand, the reduction in Black VAP enabled District 6 to be drawn
“much more compactly.” Id. at 669; accord id. (“In addition to being much more visually
compact, the compactness measurements are much better.” (emphasis added)). Rather than
stretch the district across five counties, it was possible to draw the district within Duval County.
176. None of these conditions applies here. The Legislature performed a functional
analysis. It drew a majority-minority district. The proposed reduction in minority VAP will
diminish minority voting strength. And the changes Plaintiffs seek will not make the district
much more compact and exponentially more respectful of political and geographical boundaries.
177. A better analogy to CD5 is House District 88, which the Supreme Court upheld,
and which—like CD 5—protects minority voting rights. Plaintiffs contended in the Supreme
Court that House District 88 could not be justified. They argued there that District 88 was the
least compact House district, that it packs minorities to achieve a Black VAP of 51.8%, and that
the Black VAP was more than “necessary” to elect minority-preferred candidates. They noted
that the district’s Reock score was 0.08 (lower than CD5’s), and, while the Supreme Court found
SR27.4200
Romo, et al. v. Detzner, et al. Case No. 2012-CA-000412 League of Women Voters, et al. v. Detzner, et al. Case No. 2012-CA-000490
58 MIAMI 1014554
the district “clearly visually non-compact” with “the lowest compactness measurements of all the
districts in the 2012 House plan,” it rejected Plaintiffs’ arguments. The Court upheld District 88
because the “Legislature formed this district with the stated intent to preserve minority voting
opportunities.” Id. at 649. The House conducted a functional analysis, as it did with CD5, and
District 88 was a majority-minority district, as is CD5. Id. Importantly, though the Court found
District 88 visually non-compact, it did not disregard the Legislature’s vote-dilution concerns.
Quoting the joint resolution, the Court noted that the Legislature intended that District 88 be
“consistent with Section 2 of the federal Voting Rights Act” and “not deny or abridge the equal
opportunity of racial or language minorities to participate in the political process.” Id. at 649.
The Legislature made similar findings with respect to CD5, which, like District 88, is valid.
District 10
178. Plaintiffs argue that District 10 violates compactness because it includes “an
appendage” between District 5 and District 9.
179. The so-called “appendage,” however, is situated between two minority districts:
CD5, a historically performing African-American majority-minority district, and CD9, a new
Hispanic opportunity district in the Congressional Plan that keeps Osceola County whole.
180. The addition of the “appendage” to either CD5 or CD9 would have compromised
the ability of minorities in those districts to elect their preferred candidates. Mr. Guthrie testified
that the “appendage” contains approximately 105,000 people, and that more than 70% of its
population is white. Plaintiffs presented no evidence that the “appendage”, which is Democratic-
leaning, was included to help Republican candidates.
181. Plaintiffs note that the “appendage” did not exist in the House’s initial drafts of
the Congressional Plan. Those drafts, however, divided Osceola County, and the Hispanic VAP
SR27.4201
Romo, et al. v. Detzner, et al. Case No. 2012-CA-000412 League of Women Voters, et al. v. Detzner, et al. Case No. 2012-CA-000490
59 MIAMI 1014554
of CD9 was below 40%. To respect county boundaries while affording the growing Hispanic
population the earliest opportunity to elect the candidates of its choice, the Legislature united
Osceola County and increased the Hispanic VAP of CD9 to more than 40% in the Congressional
Plan—a level similar to the Hispanic VAP of Plaintiffs’ Alternative CD9. Mr. Poreda testified
that these changes required CD9 to recede from Orange County, thus creating the appendage.
Plaintiffs did not show that these objectives could have been achieved without the appendage.
182. Plaintiffs cite Apportionment I, in which the Supreme Court invalidated a Senate
district that contained a similar “appendage” in Central Florida. 83 So. 3d at 669-72. Critical to
the Court’s conclusion, however, was that an incumbent Senator resided in the appendage and
that the Senate had not performed a proper functional analysis in order to determine whether the
appendage might have been incorporated into two adjacent minority districts. Id. at 671-72.
Importantly, when the Legislature reconvened to revise the Senate plan, it performed a functional
analysis and found it essential to retain the appendage. In Apportionment II, the Court upheld the
district—even with the appendage. The Court explained that the Legislature “could not
completely eliminate the appendage without impairing minority voting rights.” Id. at 889.
183. This case resembles Apportionment II. No incumbent member of Congress
resides in the so-called appendage, and the Legislature performed a functional analysis and
concluded that the appendage could not be eliminated without impairment of minority rights.
184. Plaintiffs’ own alternative maps contain an appendage in Orlando. Alternative
District 7 contains essentially the same appendage. The difference is that Plaintiffs’ appendage
is connected to a district to the north—not a district to the west. This difference is insignificant.
In fact, Plaintiffs’ map-drawer testified that the appendage in the alternative maps resulted from
SR27.4202
Romo, et al. v. Detzner, et al. Case No. 2012-CA-000412 League of Women Voters, et al. v. Detzner, et al. Case No. 2012-CA-000490
60 MIAMI 1014554
the same considerations that influenced the Congressional Plan: an attempt to create two nearby
minority districts. (Hawkins Dep. 258:15-261:11.) Plaintiffs cannot distinguish their appendage.
185. Plaintiffs have thus failed to offer any evidence that District 10 violates Article
III, Section 20 of the Florida Constitution.
Districts 13 and 14
186. Plaintiffs challenge CD14, contending that it unconstitutionally combines
population in Pinellas and Hillsborough Counties, which are located across Tampa Bay, in
violation of second-tier standards. The Legislature created CD14 to avoid diminishment in the
ability of black and Hispanic voters to elect the candidates of their choice, and Plaintiffs failed to
establish that a different configuration would have avoided diminishment.
187. Benchmark CD11 preceded CD14. It is uncontested that, in Benchmark CD11,
minority voters were able to elect the candidate of their choice. Blacks and Hispanics vote
cohesively in this area, and together comprised approximately 50% of the VAP of CD11.
188. The Constitution, therefore, required that the Legislature not diminish the ability
of minorities to elect their preferred candidates. See Art. III, § 20(a), Fla. Const. Furthermore,
Hillsborough County was one of five counties in Florida protected by Section 5 of the VRA. If
the Legislature had failed to protect minorities in Hillsborough County from diminishment, the
Congressional Plan would have been denied preclearance by the Department of Justice.
189. Benchmark CD11 included parts of Hillsborough, Pinellas, and Manatee
Counties. In new CD14, the Legislature eliminated the extension into Manatee County, and
therefore better balanced the second-tier requirements of compactness and adherence to political
boundaries.
SR27.4203

Romo, et al. v. Detzner, et al. Case No. 2012-CA-000412 League of Women Voters, et al. v. Detzner, et al. Case No. 2012-CA-000490
61 MIAMI 1014554
190. The Legislature concluded, however, that, given the history of preclearance in
Florida, CD14 could not be further removed from Pinellas County without a diminishment in
minority voting strength. In 1992, the Department of Justice, noting the “political cohesiveness
of minority voters” in Tampa and St. Petersburg, refused to grant preclearance to a Senate plan
that failed to unite the minority communities of Pinellas and Hillsborough Counties.8 And in
2002, in objecting to the House plan, the Department of Justice made clear that the retrogression
inquiry concerns only the effect on minorities who reside in the five covered counties—here,
Hillsborough County—and that, if necessary to avoid retrogression, the State must unite
protected minorities in covered jurisdictions with minorities outside of the covered jurisdictions.
191. The Legislature, therefore, found that minorities in Hillsborough County and
Pinellas Counties continue to be politically cohesive and that, to avoid diminishment in the
ability of Hillsborough County minorities to elect their candidates of choice, Hillsborough
County minorities must continue to be united with minorities in Pinellas County. In enacting
CD14, the Legislature expressly stated that CD14 “is consistent with Section 5 of the federal
Voting Rights Act” and “does not deny or abridge the equal opportunity of racial or language
minorities to participate in the political process or diminish their ability to elect representatives
of their choice.” Ch. 2012-2, at 4, Laws of Fla. The Legislature included a discussion of CD14
in its preclearance application, and the Department of Justice precleared the Congressional Plan.
192. Plaintiffs’ alternative maps render CD14 as well as the broader region of the State
less compact and less conformable to second-tier standards. Plaintiffs’ Alternative CD14, which
8 In 1996, a federal court approved a Senate district that, like CD14, was centered in
Hillsborough County but also included minority populations in St. Petersburg. In approving a settlement that imposed the remedial district, the Court explained: “Both common sense and the history of this litigation suggest that the residents of District 21 regard themselves as a community and experience considerable comfort with the proposed resolution.” Scott v. U.S. Dep’t of Justice, 920 F. Supp. 1248, 1255 (M.D. Fla. 1996) (Tjoflat, Nimmons, Merryday, JJ.).
SR27.4204
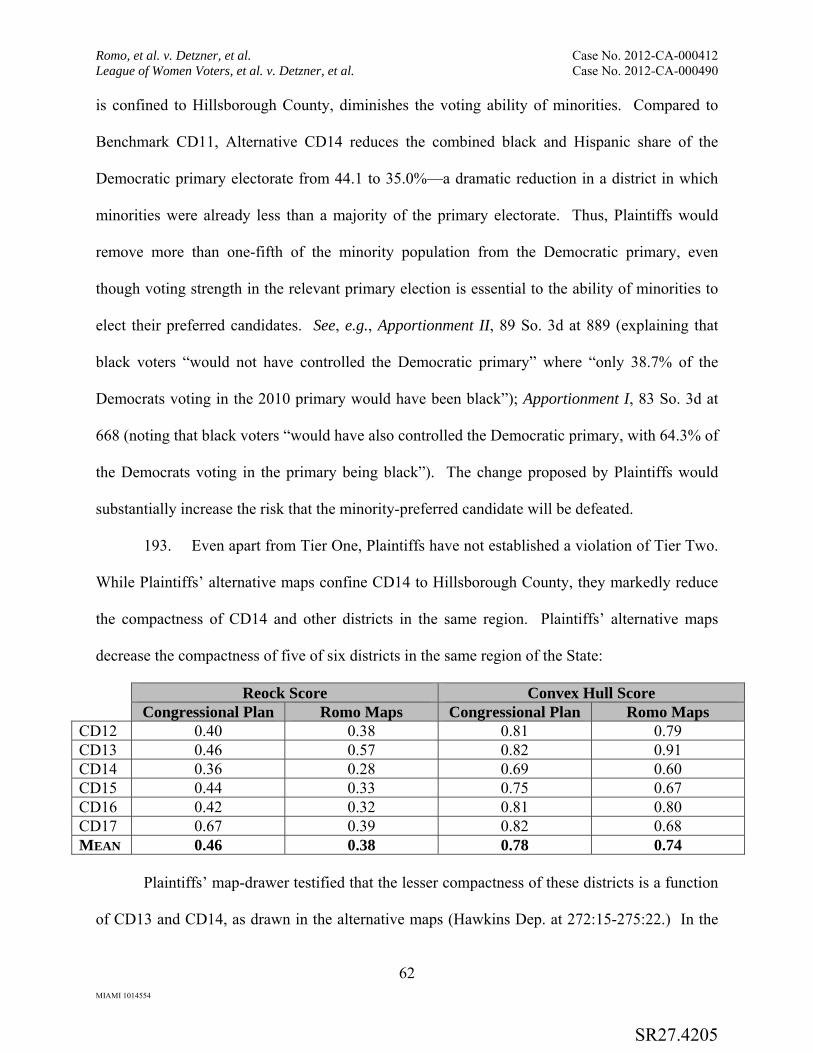
Romo, et al. v. Detzner, et al. Case No. 2012-CA-000412 League of Women Voters, et al. v. Detzner, et al. Case No. 2012-CA-000490
62 MIAMI 1014554
is confined to Hillsborough County, diminishes the voting ability of minorities. Compared to
Benchmark CD11, Alternative CD14 reduces the combined black and Hispanic share of the
Democratic primary electorate from 44.1 to 35.0%—a dramatic reduction in a district in which
minorities were already less than a majority of the primary electorate. Thus, Plaintiffs would
remove more than one-fifth of the minority population from the Democratic primary, even
though voting strength in the relevant primary election is essential to the ability of minorities to
elect their preferred candidates. See, e.g., Apportionment II, 89 So. 3d at 889 (explaining that
black voters “would not have controlled the Democratic primary” where “only 38.7% of the
Democrats voting in the 2010 primary would have been black”); Apportionment I, 83 So. 3d at
668 (noting that black voters “would have also controlled the Democratic primary, with 64.3% of
the Democrats voting in the primary being black”). The change proposed by Plaintiffs would
substantially increase the risk that the minority-preferred candidate will be defeated.
193. Even apart from Tier One, Plaintiffs have not established a violation of Tier Two.
While Plaintiffs’ alternative maps confine CD14 to Hillsborough County, they markedly reduce
the compactness of CD14 and other districts in the same region. Plaintiffs’ alternative maps
decrease the compactness of five of six districts in the same region of the State:
Reock Score Convex Hull Score Congressional Plan Romo Maps Congressional Plan Romo Maps
CD12 0.40 0.38 0.81 0.79 CD13 0.46 0.57 0.82 0.91 CD14 0.36 0.28 0.69 0.60 CD15 0.44 0.33 0.75 0.67 CD16 0.42 0.32 0.81 0.80 CD17 0.67 0.39 0.82 0.68 MEAN 0.46 0.38 0.78 0.74
Plaintiffs’ map-drawer testified that the lesser compactness of these districts is a function
of CD13 and CD14, as drawn in the alternative maps (Hawkins Dep. at 272:15-275:22.) In the
SR27.4205
Romo, et al. v. Detzner, et al. Case No. 2012-CA-000412 League of Women Voters, et al. v. Detzner, et al. Case No. 2012-CA-000490
63 MIAMI 1014554
same region, Plaintiffs are forced to divide Charlotte County, which the Congressional Plan
preserves. The Legislature properly balanced applicable standards in its construction of CD14.
194. Plaintiffs have thus failed to offer any evidence that Districts 13 and 14 violate
Article III, Section 20 of the Florida Constitution.
Districts 21 and 22
195. Plaintiffs allege that Districts 21 and 22 should have been drawn horizontally—
not, as in the Congressional Plan, vertically.
196. The configuration selected by the Legislature is reasonable and constitutional.
The districts are not visually bizarre, and their compactness scores exceed the scores that the
Supreme Court considered low. See Apportionment I, 83 So. 3d at 646, 656 (identifying districts
with low compactness scores, each of which had a Reock score less than 0.25 and a Convex Hull
score less than 0.50). Districts 21 and 22 have Reock scores of 0.28 and 0.18 and Convex Hull
scores of 0.60 and 0.61, respectively. The boundary between them divides no municipalities.
197. Plaintiffs’ alternative maps contain the same vertical pattern. Their map-drawer
testified that the vertical orientation was acceptable and appropriate (Hawkins Dep. at 271:11-
272:14.) Plaintiffs’ expert, Stephen Ansolabehere, testified that the configuration made sense
(May 28 PM Tr. 155:8-19).
198. Thus, Plaintiffs have presented no evidence that the Legislature’s decision to draw
Districts 21 and 22 was improper.
District 25
199. Plaintiffs argue that, because the enacted Congressional Plan incorporated part of
Hendry County into District 20, the Republican performance of District 25 increased in
comparison with earlier iterations of the same district.
SR27.4206
Romo, et al. v. Detzner, et al. Case No. 2012-CA-000412 League of Women Voters, et al. v. Detzner, et al. Case No. 2012-CA-000490
64 MIAMI 1014554
200. Plaintiffs fail to appreciate the requirements of Section 5 of the VRA, which
compelled the continued inclusion of Hendry County in District 20. The predecessor of District
20—Benchmark CD23—was a majority-minority district in which African-American voters
were able to elect their preferred candidates. Benchmark CD23 included part of Hendry County,
which was one of five counties in Florida protected by Section 5 of the VRA. Section 5 protects
minority voting strength only in the five covered counties—here, the voting strength of Hendry
County African-Americans. See Apportionment I, 83 So. 3d at 652-53 (noting that Section 5
protected “minority voting strength only in those counties”); Letter from Ralph F. Boyd, Jr., to
John M. McKay and Tom Feeney (July 1, 2002) (denying preclearance because House plan
retrogressed with respect to “Collier County Hispanics”). If the Legislature had removed that
portion of Hendry County from District 20, it would have deprived those Hendry County
African-Americans of the ability to elect, and afforded the Department of Justice reason to deny
preclearance. (See Order at 17 (Apr. 30, 2012) (explaining on summary judgment that “District
20 encompasses Hendry County, which is a Federal preclearance county under Section 5 of the
Voting Rights Act”).) Instead, the Legislature included in new District 20 the same Hendry
County population that previously had the ability to elect, avoiding a preclearance objection.
The contours of District 25 are a consequence of the configuration of District 20.
201. Plaintiffs’ alternative map removes Hendry County from District 20 and transfers
the entire county into District 25. Thus, under the alternative map, Hendry County African-
Americans who possessed the ability to elect in the Benchmark would have been deprived of that
ability and transferred to a predominantly Hispanic district. Dr. Ansolabehere was unable to cite
any authority to suggest that the Department of Justice would have precleared Plaintiffs’
proposed configuration, and candidly acknowledged: “I don’t know how they would treat this
SR27.4207
Romo, et al. v. Detzner, et al. Case No. 2012-CA-000412 League of Women Voters, et al. v. Detzner, et al. Case No. 2012-CA-000490
65 MIAMI 1014554
particular issue. I don’t know how the Department would treat this issue” (May 28 PM Tr.
140:23-25). The Legislature appropriately chose the safer course and maintained the ability of
Hendry County African-Americans to elect the African-American candidates of their choice, as
in the Benchmark.
202. Plaintiffs have thus failed to offer any evidence that Districts 15 and 25 violate
Article III, Section 20 of the Florida Constitution.
Districts 26 and 27
203. Plaintiffs argue that Districts 26 and 27 unconstitutionally divide the City of
Homestead. These districts were carefully drawn, however, to preserve the ability of Hispanics
to elect the candidates of their choice. Plaintiffs cannot show that it would have been possible to
preserve Homestead and also satisfy the paramount obligations in Tier One of the Constitution.
204. The Benchmark contained three districts in South Florida in which Hispanic
voters were able to elect the candidates of their choice. The expert testimony of Dr. Moreno
established that the creation of performing Hispanic districts is a sensitive and difficult task.
Hispanic voters are less cohesive than African Americans. Approximately one half of Florida’s
Hispanics are foreign born and, unless naturalized, are not entitled to vote, while some Hispanic
populations in Florida exhibit low rates of turnout. For these and other reasons, the creation of
Hispanic districts generally requires careful consideration of primary election data, and usually a
supermajority Hispanic population. See De Grandy v. Wetherell, 794 F. Supp. 1076, 1084 (N.D.
Fla. 1992) (Hatchett, Stafford, Vinson, JJ.) (“[B]ecause Hispanic communities are characterized
by a large number of noncitizens and lower voter registration rates, a super majority of the VAP
is necessary to create districts in which Hispanics can elect candidates of their choice.”).
SR27.4208
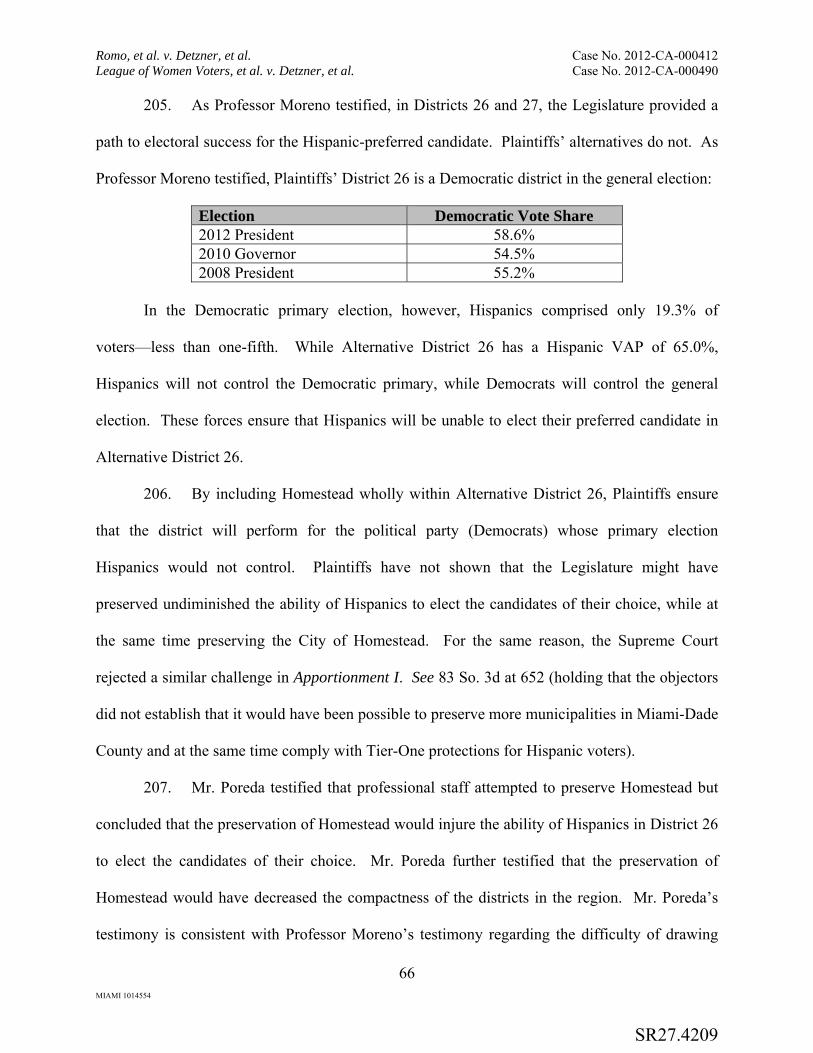
Romo, et al. v. Detzner, et al. Case No. 2012-CA-000412 League of Women Voters, et al. v. Detzner, et al. Case No. 2012-CA-000490
66 MIAMI 1014554
205. As Professor Moreno testified, in Districts 26 and 27, the Legislature provided a
path to electoral success for the Hispanic-preferred candidate. Plaintiffs’ alternatives do not. As
Professor Moreno testified, Plaintiffs’ District 26 is a Democratic district in the general election:
Election Democratic Vote Share 2012 President 58.6% 2010 Governor 54.5% 2008 President 55.2%
In the Democratic primary election, however, Hispanics comprised only 19.3% of
voters—less than one-fifth. While Alternative District 26 has a Hispanic VAP of 65.0%,
Hispanics will not control the Democratic primary, while Democrats will control the general
election. These forces ensure that Hispanics will be unable to elect their preferred candidate in
Alternative District 26.
206. By including Homestead wholly within Alternative District 26, Plaintiffs ensure
that the district will perform for the political party (Democrats) whose primary election
Hispanics would not control. Plaintiffs have not shown that the Legislature might have
preserved undiminished the ability of Hispanics to elect the candidates of their choice, while at
the same time preserving the City of Homestead. For the same reason, the Supreme Court
rejected a similar challenge in Apportionment I. See 83 So. 3d at 652 (holding that the objectors
did not establish that it would have been possible to preserve more municipalities in Miami-Dade
County and at the same time comply with Tier-One protections for Hispanic voters).
207. Mr. Poreda testified that professional staff attempted to preserve Homestead but
concluded that the preservation of Homestead would injure the ability of Hispanics in District 26
to elect the candidates of their choice. Mr. Poreda further testified that the preservation of
Homestead would have decreased the compactness of the districts in the region. Mr. Poreda’s
testimony is consistent with Professor Moreno’s testimony regarding the difficulty of drawing
SR27.4209
Romo, et al. v. Detzner, et al. Case No. 2012-CA-000412 League of Women Voters, et al. v. Detzner, et al. Case No. 2012-CA-000490
67 MIAMI 1014554
performing Hispanic districts in Miami-Dade County. Thus, the Legislature’s configuration of
Districts 25, 26, and 27 was a reasonable design which ensures that Hispanics have the
opportunity to elect candidates of their choice in South Florida.
208. Plaintiffs have failed to offer any evidence that Districts 26 and 27 violate Article
III, Section 20 of the Florida Constitution.
F. Adverse Inference. 209. Plaintiffs also asked this Court to make an adverse inference of improper intent,
alleging that the Legislative Parties destroyed relevant evidence during the redistricting process.
210. As noted above, the unrebutted testimony at trial is that the Legislature retained
records in accordance with legislative rules during the redistricting process, which mandate the
retention of documents of archival value. Plaintiffs do not dispute this fact, nor do they identify
any relevant evidence that was destroyed by the Legislature. There is no evidence that the
Legislature selectively discarded records related to redistricting, or that it departed from the long-
standing and even-handed record-retention protocols applicable to all legislative business. In
fact, any evidence of departure from normal protocols tipped overwhelmingly in the direction of
providing more extensive public records than is the norm through the Legislature’s redistricting
websites and productions for this case.
211. Accordingly, no adverse inference is appropriate in this case.
G. Invalidity of Amendment 6 Under the Elections Clause.
212. In the alternative, the Court concludes that Amendment 6 was not enacted in
accordance with the Elections Clause of the United States Constitution, and is therefore invalid.
213. The Elections Clause of the United States Constitution provides that the “Times,
Places and Manner of holding Elections for Senators and Representatives, shall be prescribed in
SR27.4210

Romo, et al. v. Detzner, et al. Case No. 2012-CA-000412 League of Women Voters, et al. v. Detzner, et al. Case No. 2012-CA-000490
68 MIAMI 1014554
each State by the Legislature thereof.” Art. I, § 4, cl. 1, U.S. Const. (emphasis added). The
authority conferred by the Elections Clause to regulate congressional elections includes the
establishment of congressional district boundaries. Branch v. Smith, 538 U.S. 254, 266 (2003).
214. Amendment 6, which regulates the manner of holding elections for Congress, was
not enacted by the Legislature. It was a constitutional amendment enacted by citizen initiative
wholly outside and contrary to the manner prescribed for legislative acts. It therefore conflicts
with the Elections Clause of the United States Constitution, and is void and unenforceable.
215. The contrary determination of the Eleventh Circuit in Brown v. Secretary of State
of Florida, 668 F.3d 1271 (11th Cir. 2012), is erroneous. Amendment 6 regulates the “Manner”
of conducting congressional elections. It prescribes how congressional elections will be held:
congressional elections will be held, for example, in compact districts that utilize political and
geographical boundaries. And the enactment of Amendment 6 by initiative petition runs afoul of
the plain constitutional text, which empowers only state legislatures (subject to oversight by
Congress) to regulate federal elections. The Supreme Court has long understood this to mean
that election regulation “must be in accordance with the method which the state has prescribed
for legislative enactments.” Smiley v. Holm, 285 U.S. 355, 367 (1932; accord Ohio ex rel. Davis
v. Hildebrant, 241 U.S. 565, 569 (1916). And in Florida, the method prescribed for legislative
enactments is the enactment of bills by the Legislature. See Art. III, § 1, Fla. Const. (“The
legislative power of the state shall be vested in a legislature of the State of Florida . . . .”).
216. Amendment 6 is invalid because it was enacted outside Florida’s legislative
process, and the decision in Brown reads the words “by the Legislature” out of the Constitution.
The Eleventh Circuit’s conclusion that Amendment 6 is constitutional does not bind this Court.
See Doe v. Pryor, 344 F.3d 1282, 1286 (11th Cir. 2003); State v. Dwyer, 332 So. 2d 333, 335
SR27.4211
Romo, et al. v. Detzner, et al. Case No. 2012-CA-000412 League of Women Voters, et al. v. Detzner, et al. Case No. 2012-CA-000490
69 MIAMI 1014554
(Fla. 1976). Because Amendment 6 purports to regulate congressional elections but was not
adopted in the mode prescribed by the Elections Clause of the United States Constitution, it is
unenforceable and unconstitutional.
CONCLUSION
Plaintiffs have failed to meet their burden of demonstrating that the Congressional Plan
violates the standards set forth in Article III, Section 20 of the Florida Constitution.
It is hereby ORDERED and ADJUDGED that judgment is entered in favor of
Defendants and against Plaintiffs with respect to all claims set forth in Plaintiffs’ complaints.
DONE AND ORDERED in Tallahassee, Florida this ____ day of _______________,
2014.
_______________________________________ TERRY P. LEWIS CIRCUIT COURT JUDGE
cc: All counsel of record
SR27.4212
Romo, et al. v. Detzner, et al. Case No. 2012-CA-000412 League of Women Voters, et al. v. Detzner, et al. Case No. 2012-CA-000490
70 MIAMI 1014554
/s/ Raoul G. Cantero Raoul G. Cantero Florida Bar No. 552356 Jason N. Zakia Florida Bar No. 698121 Jesse L. Green Florida Bar No. 95591 White & Case LLP Southeast Financial Center 200 S. Biscayne Blvd., Suite 4900 Miami, Florida 33131-2352 Telephone: (305) 371-2700 Facsimile: (305) 358-5744 E-mail: [email protected] E-mail: [email protected] E-mail: [email protected] George T. Levesque Florida Bar No. 555541 General Counsel, The Florida Senate 305 Senate Office Building 404 South Monroe Street Tallahassee, Florida 32399-1100 Telephone: (850) 487-5237 E-mail: [email protected] Attorneys for Defendants, Florida Senate and President Don Gaetz
Respectfully submitted, /s/ George N. Meros, Jr. Charles T. Wells Florida Bar No. 086265 George N. Meros, Jr. Florida Bar No. 263321 Jason L. Unger Florida Bar No. 0991562 Andy Bardos Florida Bar No. 822671 Gray Robinson, P.A. Post Office Box 11189 Tallahassee, Florida 32302 Telephone: (850) 577-9090 E-mail: [email protected] E-mail: [email protected] E-mail: [email protected] E-mail: [email protected] Daniel E. Nordby Florida Bar No. 14588 General Counsel, The Florida House of Representatives 422 The Capitol 402 South Monroe Street Tallahassee, Florida 32399-1300 Telephone: 850-717-5500 E-mail: [email protected] Attorneys for Defendants, the Florida House of Representatives and Speaker Will Weatherford
SR27.4213

Romo, et al. v. Detzner, et al. Case No. 2012-CA-000412 League of Women Voters, et al. v. Detzner, et al. Case No. 2012-CA-000490
71 MIAMI 1014554
CERTIFICATE OF SERVICE
I certify that a copy of the foregoing was served by electronic transmission on June 13,
2014, to the persons listed on the following Service List.
By: /s/ Raoul G. Cantero
Raoul G. Cantero
SR27.4214

Romo, et al. v. Detzner, et al. Case No. 2012-CA-000412 League of Women Voters, et al. v. Detzner, et al. Case No. 2012-CA-000490
72 MIAMI 1014554
SERVICE LIST
Abha Khanna Kevin J. Hamilton Ryan Spear Perkins Coie, LLP 1201 Third Avenue, Ste. 4800 Seattle, WA 98101-3099 Telephone: (206) 359-8000 Facsimile: (206) 359-9000 E-mail: [email protected] E-mail: [email protected] E-mail: [email protected] Mark Herron Robert Telfer Angelina Perez Messer Caparello & Self, P.A. Post Office Box 1876 Tallahassee, FL 32302-1876 Telephone: 850-222-0720 E-mail: [email protected] E-mail: [email protected] E-mail: [email protected]
John M. Devaney Mark Erik Elias Elisabeth C. Frost Perkins Coie, LLP 700 Thirteenth Street, NW, Ste. 700 Washington, DC 20005 Telephone: (202) 654-6200 Facsimile: (202) 654-6211 E-mail: [email protected] E-mail: [email protected] E-mail: [email protected]
Attorneys for Respondents Rene Romo, Benjamin Weaver, William Everett Warinner, Jessica Barrett, June Keener, Richard Quinn Boylan and Bonita Agan
J. Andrew Atkinson Ashley Davis Florida Department Of State R.A. Gray Building 500 S. Bronough Street Tallahassee, FL 32399 Telephone: (850) 245-6536 E-mail: [email protected] E-mail: [email protected] Attorneys for Respondent Ken Detzner, in his Official Capacity as Florida Secretary of State
Blaine H. Winship Office Of Attorney General Capitol, Pl-01 Tallahassee, FL 32399-1050 Telephone: (850) 414-3300 Facsimile: (850) 401-1630 E-Mail: [email protected] Attorneys for Pam Bondi, in her capacity as Florida Attorney General
SR27.4215

Romo, et al. v. Detzner, et al. Case No. 2012-CA-000412 League of Women Voters, et al. v. Detzner, et al. Case No. 2012-CA-000490
73 MIAMI 1014554
Gerald E. Greenberg Adam M. Schachter Gelber Schachter & Greenberg, P.A. 1441 Brickell Avenue, Suite 1420 Miami, FL 33131 Telephone: (305) 728-0950 Facsimile: (305) 728-0951 E-mail: [email protected] E-mail: [email protected]
David B. King Thomas A. Zehnder King Blackwell Zehnder Wermuth P.A. P.O. Box 1631 Orlando, FL 32802-1631 Telephone: (407) 422-2472 E-mail: [email protected] E-mail: [email protected]
Jessica Ring Amunson Paul Smith Michael B. DeSanctis Jenner & Block LLP 1099 New York Ave, N.W., Ste. 900 Washington, DC 20001-4412 Telephone: (202) 639-6023 Facsimile: (202) 661-4993 E-mail: [email protected] E-mail: [email protected] E-mail: [email protected]
Ronald Meyer Lynn Hearn Meyer, Brooks, Demma and Blohm, P.A. 131 North Gadsden Street Post Office Box 1547 (32302) Tallahassee, FL 32301 Telephone: (850) 878-5212 Facsimile: (850) 656-6750 E-mail: [email protected] E-mail: [email protected] J. Gerald Hebert 191 Somervelle Street, #405 Alexandria, VA 22304 Telephone: (703) 628-4673 E-mail: [email protected]
Attorneys for Petitioners The League of Women Voters of Florida, The National Council of La Raza, Common Cause Florida; Robert Allen Schaeffer, Brenda Ann Holt, Roland Sanchez-
Medina, Jr., and John Steele Olmstead Michael A. Carvin Louis K. Fisher Jones Day 51 Louisiana Avenue, N.W. Washington, DC 20001 Telephone: (202) 879-7643 Facsimile: (202) 626-1700 E-mail: [email protected] E-mail: [email protected] Attorneys for the Florida Senate and President Don Gaetz
SR27.4216

74 MIAMI 1014554
Victor L. Goode Dorcas R. Gilmore NAACP 4805 Mt. Hope Drive Baltimore, MD 21215-3297 Telephone: (410) 580-5790 Facsimile: (410) 358-9350 E-mail: [email protected] E-mail: [email protected] Benjamin James Stevenson American Civil Liberties Union of Florida Foundation Post Office Box 12723 Pensacola, FL 32591-2723 Telephone: (786) 363-2738 Facsimile: (786) 363-1985 E-mail: [email protected]
Allison J. Riggs Anita S. Earls Southern Coalition For Social Justice 1415 West Highway 54, Ste. 101 Durham, NC 27707 Telephone: (919) 323-3380 Facsimile: (919) 323-3942 E-mail: [email protected] E-mail: [email protected]
Attorneys for the Florida State Conference of NAACP Branches
SR27.4217

TAB 2

Compactness ScoresSplit Counties and Cities
MapMean Reock
Mean Convex Hull
SplitCounties
Split Cities
9001 0.39 0.74 24 519003 0.40 0.74 26 579005 0.39 0.73 22 509007 0.40 0.73 24 559009 0.41 0.75 26 529011 0.42 0.74 22 489013 0.40 0.74 23 58
Note: Reock and Convex Hull scores range from 0 (low) to 1 (perfect). 1
SR27.4218
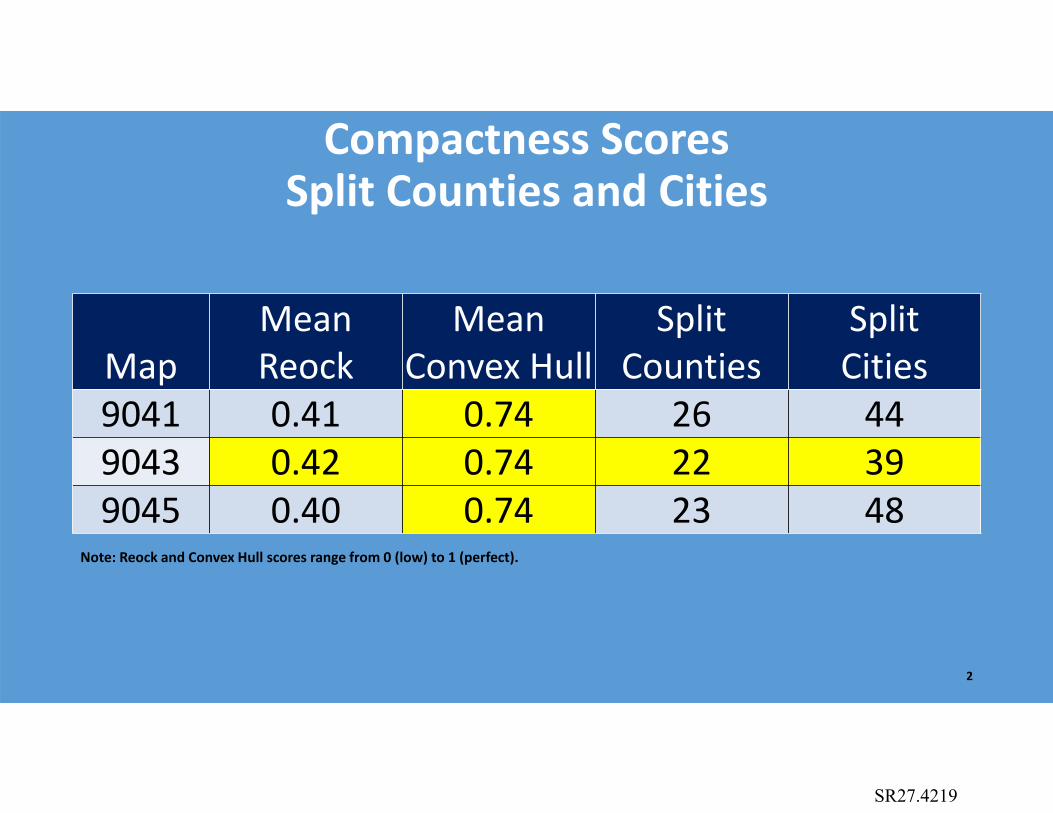
Compactness ScoresSplit Counties and Cities
MapMean Reock
Mean Convex Hull
SplitCounties
Split Cities
9041 0.41 0.74 26 449043 0.42 0.74 22 399045 0.40 0.74 23 48
Note: Reock and Convex Hull scores range from 0 (low) to 1 (perfect).
2
SR27.4219
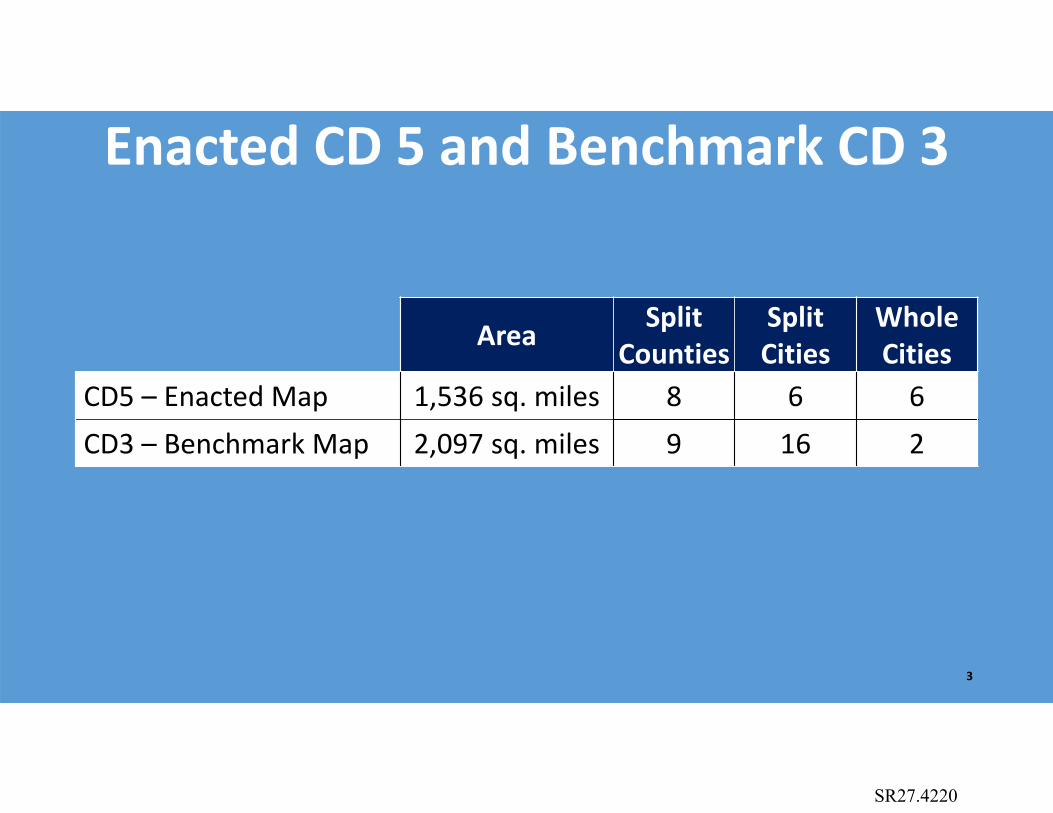
Enacted CD 5 and Benchmark CD 3
Area Split Counties
SplitCities
WholeCities
CD5 – Enacted Map 1,536 sq. miles 8 6 6CD3 – Benchmark Map 2,097 sq. miles 9 16 2
3
SR27.4220

Compactness ScoresSplit Counties and Cities
Note: Reock and Convex Hull scores range from 0 (low) to 1 (perfect).
MapMean Reock
Mean Convex Hull
SplitCounties
Split Cities
9011 0.42 0.74 22 489043 0.42 0.74 22 399047 0.40 0.72 21 27
4
SR27.4221
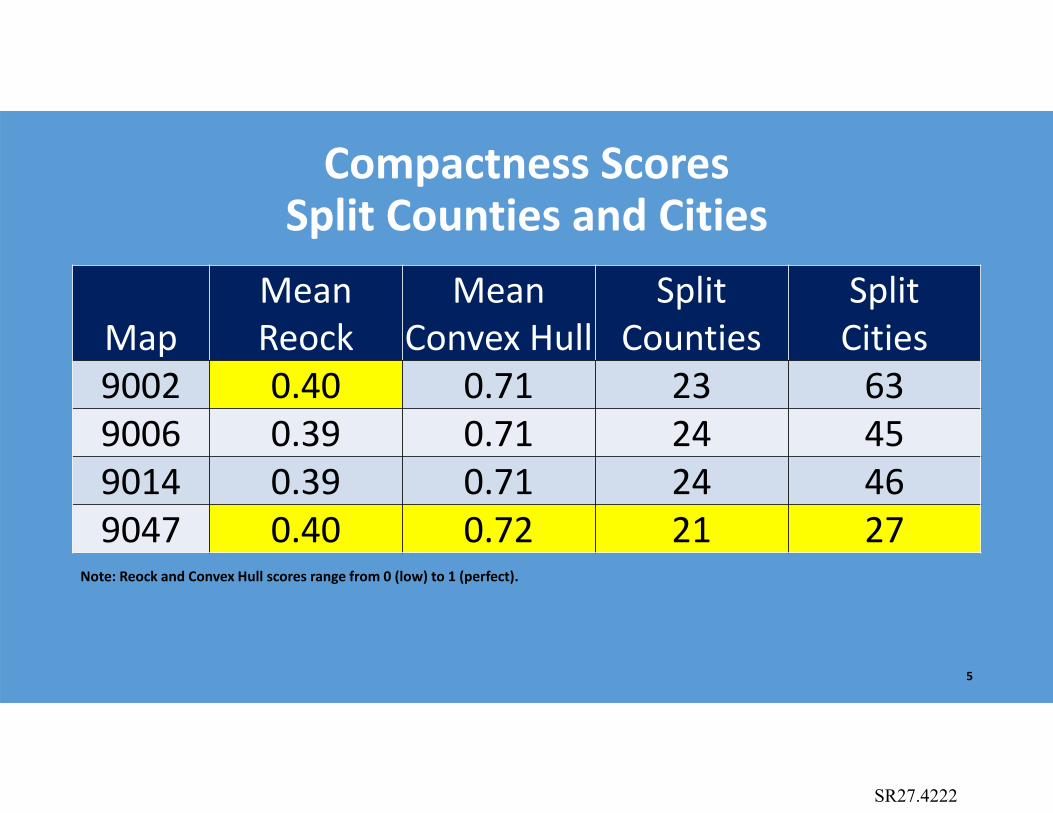
Compactness ScoresSplit Counties and Cities
Note: Reock and Convex Hull scores range from 0 (low) to 1 (perfect).
MapMean Reock
Mean Convex Hull
SplitCounties
Split Cities
9002 0.40 0.71 23 639006 0.39 0.71 24 459014 0.39 0.71 24 469047 0.40 0.72 21 27
5
SR27.4222
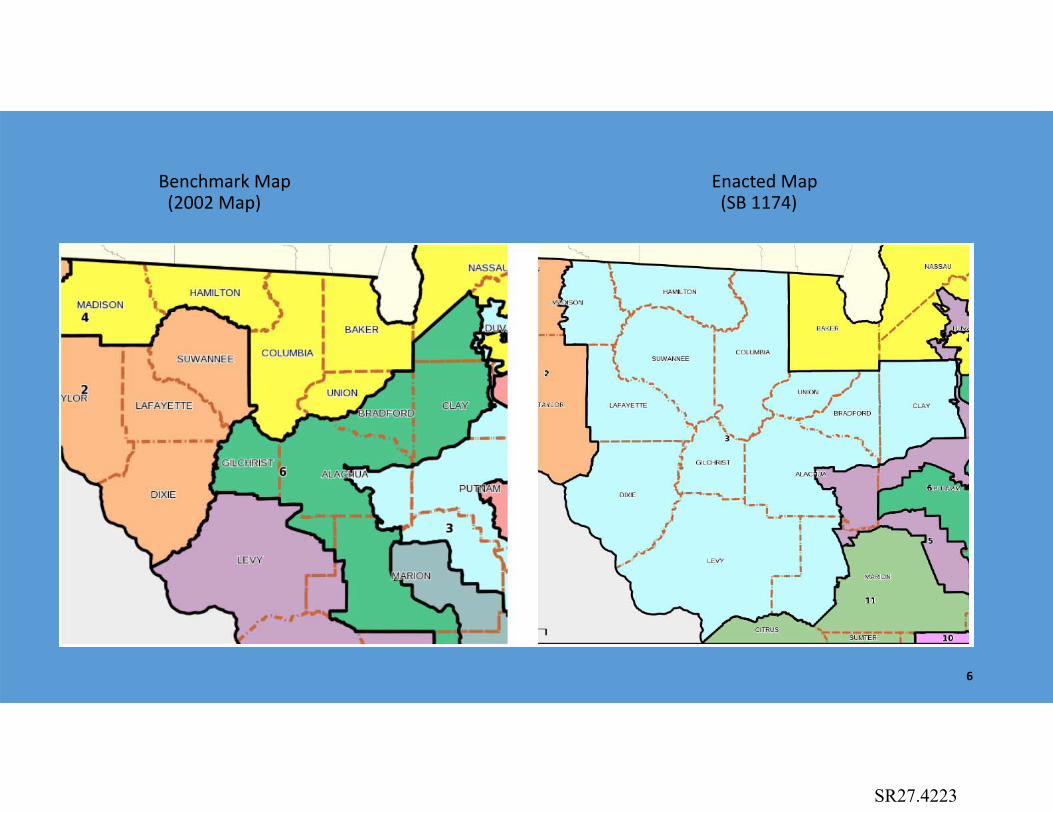
Benchmark Map Enacted Map(2002 Map) (SB 1174)
6
SR27.4223

Benchmark Map (2002 Map)
Enacted Map (SB 1174)
7
SR27.4224
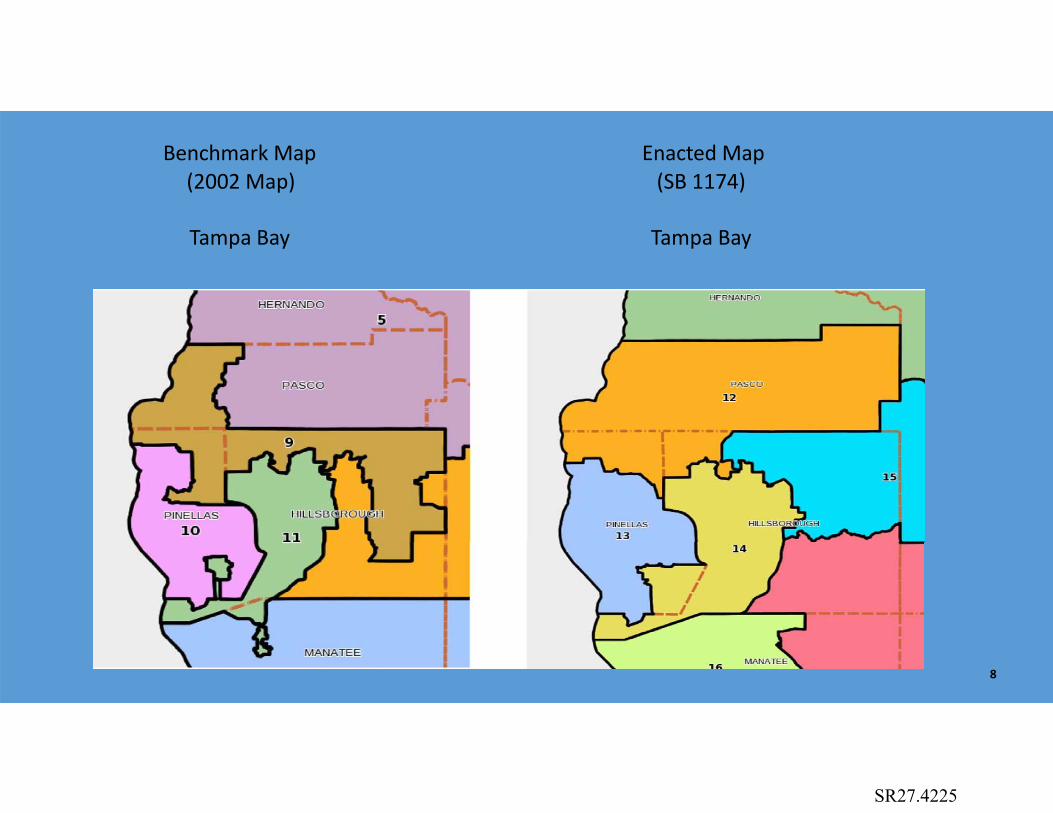
Benchmark Map Enacted Map (2002 Map) (SB 1174)
Tampa Bay Tampa Bay
8
SR27.4225

Benchmark Map (2002 Map)
Enacted Map (SB 1174)
9
SR27.4226

Benchmark Map Enacted Map •(2002 Map) (SB 1174)
•Martin and Martin and St. Lucie Counties St. Lucie Counties
11
SR27.4227

Mean Reock Scorenote: range is from 0 (low) to 1 (perfect)
(higher number means district shapes more like a circle)
Map Mean Reock ScoreEnacted 0.40Romo A 0.37Romo B 0.37
2002 Benchmark 0.30
12
SR27.4228
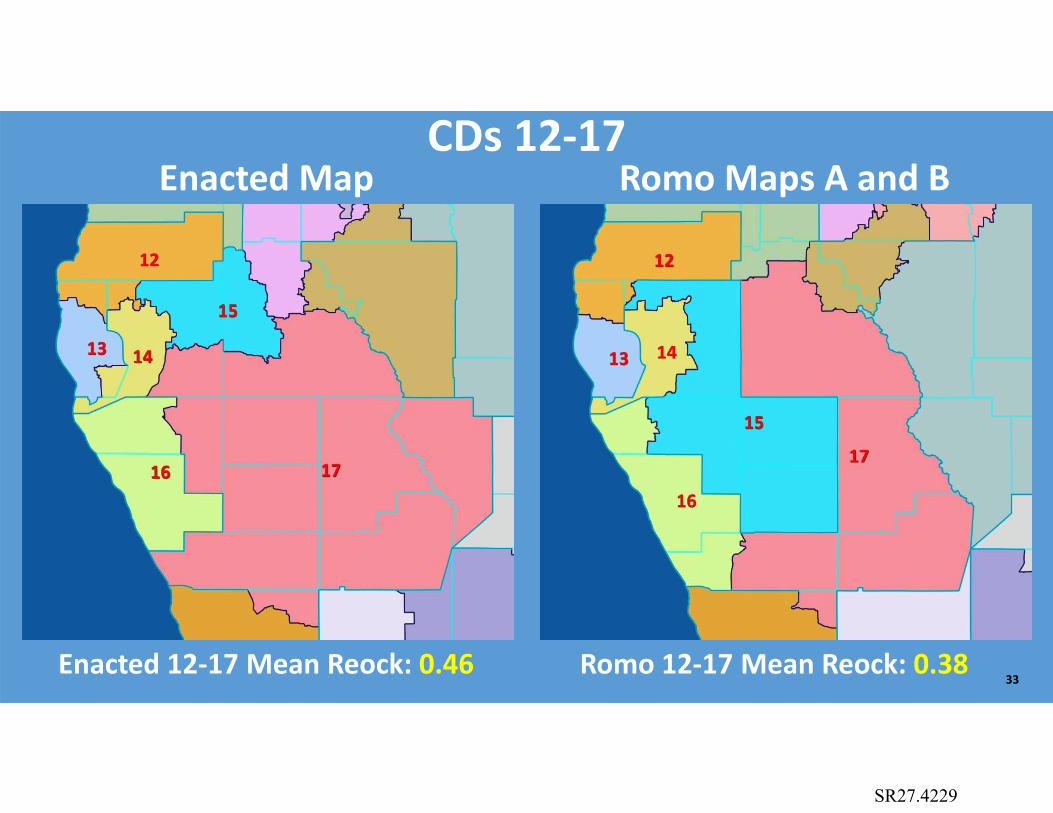
CDs 12-17Enacted Map Romo Maps A and B
Enacted 12-17 Mean Reock: 0.46 Romo 12-17 Mean Reock: 0.3833
SR27.4229

CDs 21 and 22Enacted Map Romo Maps A and B
Enacted 21 and 22 Mean Reock: 0.23
Mean Convex Hull: 0.61
Romo 21 and 22 Mean Reock: 0.25
Mean Convex Hull: 0.57
21
22
21
22
37
SR27.4230

CD 9Enacted Map Romo Maps A and B
Enacted CD 9 Hispanic VAP: 41.39% Romo CD 9 Hispanic VAP: 41.72%
9 9
38
SR27.4231
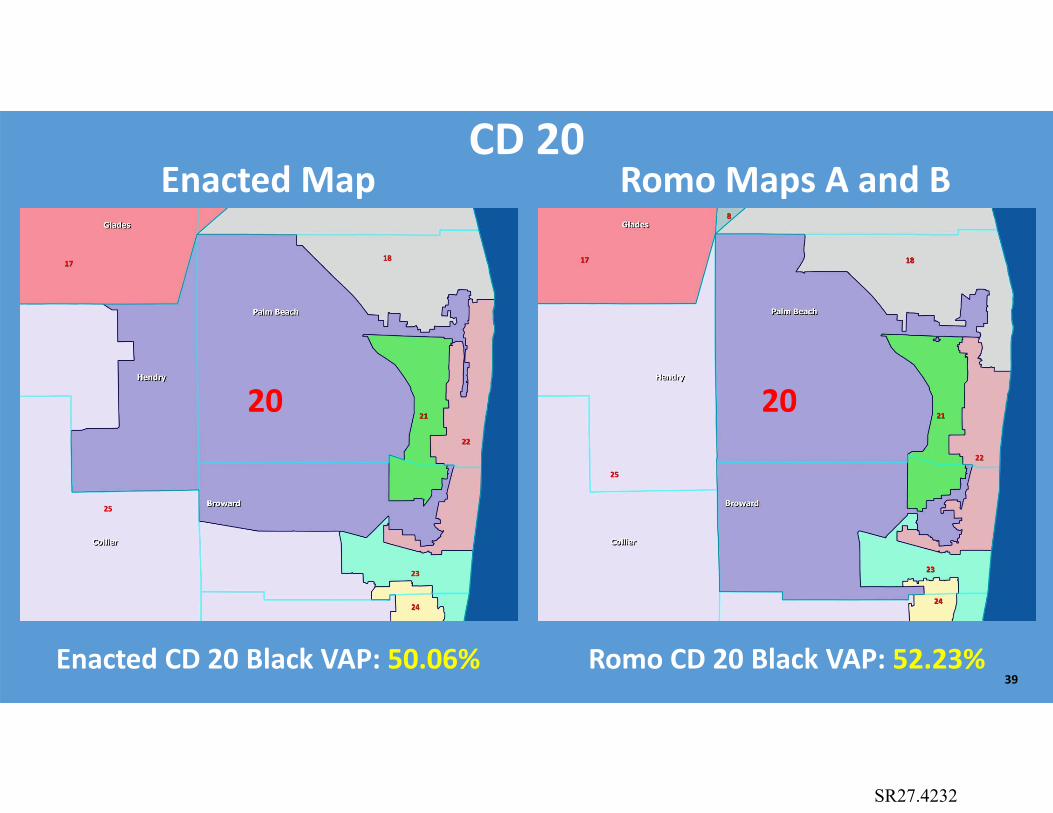
CD 20Enacted Map Romo Maps A and B
Enacted CD 20 Black VAP: 50.06% Romo CD 20 Black VAP: 52.23%
20 20
39
SR27.4232

TAB 3

Terraferma Map Enacted Plan
SR27.4233

Enacted Plan
26
Terraferma Map
SR27.4234
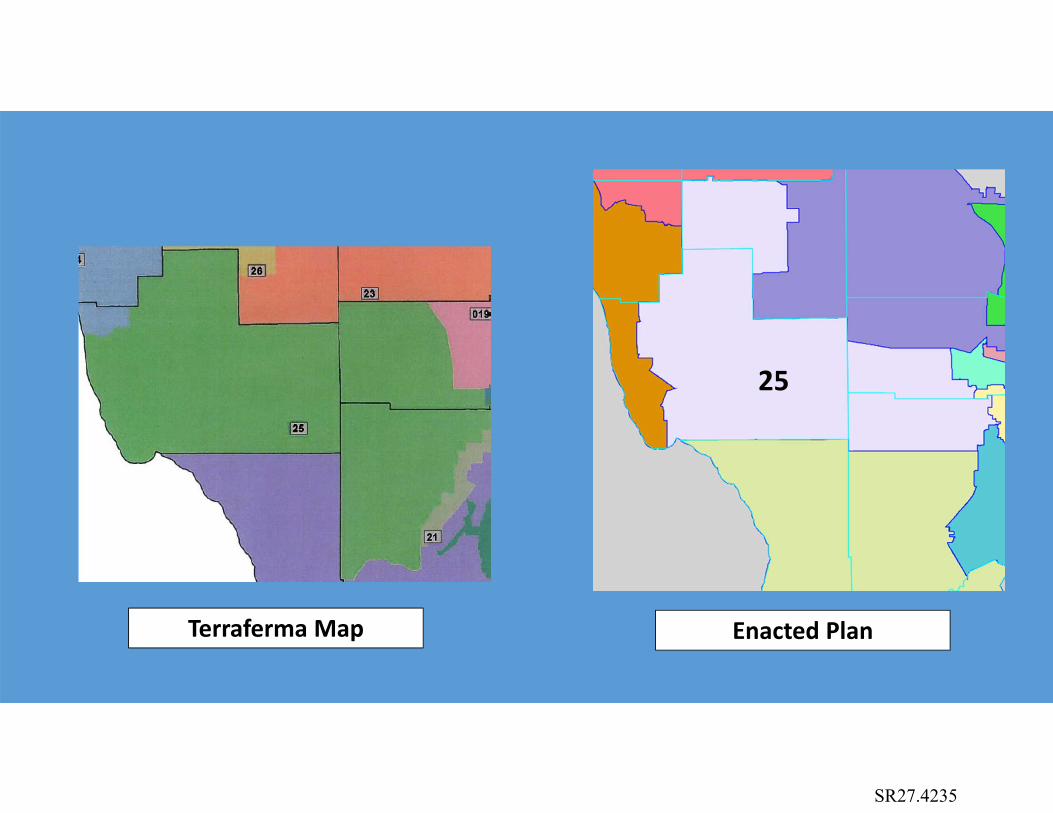
Terraferma Map Enacted Plan
25
SR27.4235

Terraferma Map Enacted Plan
9
SR27.4236
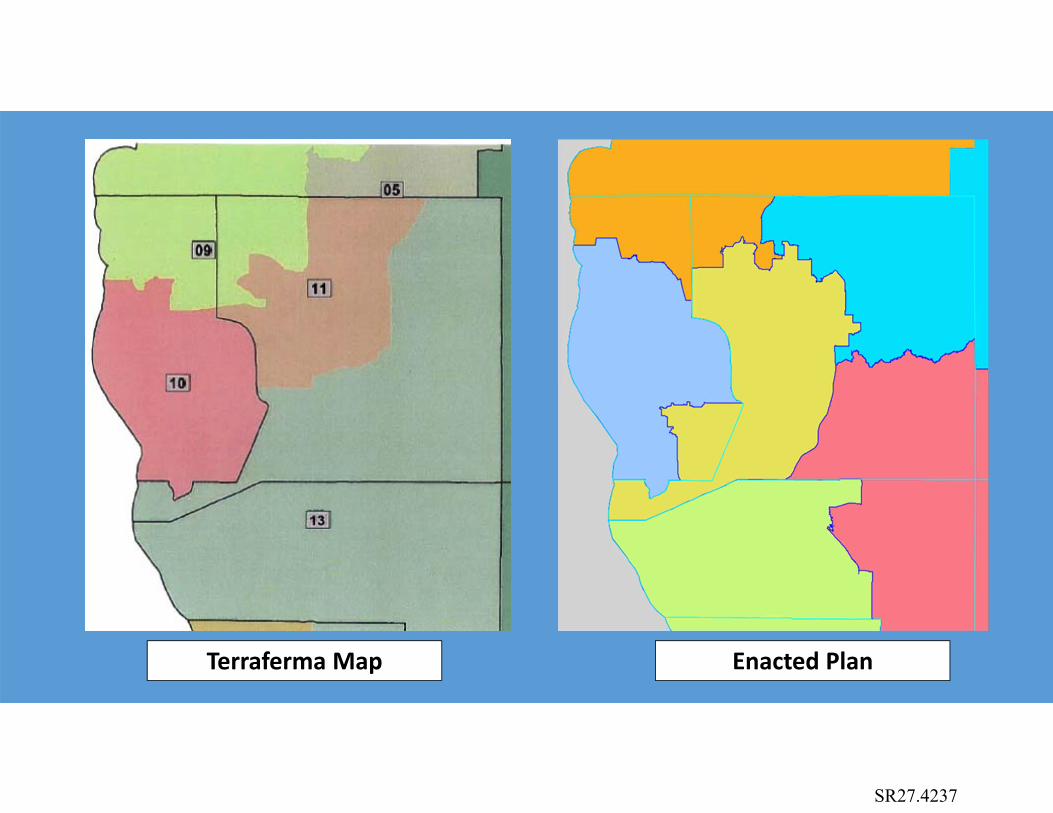
Terraferma Map Enacted Plan
SR27.4237

Terraferma Map:The Finger to Ocala
Enacted Plan:No Finger to Ocala
SR27.4238

Terraferma Map:The Finger to Ocala
Romo Map B:The Same Finger to Ocala
SR27.4239

TAB 4
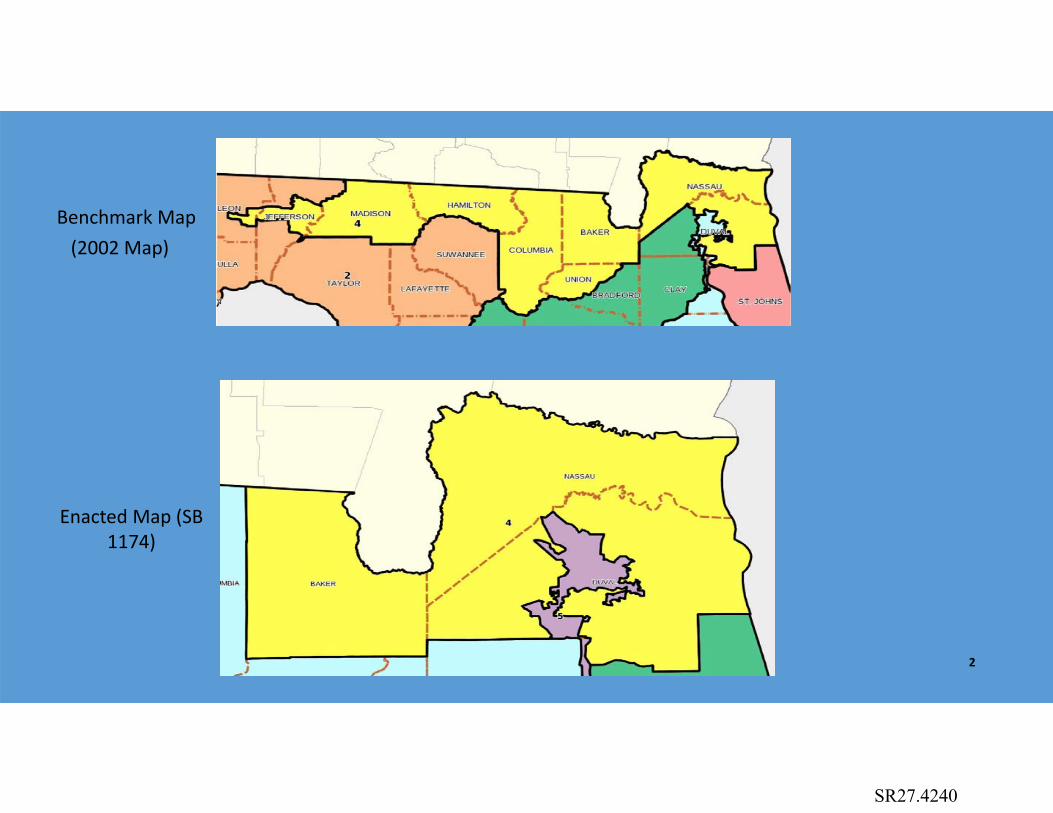
Benchmark Map (2002 Map)
Enacted Map (SB 1174)
2
SR27.4240

Mean Reock Scorenote: range is from 0 (low) to 1 (perfect)
(higher number means district shapes more like a circle)
Map Mean Reock ScoreEnacted 0.40Romo A 0.37Romo B 0.37
2002 Benchmark 0.30
4
SR27.4241

Mean Convex Hull Scorenote: range is from 0 (low) to 1 (perfect)
(higher number means district shapes more like a convex polygon)
Map Mean Convex Hull ScoreEnacted 0.72Romo A 0.71Romo B 0.69
2002 Benchmark 0.63
5
SR27.4242

Number of Split Counties
Map Split CountiesEnacted 21Romo A 23Romo B 25
2002 Benchmark 30
6
SR27.4243

Number of Split Cities
Map Split CitiesEnacted 27Romo A 28Romo B 30
2002 Benchmark 110
7
SR27.4244

CD 5Enacted Map Romo Map A
Enacted CD 5 CompactnessPerimeter: 707 miles
End-to-End: 144 milesArea: 1,536 sq. miles
Romo A CD 5 CompactnessPerimeter: 711 miles
End-to-End: 206 milesArea: 3,911 sq. miles
8
SR27.4245

CD 5Enacted Map Romo Map B
Enacted CD 5 CompactnessPerimeter: 707 miles
End-to-End: 144 milesArea: 1,536 sq. miles
Romo B CD 5 CompactnessPerimeter: 931 miles
End-to-End: 204 milesArea: 4,440 sq. miles
9
SR27.4246

CD 2Enacted Map CD 2 Romo Map A CD 2
Enacted CD 2 CompactnessReock: 0.46
Convex Hull: 0.78End-to-End: 167 miles
Perimeter: 550 miles
22
Romo Map A CD 2 CompactnessReock: 0.29
Convex Hull: 0.62End-to-End: 241 milesPerimeter: 1,010 miles 14
SR27.4247

Romo Map (A and B) CD-10
10
18
SR27.4248

Enacted CD 10 “appendage” compared to Romo A & B CD 7 “appendage”
Enacted CD 10 Romo A & B CD 7 19
SR27.4249

CDs 12-17Enacted Map Romo Maps A and B
Enacted 12-17 Mean Reock: 0.46 Romo 12-17 Mean Reock: 0.3820
SR27.4250
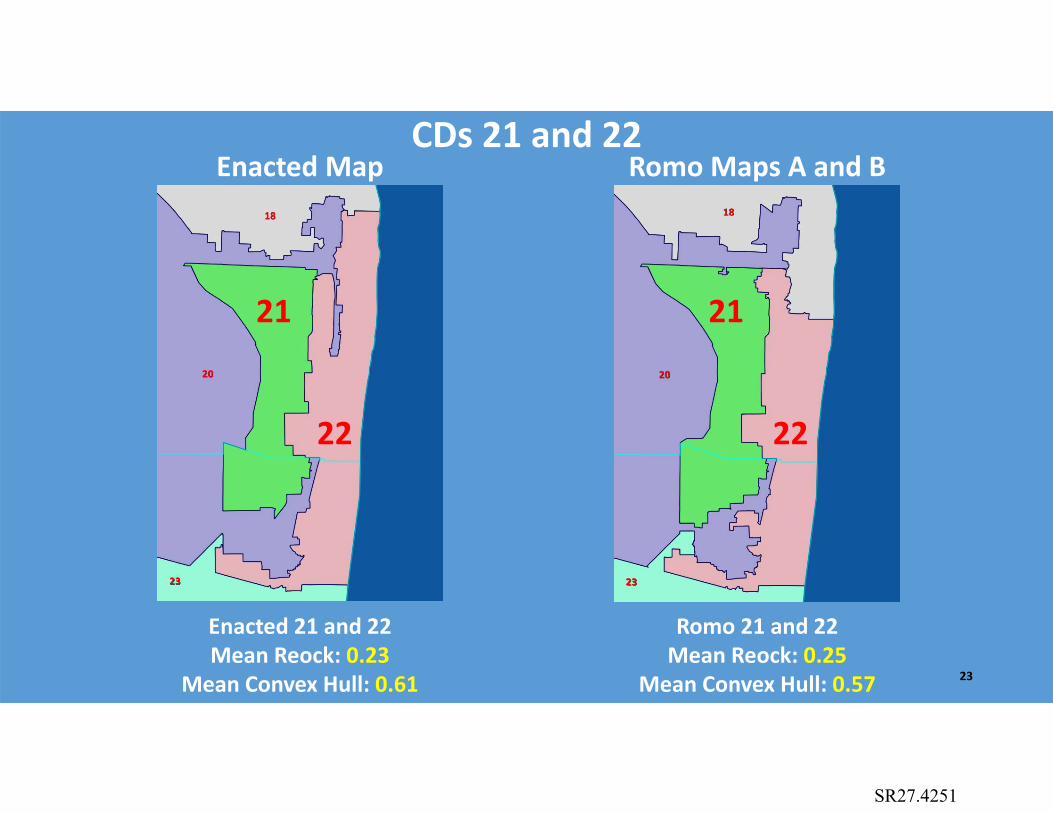
CDs 21 and 22Enacted Map Romo Maps A and B
Enacted 21 and 22 Mean Reock: 0.23
Mean Convex Hull: 0.61
Romo 21 and 22 Mean Reock: 0.25
Mean Convex Hull: 0.57
21
22
21
22
23
SR27.4251

CD 9Enacted Map Romo Maps A and B
Enacted CD 9 Hispanic VAP: 41.39% Romo CD 9 Hispanic VAP: 41.72%
9 9
24
SR27.4252

CD 20Enacted Map Romo Maps A and B
Enacted CD 20 Black VAP: 50.06% Romo CD 20 Black VAP: 52.23%
20 20
25
SR27.4253

TAB 5
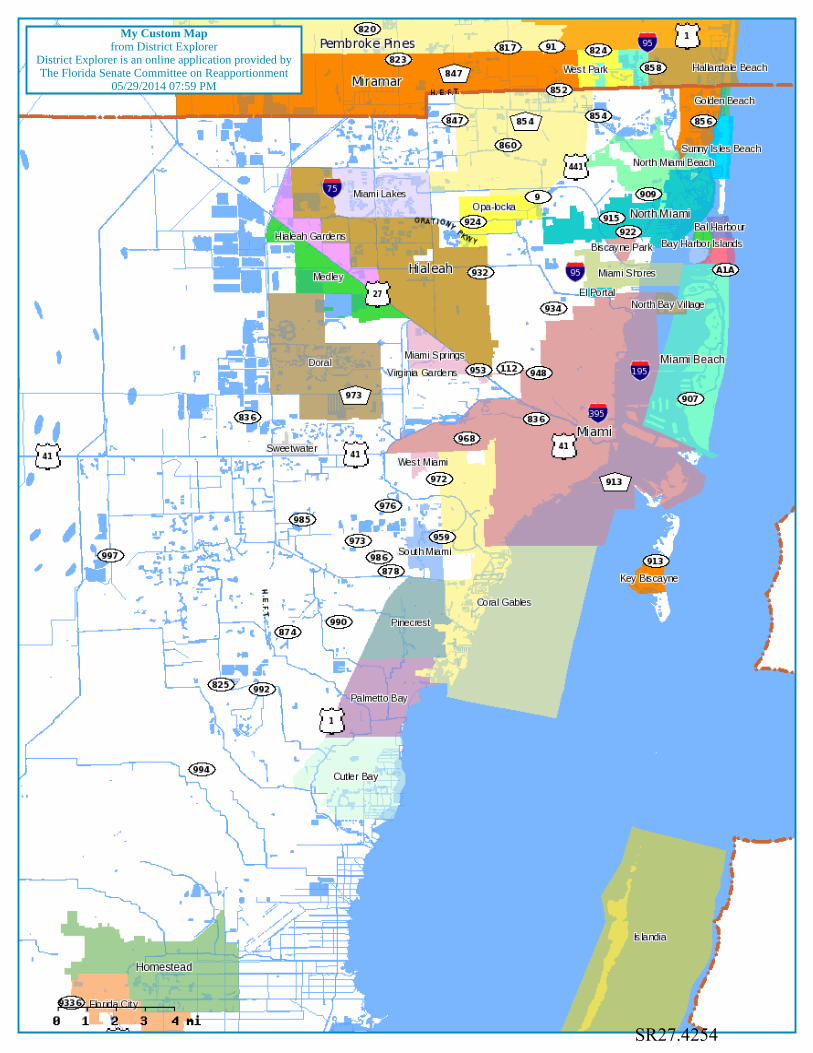
My Custom Mapfrom District Explorer
District Explorer is an online application provided byThe Florida Senate Committee on Reapportionment
05/29/2014 07:59 PM
SR27.4254

TAB 6

LegendCounty boundaryInterstateUS HighwayMajor roadSea, lake, or riverDistrict boundary & number10
0 10 20 30 40 50 605Miles
Scale bar
6
2
10Clearwater
Dunedin
Perry
Yankeetown
Lake City
Longboat Key
Live Oak
Chiefland
Lee
Seminole
Crystal River
Trenton
Bell
MonticelloJennings
JasperMadison
New Port Richey
Cedar Key
Cross City
Mayo
Otter Creek
Horseshoe Beach
LEVY
TAYLOR
DIXIE
PASCO
CITRUS
MADISON COLU
MBI
ALEON
PINELLA
S
SUWANNEE
JEFF
ERSO
N
HAMILTON
LAFAYETTE GILC
HR
IST
6
12
7
4
21
5
3
26
23
15
18
16
27
8
13
14
25
9
2
11
24
10
19
17
22
20
Jacksonville
Tampa
Bunnell
Orlando
Cape Coral
St. Petersburg
Port St. Lucie
Lakeland
Miami
Palm Coast
Ocala
North Port
Palm Bay
Bartow
Davie
NewberryGainesville
Deltona
Sanibel
Fort Myers
Alachua
Daytona Beach
Fellsmere
Wildwood
Titusville
Wellington
Jupiter
Sanford
Dunedin
West Palm Beach
Winter Haven
Sarasota
Hialeah
Leesburg
DeBary
Plant City
Coral Gables
Boca Raton
Doral
Palm Beach Gardens
Cocoa
Venice
Port Orange
Sunrise
Bay Lake
Naples
Fort Pierce
DeLand
Ocoee
Edgewater
Oviedo
Grant-Valkaria
St. Cloud
LaBelle
Mascotte
Lake Wales
Clermont
Yankeetown
Bradenton
Marco Island
Punta Gorda
Haines City
Sebring
Stuart
Oak Hill
Frostproof
Homestead
Lake City
Rockledge
Palatka
Apopka
Pierson
Delray Beach
Starke
Vero Beach
Archer
St. Augustine
Brooksville
Live Oak
Lady Lake
Inverness
Zephyrhills
Avon Park
Williston
Chiefland
Dunnellon
Dade City
Center Hill
Interlachen
Lee
Crystal River
Arcadia
Belle Glade
Fort Meade
Clewiston
Temple Terrace
HawthorneTrenton
Macclenny
Orange Park
Wauchula
BellWaldo
JenningsJasper
Fort Myers Beach
Okeechobee
Belleview
Lake Placid
New Port Richey
Jupiter Island
Lake Butler
Fernandina Beach
Polk City
Cedar Key
HastingsCross City
Callahan
Mayo
ReddickOtter Creek
Everglades
Penney Farms
Moore Haven
Horseshoe Beach
POLK
LEE
COLLIER
LEVY
LAKE
MARION
MIAMI-DADE
MONROE
PALM BEACH
BREVARD
VOLUSIA
OSCEOLA
DIXIE
HENDRY
DUVAL
PASCO
BROWARD
CLAY
GLADES
ORANGE
CITRUS
ALACHUA
PUTNAM
MARTIN
HIGHLANDS
MANATEE
ST. JOHNS
BAKER
HILLSBOROUGH
DESOTO
HARDEE
COLU
MBI
A
ST. LUCIE
SUM
TER
CHARLOTTE
SARASOTA
OKEECHOBEE
PINELLA
S
FLAGLER
SUWANNEE
TAYLO
R
NASSAU
HERNANDO
MADISON
HAMILTON
LAFAYETTE
INDIAN RIVER
UNION
GILC
HR
IST
BRADFORD
S000C900228-Nov-2011
PCS 7032 by Senate Reapportionment Committee (23-3); 6-Dec-2011
6
2
10Clearwater
Dunedin
Perry
Yankeetown
Lake City
Longboat Key
Live Oak
Chiefland
Lee
Seminole
Crystal River
Trenton
Bell
MonticelloJennings
JasperMadison
New Port Richey
Cedar Key
Cross City
Mayo
Otter Creek
Horseshoe Beach
LEVY
TAYLOR
DIXIE
PASCO
CITRUS
MADISON COLU
MBI
ALEON
PINELLA
S
SUWANNEE
JEFF
ERSO
N
HAMILTON
LAFAYETTE GILC
HR
IST
6
12
7
2
4
21
5
3
26
23
15
18
8
16
27
14
25
9
13
11
24
10
19
22
2017
Jacksonville
Tampa
Bunnell
Orlando
Cape Coral
St. Petersburg
Port St. Lucie
Lakeland
Miami
Palm Coast
Ocala
North Port
Palm Bay
Bartow
Davie
NewberryGainesville
Deltona
Sanibel
Fort Myers
Alachua
Daytona Beach
Fellsmere
Wildwood
Titusville
Wellington
Clearwater
Jupiter
Sanford
Dunedin
West Palm Beach
Winter Haven
Sarasota
Hialeah
Leesburg
DeBary
Plant City
Coral Gables
Boca Raton
Doral
Palm Beach Gardens
Cocoa
Venice
Port Orange
Sunrise
Bay Lake
Naples
Fort Pierce
DeLand
Ocoee
Edgewater
Oviedo
Grant-Valkaria
St. Cloud
LaBelle
Mascotte
Perry
Lake Wales
Clermont
Yankeetown
Bradenton
Marco Island
Punta Gorda
Haines City
Sebring
Stuart
Oak Hill
Frostproof
Homestead
Lake City
Rockledge
Palatka
Apopka
Pierson
Delray Beach
Starke
Vero Beach
Archer
St. Augustine
Brooksville
Live Oak
Lady Lake
Inverness
Zephyrhills
Avon Park
Williston
Chiefland
Dunnellon
Dade City
Center Hill
Interlachen
Lee
Seminole
Crystal River
Arcadia
Belle Glade
Fort Meade
Clewiston
HawthorneTrenton
Macclenny
Orange Park
Wauchula
Bell
Monticello
Waldo
JenningsJasper
Fort Myers Beach
Okeechobee
Belleview
Lake Placid
Madison
New Port Richey
Jupiter Island
Lake Butler
Polk City
Cedar Key
Fernandina Beach
HastingsCross City
Callahan
Mayo
ReddickOtter Creek
Everglades
Penney Farms
Moore Haven
Horseshoe Beach
POLK
LEE
COLLIER
LEVY
LAKE
MARION
MONROE
MIAMI-DADE
PALM BEACH
BREVARD
VOLUSIA
OSCEOLA
TAYLOR
DIXIE
HENDRY
DUVAL
PASCO
BROWARD
CLAY
GLADES
ORANGE
CITRUS
ALACHUA
PUTNAM
MARTIN
HIGHLANDS
MANATEE
ST. JOHNS
BAKER
HILLSBOROUGH
DESOTO
HARDEE
MADISON COLU
MBI
A
ST. LUCIE
SUM
TER
CHARLOTTE
LEON
SARASOTA
OKEECHOBEE
PINELLA
S
FLAGLER
SUWANNEE
JEFF
ERSO
N
NASSAU
HERNANDO
HAMILTON
LAFAYETTE
INDIAN RIVER
UNION
GILC
HR
IST
BRADFORD
S000C900630-Dec-2011
CS/SB 1174 by Senate ReapportionmentCommittee (21-5); 11-Jan-2012
´6
12
7
2
4
21
5
3
26
23
15
18
8
16
27
14
25
9
13
11
24
10
19
17
22
20
Jacksonville
Tampa
Bunnell
Orlando
Cape Coral
St. Petersburg
Port St. Lucie
Lakeland
Miami
Palm Coast
Ocala
North Port
Palm Bay
Bartow
Davie
NewberryGainesville
Deltona
Sanibel
Fort Myers
Alachua
Daytona Beach
Fellsmere
Wildwood
Titusville
Wellington
Clearwater
Jupiter
Sanford
Dunedin
West Palm Beach
Winter Haven
Sarasota
Hialeah
Leesburg
DeBary
Plant City
Coral Gables
Boca Raton
Doral
Palm Beach Gardens
Cocoa
Venice
Port Orange
Sunrise
Bay Lake
Naples
Fort Pierce
DeLand
Ocoee
Edgewater
Oviedo
Grant-Valkaria
St. Cloud
LaBelle
Mascotte
Perry
Lake Wales
Clermont
Yankeetown
Bradenton
Marco Island
Punta Gorda
Haines City
Sebring
Stuart
Oak Hill
Frostproof
Homestead
Lake City
Rockledge
Palatka
Apopka
Pierson
Delray Beach
Starke
Vero Beach
Archer
St. Augustine
Brooksville
Live Oak
Lady Lake
Inverness
Zephyrhills
Avon Park
Williston
Chiefland
Dunnellon
Dade City
Center Hill
Interlachen
Lee
Seminole
Crystal River
Arcadia
Belle Glade
Fort Meade
Clewiston
HawthorneTrenton
Macclenny
Orange Park
Wauchula
Bell
Monticello
Waldo
JenningsJasper
Fort Myers Beach
Okeechobee
Belleview
Lake Placid
Madison
New Port Richey
Jupiter Island
Lake Butler
Polk City
Cedar Key
HastingsCross City
Callahan
Mayo
ReddickOtter Creek
Everglades
Penney Farms
Moore Haven
Horseshoe Beach
POLK
LEE
COLLIER
LEVY
LAKE
MARION
MONROE
MIAMI-DADE
PALM BEACH
BREVARD
VOLUSIA
OSCEOLA
TAYLOR
DIXIE
HENDRY
DUVAL
PASCO
BROWARD
CLAY
GLADES
ORANGE
CITRUS
ALACHUA
PUTNAM
MARTIN
HIGHLANDS
MANATEE
ST. JOHNS
BAKER
HILLSBOROUGH
DESOTO
HARDEE
MADISON COLU
MBI
A
ST. LUCIE
SUM
TER
CHARLOTTE
SARASOTA
LEON
OKEECHOBEE
PINELLA
S
FLAGLER
SUWANNEE
JEFF
ERSO
N
HERNANDO
NASSAUHAMILTON
LAFAYETTE
INDIAN RIVER
UNION
GILC
HR
IST
BRADFORD
S004C901412-Jan-2012
CS/SB 1174, 1st eng.; PassedSenate (34-6); 17-Jan-2012
LegendCounty boundaryInterstateUS HighwayMajor roadSea, lake, or riverDistrict boundary & number10
0 10 20 30 40 50 605Miles
Scale bar
SR27.4255
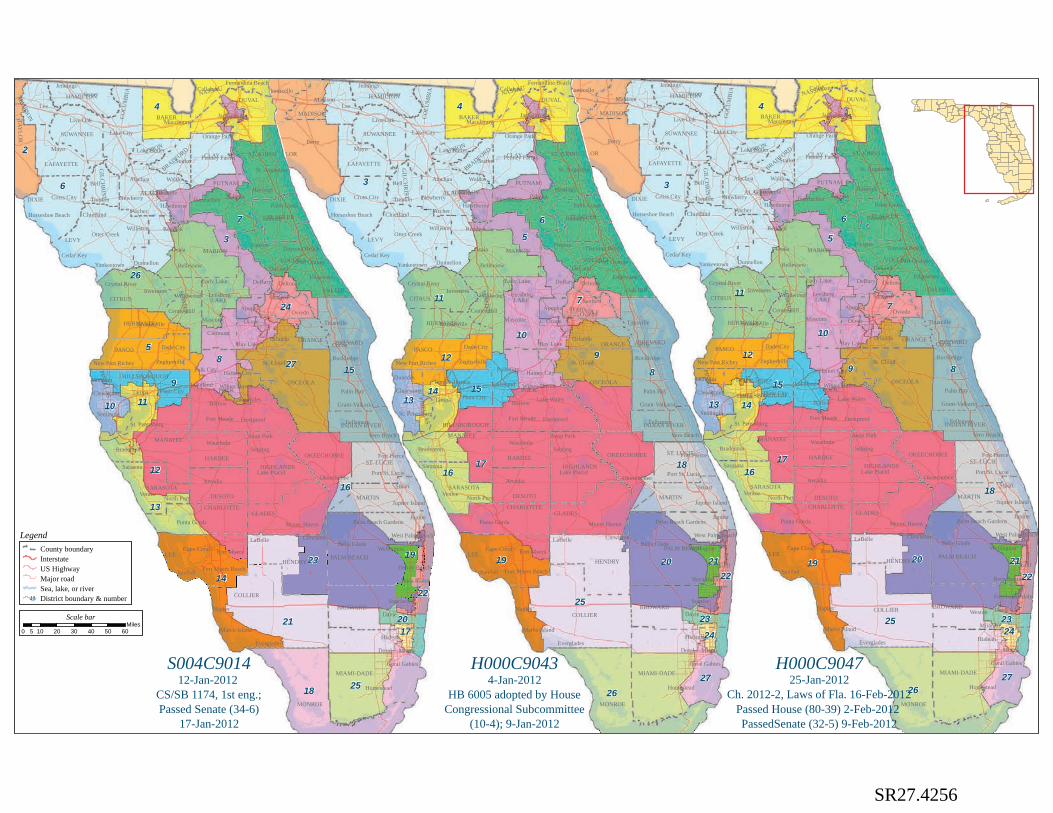
LegendCounty boundaryInterstateUS HighwayMajor roadSea, lake, or riverDistrict boundary & number10
0 10 20 30 40 50 605Miles
Scale bar
6
12
7
4
21
5
3
26
23
15
18
8
16
27
14
25
9
2
13
11
24
10
19
17
22
20
Jacksonville
Tampa
Bunnell
Orlando
Cape Coral
St. Petersburg
Port St. Lucie
Lakeland
Miami
Palm Coast
Ocala
North Port
Palm Bay
Bartow
Davie
NewberryGainesville
Deltona
Sanibel
Fort Myers
Alachua
Daytona Beach
Fellsmere
Wildwood
Titusville
Wellington
Clearwater
Jupiter
Sanford
Dunedin
West Palm Beach
Winter Haven
Sarasota
Hialeah
Leesburg
DeBary
Plant City
Coral Gables
Boca Raton
Doral
Palm Beach Gardens
Cocoa
Venice
Port Orange
Sunrise
Bay Lake
Naples
Fort Pierce
DeLand
Ocoee
Edgewater
Oviedo
Grant-Valkaria
St. Cloud
LaBelle
Mascotte
Lake Wales
Clermont
Yankeetown
Bradenton
Marco Island
Punta Gorda
Haines City
Sebring
Stuart
Oak Hill
Frostproof
Homestead
Lake City
Rockledge
Palatka
Apopka
Pierson
Delray Beach
Starke
Vero Beach
Archer
St. Augustine
Brooksville
Live Oak
Lady Lake
Inverness
Zephyrhills
Avon Park
Williston
Chiefland
Dunnellon
Dade City
Center Hill
Interlachen
Lee
Seminole
Crystal River
Arcadia
Belle Glade
Fort Meade
Clewiston
HawthorneTrenton
Macclenny
Orange Park
Wauchula
BellWaldo
JenningsJasper
Fort Myers Beach
Okeechobee
Belleview
Lake Placid
New Port Richey
Jupiter Island
Lake Butler
Fernandina Beach
Polk City
Cedar Key
HastingsCross City
Callahan
Mayo
ReddickOtter Creek
Everglades
Penney Farms
Moore Haven
Horseshoe Beach
POLK
LEE
COLLIER
LEVY
LAKE
MARION
MIAMI-DADE
MONROE
PALM BEACH
BREVARD
VOLUSIA
OSCEOLA
DIXIE
HENDRY
DUVAL
PASCO
BROWARD
CLAY
GLADES
ORANGE
CITRUS
ALACHUA
PUTNAM
MARTIN
HIGHLANDS
MANATEE
ST. JOHNS
BAKER
HILLSBOROUGH
DESOTO
HARDEE
COLU
MBI
A
ST. LUCIE
SUM
TER
CHARLOTTE
SARASOTA
OKEECHOBEE
PINELLA
S
FLAGLER
SUWANNEE
TAYLO
R
NASSAU
HERNANDO
MADISON
HAMILTON
LAFAYETTE
INDIAN RIVER
UNION
GILC
HR
IST
BRADFORD
S004C901412-Jan-2012
CS/SB 1174, 1st eng.;Passed Senate (34-6)
17-Jan-2012
3
17
6
2
8
25
4
5
11
26
9
20
18
10
19
16
7
12
15
27
1413
2221
23
24
Jacksonville
Tampa
Bunnell
Orlando
Cape Coral
St. Petersburg
Port St. Lucie
Lakeland
Miami
Palm Coast
Ocala
North Port
Palm Bay
Bartow
Davie
NewberryGainesville
Deltona
Sanibel
Fort Myers
Alachua
Daytona Beach
Fellsmere
Wildwood
Titusville
Wellington
Clearwater
Jupiter
Sanford
Dunedin
West Palm Beach
Winter Haven
Sarasota
Hialeah
Leesburg
DeBary
Plant City
Coral Gables
Boca Raton
Doral
Palm Beach Gardens
Cocoa
Venice
Port Orange
Sunrise
Bay Lake
Naples
Fort Pierce
DeLand
Ocoee
Edgewater
Oviedo
Grant-Valkaria
St. Cloud
LaBelle
Mascotte
Perry
Lake Wales
Yankeetown
Bradenton
Marco Island
Punta Gorda
Haines City
Sebring
Stuart
Oak Hill
Frostproof
Homestead
Lake City
Rockledge
Palatka
Apopka
Pierson
Starke
Vero Beach
Archer
St. Augustine
Brooksville
Live Oak
Lady Lake
Inverness
Zephyrhills
Avon Park
Williston
Chiefland
Dunnellon
Dade City
Center Hill
Interlachen
Lee
Crystal River
Arcadia
Belle Glade
Fort Meade
Clewiston
Temple Terrace
HawthorneTrenton
Macclenny
Orange Park
Wauchula
Bell
Monticello
Waldo
JenningsJasper
Fort Myers Beach
Okeechobee
Belleview
Lake Placid
Madison
New Port Richey
Jupiter Island
Lake Butler
Polk City
Cedar Key
Fernandina Beach
Hastings
Golf
Cross City
Callahan
Mayo
ReddickOtter Creek
Everglades
Penney Farms
Moore Haven
Horseshoe Beach
POLK
LEE
COLLIER
LEVY
LAKE
MARION
MONROE
MIAMI-DADE
PALM BEACH
BREVARD
VOLUSIA
OSCEOLA
TAYLOR
DIXIE
HENDRY
DUVAL
PASCO
BROWARD
CLAY
GLADES
ORANGE
CITRUS
ALACHUA
PUTNAM
MARTIN
HIGHLANDS
MANATEE
ST. JOHNS
BAKER
HILLSBOROUGH
DESOTO
HARDEE
MADISON COLU
MBI
A
ST. LUCIE
SUM
TER
CHARLOTTE
LEON
SARASOTA
OKEECHOBEE
PINELLA
S
FLAGLER
SUWANNEE
JEFF
ERSO
N
NASSAU
HERNANDO
HAMILTON
LAFAYETTE
INDIAN RIVER
UNION
GILC
HR
IST
SEMINOLE
BRADFORD
H000C90434-Jan-2012
HB 6005 adopted by HouseCongressional Subcommittee
(10-4); 9-Jan-2012
´3
17
6
2
89
4
25
11
5
26
20
18
10
19
16
7
12
15
27
1413
2221
2423
Jacksonville
Tampa
Bunnell
Orlando
Cape Coral
St. Petersburg
Port St. Lucie
Lakeland
Miami
Palm Coast
Ocala
North Port
Palm Bay
Bartow
Davie
NewberryGainesville
Deltona
Sanibel
Fort Myers
Alachua
Daytona Beach
Fellsmere
Wildwood
Titusville
Wellington
Clearwater
Jupiter
Sanford
Miramar
Weston
Dunedin
West Palm Beach
Winter Haven
Sarasota
Hialeah
Leesburg
DeBary
Plant City
Coral Gables
Boca Raton
Palm Beach Gardens
Cocoa
Venice
Port Orange
Bay Lake
Naples
Fort Pierce
DeLand
Ocoee
Edgewater
Oviedo
Fort Lauderdale
Grant-Valkaria
St. Cloud
LaBelle
Mascotte
Perry
Lake Wales
Yankeetown
Bradenton
Marco Island
Punta Gorda
Haines City
Sebring
Stuart
Oak Hill
Frostproof
Homestead
Lake City
Rockledge
Palatka
Apopka
Pierson
Starke
Vero Beach
Archer
St. Augustine
Brooksville
Live Oak
Lady Lake
Inverness
Zephyrhills
Avon Park
Williston
Chiefland
Dunnellon
Dade City
Center Hill
Interlachen
Lee
Seminole
Crystal River
Arcadia
Belle Glade
Fort Meade
Clewiston
Temple Terrace
HawthorneTrenton
Macclenny
Orange Park
Wauchula
Bell
Monticello
Waldo
JenningsJasper
Okeechobee
Belleview
Lake Placid
Madison
New Port Richey
Jupiter Island
Lake Butler
Cedar Key
Hastings
Golf
Cross City
Callahan
Mayo
ReddickOtter Creek
Everglades
Penney Farms
Moore Haven
Horseshoe Beach
POLK
LEE
COLLIER
LEVY
LAKE
MARION
MONROE
MIAMI-DADE
PALM BEACH
BREVARD
VOLUSIA
OSCEOLA
TAYLOR
DIXIE
HENDRY
DUVAL
PASCO
BROWARD
CLAY
GLADES
ORANGE
CITRUS
ALACHUA
PUTNAM
MARTIN
HIGHLANDS
MANATEE
ST. JOHNS
BAKER
HILLSBOROUGH
DESOTO
HARDEE
MADISON COLU
MBI
A
ST. LUCIE
SUM
TER
CHARLOTTE
SARASOTA
LEON
OKEECHOBEE
PINELLA
S
FLAGLER
SUWANNEE
JEFF
ERSO
N
HERNANDO
NASSAUHAMILTON
LAFAYETTE
INDIAN RIVER
UNION
GILC
HR
IST
BRADFORD
H000C904725-Jan-2012
Ch. 2012-2, Laws of Fla. 16-Feb-2012Passed House (80-39) 2-Feb-2012 PassedSenate (32-5) 9-Feb-2012
LegendCounty boundaryInterstateUS HighwayMajor roadSea, lake, or riverDistrict boundary & number10
0 10 20 30 40 50 605Miles
Scale bar
SR27.4256

TAB 7

Compactness ScoreNumber of Simulated DistrictsWith This Compactness Score
0.797980938 3470.756731366 1490.567590897 1040.703523469 680.850099094 550.805352214 500.834099348 440.717369711 420.719145306 420.823366909 420.743614879 400.82433347 39
SR27.4257
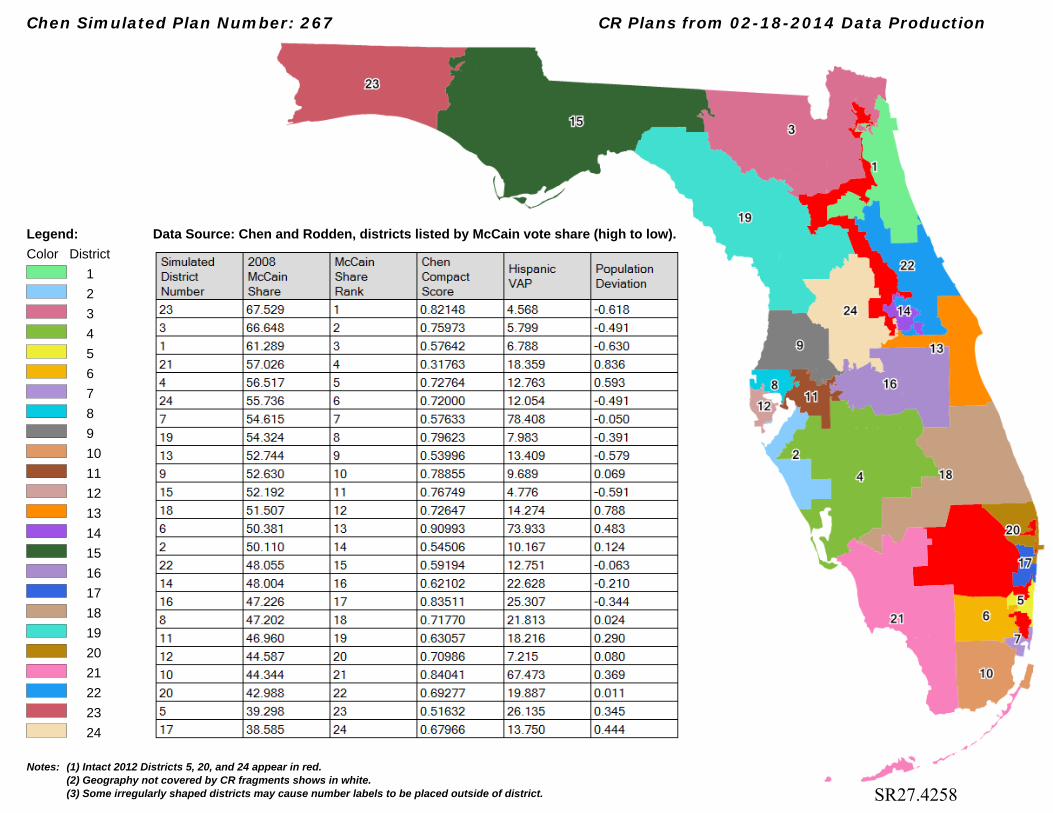
Chen Simulated Plan Number: 267 CR Plans from 02-18-2014 Data Production
Data Source: Chen and Rodden, districts listed by McCain vote share (high to low).Legend:Color District
Notes: (1) Intact 2012 Districts 5, 20, and 24 appear in red.(2) Geography not covered by CR fragments shows in white.(3) Some irregularly shaped districts may cause number labels to be placed outside of district.
123456789101112131415161718192021222324
SR27.4258
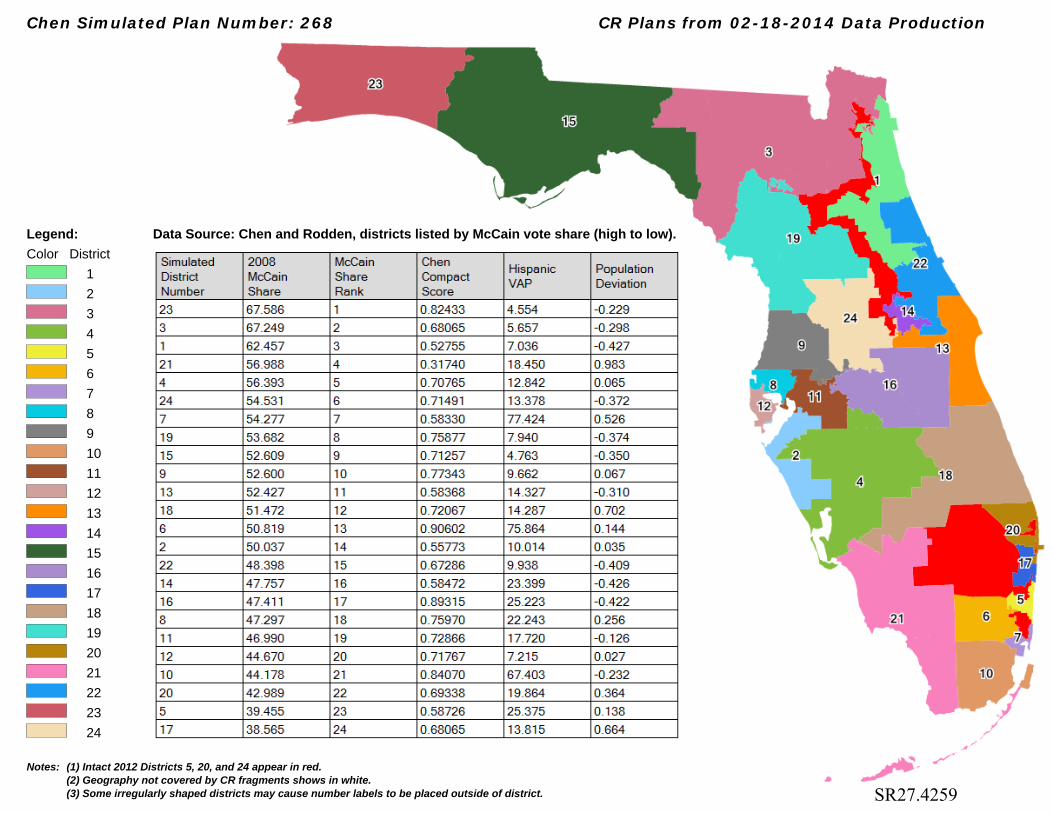
Chen Simulated Plan Number: 268 CR Plans from 02-18-2014 Data Production
Data Source: Chen and Rodden, districts listed by McCain vote share (high to low).Legend:Color District
Notes: (1) Intact 2012 Districts 5, 20, and 24 appear in red.(2) Geography not covered by CR fragments shows in white.(3) Some irregularly shaped districts may cause number labels to be placed outside of district.
123456789101112131415161718192021222324
SR27.4259

Chen Simulated Plan Number: 433 CR Plans from 02-18-2014 Data Production
Data Source: Chen and Rodden, districts listed by McCain vote share (high to low).Legend:Color District
Notes: (1) Intact 2012 Districts 5, 20, and 24 appear in red.(2) Geography not covered by CR fragments shows in white.(3) Some irregularly shaped districts may cause number labels to be placed outside of district.
123456789101112131415161718192021222324
SR27.4260

Chen Simulated Plan Number: 434 CR Plans from 02-18-2014 Data Production
Data Source: Chen and Rodden, districts listed by McCain vote share (high to low).Legend:Color District
Notes: (1) Intact 2012 Districts 5, 20, and 24 appear in red.(2) Geography not covered by CR fragments shows in white.(3) Some irregularly shaped districts may cause number labels to be placed outside of district.
123456789101112131415161718192021222324
SR27.4261

Chen Simulated Plan Number: 529 CR Plans from 02-18-2014 Data Production
Data Source: Chen and Rodden, districts listed by McCain vote share (high to low).Legend:Color District
Notes: (1) Intact 2012 Districts 5, 20, and 24 appear in red.(2) Geography not covered by CR fragments shows in white.(3) Some irregularly shaped districts may cause number labels to be placed outside of district.
123456789101112131415161718192021222324
SR27.4262
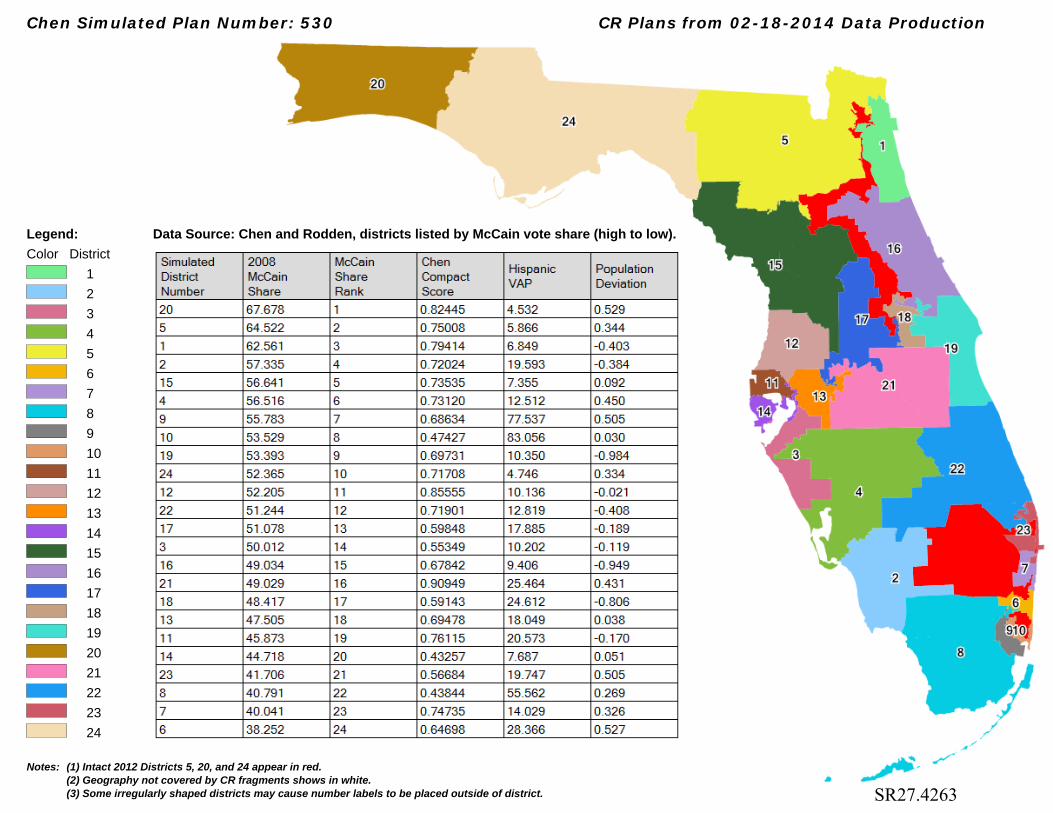
Chen Simulated Plan Number: 530 CR Plans from 02-18-2014 Data Production
Data Source: Chen and Rodden, districts listed by McCain vote share (high to low).Legend:Color District
Notes: (1) Intact 2012 Districts 5, 20, and 24 appear in red.(2) Geography not covered by CR fragments shows in white.(3) Some irregularly shaped districts may cause number labels to be placed outside of district.
123456789101112131415161718192021222324
SR27.4263

TAB 8
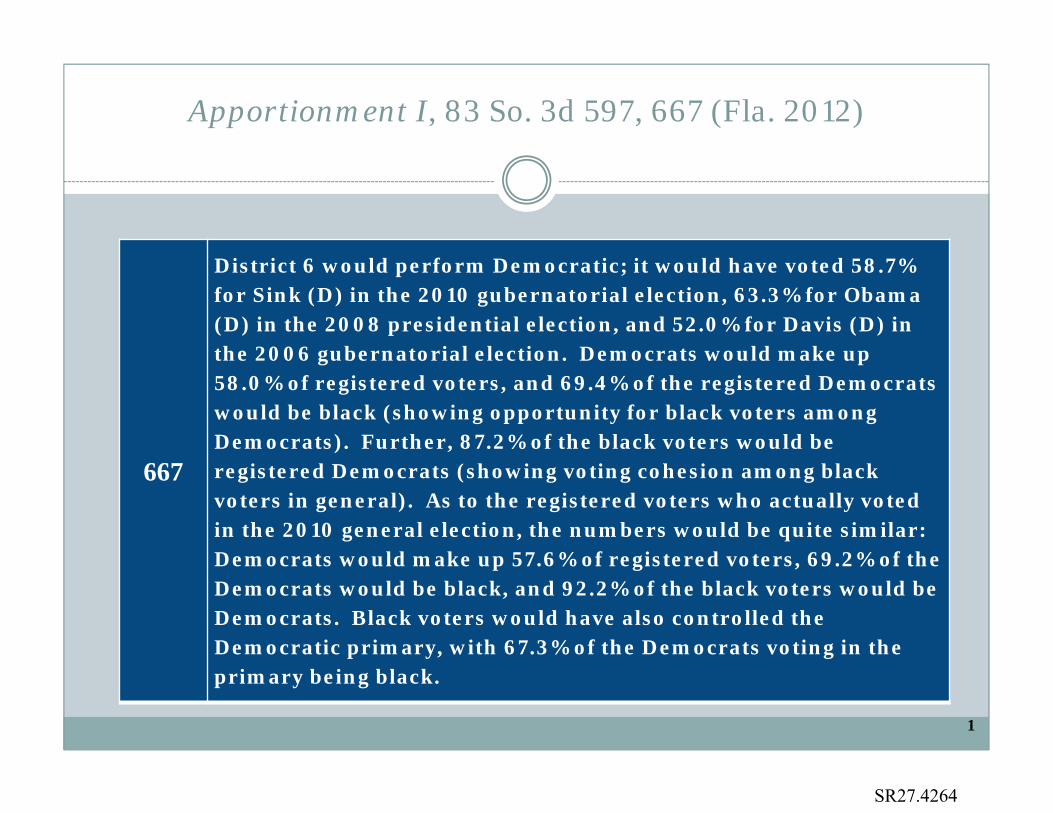
Apportionment I, 83 So. 3d 597, 667 (Fla. 2012)
667
District 6 would perform Democratic; it would have voted 58.7% for Sink (D) in the 2010 gubernatorial election, 63.3% for Obama (D) in the 2008 presidential election, and 52.0% for Davis (D) in the 2006 gubernatorial election. Democrats would make up 58.0% of registered voters, and 69.4% of the registered Democrats would be black (showing opportunity for black voters among Democrats). Further, 87.2% of the black voters would be registered Democrats (showing voting cohesion among black voters in general). As to the registered voters who actually voted in the 2010 general election, the numbers would be quite similar: Democrats would make up 57.6% of registered voters, 69.2% of the Democrats would be black, and 92.2% of the black voters would be Democrats. Black voters would have also controlled the Democratic primary, with 67.3% of the Democrats voting in the primary being black.
1
SR27.4264
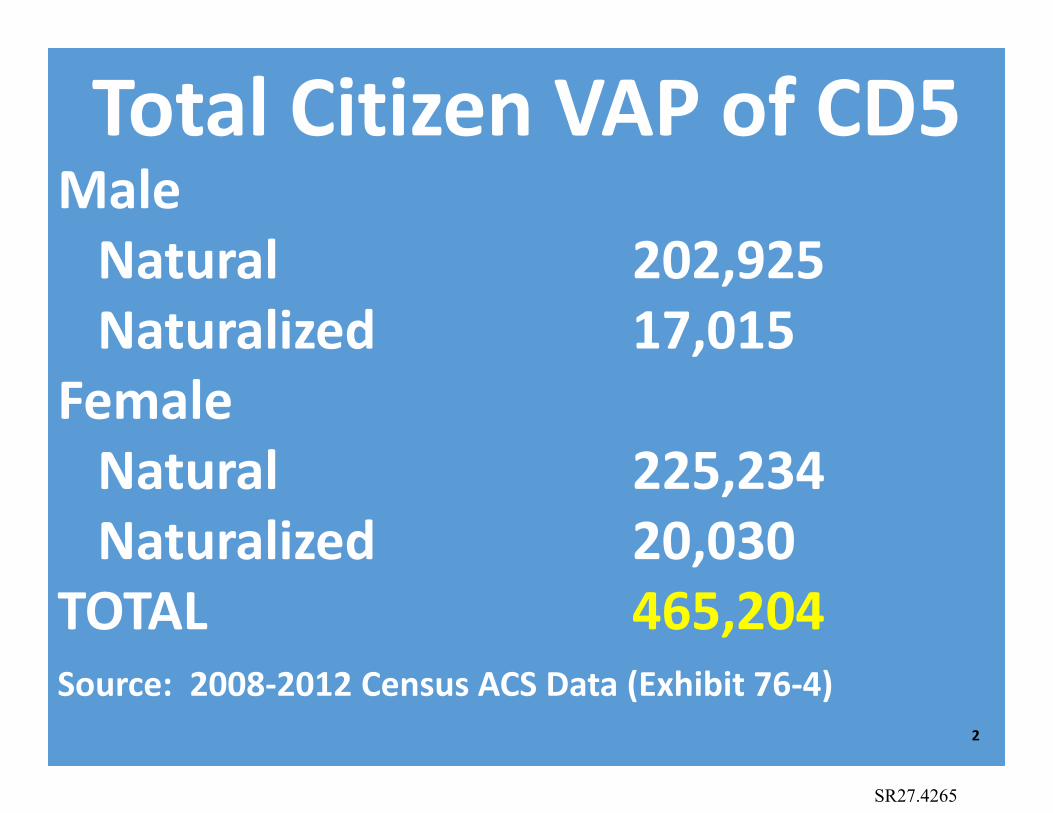
Total Citizen VAP of CD5Male
Natural 202,925Naturalized 17,015
FemaleNatural 225,234Naturalized 20,030
TOTAL 465,204Source: 2008-2012 Census ACS Data (Exhibit 76-4)
2
SR27.4265
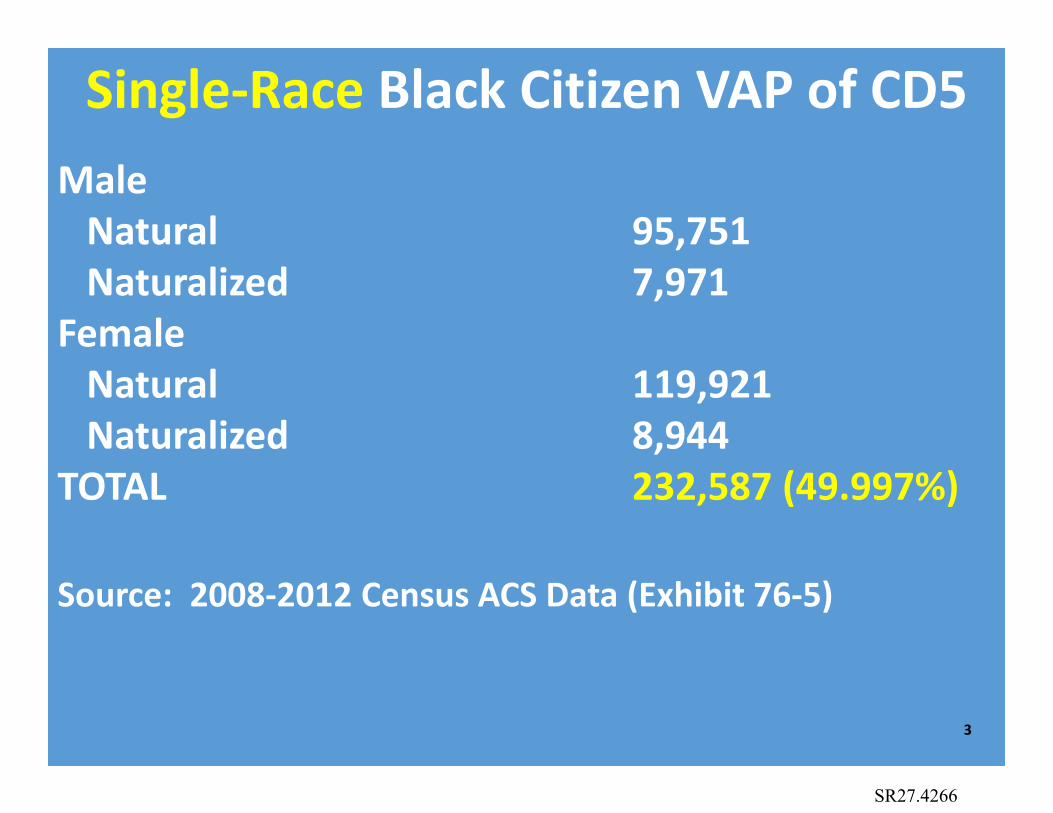
Single-Race Black Citizen VAP of CD5Male
Natural 95,751Naturalized 7,971
FemaleNatural 119,921Naturalized 8,944
TOTAL 232,587 (49.997%)
Source: 2008-2012 Census ACS Data (Exhibit 76-5)
3
SR27.4266
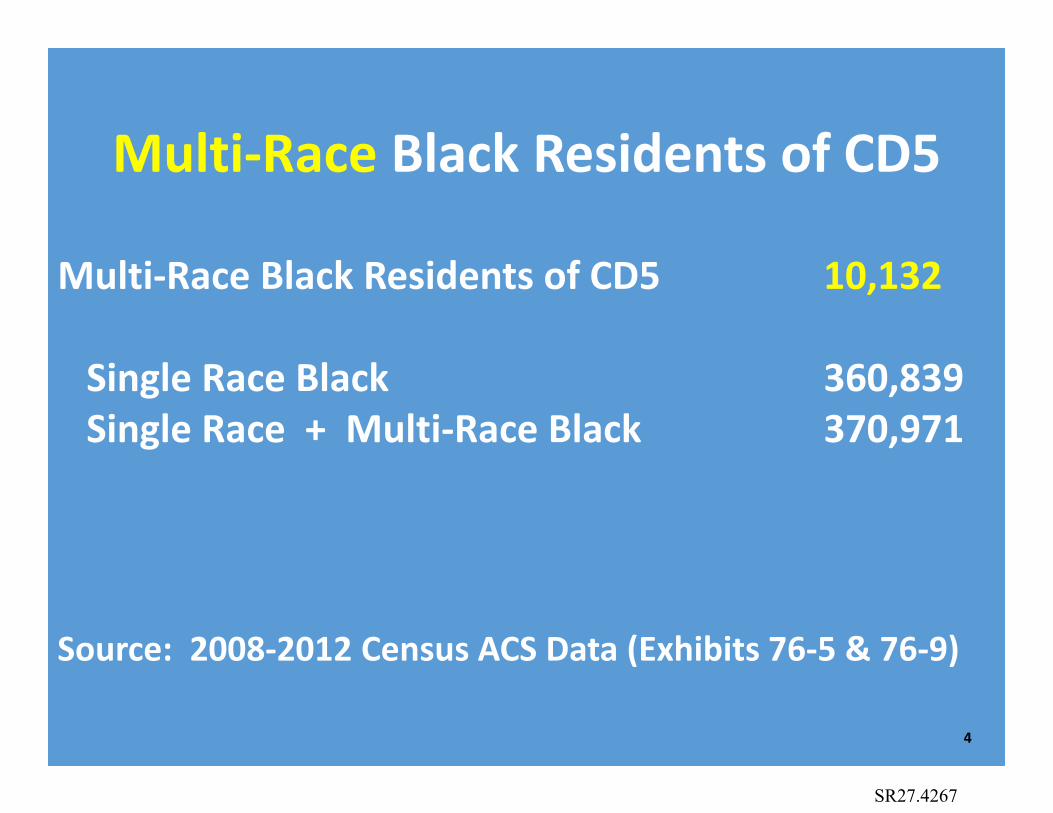
Multi-Race Black Residents of CD5
Multi-Race Black Residents of CD5 10,132
Single Race Black 360,839Single Race + Multi-Race Black 370,971
Source: 2008-2012 Census ACS Data (Exhibits 76-5 & 76-9)
4
SR27.4267
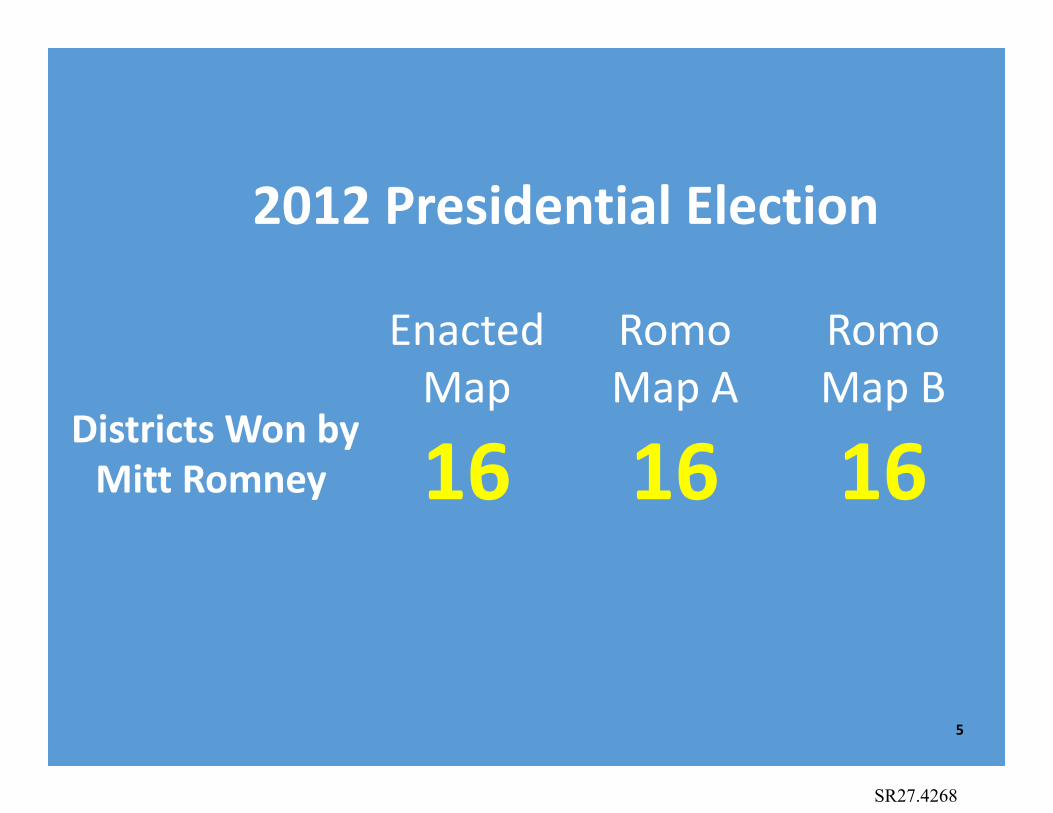
EnactedMap
RomoMap A
Romo Map B
16 16 16
2012 Presidential Election
Districts Won byMitt Romney
5
SR27.4268

EnactedMap
RomoMap A
Romo Map B
122 123 123
Seven Statewide Races in 2010 and 2012 General Elections
Districts Won by Statewide Republican Candidates
6
SR27.4269
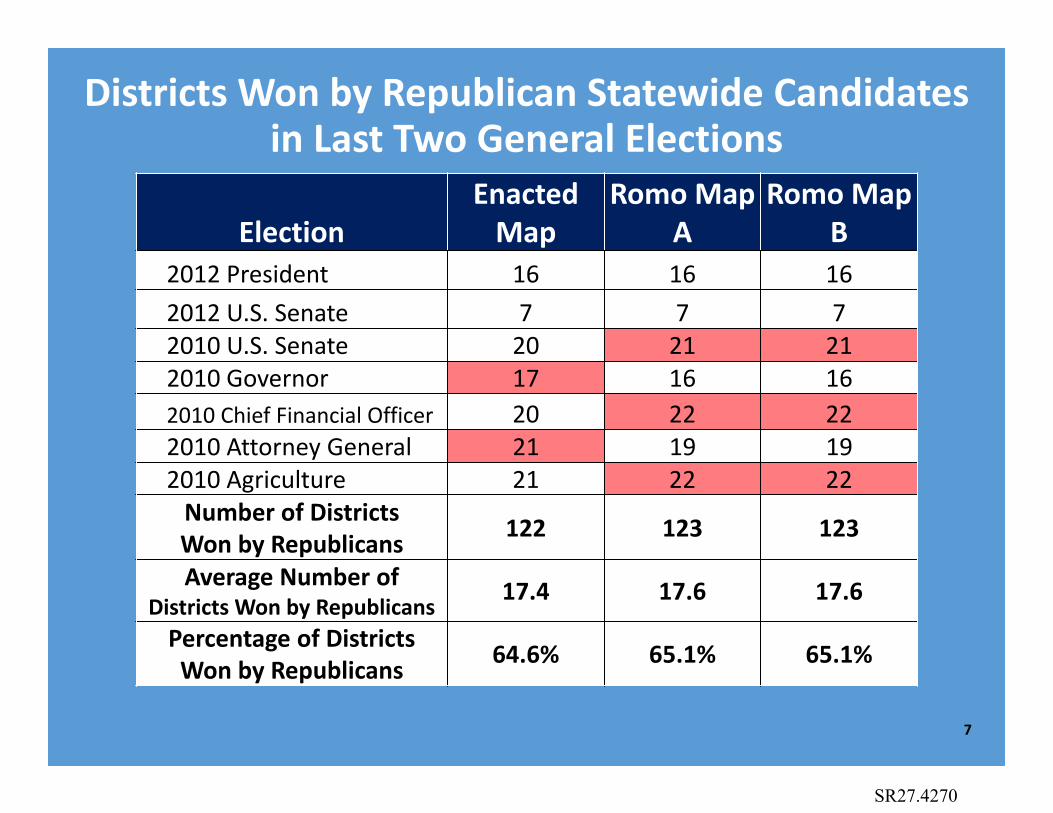
ElectionEnacted
MapRomo Map
ARomo Map
B2012 President 16 16 162012 U.S. Senate 7 7 72010 U.S. Senate 20 21 212010 Governor 17 16 162010 Chief Financial Officer 20 22 222010 Attorney General 21 19 192010 Agriculture 21 22 22
Number of DistrictsWon by Republicans 122 123 123
Average Number ofDistricts Won by Republicans 17.4 17.6 17.6
Percentage of DistrictsWon by Republicans 64.6% 65.1% 65.1%
Districts Won by Republican Statewide Candidatesin Last Two General Elections
7
SR27.4270
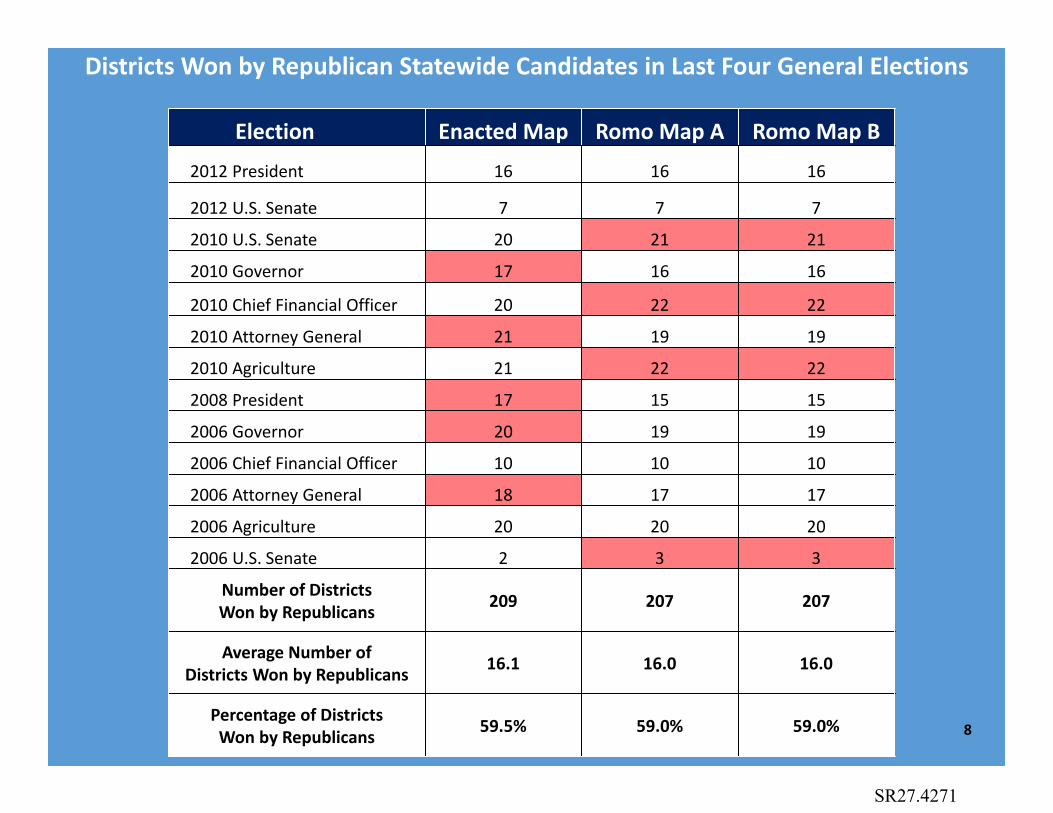
Election Enacted Map Romo Map A Romo Map B2012 President 16 16 16
2012 U.S. Senate 7 7 7
2010 U.S. Senate 20 21 21
2010 Governor 17 16 16
2010 Chief Financial Officer 20 22 22
2010 Attorney General 21 19 19
2010 Agriculture 21 22 22
2008 President 17 15 15
2006 Governor 20 19 19
2006 Chief Financial Officer 10 10 10
2006 Attorney General 18 17 17
2006 Agriculture 20 20 20
2006 U.S. Senate 2 3 3
Number of DistrictsWon by Republicans 209 207 207
Average Number ofDistricts Won by Republicans 16.1 16.0 16.0
Percentage of DistrictsWon by Republicans 59.5% 59.0% 59.0%
Districts Won by Republican Statewide Candidates in Last Four General Elections
8
SR27.4271

CDs 21 and 22Enacted Map Romo Maps A
and B
Enacted 21 and 22 Mean Reock: 0.23
Mean Convex Hull: 0.61
Romo 21 and 22 Mean Reock: 0.25
Mean Convex Hull: 0.57
21
22
21
22
9
SR27.4272
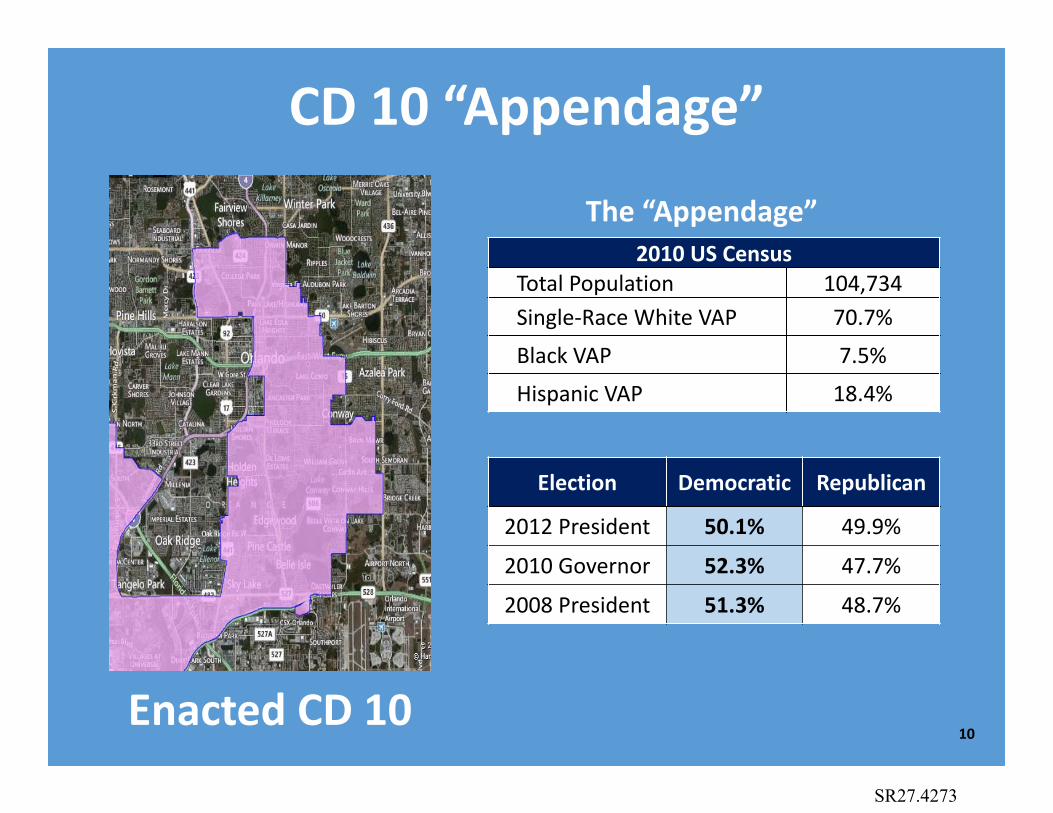
CD 10 “Appendage”
Enacted CD 10
2010 US CensusTotal Population 104,734Single-Race White VAP 70.7%
Black VAP 7.5%
Hispanic VAP 18.4%
Election Democratic Republican
2012 President 50.1% 49.9%
2010 Governor 52.3% 47.7%
2008 President 51.3% 48.7%
The “Appendage”
10
SR27.4273
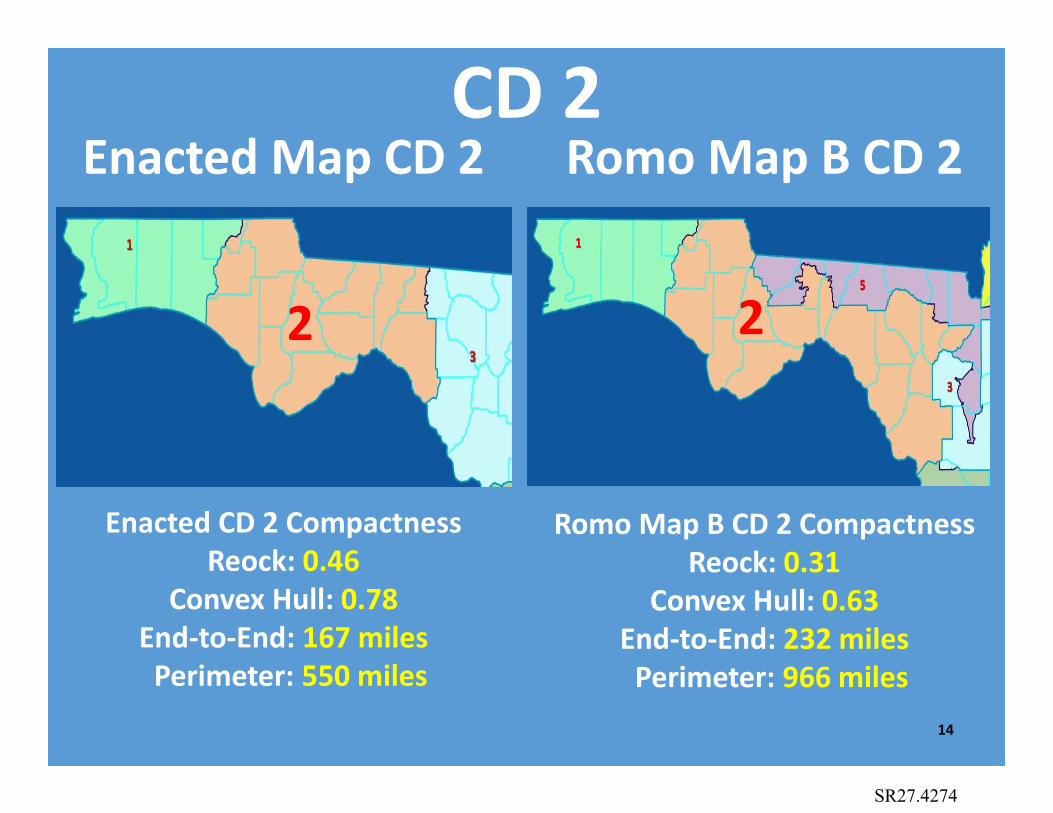
CD 2Enacted Map CD 2 Romo Map B CD 2
Enacted CD 2 CompactnessReock: 0.46
Convex Hull: 0.78End-to-End: 167 miles
Perimeter: 550 miles
22
Romo Map B CD 2 CompactnessReock: 0.31
Convex Hull: 0.63End-to-End: 232 miles
Perimeter: 966 miles14
SR27.4274

15
Enacted Map CD 4
SR27.4275
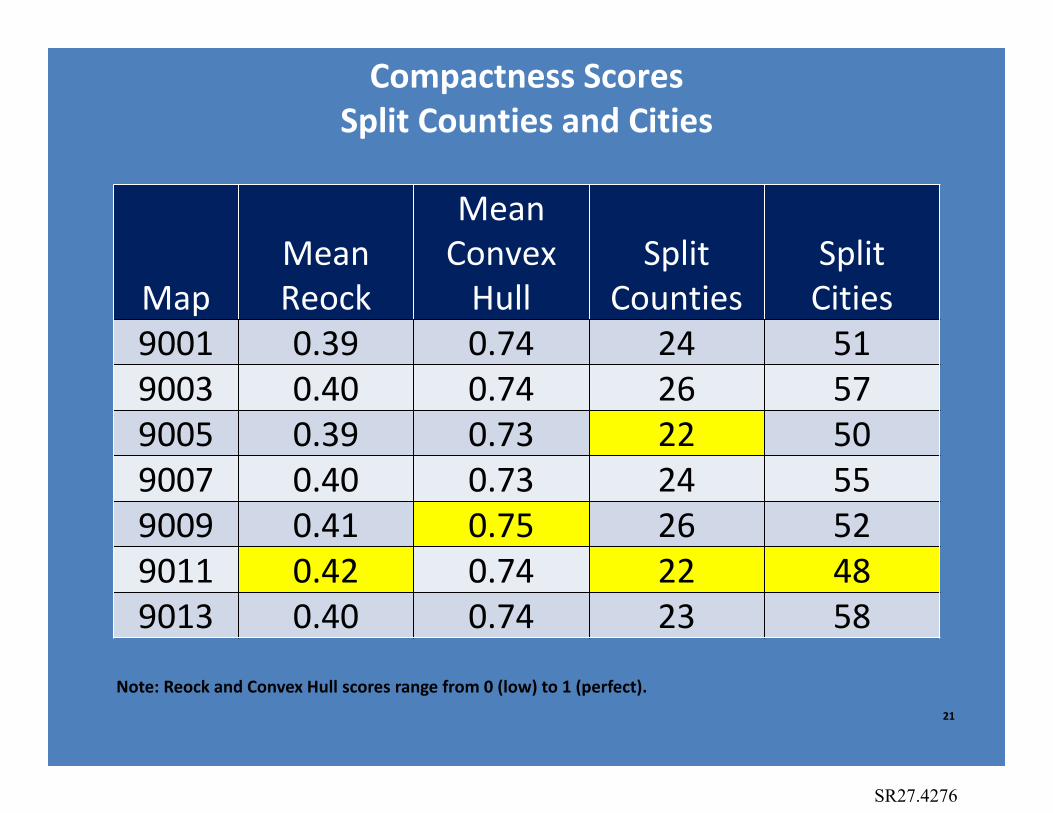
Compactness ScoresSplit Counties and Cities
MapMean Reock
Mean Convex
HullSplit
CountiesSplit Cities
9001 0.39 0.74 24 519003 0.40 0.74 26 579005 0.39 0.73 22 509007 0.40 0.73 24 559009 0.41 0.75 26 529011 0.42 0.74 22 489013 0.40 0.74 23 58
Note: Reock and Convex Hull scores range from 0 (low) to 1 (perfect).21
SR27.4276
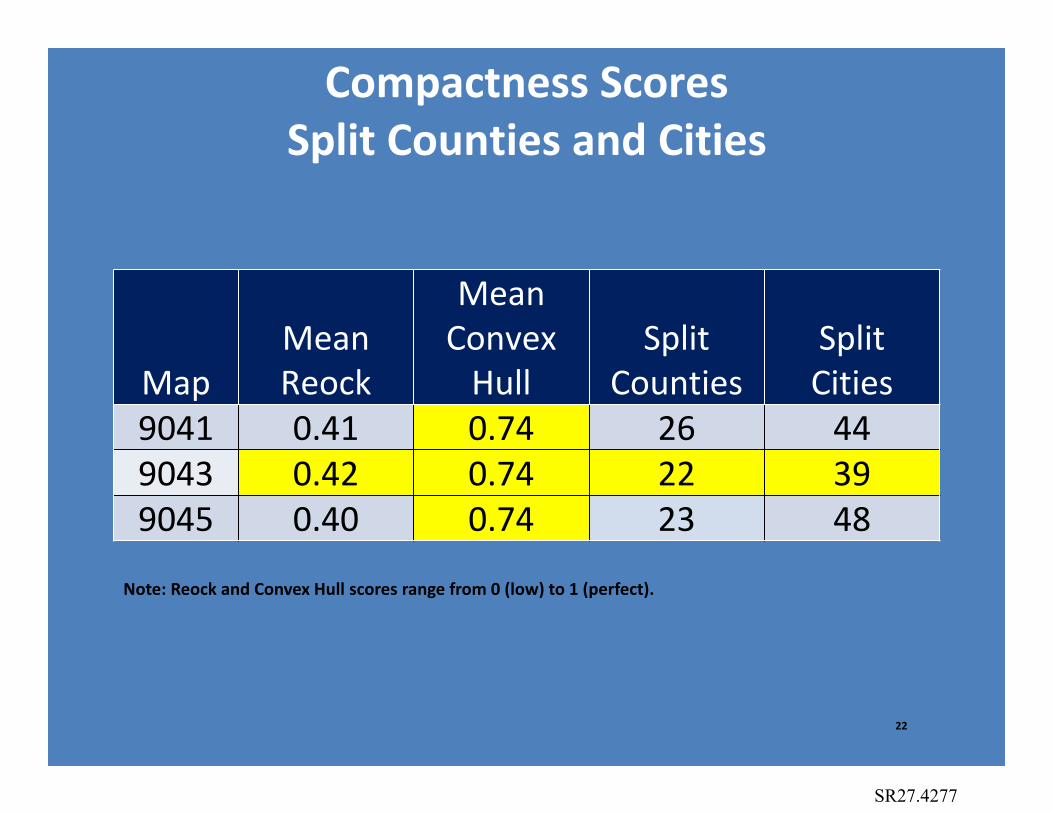
Compactness ScoresSplit Counties and Cities
MapMean Reock
Mean Convex
HullSplit
CountiesSplit Cities
9041 0.41 0.74 26 449043 0.42 0.74 22 399045 0.40 0.74 23 48
Note: Reock and Convex Hull scores range from 0 (low) to 1 (perfect).
22
SR27.4277
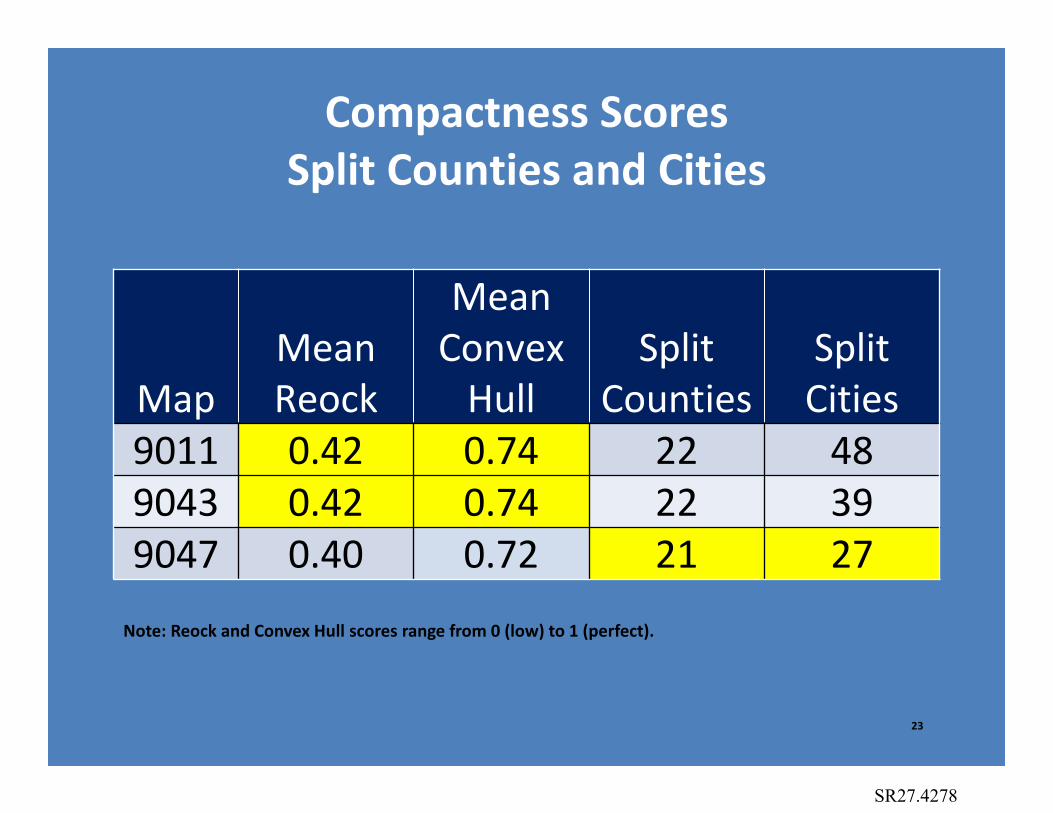
Compactness ScoresSplit Counties and Cities
Note: Reock and Convex Hull scores range from 0 (low) to 1 (perfect).
MapMean Reock
Mean Convex
HullSplit
CountiesSplit Cities
9011 0.42 0.74 22 489043 0.42 0.74 22 399047 0.40 0.72 21 27
23
SR27.4278

CD 5Enacted
MapRomo Map
B
Enacted CD 5 CompactnessPerimeter: 707 miles
End-to-End: 144 milesArea: 1,536 sq. miles
Romo B CD 5 CompactnessPerimeter: 931 miles
End-to-End: 204 milesArea: 4,440 sq. miles
28
SR27.4279
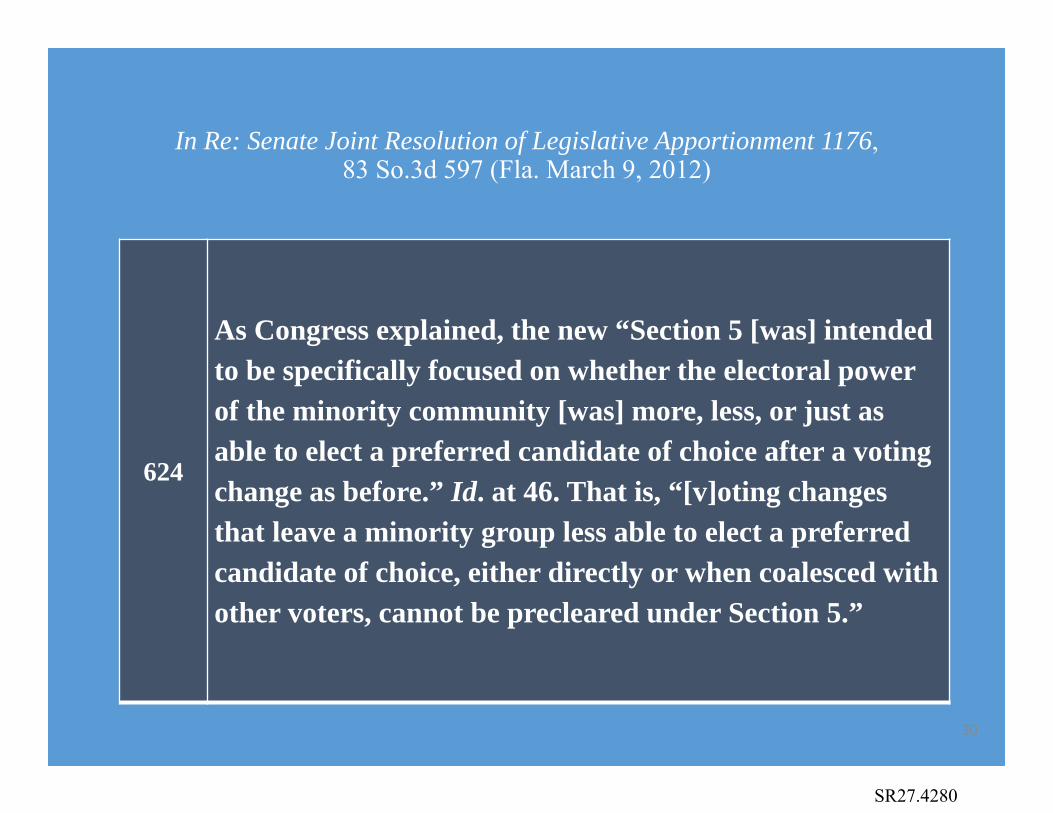
In Re: Senate Joint Resolution of Legislative Apportionment 1176, 83 So.3d 597 (Fla. March 9, 2012)
624
As Congress explained, the new “Section 5 [was] intended to be specifically focused on whether the electoral power of the minority community [was] more, less, or just as able to elect a preferred candidate of choice after a voting change as before.” Id. at 46. That is, “[v]oting changes that leave a minority group less able to elect a preferred candidate of choice, either directly or when coalesced with other voters, cannot be precleared under Section 5.”
30
SR27.4280

Panhandle DistrictsPosada Map(SPUBC0132)
League of WomenVoters’ Map (SPUBC0170)
District 1 13.19338% 13.19336%
District 2 23.84260% 24.29917%
34
SR27.4281

TAB 9

2
3
1
17
6
26
8
4
5
25
11
20
9
18
10
19
16
12
7
15
27
1413
22
23
21
24
MONROE
POLK
LEE
COLLIER
LEVY
BAY
LAKE
MARION
MIAMI-DADE
PALM BEACH
BREVARD
VOLUSIA
OSCEOLA
TAYLOR
DIXIE
WALTON
GULF
HENDRY
DUVAL
PASCO
LEON
BROWARD
CLAY
GLADES
ORANGE
CITRUS
JACKSON
LIBERTY
FRANKLIN
OK
ALO
OSA
ALACHUAPUTNAM
SANTA ROSA
MARTIN
HIGHLANDS
NASSAU
MANATEE
ST. JOH
NS
BAKER
ESCAM
BIA
HILLSBOROUGH
DESOTO
MADISON
HARDEE
COLU
MBI
A
WAKULLA
ST. LUCIE
SUM
TER
CHARLOTTE
SARASOTA
OKEECHOBEE
FLAGLER
SUWANNEE
HOLMES
JEFF
ERSO
N
CALHOUN
GADSDEN
HERNANDO
HAMILTON
LAFAYETTE
WASHINGTON
INDIAN RIVER
UNION
GILCH
RIST
BRADFORD
Remedial PlanH000C9057
by Sen. Galvano andRep. Corcoran7-Aug-2014
* * * * *Congressional Districts
established byCh. 2014-255, Laws of Fla.
13-Aug-2014
20
18
2726
25
22
23
21
24
Miami
Davie
Wellington
Jupiter
Miramar
Weston
Hialeah
Hollywood
Doral
Plantation
West Palm Beach
Coral Gables
Boca Raton
Palm Beach Gardens
Sunrise
Pembroke Pines
Fort Lauderdale
Coral SpringsPompano Beach
Parkland
Tamarac
Homestead
Miami Gardens
Delray Beach
Miami Beach
Boynton Beach
Deerfield Beach
Cutler Bay
Palm Beach
Lauderhill
Pinecrest
North Miami
Medley
Riviera Beach
Cooper City
Palmetto Bay
Royal Palm Beach
Loxahatchee Groves
Oakland Park
Lake WorthGreenacres
Florida City
Miami Lakes
Southwest Ranches Dania Beach
Aventura
Lantana
Jupiter Island
Tequesta
Palm Springs
Pahokee
South Miami
Sweetwater
Belle Glade
PALM BEACH
MIAMI-DADE
BROWARD
MARTIN
4
36
5
Jacksonville
Jacksonville Beach
Atlantic Beach
Starke
Green Cove Springs
Orange Park
St. Augustine
Baldwin
Callahan
DUVAL
CLAY ST. JOHNS
NASSAU
7
9
8
5
10
6
Orlando
DeBary
Sanford
Bay Lake
Ocoee
Oviedo
Eustis
Kissimmee
Deltona
Apopka
Mount Dora
Winter Springs
Winter Garden
Lake Mary
Winter ParkMaitland
Belle Isle
Titusville
Oak Hill
Lake Buena Vista
Windermere
St. Cloud
ORANGE
LAKE
SEMINOLE
OSCEOLA
VOLUSIA
12
17
14
15
13
16
11
Tampa
St. Petersburg
Dunedin
Plant CityClearwater
Largo
Bradenton
St. Pete Beach
Pinellas Park
Tarpon Springs
Oldsmar
Zephyrhills
Palmetto
Seminole
Temple Terrace
Gulfport
Belleair
Treasure Island
New Port Richey
Port Richey
St. Leo
Holmes Beach
Dade City
PASCO
HILLSBOROUGHPINELLAS
MANATEE
Tampa Bay Area
Jacksonville Area
Orlando Area
South Florida
"
LegendCounty boundaryInterstateUS HighwayMajor roadSea, lake, or riverDistrict boundary & number10
Map produced by professional staff:Florida Senate Committee on Reapportionment404 S. Monroe St., Tallahassee, FL 32399-1100
Office: 103 SOB; Phone: (850) 487-5855;Website: http://www.flsenate.gov/session/redistricting
0 10 205Miles
Scale bar for insets
Scale bar for statewide map
0 10 20 30 40 50 605Miles
SR27.4282
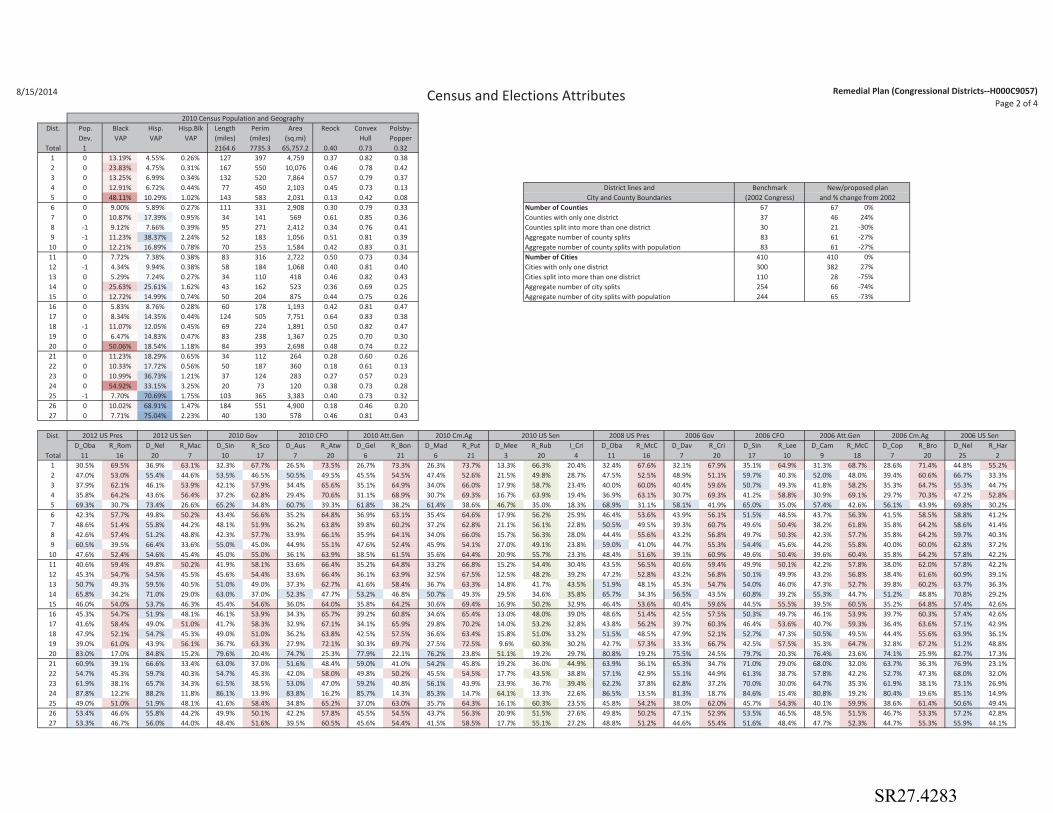
8/15/2014 Census and Elections Attributes Remedial Plan (Congressional Districts--H000C9057)Page 2 of 4
2010 Census Population and Geography Dist. Pop. Black Hisp. Hisp.Blk Length Perim Area Reock Convex Polsby-
Dev. VAP VAP VAP (miles) (miles) (sq.mi) Hull Popper Total 1 2164.6 7735.3 65,757.2 0.40 0.73 0.32
1 0 13.19% 4.55% 0.26% 127 397 4,759 0.37 0.82 0.382 0 23.83% 4.75% 0.31% 167 550 10,076 0.46 0.78 0.423 0 13.25% 6.99% 0.34% 132 520 7,864 0.57 0.79 0.374 0 12.91% 6.72% 0.44% 77 450 2,103 0.45 0.73 0.13 District lines and Benchmark New/proposed plan5 0 48.11% 10.29% 1.02% 143 583 2,031 0.13 0.42 0.08 City and County Boundaries (2002 Congress) and % change from 20026 0 9.00% 5.89% 0.27% 111 331 2,908 0.30 0.79 0.33 Number of Counties 67 67 0%7 0 10.87% 17.39% 0.95% 34 141 569 0.61 0.85 0.36 Counties with only one district 37 46 24%8 -1 9.12% 7.66% 0.39% 95 271 2,412 0.34 0.76 0.41 Counties split into more than one district 30 21 -30%9 -1 11.23% 38.37% 2.24% 52 183 1,056 0.51 0.81 0.39 Aggregate number of county splits 83 61 -27%
10 0 12.21% 16.89% 0.78% 70 253 1,584 0.42 0.83 0.31 Aggregate number of county splits with population 83 61 -27%11 0 7.72% 7.38% 0.38% 83 316 2,722 0.50 0.73 0.34 Number of Cities 410 410 0%12 -1 4.34% 9.94% 0.38% 58 184 1,068 0.40 0.81 0.40 Cities with only one district 300 382 27%13 0 5.29% 7.24% 0.27% 34 110 418 0.46 0.82 0.43 Cities split into more than one district 110 28 -75%14 0 25.63% 25.61% 1.62% 43 162 523 0.36 0.69 0.25 Aggregate number of city splits 254 66 -74%15 0 12.72% 14.99% 0.74% 50 204 875 0.44 0.75 0.26 Aggregate number of city splits with population 244 65 -73%16 0 5.83% 8.76% 0.28% 60 178 1,193 0.42 0.81 0.4717 0 8.34% 14.35% 0.44% 124 505 7,751 0.64 0.83 0.3818 -1 11.07% 12.05% 0.45% 69 224 1,891 0.50 0.82 0.4719 0 6.47% 14.83% 0.47% 83 238 1,367 0.25 0.70 0.3020 0 50.06% 18.54% 1.18% 84 393 2,698 0.48 0.74 0.2221 0 11.23% 18.29% 0.65% 34 112 264 0.28 0.60 0.2622 0 10.33% 17.72% 0.56% 50 187 360 0.18 0.61 0.1323 0 10.99% 36.73% 1.21% 37 124 283 0.27 0.57 0.2324 0 54.92% 33.15% 3.25% 20 73 120 0.38 0.73 0.2825 -1 7.70% 70.69% 1.75% 103 365 3,383 0.40 0.73 0.3226 0 10.02% 68.91% 1.47% 184 551 4,900 0.18 0.46 0.2027 0 7.71% 75.04% 2.23% 40 130 578 0.46 0.81 0.43
Dist. 2012 US Pres 2012 US Sen 2010 Gov 2010 CFO 2010 Att.Gen 2010 Cm.Ag 2010 US Sen 2008 US Pres 2006 Gov 2006 CFO 2006 Att.Gen 2006 Cm.Ag 2006 US Sen D_Oba R_Rom D_Nel R_Mac D_Sin R_Sco D_Aus R_Atw D_Gel R_Bon D_Mad R_Put D_Mee R_Rub I_Cri D_Oba R_McC D_Dav R_Cri D_Sin R_Lee D_Cam R_McC D_Cop R_Bro D_Nel R_Har
Total 11 16 20 7 10 17 7 20 6 21 6 21 3 20 4 11 16 7 20 17 10 9 18 7 20 25 21 30.5% 69.5% 36.9% 63.1% 32.3% 67.7% 26.5% 73.5% 26.7% 73.3% 26.3% 73.7% 13.3% 66.3% 20.4% 32.4% 67.6% 32.1% 67.9% 35.1% 64.9% 31.3% 68.7% 28.6% 71.4% 44.8% 55.2%2 47.0% 53.0% 55.4% 44.6% 53.5% 46.5% 50.5% 49.5% 45.5% 54.5% 47.4% 52.6% 21.5% 49.8% 28.7% 47.5% 52.5% 48.9% 51.1% 59.7% 40.3% 52.0% 48.0% 39.4% 60.6% 66.7% 33.3%3 37.9% 62.1% 46.1% 53.9% 42.1% 57.9% 34.4% 65.6% 35.1% 64.9% 34.0% 66.0% 17.9% 58.7% 23.4% 40.0% 60.0% 40.4% 59.6% 50.7% 49.3% 41.8% 58.2% 35.3% 64.7% 55.3% 44.7%4 35.8% 64.2% 43.6% 56.4% 37.2% 62.8% 29.4% 70.6% 31.1% 68.9% 30.7% 69.3% 16.7% 63.9% 19.4% 36.9% 63.1% 30.7% 69.3% 41.2% 58.8% 30.9% 69.1% 29.7% 70.3% 47.2% 52.8%5 69.3% 30.7% 73.4% 26.6% 65.2% 34.8% 60.7% 39.3% 61.8% 38.2% 61.4% 38.6% 46.7% 35.0% 18.3% 68.9% 31.1% 58.1% 41.9% 65.0% 35.0% 57.4% 42.6% 56.1% 43.9% 69.8% 30.2%6 42.3% 57.7% 49.8% 50.2% 43.4% 56.6% 35.2% 64.8% 36.9% 63.1% 35.4% 64.6% 17.9% 56.2% 25.9% 46.4% 53.6% 43.9% 56.1% 51.5% 48.5% 43.7% 56.3% 41.5% 58.5% 58.8% 41.2%7 48.6% 51.4% 55.8% 44.2% 48.1% 51.9% 36.2% 63.8% 39.8% 60.2% 37.2% 62.8% 21.1% 56.1% 22.8% 50.5% 49.5% 39.3% 60.7% 49.6% 50.4% 38.2% 61.8% 35.8% 64.2% 58.6% 41.4%8 42.6% 57.4% 51.2% 48.8% 42.3% 57.7% 33.9% 66.1% 35.9% 64.1% 34.0% 66.0% 15.7% 56.3% 28.0% 44.4% 55.6% 43.2% 56.8% 49.7% 50.3% 42.3% 57.7% 35.8% 64.2% 59.7% 40.3%9 60.5% 39.5% 66.4% 33.6% 55.0% 45.0% 44.9% 55.1% 47.6% 52.4% 45.9% 54.1% 27.0% 49.1% 23.8% 59.0% 41.0% 44.7% 55.3% 54.4% 45.6% 44.2% 55.8% 40.0% 60.0% 62.8% 37.2%
10 47.6% 52.4% 54.6% 45.4% 45.0% 55.0% 36.1% 63.9% 38.5% 61.5% 35.6% 64.4% 20.9% 55.7% 23.3% 48.4% 51.6% 39.1% 60.9% 49.6% 50.4% 39.6% 60.4% 35.8% 64.2% 57.8% 42.2%11 40.6% 59.4% 49.8% 50.2% 41.9% 58.1% 33.6% 66.4% 35.2% 64.8% 33.2% 66.8% 15.2% 54.4% 30.4% 43.5% 56.5% 40.6% 59.4% 49.9% 50.1% 42.2% 57.8% 38.0% 62.0% 57.8% 42.2%12 45.3% 54.7% 54.5% 45.5% 45.6% 54.4% 33.6% 66.4% 36.1% 63.9% 32.5% 67.5% 12.5% 48.2% 39.2% 47.2% 52.8% 43.2% 56.8% 50.1% 49.9% 43.2% 56.8% 38.4% 61.6% 60.9% 39.1%13 50.7% 49.3% 59.5% 40.5% 51.0% 49.0% 37.3% 62.7% 41.6% 58.4% 36.7% 63.3% 14.8% 41.7% 43.5% 51.9% 48.1% 45.3% 54.7% 54.0% 46.0% 47.3% 52.7% 39.8% 60.2% 63.7% 36.3%14 65.8% 34.2% 71.0% 29.0% 63.0% 37.0% 52.3% 47.7% 53.2% 46.8% 50.7% 49.3% 29.5% 34.6% 35.8% 65.7% 34.3% 56.5% 43.5% 60.8% 39.2% 55.3% 44.7% 51.2% 48.8% 70.8% 29.2%15 46.0% 54.0% 53.7% 46.3% 45.4% 54.6% 36.0% 64.0% 35.8% 64.2% 30.6% 69.4% 16.9% 50.2% 32.9% 46.4% 53.6% 40.4% 59.6% 44.5% 55.5% 39.5% 60.5% 35.2% 64.8% 57.4% 42.6%16 45.3% 54.7% 51.9% 48.1% 46.1% 53.9% 34.3% 65.7% 39.2% 60.8% 34.6% 65.4% 13.0% 48.0% 39.0% 48.6% 51.4% 42.5% 57.5% 50.3% 49.7% 46.1% 53.9% 39.7% 60.3% 57.4% 42.6%17 41.6% 58.4% 49.0% 51.0% 41.7% 58.3% 32.9% 67.1% 34.1% 65.9% 29.8% 70.2% 14.0% 53.2% 32.8% 43.8% 56.2% 39.7% 60.3% 46.4% 53.6% 40.7% 59.3% 36.4% 63.6% 57.1% 42.9%18 47.9% 52.1% 54.7% 45.3% 49.0% 51.0% 36.2% 63.8% 42.5% 57.5% 36.6% 63.4% 15.8% 51.0% 33.2% 51.5% 48.5% 47.9% 52.1% 52.7% 47.3% 50.5% 49.5% 44.4% 55.6% 63.9% 36.1%19 39.0% 61.0% 43.9% 56.1% 36.7% 63.3% 27.9% 72.1% 30.3% 69.7% 27.5% 72.5% 9.6% 60.3% 30.2% 42.7% 57.3% 33.3% 66.7% 42.5% 57.5% 35.3% 64.7% 32.8% 67.2% 51.2% 48.8%20 83.0% 17.0% 84.8% 15.2% 79.6% 20.4% 74.7% 25.3% 77.9% 22.1% 76.2% 23.8% 51.1% 19.2% 29.7% 80.8% 19.2% 75.5% 24.5% 79.7% 20.3% 76.4% 23.6% 74.1% 25.9% 82.7% 17.3%21 60.9% 39.1% 66.6% 33.4% 63.0% 37.0% 51.6% 48.4% 59.0% 41.0% 54.2% 45.8% 19.2% 36.0% 44.9% 63.9% 36.1% 65.3% 34.7% 71.0% 29.0% 68.0% 32.0% 63.7% 36.3% 76.9% 23.1%22 54.7% 45.3% 59.7% 40.3% 54.7% 45.3% 42.0% 58.0% 49.8% 50.2% 45.5% 54.5% 17.7% 43.5% 38.8% 57.1% 42.9% 55.1% 44.9% 61.3% 38.7% 57.8% 42.2% 52.7% 47.3% 68.0% 32.0%23 61.9% 38.1% 65.7% 34.3% 61.5% 38.5% 53.0% 47.0% 59.2% 40.8% 56.1% 43.9% 23.9% 36.7% 39.4% 62.2% 37.8% 62.8% 37.2% 70.0% 30.0% 64.7% 35.3% 61.9% 38.1% 73.1% 26.9%24 87.8% 12.2% 88.2% 11.8% 86.1% 13.9% 83.8% 16.2% 85.7% 14.3% 85.3% 14.7% 64.1% 13.3% 22.6% 86.5% 13.5% 81.3% 18.7% 84.6% 15.4% 80.8% 19.2% 80.4% 19.6% 85.1% 14.9%25 49.0% 51.0% 51.9% 48.1% 41.6% 58.4% 34.8% 65.2% 37.0% 63.0% 35.7% 64.3% 16.1% 60.3% 23.5% 45.8% 54.2% 38.0% 62.0% 45.7% 54.3% 40.1% 59.9% 38.6% 61.4% 50.6% 49.4%26 53.4% 46.6% 55.8% 44.2% 49.9% 50.1% 42.2% 57.8% 45.5% 54.5% 43.7% 56.3% 20.9% 51.5% 27.6% 49.8% 50.2% 47.1% 52.9% 53.5% 46.5% 48.5% 51.5% 46.7% 53.3% 57.2% 42.8%27 53.3% 46.7% 56.0% 44.0% 48.4% 51.6% 39.5% 60.5% 45.6% 54.4% 41.5% 58.5% 17.7% 55.1% 27.2% 48.8% 51.2% 44.6% 55.4% 51.6% 48.4% 47.7% 52.3% 44.7% 55.3% 55.9% 44.1%
SR27.4283

8/15/2014 Voter Registration and Turnout Remedial Plan (Congressional Districts--H000C9057)Page 3 of 4
2012 General Election Registered Voters 2012 General Election Voter Turnout Dist. RV who are: RV who are: Dems who are: Reps who are: Blks who Hisp. who are: Voters who are: Voters who are: Dems who are: Reps who are: Blks who Hisp. who are:
Dems Reps NPA-Oth Black Hisp. Black Hisp. Black Hisp. are Dems Dems Reps Dems Reps NPA-Oth Black Hisp. Black Hisp. Black Hisp. are Dems Dems Reps1 29.1% 51.9% 19.1% 11.3% 2.0% 31.2% 2.0% 1.3% 1.5% 80.3% 28.6% 40.1% 28.7% 55.8% 15.5% 11.4% 1.7% 33.4% 1.6% 1.0% 1.4% 83.9% 27.5% 44.8%2 51.8% 32.7% 15.5% 21.8% 2.2% 37.2% 1.8% 1.8% 1.9% 88.5% 42.3% 28.8% 53.0% 34.5% 12.5% 22.3% 2.0% 38.1% 1.6% 1.3% 1.8% 90.7% 42.7% 30.9%3 40.3% 40.6% 19.2% 10.9% 4.1% 22.7% 4.0% 1.2% 2.9% 83.8% 38.7% 28.9% 40.3% 43.8% 15.8% 10.8% 3.6% 23.3% 3.4% 0.9% 2.6% 86.7% 38.8% 31.6%4 32.7% 46.3% 21.0% 12.5% 3.8% 30.5% 4.0% 1.3% 2.5% 79.7% 34.8% 30.9% 32.6% 50.0% 17.3% 12.8% 3.2% 32.4% 3.4% 1.1% 2.2% 82.4% 35.1% 34.9%5 60.2% 20.9% 18.9% 47.6% 6.4% 68.0% 5.4% 6.6% 4.9% 86.1% 50.6% 16.1% 62.8% 22.4% 14.8% 49.9% 5.1% 70.7% 4.3% 5.2% 4.0% 89.0% 53.0% 17.7%6 34.3% 40.8% 24.9% 7.9% 3.2% 18.8% 3.9% 0.7% 1.9% 82.1% 41.3% 24.6% 34.2% 44.6% 21.2% 7.8% 2.8% 19.4% 3.4% 0.6% 1.8% 84.9% 41.9% 28.0%7 35.1% 37.9% 27.0% 9.5% 13.6% 21.2% 17.7% 1.2% 7.1% 78.1% 45.5% 19.7% 35.0% 41.9% 23.2% 9.6% 11.8% 22.2% 15.9% 1.0% 6.1% 80.8% 47.0% 21.7%8 33.4% 43.5% 23.1% 7.9% 4.6% 19.2% 5.8% 0.9% 2.9% 81.6% 41.9% 27.2% 33.1% 46.9% 20.0% 7.9% 4.1% 20.0% 5.2% 0.7% 2.6% 84.1% 42.2% 30.1%9 41.7% 28.4% 29.9% 8.4% 34.5% 15.6% 41.1% 1.3% 17.6% 77.1% 49.7% 14.5% 42.8% 31.9% 25.4% 9.2% 30.5% 17.2% 37.9% 1.1% 14.6% 80.1% 53.2% 15.3%
10 36.5% 38.1% 25.4% 10.8% 12.4% 24.0% 15.7% 1.3% 6.0% 81.0% 46.4% 18.5% 36.2% 41.8% 21.9% 11.1% 10.4% 25.7% 13.8% 1.1% 5.0% 83.6% 48.1% 20.2%11 35.1% 43.3% 21.7% 6.0% 4.8% 14.4% 6.8% 0.6% 2.7% 84.3% 50.0% 24.8% 34.3% 47.3% 18.4% 5.9% 3.9% 15.1% 5.9% 0.5% 2.2% 87.1% 51.7% 26.9%12 33.3% 40.2% 26.5% 3.8% 6.7% 8.6% 8.7% 0.6% 4.2% 75.1% 43.2% 25.1% 33.1% 43.8% 23.1% 4.0% 6.1% 9.3% 8.0% 0.5% 3.8% 77.3% 43.8% 27.8%13 35.2% 37.5% 27.3% 4.5% 3.9% 9.9% 5.0% 0.5% 2.3% 77.4% 44.4% 21.9% 35.7% 40.7% 23.6% 4.5% 3.5% 10.1% 4.5% 0.4% 2.1% 80.8% 46.4% 24.1%14 50.2% 24.5% 25.3% 25.5% 15.7% 42.3% 15.0% 3.4% 11.9% 83.3% 47.8% 18.5% 52.0% 26.8% 21.3% 26.4% 13.8% 43.8% 13.3% 2.6% 10.5% 86.0% 50.3% 20.4%15 37.7% 38.1% 24.1% 12.4% 9.0% 26.4% 10.3% 1.4% 5.5% 80.4% 43.0% 23.0% 38.0% 41.7% 20.3% 12.9% 7.8% 28.1% 9.1% 1.2% 4.8% 82.8% 44.3% 25.5%16 32.1% 43.5% 24.4% 4.9% 3.6% 12.5% 4.9% 0.5% 1.9% 81.2% 43.3% 23.2% 32.0% 46.8% 21.2% 4.8% 3.1% 12.7% 4.4% 0.4% 1.6% 84.6% 45.2% 24.6%17 36.0% 41.2% 22.7% 7.3% 7.3% 16.6% 9.1% 0.8% 4.1% 82.1% 45.1% 23.0% 35.5% 45.3% 19.2% 7.5% 5.8% 18.1% 7.7% 0.6% 3.2% 84.9% 47.1% 25.4%18 36.2% 38.1% 25.7% 9.6% 6.3% 21.5% 7.8% 1.1% 3.8% 81.1% 44.7% 23.1% 36.2% 41.4% 22.5% 9.9% 5.5% 22.8% 7.0% 0.9% 3.4% 83.6% 45.7% 25.8%19 27.5% 46.5% 25.9% 4.7% 7.1% 13.0% 10.6% 0.5% 3.6% 77.0% 41.3% 23.9% 26.8% 51.3% 22.0% 4.5% 5.6% 13.5% 9.2% 0.4% 2.9% 80.7% 43.5% 26.7%20 65.6% 13.3% 21.1% 48.0% 10.8% 61.7% 8.3% 10.4% 14.1% 84.4% 50.2% 17.3% 69.7% 12.8% 17.5% 52.2% 9.6% 65.3% 7.2% 9.0% 13.6% 87.1% 52.3% 18.3%21 46.8% 25.8% 27.4% 8.9% 11.6% 14.7% 11.2% 1.4% 8.8% 77.0% 45.2% 19.7% 48.4% 26.9% 24.8% 9.6% 10.6% 15.8% 10.1% 1.3% 8.3% 79.4% 46.1% 21.2%22 40.8% 31.8% 27.4% 7.7% 9.2% 14.9% 10.0% 1.0% 6.4% 79.3% 44.4% 22.0% 41.7% 33.8% 24.5% 8.0% 8.5% 15.7% 9.1% 0.8% 6.1% 81.9% 44.8% 24.3%23 47.1% 24.9% 28.0% 9.7% 26.3% 16.4% 22.8% 1.5% 27.3% 79.8% 40.9% 25.8% 48.8% 26.1% 25.1% 10.4% 26.3% 17.6% 22.1% 1.4% 28.0% 82.3% 40.9% 27.7%24 68.6% 10.4% 20.9% 55.2% 22.9% 68.8% 15.5% 13.9% 47.7% 85.5% 46.3% 21.7% 72.4% 9.8% 17.8% 59.1% 20.7% 71.6% 13.7% 12.6% 48.3% 87.8% 47.8% 22.8%25 32.4% 38.4% 29.2% 6.3% 58.1% 15.5% 53.4% 0.8% 58.3% 79.3% 29.8% 38.5% 32.3% 42.0% 25.7% 7.0% 55.2% 17.7% 49.7% 0.7% 55.7% 82.0% 29.1% 42.4%26 35.6% 35.2% 29.3% 9.3% 57.3% 21.2% 45.3% 1.1% 66.2% 80.8% 28.1% 40.6% 36.1% 38.4% 25.5% 9.7% 56.1% 22.5% 42.2% 0.9% 65.9% 83.8% 27.2% 45.0%27 35.8% 35.9% 28.3% 7.0% 60.5% 15.8% 48.3% 0.8% 71.0% 80.5% 28.6% 42.1% 36.1% 38.6% 25.2% 7.1% 59.7% 16.3% 45.7% 0.6% 71.0% 83.1% 27.7% 46.0%
2010 General Election Registered Voters 2010 General Election Voter Turnout 2010 Primary Turnout Dist. RV who are: RV who are: Dems who are: Reps who are: Blks who Hisp. who are: Voters who are: Voters who are: Dems who are: Reps who are: Blks who Hisp. who are: Dems who are: Reps who
Dems Reps NPA-Oth Black Hisp. Black Hisp. Black Hisp. are Dems Dems Reps Dems Reps NPA-Oth Black Hisp. Black Hisp. Black Hisp. are Dems Dems Reps Black Hisp are Hisp.1 31.0% 50.9% 18.1% 11.0% 1.8% 28.6% 1.7% 1.4% 1.4% 80.6% 29.6% 40.4% 29.2% 59.8% 11.0% 9.6% 1.1% 28.6% 0.9% 0.9% 1.0% 87.3% 24.8% 55.7% 24.3% 0.7% 0.7%2 54.3% 31.7% 14.0% 21.0% 1.8% 34.7% 1.5% 1.8% 1.7% 89.7% 44.6% 30.0% 54.9% 36.0% 9.1% 19.2% 1.2% 32.7% 0.9% 1.1% 1.3% 93.5% 42.6% 37.7% 29.1% 0.6% 1.0%3 43.5% 38.8% 17.7% 10.7% 3.7% 21.0% 3.4% 1.3% 2.8% 85.3% 40.7% 30.0% 42.5% 45.7% 11.8% 8.7% 2.2% 18.3% 1.9% 0.7% 1.9% 89.9% 36.3% 40.3% 16.7% 0.9% 1.4%4 34.9% 45.5% 19.6% 12.9% 3.4% 29.9% 3.5% 1.4% 2.4% 80.9% 35.9% 31.9% 33.0% 54.0% 12.9% 11.0% 2.1% 28.3% 2.0% 1.0% 1.8% 85.1% 31.6% 45.1% 22.8% 1.2% 1.3%5 60.1% 22.0% 17.9% 45.1% 5.8% 65.3% 4.9% 6.3% 4.6% 86.9% 51.0% 17.4% 60.6% 28.5% 10.9% 43.7% 3.3% 66.2% 2.8% 3.6% 2.9% 92.0% 52.0% 25.4% 64.1% 1.9% 2.0%6 36.1% 40.1% 23.8% 7.8% 2.9% 17.8% 3.4% 0.8% 1.8% 82.9% 42.3% 24.6% 34.1% 48.7% 17.1% 6.3% 1.9% 16.4% 2.3% 0.4% 1.3% 88.9% 41.2% 34.9% 16.4% 1.4% 1.0%7 35.9% 38.7% 25.4% 9.2% 12.5% 20.2% 16.1% 1.2% 6.8% 79.0% 46.2% 20.9% 33.3% 49.1% 17.6% 7.9% 7.8% 19.9% 10.6% 0.8% 4.7% 83.3% 44.9% 29.3% 17.7% 7.5% 3.4%8 35.0% 43.9% 21.1% 7.5% 4.2% 17.6% 5.2% 0.9% 2.7% 82.7% 43.2% 28.1% 32.3% 52.2% 15.4% 6.2% 2.8% 16.7% 3.6% 0.6% 2.0% 86.7% 40.7% 37.7% 15.7% 2.5% 1.6%9 42.5% 30.1% 27.3% 8.0% 32.2% 14.7% 38.6% 1.3% 17.4% 78.2% 51.0% 16.3% 40.7% 41.3% 18.0% 8.1% 20.6% 16.6% 27.6% 0.9% 11.0% 83.3% 54.5% 22.1% 13.1% 19.7% 7.5%
10 37.4% 39.0% 23.6% 10.5% 11.0% 22.9% 13.7% 1.3% 5.6% 81.9% 46.6% 20.1% 34.0% 49.2% 16.8% 9.3% 6.0% 23.6% 8.0% 0.9% 3.5% 86.3% 45.7% 28.7% 21.3% 5.0% 2.4%11 36.9% 42.2% 20.8% 5.8% 4.4% 13.3% 6.1% 0.7% 2.6% 84.6% 50.8% 24.9% 33.6% 50.7% 15.7% 4.8% 2.4% 12.8% 3.6% 0.4% 1.6% 89.7% 50.1% 33.8% 11.9% 2.1% 1.1%12 34.7% 40.1% 25.2% 3.5% 6.0% 7.7% 7.6% 0.5% 3.8% 75.8% 44.3% 25.8% 32.6% 48.6% 18.9% 3.1% 3.8% 7.7% 4.8% 0.4% 2.8% 79.6% 41.0% 36.2% 6.1% 2.9% 2.0%13 36.2% 37.9% 25.8% 4.1% 3.5% 8.8% 4.3% 0.5% 2.1% 77.8% 44.6% 23.1% 35.2% 45.8% 19.0% 3.0% 2.1% 7.2% 2.6% 0.3% 1.5% 84.7% 43.1% 33.1% 5.7% 1.9% 1.2%14 51.0% 25.4% 23.6% 24.9% 14.1% 41.0% 13.0% 3.5% 11.3% 84.0% 47.1% 20.3% 51.5% 32.8% 15.6% 23.0% 8.4% 40.0% 7.6% 2.1% 7.9% 89.6% 46.5% 30.6% 38.5% 4.2% 5.6%15 39.0% 38.6% 22.4% 11.8% 8.1% 24.6% 9.1% 1.4% 5.2% 81.6% 43.6% 24.4% 37.3% 47.8% 14.9% 10.2% 4.6% 23.5% 5.1% 0.9% 3.4% 85.9% 41.0% 35.6% 20.6% 2.6% 2.4%16 32.8% 43.6% 23.5% 4.7% 3.1% 11.6% 4.1% 0.6% 1.8% 81.0% 42.7% 24.5% 30.8% 51.5% 17.7% 3.4% 1.7% 9.7% 2.3% 0.3% 1.1% 87.4% 41.1% 34.6% 9.5% 1.4% 0.9%17 37.8% 40.5% 21.7% 7.0% 7.0% 15.3% 8.5% 0.8% 4.0% 82.5% 46.1% 23.3% 34.8% 49.8% 15.4% 5.7% 3.4% 14.3% 4.5% 0.5% 2.3% 87.4% 45.2% 33.5% 11.5% 2.7% 1.6%18 37.3% 38.0% 24.7% 9.0% 5.7% 19.6% 7.0% 1.0% 3.5% 81.6% 45.9% 23.5% 34.8% 46.6% 18.7% 7.5% 3.4% 18.7% 4.2% 0.7% 2.5% 86.4% 43.6% 34.5% 18.0% 2.7% 1.8%19 28.3% 47.2% 24.5% 4.2% 6.2% 11.4% 9.2% 0.5% 3.4% 77.6% 41.8% 25.4% 24.4% 58.0% 17.6% 2.6% 3.1% 8.8% 4.9% 0.3% 2.0% 83.3% 39.1% 38.6% 7.7% 2.8% 1.5%20 65.2% 14.5% 20.4% 45.6% 10.1% 59.0% 7.7% 10.3% 13.1% 84.4% 50.0% 18.9% 69.9% 16.6% 13.5% 48.4% 6.3% 62.1% 4.5% 6.9% 10.1% 89.8% 49.7% 26.8% 61.6% 2.7% 8.3%21 48.1% 26.0% 25.9% 7.9% 10.1% 12.6% 9.6% 1.4% 8.0% 77.3% 45.7% 20.6% 50.1% 29.8% 20.1% 7.5% 6.2% 12.2% 5.3% 1.1% 6.1% 81.8% 43.1% 29.4% 10.1% 2.8% 4.8%22 41.6% 32.6% 25.8% 7.2% 8.1% 13.8% 8.6% 1.0% 5.8% 79.9% 44.6% 23.3% 41.2% 39.2% 19.6% 6.1% 5.2% 12.5% 5.3% 0.6% 4.4% 84.8% 42.0% 33.4% 11.2% 3.1% 3.4%23 48.5% 25.7% 25.8% 9.0% 24.1% 15.0% 20.5% 1.5% 26.4% 80.4% 41.2% 28.1% 50.4% 30.8% 18.8% 9.4% 19.7% 15.9% 14.3% 1.2% 25.0% 85.0% 36.7% 39.1% 15.9% 9.2% 24.0%24 69.3% 11.1% 19.6% 55.9% 21.5% 69.1% 14.3% 15.1% 46.7% 85.7% 46.1% 24.1% 75.7% 11.3% 13.0% 62.8% 15.7% 74.8% 9.2% 11.8% 45.4% 90.3% 44.2% 32.7% 78.9% 5.4% 43.7%25 32.4% 40.1% 27.5% 6.4% 55.4% 15.7% 49.5% 0.8% 57.5% 79.5% 28.9% 41.5% 29.0% 51.6% 19.3% 7.0% 49.1% 20.4% 38.6% 0.6% 53.7% 84.8% 22.8% 56.5% 22.9% 31.9% 52.4%26 35.8% 36.8% 27.4% 9.4% 55.5% 21.4% 42.6% 1.1% 65.6% 81.0% 27.5% 43.5% 35.3% 45.9% 18.8% 9.8% 51.4% 24.0% 32.8% 0.7% 64.2% 86.9% 22.5% 57.4% 25.5% 22.7% 63.6%27 35.8% 38.2% 26.0% 7.0% 59.2% 16.0% 45.4% 0.8% 70.8% 81.4% 27.4% 45.6% 34.0% 47.6% 18.4% 6.3% 56.7% 16.1% 35.5% 0.5% 70.9% 86.3% 21.3% 59.5% 15.6% 29.2% 74.3%
SR27.4284
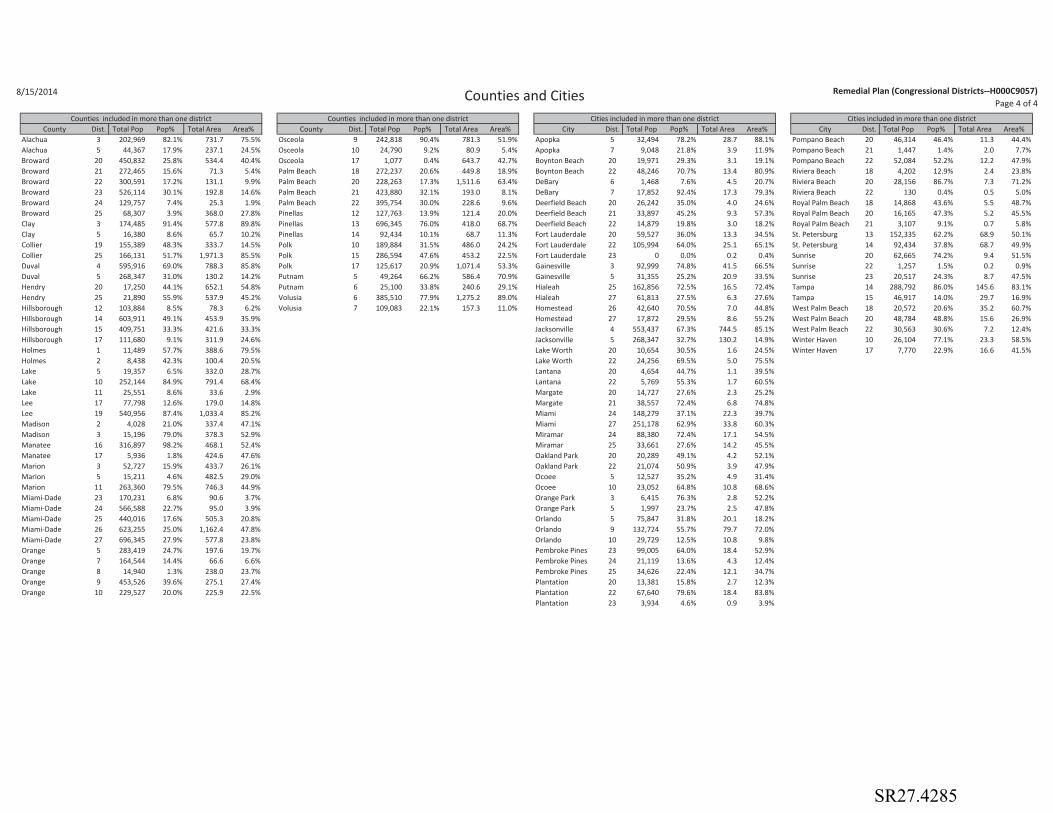
8/15/2014 Counties and Cities Remedial Plan (Congressional Districts--H000C9057)Page 4 of 4
Counties included in more than one district Counties included in more than one district Cities included in more than one district Cities included in more than one districtCounty Dist. Total Pop Pop% Total Area Area% County Dist. Total Pop Pop% Total Area Area% City Dist. Total Pop Pop% Total Area Area% City Dist. Total Pop Pop% Total Area Area%
Alachua 3 202,969 82.1% 731.7 75.5% Osceola 9 242,818 90.4% 781.3 51.9% Apopka 5 32,494 78.2% 28.7 88.1% Pompano Beach 20 46,314 46.4% 11.3 44.4%Alachua 5 44,367 17.9% 237.1 24.5% Osceola 10 24,790 9.2% 80.9 5.4% Apopka 7 9,048 21.8% 3.9 11.9% Pompano Beach 21 1,447 1.4% 2.0 7.7%Broward 20 450,832 25.8% 534.4 40.4% Osceola 17 1,077 0.4% 643.7 42.7% Boynton Beach 20 19,971 29.3% 3.1 19.1% Pompano Beach 22 52,084 52.2% 12.2 47.9%Broward 21 272,465 15.6% 71.3 5.4% Palm Beach 18 272,237 20.6% 449.8 18.9% Boynton Beach 22 48,246 70.7% 13.4 80.9% Riviera Beach 18 4,202 12.9% 2.4 23.8%Broward 22 300,591 17.2% 131.1 9.9% Palm Beach 20 228,263 17.3% 1,511.6 63.4% DeBary 6 1,468 7.6% 4.5 20.7% Riviera Beach 20 28,156 86.7% 7.3 71.2%Broward 23 526,114 30.1% 192.8 14.6% Palm Beach 21 423,880 32.1% 193.0 8.1% DeBary 7 17,852 92.4% 17.3 79.3% Riviera Beach 22 130 0.4% 0.5 5.0%Broward 24 129,757 7.4% 25.3 1.9% Palm Beach 22 395,754 30.0% 228.6 9.6% Deerfield Beach 20 26,242 35.0% 4.0 24.6% Royal Palm Beach 18 14,868 43.6% 5.5 48.7%Broward 25 68,307 3.9% 368.0 27.8% Pinellas 12 127,763 13.9% 121.4 20.0% Deerfield Beach 21 33,897 45.2% 9.3 57.3% Royal Palm Beach 20 16,165 47.3% 5.2 45.5%Clay 3 174,485 91.4% 577.8 89.8% Pinellas 13 696,345 76.0% 418.0 68.7% Deerfield Beach 22 14,879 19.8% 3.0 18.2% Royal Palm Beach 21 3,107 9.1% 0.7 5.8%Clay 5 16,380 8.6% 65.7 10.2% Pinellas 14 92,434 10.1% 68.7 11.3% Fort Lauderdale 20 59,527 36.0% 13.3 34.5% St. Petersburg 13 152,335 62.2% 68.9 50.1%Collier 19 155,389 48.3% 333.7 14.5% Polk 10 189,884 31.5% 486.0 24.2% Fort Lauderdale 22 105,994 64.0% 25.1 65.1% St. Petersburg 14 92,434 37.8% 68.7 49.9%Collier 25 166,131 51.7% 1,971.3 85.5% Polk 15 286,594 47.6% 453.2 22.5% Fort Lauderdale 23 0 0.0% 0.2 0.4% Sunrise 20 62,665 74.2% 9.4 51.5%Duval 4 595,916 69.0% 788.3 85.8% Polk 17 125,617 20.9% 1,071.4 53.3% Gainesville 3 92,999 74.8% 41.5 66.5% Sunrise 22 1,257 1.5% 0.2 0.9%Duval 5 268,347 31.0% 130.2 14.2% Putnam 5 49,264 66.2% 586.4 70.9% Gainesville 5 31,355 25.2% 20.9 33.5% Sunrise 23 20,517 24.3% 8.7 47.5%Hendry 20 17,250 44.1% 652.1 54.8% Putnam 6 25,100 33.8% 240.6 29.1% Hialeah 25 162,856 72.5% 16.5 72.4% Tampa 14 288,792 86.0% 145.6 83.1%Hendry 25 21,890 55.9% 537.9 45.2% Volusia 6 385,510 77.9% 1,275.2 89.0% Hialeah 27 61,813 27.5% 6.3 27.6% Tampa 15 46,917 14.0% 29.7 16.9%Hillsborough 12 103,884 8.5% 78.3 6.2% Volusia 7 109,083 22.1% 157.3 11.0% Homestead 26 42,640 70.5% 7.0 44.8% West Palm Beach 18 20,572 20.6% 35.2 60.7%Hillsborough 14 603,911 49.1% 453.9 35.9% Homestead 27 17,872 29.5% 8.6 55.2% West Palm Beach 20 48,784 48.8% 15.6 26.9%Hillsborough 15 409,751 33.3% 421.6 33.3% Jacksonville 4 553,437 67.3% 744.5 85.1% West Palm Beach 22 30,563 30.6% 7.2 12.4%Hillsborough 17 111,680 9.1% 311.9 24.6% Jacksonville 5 268,347 32.7% 130.2 14.9% Winter Haven 10 26,104 77.1% 23.3 58.5%Holmes 1 11,489 57.7% 388.6 79.5% Lake Worth 20 10,654 30.5% 1.6 24.5% Winter Haven 17 7,770 22.9% 16.6 41.5%Holmes 2 8,438 42.3% 100.4 20.5% Lake Worth 22 24,256 69.5% 5.0 75.5%Lake 5 19,357 6.5% 332.0 28.7% Lantana 20 4,654 44.7% 1.1 39.5%Lake 10 252,144 84.9% 791.4 68.4% Lantana 22 5,769 55.3% 1.7 60.5%Lake 11 25,551 8.6% 33.6 2.9% Margate 20 14,727 27.6% 2.3 25.2%Lee 17 77,798 12.6% 179.0 14.8% Margate 21 38,557 72.4% 6.8 74.8%Lee 19 540,956 87.4% 1,033.4 85.2% Miami 24 148,279 37.1% 22.3 39.7%Madison 2 4,028 21.0% 337.4 47.1% Miami 27 251,178 62.9% 33.8 60.3%Madison 3 15,196 79.0% 378.3 52.9% Miramar 24 88,380 72.4% 17.1 54.5%Manatee 16 316,897 98.2% 468.1 52.4% Miramar 25 33,661 27.6% 14.2 45.5%Manatee 17 5,936 1.8% 424.6 47.6% Oakland Park 20 20,289 49.1% 4.2 52.1%Marion 3 52,727 15.9% 433.7 26.1% Oakland Park 22 21,074 50.9% 3.9 47.9%Marion 5 15,211 4.6% 482.5 29.0% Ocoee 5 12,527 35.2% 4.9 31.4%Marion 11 263,360 79.5% 746.3 44.9% Ocoee 10 23,052 64.8% 10.8 68.6%Miami-Dade 23 170,231 6.8% 90.6 3.7% Orange Park 3 6,415 76.3% 2.8 52.2%Miami-Dade 24 566,588 22.7% 95.0 3.9% Orange Park 5 1,997 23.7% 2.5 47.8%Miami-Dade 25 440,016 17.6% 505.3 20.8% Orlando 5 75,847 31.8% 20.1 18.2%Miami-Dade 26 623,255 25.0% 1,162.4 47.8% Orlando 9 132,724 55.7% 79.7 72.0%Miami-Dade 27 696,345 27.9% 577.8 23.8% Orlando 10 29,729 12.5% 10.8 9.8%Orange 5 283,419 24.7% 197.6 19.7% Pembroke Pines 23 99,005 64.0% 18.4 52.9%Orange 7 164,544 14.4% 66.6 6.6% Pembroke Pines 24 21,119 13.6% 4.3 12.4%Orange 8 14,940 1.3% 238.0 23.7% Pembroke Pines 25 34,626 22.4% 12.1 34.7%Orange 9 453,526 39.6% 275.1 27.4% Plantation 20 13,381 15.8% 2.7 12.3%Orange 10 229,527 20.0% 225.9 22.5% Plantation 22 67,640 79.6% 18.4 83.8%
Plantation 23 3,934 4.6% 0.9 3.9%
SR27.4285

TAB 10

2
1
3
5
17
6
26
89
25
4
11
20
18
19
16
12
7
15
27
10
1413
22
23
21
24
MONROE
POLK
LEE
COLLIER
LEVY
BAY
LAKE
MARION
MIAMI-DADE
PALM BEACH
BREVARD
VOLUSIA
OSCEOLA
TAYLOR
DIXIE
WALTON
GULF
HENDRY
DUVAL
PASCO
LEON
BROWARD
CLAY
GLADES
ORANGE
CITRUS
JACKSON
LIBERTY
FRANKLIN
OK
ALO
OSA
ALACHUAPUTNAM
SANTA ROSA
MARTIN
HIGHLANDS
NASSAU
MANATEE
ST. JOH
NS
BAKER
ESCAM
BIA
HILLSBOROUGH
DESOTO
MADISON
HARDEE
COLU
MBI
A
WAKULLA
ST. LUCIE
SUM
TER
CHARLOTTE
SARASOTA
OKEECHOBEE
SUWANNEE
HOLMES
JEFF
ERSO
N
CALHOUN
GADSDEN
HERNANDO
HAMILTON
LAFAYETTE
WASHINGTON
INDIAN RIVER
UNION
GILCH
RIST
BRADFORD
CoalitionRemedial Map A
("CP-A")30-Jul-2014
20
18
2726
25
22
23
21
24
Miami
Davie
Wellington
Jupiter
Miramar
Weston
Hialeah
Hollywood
Doral
Plantation
West Palm Beach
Coral Gables
Boca Raton
Palm Beach Gardens
Sunrise
Pembroke Pines
Fort Lauderdale
Coral SpringsPompano Beach
Parkland
Tamarac
Homestead
Miami Gardens
Delray Beach
Miami Beach
Boynton Beach
Deerfield Beach
Cutler Bay
Palm Beach
Lauderhill
Pinecrest
North Miami
Medley
Riviera Beach
Cooper City
Palmetto Bay
Royal Palm Beach
Loxahatchee Groves
Oakland Park
Lake WorthGreenacres
Florida City
Miami Lakes
Southwest Ranches Dania Beach
Aventura
Lantana
Jupiter Island
Tequesta
Palm Springs
Pahokee
South Miami
Sweetwater
Belle Glade
PALM BEACH
MIAMI-DADE
BROWARD
MARTIN
4
3
5
6
Jacksonville
Jacksonville Beach
Atlantic Beach
Starke
Green Cove Springs
Neptune Beach
Orange Park
St. Augustine
Baldwin
Lawtey
Callahan
DUVAL
CLAY
ST. JOHNS
NASSAU
7
9
8
10
6
11
6
Orlando
DeBary
Sanford
Bay Lake
Ocoee
Oviedo
Eustis
Kissimmee
Deltona
Apopka
Mount Dora
Winter Springs
Winter Garden
Lake Mary
Winter ParkMaitland
Belle Isle
Titusville
Oak Hill
Lake Buena Vista
Windermere
St. Cloud
ORANGE
LAKE
SEMINOLE
OSCEOLA
VOLUSIA
12
17
14
15
13
16
11
Tampa
St. Petersburg
Dunedin
Plant CityClearwater
Largo
Bradenton
St. Pete Beach
Pinellas Park
Tarpon Springs
Oldsmar
Zephyrhills
Palmetto
Seminole
Temple Terrace
Gulfport
Belleair
Treasure Island
New Port Richey
Port Richey
St. Leo
Holmes Beach
Dade City
PASCO
HILLSBOROUGHPINELLAS
MANATEE
Tampa Bay Area
Jacksonville Area
Orlando Area
South Florida
"
LegendCounty boundaryInterstateUS HighwayMajor roadSea, lake, or riverDistrict boundary & number10
Map produced by professional staff:Florida Senate Committee on Reapportionment404 S. Monroe St., Tallahassee, FL 32399-1100
Office: 103 SOB; Phone: (850) 487-5855;Website: http://www.flsenate.gov/session/redistricting
0 10 205Miles
Scale bar for insets
Scale bar for statewide map
0 10 20 30 40 50 605Miles
SR27.4286
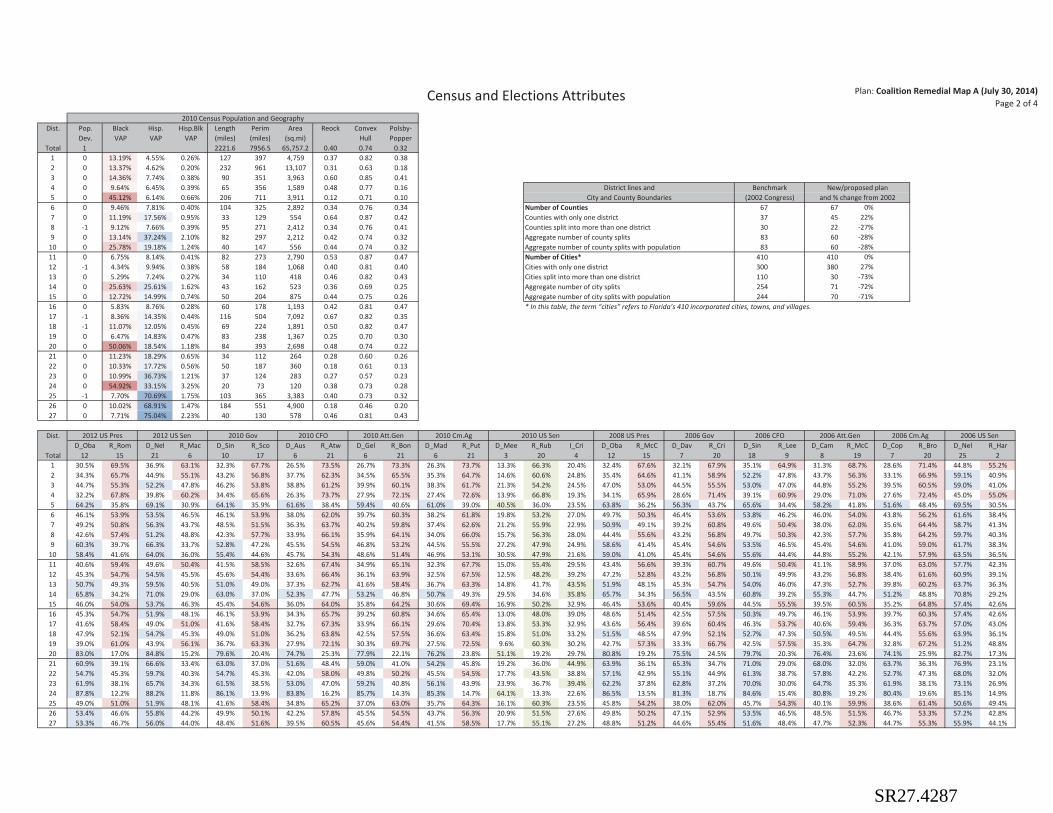
Census and Elections Attributes Plan: Coalition Remedial Map A (July 30, 2014)Page 2 of 4
2010 Census Population and Geography Dist. Pop. Black Hisp. Hisp.Blk Length Perim Area Reock Convex Polsby-
Dev. VAP VAP VAP (miles) (miles) (sq.mi) Hull Popper Total 1 2221.6 7956.5 65,757.2 0.40 0.74 0.32
1 0 13.19% 4.55% 0.26% 127 397 4,759 0.37 0.82 0.382 0 13.37% 4.62% 0.20% 232 961 13,107 0.31 0.63 0.183 0 14.36% 7.74% 0.38% 90 351 3,963 0.60 0.85 0.414 0 9.64% 6.45% 0.39% 65 356 1,589 0.48 0.77 0.16 District lines and Benchmark New/proposed plan5 0 45.12% 6.14% 0.66% 206 711 3,911 0.12 0.71 0.10 City and County Boundaries (2002 Congress) and % change from 20026 0 9.46% 7.81% 0.40% 104 325 2,892 0.34 0.76 0.34 Number of Counties 67 67 0%7 0 11.19% 17.56% 0.95% 33 129 554 0.64 0.87 0.42 Counties with only one district 37 45 22%8 -1 9.12% 7.66% 0.39% 95 271 2,412 0.34 0.76 0.41 Counties split into more than one district 30 22 -27%9 0 13.14% 37.24% 2.10% 82 297 2,212 0.42 0.74 0.32 Aggregate number of county splits 83 60 -28%
10 0 25.78% 19.18% 1.24% 40 147 556 0.44 0.74 0.32 Aggregate number of county splits with population 83 60 -28%11 0 6.75% 8.14% 0.41% 82 273 2,790 0.53 0.87 0.47 Number of Cities* 410 410 0%12 -1 4.34% 9.94% 0.38% 58 184 1,068 0.40 0.81 0.40 Cities with only one district 300 380 27%13 0 5.29% 7.24% 0.27% 34 110 418 0.46 0.82 0.43 Cities split into more than one district 110 30 -73%14 0 25.63% 25.61% 1.62% 43 162 523 0.36 0.69 0.25 Aggregate number of city splits 254 71 -72%15 0 12.72% 14.99% 0.74% 50 204 875 0.44 0.75 0.26 Aggregate number of city splits with population 244 70 -71%16 0 5.83% 8.76% 0.28% 60 178 1,193 0.42 0.81 0.47 * In this table, the term “cities” refers to Florida’s 410 incorporated cities, towns, and villages.17 -1 8.36% 14.35% 0.44% 116 504 7,092 0.67 0.82 0.3518 -1 11.07% 12.05% 0.45% 69 224 1,891 0.50 0.82 0.4719 0 6.47% 14.83% 0.47% 83 238 1,367 0.25 0.70 0.3020 0 50.06% 18.54% 1.18% 84 393 2,698 0.48 0.74 0.2221 0 11.23% 18.29% 0.65% 34 112 264 0.28 0.60 0.2622 0 10.33% 17.72% 0.56% 50 187 360 0.18 0.61 0.1323 0 10.99% 36.73% 1.21% 37 124 283 0.27 0.57 0.2324 0 54.92% 33.15% 3.25% 20 73 120 0.38 0.73 0.2825 -1 7.70% 70.69% 1.75% 103 365 3,383 0.40 0.73 0.3226 0 10.02% 68.91% 1.47% 184 551 4,900 0.18 0.46 0.2027 0 7.71% 75.04% 2.23% 40 130 578 0.46 0.81 0.43
Dist. 2012 US Pres 2012 US Sen 2010 Gov 2010 CFO 2010 Att.Gen 2010 Cm.Ag 2010 US Sen 2008 US Pres 2006 Gov 2006 CFO 2006 Att.Gen 2006 Cm.Ag 2006 US Sen D_Oba R_Rom D_Nel R_Mac D_Sin R_Sco D_Aus R_Atw D_Gel R_Bon D_Mad R_Put D_Mee R_Rub I_Cri D_Oba R_McC D_Dav R_Cri D_Sin R_Lee D_Cam R_McC D_Cop R_Bro D_Nel R_Har
Total 12 15 21 6 10 17 6 21 6 21 6 21 3 20 4 12 15 7 20 18 9 8 19 7 20 25 21 30.5% 69.5% 36.9% 63.1% 32.3% 67.7% 26.5% 73.5% 26.7% 73.3% 26.3% 73.7% 13.3% 66.3% 20.4% 32.4% 67.6% 32.1% 67.9% 35.1% 64.9% 31.3% 68.7% 28.6% 71.4% 44.8% 55.2%2 34.3% 65.7% 44.9% 55.1% 43.2% 56.8% 37.7% 62.3% 34.5% 65.5% 35.3% 64.7% 14.6% 60.6% 24.8% 35.4% 64.6% 41.1% 58.9% 52.2% 47.8% 43.7% 56.3% 33.1% 66.9% 59.1% 40.9%3 44.7% 55.3% 52.2% 47.8% 46.2% 53.8% 38.8% 61.2% 39.9% 60.1% 38.3% 61.7% 21.3% 54.2% 24.5% 47.0% 53.0% 44.5% 55.5% 53.0% 47.0% 44.8% 55.2% 39.5% 60.5% 59.0% 41.0%4 32.2% 67.8% 39.8% 60.2% 34.4% 65.6% 26.3% 73.7% 27.9% 72.1% 27.4% 72.6% 13.9% 66.8% 19.3% 34.1% 65.9% 28.6% 71.4% 39.1% 60.9% 29.0% 71.0% 27.6% 72.4% 45.0% 55.0%5 64.2% 35.8% 69.1% 30.9% 64.1% 35.9% 61.6% 38.4% 59.4% 40.6% 61.0% 39.0% 40.5% 36.0% 23.5% 63.8% 36.2% 56.3% 43.7% 65.6% 34.4% 58.2% 41.8% 51.6% 48.4% 69.5% 30.5%6 46.1% 53.9% 53.5% 46.5% 46.1% 53.9% 38.0% 62.0% 39.7% 60.3% 38.2% 61.8% 19.8% 53.2% 27.0% 49.7% 50.3% 46.4% 53.6% 53.8% 46.2% 46.0% 54.0% 43.8% 56.2% 61.6% 38.4%7 49.2% 50.8% 56.3% 43.7% 48.5% 51.5% 36.3% 63.7% 40.2% 59.8% 37.4% 62.6% 21.2% 55.9% 22.9% 50.9% 49.1% 39.2% 60.8% 49.6% 50.4% 38.0% 62.0% 35.6% 64.4% 58.7% 41.3%8 42.6% 57.4% 51.2% 48.8% 42.3% 57.7% 33.9% 66.1% 35.9% 64.1% 34.0% 66.0% 15.7% 56.3% 28.0% 44.4% 55.6% 43.2% 56.8% 49.7% 50.3% 42.3% 57.7% 35.8% 64.2% 59.7% 40.3%9 60.3% 39.7% 66.3% 33.7% 52.8% 47.2% 45.5% 54.5% 46.8% 53.2% 44.5% 55.5% 27.2% 47.9% 24.9% 58.6% 41.4% 45.4% 54.6% 53.5% 46.5% 45.4% 54.6% 41.0% 59.0% 61.7% 38.3%
10 58.4% 41.6% 64.0% 36.0% 55.4% 44.6% 45.7% 54.3% 48.6% 51.4% 46.9% 53.1% 30.5% 47.9% 21.6% 59.0% 41.0% 45.4% 54.6% 55.6% 44.4% 44.8% 55.2% 42.1% 57.9% 63.5% 36.5%11 40.6% 59.4% 49.6% 50.4% 41.5% 58.5% 32.6% 67.4% 34.9% 65.1% 32.3% 67.7% 15.0% 55.4% 29.5% 43.4% 56.6% 39.3% 60.7% 49.6% 50.4% 41.1% 58.9% 37.0% 63.0% 57.7% 42.3%12 45.3% 54.7% 54.5% 45.5% 45.6% 54.4% 33.6% 66.4% 36.1% 63.9% 32.5% 67.5% 12.5% 48.2% 39.2% 47.2% 52.8% 43.2% 56.8% 50.1% 49.9% 43.2% 56.8% 38.4% 61.6% 60.9% 39.1%13 50.7% 49.3% 59.5% 40.5% 51.0% 49.0% 37.3% 62.7% 41.6% 58.4% 36.7% 63.3% 14.8% 41.7% 43.5% 51.9% 48.1% 45.3% 54.7% 54.0% 46.0% 47.3% 52.7% 39.8% 60.2% 63.7% 36.3%14 65.8% 34.2% 71.0% 29.0% 63.0% 37.0% 52.3% 47.7% 53.2% 46.8% 50.7% 49.3% 29.5% 34.6% 35.8% 65.7% 34.3% 56.5% 43.5% 60.8% 39.2% 55.3% 44.7% 51.2% 48.8% 70.8% 29.2%15 46.0% 54.0% 53.7% 46.3% 45.4% 54.6% 36.0% 64.0% 35.8% 64.2% 30.6% 69.4% 16.9% 50.2% 32.9% 46.4% 53.6% 40.4% 59.6% 44.5% 55.5% 39.5% 60.5% 35.2% 64.8% 57.4% 42.6%16 45.3% 54.7% 51.9% 48.1% 46.1% 53.9% 34.3% 65.7% 39.2% 60.8% 34.6% 65.4% 13.0% 48.0% 39.0% 48.6% 51.4% 42.5% 57.5% 50.3% 49.7% 46.1% 53.9% 39.7% 60.3% 57.4% 42.6%17 41.6% 58.4% 49.0% 51.0% 41.6% 58.4% 32.7% 67.3% 33.9% 66.1% 29.6% 70.4% 13.8% 53.3% 32.9% 43.6% 56.4% 39.6% 60.4% 46.3% 53.7% 40.6% 59.4% 36.3% 63.7% 57.0% 43.0%18 47.9% 52.1% 54.7% 45.3% 49.0% 51.0% 36.2% 63.8% 42.5% 57.5% 36.6% 63.4% 15.8% 51.0% 33.2% 51.5% 48.5% 47.9% 52.1% 52.7% 47.3% 50.5% 49.5% 44.4% 55.6% 63.9% 36.1%19 39.0% 61.0% 43.9% 56.1% 36.7% 63.3% 27.9% 72.1% 30.3% 69.7% 27.5% 72.5% 9.6% 60.3% 30.2% 42.7% 57.3% 33.3% 66.7% 42.5% 57.5% 35.3% 64.7% 32.8% 67.2% 51.2% 48.8%20 83.0% 17.0% 84.8% 15.2% 79.6% 20.4% 74.7% 25.3% 77.9% 22.1% 76.2% 23.8% 51.1% 19.2% 29.7% 80.8% 19.2% 75.5% 24.5% 79.7% 20.3% 76.4% 23.6% 74.1% 25.9% 82.7% 17.3%21 60.9% 39.1% 66.6% 33.4% 63.0% 37.0% 51.6% 48.4% 59.0% 41.0% 54.2% 45.8% 19.2% 36.0% 44.9% 63.9% 36.1% 65.3% 34.7% 71.0% 29.0% 68.0% 32.0% 63.7% 36.3% 76.9% 23.1%22 54.7% 45.3% 59.7% 40.3% 54.7% 45.3% 42.0% 58.0% 49.8% 50.2% 45.5% 54.5% 17.7% 43.5% 38.8% 57.1% 42.9% 55.1% 44.9% 61.3% 38.7% 57.8% 42.2% 52.7% 47.3% 68.0% 32.0%23 61.9% 38.1% 65.7% 34.3% 61.5% 38.5% 53.0% 47.0% 59.2% 40.8% 56.1% 43.9% 23.9% 36.7% 39.4% 62.2% 37.8% 62.8% 37.2% 70.0% 30.0% 64.7% 35.3% 61.9% 38.1% 73.1% 26.9%24 87.8% 12.2% 88.2% 11.8% 86.1% 13.9% 83.8% 16.2% 85.7% 14.3% 85.3% 14.7% 64.1% 13.3% 22.6% 86.5% 13.5% 81.3% 18.7% 84.6% 15.4% 80.8% 19.2% 80.4% 19.6% 85.1% 14.9%25 49.0% 51.0% 51.9% 48.1% 41.6% 58.4% 34.8% 65.2% 37.0% 63.0% 35.7% 64.3% 16.1% 60.3% 23.5% 45.8% 54.2% 38.0% 62.0% 45.7% 54.3% 40.1% 59.9% 38.6% 61.4% 50.6% 49.4%26 53.4% 46.6% 55.8% 44.2% 49.9% 50.1% 42.2% 57.8% 45.5% 54.5% 43.7% 56.3% 20.9% 51.5% 27.6% 49.8% 50.2% 47.1% 52.9% 53.5% 46.5% 48.5% 51.5% 46.7% 53.3% 57.2% 42.8%27 53.3% 46.7% 56.0% 44.0% 48.4% 51.6% 39.5% 60.5% 45.6% 54.4% 41.5% 58.5% 17.7% 55.1% 27.2% 48.8% 51.2% 44.6% 55.4% 51.6% 48.4% 47.7% 52.3% 44.7% 55.3% 55.9% 44.1%
SR27.4287
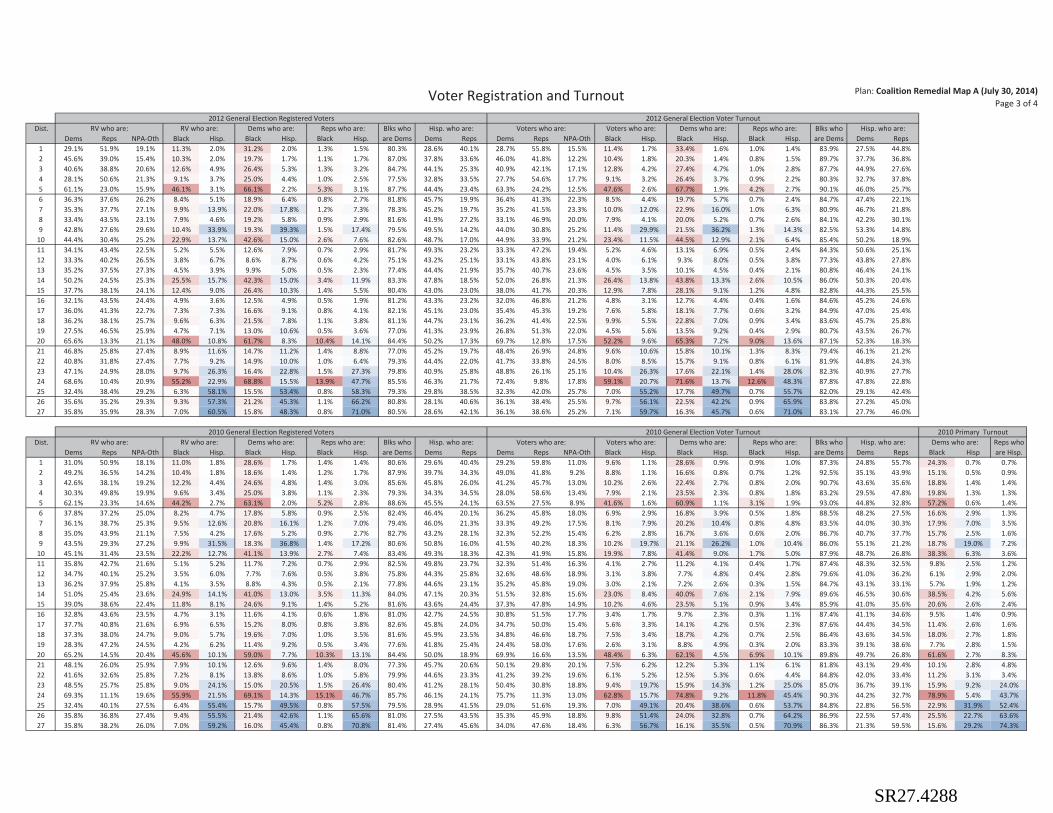
Voter Registration and Turnout Plan: Coalition Remedial Map A (July 30, 2014)Page 3 of 4
2012 General Election Registered Voters 2012 General Election Voter Turnout Dist. RV who are: RV who are: Dems who are: Reps who are: Blks who Hisp. who are: Voters who are: Voters who are: Dems who are: Reps who are: Blks who Hisp. who are:
Dems Reps NPA-Oth Black Hisp. Black Hisp. Black Hisp. are Dems Dems Reps Dems Reps NPA-Oth Black Hisp. Black Hisp. Black Hisp. are Dems Dems Reps1 29.1% 51.9% 19.1% 11.3% 2.0% 31.2% 2.0% 1.3% 1.5% 80.3% 28.6% 40.1% 28.7% 55.8% 15.5% 11.4% 1.7% 33.4% 1.6% 1.0% 1.4% 83.9% 27.5% 44.8%2 45.6% 39.0% 15.4% 10.3% 2.0% 19.7% 1.7% 1.1% 1.7% 87.0% 37.8% 33.6% 46.0% 41.8% 12.2% 10.4% 1.8% 20.3% 1.4% 0.8% 1.5% 89.7% 37.7% 36.8%3 40.6% 38.8% 20.6% 12.6% 4.9% 26.4% 5.3% 1.3% 3.2% 84.7% 44.1% 25.3% 40.9% 42.1% 17.1% 12.8% 4.2% 27.4% 4.7% 1.0% 2.8% 87.7% 44.9% 27.6%4 28.1% 50.6% 21.3% 9.1% 3.7% 25.0% 4.4% 1.0% 2.5% 77.5% 32.8% 33.5% 27.7% 54.6% 17.7% 9.1% 3.2% 26.4% 3.7% 0.9% 2.2% 80.3% 32.7% 37.8%5 61.1% 23.0% 15.9% 46.1% 3.1% 66.1% 2.2% 5.3% 3.1% 87.7% 44.4% 23.4% 63.3% 24.2% 12.5% 47.6% 2.6% 67.7% 1.9% 4.2% 2.7% 90.1% 46.0% 25.7%6 36.3% 37.6% 26.2% 8.4% 5.1% 18.9% 6.4% 0.8% 2.7% 81.8% 45.7% 19.9% 36.4% 41.3% 22.3% 8.5% 4.4% 19.7% 5.7% 0.7% 2.4% 84.7% 47.4% 22.1%7 35.3% 37.7% 27.1% 9.9% 13.9% 22.0% 17.8% 1.2% 7.3% 78.3% 45.2% 19.7% 35.2% 41.5% 23.3% 10.0% 12.0% 22.9% 16.0% 1.0% 6.3% 80.9% 46.7% 21.8%8 33.4% 43.5% 23.1% 7.9% 4.6% 19.2% 5.8% 0.9% 2.9% 81.6% 41.9% 27.2% 33.1% 46.9% 20.0% 7.9% 4.1% 20.0% 5.2% 0.7% 2.6% 84.1% 42.2% 30.1%9 42.8% 27.6% 29.6% 10.4% 33.9% 19.3% 39.3% 1.5% 17.4% 79.5% 49.5% 14.2% 44.0% 30.8% 25.2% 11.4% 29.9% 21.5% 36.2% 1.3% 14.3% 82.5% 53.3% 14.8%
10 44.4% 30.4% 25.2% 22.9% 13.7% 42.6% 15.0% 2.6% 7.6% 82.6% 48.7% 17.0% 44.9% 33.9% 21.2% 23.4% 11.5% 44.5% 12.9% 2.1% 6.4% 85.4% 50.2% 18.9%11 34.1% 43.4% 22.5% 5.2% 5.5% 12.6% 7.9% 0.7% 2.9% 81.7% 49.3% 23.2% 33.3% 47.2% 19.4% 5.2% 4.6% 13.1% 6.9% 0.5% 2.4% 84.3% 50.6% 25.1%12 33.3% 40.2% 26.5% 3.8% 6.7% 8.6% 8.7% 0.6% 4.2% 75.1% 43.2% 25.1% 33.1% 43.8% 23.1% 4.0% 6.1% 9.3% 8.0% 0.5% 3.8% 77.3% 43.8% 27.8%13 35.2% 37.5% 27.3% 4.5% 3.9% 9.9% 5.0% 0.5% 2.3% 77.4% 44.4% 21.9% 35.7% 40.7% 23.6% 4.5% 3.5% 10.1% 4.5% 0.4% 2.1% 80.8% 46.4% 24.1%14 50.2% 24.5% 25.3% 25.5% 15.7% 42.3% 15.0% 3.4% 11.9% 83.3% 47.8% 18.5% 52.0% 26.8% 21.3% 26.4% 13.8% 43.8% 13.3% 2.6% 10.5% 86.0% 50.3% 20.4%15 37.7% 38.1% 24.1% 12.4% 9.0% 26.4% 10.3% 1.4% 5.5% 80.4% 43.0% 23.0% 38.0% 41.7% 20.3% 12.9% 7.8% 28.1% 9.1% 1.2% 4.8% 82.8% 44.3% 25.5%16 32.1% 43.5% 24.4% 4.9% 3.6% 12.5% 4.9% 0.5% 1.9% 81.2% 43.3% 23.2% 32.0% 46.8% 21.2% 4.8% 3.1% 12.7% 4.4% 0.4% 1.6% 84.6% 45.2% 24.6%17 36.0% 41.3% 22.7% 7.3% 7.3% 16.6% 9.1% 0.8% 4.1% 82.1% 45.1% 23.0% 35.4% 45.3% 19.2% 7.6% 5.8% 18.1% 7.7% 0.6% 3.2% 84.9% 47.0% 25.4%18 36.2% 38.1% 25.7% 9.6% 6.3% 21.5% 7.8% 1.1% 3.8% 81.1% 44.7% 23.1% 36.2% 41.4% 22.5% 9.9% 5.5% 22.8% 7.0% 0.9% 3.4% 83.6% 45.7% 25.8%19 27.5% 46.5% 25.9% 4.7% 7.1% 13.0% 10.6% 0.5% 3.6% 77.0% 41.3% 23.9% 26.8% 51.3% 22.0% 4.5% 5.6% 13.5% 9.2% 0.4% 2.9% 80.7% 43.5% 26.7%20 65.6% 13.3% 21.1% 48.0% 10.8% 61.7% 8.3% 10.4% 14.1% 84.4% 50.2% 17.3% 69.7% 12.8% 17.5% 52.2% 9.6% 65.3% 7.2% 9.0% 13.6% 87.1% 52.3% 18.3%21 46.8% 25.8% 27.4% 8.9% 11.6% 14.7% 11.2% 1.4% 8.8% 77.0% 45.2% 19.7% 48.4% 26.9% 24.8% 9.6% 10.6% 15.8% 10.1% 1.3% 8.3% 79.4% 46.1% 21.2%22 40.8% 31.8% 27.4% 7.7% 9.2% 14.9% 10.0% 1.0% 6.4% 79.3% 44.4% 22.0% 41.7% 33.8% 24.5% 8.0% 8.5% 15.7% 9.1% 0.8% 6.1% 81.9% 44.8% 24.3%23 47.1% 24.9% 28.0% 9.7% 26.3% 16.4% 22.8% 1.5% 27.3% 79.8% 40.9% 25.8% 48.8% 26.1% 25.1% 10.4% 26.3% 17.6% 22.1% 1.4% 28.0% 82.3% 40.9% 27.7%24 68.6% 10.4% 20.9% 55.2% 22.9% 68.8% 15.5% 13.9% 47.7% 85.5% 46.3% 21.7% 72.4% 9.8% 17.8% 59.1% 20.7% 71.6% 13.7% 12.6% 48.3% 87.8% 47.8% 22.8%25 32.4% 38.4% 29.2% 6.3% 58.1% 15.5% 53.4% 0.8% 58.3% 79.3% 29.8% 38.5% 32.3% 42.0% 25.7% 7.0% 55.2% 17.7% 49.7% 0.7% 55.7% 82.0% 29.1% 42.4%26 35.6% 35.2% 29.3% 9.3% 57.3% 21.2% 45.3% 1.1% 66.2% 80.8% 28.1% 40.6% 36.1% 38.4% 25.5% 9.7% 56.1% 22.5% 42.2% 0.9% 65.9% 83.8% 27.2% 45.0%27 35.8% 35.9% 28.3% 7.0% 60.5% 15.8% 48.3% 0.8% 71.0% 80.5% 28.6% 42.1% 36.1% 38.6% 25.2% 7.1% 59.7% 16.3% 45.7% 0.6% 71.0% 83.1% 27.7% 46.0%
2010 General Election Registered Voters 2010 General Election Voter Turnout 2010 Primary Turnout Dist. RV who are: RV who are: Dems who are: Reps who are: Blks who Hisp. who are: Voters who are: Voters who are: Dems who are: Reps who are: Blks who Hisp. who are: Dems who are: Reps who
Dems Reps NPA-Oth Black Hisp. Black Hisp. Black Hisp. are Dems Dems Reps Dems Reps NPA-Oth Black Hisp. Black Hisp. Black Hisp. are Dems Dems Reps Black Hisp are Hisp.1 31.0% 50.9% 18.1% 11.0% 1.8% 28.6% 1.7% 1.4% 1.4% 80.6% 29.6% 40.4% 29.2% 59.8% 11.0% 9.6% 1.1% 28.6% 0.9% 0.9% 1.0% 87.3% 24.8% 55.7% 24.3% 0.7% 0.7%2 49.2% 36.5% 14.2% 10.4% 1.8% 18.6% 1.4% 1.2% 1.7% 87.9% 39.7% 34.3% 49.0% 41.8% 9.2% 8.8% 1.1% 16.6% 0.8% 0.7% 1.2% 92.5% 35.1% 43.9% 15.1% 0.5% 0.9%3 42.6% 38.1% 19.2% 12.2% 4.4% 24.6% 4.8% 1.4% 3.0% 85.6% 45.8% 26.0% 41.2% 45.7% 13.0% 10.2% 2.6% 22.4% 2.7% 0.8% 2.0% 90.7% 43.6% 35.6% 18.8% 1.4% 1.4%4 30.3% 49.8% 19.9% 9.6% 3.4% 25.0% 3.8% 1.1% 2.3% 79.3% 34.3% 34.5% 28.0% 58.6% 13.4% 7.9% 2.1% 23.5% 2.3% 0.8% 1.8% 83.2% 29.5% 47.8% 19.8% 1.3% 1.3%5 62.1% 23.3% 14.6% 44.2% 2.7% 63.1% 2.0% 5.2% 2.8% 88.6% 45.5% 24.1% 63.5% 27.5% 8.9% 41.6% 1.6% 60.9% 1.1% 3.1% 1.9% 93.0% 44.8% 32.8% 57.2% 0.6% 1.4%6 37.8% 37.2% 25.0% 8.2% 4.7% 17.8% 5.8% 0.9% 2.5% 82.4% 46.4% 20.1% 36.2% 45.8% 18.0% 6.9% 2.9% 16.8% 3.9% 0.5% 1.8% 88.5% 48.2% 27.5% 16.6% 2.9% 1.3%7 36.1% 38.7% 25.3% 9.5% 12.6% 20.8% 16.1% 1.2% 7.0% 79.4% 46.0% 21.3% 33.3% 49.2% 17.5% 8.1% 7.9% 20.2% 10.4% 0.8% 4.8% 83.5% 44.0% 30.3% 17.9% 7.0% 3.5%8 35.0% 43.9% 21.1% 7.5% 4.2% 17.6% 5.2% 0.9% 2.7% 82.7% 43.2% 28.1% 32.3% 52.2% 15.4% 6.2% 2.8% 16.7% 3.6% 0.6% 2.0% 86.7% 40.7% 37.7% 15.7% 2.5% 1.6%9 43.5% 29.3% 27.2% 9.9% 31.5% 18.3% 36.8% 1.4% 17.2% 80.6% 50.8% 16.0% 41.5% 40.2% 18.3% 10.2% 19.7% 21.1% 26.2% 1.0% 10.4% 86.0% 55.1% 21.2% 18.7% 19.0% 7.2%
10 45.1% 31.4% 23.5% 22.2% 12.7% 41.1% 13.9% 2.7% 7.4% 83.4% 49.3% 18.3% 42.3% 41.9% 15.8% 19.9% 7.8% 41.4% 9.0% 1.7% 5.0% 87.9% 48.7% 26.8% 38.3% 6.3% 3.6%11 35.8% 42.7% 21.6% 5.1% 5.2% 11.7% 7.2% 0.7% 2.9% 82.5% 49.8% 23.7% 32.3% 51.4% 16.3% 4.1% 2.7% 11.2% 4.1% 0.4% 1.7% 87.4% 48.3% 32.5% 9.8% 2.5% 1.2%12 34.7% 40.1% 25.2% 3.5% 6.0% 7.7% 7.6% 0.5% 3.8% 75.8% 44.3% 25.8% 32.6% 48.6% 18.9% 3.1% 3.8% 7.7% 4.8% 0.4% 2.8% 79.6% 41.0% 36.2% 6.1% 2.9% 2.0%13 36.2% 37.9% 25.8% 4.1% 3.5% 8.8% 4.3% 0.5% 2.1% 77.8% 44.6% 23.1% 35.2% 45.8% 19.0% 3.0% 2.1% 7.2% 2.6% 0.3% 1.5% 84.7% 43.1% 33.1% 5.7% 1.9% 1.2%14 51.0% 25.4% 23.6% 24.9% 14.1% 41.0% 13.0% 3.5% 11.3% 84.0% 47.1% 20.3% 51.5% 32.8% 15.6% 23.0% 8.4% 40.0% 7.6% 2.1% 7.9% 89.6% 46.5% 30.6% 38.5% 4.2% 5.6%15 39.0% 38.6% 22.4% 11.8% 8.1% 24.6% 9.1% 1.4% 5.2% 81.6% 43.6% 24.4% 37.3% 47.8% 14.9% 10.2% 4.6% 23.5% 5.1% 0.9% 3.4% 85.9% 41.0% 35.6% 20.6% 2.6% 2.4%16 32.8% 43.6% 23.5% 4.7% 3.1% 11.6% 4.1% 0.6% 1.8% 81.0% 42.7% 24.5% 30.8% 51.5% 17.7% 3.4% 1.7% 9.7% 2.3% 0.3% 1.1% 87.4% 41.1% 34.6% 9.5% 1.4% 0.9%17 37.7% 40.8% 21.6% 6.9% 6.5% 15.2% 8.0% 0.8% 3.8% 82.6% 45.8% 24.0% 34.7% 50.0% 15.4% 5.6% 3.3% 14.1% 4.2% 0.5% 2.3% 87.6% 44.4% 34.5% 11.4% 2.6% 1.6%18 37.3% 38.0% 24.7% 9.0% 5.7% 19.6% 7.0% 1.0% 3.5% 81.6% 45.9% 23.5% 34.8% 46.6% 18.7% 7.5% 3.4% 18.7% 4.2% 0.7% 2.5% 86.4% 43.6% 34.5% 18.0% 2.7% 1.8%19 28.3% 47.2% 24.5% 4.2% 6.2% 11.4% 9.2% 0.5% 3.4% 77.6% 41.8% 25.4% 24.4% 58.0% 17.6% 2.6% 3.1% 8.8% 4.9% 0.3% 2.0% 83.3% 39.1% 38.6% 7.7% 2.8% 1.5%20 65.2% 14.5% 20.4% 45.6% 10.1% 59.0% 7.7% 10.3% 13.1% 84.4% 50.0% 18.9% 69.9% 16.6% 13.5% 48.4% 6.3% 62.1% 4.5% 6.9% 10.1% 89.8% 49.7% 26.8% 61.6% 2.7% 8.3%21 48.1% 26.0% 25.9% 7.9% 10.1% 12.6% 9.6% 1.4% 8.0% 77.3% 45.7% 20.6% 50.1% 29.8% 20.1% 7.5% 6.2% 12.2% 5.3% 1.1% 6.1% 81.8% 43.1% 29.4% 10.1% 2.8% 4.8%22 41.6% 32.6% 25.8% 7.2% 8.1% 13.8% 8.6% 1.0% 5.8% 79.9% 44.6% 23.3% 41.2% 39.2% 19.6% 6.1% 5.2% 12.5% 5.3% 0.6% 4.4% 84.8% 42.0% 33.4% 11.2% 3.1% 3.4%23 48.5% 25.7% 25.8% 9.0% 24.1% 15.0% 20.5% 1.5% 26.4% 80.4% 41.2% 28.1% 50.4% 30.8% 18.8% 9.4% 19.7% 15.9% 14.3% 1.2% 25.0% 85.0% 36.7% 39.1% 15.9% 9.2% 24.0%24 69.3% 11.1% 19.6% 55.9% 21.5% 69.1% 14.3% 15.1% 46.7% 85.7% 46.1% 24.1% 75.7% 11.3% 13.0% 62.8% 15.7% 74.8% 9.2% 11.8% 45.4% 90.3% 44.2% 32.7% 78.9% 5.4% 43.7%25 32.4% 40.1% 27.5% 6.4% 55.4% 15.7% 49.5% 0.8% 57.5% 79.5% 28.9% 41.5% 29.0% 51.6% 19.3% 7.0% 49.1% 20.4% 38.6% 0.6% 53.7% 84.8% 22.8% 56.5% 22.9% 31.9% 52.4%26 35.8% 36.8% 27.4% 9.4% 55.5% 21.4% 42.6% 1.1% 65.6% 81.0% 27.5% 43.5% 35.3% 45.9% 18.8% 9.8% 51.4% 24.0% 32.8% 0.7% 64.2% 86.9% 22.5% 57.4% 25.5% 22.7% 63.6%27 35.8% 38.2% 26.0% 7.0% 59.2% 16.0% 45.4% 0.8% 70.8% 81.4% 27.4% 45.6% 34.0% 47.6% 18.4% 6.3% 56.7% 16.1% 35.5% 0.5% 70.9% 86.3% 21.3% 59.5% 15.6% 29.2% 74.3%
SR27.4288

Counties and Cities Plan: Coalition Remedial Map A (July 30, 2014)Page 4 of 4
Counties included in more than one district Counties included in more than one district Cities included in more than one district* Cities included in more than one district*County Dist. Total Pop Pop% Total Area Area% County Dist. Total Pop Pop% Total Area Area% City Dist. Total Pop Pop% Total Area Area% City Dist. Total Pop Pop% Total Area Area%
Alachua 2 28,520 11.5% 261.1 27.0% Polk 9 188,808 31.4% 501.6 25.0% Alachua 2 6,125 67.6% 25.2 71.7% Riviera Beach 18 4,202 12.9% 2.4 23.8%Alachua 3 218,816 88.5% 707.8 73.1% Polk 15 286,594 47.6% 453.2 22.5% Alachua 3 2,934 32.4% 10.0 28.4% Riviera Beach 20 28,156 86.7% 7.3 71.2%Broward 20 450,832 25.8% 534.4 40.4% Polk 17 126,693 21.0% 1,055.8 52.5% Apopka 7 4,771 11.5% 1.3 4.1% Riviera Beach 22 130 0.4% 0.5 5.0%Broward 21 272,465 15.6% 71.3 5.4% St. Johns 4 73,956 38.9% 162.4 19.8% Apopka 10 36,771 88.5% 31.3 96.0% Royal Palm Beach 18 14,868 43.6% 5.5 48.7%Broward 22 300,591 17.2% 131.1 9.9% St. Johns 6 116,083 61.1% 659.1 80.2% Boynton Beach 20 19,971 29.3% 3.2 19.1% Royal Palm Beach 20 16,165 47.4% 5.2 45.5%Broward 23 526,114 30.1% 192.8 14.6% Volusia 6 459,042 92.8% 1,308.1 91.3% Boynton Beach 22 48,246 70.7% 13.4 80.9% Royal Palm Beach 21 3,107 9.1% 0.7 5.8%Broward 24 129,757 7.4% 25.3 1.9% Volusia 7 35,551 7.2% 124.4 8.7% DeBary 6 8,419 43.6% 8.0 36.7% St. Petersburg 13 152,335 62.2% 68.9 50.1%Broward 25 68,307 3.9% 368.0 27.8% DeBary 7 10,901 56.4% 13.8 63.3% St. Petersburg 14 92,434 37.8% 68.7 49.9%Clay 3 102,987 54.0% 590.0 91.7% Deerfield Beach 20 26,242 35.0% 4.0 24.6% Sunrise 20 62,665 74.2% 9.4 51.6%Clay 4 87,878 46.0% 53.5 8.3% Deerfield Beach 21 33,897 45.2% 9.3 57.3% Sunrise 22 1,257 1.5% 0.2 0.9%Collier 19 155,389 48.3% 333.7 14.5% Deerfield Beach 22 14,879 19.8% 3.0 18.2% Sunrise 23 20,517 24.3% 8.7 47.5%Collier 25 166,131 51.7% 1,971.3 85.5% Deltona 6 66,540 78.1% 30.0 73.0% Tallahassee 2 68,681 37.9% 54.2 52.4%Columbia 2 54,709 81.0% 431.0 53.8% Deltona 7 18,642 21.9% 11.1 27.0% Tallahassee 5 112,695 62.1% 49.3 47.7%Columbia 5 12,822 19.0% 370.3 46.2% Eustis 6 94 0.5% 0.5 3.8% Tampa 14 288,792 86.0% 145.6 83.1%Duval 4 461,197 53.4% 647.3 70.5% Eustis 10 12,804 69.0% 7.2 59.8% Tampa 15 46,917 14.0% 29.7 16.9%Duval 5 403,066 46.6% 271.1 29.5% Eustis 11 5,660 30.5% 4.4 36.4% West Palm Beach 18 20,572 20.6% 35.2 60.7%Hendry 20 17,250 44.1% 652.1 54.8% Fort Lauderdale 20 59,527 36.0% 13.3 34.5% West Palm Beach 20 48,784 48.8% 15.6 26.9%Hendry 25 21,890 55.9% 537.9 45.2% Fort Lauderdale 22 105,994 64.0% 25.1 65.1% West Palm Beach 22 30,563 30.6% 7.2 12.4%Hillsborough 12 103,884 8.5% 78.3 6.2% Fort Lauderdale 23 0 0.0% 0.2 0.4% Winter Haven 9 25,035 73.9% 23.6 59.0%Hillsborough 14 603,911 49.1% 453.9 35.9% Hialeah 25 162,856 72.5% 16.5 72.4% Winter Haven 17 8,839 26.1% 16.4 41.0%Hillsborough 15 409,751 33.3% 421.6 33.3% Hialeah 27 61,813 27.5% 6.3 27.6%Hillsborough 17 111,680 9.1% 312.0 24.7% Homestead 26 42,640 70.5% 7.0 44.8%Holmes 1 11,489 57.7% 388.6 79.5% Homestead 27 17,872 29.5% 8.6 55.2%Holmes 2 8,438 42.3% 100.4 20.5% Jacksonville 4 418,718 51.0% 603.5 69.0%Jefferson 2 1,153 7.8% 209.8 33.0% Jacksonville 5 403,066 49.1% 271.1 31.0%Jefferson 5 13,608 92.2% 426.7 67.0% Lake City 2 7,439 61.8% 7.7 62.1%Lake 6 25,524 8.6% 354.0 30.6% Lake City 5 4,607 38.3% 4.7 37.9%Lake 10 42,257 14.2% 80.2 6.9% Lake Worth 20 10,654 30.5% 1.6 24.5%Lake 11 229,271 77.2% 722.7 62.5% Lake Worth 22 24,256 69.5% 5.0 75.5%Lee 17 77,798 12.6% 179.0 14.8% Lantana 20 4,654 44.7% 1.1 39.5%Lee 19 540,956 87.4% 1,033.4 85.2% Lantana 22 5,769 55.4% 1.7 60.5%Leon 2 116,165 42.2% 211.5 30.1% Margate 20 14,727 27.6% 2.3 25.2%Leon 5 159,322 57.8% 490.3 69.9% Margate 21 38,557 72.4% 6.8 74.8%Manatee 16 316,897 98.2% 468.1 52.4% Miami 24 148,279 37.1% 22.3 39.7%Manatee 17 5,936 1.8% 424.6 47.6% Miami 27 251,178 62.9% 33.8 60.3%Marion 3 271,658 82.0% 1,537.8 92.5% Miramar 24 88,380 72.4% 17.1 54.5%Marion 11 59,640 18.0% 124.8 7.5% Miramar 25 33,661 27.6% 14.2 45.5%Miami-Dade 23 170,231 6.8% 90.6 3.7% Oakland Park 20 20,289 49.1% 4.2 52.1%Miami-Dade 24 566,588 22.7% 95.1 3.9% Oakland Park 22 21,074 51.0% 3.9 47.9%Miami-Dade 25 440,016 17.6% 505.3 20.8% Orlando 7 12,600 5.3% 4.0 3.6%Miami-Dade 26 623,255 25.0% 1,162.4 47.8% Orlando 9 52,909 22.2% 53.8 48.6%Miami-Dade 27 696,345 27.9% 577.8 23.8% Orlando 10 172,791 72.5% 52.9 47.8%Orange 7 238,076 20.8% 84.6 8.4% Pembroke Pines 23 99,005 64.0% 18.4 52.9%Orange 8 14,940 1.3% 238.0 23.7% Pembroke Pines 24 21,119 13.7% 4.3 12.4%Orange 9 238,852 20.8% 204.9 20.4% Pembroke Pines 25 34,626 22.4% 12.1 34.7%Orange 10 654,088 57.1% 475.8 47.4% Plantation 20 13,381 15.8% 2.7 12.3%Palm Beach 18 272,237 20.6% 449.8 18.9% Plantation 22 67,640 79.6% 18.4 83.8%Palm Beach 20 228,263 17.3% 1,511.6 63.4% Plantation 23 3,934 4.6% 0.9 3.9%Palm Beach 21 423,880 32.1% 193.0 8.1% Pompano Beach 20 46,314 46.4% 11.3 44.4%Palm Beach 22 395,754 30.0% 228.6 9.6% Pompano Beach 21 1,447 1.5% 2.0 7.7% * In this table, the term “cities” refers to Florida’s Pinellas 12 127,763 13.9% 121.5 20.0% Pompano Beach 22 52,084 52.2% 12.2 47.9% 410 incorporated cities, towns, and villages.Pinellas 13 696,345 76.0% 418.0 68.7%Pinellas 14 92,434 10.1% 68.7 11.3%
SR27.4289
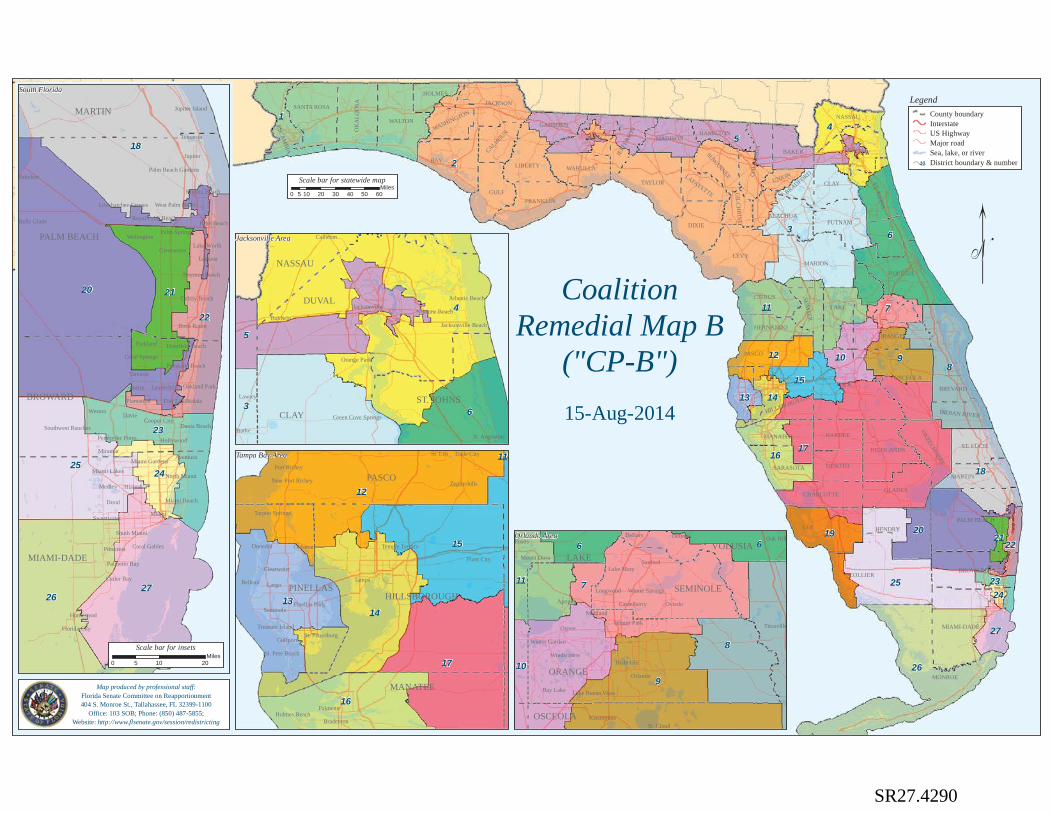
2
1
17
3
5
6
26
8
25
4
11
20
9
18
19
16
7
12 10
15
27
1413
22
23
21
24
MONROE
POLK
LEE
COLLIER
LEVY
BAY
LAKE
MARION
MIAMI-DADE
PALM BEACH
BREVARD
VOLUSIA
OSCEOLA
TAYLOR
DIXIE
WALTON
GULF
HENDRY
DUVAL
PASCO
LEON
BROWARD
CLAY
GLADES
ORANGE
CITRUS
JACKSON
LIBERTY
FRANKLIN
OK
ALO
OSA
ALACHUAPUTNAM
SANTA ROSA
MARTIN
HIGHLANDS
NASSAU
MANATEE
ST. JOH
NS
BAKER
ESCAM
BIA
HILLSBOROUGH
DESOTO
MADISON
HARDEE
COLU
MBI
A
WAKULLA
ST. LUCIE
SUM
TER
CHARLOTTE
SARASOTA
OKEECHOBEE
SUWANNEE
HOLMES
JEFF
ERSO
N
CALHOUN
GADSDEN
HERNANDO
HAMILTON
LAFAYETTE
WASHINGTON
INDIAN RIVER
UNION
GILCH
RIST
BRADFORD
20
18
2726
25
22
23
21
24
Miami
Davie
Wellington
Jupiter
Miramar
Weston
Hialeah
Hollywood
Doral
Plantation
West Palm Beach
Coral Gables
Boca Raton
Palm Beach Gardens
Sunrise
Pembroke Pines
Fort Lauderdale
Coral SpringsPompano Beach
Parkland
Tamarac
Homestead
Miami Gardens
Delray Beach
Miami Beach
Boynton Beach
Deerfield Beach
Cutler Bay
Palm Beach
Lauderhill
Pinecrest
North Miami
Medley
Riviera Beach
Cooper City
Palmetto Bay
Royal Palm Beach
Loxahatchee Groves
Oakland Park
Lake WorthGreenacres
Florida City
Miami Lakes
Southwest Ranches Dania Beach
Aventura
Lantana
Jupiter Island
Tequesta
Palm Springs
Pahokee
South Miami
Sweetwater
Belle Glade
PALM BEACH
MIAMI-DADE
BROWARD
MARTIN
4
3
5
6
Jacksonville
Jacksonville Beach
Atlantic Beach
Starke
Green Cove Springs
Neptune Beach
Orange Park
St. Augustine
Baldwin
Lawtey
Callahan
DUVAL
CLAY
ST. JOHNS
NASSAU
7
9
8
10
11
66
Orlando
DeBary
Sanford
Bay Lake
Ocoee
Oviedo
Eustis
Kissimmee
Deltona
Apopka
Mount Dora
Winter Springs
Winter Garden
Lake Mary
Winter ParkMaitland
Casselberry
Belle Isle
Longwood
Titusville
Oak Hill
Lake Buena Vista
Windermere
St. Cloud
ORANGE
LAKE
SEMINOLE
OSCEOLA
VOLUSIA
12
17
14
15
13
16
11
Tampa
St. Petersburg
Dunedin
Plant CityClearwater
Largo
Bradenton
St. Pete Beach
Pinellas Park
Tarpon Springs
Oldsmar
Zephyrhills
Palmetto
Seminole
Temple Terrace
Gulfport
Belleair
Treasure Island
New Port Richey
Port Richey
St. Leo
Holmes Beach
Dade City
PASCO
HILLSBOROUGHPINELLAS
MANATEE
Tampa Bay Area
Jacksonville Area
Orlando Area
South Florida
"
LegendCounty boundaryInterstateUS HighwayMajor roadSea, lake, or riverDistrict boundary & number10
Map produced by professional staff:Florida Senate Committee on Reapportionment404 S. Monroe St., Tallahassee, FL 32399-1100
Office: 103 SOB; Phone: (850) 487-5855;Website: http://www.flsenate.gov/session/redistricting
0 10 205Miles
Scale bar for insets
Scale bar for statewide map
0 10 20 30 40 50 605Miles
CoalitionRemedial Map B
("CP-B")15-Aug-2014
SR27.4290

Census and Elections Attributes Plan: Coalition Remedial Map B (August 15, 2014)Page 2 of 4
2010 Census Population and Geography Dist. Pop. Black Hisp. Hisp.Blk Length Perim Area Reock Convex Polsby-
Dev. VAP VAP VAP (miles) (miles) (sq.mi) Hull Popper Total 1 2209.4 7885.5 65,757.2 0.40 0.75 0.32
1 0 13.19% 4.55% 0.26% 127 397 4,759 0.37 0.82 0.382 0 13.37% 4.62% 0.20% 232 961 13,107 0.31 0.63 0.183 0 14.36% 7.74% 0.38% 90 351 3,963 0.60 0.85 0.414 0 9.64% 6.45% 0.39% 65 356 1,589 0.48 0.77 0.16 District lines and Benchmark New/proposed plan5 0 45.12% 6.14% 0.66% 206 711 3,911 0.12 0.71 0.10 City and County Boundaries (2002 Congress) and % change from 20026 0 9.44% 7.82% 0.40% 104 317 2,891 0.34 0.78 0.36 Number of Counties 67 67 0%7 0 11.06% 16.70% 0.88% 36 125 589 0.59 0.88 0.47 Counties with only one district 37 44 19%8 -1 9.12% 7.66% 0.39% 95 271 2,412 0.34 0.76 0.41 Counties split into more than one district 30 23 -23%9 -1 11.35% 39.30% 2.27% 48 169 1,096 0.60 0.85 0.48 Aggregate number of county splits 83 64 -23%
10 0 27.40% 18.50% 1.19% 50 191 952 0.49 0.75 0.33 Aggregate number of county splits with population 83 64 -23%11 0 7.29% 7.50% 0.36% 83 296 2,817 0.52 0.83 0.40 Number of Cities* 410 410 0%12 -1 4.34% 9.94% 0.38% 58 184 1,068 0.40 0.81 0.40 Cities with only one district 300 376 25%13 0 5.29% 7.24% 0.27% 34 110 418 0.46 0.82 0.43 Cities split into more than one district 110 34 -69%14 0 25.63% 25.61% 1.62% 43 162 523 0.36 0.69 0.25 Aggregate number of city splits 254 79 -69%15 0 12.72% 14.99% 0.74% 50 204 875 0.44 0.75 0.26 Aggregate number of city splits with population 244 77 -68%16 0 5.83% 8.76% 0.28% 60 178 1,193 0.42 0.81 0.47 * In this table, the term “cities” refers to Florida’s 410 incorporated cities, towns, and villages.17 0 8.34% 14.35% 0.44% 124 506 7,751 0.64 0.83 0.3818 -1 11.07% 12.05% 0.45% 69 224 1,891 0.50 0.82 0.4719 0 6.47% 14.83% 0.47% 83 238 1,367 0.25 0.70 0.3020 0 50.06% 18.54% 1.18% 84 393 2,698 0.48 0.74 0.2221 0 11.23% 18.29% 0.65% 34 112 264 0.28 0.60 0.2622 0 10.33% 17.72% 0.56% 50 187 360 0.18 0.61 0.1323 0 10.99% 36.73% 1.21% 37 124 283 0.27 0.57 0.2324 0 54.92% 33.15% 3.25% 20 73 120 0.38 0.73 0.2825 -1 7.70% 70.69% 1.75% 103 365 3,383 0.40 0.73 0.3226 0 10.02% 68.91% 1.47% 184 551 4,900 0.18 0.46 0.2027 0 7.71% 75.04% 2.23% 40 130 578 0.46 0.81 0.43
Dist. 2012 US Pres 2012 US Sen 2010 Gov 2010 CFO 2010 Att.Gen 2010 Cm.Ag 2010 US Sen 2008 US Pres 2006 Gov 2006 CFO 2006 Att.Gen 2006 Cm.Ag 2006 US Sen D_Oba R_Rom D_Nel R_Mac D_Sin R_Sco D_Aus R_Atw D_Gel R_Bon D_Mad R_Put D_Mee R_Rub I_Cri D_Oba R_McC D_Dav R_Cri D_Sin R_Lee D_Cam R_McC D_Cop R_Bro D_Nel R_Har
Total 12 15 21 6 10 17 6 21 6 21 6 21 3 20 4 12 15 7 20 18 9 8 19 7 20 25 21 30.5% 69.5% 36.9% 63.1% 32.3% 67.7% 26.5% 73.5% 26.7% 73.3% 26.3% 73.7% 13.3% 66.3% 20.4% 32.4% 67.6% 32.1% 67.9% 35.1% 64.9% 31.3% 68.7% 28.6% 71.4% 44.8% 55.2%2 34.3% 65.7% 44.9% 55.1% 43.2% 56.8% 37.7% 62.3% 34.5% 65.5% 35.3% 64.7% 14.6% 60.6% 24.8% 35.4% 64.6% 41.1% 58.9% 52.2% 47.8% 43.7% 56.3% 33.1% 66.9% 59.1% 40.9%3 44.7% 55.3% 52.2% 47.8% 46.2% 53.8% 38.8% 61.2% 39.9% 60.1% 38.3% 61.7% 21.3% 54.2% 24.5% 47.0% 53.0% 44.5% 55.5% 53.0% 47.0% 44.8% 55.2% 39.5% 60.5% 59.0% 41.0%4 32.2% 67.8% 39.8% 60.2% 34.4% 65.6% 26.3% 73.7% 27.9% 72.1% 27.4% 72.6% 13.9% 66.8% 19.3% 34.1% 65.9% 28.6% 71.4% 39.1% 60.9% 29.0% 71.0% 27.6% 72.4% 45.0% 55.0%5 64.2% 35.8% 69.1% 30.9% 64.1% 35.9% 61.6% 38.4% 59.4% 40.6% 61.0% 39.0% 40.5% 36.0% 23.5% 63.8% 36.2% 56.3% 43.7% 65.6% 34.4% 58.2% 41.8% 51.6% 48.4% 69.5% 30.5%6 46.0% 54.0% 53.4% 46.6% 46.1% 53.9% 38.0% 62.0% 39.7% 60.3% 38.2% 61.8% 19.7% 53.3% 27.0% 49.7% 50.3% 46.4% 53.6% 53.8% 46.2% 46.0% 54.0% 43.8% 56.2% 61.6% 38.4%7 48.6% 51.4% 55.8% 44.2% 48.3% 51.7% 36.0% 64.0% 39.9% 60.1% 37.1% 62.9% 21.0% 56.1% 22.9% 50.3% 49.7% 39.1% 60.9% 49.7% 50.3% 37.9% 62.1% 35.3% 64.7% 58.7% 41.3%8 42.6% 57.4% 51.2% 48.8% 42.3% 57.7% 33.9% 66.1% 35.9% 64.1% 34.0% 66.0% 15.7% 56.3% 28.0% 44.4% 55.6% 43.2% 56.8% 49.7% 50.3% 42.3% 57.7% 35.8% 64.2% 59.7% 40.3%9 61.4% 38.6% 67.2% 32.8% 55.2% 44.8% 45.7% 54.3% 48.1% 51.9% 46.6% 53.4% 27.7% 48.7% 23.5% 59.7% 40.3% 45.1% 54.9% 54.5% 45.5% 44.7% 55.3% 40.5% 59.5% 62.8% 37.2%
10 58.6% 41.4% 64.0% 36.0% 53.7% 46.3% 46.5% 53.5% 48.1% 51.9% 45.9% 54.1% 30.5% 46.4% 23.1% 59.0% 41.0% 46.4% 53.6% 55.0% 45.0% 46.2% 53.8% 43.7% 56.3% 62.5% 37.5%11 40.3% 59.7% 49.4% 50.6% 41.6% 58.4% 32.6% 67.4% 34.9% 65.1% 32.3% 67.7% 15.2% 55.5% 29.2% 43.2% 56.8% 39.2% 60.8% 49.6% 50.4% 41.0% 59.0% 36.7% 63.3% 57.8% 42.2%12 45.3% 54.7% 54.5% 45.5% 45.6% 54.4% 33.6% 66.4% 36.1% 63.9% 32.5% 67.5% 12.5% 48.2% 39.2% 47.2% 52.8% 43.2% 56.8% 50.1% 49.9% 43.2% 56.8% 38.4% 61.6% 60.9% 39.1%13 50.7% 49.3% 59.5% 40.5% 51.0% 49.0% 37.3% 62.7% 41.6% 58.4% 36.7% 63.3% 14.8% 41.7% 43.5% 51.9% 48.1% 45.3% 54.7% 54.0% 46.0% 47.3% 52.7% 39.8% 60.2% 63.7% 36.3%14 65.8% 34.2% 71.0% 29.0% 63.0% 37.0% 52.3% 47.7% 53.2% 46.8% 50.7% 49.3% 29.5% 34.6% 35.8% 65.7% 34.3% 56.5% 43.5% 60.8% 39.2% 55.3% 44.7% 51.2% 48.8% 70.8% 29.2%15 46.0% 54.0% 53.7% 46.3% 45.4% 54.6% 36.0% 64.0% 35.8% 64.2% 30.6% 69.4% 16.9% 50.2% 32.9% 46.4% 53.6% 40.4% 59.6% 44.5% 55.5% 39.5% 60.5% 35.2% 64.8% 57.4% 42.6%16 45.3% 54.7% 51.9% 48.1% 46.1% 53.9% 34.3% 65.7% 39.2% 60.8% 34.6% 65.4% 13.0% 48.0% 39.0% 48.6% 51.4% 42.5% 57.5% 50.3% 49.7% 46.1% 53.9% 39.7% 60.3% 57.4% 42.6%17 41.6% 58.4% 49.0% 51.0% 41.7% 58.3% 32.9% 67.1% 34.1% 65.9% 29.8% 70.2% 14.0% 53.2% 32.8% 43.8% 56.2% 39.7% 60.3% 46.4% 53.6% 40.7% 59.3% 36.4% 63.6% 57.1% 42.9%18 47.9% 52.1% 54.7% 45.3% 49.0% 51.0% 36.2% 63.8% 42.5% 57.5% 36.6% 63.4% 15.8% 51.0% 33.2% 51.5% 48.5% 47.9% 52.1% 52.7% 47.3% 50.5% 49.5% 44.4% 55.6% 63.9% 36.1%19 39.0% 61.0% 43.9% 56.1% 36.7% 63.3% 27.9% 72.1% 30.3% 69.7% 27.5% 72.5% 9.6% 60.3% 30.2% 42.7% 57.3% 33.3% 66.7% 42.5% 57.5% 35.3% 64.7% 32.8% 67.2% 51.2% 48.8%20 83.0% 17.0% 84.8% 15.2% 79.6% 20.4% 74.7% 25.3% 77.9% 22.1% 76.2% 23.8% 51.1% 19.2% 29.7% 80.8% 19.2% 75.5% 24.5% 79.7% 20.3% 76.4% 23.6% 74.1% 25.9% 82.7% 17.3%21 60.9% 39.1% 66.6% 33.4% 63.0% 37.0% 51.6% 48.4% 59.0% 41.0% 54.2% 45.8% 19.2% 36.0% 44.9% 63.9% 36.1% 65.3% 34.7% 71.0% 29.0% 68.0% 32.0% 63.7% 36.3% 76.9% 23.1%22 54.7% 45.3% 59.7% 40.3% 54.7% 45.3% 42.0% 58.0% 49.8% 50.2% 45.5% 54.5% 17.7% 43.5% 38.8% 57.1% 42.9% 55.1% 44.9% 61.3% 38.7% 57.8% 42.2% 52.7% 47.3% 68.0% 32.0%23 61.9% 38.1% 65.7% 34.3% 61.5% 38.5% 53.0% 47.0% 59.2% 40.8% 56.1% 43.9% 23.9% 36.7% 39.4% 62.2% 37.8% 62.8% 37.2% 70.0% 30.0% 64.7% 35.3% 61.9% 38.1% 73.1% 26.9%24 87.8% 12.2% 88.2% 11.8% 86.1% 13.9% 83.8% 16.2% 85.7% 14.3% 85.3% 14.7% 64.1% 13.3% 22.6% 86.5% 13.5% 81.3% 18.7% 84.6% 15.4% 80.8% 19.2% 80.4% 19.6% 85.1% 14.9%25 49.0% 51.0% 51.9% 48.1% 41.6% 58.4% 34.8% 65.2% 37.0% 63.0% 35.7% 64.3% 16.1% 60.3% 23.5% 45.8% 54.2% 38.0% 62.0% 45.7% 54.3% 40.1% 59.9% 38.6% 61.4% 50.6% 49.4%26 53.4% 46.6% 55.8% 44.2% 49.9% 50.1% 42.2% 57.8% 45.5% 54.5% 43.7% 56.3% 20.9% 51.5% 27.6% 49.8% 50.2% 47.1% 52.9% 53.5% 46.5% 48.5% 51.5% 46.7% 53.3% 57.2% 42.8%27 53.3% 46.7% 56.0% 44.0% 48.4% 51.6% 39.5% 60.5% 45.6% 54.4% 41.5% 58.5% 17.7% 55.1% 27.2% 48.8% 51.2% 44.6% 55.4% 51.6% 48.4% 47.7% 52.3% 44.7% 55.3% 55.9% 44.1%
SR27.4291

Voter Registration and Turnout Plan: Coalition Remedial Map B (August 15, 2014)Page 3 of 4
2012 General Election Registered Voters 2012 General Election Voter Turnout Dist. RV who are: RV who are: Dems who are: Reps who are: Blks who Hisp. who are: Voters who are: Voters who are: Dems who are: Reps who are: Blks who Hisp. who are:
Dems Reps NPA-Oth Black Hisp. Black Hisp. Black Hisp. are Dems Dems Reps Dems Reps NPA-Oth Black Hisp. Black Hisp. Black Hisp. are Dems Dems Reps1 29.1% 51.9% 19.1% 11.3% 2.0% 31.2% 2.0% 1.3% 1.5% 80.3% 28.6% 40.1% 28.7% 55.8% 15.5% 11.4% 1.7% 33.4% 1.6% 1.0% 1.4% 83.9% 27.5% 44.8%2 45.6% 39.0% 15.4% 10.3% 2.0% 19.7% 1.7% 1.1% 1.7% 87.0% 37.8% 33.6% 46.0% 41.8% 12.2% 10.4% 1.8% 20.3% 1.4% 0.8% 1.5% 89.7% 37.7% 36.8%3 40.6% 38.8% 20.6% 12.6% 4.9% 26.4% 5.3% 1.3% 3.2% 84.7% 44.1% 25.3% 40.9% 42.1% 17.1% 12.8% 4.2% 27.4% 4.7% 1.0% 2.8% 87.7% 44.9% 27.6%4 28.1% 50.6% 21.3% 9.1% 3.7% 25.0% 4.4% 1.0% 2.5% 77.5% 32.8% 33.5% 27.7% 54.6% 17.7% 9.1% 3.2% 26.4% 3.7% 0.9% 2.2% 80.3% 32.7% 37.8%5 61.1% 23.0% 15.9% 46.1% 3.1% 66.1% 2.2% 5.3% 3.1% 87.7% 44.4% 23.4% 63.3% 24.2% 12.5% 47.6% 2.6% 67.7% 1.9% 4.2% 2.7% 90.1% 46.0% 25.7%6 36.2% 37.6% 26.2% 8.3% 5.1% 18.8% 6.4% 0.8% 2.7% 81.8% 45.6% 20.1% 36.3% 41.3% 22.4% 8.4% 4.4% 19.7% 5.7% 0.6% 2.4% 84.6% 47.2% 22.3%7 35.1% 38.3% 26.6% 9.8% 12.8% 21.9% 16.4% 1.2% 6.7% 78.5% 45.1% 20.1% 35.0% 42.2% 22.9% 9.8% 11.1% 22.7% 14.7% 1.0% 5.8% 81.1% 46.5% 22.2%8 33.4% 43.5% 23.1% 7.9% 4.6% 19.2% 5.8% 0.9% 2.9% 81.6% 41.9% 27.2% 33.1% 46.9% 20.0% 7.9% 4.1% 20.0% 5.2% 0.7% 2.6% 84.1% 42.2% 30.1%9 42.0% 27.6% 30.4% 8.6% 35.8% 15.7% 42.3% 1.4% 18.7% 77.0% 49.7% 14.4% 43.2% 30.9% 25.9% 9.5% 31.9% 17.6% 39.3% 1.2% 15.6% 80.1% 53.2% 15.2%
10 45.4% 29.2% 25.4% 24.2% 13.8% 44.3% 14.7% 2.8% 7.9% 82.9% 48.3% 16.7% 45.9% 32.4% 21.7% 24.9% 11.6% 46.6% 12.6% 2.2% 6.6% 85.7% 50.0% 18.4%11 34.2% 43.8% 21.9% 5.9% 4.6% 14.2% 6.6% 0.7% 2.5% 82.7% 48.8% 24.2% 33.4% 47.7% 18.9% 5.8% 3.8% 14.8% 5.7% 0.5% 2.1% 85.6% 50.2% 26.4%12 33.3% 40.2% 26.5% 3.8% 6.7% 8.6% 8.7% 0.6% 4.2% 75.1% 43.2% 25.1% 33.1% 43.8% 23.1% 4.0% 6.1% 9.3% 8.0% 0.5% 3.8% 77.3% 43.8% 27.8%13 35.2% 37.5% 27.3% 4.5% 3.9% 9.9% 5.0% 0.5% 2.3% 77.4% 44.4% 21.9% 35.7% 40.7% 23.6% 4.5% 3.5% 10.1% 4.5% 0.4% 2.1% 80.8% 46.4% 24.1%14 50.2% 24.5% 25.3% 25.5% 15.7% 42.3% 15.0% 3.4% 11.9% 83.3% 47.8% 18.5% 52.0% 26.8% 21.3% 26.4% 13.8% 43.8% 13.3% 2.6% 10.5% 86.0% 50.3% 20.4%15 37.7% 38.1% 24.1% 12.4% 9.0% 26.4% 10.3% 1.4% 5.5% 80.4% 43.0% 23.0% 38.0% 41.7% 20.3% 12.9% 7.8% 28.1% 9.1% 1.2% 4.8% 82.8% 44.3% 25.5%16 32.1% 43.5% 24.4% 4.9% 3.6% 12.5% 4.9% 0.5% 1.9% 81.2% 43.3% 23.2% 32.0% 46.8% 21.2% 4.8% 3.1% 12.7% 4.4% 0.4% 1.6% 84.6% 45.2% 24.6%17 36.0% 41.2% 22.7% 7.3% 7.3% 16.6% 9.1% 0.8% 4.1% 82.1% 45.1% 23.0% 35.5% 45.3% 19.2% 7.5% 5.8% 18.1% 7.7% 0.6% 3.2% 84.9% 47.1% 25.4%18 36.2% 38.1% 25.7% 9.6% 6.3% 21.5% 7.8% 1.1% 3.8% 81.1% 44.7% 23.1% 36.2% 41.4% 22.5% 9.9% 5.5% 22.8% 7.0% 0.9% 3.4% 83.6% 45.7% 25.8%19 27.5% 46.5% 25.9% 4.7% 7.1% 13.0% 10.6% 0.5% 3.6% 77.0% 41.3% 23.9% 26.8% 51.3% 22.0% 4.5% 5.6% 13.5% 9.2% 0.4% 2.9% 80.7% 43.5% 26.7%20 65.6% 13.3% 21.1% 48.0% 10.8% 61.7% 8.3% 10.4% 14.1% 84.4% 50.2% 17.3% 69.7% 12.8% 17.5% 52.2% 9.6% 65.3% 7.2% 9.0% 13.6% 87.1% 52.3% 18.3%21 46.8% 25.8% 27.4% 8.9% 11.6% 14.7% 11.2% 1.4% 8.8% 77.0% 45.2% 19.7% 48.4% 26.9% 24.8% 9.6% 10.6% 15.8% 10.1% 1.3% 8.3% 79.4% 46.1% 21.2%22 40.8% 31.8% 27.4% 7.7% 9.2% 14.9% 10.0% 1.0% 6.4% 79.3% 44.4% 22.0% 41.7% 33.8% 24.5% 8.0% 8.5% 15.7% 9.1% 0.8% 6.1% 81.9% 44.8% 24.3%23 47.1% 24.9% 28.0% 9.7% 26.3% 16.4% 22.8% 1.5% 27.3% 79.8% 40.9% 25.8% 48.8% 26.1% 25.1% 10.4% 26.3% 17.6% 22.1% 1.4% 28.0% 82.3% 40.9% 27.7%24 68.6% 10.4% 20.9% 55.2% 22.9% 68.8% 15.5% 13.9% 47.7% 85.5% 46.3% 21.7% 72.4% 9.8% 17.8% 59.1% 20.7% 71.6% 13.7% 12.6% 48.3% 87.8% 47.8% 22.8%25 32.4% 38.4% 29.2% 6.3% 58.1% 15.5% 53.4% 0.8% 58.3% 79.3% 29.8% 38.5% 32.3% 42.0% 25.7% 7.0% 55.2% 17.7% 49.7% 0.7% 55.7% 82.0% 29.1% 42.4%26 35.6% 35.2% 29.3% 9.3% 57.3% 21.2% 45.3% 1.1% 66.2% 80.8% 28.1% 40.6% 36.1% 38.4% 25.5% 9.7% 56.1% 22.5% 42.2% 0.9% 65.9% 83.8% 27.2% 45.0%27 35.8% 35.9% 28.3% 7.0% 60.5% 15.8% 48.3% 0.8% 71.0% 80.5% 28.6% 42.1% 36.1% 38.6% 25.2% 7.1% 59.7% 16.3% 45.7% 0.6% 71.0% 83.1% 27.7% 46.0%
2010 General Election Registered Voters 2010 General Election Voter Turnout 2010 Primary Turnout Dist. RV who are: RV who are: Dems who are: Reps who are: Blks who Hisp. who are: Voters who are: Voters who are: Dems who are: Reps who are: Blks who Hisp. who are: Dems who are: Reps who
Dems Reps NPA-Oth Black Hisp. Black Hisp. Black Hisp. are Dems Dems Reps Dems Reps NPA-Oth Black Hisp. Black Hisp. Black Hisp. are Dems Dems Reps Black Hisp are Hisp.1 31.0% 50.9% 18.1% 11.0% 1.8% 28.6% 1.7% 1.4% 1.4% 80.6% 29.6% 40.4% 29.2% 59.8% 11.0% 9.6% 1.1% 28.6% 0.9% 0.9% 1.0% 87.3% 24.8% 55.7% 24.3% 0.7% 0.7%2 49.2% 36.5% 14.2% 10.4% 1.8% 18.6% 1.4% 1.2% 1.7% 87.9% 39.7% 34.3% 49.0% 41.8% 9.2% 8.8% 1.1% 16.6% 0.8% 0.7% 1.2% 92.5% 35.1% 43.9% 15.1% 0.5% 0.9%3 42.6% 38.1% 19.2% 12.2% 4.4% 24.6% 4.8% 1.4% 3.0% 85.6% 45.8% 26.0% 41.2% 45.7% 13.0% 10.2% 2.6% 22.4% 2.7% 0.8% 2.0% 90.7% 43.6% 35.6% 18.8% 1.4% 1.4%4 30.3% 49.8% 19.9% 9.6% 3.4% 25.0% 3.8% 1.1% 2.3% 79.3% 34.3% 34.5% 28.0% 58.6% 13.4% 7.9% 2.1% 23.5% 2.3% 0.8% 1.8% 83.2% 29.5% 47.8% 19.8% 1.3% 1.3%5 62.1% 23.3% 14.6% 44.2% 2.7% 63.1% 2.0% 5.2% 2.8% 88.6% 45.5% 24.1% 63.5% 27.5% 8.9% 41.6% 1.6% 60.9% 1.1% 3.1% 1.9% 93.0% 44.8% 32.8% 57.2% 0.6% 1.4%6 37.7% 37.2% 25.0% 8.1% 4.7% 17.8% 5.8% 0.8% 2.6% 82.4% 46.3% 20.2% 36.1% 45.8% 18.1% 6.8% 2.9% 16.8% 3.9% 0.5% 1.8% 88.5% 48.1% 27.7% 16.5% 2.9% 1.4%7 35.9% 39.2% 24.9% 9.3% 11.6% 20.7% 14.8% 1.2% 6.4% 79.4% 45.8% 21.6% 33.3% 49.5% 17.2% 7.9% 7.2% 19.8% 9.5% 0.8% 4.5% 83.5% 43.6% 30.7% 17.4% 6.2% 3.1%8 35.0% 43.9% 21.1% 7.5% 4.2% 17.6% 5.2% 0.9% 2.7% 82.7% 43.2% 28.1% 32.3% 52.2% 15.4% 6.2% 2.8% 16.7% 3.6% 0.6% 2.0% 86.7% 40.7% 37.7% 15.7% 2.5% 1.6%9 42.8% 29.3% 27.8% 8.2% 33.5% 15.0% 39.9% 1.3% 18.5% 78.2% 50.9% 16.2% 40.9% 40.5% 18.6% 8.6% 21.8% 17.4% 29.0% 1.0% 11.7% 83.3% 54.5% 21.8% 14.2% 21.1% 8.1%
10 45.9% 30.3% 23.7% 23.6% 12.3% 43.1% 13.1% 2.9% 7.5% 83.8% 48.6% 18.3% 43.1% 40.5% 16.3% 21.8% 7.1% 44.8% 7.9% 1.8% 4.7% 88.6% 48.4% 26.8% 44.4% 5.3% 3.4%11 35.9% 43.1% 21.0% 5.7% 4.3% 13.2% 5.9% 0.7% 2.5% 83.5% 49.7% 24.7% 32.4% 51.6% 15.9% 4.6% 2.3% 12.4% 3.5% 0.4% 1.5% 88.3% 48.3% 33.7% 10.9% 2.1% 1.1%12 34.7% 40.1% 25.2% 3.5% 6.0% 7.7% 7.6% 0.5% 3.8% 75.8% 44.3% 25.8% 32.6% 48.6% 18.9% 3.1% 3.8% 7.7% 4.8% 0.4% 2.8% 79.6% 41.0% 36.2% 6.1% 2.9% 2.0%13 36.2% 37.9% 25.8% 4.1% 3.5% 8.8% 4.3% 0.5% 2.1% 77.8% 44.6% 23.1% 35.2% 45.8% 19.0% 3.0% 2.1% 7.2% 2.6% 0.3% 1.5% 84.7% 43.1% 33.1% 5.7% 1.9% 1.2%14 51.0% 25.4% 23.6% 24.9% 14.1% 41.0% 13.0% 3.5% 11.3% 84.0% 47.1% 20.3% 51.5% 32.8% 15.6% 23.0% 8.4% 40.0% 7.6% 2.1% 7.9% 89.6% 46.5% 30.6% 38.5% 4.2% 5.6%15 39.0% 38.6% 22.4% 11.8% 8.1% 24.6% 9.1% 1.4% 5.2% 81.6% 43.6% 24.4% 37.3% 47.8% 14.9% 10.2% 4.6% 23.5% 5.1% 0.9% 3.4% 85.9% 41.0% 35.6% 20.6% 2.6% 2.4%16 32.8% 43.6% 23.5% 4.7% 3.1% 11.6% 4.1% 0.6% 1.8% 81.0% 42.7% 24.5% 30.8% 51.5% 17.7% 3.4% 1.7% 9.7% 2.3% 0.3% 1.1% 87.4% 41.1% 34.6% 9.5% 1.4% 0.9%17 37.8% 40.5% 21.7% 7.0% 7.0% 15.3% 8.5% 0.8% 4.0% 82.5% 46.1% 23.3% 34.8% 49.8% 15.4% 5.7% 3.4% 14.3% 4.5% 0.5% 2.3% 87.4% 45.2% 33.5% 11.5% 2.7% 1.6%18 37.3% 38.0% 24.7% 9.0% 5.7% 19.6% 7.0% 1.0% 3.5% 81.6% 45.9% 23.5% 34.8% 46.6% 18.7% 7.5% 3.4% 18.7% 4.2% 0.7% 2.5% 86.4% 43.6% 34.5% 18.0% 2.7% 1.8%19 28.3% 47.2% 24.5% 4.2% 6.2% 11.4% 9.2% 0.5% 3.4% 77.6% 41.8% 25.4% 24.4% 58.0% 17.6% 2.6% 3.1% 8.8% 4.9% 0.3% 2.0% 83.3% 39.1% 38.6% 7.7% 2.8% 1.5%20 65.2% 14.5% 20.4% 45.6% 10.1% 59.0% 7.7% 10.3% 13.1% 84.4% 50.0% 18.9% 69.9% 16.6% 13.5% 48.4% 6.3% 62.1% 4.5% 6.9% 10.1% 89.8% 49.7% 26.8% 61.6% 2.7% 8.3%21 48.1% 26.0% 25.9% 7.9% 10.1% 12.6% 9.6% 1.4% 8.0% 77.3% 45.7% 20.6% 50.1% 29.8% 20.1% 7.5% 6.2% 12.2% 5.3% 1.1% 6.1% 81.8% 43.1% 29.4% 10.1% 2.8% 4.8%22 41.6% 32.6% 25.8% 7.2% 8.1% 13.8% 8.6% 1.0% 5.8% 79.9% 44.6% 23.3% 41.2% 39.2% 19.6% 6.1% 5.2% 12.5% 5.3% 0.6% 4.4% 84.8% 42.0% 33.4% 11.2% 3.1% 3.4%23 48.5% 25.7% 25.8% 9.0% 24.1% 15.0% 20.5% 1.5% 26.4% 80.4% 41.2% 28.1% 50.4% 30.8% 18.8% 9.4% 19.7% 15.9% 14.3% 1.2% 25.0% 85.0% 36.7% 39.1% 15.9% 9.2% 24.0%24 69.3% 11.1% 19.6% 55.9% 21.5% 69.1% 14.3% 15.1% 46.7% 85.7% 46.1% 24.1% 75.7% 11.3% 13.0% 62.8% 15.7% 74.8% 9.2% 11.8% 45.4% 90.3% 44.2% 32.7% 78.9% 5.4% 43.7%25 32.4% 40.1% 27.5% 6.4% 55.4% 15.7% 49.5% 0.8% 57.5% 79.5% 28.9% 41.5% 29.0% 51.6% 19.3% 7.0% 49.1% 20.4% 38.6% 0.6% 53.7% 84.8% 22.8% 56.5% 22.9% 31.9% 52.4%26 35.8% 36.8% 27.4% 9.4% 55.5% 21.4% 42.6% 1.1% 65.6% 81.0% 27.5% 43.5% 35.3% 45.9% 18.8% 9.8% 51.4% 24.0% 32.8% 0.7% 64.2% 86.9% 22.5% 57.4% 25.5% 22.7% 63.6%27 35.8% 38.2% 26.0% 7.0% 59.2% 16.0% 45.4% 0.8% 70.8% 81.4% 27.4% 45.6% 34.0% 47.6% 18.4% 6.3% 56.7% 16.1% 35.5% 0.5% 70.9% 86.3% 21.3% 59.5% 15.6% 29.2% 74.3%
SR27.4292
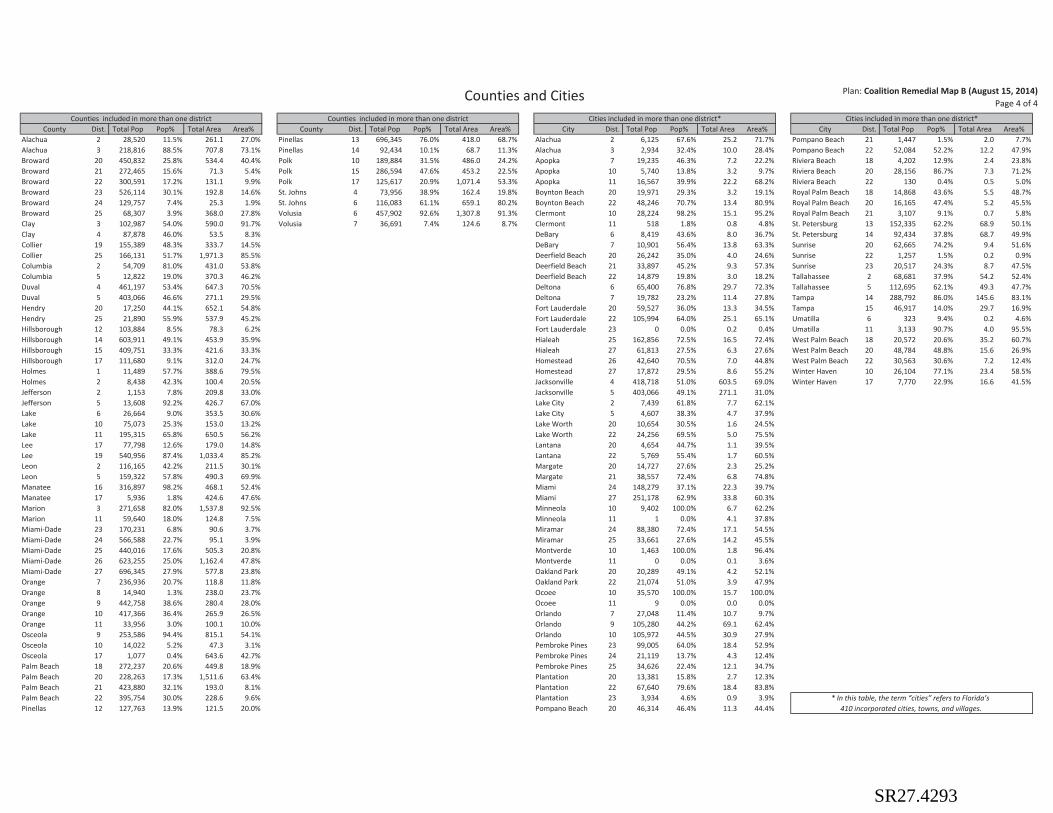
Counties and Cities Plan: Coalition Remedial Map B (August 15, 2014)Page 4 of 4
Counties included in more than one district Counties included in more than one district Cities included in more than one district* Cities included in more than one district*County Dist. Total Pop Pop% Total Area Area% County Dist. Total Pop Pop% Total Area Area% City Dist. Total Pop Pop% Total Area Area% City Dist. Total Pop Pop% Total Area Area%
Alachua 2 28,520 11.5% 261.1 27.0% Pinellas 13 696,345 76.0% 418.0 68.7% Alachua 2 6,125 67.6% 25.2 71.7% Pompano Beach 21 1,447 1.5% 2.0 7.7%Alachua 3 218,816 88.5% 707.8 73.1% Pinellas 14 92,434 10.1% 68.7 11.3% Alachua 3 2,934 32.4% 10.0 28.4% Pompano Beach 22 52,084 52.2% 12.2 47.9%Broward 20 450,832 25.8% 534.4 40.4% Polk 10 189,884 31.5% 486.0 24.2% Apopka 7 19,235 46.3% 7.2 22.2% Riviera Beach 18 4,202 12.9% 2.4 23.8%Broward 21 272,465 15.6% 71.3 5.4% Polk 15 286,594 47.6% 453.2 22.5% Apopka 10 5,740 13.8% 3.2 9.7% Riviera Beach 20 28,156 86.7% 7.3 71.2%Broward 22 300,591 17.2% 131.1 9.9% Polk 17 125,617 20.9% 1,071.4 53.3% Apopka 11 16,567 39.9% 22.2 68.2% Riviera Beach 22 130 0.4% 0.5 5.0%Broward 23 526,114 30.1% 192.8 14.6% St. Johns 4 73,956 38.9% 162.4 19.8% Boynton Beach 20 19,971 29.3% 3.2 19.1% Royal Palm Beach 18 14,868 43.6% 5.5 48.7%Broward 24 129,757 7.4% 25.3 1.9% St. Johns 6 116,083 61.1% 659.1 80.2% Boynton Beach 22 48,246 70.7% 13.4 80.9% Royal Palm Beach 20 16,165 47.4% 5.2 45.5%Broward 25 68,307 3.9% 368.0 27.8% Volusia 6 457,902 92.6% 1,307.8 91.3% Clermont 10 28,224 98.2% 15.1 95.2% Royal Palm Beach 21 3,107 9.1% 0.7 5.8%Clay 3 102,987 54.0% 590.0 91.7% Volusia 7 36,691 7.4% 124.6 8.7% Clermont 11 518 1.8% 0.8 4.8% St. Petersburg 13 152,335 62.2% 68.9 50.1%Clay 4 87,878 46.0% 53.5 8.3% DeBary 6 8,419 43.6% 8.0 36.7% St. Petersburg 14 92,434 37.8% 68.7 49.9%Collier 19 155,389 48.3% 333.7 14.5% DeBary 7 10,901 56.4% 13.8 63.3% Sunrise 20 62,665 74.2% 9.4 51.6%Collier 25 166,131 51.7% 1,971.3 85.5% Deerfield Beach 20 26,242 35.0% 4.0 24.6% Sunrise 22 1,257 1.5% 0.2 0.9%Columbia 2 54,709 81.0% 431.0 53.8% Deerfield Beach 21 33,897 45.2% 9.3 57.3% Sunrise 23 20,517 24.3% 8.7 47.5%Columbia 5 12,822 19.0% 370.3 46.2% Deerfield Beach 22 14,879 19.8% 3.0 18.2% Tallahassee 2 68,681 37.9% 54.2 52.4%Duval 4 461,197 53.4% 647.3 70.5% Deltona 6 65,400 76.8% 29.7 72.3% Tallahassee 5 112,695 62.1% 49.3 47.7%Duval 5 403,066 46.6% 271.1 29.5% Deltona 7 19,782 23.2% 11.4 27.8% Tampa 14 288,792 86.0% 145.6 83.1%Hendry 20 17,250 44.1% 652.1 54.8% Fort Lauderdale 20 59,527 36.0% 13.3 34.5% Tampa 15 46,917 14.0% 29.7 16.9%Hendry 25 21,890 55.9% 537.9 45.2% Fort Lauderdale 22 105,994 64.0% 25.1 65.1% Umatilla 6 323 9.4% 0.2 4.6%Hillsborough 12 103,884 8.5% 78.3 6.2% Fort Lauderdale 23 0 0.0% 0.2 0.4% Umatilla 11 3,133 90.7% 4.0 95.5%Hillsborough 14 603,911 49.1% 453.9 35.9% Hialeah 25 162,856 72.5% 16.5 72.4% West Palm Beach 18 20,572 20.6% 35.2 60.7%Hillsborough 15 409,751 33.3% 421.6 33.3% Hialeah 27 61,813 27.5% 6.3 27.6% West Palm Beach 20 48,784 48.8% 15.6 26.9%Hillsborough 17 111,680 9.1% 312.0 24.7% Homestead 26 42,640 70.5% 7.0 44.8% West Palm Beach 22 30,563 30.6% 7.2 12.4%Holmes 1 11,489 57.7% 388.6 79.5% Homestead 27 17,872 29.5% 8.6 55.2% Winter Haven 10 26,104 77.1% 23.4 58.5%Holmes 2 8,438 42.3% 100.4 20.5% Jacksonville 4 418,718 51.0% 603.5 69.0% Winter Haven 17 7,770 22.9% 16.6 41.5%Jefferson 2 1,153 7.8% 209.8 33.0% Jacksonville 5 403,066 49.1% 271.1 31.0%Jefferson 5 13,608 92.2% 426.7 67.0% Lake City 2 7,439 61.8% 7.7 62.1%Lake 6 26,664 9.0% 353.5 30.6% Lake City 5 4,607 38.3% 4.7 37.9%Lake 10 75,073 25.3% 153.0 13.2% Lake Worth 20 10,654 30.5% 1.6 24.5%Lake 11 195,315 65.8% 650.5 56.2% Lake Worth 22 24,256 69.5% 5.0 75.5%Lee 17 77,798 12.6% 179.0 14.8% Lantana 20 4,654 44.7% 1.1 39.5%Lee 19 540,956 87.4% 1,033.4 85.2% Lantana 22 5,769 55.4% 1.7 60.5%Leon 2 116,165 42.2% 211.5 30.1% Margate 20 14,727 27.6% 2.3 25.2%Leon 5 159,322 57.8% 490.3 69.9% Margate 21 38,557 72.4% 6.8 74.8%Manatee 16 316,897 98.2% 468.1 52.4% Miami 24 148,279 37.1% 22.3 39.7%Manatee 17 5,936 1.8% 424.6 47.6% Miami 27 251,178 62.9% 33.8 60.3%Marion 3 271,658 82.0% 1,537.8 92.5% Minneola 10 9,402 100.0% 6.7 62.2%Marion 11 59,640 18.0% 124.8 7.5% Minneola 11 1 0.0% 4.1 37.8%Miami-Dade 23 170,231 6.8% 90.6 3.7% Miramar 24 88,380 72.4% 17.1 54.5%Miami-Dade 24 566,588 22.7% 95.1 3.9% Miramar 25 33,661 27.6% 14.2 45.5%Miami-Dade 25 440,016 17.6% 505.3 20.8% Montverde 10 1,463 100.0% 1.8 96.4%Miami-Dade 26 623,255 25.0% 1,162.4 47.8% Montverde 11 0 0.0% 0.1 3.6%Miami-Dade 27 696,345 27.9% 577.8 23.8% Oakland Park 20 20,289 49.1% 4.2 52.1%Orange 7 236,936 20.7% 118.8 11.8% Oakland Park 22 21,074 51.0% 3.9 47.9%Orange 8 14,940 1.3% 238.0 23.7% Ocoee 10 35,570 100.0% 15.7 100.0%Orange 9 442,758 38.6% 280.4 28.0% Ocoee 11 9 0.0% 0.0 0.0%Orange 10 417,366 36.4% 265.9 26.5% Orlando 7 27,048 11.4% 10.7 9.7%Orange 11 33,956 3.0% 100.1 10.0% Orlando 9 105,280 44.2% 69.1 62.4%Osceola 9 253,586 94.4% 815.1 54.1% Orlando 10 105,972 44.5% 30.9 27.9%Osceola 10 14,022 5.2% 47.3 3.1% Pembroke Pines 23 99,005 64.0% 18.4 52.9%Osceola 17 1,077 0.4% 643.6 42.7% Pembroke Pines 24 21,119 13.7% 4.3 12.4%Palm Beach 18 272,237 20.6% 449.8 18.9% Pembroke Pines 25 34,626 22.4% 12.1 34.7%Palm Beach 20 228,263 17.3% 1,511.6 63.4% Plantation 20 13,381 15.8% 2.7 12.3%Palm Beach 21 423,880 32.1% 193.0 8.1% Plantation 22 67,640 79.6% 18.4 83.8%Palm Beach 22 395,754 30.0% 228.6 9.6% Plantation 23 3,934 4.6% 0.9 3.9% * In this table, the term “cities” refers to Florida’s Pinellas 12 127,763 13.9% 121.5 20.0% Pompano Beach 20 46,314 46.4% 11.3 44.4% 410 incorporated cities, towns, and villages.
SR27.4293
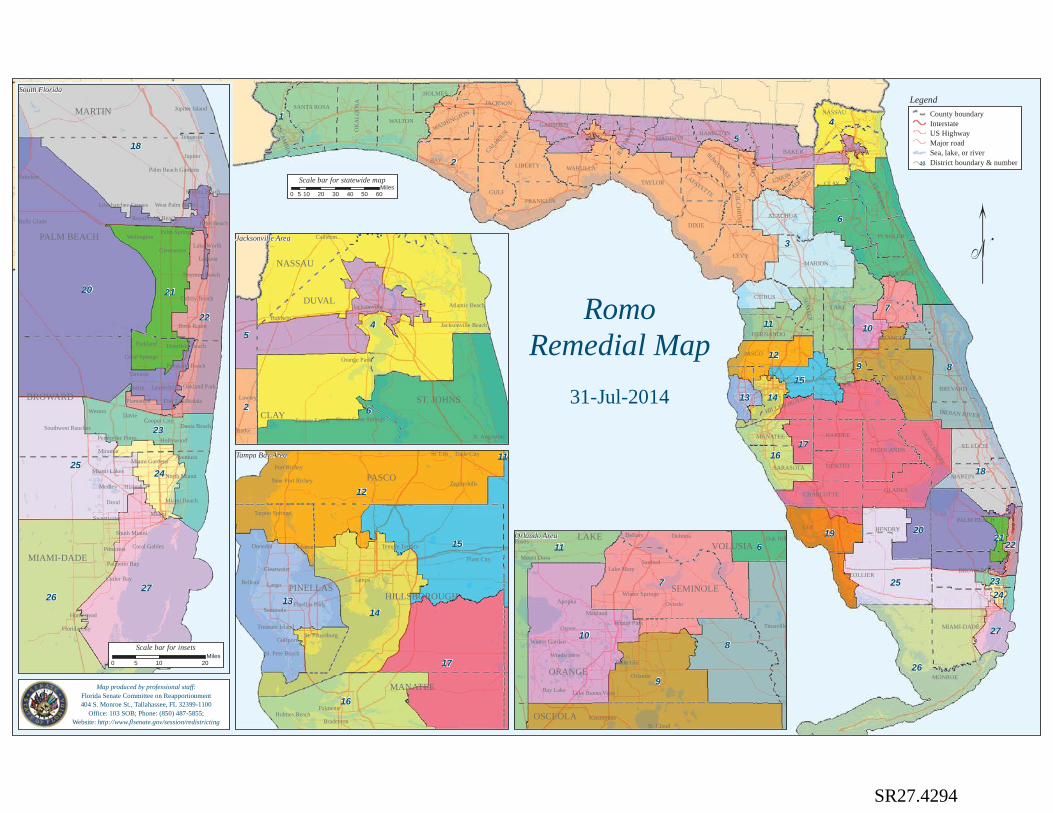
2
1
5
17
6
3
26
89
25
4
11
20
18
7
19
16
12
15
27
14
10
13
22
23
21
24
MONROE
POLK
LEE
COLLIER
LEVY
BAY
LAKE
MARION
MIAMI-DADE
PALM BEACH
BREVARD
VOLUSIA
OSCEOLA
TAYLOR
DIXIE
WALTON
GULF
HENDRY
DUVAL
PASCO
LEON
BROWARD
CLAY
GLADES
ORANGE
CITRUS
JACKSON
LIBERTY
FRANKLIN
OK
ALO
OSA
ALACHUA
SANTA ROSA
MARTIN
HIGHLANDS
NASSAU
MANATEE
ST. JOH
NS
BAKER
ESCAM
BIA
HILLSBOROUGH
DESOTO
MADISON
HARDEE
COLU
MBI
A
WAKULLA
ST. LUCIE
SUM
TER
CHARLOTTE
SARASOTA
OKEECHOBEE
FLAGLER
SUWANNEE
HOLMES
JEFF
ERSO
N
CALHOUN
GADSDEN
HERNANDO
HAMILTON
LAFAYETTE
WASHINGTON
INDIAN RIVER
UNION
GILCH
RIST
BRADFORD
20
18
2726
25
22
23
21
24
Miami
Davie
Wellington
Jupiter
Miramar
Weston
Hialeah
Hollywood
Doral
Plantation
West Palm Beach
Coral Gables
Boca Raton
Palm Beach Gardens
Sunrise
Pembroke Pines
Fort Lauderdale
Coral SpringsPompano Beach
Parkland
Tamarac
Homestead
Miami Gardens
Delray Beach
Miami Beach
Boynton Beach
Deerfield Beach
Cutler Bay
Palm Beach
Lauderhill
Pinecrest
North Miami
Medley
Riviera Beach
Cooper City
Palmetto Bay
Royal Palm Beach
Loxahatchee Groves
Oakland Park
Lake WorthGreenacres
Florida City
Miami Lakes
Southwest Ranches Dania Beach
Aventura
Lantana
Jupiter Island
Tequesta
Palm Springs
Pahokee
South Miami
Sweetwater
Belle Glade
PALM BEACH
MIAMI-DADE
BROWARD
MARTIN
4
6
5
2
Jacksonville
Jacksonville Beach
Atlantic Beach
Starke
Green Cove Springs
Orange Park
St. Augustine
Baldwin
Lawtey
Callahan
Penney Farms
DUVAL
CLAY
ST. JOHNS
NASSAU
7
9
810
11 6
Orlando
DeBary
Sanford
Bay Lake
Ocoee
Oviedo
Eustis
Kissimmee
Deltona
Apopka
Mount Dora
Winter Springs
Winter Garden
Lake Mary
Winter ParkMaitland
Belle Isle
Titusville
Oak Hill
Lake Buena Vista
Windermere
St. Cloud
ORANGE
LAKE
SEMINOLE
OSCEOLA
VOLUSIA
12
17
14
15
13
16
11
Tampa
St. Petersburg
Dunedin
Plant CityClearwater
Largo
Bradenton
St. Pete Beach
Pinellas Park
Tarpon Springs
Oldsmar
Zephyrhills
Palmetto
Seminole
Temple Terrace
Gulfport
Belleair
Treasure Island
New Port Richey
Port Richey
St. Leo
Holmes Beach
Dade City
PASCO
HILLSBOROUGHPINELLAS
MANATEE
Tampa Bay Area
Jacksonville Area
Orlando Area
South Florida
"
LegendCounty boundaryInterstateUS HighwayMajor roadSea, lake, or riverDistrict boundary & number10
Map produced by professional staff:Florida Senate Committee on Reapportionment404 S. Monroe St., Tallahassee, FL 32399-1100
Office: 103 SOB; Phone: (850) 487-5855;Website: http://www.flsenate.gov/session/redistricting
0 10 205Miles
Scale bar for insets
Scale bar for statewide map
0 10 20 30 40 50 605Miles
RomoRemedial Map
31-Jul-2014
SR27.4294
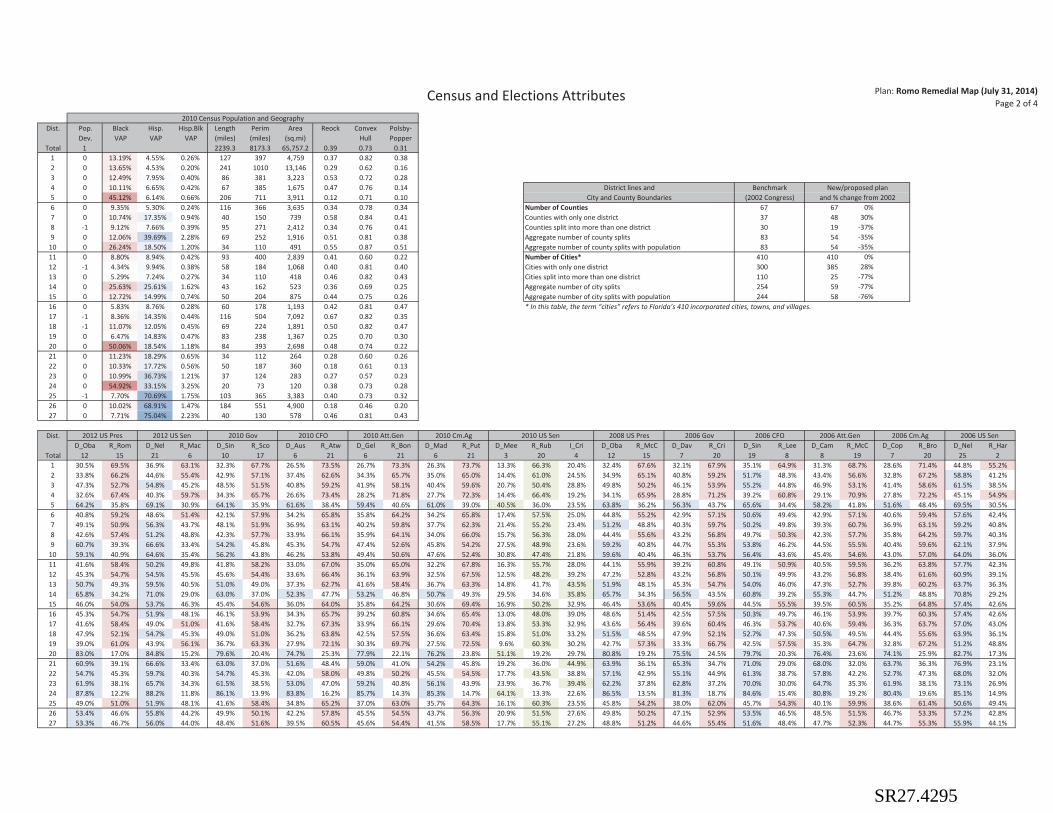
Census and Elections Attributes Plan: Romo Remedial Map (July 31, 2014)Page 2 of 4
2010 Census Population and Geography Dist. Pop. Black Hisp. Hisp.Blk Length Perim Area Reock Convex Polsby-
Dev. VAP VAP VAP (miles) (miles) (sq.mi) Hull Popper Total 1 2239.3 8173.3 65,757.2 0.39 0.73 0.31
1 0 13.19% 4.55% 0.26% 127 397 4,759 0.37 0.82 0.382 0 13.65% 4.53% 0.20% 241 1010 13,146 0.29 0.62 0.163 0 12.49% 7.95% 0.40% 86 381 3,223 0.53 0.72 0.284 0 10.11% 6.65% 0.42% 67 385 1,675 0.47 0.76 0.14 District lines and Benchmark New/proposed plan5 0 45.12% 6.14% 0.66% 206 711 3,911 0.12 0.71 0.10 City and County Boundaries (2002 Congress) and % change from 20026 0 9.35% 5.30% 0.24% 116 366 3,635 0.34 0.78 0.34 Number of Counties 67 67 0%7 0 10.74% 17.35% 0.94% 40 150 739 0.58 0.84 0.41 Counties with only one district 37 48 30%8 -1 9.12% 7.66% 0.39% 95 271 2,412 0.34 0.76 0.41 Counties split into more than one district 30 19 -37%9 0 12.06% 39.69% 2.28% 69 252 1,916 0.51 0.81 0.38 Aggregate number of county splits 83 54 -35%
10 0 26.24% 18.50% 1.20% 34 110 491 0.55 0.87 0.51 Aggregate number of county splits with population 83 54 -35%11 0 8.80% 8.94% 0.42% 93 400 2,839 0.41 0.60 0.22 Number of Cities* 410 410 0%12 -1 4.34% 9.94% 0.38% 58 184 1,068 0.40 0.81 0.40 Cities with only one district 300 385 28%13 0 5.29% 7.24% 0.27% 34 110 418 0.46 0.82 0.43 Cities split into more than one district 110 25 -77%14 0 25.63% 25.61% 1.62% 43 162 523 0.36 0.69 0.25 Aggregate number of city splits 254 59 -77%15 0 12.72% 14.99% 0.74% 50 204 875 0.44 0.75 0.26 Aggregate number of city splits with population 244 58 -76%16 0 5.83% 8.76% 0.28% 60 178 1,193 0.42 0.81 0.47 * In this table, the term “cities” refers to Florida’s 410 incorporated cities, towns, and villages.17 -1 8.36% 14.35% 0.44% 116 504 7,092 0.67 0.82 0.3518 -1 11.07% 12.05% 0.45% 69 224 1,891 0.50 0.82 0.4719 0 6.47% 14.83% 0.47% 83 238 1,367 0.25 0.70 0.3020 0 50.06% 18.54% 1.18% 84 393 2,698 0.48 0.74 0.2221 0 11.23% 18.29% 0.65% 34 112 264 0.28 0.60 0.2622 0 10.33% 17.72% 0.56% 50 187 360 0.18 0.61 0.1323 0 10.99% 36.73% 1.21% 37 124 283 0.27 0.57 0.2324 0 54.92% 33.15% 3.25% 20 73 120 0.38 0.73 0.2825 -1 7.70% 70.69% 1.75% 103 365 3,383 0.40 0.73 0.3226 0 10.02% 68.91% 1.47% 184 551 4,900 0.18 0.46 0.2027 0 7.71% 75.04% 2.23% 40 130 578 0.46 0.81 0.43
Dist. 2012 US Pres 2012 US Sen 2010 Gov 2010 CFO 2010 Att.Gen 2010 Cm.Ag 2010 US Sen 2008 US Pres 2006 Gov 2006 CFO 2006 Att.Gen 2006 Cm.Ag 2006 US Sen D_Oba R_Rom D_Nel R_Mac D_Sin R_Sco D_Aus R_Atw D_Gel R_Bon D_Mad R_Put D_Mee R_Rub I_Cri D_Oba R_McC D_Dav R_Cri D_Sin R_Lee D_Cam R_McC D_Cop R_Bro D_Nel R_Har
Total 12 15 21 6 10 17 6 21 6 21 6 21 3 20 4 12 15 7 20 19 8 8 19 7 20 25 21 30.5% 69.5% 36.9% 63.1% 32.3% 67.7% 26.5% 73.5% 26.7% 73.3% 26.3% 73.7% 13.3% 66.3% 20.4% 32.4% 67.6% 32.1% 67.9% 35.1% 64.9% 31.3% 68.7% 28.6% 71.4% 44.8% 55.2%2 33.8% 66.2% 44.6% 55.4% 42.9% 57.1% 37.4% 62.6% 34.3% 65.7% 35.0% 65.0% 14.4% 61.0% 24.5% 34.9% 65.1% 40.8% 59.2% 51.7% 48.3% 43.4% 56.6% 32.8% 67.2% 58.8% 41.2%3 47.3% 52.7% 54.8% 45.2% 48.5% 51.5% 40.8% 59.2% 41.9% 58.1% 40.4% 59.6% 20.7% 50.4% 28.8% 49.8% 50.2% 46.1% 53.9% 55.2% 44.8% 46.9% 53.1% 41.4% 58.6% 61.5% 38.5%4 32.6% 67.4% 40.3% 59.7% 34.3% 65.7% 26.6% 73.4% 28.2% 71.8% 27.7% 72.3% 14.4% 66.4% 19.2% 34.1% 65.9% 28.8% 71.2% 39.2% 60.8% 29.1% 70.9% 27.8% 72.2% 45.1% 54.9%5 64.2% 35.8% 69.1% 30.9% 64.1% 35.9% 61.6% 38.4% 59.4% 40.6% 61.0% 39.0% 40.5% 36.0% 23.5% 63.8% 36.2% 56.3% 43.7% 65.6% 34.4% 58.2% 41.8% 51.6% 48.4% 69.5% 30.5%6 40.8% 59.2% 48.6% 51.4% 42.1% 57.9% 34.2% 65.8% 35.8% 64.2% 34.2% 65.8% 17.4% 57.5% 25.0% 44.8% 55.2% 42.9% 57.1% 50.6% 49.4% 42.9% 57.1% 40.6% 59.4% 57.6% 42.4%7 49.1% 50.9% 56.3% 43.7% 48.1% 51.9% 36.9% 63.1% 40.2% 59.8% 37.7% 62.3% 21.4% 55.2% 23.4% 51.2% 48.8% 40.3% 59.7% 50.2% 49.8% 39.3% 60.7% 36.9% 63.1% 59.2% 40.8%8 42.6% 57.4% 51.2% 48.8% 42.3% 57.7% 33.9% 66.1% 35.9% 64.1% 34.0% 66.0% 15.7% 56.3% 28.0% 44.4% 55.6% 43.2% 56.8% 49.7% 50.3% 42.3% 57.7% 35.8% 64.2% 59.7% 40.3%9 60.7% 39.3% 66.6% 33.4% 54.2% 45.8% 45.3% 54.7% 47.4% 52.6% 45.8% 54.2% 27.5% 48.9% 23.6% 59.2% 40.8% 44.7% 55.3% 53.8% 46.2% 44.5% 55.5% 40.4% 59.6% 62.1% 37.9%
10 59.1% 40.9% 64.6% 35.4% 56.2% 43.8% 46.2% 53.8% 49.4% 50.6% 47.6% 52.4% 30.8% 47.4% 21.8% 59.6% 40.4% 46.3% 53.7% 56.4% 43.6% 45.4% 54.6% 43.0% 57.0% 64.0% 36.0%11 41.6% 58.4% 50.2% 49.8% 41.8% 58.2% 33.0% 67.0% 35.0% 65.0% 32.2% 67.8% 16.3% 55.7% 28.0% 44.1% 55.9% 39.2% 60.8% 49.1% 50.9% 40.5% 59.5% 36.2% 63.8% 57.7% 42.3%12 45.3% 54.7% 54.5% 45.5% 45.6% 54.4% 33.6% 66.4% 36.1% 63.9% 32.5% 67.5% 12.5% 48.2% 39.2% 47.2% 52.8% 43.2% 56.8% 50.1% 49.9% 43.2% 56.8% 38.4% 61.6% 60.9% 39.1%13 50.7% 49.3% 59.5% 40.5% 51.0% 49.0% 37.3% 62.7% 41.6% 58.4% 36.7% 63.3% 14.8% 41.7% 43.5% 51.9% 48.1% 45.3% 54.7% 54.0% 46.0% 47.3% 52.7% 39.8% 60.2% 63.7% 36.3%14 65.8% 34.2% 71.0% 29.0% 63.0% 37.0% 52.3% 47.7% 53.2% 46.8% 50.7% 49.3% 29.5% 34.6% 35.8% 65.7% 34.3% 56.5% 43.5% 60.8% 39.2% 55.3% 44.7% 51.2% 48.8% 70.8% 29.2%15 46.0% 54.0% 53.7% 46.3% 45.4% 54.6% 36.0% 64.0% 35.8% 64.2% 30.6% 69.4% 16.9% 50.2% 32.9% 46.4% 53.6% 40.4% 59.6% 44.5% 55.5% 39.5% 60.5% 35.2% 64.8% 57.4% 42.6%16 45.3% 54.7% 51.9% 48.1% 46.1% 53.9% 34.3% 65.7% 39.2% 60.8% 34.6% 65.4% 13.0% 48.0% 39.0% 48.6% 51.4% 42.5% 57.5% 50.3% 49.7% 46.1% 53.9% 39.7% 60.3% 57.4% 42.6%17 41.6% 58.4% 49.0% 51.0% 41.6% 58.4% 32.7% 67.3% 33.9% 66.1% 29.6% 70.4% 13.8% 53.3% 32.9% 43.6% 56.4% 39.6% 60.4% 46.3% 53.7% 40.6% 59.4% 36.3% 63.7% 57.0% 43.0%18 47.9% 52.1% 54.7% 45.3% 49.0% 51.0% 36.2% 63.8% 42.5% 57.5% 36.6% 63.4% 15.8% 51.0% 33.2% 51.5% 48.5% 47.9% 52.1% 52.7% 47.3% 50.5% 49.5% 44.4% 55.6% 63.9% 36.1%19 39.0% 61.0% 43.9% 56.1% 36.7% 63.3% 27.9% 72.1% 30.3% 69.7% 27.5% 72.5% 9.6% 60.3% 30.2% 42.7% 57.3% 33.3% 66.7% 42.5% 57.5% 35.3% 64.7% 32.8% 67.2% 51.2% 48.8%20 83.0% 17.0% 84.8% 15.2% 79.6% 20.4% 74.7% 25.3% 77.9% 22.1% 76.2% 23.8% 51.1% 19.2% 29.7% 80.8% 19.2% 75.5% 24.5% 79.7% 20.3% 76.4% 23.6% 74.1% 25.9% 82.7% 17.3%21 60.9% 39.1% 66.6% 33.4% 63.0% 37.0% 51.6% 48.4% 59.0% 41.0% 54.2% 45.8% 19.2% 36.0% 44.9% 63.9% 36.1% 65.3% 34.7% 71.0% 29.0% 68.0% 32.0% 63.7% 36.3% 76.9% 23.1%22 54.7% 45.3% 59.7% 40.3% 54.7% 45.3% 42.0% 58.0% 49.8% 50.2% 45.5% 54.5% 17.7% 43.5% 38.8% 57.1% 42.9% 55.1% 44.9% 61.3% 38.7% 57.8% 42.2% 52.7% 47.3% 68.0% 32.0%23 61.9% 38.1% 65.7% 34.3% 61.5% 38.5% 53.0% 47.0% 59.2% 40.8% 56.1% 43.9% 23.9% 36.7% 39.4% 62.2% 37.8% 62.8% 37.2% 70.0% 30.0% 64.7% 35.3% 61.9% 38.1% 73.1% 26.9%24 87.8% 12.2% 88.2% 11.8% 86.1% 13.9% 83.8% 16.2% 85.7% 14.3% 85.3% 14.7% 64.1% 13.3% 22.6% 86.5% 13.5% 81.3% 18.7% 84.6% 15.4% 80.8% 19.2% 80.4% 19.6% 85.1% 14.9%25 49.0% 51.0% 51.9% 48.1% 41.6% 58.4% 34.8% 65.2% 37.0% 63.0% 35.7% 64.3% 16.1% 60.3% 23.5% 45.8% 54.2% 38.0% 62.0% 45.7% 54.3% 40.1% 59.9% 38.6% 61.4% 50.6% 49.4%26 53.4% 46.6% 55.8% 44.2% 49.9% 50.1% 42.2% 57.8% 45.5% 54.5% 43.7% 56.3% 20.9% 51.5% 27.6% 49.8% 50.2% 47.1% 52.9% 53.5% 46.5% 48.5% 51.5% 46.7% 53.3% 57.2% 42.8%27 53.3% 46.7% 56.0% 44.0% 48.4% 51.6% 39.5% 60.5% 45.6% 54.4% 41.5% 58.5% 17.7% 55.1% 27.2% 48.8% 51.2% 44.6% 55.4% 51.6% 48.4% 47.7% 52.3% 44.7% 55.3% 55.9% 44.1%
SR27.4295

Voter Registration and Turnout Plan: Romo Remedial Map (July 31, 2014)Page 3 of 4
2012 General Election Registered Voters 2012 General Election Voter Turnout Dist. RV who are: RV who are: Dems who are: Reps who are: Blks who Hisp. who are: Voters who are: Voters who are: Dems who are: Reps who are: Blks who Hisp. who are:
Dems Reps NPA-Oth Black Hisp. Black Hisp. Black Hisp. are Dems Dems Reps Dems Reps NPA-Oth Black Hisp. Black Hisp. Black Hisp. are Dems Dems Reps1 29.1% 51.9% 19.1% 11.3% 2.0% 31.2% 2.0% 1.3% 1.5% 80.3% 28.6% 40.1% 28.7% 55.8% 15.5% 11.4% 1.7% 33.4% 1.6% 1.0% 1.4% 83.9% 27.5% 44.8%2 45.8% 39.1% 15.1% 10.3% 1.9% 19.6% 1.6% 1.1% 1.6% 87.0% 38.1% 33.7% 46.2% 41.9% 11.9% 10.5% 1.7% 20.3% 1.4% 0.8% 1.5% 89.8% 38.0% 37.0%3 40.4% 37.8% 21.8% 11.0% 5.3% 23.2% 6.1% 1.1% 3.4% 85.0% 46.7% 24.4% 40.5% 40.9% 18.6% 11.0% 4.5% 23.9% 5.3% 0.8% 2.9% 87.8% 47.5% 26.2%4 28.7% 49.9% 21.4% 9.7% 3.9% 26.2% 4.5% 1.1% 2.6% 77.4% 33.0% 33.1% 28.3% 54.0% 17.8% 9.8% 3.3% 27.8% 3.9% 1.0% 2.3% 80.2% 33.0% 37.3%5 61.1% 23.0% 15.9% 46.1% 3.1% 66.1% 2.2% 5.3% 3.1% 87.7% 44.4% 23.4% 63.3% 24.2% 12.5% 47.6% 2.6% 67.7% 1.9% 4.2% 2.7% 90.1% 46.0% 25.7%6 34.7% 41.4% 24.0% 8.2% 2.8% 19.5% 3.4% 0.8% 1.8% 82.7% 41.1% 26.3% 34.5% 45.2% 20.3% 8.1% 2.5% 20.2% 3.0% 0.6% 1.6% 85.6% 41.5% 30.0%7 35.6% 37.0% 27.5% 9.5% 13.8% 21.0% 17.7% 1.1% 7.2% 78.3% 45.8% 19.2% 35.6% 40.9% 23.5% 9.7% 12.0% 22.1% 16.0% 1.0% 6.2% 81.0% 47.3% 21.2%8 33.4% 43.5% 23.1% 7.9% 4.6% 19.2% 5.8% 0.9% 2.9% 81.6% 41.9% 27.2% 33.1% 46.9% 20.0% 7.9% 4.1% 20.0% 5.2% 0.7% 2.6% 84.1% 42.2% 30.1%9 42.1% 27.7% 30.2% 9.3% 35.7% 17.3% 41.9% 1.4% 18.4% 78.0% 49.5% 14.3% 43.2% 31.1% 25.7% 10.3% 31.5% 19.3% 38.7% 1.2% 15.2% 81.0% 53.1% 15.0%
10 44.7% 29.9% 25.4% 23.5% 13.2% 43.4% 14.3% 2.7% 7.6% 82.6% 48.4% 17.2% 45.2% 33.3% 21.5% 23.9% 11.2% 45.2% 12.3% 2.1% 6.4% 85.4% 49.8% 19.2%11 34.9% 42.8% 22.3% 6.9% 5.9% 16.4% 8.2% 0.8% 3.1% 82.5% 47.9% 22.0% 34.1% 46.6% 19.2% 6.9% 5.0% 17.1% 7.3% 0.6% 2.6% 85.1% 49.5% 23.9%12 33.3% 40.2% 26.5% 3.8% 6.7% 8.6% 8.7% 0.6% 4.2% 75.1% 43.2% 25.1% 33.1% 43.8% 23.1% 4.0% 6.1% 9.3% 8.0% 0.5% 3.8% 77.3% 43.8% 27.8%13 35.2% 37.5% 27.3% 4.5% 3.9% 9.9% 5.0% 0.5% 2.3% 77.4% 44.4% 21.9% 35.7% 40.7% 23.6% 4.5% 3.5% 10.1% 4.5% 0.4% 2.1% 80.8% 46.4% 24.1%14 50.2% 24.5% 25.3% 25.5% 15.7% 42.3% 15.0% 3.4% 11.9% 83.3% 47.8% 18.5% 52.0% 26.8% 21.3% 26.4% 13.8% 43.8% 13.3% 2.6% 10.5% 86.0% 50.3% 20.4%15 37.7% 38.1% 24.1% 12.4% 9.0% 26.4% 10.3% 1.4% 5.5% 80.4% 43.0% 23.0% 38.0% 41.7% 20.3% 12.9% 7.8% 28.1% 9.1% 1.2% 4.8% 82.8% 44.3% 25.5%16 32.1% 43.5% 24.4% 4.9% 3.6% 12.5% 4.9% 0.5% 1.9% 81.2% 43.3% 23.2% 32.0% 46.8% 21.2% 4.8% 3.1% 12.7% 4.4% 0.4% 1.6% 84.6% 45.2% 24.6%17 36.0% 41.3% 22.7% 7.3% 7.3% 16.6% 9.1% 0.8% 4.1% 82.1% 45.1% 23.0% 35.4% 45.3% 19.2% 7.6% 5.8% 18.1% 7.7% 0.6% 3.2% 84.9% 47.0% 25.4%18 36.2% 38.1% 25.7% 9.6% 6.3% 21.5% 7.8% 1.1% 3.8% 81.1% 44.7% 23.1% 36.2% 41.4% 22.5% 9.9% 5.5% 22.8% 7.0% 0.9% 3.4% 83.6% 45.7% 25.8%19 27.5% 46.5% 25.9% 4.7% 7.1% 13.0% 10.6% 0.5% 3.6% 77.0% 41.3% 23.9% 26.8% 51.3% 22.0% 4.5% 5.6% 13.5% 9.2% 0.4% 2.9% 80.7% 43.5% 26.7%20 65.6% 13.3% 21.1% 48.0% 10.8% 61.7% 8.3% 10.4% 14.1% 84.4% 50.2% 17.3% 69.7% 12.8% 17.5% 52.2% 9.6% 65.3% 7.2% 9.0% 13.6% 87.1% 52.3% 18.3%21 46.8% 25.8% 27.4% 8.9% 11.6% 14.7% 11.2% 1.4% 8.8% 77.0% 45.2% 19.7% 48.4% 26.9% 24.8% 9.6% 10.6% 15.8% 10.1% 1.3% 8.3% 79.4% 46.1% 21.2%22 40.8% 31.8% 27.4% 7.7% 9.2% 14.9% 10.0% 1.0% 6.4% 79.3% 44.4% 22.0% 41.7% 33.8% 24.5% 8.0% 8.5% 15.7% 9.1% 0.8% 6.1% 81.9% 44.8% 24.3%23 47.1% 24.9% 28.0% 9.7% 26.3% 16.4% 22.8% 1.5% 27.3% 79.8% 40.9% 25.8% 48.8% 26.1% 25.1% 10.4% 26.3% 17.6% 22.1% 1.4% 28.0% 82.3% 40.9% 27.7%24 68.6% 10.4% 20.9% 55.2% 22.9% 68.8% 15.5% 13.9% 47.7% 85.5% 46.3% 21.7% 72.4% 9.8% 17.8% 59.1% 20.7% 71.6% 13.7% 12.6% 48.3% 87.8% 47.8% 22.8%25 32.4% 38.4% 29.2% 6.3% 58.1% 15.5% 53.4% 0.8% 58.3% 79.3% 29.8% 38.5% 32.3% 42.0% 25.7% 7.0% 55.2% 17.7% 49.7% 0.7% 55.7% 82.0% 29.1% 42.4%26 35.6% 35.2% 29.3% 9.3% 57.3% 21.2% 45.3% 1.1% 66.2% 80.8% 28.1% 40.6% 36.1% 38.4% 25.5% 9.7% 56.1% 22.5% 42.2% 0.9% 65.9% 83.8% 27.2% 45.0%27 35.8% 35.9% 28.3% 7.0% 60.5% 15.8% 48.3% 0.8% 71.0% 80.5% 28.6% 42.1% 36.1% 38.6% 25.2% 7.1% 59.7% 16.3% 45.7% 0.6% 71.0% 83.1% 27.7% 46.0%
2010 General Election Registered Voters 2010 General Election Voter Turnout 2010 Primary Turnout Dist. RV who are: RV who are: Dems who are: Reps who are: Blks who Hisp. who are: Voters who are: Voters who are: Dems who are: Reps who are: Blks who Hisp. who are: Dems who are: Reps who
Dems Reps NPA-Oth Black Hisp. Black Hisp. Black Hisp. are Dems Dems Reps Dems Reps NPA-Oth Black Hisp. Black Hisp. Black Hisp. are Dems Dems Reps Black Hisp are Hisp.1 31.0% 50.9% 18.1% 11.0% 1.8% 28.6% 1.7% 1.4% 1.4% 80.6% 29.6% 40.4% 29.2% 59.8% 11.0% 9.6% 1.1% 28.6% 0.9% 0.9% 1.0% 87.3% 24.8% 55.7% 24.3% 0.7% 0.7%2 49.4% 36.6% 13.9% 10.4% 1.7% 18.5% 1.4% 1.2% 1.6% 87.9% 40.3% 34.2% 49.2% 41.9% 8.9% 8.8% 1.1% 16.6% 0.8% 0.6% 1.1% 92.6% 35.5% 44.1% 15.1% 0.5% 0.9%3 42.4% 37.0% 20.6% 10.6% 4.8% 21.4% 5.5% 1.2% 3.2% 85.7% 48.4% 25.0% 40.5% 44.5% 15.0% 8.7% 2.7% 19.5% 3.1% 0.6% 2.0% 90.8% 46.5% 33.1% 16.6% 1.6% 1.4%4 31.0% 49.1% 19.9% 10.2% 3.6% 26.1% 4.0% 1.2% 2.5% 79.2% 34.4% 34.1% 28.6% 58.1% 13.3% 8.5% 2.2% 24.7% 2.3% 0.9% 1.8% 83.1% 29.7% 47.9% 20.5% 1.3% 1.3%5 62.1% 23.3% 14.6% 44.2% 2.7% 63.1% 2.0% 5.2% 2.8% 88.6% 45.5% 24.1% 63.5% 27.5% 8.9% 41.6% 1.6% 60.9% 1.1% 3.1% 1.9% 93.0% 44.8% 32.8% 57.2% 0.6% 1.4%6 36.4% 40.6% 22.9% 8.0% 2.6% 18.3% 3.0% 0.8% 1.7% 83.4% 42.3% 26.2% 34.3% 49.3% 16.4% 6.4% 1.7% 16.6% 2.0% 0.4% 1.3% 89.1% 40.3% 37.1% 15.8% 1.2% 0.9%7 36.4% 37.6% 26.0% 9.1% 12.7% 19.8% 16.2% 1.2% 6.9% 79.0% 46.3% 20.4% 33.9% 48.0% 18.1% 8.0% 8.0% 19.8% 10.8% 0.8% 4.8% 83.8% 45.4% 28.6% 18.4% 7.7% 3.5%8 35.0% 43.9% 21.1% 7.5% 4.2% 17.6% 5.2% 0.9% 2.7% 82.7% 43.2% 28.1% 32.3% 52.2% 15.4% 6.2% 2.8% 16.7% 3.6% 0.6% 2.0% 86.7% 40.7% 37.7% 15.7% 2.5% 1.6%9 43.0% 29.4% 27.7% 8.9% 33.4% 16.4% 39.4% 1.4% 18.3% 79.2% 50.8% 16.1% 40.9% 40.7% 18.4% 9.3% 21.2% 19.2% 28.4% 1.0% 11.3% 84.3% 54.8% 21.7% 15.9% 20.7% 7.9%
10 45.3% 31.1% 23.5% 22.9% 12.1% 42.2% 13.1% 2.8% 7.3% 83.4% 48.9% 18.8% 42.7% 41.4% 15.9% 20.4% 7.5% 42.1% 8.4% 1.7% 4.9% 87.9% 47.8% 27.3% 39.4% 5.7% 3.5%11 36.3% 42.4% 21.3% 6.7% 5.6% 15.3% 7.4% 0.8% 3.0% 83.3% 48.2% 22.7% 32.8% 51.5% 15.7% 5.3% 3.0% 14.4% 4.3% 0.5% 1.8% 88.1% 47.7% 31.4% 12.8% 2.7% 1.3%12 34.7% 40.1% 25.2% 3.5% 6.0% 7.7% 7.6% 0.5% 3.8% 75.8% 44.3% 25.8% 32.6% 48.6% 18.9% 3.1% 3.8% 7.7% 4.8% 0.4% 2.8% 79.6% 41.0% 36.2% 6.1% 2.9% 2.0%13 36.2% 37.9% 25.8% 4.1% 3.5% 8.8% 4.3% 0.5% 2.1% 77.8% 44.6% 23.1% 35.2% 45.8% 19.0% 3.0% 2.1% 7.2% 2.6% 0.3% 1.5% 84.7% 43.1% 33.1% 5.7% 1.9% 1.2%14 51.0% 25.4% 23.6% 24.9% 14.1% 41.0% 13.0% 3.5% 11.3% 84.0% 47.1% 20.3% 51.5% 32.8% 15.6% 23.0% 8.4% 40.0% 7.6% 2.1% 7.9% 89.6% 46.5% 30.6% 38.5% 4.2% 5.6%15 39.0% 38.6% 22.4% 11.8% 8.1% 24.6% 9.1% 1.4% 5.2% 81.6% 43.6% 24.4% 37.3% 47.8% 14.9% 10.2% 4.6% 23.5% 5.1% 0.9% 3.4% 85.9% 41.0% 35.6% 20.6% 2.6% 2.4%16 32.8% 43.6% 23.5% 4.7% 3.1% 11.6% 4.1% 0.6% 1.8% 81.0% 42.7% 24.5% 30.8% 51.5% 17.7% 3.4% 1.7% 9.7% 2.3% 0.3% 1.1% 87.4% 41.1% 34.6% 9.5% 1.4% 0.9%17 37.7% 40.8% 21.6% 6.9% 6.5% 15.2% 8.0% 0.8% 3.8% 82.6% 45.8% 24.0% 34.7% 50.0% 15.4% 5.6% 3.3% 14.1% 4.2% 0.5% 2.3% 87.6% 44.4% 34.5% 11.4% 2.6% 1.6%18 37.3% 38.0% 24.7% 9.0% 5.7% 19.6% 7.0% 1.0% 3.5% 81.6% 45.9% 23.5% 34.8% 46.6% 18.7% 7.5% 3.4% 18.7% 4.2% 0.7% 2.5% 86.4% 43.6% 34.5% 18.0% 2.7% 1.8%19 28.3% 47.2% 24.5% 4.2% 6.2% 11.4% 9.2% 0.5% 3.4% 77.6% 41.8% 25.4% 24.4% 58.0% 17.6% 2.6% 3.1% 8.8% 4.9% 0.3% 2.0% 83.3% 39.1% 38.6% 7.7% 2.8% 1.5%20 65.2% 14.5% 20.4% 45.6% 10.1% 59.0% 7.7% 10.3% 13.1% 84.4% 50.0% 18.9% 69.9% 16.6% 13.5% 48.4% 6.3% 62.1% 4.5% 6.9% 10.1% 89.8% 49.7% 26.8% 61.6% 2.7% 8.3%21 48.1% 26.0% 25.9% 7.9% 10.1% 12.6% 9.6% 1.4% 8.0% 77.3% 45.7% 20.6% 50.1% 29.8% 20.1% 7.5% 6.2% 12.2% 5.3% 1.1% 6.1% 81.8% 43.1% 29.4% 10.1% 2.8% 4.8%22 41.6% 32.6% 25.8% 7.2% 8.1% 13.8% 8.6% 1.0% 5.8% 79.9% 44.6% 23.3% 41.2% 39.2% 19.6% 6.1% 5.2% 12.5% 5.3% 0.6% 4.4% 84.8% 42.0% 33.4% 11.2% 3.1% 3.4%23 48.5% 25.7% 25.8% 9.0% 24.1% 15.0% 20.5% 1.5% 26.4% 80.4% 41.2% 28.1% 50.4% 30.8% 18.8% 9.4% 19.7% 15.9% 14.3% 1.2% 25.0% 85.0% 36.7% 39.1% 15.9% 9.2% 24.0%24 69.3% 11.1% 19.6% 55.9% 21.5% 69.1% 14.3% 15.1% 46.7% 85.7% 46.1% 24.1% 75.7% 11.3% 13.0% 62.8% 15.7% 74.8% 9.2% 11.8% 45.4% 90.3% 44.2% 32.7% 78.9% 5.4% 43.7%25 32.4% 40.1% 27.5% 6.4% 55.4% 15.7% 49.5% 0.8% 57.5% 79.5% 28.9% 41.5% 29.0% 51.6% 19.3% 7.0% 49.1% 20.4% 38.6% 0.6% 53.7% 84.8% 22.8% 56.5% 22.9% 31.9% 52.4%26 35.8% 36.8% 27.4% 9.4% 55.5% 21.4% 42.6% 1.1% 65.6% 81.0% 27.5% 43.5% 35.3% 45.9% 18.8% 9.8% 51.4% 24.0% 32.8% 0.7% 64.2% 86.9% 22.5% 57.4% 25.5% 22.7% 63.6%27 35.8% 38.2% 26.0% 7.0% 59.2% 16.0% 45.4% 0.8% 70.8% 81.4% 27.4% 45.6% 34.0% 47.6% 18.4% 6.3% 56.7% 16.1% 35.5% 0.5% 70.9% 86.3% 21.3% 59.5% 15.6% 29.2% 74.3%
SR27.4296
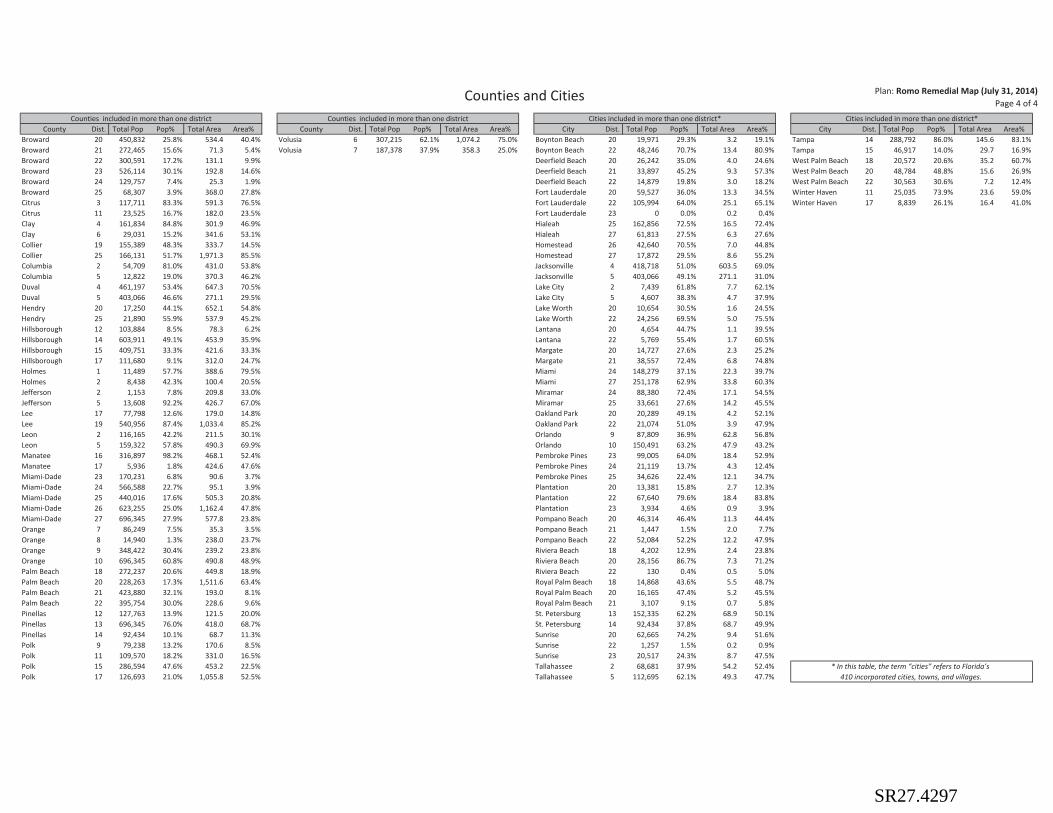
Counties and Cities Plan: Romo Remedial Map (July 31, 2014)Page 4 of 4
Counties included in more than one district Counties included in more than one district Cities included in more than one district* Cities included in more than one district*County Dist. Total Pop Pop% Total Area Area% County Dist. Total Pop Pop% Total Area Area% City Dist. Total Pop Pop% Total Area Area% City Dist. Total Pop Pop% Total Area Area%
Broward 20 450,832 25.8% 534.4 40.4% Volusia 6 307,215 62.1% 1,074.2 75.0% Boynton Beach 20 19,971 29.3% 3.2 19.1% Tampa 14 288,792 86.0% 145.6 83.1%Broward 21 272,465 15.6% 71.3 5.4% Volusia 7 187,378 37.9% 358.3 25.0% Boynton Beach 22 48,246 70.7% 13.4 80.9% Tampa 15 46,917 14.0% 29.7 16.9%Broward 22 300,591 17.2% 131.1 9.9% Deerfield Beach 20 26,242 35.0% 4.0 24.6% West Palm Beach 18 20,572 20.6% 35.2 60.7%Broward 23 526,114 30.1% 192.8 14.6% Deerfield Beach 21 33,897 45.2% 9.3 57.3% West Palm Beach 20 48,784 48.8% 15.6 26.9%Broward 24 129,757 7.4% 25.3 1.9% Deerfield Beach 22 14,879 19.8% 3.0 18.2% West Palm Beach 22 30,563 30.6% 7.2 12.4%Broward 25 68,307 3.9% 368.0 27.8% Fort Lauderdale 20 59,527 36.0% 13.3 34.5% Winter Haven 11 25,035 73.9% 23.6 59.0%Citrus 3 117,711 83.3% 591.3 76.5% Fort Lauderdale 22 105,994 64.0% 25.1 65.1% Winter Haven 17 8,839 26.1% 16.4 41.0%Citrus 11 23,525 16.7% 182.0 23.5% Fort Lauderdale 23 0 0.0% 0.2 0.4%Clay 4 161,834 84.8% 301.9 46.9% Hialeah 25 162,856 72.5% 16.5 72.4%Clay 6 29,031 15.2% 341.6 53.1% Hialeah 27 61,813 27.5% 6.3 27.6%Collier 19 155,389 48.3% 333.7 14.5% Homestead 26 42,640 70.5% 7.0 44.8%Collier 25 166,131 51.7% 1,971.3 85.5% Homestead 27 17,872 29.5% 8.6 55.2%Columbia 2 54,709 81.0% 431.0 53.8% Jacksonville 4 418,718 51.0% 603.5 69.0%Columbia 5 12,822 19.0% 370.3 46.2% Jacksonville 5 403,066 49.1% 271.1 31.0%Duval 4 461,197 53.4% 647.3 70.5% Lake City 2 7,439 61.8% 7.7 62.1%Duval 5 403,066 46.6% 271.1 29.5% Lake City 5 4,607 38.3% 4.7 37.9%Hendry 20 17,250 44.1% 652.1 54.8% Lake Worth 20 10,654 30.5% 1.6 24.5%Hendry 25 21,890 55.9% 537.9 45.2% Lake Worth 22 24,256 69.5% 5.0 75.5%Hillsborough 12 103,884 8.5% 78.3 6.2% Lantana 20 4,654 44.7% 1.1 39.5%Hillsborough 14 603,911 49.1% 453.9 35.9% Lantana 22 5,769 55.4% 1.7 60.5%Hillsborough 15 409,751 33.3% 421.6 33.3% Margate 20 14,727 27.6% 2.3 25.2%Hillsborough 17 111,680 9.1% 312.0 24.7% Margate 21 38,557 72.4% 6.8 74.8%Holmes 1 11,489 57.7% 388.6 79.5% Miami 24 148,279 37.1% 22.3 39.7%Holmes 2 8,438 42.3% 100.4 20.5% Miami 27 251,178 62.9% 33.8 60.3%Jefferson 2 1,153 7.8% 209.8 33.0% Miramar 24 88,380 72.4% 17.1 54.5%Jefferson 5 13,608 92.2% 426.7 67.0% Miramar 25 33,661 27.6% 14.2 45.5%Lee 17 77,798 12.6% 179.0 14.8% Oakland Park 20 20,289 49.1% 4.2 52.1%Lee 19 540,956 87.4% 1,033.4 85.2% Oakland Park 22 21,074 51.0% 3.9 47.9%Leon 2 116,165 42.2% 211.5 30.1% Orlando 9 87,809 36.9% 62.8 56.8%Leon 5 159,322 57.8% 490.3 69.9% Orlando 10 150,491 63.2% 47.9 43.2%Manatee 16 316,897 98.2% 468.1 52.4% Pembroke Pines 23 99,005 64.0% 18.4 52.9%Manatee 17 5,936 1.8% 424.6 47.6% Pembroke Pines 24 21,119 13.7% 4.3 12.4%Miami-Dade 23 170,231 6.8% 90.6 3.7% Pembroke Pines 25 34,626 22.4% 12.1 34.7%Miami-Dade 24 566,588 22.7% 95.1 3.9% Plantation 20 13,381 15.8% 2.7 12.3%Miami-Dade 25 440,016 17.6% 505.3 20.8% Plantation 22 67,640 79.6% 18.4 83.8%Miami-Dade 26 623,255 25.0% 1,162.4 47.8% Plantation 23 3,934 4.6% 0.9 3.9%Miami-Dade 27 696,345 27.9% 577.8 23.8% Pompano Beach 20 46,314 46.4% 11.3 44.4%Orange 7 86,249 7.5% 35.3 3.5% Pompano Beach 21 1,447 1.5% 2.0 7.7%Orange 8 14,940 1.3% 238.0 23.7% Pompano Beach 22 52,084 52.2% 12.2 47.9%Orange 9 348,422 30.4% 239.2 23.8% Riviera Beach 18 4,202 12.9% 2.4 23.8%Orange 10 696,345 60.8% 490.8 48.9% Riviera Beach 20 28,156 86.7% 7.3 71.2%Palm Beach 18 272,237 20.6% 449.8 18.9% Riviera Beach 22 130 0.4% 0.5 5.0%Palm Beach 20 228,263 17.3% 1,511.6 63.4% Royal Palm Beach 18 14,868 43.6% 5.5 48.7%Palm Beach 21 423,880 32.1% 193.0 8.1% Royal Palm Beach 20 16,165 47.4% 5.2 45.5%Palm Beach 22 395,754 30.0% 228.6 9.6% Royal Palm Beach 21 3,107 9.1% 0.7 5.8%Pinellas 12 127,763 13.9% 121.5 20.0% St. Petersburg 13 152,335 62.2% 68.9 50.1%Pinellas 13 696,345 76.0% 418.0 68.7% St. Petersburg 14 92,434 37.8% 68.7 49.9%Pinellas 14 92,434 10.1% 68.7 11.3% Sunrise 20 62,665 74.2% 9.4 51.6%Polk 9 79,238 13.2% 170.6 8.5% Sunrise 22 1,257 1.5% 0.2 0.9%Polk 11 109,570 18.2% 331.0 16.5% Sunrise 23 20,517 24.3% 8.7 47.5%Polk 15 286,594 47.6% 453.2 22.5% Tallahassee 2 68,681 37.9% 54.2 52.4% * In this table, the term “cities” refers to Florida’s Polk 17 126,693 21.0% 1,055.8 52.5% Tallahassee 5 112,695 62.1% 49.3 47.7% 410 incorporated cities, towns, and villages.
SR27.4297