in three technical areas: skills. the projeet also
TRANSCRIPT

ED 059/61.8
AUTHoRTITLE
INSTITUTION
SPONS AGENCYBUREAU NO%PUB DATENOT,E
EDRS PRICEDESCRIPTORS
ABSTRACT
DOCUMENT RESUME
24 EM 009 638
Mitzel, Harold E.Experimentation with Computer-Assisted Instruction inVocationalr-Technical Education, 1965-1970. FinalReport.Pennsylvania State Univ., University Park.Computer-Assisted Instruction Lab.of f ice of Education (DHEW) , Washington, D.C.BR-5.-0035Feb 71228p.
.MF-$0.,65 HC-$ 9.87*Computer Assisted Instruction; Computer Programs;*Curriculum Development; *Educational Researth;Engineering Education; Feedback; *Flowcharts;Instructional Materials; Intermode Differences;Mathematics Instruction; Occivational Guidance;Prompting; Reaction Time; Retention; SpellingInstruction; Student Attitudes; Testing; Transfer ofTraining; *VOcational Education; Vocational EducationTeachers
A ,computer-assisted instruction (CAI) project focusedprimarily on curriculum development in three technical areas:science, mathematics, and communication skills. The projeet alsosougiht 1) to develop specific course material and methods ofpresentation; 2) to provide explanations of various techniques andstrategies for dealing with course development, with emphasis on theeducation of vdcational education teachers; 3) to evaluate .arviarticulate the combinatiOn of CAI with bothep.educational strategies,and 4) by means of careful experimentation, to detertine optimamformats for vocational-technical material taught With computerassistance. The four-year project used first an IBM 1410 computer andthen an.,IBM 1500; prOgrams were in the COURSEWRITER language. In this'report the curriculum Material in mathematics, spelling, engineeringscience, testing, and occupational guidance are presented in somedetan, along with the systems programs for display and coding,research studies into 'educational stratlegies and equipmentevaluation, and ,the flowdharts developed by the project. Thedissemination activities of the' project are Summarized. (JY)
t.

-CC)
t--4.0
.1.
ON .4
t.C1 ZO 0 '' ,:. '1', ,';'
SCOPE OF INTEREST NOTICE
The ERIC Facility hes ssigned
this locument for processing
to;
In our lodgement,this docutrieni
ii also of Interestw the aloes ing-
houses noted to the right. Index-
ing shouldreflect their special
Points of view.
()OS's--
ASSISTED INS1RUCTION LABORATbir
COLLEGE OF-EDUCATION CHAMBERS BUILDING.
ME PENNSYLVANIASTATE UNIVERSITY UNIVERSITY PARK, PA. .
EXPERIMENTATION WITH
COMPUTERASSISTED INSTRUCTION IN
VOCATIONAL-TECHNICAL EDUCATION
FINAL REP9RT
Februa6,19711
Report No R-37
(° f!'
4

IIIA11An=s'
U.S. DEPARTMENT OF HEALTH.EDUCATION & WELIIAREOFFICE OF EDUCATION
THIS DOCUMENT HAS SEEN REPRO.DUCED EXACTLY AS RECEIVED FROMTHE PERSON OR ORGANIZATION ORIG-INATING IT POINTS OF VIEW OR OPIN-IONS STATED DO NOT NECESSARILYREPRESENT OFFICIAL OFFICE OF EDUCATION 'num OR POLICY
The Pennsylvania State University
Computer Assisted Instruction LaboratoryUniversity Park, Pennsylvania
.1
Final ,Report
EXPERIMENTATION' WITH COMPUTER-ASSIStED INSTRUCTION
IN VOCATIONAL-TECHNICAL EDUCATION
1965-19i0
U. S. 0. E. Project No. 5-85474.
Harold E. Mitzel
4" Principal Investigator
Februarycl 971
Report No. R-37
S..
,I

Ii
KNOWLEDGMENTS
This projeCt drew strength and wisdom from many people and organizations.
The grant awarded by the United States Office kf Education from resources
provided under the phvis.ions of Section 4(c), Vocational Education Act of 1963,
enabled the staff to c'arry out researchand development activities over a four
year period.' Cooperating organizations were: the Altoona Campus of The
Pennsylvania State University; the Williamsport Area Coninunity College; T. J.
Watson Research Center, Yorktown Heights; The Pennsylvania State University
Computation Center, and particularly Professor Donald T. Laird, who directs
the Center.
4, In addition to many colleagues who offered advice and suggestions, special
recognition is due Professor George L. Brandon who served as co-project direc-
tor from the inception of the study until he accepted an assignment with the
American Vocational Association in 1968. Mrs. Betta Kriner served as admin-,
istratim assistant and her services were invaluable. Professor Keith A. Hall
served since 1968 as director of *the Computer Assisted Instruction Laboratory
which functioned.as the administrative arm for the 'grant. Other individuals
whose skill and dedication contributed to the program of studier, include4
Marilyn C. Adams, Terry A. Bahn, Phyllis W. Berman, David C. Bjorkquist,
Karl G. Borman, Bobby R. Brom 'Frederick N. Chase, Carol A. Dwyer, Helen L. K..
Farr, Patricia,S. Fredericks, Joseph L. French, Clara Gargula; David A. Gilman,
Keith A. Hap, Nancy Harvilchuck, Harriett Flogan, and Rosemary Hollick. Also,
Robert V. Igo, Joseph T. .Impellitteri, Donald W. Johnson, James J. Kelly,
pobert King, Scott Kostenbacder,, Pearl Laird, David P. Palmer, Francis J.
'Paolone, Paul V. Peloquin,,William Rabinowitz, Joseph -K. Ritchey, Paul Rowe,
Harold R. Sands, Robert Seibel, John Tardibuono, Mary Ann Vil'iwock, and
Kc4ineth H. Wodtke.
Mrs. Susan Lutz.carried out the responsibility for summarizing the high-
lights of four years of research effort and for preparing and editing this
manuscript.

TABLE,OF CONTENTS
Page No.
ACKNOWLEDGMENTS
TABLE OF CONTENTS
LIST OF TABLES viii
LIST OF FIGURES ix
CHAPTER
I. INTRODUCTION
Focus of ProjectFunding of the ProjectThemes in Computer Assisted InstructionObjectiVes of the Project
1
1
3
3I
6
II. CAI AT PENN STATE 7
What is. CAI 7
Coursewriter I and II 8
Programing Language S di , 9
Flowcharting 10
III. THE DEVELOPMENT OF HARDWARE AND FACILITIES 13
Physical Facilities, 13
Equipment.Evaluation 13
IV.
,
CURRICULUM MATERIALS 17
Mathematics .. . . . , . . . . . ... .. . . .. . . : . . 17
l'echnical Mpthematics - (IBM 1410 Computer System) . . . IF
Number Systems -; (IBM 1410 Computer System) 18
Slide Rule - (IBM 1500 Computer System) 19
,Spelltng 19
Communicatidn Skills - Speliing - (IBM 1410
1bmputer System ., . . . ... . . , .......... 20
Spelling.- (IBM 1500 Computer System) 21
Spolp - (IBM 1500 Computer System) 25
..Ingineertng Science. . : . . . , 25.
Engineering Science - (IBM 1410 Computer System) . . . . . 25
Measurement and Evaluation . .. . . .. . . , ... .. .
elan for the 'Development of a Pilot Computer-Assisted
. . . 28
Occupational Guidance Program ." . 1, 29
DesCription of Original Version of CAOG 29
Relylts of the Field Trials 31
Deftription of planned Program 32
,

3.
!
TABLE OF CONTENTS (cont'd)
CHAPTER
V. SYSTEMS PROGRAMS
Geometric Dictiona. rY
Page No.
37
37
General Description 37
Procedure 38
Skething 38
Coding ... 39
P :Entering . . 39
A Processor for Multiple Numeric Entries -, (IBM 1410
Computer'System ,
42
VI. RESEARCH STUDiES ... 45
Relationship Among Attitude, Achievement, andAptitude Measures and Performance 45
Purpose 45
Methods and Procedures 45
Summary 46
Scrambling vs Ordeled Course Sequencing 47
Purpose 47
Methods and Procedures 47
Results (.... 49
Rote Rule-learning pn Transfer of Training 50
Major Objectives 50
Conclusions , 52
Educational Variables . . . 54
Purpose ,54
,Method ... .
Conclusions
54
55
Typewriter Interface ... 56
Nature and Purpose of the Study 56
Tentative Conclusions 60
Gradient- and Full-Response Feedback in Computer-Assisted Instruction. . 61
Purpose , . .
,
61
Method , 61
Subjects 62
Findings 63
Conclusions. . . . . .... ... 64
A Comparison of the Effectiveness of Five Feedback Modesin A Computer-Assisted.Adjunct Auto-Ibstruction Program . , 65
Rationale 65
Subjects 65
Materials 65
Procedure-. 65
Independent Variables . . . 66
iv

LI
CHAPTER
TABLE OF CONTENTS (contA)
0Page No.
Effect of CAI on Natural Spelling Behaviors 71
Rationale- . 71
Method. 71
Results 72
Conclusions .72
Comparability.of Computer-Assisted and Conventional
Test Administration , . 74
Purpose ,74
Method . .! .
Subjects 74
Analysis . d
q.74
Results 75. .
Numerical and Verbal Aptitude Tests Administered at
the Student Station 78
Purpose ... .
.
78
The Sample 78
Pirocedure 79
Results .. 80
Remedial and Review Branching in 'Computer-
Assisted Instruction 81
Purpose 81
Method 82
Discussion 83
Conclusion , 83
Relative EffectiVeness of Various %des of Stimulus ..
Presentation Through Computer-Assisted Instruction 84
Purpose . 84.
Subjects . . 84
Procedure84
Findings .. OOOOO .. 85
Subjects . . . . 485
. Implications86
An/Experimental Procedure for Course Revision
Based on Students' Past Performance . . . . 1. . . O . , . 87
Purpose,,87
Method87
Subjectt88
Procedures............... , . ., .. 88
Results. . . . ./
/ 88
Expressed Student Attitudes Under Several Condi*ns
of Automated Programed Instruction 89
Purpose89
A -Method .,..... .. 90
Design.4 .
90
. Test .. 91
Results .. 1 91

CHAPTER
TABLE OF CONTENTS (cont'd)
Page No.
Effects of Reducing Verbal'Content in Computer-AssistedInstruction Programs 92
Purpose 92
Method.
92
Conclusions 93
Prldr Knowledge and Individualized Instructior 94
Purpose 94
. Results 95
Discussion and Conclusions 96
Response Latency: Its' Relationship with Errors andResponse Stability in Two Tasks invotving ResponseCompetition 97
Purpose 97
Method 97
Results.
98
Prompting and Confirmation as Modes of Feedackwith Computer-Assisted Instruction 100
Purpose 100
Method 101
Findings 101
Discussion .. 103
Reading Rate and Retention Under Two Modes of Presentation 104
Purpose . 104
Method 104
Procedure . 104
Results 105
.111.. FLOWCHARTS 107
Course Flowcharts 107
Strategies Informing Student About Content 107
Strategies Based on Performance 107
,, Student-Selected Sequences 124
Section Flowcharts 134
Giving Cumulative Feedback 142
Flexible Course Flow . . .. . , 142
,QUestion-Level Flowcharts. .... 150t
Individualii ation of Presentation' 150
Requests Made by Student .158
Flexible Feedback 159172178178186192
Editing.Student's ResponseResponses'Checked for Key PartsMultiple-Part ResPonsesResponses Requiring OrderingNumerical Responses
vi

TABLE OF CONTENTS (cont'd)
CHAPTER
page No.
VIII. DISSEMINATION 205
CAI Bibliography 2f1
REFERENCES .21 7
4
Li
II
vi i
8
(

Table
2,
3
4
5
6
8
'9
LIST OF:TABLES
fage go.
Experimental Sequences 51
Comparison of Mean Posttest, Retention Test, and
Instructional Time for On-line and Off-line InstruCtibn
in Technical Physics (High School,Student Sampldr: . . . . . 57
Typing Ability and Instructional Time (in minutes) at'
the Typewriter Interface 60O.
Medley Equivalence AnalysisAnalysis of Variance: RAT Form 1 . 76
Means and Stantiard Deviations of Posttest(Maximum Possible Score.15 Points)
Organized Diiseminition Activities by CAI.May 1, 1967 through June 30, 1968
Scores
Laboratory Personnel206
86
Visitors to CAI LaboratoryMay 1, 1967 through April 30, 1968 208
Summary 1410 Student Terminal Usage .
May 1, 1967 through April 30, 1968 209
1500 System UsageFebruary 1, 1968 through Aprit 30, 1968. . '
fr.
210
2'
5
1.

LIST 'OF FIGURES
figure,
1 Example of a flowchart of the type used in the CAI project. .
page No.
11
2 Schematic showirig geographic arrangement ofCAI student terminals . 14
3 Short form documentation . . 40
Flowchart Objectives of course presented to student 1 09
5 Flowchart - Objectives stated prior to module instructionwith option to repeat modules 111
6 Flowchart - Sequence based 'on diagnostic tests 1 15
7 Flowchart - Course presentation in three tracks 1 17.
8 Flowchart - Flexible strategy for slow, average, and-
advanced students 119
9 Flowchart - Shorter sequence lor better student 1 21
10 Flowchart_ -,Sequence and review based on errors made 1 23
-11 Flowchart - Hierarchical instruction beginning at highest
competency of student 1 27
12 Flowchart - Student choice of additional practice of test . . 1 29
.13 Flowchart - Student given option to skip sections offcourse . . 1 31
14 Flowchart - Type of sequence through course chosen by. student . 1 33
15 Flowchart - Student-control oficourse content . . 1 37
16 Flowchart - Student choice to receive explanation of quizquestions and/or review 1 39
17 FlowShart - Student-adapted multilevel instruction 141
18 Flowchart - Indicating response latency to student 145
19 Flowchart - Testing student and giving feedback tostudent and proctor 147
20 Flowchart - Gi'ving information tot proctor when studentcompletes an instructional sessiob. . 149,
ix
10

LIST- OF FIGURES (contsd)
Figure..
Flowchart - Student control of course flow
Flowchart - Sequence based on number of consecutiveproblems whiCh are correct
Flowchart - Allowing student to change responses. . . . .. . .
Flowchart - Student may request assistance from the proctor .
Page No.
21
22
23
24
153
153
157
161
25 Flowchart -4Student may request correct answer. . . ..... . 163
26 Flowchart - Student may indiCate need for.review 165
27 Flowchart Feedback adjusted to student 169
'28 FloWchart - Varying feedback for each responie attempt. 171
29 Fl owchart - Mul ti pl e 1 evel question . . 175
30 Fl owchart - Downshi fti ng response characters and repl aci ngwords with numbers., 177
31 'Flowchart L. Replacing words in student's: responsewi th synonym
t
181
32 Flowchart - Testing for specific words in student's response. . 183
33, :Fl owchart - Checki ng responses for speci fi c _character stri ngs . 185
34 Flowchart - Creating a response by selecting its parts. . . 189
35 FloWchart- Two-part response by student . 191
36 Flowshart - Arrangement by student of given items inproper order 195
37 Flowchart - Analyzing a response containtng ordered words . . . 197
38 Fl owctiak - Testi ng for a numerical response within aspecified range 201
39 FlowthaA Testing for a precise nuMerical response 203
"

CHAPTER.I
1
INTRODUCTION
Focus of Project
The compu-ter-assisted-instruction.project focused primarily on curriculum
development in three, technical dreas: ,science, mathematics, and communication
skills. Course development was deemed to be such a crucial area of inveiti-
gation because the capabilities of computerassisted instruction have fre-
quently bee1.1 limited simply because of the 1\ck of available "software." The
project sought to.develop specific course material and methods of,presentation
as well as providing explanations of various ,tchniques and strategies for
dealing-with course development.\
\There was an emphasis on the education of ocational education teachers.
The project sought to explore the promising streth of CAI in the raPid pre-
paration of vocational-technical teachers. Venn points .to ihe cruciality of
university leadership in,this task.;
. . .the expdnsion,and improvement of vocational and
technical education are heavily dependent on some resolu-
tion of the teacher-training question.. This cannot and
will not happen through the efforts of people already in
the'field; higher education in particular' must assumeleadership in the preparation of vOcational .and. technical
teachers. .(Venn, 1964, p. 36.)'
Secondly, the project attempted-the evaluation and articulation of com-
puter-assisted instruction with other educational' sirategies, and, by means of\
carefu l. experimentation, determined optimum formats for vocationahnical,
material tautt with computer :assistarice. This.application on an interdisci- ,
Li plinary basis is advocated by. Brandon and Evans:
4fif
Briefly, the broad nature of research results andresearch 'techniques. at the present time in the various
I disciplines and fields of aOplIcation show interesting
and profttable avenues for our exploration and study:
, 1. New methods of teaching and learnini through
many new media, numerous". 'synthetics,' programed learning,9
computer-based instruction, etc. Many aspects of so-called
'related instruction' in voCational education'are uniquely
adaptable to these media; (Brandon and Evans, 1965.)
12

ii2
The Preiident's Panel on Vocational Education (1962). 'advocated that eight
out of ten of the twenty-six million young people who started, or who will
start, work during the past decade (1966-1970) would have gained oceupational
competence through vocational-technical education. To this massive challenge.
_must be added the extensive retraining needs of hundreds of thousands of adult
workers who are presently underemidoyed or who have been automated or mecha-
nized out of productive-employment.;I
Third, the curriculum development effort was aCcompanied by coordinated
research and evaluation. Careful experimentation with CAI.materials in natu-
ralistic settings were required in order that the worth of the inhovations
represented by the new approacitio'vqcational education might be aicertained
prior to widespread investment'in equipment and curriculum change. For this
reason, a clOsely articulated ipearch effort was designed and included in
the overall research program plan for the Computer Aisftted Instruction Labora-
f
,
tory.-
,
Fourth, the training and'diisemination programs within:the Lab's activ-
ititswere design466-supplement and balance the research,and development .
activities. The severe.national shortage Of curriculUm and research special-
ists in vocational-technical education has been tradiponal; it -fs now crit-.
The fellowships,, gradUate assistantships and summer WorkshOps incl.uded
th the Laboratory's: program Were designed.to help alleviate this shortage.
With pespect,to disseminition; tt is clear that innovations in education do
not justhappen. New methodologies,'new curricula,:and new educational strate-
gies must beinvehted avid communicated through-as many avenues is possible ih
'order to overcome the greatinirtia tn educational processes. Thus,-the CAI'
Lab's, staff believed it as important to dissemi ate cogent information.con- ,
cerning its activities and progress as it was lo perform continuing research
ind development.
The research and development program-was planned as a four-year effort
with" a careful build-up of equipment and personnel during the initiaryear of
,operation. The.work of the 0-roject was carried on by an organization of two.
yrofessional teams, .one focused on the preparation'of teachinimaterials in
'vocational-technical .subjects, and a second seeking answers .to .questions ,about
computer-assisted instruction hy means of basic and appliesd research:. About

twenty computer4resented instructional units were prepared and tested by the,
staff. These materials could be integrated into prototypes of vocational-
technical education proirams. In addition, the Lab carried on a variety of
training and dissemination activities designed to communicate the innovation
of Computer-assisted instiiuction to the public and the professions.
Funding of the-project
The .project was conducted at Penn State University between July 1, 1965
and :DeceMber 31, 1969. Funds were provided by the United States Office of Educa-
-tion on the following schedule:
1964-65 (1.mo. only) - $ 7,236
165-66 . ..i62,521
1966-67 - 3104101
1967-68 206,000
1968-69 - 273 130.
' Total -.$94,888 °
Themes in Computer Assisted *Instruction
- Research and development involving the use of a computer to assist in the
instructional .precess may be thought of as being related to teathing machine
technology, but CAI,.because Of .its' flexibility; decision iogic,characteris-
tics, and2sophistication o input-output mode, must be considered as a quantum
advance over. traditional propramed instruction. Projects using a computer i'or
Instruction are similar to eadyother, but differ in their emphasis. 'The
flexibility of .the digital computer allowi for a variety of themes different
frOmand..richer than the themes of.programed instruction as represented -in the
programed text or simple teaching machine. One, such..theme is the, ektent to*
which input and output displaxt facilitate .codinunication.between the student ...
and the .,computer, e.g., -6athode raY tube display, variouS large capacity
random access visual. and audio devices, special respohie keyboards, light pens;4
etc. Multi-media interfaces between learner and?Computer seems to..be necessary
with relditant learners and the handicapped a/0 they seem to be required-for
teaching \coiplex Material Such.as the teac ng of _reading. Good display and
response cievices are particularly attractive to the researcher concerned with
Li

1
1 I
4
instruction, .but at the tame time handmade interface equipment does not
stimulate research in other laboratories because tfre special equipment is .
generally of experimental or prototype construction arid extremely expensive;
Two efforts that, emphasize thi.s theme in computer aided instruction are those
of Bitzer and Easlejf (1964) , and Suppes and Ginsberg (1962).
A second theme is to adapt:course organization to individual student's
needs; here the concept is to monitor.and analyze student-performance, and, on
the basis of this performance .plus other historical 'information about the
individual student, continually adjust ,the 'course organization to optimize- itl .
for every particular student's progress. Such tailoring of materials. tO an indi-
vi.dual student is highly cisirable, but in the occupational area adequate
tailoring to the, student Ository is. difficult., Tailoria9 to long-terM per.-formance,of a student is.possible, but.of relative high cost because.Consid-
erable-compUter capability would be needed for each student. TO some extent,
P-this is:the a0proach .of Stolurow.and David (1963.), and SmallWood (1962).
A third,themeis that of tutorial interactio ; the conCept is that the
high speedlogic of the Ccimputing maChine reacts to the detailed features of
studentxperformance on Srp:eCific taskt,"observes the efforts of the student in,
,dealing with these tasks, and presents appropriate remedial or accelerated
action where tie qudenti is not succeeding or is insufficiently challenged.
The tutorial interaction is supplementary to the strategic job of adjusting.
the arrangement and, difficultrof the tasks and their 'manner of .presentation
to the individual student. This approach is exemplified by the effort at
IBM' s T. J ..Watson Research. Center by. Utal 1 (1961) . .
A fourth theme .is the process of simulation and gaming between the stu-
dent and the machine; here the role ai the machine is 'that of si-mulator of .a
process or as an opponent with which the student interacts, just as he inter-_
acts m ith process or persons in laboratories or real si. emtuations. This theis p
Iminent in the work of Feuerzeig (1964, at Bolt, Beranek; and Newman,
Inc., and Wing (1966), at the Board-o# Cooperative Educational Services, .
Westchester County, N.- Y. Public Schools (Swets, 1962).
..The present project in computer-assisted instruction emphasized 'tutorial
interaction, :and made, limited use .of .-the other themes described. We '.believe .
that AO of the emphasei described' above represents a valid conception of an.
s
15

approach to the use of computers as educational aids, butthat the approach we
have seleeted is an appropriate one for education, to the extent that the
reSearch and development commitment is pointed toward partial vlutions of im-
mediate problems as well, as to thoSe of a long-term nature. Curtent and pro-
jected needs, force administrators to consider instructional cost, Iboth for the
development of courses, and the administration of these courses by the computer
"productio0' teaching. This research.established a flexible interface .
between, the learner and the computer, but at the same time it utilized a system
that is juitifiably economical in the 16ng run to allow for wide-scale adapta-
tion to A variety 'of educational operations.,
We prepared the instructional materials in the present project in the same
manner thai we used for developing four College courses ulider a previous con-
tract With' the U. S. Office of Education. Unlike most developmental projects
in CAI., we,have not devoted resources to the invention of terminal hardware
or to.the writing.ofcomputer programs in machine language. We avoided these
tasks by using a commercially available typewriter terminal as the interface
between' the compaer and the student, and using the. Coursewriter program devel-
oped it the IBM T. J. Watson Research Center for controlling this Interchange.
Virtually all of our resources were devoted to the preparation of the educa-
tional materiali presented by the cOmputer *since it appears that a major
limiting faCtor in ttyltimate wide-scale use of computers as an educational
aid will be the time necessary to prepare the educational materials.
The_ courte development under this contract was an eclectic one in which
current theory, practice of teaching, and programed instruction were adapted
and assimilated to the prePirittion of these cOurses rather than trying to pre-
pare,materials based more directly on current learning theory develoPed in the
learning laboratory.' This approach appears to have resulted' in efiscient pre-
paration of fltaterials.that teach well, and materials suitable for theoretical
learning studies. This eclectic approach, coupled with a concentration of
resources in course development, made it possible to prepare an extensive set
of pOst-secondarly course materials designed specifically for computeis presenta-
:tion. **ever., we Must admit that improved hardware has made a good portion
of our course materials obsolete.a
16

Ob ectives of the Project
The Computer Assisted Instruction Lab at Penn. State sought to achieve a
wide varietmif curriculum development, research, training, and dissemination
objectives. Accordingly, the specific objectives were organized -under the four.
headings..Curriculum Development 04ject1ve. The curriculum develOpment objective
was to prepare curriculum matilcial for computer presentation of selected tech-
nical-vocational subjeCts suitable for youth and adults in the first two years
of post-high school education.Research Objectives,. The research 'objectives were 1) to evaluate the
results achieved Itn student programs employing CAI and the articulation of CAI .
with other components of instructibnal systems; 2) to evaluate by means of
.experimentatiOnLfundamental research questions within CAI, topics ,dealing with
the effectiveness of different forms of knowledge of resultsfor example,
optimal post-feedback intervals, social and motivational components in know-
ledge of results, and relationship of t'yping skill to learning and retention;
and 3) to study the feasibi 1 ity. of adapting a 'wide variety of vocational educa-
tion teaching material to CAI modes of presentation and to make recommendations
to appropriate federal: and state'educational age cies for future feasibility,
field testing, demonstration, and pilot .perimentaThn
Training Objectives. The training objectives were 1) tb train an inter-
disciOinary group of research. fellows as vocational educational currictilums
research specialists to the level of the doctoral degree; 'and 2) to.train
through summer workshops a group of'vocational :educational educational Subject
matter specialisa in course writing for computer-assisted instruction..
Dissemination Objectives. The disseminaiion objectives were to dissemi-
nate the results' of CAI research develoPment to schoOl .systems, colleges, and
governmental agencies, making available. CAI'Materials 'and know-how in \the form
of reports, journal articl es , . "hands-on " demonstrations, conferences 41ks
computer programs vi deo tapes , 'films , and televi s i on programs .
It was possible for the. investigator's 46 'achieve a,coordinated and inte-
grated approach to the wide variety of activities and study that needed to be
pursued is shown in the objectives above.

c.
CHAPTER'II
CAI AT FENti STATE ,
7
What.is CAI
Throu§h the use of a computer it which a course is programed and stored,
the student can receive instruction'which is.individually paced-and-presented..."
This initruction may be tutorfal in natures, be a problem simulation, consist
of drill-and practice, present infOnnatiOn, or be.a combination ofall four
types. The course materials for tutorial computer-assisted instruction are,
stored in the computer, and the informatidn is presented to students at special
computer cotnected instruction stations....
Two computer sys4Ms wire used during the project. An IBM 1410 syttem
was used from 1965-1.967 and the IBA 1500 system was used from 1967-1969. For
a period of several months, there was-an overlap of the systems. *For a more
complete description, tee Chapter III..
An important aspect of computer-assistedinstruction is the speed at which
the computer:presents infokation t
;
tile students taking the course. In a . .
time-sharing 'situation, the individ al itudent feels.tbat the computer is pre-
senting Only his lesson even though other students are taking-the same coUrse
or other. courtes at-the tame time. ThisAime-sharing is possible because the
computer,reacts-immicroseconds while a student reacts in terms Of seconds or
eVen minutes0
jn using the,coMputer for instruction purposes,questions Can be pre-
.
'tented by,the computer; the student can respond by usirig the typewriter key-
board attached to a cathode-ray tube (CRT). In addition, on instructional
statiots.which'incorporate a CRT, it is poisible to have the student use a. .
.
light pen to respond to questions The student presses the light pen against
his inswer-choice; the light sensitive pen receives ihe light and the position
of his choice is recorded. Responses-from the keyboard or light Oen-can then .
be analyzed by the computer, and the'student. may be given feedback.corresponding., .
to the reslionse made. An'audio unit allows the student to record responses
which may be analyzed by the.instructor after .the student has sigted off the
course.
18

*.
8
Since the computer has the capability to:record and recall student
responses, the number of correct answers; the number of wrong answers, etc.,
the sequence.of instruction for a particular student can-be altered on the
basis'of his response history. More challenging.material or remedial instruc:.
tion can be presented on the basis of past performance, or sections of the
course may be tkipped if the student's*performance is at a specificlevel of
proficiency. And if the student stops interacting with the computer for a
period of tiMe while taking a course, whevhe signs on again, instruction will.
resume where he stoppeepreviouslY.
The computer can be used to record a variety of types of information for
all students, e.g., the exact contents of his response, the number of seConds
The takes to respond, and his exact position in a course. Summary information
such as number of correct responses to a question, total number of response
attempts, etc., may be produced-fot analysis by the instructor thereby reducing
the leacher's clerical duttes:and freeing hit to give indiyidual instruction.
Tile nature of the computer input is such that.it will.accept course con-
tent in two waYs: 1). course statements may be punched on cards, or.2) course
material may,be input directly into.the'coMputer from the instructional station
keyboard. Using the second methods.the contents of a course can be replaced,
corrected, or deleted easily and quickly by specialauthor commands.
Coursewriter I and II
At the beginnino of the project, the developed courtes were written in
the CAI author language known is Coursewriter I for use with the IBM 1410 com-
puter system.' A complete description of Coursewritet I is beyond the scope of
this report; however, because it is standard IBM language, it is readily avail-_
able.
The period betweenrJanuary 11 1968 and Jyne 30, 1968 wassa time of transi-
tion in hardware in tie CAI Lab. A change was made from the IBM 1410 to the
IBM 1500, and .in author language from Coursewriter. I (Yorktown Heights version)
to Coursewriter II. Staff effOrts during.that period went into the completion
of experimental studies begun on the typewriter terminal; the tranilation of
carefully selected coursimaterial from the,old author language inio a new,
considerably more flexible language, and the development on the.part of the ttaff
of new skills and new teaching strategies for the richer learning environment
provided by'the 1500 system (IBM Corporation,1968)

9
Programing, i.anguage
To assist in providing an answer to the question. as to.how instruction 7'
.strategies.are 'prepared for the coMputer, the following excerpt from the IBM
1500 Coursewriter II Author's Guide, Part I: Course Planning Is included here.
The Coursewriter lang6age is oomposed of individual instructions
that can be logtcally separated into five major' groups. .
Problem presentationPresentatton sequence controlResponse requestsResponse analysisScorekeeping
The problem presentation instructions .are use:Ltd mark the
beginning of a problem, to-type and display instructional material,
to play audio messages,and to project images from film reels.
The response request instructions enter and proceis student
responsei from the light pen andlrom-the typewriter and instruc-
tional display keyboards. They alsd,record audio messages, con-
trol the time allowed for iesponseeind cause performance records
to be written automaticalb, (if the author.has spetified them).
The response.analysis instructions determine whether a
response is.correct, incorrect, or unrecognizable. Special program-
ming is built into the system to handle matching bf responses
automatically.\
The scorekeeping instructions permit the author to channel into
performance records' the.counts of a student's correct answers, wrong
answers, time7outs, etc., and to.post other special indicative .
informatim They also permit the.authdr tO l'capture'actual
responset and work with them by executing special 'Toutines during
answer processing.
The pretentation sequence control instructim* allbw the author
to provide several paths of instruction based on conditionsthat
arise while students are .actually taking the course: They also allow
the author to link course'segments as needed to complete course flow
through an instructional session. (IBM Corporation, 1967, p. 25')
Course programing languages other than Courseriter Il4rovide instruc-.
tions to carry out Similar action. With systems cledici\teeto computer asSisted. .
instruction, changes and additions can be made in the plOgraming language.
Functions can be written toprovide special processing hot included it,part.of
the'programing language,.and these functions can be accessed within ige.course..
Thus;e great deal of flexibility ii provided.,
- 20

10
flowcharting
.flowcharting.is i means of ,presenting a tourse description so that it is
easy to visualize and fol.low. Simple geoMetric figures, are used, to show-the
flow'of the, course through Which a .studeht may pass.. A flowchart may be used
while' a coursd Is 'being developed to_experiment with the sequence of presenta-
tion or .may be used 'as a .meins of communication between the. curriculum special-
ist or course author and .a programer. Flowcharts.Can depict major logical
steps or any degree of detail desired and are Commonly, used as a means .Of
documenting a .program. An over'all course flowhcart woUld indicate general
steps without much detail; whereas a detailed Program flowchart is a map of
the program. A program flowchart should be labeled so that the associated
'instructions from the programing. ?anguage. arerefeisenced; thus, understandings
and modifications of the course are both facilitated.
Flowcharting Symbols used in this:project .were generally. consistent with
IBM flowcharting symbols. Since programing for computer-assisted instruction
is different from-programing for other purposes, the meanings of some symbols
were altered to fit our particular situations.. For -example, in flowcharting
CAI programs, a few Symbols Were adapted from those usually used only for flotti-
charting. Symbols. The .iymbols used for .flowcharting in this project all appear
on the Standard Registei. Business Forms 'floWchart template.
.Figure 1, pba-ge 11: is an example of' a flowchart. of' the type used in the '
project. This is such a critical area in programing that the itrategies.devel-
oped will, be briefly described: Briefly, it is the computer *operation, pro-
.gramed by the course author, Which moves, the student to remedial. or advanced,
work. It allows the, author, via the computer, to fit the course to' the:student.
Itv the diagram shown ih FtiUre f, 'the stUdent may choose three routes. He may
elect to take a quiz,, receive feedback 'on the,adequacy of his knowledge, ind
thin Move to,the beginning 'or end of the course. .He can also. receive instruc-
tion, 'movet6 a' review', and then take'the. quiz. His third choice would* be to
go .01rectly to .the review, then to the quizoinstruction, or to another review.
Addttional flowcharts for specific instructional strategies can be foUnd
on page 107 of thii report.
_ 21 .

ge.
I I
r
Fig. 1. Example of a flowchart of the type used in the CAI project.

:
-1
V .
, 13
CHAPTER _III.
THE DEVELOPMENT OF' HARDWARE AND FACILITIES
Physical.Facilities
To initiate the vocational-technical CAI project, a large room, 45 feet
by 45 feet, was remodeled and the space was designed to accommodate approxi-
mately ten_ professionai staff members, eight graduate assistants, five CAI
tethnicians, and four student terminals, 'each with audio-visual components and
. a printing desk cal cul ator. ) From i ts own resources the Uni versi ty made avai 1-
atl e new ,office furni ture and equipment andinitalled air conditioning and
el ecthi cal control s 4_n the space occupi ed4by the heat-generating terminal s .
Equipment Evaluation
In July, 1965,- two student terminalsOn the CAI Lab were connected by
means of dedicated long distance telephonelines to'the IBM 7010-1448 computer
.s.configuration at. the T. J. Watson Research Center,'IBM Corporation, Yorktown
. Heighti, New York. The Lab was.under contract for this service until June 30,
.1966. The tservi ce included not only.,64 hours of terminal time weekly,' but
cdMpiled course listings and.sunmarized student records taken from log magnetic-
tapes...Delivery of four new IBM 1050 communications terminals with improved
audio-visual components, expected in October, 1966, Was delayed., Installation
of this' equipment, replacing the two ."bench-built" units9s occurred in January,
1967. Orders were pl aced for the 'addi ti onal,. four termi nal t to be .i nstal 1 i n
Wi 1 1 iamsport and in Al toona by July, 1967..By June, 19669 the Project was almost completely moved into its new
remodeled quarters. The new 'facility was extremely Nell suited to the needs
'of the project and staff. Four new student terminals were installed in four
separate sound-proofed and air-Conditioned rooms. 'The Laboratory office
.space completely accommodated the staff of the project.
By July, 3966, convertion to Penn State's own 1410 computer system had
been completed°, and CAI courses prepared to, date operated .successfully on this
.system. The new sYstem controlled four-student terminals *in the Laboratory,:
two add tiOnal terminals locited at the Williamsport Area Community' College.,
23

.
14 /J.ty"-
and two terminals on Penn State's CommonWealth Campus in Altoona, The four
student termfhals in the field were installed and available for student instruc-
tion by mid-July, 1966. Students enrolled at these two schools were used for
research and evaluation of the CAI courses in technical educatiOn during the
summer,,1966. The schematic. in Figure 2 shows this geographic arrangement co
equipment.
STUDENT TERMINALSWILLIAMSPORT AREA
COMMUNITY ,COLLEGEWilliamsport4, Pa.
STUDENT TERMINALSOM LAB
University Park, Pa COMPUTERCOMPUTER CENTER
University Park, Pa.
STUDENT °TERMINALSALTOONA CENTER
Altoona, Pa.
t
Fig.- . SOhematfc showing geOgraphic-arrangeMent of CAI, student terminals.

15
The research and development progress in CAI-completed up to December 31,
1967, was accomplished on a hardware configuration organized arOund an IBM' 1410-
computer as a central processor used in time-sharing mode and located in Penn
State'l Computation Center. Connected to the central processor by telephone
lines, the CAI Lab maintained eight student stations consisting of IBM 1050 .
typewriters; each augmented by a random access tape recorder and a random access
slide Projector. This modified \business-application equipment provided service
as has been described for two and one-half4years, but was replaced late in
December, 1967 with an eight terminal IBM 1500.instructional sistem. The new
system,. designed for instructional purposes, \offered numerous advantages over
the former. Displa.is of materials are achieveealmost instantaneously on theCRT terminal instead of the .tedious. typewriter type-out. Student's answer
procetsing was vastly improved.' Last, but not least, the Cost per student
terminal hour was .about one-fOurth of the former 1410/1050 system. 6
During. the first half of 1968, the project staff ,was ,primarily engaged. in
the translation of expetimental course 'materials from Course4ri ter I,' the
authiir language of the IBM 1410 systeni, to Coursewriter II,' the author lan-
guage of the IBM 1500 system. In addition, the'Lab learned the intricacies 'of
the new hardware/software configuration and developed new dictionaries'and
"macros." Stddiet Wet* initiated, dUri fig the period which built upon what-they'
ready-learned about response modes, sequencing, and student attitudes:
Due to buOget cuts for the 1968-69- fiscal year, the Lab reluctantly had
to withdraw the tirrn,inals from Williamsport and Altoona:. Both institutions
had .provided ,us with unstinting coOperation in the selection of technical
education students who served as 'subjects., The faculties of both.schools had ,
provided many hours of valuable consultation on curriculum and display
problems.
LI
25

ft*.
CHAPTER' IV
CUFiRICULUM MATERIALS
17
Mathemati cs
,Technical Mathematics -(IBM .1410 Computer System)
The technical mathematics curricuiculum (Ritchey, 1960. embodiedtin this
CAI course inclUdes the following topics: graphing, exponents, roots, Vigo;
nOmetry, simul taneous quadrati c equations cal cul us , logari thms vector analy-
sis algebra, ratio, and. proportion.
By design the f eVments programed are common to both physics and
mathematics instru ion. The common segments thclude.the metric system,
working with units,"and.significant figures. A. summary of the course segments
and their 'Content follows':
..Basic' Mathematics. A review of basic mathematics; course is developed by
presentation of square-root, cube root, and estimating square root and cube
root. Estimated time: 9 hour.
Signiftcant Figures. .Instruction in the accuracy of calculations used in
scientific experimentation. The student 'is taught the reasons for limiting
the number if digits 'in the results of his calculations, Th.is vehion teaches
the course by.telling the student the reasons for using significant figures;
but does not present rules for Using significant figures. Estimated time: 90
minutes. -(Also programed are three additional experimental versions of signi-,
ficant figures.)
Graphs.,. Definition of basic terms used in graphing;' construction and
interpretatibn of graphs with a ,physical rather than an'algebraic slant.
Estimated time: 1 1/2 hours..
Logarithms. PrO,gram instructs student in logarithms and the use of loga-
rithms and 'the use of logarithm functions and working technical programs.
Estimated time: .11. 1/2 hours. .
'Trigonometry. _A study of the aprilications of the elementary functions of
trigonometry. The student learns to use tables, to interpolate,'and to per-
font mathematiCal operations 'with the trigonometric functions. Estimated .
time: 3 1/2 hours.

4
. Vector Analyiis. A segment that teaches factors and the law of cosines
and sines.
. Simultaneous Equations. A segment on how to solve simultaneous linear
equations by algebraic methods. The presentation of the material is developed
through substitution, "trial and error," and thence to algebraic substitutioN
The final method presented is algebraic solution usinultiplication and
addition. Ettimated time: 1.hour.
Algebra. The second part of basic mathematics, a continuation of remedial
math. Content: elgebra. Estimated time: 45 minutes.
Ratio Proportion. A continuation of basic mathematics. This segment
develops ratio and proportion and is the terminating sequential course for the
basic mathematics sequence; Estimated time:. 1 hour.
Test,on ra-, rb-, and re-math segmehts. Test on the material covered in
re-,. rb-,, re math segments. Includes test on exponents, roots, algebraic
expression, ratios:and proportton. Test presented via 2 x 2-inch slides and
feedback given for each'question. Estimated time: 45 minutes.
Number Systems -(IBM. 1410 Computer System).
A program entitled Number Systems (Sands, 1960 was written for the pur-
pose of invetigating techniques of developing computerized instructional
materials in the area of mathematics. The program.consists of approximately4
840 Coursewriter statements and takes an estimated 3 hours for a Student to
complete.
The 'objectives of this program are as follows:
Main Objective
To have students acquire the ability to convert a number from.:
one number system to another. For example: 231 (base five at (base
ten)
Sub-Ob ectives
To recognize for any symbol in a number its Iquivelant expres-
sion containing a coefficient, base, and, eicponent; an example of
this would be to recognize 2(52) as the equiValent of the 2 in
231 (base five).
_ 27

lb
19
To recognize the correct expanded form of any number; an
example of this would be to recognize 4(91) + 1(90) as the 'equiva-
lent of 41 (base nine).
To recognize the correct numerical expression for a verbal
statement. 'An exmple of this would be to recognize "20" as
equivalent tO "two groups of the base -in any number system."
The programing strategy used is a slight departure from most of the
strategies used with Coursewriter. The major criteria for branching is not the'
type of error response but in the amount of practice.required to/achieve
mastery within sections of the program. Also, an attempt has been Made to
keep error rate at a minimum. Studenti who do make errors are not required to
type the correct answer, but are given an explanation of the correct solution
and are automatically branched to the next item.
Slide Rule -(IBM MbComp u te r System)
5
This -is.a course which provides instruction on the use of a slide rule.
The scales discussed are those used for: 1) multiplication (C, D, C1);
2)lq rooaring and cubing numbers and *king square and cube ots (A, B, k);
3) fi
i
ding logarithms (L);'and 4j r4ding trigonometric functions (S and T).,
Spel 1 ing,
Two programs in spelling were developed in the CAI Laboratory. Both pro.;
grams were designed-for. remedial instruction for high school or post-high
school -students. The first program descrihed was designed fOr use on the IBM
1410 computer system. The second program is built for the IBM 1500 computer
system and is available-for use on the Lab's present computer system.. The task
of building the second spelling program wai facilitated by-knowledge gained
through the develOpment ind testing of the first program.
4

20
ConniunicationsSkills - Spelling -
c IBM 1410'Compule-FSYstem)
The purpose of the CAI course in communications skills (Bjorkquist, 1965)
was to develop and evaluate a computer assisted,
program of trtsiruction in
remedial spelling for 'students pteparing to be technicians. The computer pro-,
gram was, planned to diagnose the spelling errors made by individual students
and to branch students to remedial programs of instruction appropriate for_the
types of spelling errors made. It was anticipated that this course would be a
prototype for the prel;aration of other communications materials.
Stfdents completed an orientation which introduced them to the.selectric
typewriker, tape recorder., and photographic .slide.outputs of the computer. It
also acquainted -them with the typewriter they woutd use 'for responding and
tried to impress upon them the importance of accUrate spelling. Instruction
in.identifying word syllables and in listening.fór correct pronunciation was
included. The orientation was followed.by a diagnostic spelling test which
identified the types of spellfng errors made by the F.dividual. Words in the
diagnostic test are pronounced to the' student via audto -tape message, and he
responds by typing the word on the computer typewriter keytioard. Based on an
analysis of the responses made bx the student, the computer branches those
students needing remedial work to one or more of nine remedial programs.
The diagnostic test is made up of words involvinge nine types of spelling
problems: plurals, homonyms, contractions and hyphenated words, words with
ie and ei Combinations, double consonants, suffixes, e and y endings, words
requiring visual discrimination, and "demon" words. A student who misspells a
certain percentage of those words tnvolving one of the types of spelling errors
is branched to the remedial program of instruction to.correct that type of error.
After completion of the remedial program, the student is tested to deter-
mine his degree of improvement. Failure to show marked improvement tp cor-
recting a type of spelling"error will repeat the remedial program for the stu-
dent.
Words for the ,diagnostic and-remedial programs are selected from graded
spelling lists, themes written by students and from words used'by technicians
in their work. Emphasis is placed on the incluston of those words which are
commonly used by technicians.
29
s't

21
Following completion of the orientation, diagnostic test, and remedial
programs, the student completes a proofreading exercise. The purpose of this
exercise is to test the student's ability to recognize misspelled words in a
printed page, to correct errors and to emphasize the importance of-\p.ofreading.
The program in spelling concludes with a posttest'composed of words ran or4113%
taken irom the same word list as the diagnostic test.
0 Computer System)
This spelling course (Farr, Kelly, and Palmer,. 1969) consists of two tests
.and five Instructional segments. The pretest and posttest are parallel in
format and in diagnostic siructlire, but the posttest had twice as many (100) as-
the pretest. In both of -these multiple-choice tests, the student is presented
with one sentence at a tirie. Each sentence contains one blank space to be
filled with the word appearing under the. sentence. Three possible spellings
for that word are shown simultaneously with the sentence, 'and the ,student
registers his choice of the correct spelling kr touching the light.pen to the
speltpng he judges to be correct. The student's choice is then evaluated as
correct Or incorrect by a coipputer routine, and wrong choices are recorded in
counters. Each student's cumulative totals' of wrong responses is availabl.e for
each Of the( five error categories being testedo The student does not receive
any eValuative feedback about his choices until he- has completed, the test
.being takeno However, at the conclusion of both testi, he il'informed of the
number of errors that he made in each of the five categories.
At the. time this -course was being derloped., audio equipment for the 1500
student stations was not available. .And in view of the highly unreliable per-
formance experienced in using.tape-recorded spelling tests on the 1410 system,:
as well as an .imminesit tennination'date for the project, we decided to proceed
Ithout the use of audio equipment.Therefore, we represented the possible pronunciations for the three
spelling choices ritth ef set of graphic' symbols and manipulations.. The symbols
and manipulations used are modifications of a. syitem for representing Sounds
which was devised by T. V. Barker of the Lehigh University Speech Department.
The major advantage of Barker's system. over other graphic systems:for
I
I
II
p.
22
representing sounds (e.g., the International"Phonetic Alphabet) is that all the
Barker graphic symbols are readily identifiable as -letiers.of the English
alphabet. Hence, in spelling., the graphic Sound representation of a lord is
spell ed.exactly like the standard .alphabetica representation of that word.
When anaiphabetic symbol has more than one possi bl e sound (e.g., c,.s, th
vowels),:Cthe position and/or form of the letter symbol indicates the appro-
priate sound for the word (i.e., spelling choice) under consideration. For
example, \when c,. s, -and t are voiceless, they are located one-half space above
the home line of type; if they' symbolize voiced sounds; they are located one-
half _space:below the home line of type. A vowel followed by a space is always.
accorded ihe long vowel sound, 'and anr letter crosed by a ilash 'mark is a 1
silent feiter. :Outline and shaded letter symbols represent diphttiOngs and .
other speial, sound combinations: Each student i,s proVided with Lipronuncia-
tion. key (on paper) illustrating each symbol "as its sound occurs in a common,
word.
In the instructions for the pretest and posttest, each student\ is- if,ormed
. ,
that he c+ touch_ his light pen to the word "help" (which appear :in the si\lie
spot on tile screen with each test.question) if he wants to tee Ii6v,; the choiCes
are pronot1nced. The program perets hilli to return to the pronunciation (Lel.,
"help") section as many times as he wants on each question. Counters are pro-
gramed tol keep track of the number of times each student uses the "help!'
section for each of the five different error categories being tested.
Iteffls covering the five error categories are presented in the same, order
on the' ptletest and the posttest. Thus, the pretest contains a total of' 5016
'items ,arranged in 10 groups of the following error categories: 'the doubling
of finali consonants, ie-ei words, the formation of plurals, words ending in
silent e, and words ending in The posttest contains a total of 100 items
arrangel in'20 groups of the same error categories.
Because the students' for whom this course was planned are older adoles-
cents, an attempt has been made to make the test sentences as bnlike.the usual,
unimaginative, monotonous sOelling-test sentences as possible, while at the.
same time making them clear and not so interesting as to be distracting.
*ending on each student's performance on the pretest, he is judged
eitherh to be in need of initructiontn.one or more of the five error categories,
_ 31

23
or not to be in:need of sUch instruction. If, on the pretest, a student makes '
no more than two errors in each category (f.e., if he.misspells no more than
two out Of ten words-in a single category) he is judged to have,performed
satisfactotily and ht does.not receive instruttion in that error category.
Each category is judged separately, so..a student' could make as many-as ten
errors (i.e., two errors in each of thee'five'cateogries) and yet..not be routed
frito instruction. The justification for this criterion level is that two
errots out of ten possibilities represents an accuracy level of 80%. Sike
the expectation of.perfect Englh spelling may be an unrealistic'one for'
human beings, we settled on 80%.accuracy as indicative ofknowledge and skill
well beyond the level of chance, yet within the.scope of attafnment"for students
enrolled in post-high school study, programs.
When a student makes more than two'errors in a citegory, he'is auto-
matically routed to the instructional sectfon deiling.wfth the kind or kindsof
errors that he made. After completing all instruction indicated as necessary
(On the basis of his pretest score), a itudent'is explicitly branched to the
posttest, where the same criterion.level *Ids. Hence, on the posttest, if a
student spells 80% of the words in a category cOrrettly, he is judged to have.
achieved a satisfactory level of.spelling performance (i,e,he makes no more
than four errors.out of a.possible twenty in each of the:five cateogries).
-Only as a meant of gathering information-about the testi, we have,'at
this level of development, given the posttest.to students who achieved our
no-instruction criterion on the pretest. Ordinarily such students would be ,-
/,
dismissed after taking the pretest. ,/'
Any student whose pretest score indicates that he needs instruction in one
or more of the five error categories, is systematically branched into a
,prologue segment called "Spelling'Patterns." This segment has two b sic pur-
poses: 1).to alert the student to the'presence and prevalence ,f4atterns in
English'spelling; and 2) to presentbasic expository informat on about vowels
and 'consonants. The first of these purposes is. essential y an attempt to'drav
upon a linguisticNapproach to the'study of spelling, in contrast to the pro-
bable, "There is no rhyme nor reason to English spe14ing" approach which most
of our young adult students had previously encouniered. The.second purpose
//

24
was merely to ascertain that the studenti were knowledgeable about two funda.-
-mental terms' (cOnionants and vowels).which are uied extensively in :certain of .
the instructional segments.
The CRT's potential for animated presentation of material permits, the
author to emphasize particular:pitterns and to build on'those patterns in
accord with' the concept(s) being dealt with ai the moment. This animation
capacity of the CRT, hai; as- the,authors anticipated, Ooved to be one of itt
most appreciated adyantagesn-especially when the subject matter is approached
rather reluetanthi by students who. have a general .and prolonged history of
failure in the subject. Both the content (i.e., the fact that there. are pat-
terns in English spelling) and the graphic treatment of the content. (i.e.,
meaningful arrangementvand animation) tend to rékindle hope in the students
that this time ihey might really learn hqw to Spell. The patterns prologue
-received fivcrrable, cOMments---soMetimes accompanied by pleasant surprise.,
Theydoubl ing i nstructional segment is,, concerned wi th teachi ng;. students
how,to determine whether or not the final consonant on a word should be
Aoubled when a Rffix is added *to the .word. To .begi n. wi th, the student is
asked to distinguish between vowels, and'consonants. If he fails' to do' so
satisfactorily, he is given a brief review on eonsonants and ,vowels. The
instructional segment uses si gni fi cant .animati on extensivelY, illustrating.
doubled consOnints, the settings in which they oecur and- do not occur, and
the rule of the syllable number and actent, as well as the significant pleme
in the suffix to be added to the root word. After the instructional prograM. ,
has shown the separation of words into their roots, suffixes, and doubled c
sonanti (where .necessary), the student is presented with a series of-intern
quizzes in which he must decide whether to join the Toots and suffixesi.jus
they,appear. on the screen, or Whether or not to .double the final .consOnant
the.root word; before adding the suffix.
-When -the student has passed this point,, he is presented With .a state
of the .rule.and then is* quizzed on itt, application.. After each unit. of
instruction, the stuctent is quizzed until his performanci'scOre reaches
terion;.then he. is directed into.a different and/Or a lnore conipl ex aspiC
the topic.' The tone of the evaluative feedback is designed to be approp, , .
for the student's performance: gentle and suppOrtiVe'it .firstvmore
ri-
'1
.41
,

25.
matter-of-fact as the number of trials to criteriQn increases. Drill-and-
practice -is extensively interspersed w.ith internal quizzes in all instructional
segments
1500 Ccimputer -System)
Spelp is a computer instructional program for 'the understanding of prefixes
and suffixes. The course contains a description of 1) the relationship among
prefixes, suffixes, and root wOrdsV 2) an exercise 4n typing the root when
prefix a suffix are given, and. 3) an extensive dri fl in choosing the correct
wird mea ngs when the meaning of the prefix is known.
Engineering Science
Engineering Science -(IBM 1410 Computer System)
'The planning of this, course in engineering science, (Gilman, 1965) included
comprehensive examination of the engineering technology and physics 'curricula
of many vocational institutions. Most of the available texts in tec ical
phYsi cs, were* reviewed.
Because there is a certain amount of subject matter common to physics and
mathematics, these areas were programed' ii rst. To'pi cs in 'scientific notation,
the metric system, 'working with units, signifitant figures anikinematics were
programed and tested by student subjects. Also, a chapter explaining the
relationship between physics and engineering. was programed and is available.
Short segments in magnetism and atomic energy were written and tested.
The overall instructional strategy for CAI Engineering Science and Tech-.
nical Mathematics begins with a common subject alid branchet into separate tech-
nically oriented mathematics and physics courses. However, the separate courses
are correlated, so that instruction in physics topics are preceded by the pre-
requ i si te.mathemati cs for that topic .
The physics curriculum includes beginning material of mechanics, heat,
matter, electricity, magnetics, electronics, mbdern physics, light, and sound.
34
43
26
Technologital adaptations of physics knowledge are stressed to a great
degree. The structure Of the science of physics, is emphasized and provides a
valid framework for learning fundamental concepts. A summary of the course
segments in Engineering Science and their content are summarized below:
-, Introduction to Physics. An introduction to the science of physics. This
segment desciibes the relationship of physics tc; enginieringland chemistry, con-
siders some.elementary physics topics such as density, kinetic and potential
energy, and the relationthip between mass and energy-. .Estimated time: 1 hour..
.The Metric System of Measurement: .Teithes the student to use the metric
-1
system of measurement and -to make.conversions from One systen'to another. .The
student learns to.make conversions through the proper multipl4cation and .
...division techniques required for unit conversiom Estimated time: 1 hour.
Working with Units. This short course presents a different treatment to
the use of dimensional analysis (also known as factor labeling).in working
physics -problems. The student is taught how to use' the units given in a
problem to find the units required in ihe problem's solution; Ai:...o, branching
strategy is determined by student's error rate. Estimated time.: 70 minutes. ,
(Also programed are four,experimental versions of Woking with *units.) .
iSignificant Figutes. Determination of final accuracy. in scientificexperiments' through the use of, significant figures. Accuracy in measurement is
considered and rules are giyen for finding the Correct accuracy in the final
result. Estimated time:. 1 3/4 hours.Use of Micrometer and Vernier Calipers. This segment teaches the use Of
the Vernier calipers and micrometer caliPers as measuring instruments. The
student first receives instruction on how tot,manipulate the instrument and to
read the scales. He then.makes measurements uSingcthe instruments. The stu-
dent enters his readings at the terminal and they are compared with the measure-
ments made by the course authors.Calculus and Kinematics. A discovery approach to °the relationship of -
: velocity and acceleration to differential calculus. The student develops the
ability to associate the first and second -derivatives of differential calculus
with the graphical representations of velocity and acceleration. Estimated
time: 40 minutes.
35
(
A
27
Heat, Part' I. An introductory course on ,heat. The students is instructed
in thermometry, kinetic energy of gases, and the expansion of solids, liquids,
and gases. kstimated time: 2 hours.
Meat Part II. This is another segment of the introductoiy cotirse in heat.
In this segment the student is introduced to the. concepts of specific heat,
calorimetry, and the
El ectri fi cati on
relationship between
hours.
states of matter. Estimated time: .1 1/2 houi.s.
. Iniludes theory of electrostatOcs) Coulomb's Law and
forces and electrical charges. Estimated time: 1 1/2
.10
Magnetism. A ver'y basic'treatment of magnetism designed as introductory
material to electromagnetic circuits and devices. Estimated time:. 75 minutes.
Optics Part I. kn introductory course in optics: In tSis segment, the
studdnt is presented instruction in i 11 umi nation, *refl ecti on and refracii on .
Estimated time: 2 hours.
Optics Part II. In this segment the student studies geometric optics as
i t applies to plane. mi rrors curved mi rrors and' lenses Estimated 'lime:
2 houri.'' .
Atomic Enerdy. . Utilizes, the full facilities of compyter-assitted instruc-
tion ta present an elementary description of atomic energy. The student is
taught the relationship between.atomic weight.and the numbers of protons and
neutrons in the atom. Estimated time:, 1 hour.
Mechanics. Adjunct auto7instructional program to provide supplementary
instruction during* testtng in the area of mechanics. Estimated time: .45 min,
utes" to 2. hours.
Kinematics. Adjunct auto-instructional progtim to provide supplementary
instruction during *sting in the area of kinematics. Estimated time: 45
minutes to 2 hours.
Meteorology. This metro segmenty incl tides the physi cal and meteorologi cal
--aspects of heat and scales commonly used on thermometers, and the =won type
of thermometers.
Simulated Laboratory physics Exercise. S1 physics is, a simulated labora-
tory physics exercise designed to provide the stuident with the concept of thel.
variables involved in a simple example of uniform, circular motion. The stU-
dent is'instructed to identify the variables -In the situation, hypothesize

.
;
28
the.relationships between the variables, request data, and evaluate his hypothe-
ies. The student may request.information pertinent to the Physical situation
on terms relating tothe situation.
Science, Gewal, Content.of these two_segments is designed to update
student's science knowledge and to provide student with more adequate science
concepts.- Both segments automatically connect to tc physics, a macro program
of pre-programed options which an-author eanouse to specify strategies for any
question 6ame.Po.
Measurement and EvaluatiOn
Severat courses are available on the IBM 1410 computer tn the measurement
area. A biief description follows:-
Student Opinion Survey. A CAI segment, administered 'on line, is a meas-
uring instrument to evaluate the student's attitude toward computer-assisted
instruction. Twenty questions are 'Presented via 2 x 2-inch slides; the system
records the student's response and assigns a value of one through five to the.
response depending upon where it lies on the continuum. -System types.out score,
which may range from 1 to 100, and the accumulated nysponse latenCy. Estimated
time: 20 minutes.
Compulter Aptitube Test. Pretest.for compat(computer.aptitude test). A.
preliminary CAI ability measure designed for sequential kesentation at the
student, terminal. Estimated time: 30 minutes.
Remote Associates Test. Computer administered Remote Associates Test of
creativity. .Thirty questions are presented via 2 x.2-inch slides. Those that
are skipped are presented again.and then a,third time if,skipped the second
time. Individual and total response latencies are printed.out 'for, each ques-
tion as student proceeds, plUs.the total score and the number of questions
missed. Estimated time: 50 minutes.
. 37

..
=boo.
ugny je4,41 e
29
Plan for the Development of A Pilot Computer-AssiitedOccupational tiliTaiTETTrogram
The purpose of this section is fourfold: 1) to describe the initialcomputer-assisted occupational guidance (CAOG) program developed in the Depart-
ment of Vocational Education at.Frenn State; 2) to present the results of two
field trials, in which the program was'utilized; 3) to describe the second
generation version of the program developed in the CAI Laboratory; and 4) to
present a planned third generation program and the rationale upon which it is
based (Impellitteri Kostenbauder,' and Paolone, 1968) .
Description of OriginalVersion of cIUG
The efforts devoted tO the design and development of the initial prototype
of'CAOG were a reaction to a growing concern. The objectives of the original
project were, ,as stated. in the Phase I report (Impel 1 i tteri , 1968):" aj to
develop a pilot occupational information retrieval and transmission system
which would stimulate a selected segment of the ninth grade population to
explore occupations on .their own; b) to structure the occupational information
transmission and the procedures by which the information is retrieved in such
a way as to.develop in the 'boys who are exposed to tie systenuthe acquisition
of strategies for Career exploration; and c) to develop a vocational guidance
support syttem*focusing upon occupational information which represents an )integral part of the total guidance services .in a school.
The focus of the initial pro"gram was upon the storage and transmission of
oc ational information by.wiy of a computer-based terMinal device as acl
vehicle by ,which Youngsters would be both'motivated to further exploration, of
octUpations and stimulated to develop their own individualized strategies to.,
undertake those explorations. 'A brief description of the hardware, software,
and nature of the interactive process which was utilized in an attempt to_
fulfill the stated objectives is. presented 'in the following discussion. \The student terminal provided the means by which a student, interacted with
the system. The terminal, cbnnected to -an IBM 1410 computer by telephone
lines, was compcised of an electric typewriter, a tape recorder, and a slide
projector, all under computer control. The computer presented selected
z. 38

30
materials to the student, who was seated at the terminal, by either typing out
a message through the typewrtter, displaying a particular image on the slide
projector, or by playing a previously recorded message on the tape recorder.
.The student"transmitted meaningful messages to the computer by typing a-thort
response on the typewriter. This short responie required of, the student was.
'considered to be essential since longer typed messages would7have required a
level of typing skill not ordinarily achieved by most ninth grade boys.
Information related to a certain student's abilities, preferences, and
educational Oansivere stored in the coMpuier befOre the student began the
interactive phase. The student'was oriented to the purposes of the system
before he began the first setsion. At that time, he was'given a list of 40
occupations with corresponding codes representing his primary'entry into the'
I
system. The computer's first request to the Istudent.was toisk him to.select
one of the 40 occupations on the list about which he would have liked to haVe
known MOM .After the ttudent responded by typing an ocCupational codenumber,
the computer typed out a. short paragraph very'briefly describing the occupa-
tion. The student was then asked if he wished to find out more about the
occupation. .If the student responded positively,:four operations were acti-
i
vated in the following order: discrepancies which may.have existed
between the students ability-prefarence profile and the requirements for the
particular occupation were typed,Out; 2)'a two-Minute taped interview with a
worker in the occupation was played; 3) an image was projected on the slide
projector screen 'depicting the worker undertaking four.typical tasks in the
occupation and 4) a 150 to 200-word description of the occupation was typed
out for the student to read, and to keep for later use.
rhe student was allowed to proceed through as many occupations as he
wished during as many 40-Minute sessions at he chose to tpend. He may have,
.at any point in the process, indicated that he would have liked:the computer
to select for him tho4e occupations.from the list of 40 which,he might have
been interested in exploring further. The computer, by comparing the aptitude--
preference profile for the student with the 40 occupational profiTes sought
those coo:potions for which no discrepancies existed, it listed those occupal,
tions for-the student.

31
Retults of the Field Trials
In order to assess the outcomes of the field trials a substantial amount
of data wat collected. These data included:
I) ,amount of time,voluntarily spent by each student with' the terminal
(Roosevelt High School sample only);
2) number and type of occupational triscriptions requested kie each student;
3) reaction of each student to the equipment, the content and procedures
utilized,*as nmasured by a 44-item inventory;
students' expectations of, the experience; their changes in awareness
of self as related to work; the degree to which their horizons of
occupation( l opportunities increased or'decreased; the degree to which
students developed an exploration strategy; and the degree to.which
students were stimulated to seek additional information regarding
occupattonal opportunities--all collected by way of a 30-minute
interview immediately following the terminal experience (Roosevelt
High School sample only); .
5) change in expressed tentative occupational choice between September
and March for the group having the terminal experience as compared
to a .similar group of vocational-technical bound boy$ not having the
'experience and a group of non-vocational-technical bound boys
(Roosevelt High School sample only);
6) selection of tenth grade course of study as compared to previous two
years selections at the same school (Roosevelt High School sample
only);
7) changet in occupational values as measured by a 35-item inventory,
and
8) changes in the students' general knowledge a6out occupations as
()measured by a 149-item test (Keith High School sample only).
An iffensive anilysis of the data listed here appears in the Final Report
of the Phase I project (Impellitteri, 1968). Betause of the broader purposes
of this paper., only summarized portions of the more significant analyses are
presented.
40
4.

1 revised,,mote highly structured heurisstic approach has been designed.
The folloWing.discussion is an attempt to describe the content, .sequence and
the nature o# the student's Participation during the interactive- process.
The first phaseof the coMputer terminal experience for a student requires
him to\ select t ree occupations from a list of 144 occupations representing a
reasonable samp ing of opportunities in the world of wonk. The three occupa-
tions the student is required to select from the list represent three tentative
occupational choices, The computer has access to 288 other occupations, some
of which may be presented during the student's terminal experience. The stu-
dent, however, must select from tife list of 144. This. requirement has merely
been conceived as a convenient starting point. The numberi of selections, and
stored occupations have been set rather arbitrarily.The next step in the program.is. to check on whether any.meaning can be
transl ated from these three choices (elementary level of ,"occtal k" to
"psychtalk"). This check has. been built into the program as a five-item test'
with feedback on each of the three occupations. Each of the five multiple,
choice test items have been designed to measure. a student's knowledge about one
f the following aspects of each of the three selected occupations: 1) duties
and typical tasks; 2) educational requirements; 3) training requirements; 4)
working conditions;. and 5) opportunities for advancement. The feedback for
each i_tem is essential in that it either crystallizes the perception of the
youngster about an occupation, or' it clarifies his perception. The nature of
the feedback takes the 'form of .either; "Good! Your ansor is correct. . 9li.
or "Incorrect. ." In either case " " represents a one or two sentenceOMMMINFM
description of the particular aspect of the occupation in question.'
The final stage in analyzing each of the three occupations Is to give the.
1_7(
youngster an opportunity to replace the-occupation in question with another
which might appear to be more appealing to him after finding out something
UaboUt the originally listed occupation. . Replacement, then requires the student
to go through the same process of questioning with the new occupation on the
lig. The student's ecore on eat!) five-item teit, his total score, his score
on eadh of the five areas across the three occupations, and the number of
replacements he chooses to use are stored in computer counters for use later in
Iithe program. -
32
Description of Planned Program .
(1 41

9
a
33
Thk procedure continues after the student has reached the stage'when he
is relatively satisfied with the three occupations finally listed. The coin=
puter then presents the following message via the CRT:
. "When a ninth grade boy states what he thinks are possible
occupations which he might enter in the future, he may be
indirectly indicating something about those kind of acti-
vtties he likes to do. Let'us examine if you have shown
something aboutillurself in selecting the choices you listed."
The computer proceeds to compare an interest profile developed for each
,of the three occupations listed based on a dichotomous scale (Significant/
Non-significant) of each of the teh Kuder Interest Inventory dimensions. Only
those coincidences of three occupations having the same significant dimension
are noted for further consideration. If there are no coincidences of three
occupations, the computer, searches for two of three on any of the dimensions.
On the basis of its search the computer then presents the following
message:
"In selecting the three occupationi which you have listed
you have indicated that you may have a preference for
working with nuabers and a preference for working with
machines and Elgrr (The student is then asked about each of the areas of interest which Wire
underlined in the message, one at a time. He is asked, "Do you.iRink you have
a preference for working with numbers?" After the student answers "yes" or
"no," the computer then verifies this answer on the basis of the student's
coded (Sjgnificant/Non-significant) Kuder scores which have been stored. It
then feeds back information on.the accuracy of the student's perception. When
each of the interest areas have been presented, the student is then asked,
"Would you like tO examine other occupations.which might be in line with.the
preferences you have expressed?'
If the student answers "no" to that question he is asked to consult a
list of the ten preference statements of the Kuder, and to indicate'his'major
preferences. These then are verified imirthe same manner as previously described.
All students should, whether they have answered "yes" or "no" to the question,
reach the next step of the program. That step requires the student to consult
_ 42

34
'another list which allows him to specify further those characteristics, if any,
.'he wishes to impose on tho following selection. Those possible characteristics
include;---
Any one, two, or three Of the nine aptitudes of the GATB (U.'S.
Employment Service), listed by statements like, "Ability to deal
accurately.and quickly with numbers," etc; Each. of these apti-
tudes, if selected, by the student is verified in accordance with
the same procedures utilized in the verification of perceived
interests.
2) Four areas of school achievement (mathematics, language, science,
social studies). These also are verifted-in accordance with
previously described procedures.
3) Educational level--college vs. non7college.
. 4) Amount of physical acti'vity involved in the workn-much vs. some vs.
none.1
5) Primarily indoor or outdoor work..1-
6) Salary_leGel.
4
For each of the 432 occupations in storage each of the characteristics
above are coded in some way. This feature allows the computer to aecess, based
upon the student's stated restrictions, 429 occupattons mink the number of
occupational replacements made by the student. Each of thelle97R occupations
which are identified by "'computer are presented via the CRT.to the student.
If five or fewer occupations are identified in accordance with the student's
restrictions, the.computer will suggest that the student pick out the-least
important characteristic he chooses, and elimirite it. At the point where
five or more occupations have been.presented to the student (plus the three
originally selected by the student) it is suggested.that the student nay wish
to visit the library, counselor's*office, etc., to uncover more information
about these or other Occupaiions:
The final phase of the programorients the student to focus upon the
characteristics he selected. For instinte, if he indicated no agtitude area
as being important, he will be asked to select what he feels is.the-most
important of the,nine abilities and to note the differences between the
original list of occupations and the new list. He is asked to make some

.35
comment about the difference.from a list Of five statements presented to him..
This technique is also used for the achievement area as well as educational
plant.
Through the kind of experiences provided for the student in this revised
program, it is hypothesized that he will develop a unique framework of the
world Of wirk as well it an operational strategy in exploring his place in it.
For ninth graders, whose entrY,into the exploratory stage is immlnento.it seems
that such an objective is esiential, and.should be an important determinant in
the planning and-devtlopment. of the total ninth grade educational'program.
44

r, CHAPTER V
SYSTEMS PROGRAMS
Geometric Dictionary
sr37 A
q)
There are at least four' advantages in .using a .eometri$ dictionary on the ;
computer-controlled CRT display (Peloquin, 1968). First, the geometric diction=*,
ary uses less core storage than a graphic set, yet there.is'no limitt to the.number of line drawings wEich can be made. Becausethe Copiponents oi a diction-
ary are small,' they beconie more general and may be used in many differentcom-1
binations. By analogy, a graphic set mai be equatetto a vocabulary of 64words, while _the geometric di.ctionary maY be equated to. an alphabet of. 128 ..'
: .,? . .
letters. The geometric dictionary may be equated and used various..
courses thereby conserving core storage. Second, the necestity, of 'keypunching
each and.every. one of the line drawings dot by dot -is eliminate& ;Third; thegeometric dictionary allows the at;thor to construct, on-line, thei.graphits for.his course. This ability allows him to Instantly see the tine drawing as it
4.
entered and make necessary changes or correctioni. Fourth, words and line
drawings can be combined -wi'thout, the one column gap necessark when ut-ing a
graphic set.there are, of course, some 'disadvantages as well. The geometric diection-
ary has been designed for producing moderate and large-sized line drawings.
Except for some gross shading, such as "blackened" areas and hachures,. the ,... -..i., .:
fires produced with this dictionary have been only line drawings'. Some con,.v A ...;.
straints are' placed upon the drawing by the .avai lability and the nature of the
1 i ne segments: Thi t restriction necessitates. careful planni ng 9 bilt Wi th ihe t. , (
.::e
help of the IBM 1500 InstructiOnal Display Planning Guide sheets it does not
constitute a serious problem'. Usually the addition of an extra character into
the dictionark or a bit of programing ingenuity will overcome problems in
producing still or dynami,c line drawings.
General Descriptionv.
The geometric dictionary consists of line segthents..entered.:as dictionary
charactT which may be manipulated as such. ThrOughout this description the
45
, I
joc4

38
characters appearing on the terminal keyboard and on the CRT under the system
dictionary, whether letters, symbols, or numbers, will be referred to as
"associated keyboard characters." The characters containing the line segments
of the geometric dictionary will .be refered to as geometric characters, and
the line parts contained rithin each of the.geometric characters will be
referred to as line segments; whether straight line segments, arcs, or special
characters. Since we am dealing with dictioniry charactersti once the
geometric dictionary hitbeen called by a dictionary change the geometric
dictionary has all the operating characteristics and functions of the system
dictionary. A particular line segment is called and displayed on the screen
by entering the associated keyboard character in a display text (DT) or
display text insert (DTI) instruction. For example:
DT .12,10///*laaaaa*b*b78 aaaaa 78*b*aaaaa*e
After a dictionary change (denoted by *1) is made, this instruction will
display the "a" as. a horizontal straight line and the numbers "78" as the left
and right half of a small circle respectively. The backspace function (*b) has
been used to superimpose lines.
Procedure
Sketching
The procedure involved in the construction of a line drawing requires
three steps: sketching, coding, and entering'. First, a sketch of the line
drawfng is made on an Instructional Display Planning Guide. The sketches f-
should be rather simple and should be constructed of those line segments that
the prbgramer knows are available in the dictionary. On the three pages fol-
lowing this description of the first step are reference pages indicating the
orientations of the line segments that are presently available to the programer.
It is recommended that these reference pages be reproduced in a transparent
form in order that the programer may overlay the available line segments on
his sketch for compariSon. The reader is reminded that each geometric charac-
ter may be used independently. Thus if the third (and middle) character of a
30° line is needed, it may be used independently of the other four geometric

a
39
characters which make up the completed line. If the programer cannot match his
sketch witn an available line, le should select the closest approximation and
revise his sketch accordingly. A Hilted number of special characters may be
inserted into the geometric dictionary if the programer finds that their omis-
sion seriously handicaps him. Additional flexibility can be gained by the use
of the keyboard functions such as space, backspace, index, reverse index, and
dictionary change. Superimposition, offsetting by a half-line, the display of
text and geometric figures in juxtaposition or superimposition, the display of
only half of a geometric character, and shading are some facilities gained by
use of standard keyboard functions. With a little practice, the programtt's
familiarity with the lines available in the dictionary should grow to a point
where he will be able to produce sketches whichAruire no lines that are not
already in the dictionary. In anticipation of the second step, the programer
may wish to make mental or written notes on the lime segments he intends to use
in constructing the line drawing.
Coding
The.second step in constructing a figure with the geometric dictionary may
take place once the sketch in the. Instructional Display Planning Guide contains
no lines which are not in the geometric dictionary.
The two reference pages following, Figure 3, are used in the "short form"
of encoding. The reader should note that the associated keyboard characters
are written beside, atiove, or below the geometric characters to which they
refer. One simply chooses the line segment and geometric character he-wishes,
then encodes the associated keyboard character.
The use of the long form is not described here since simple line drawings
can easily be constructed with the use of the short form. More complex figures
requiring knowledge of every lighted dot within the character would necessitate
the use of the long form.
Entering
The third step involves the on-line entering of the coded line drawing.
This step may, of course, be iltered by entering the coding on cards. The
47

40
PSU GEOMETRIC DICTIONARYSHORT-FORM DOCUMENTATION
Circles
6 Characters Tall
H e.< (
ROP aONM
1 Character
r17 P,
Horizontals
3
6
4
B El ti.; a
Ha 1 f-Hori zonta 1 s*
4 Characters Tall
'.1-I S
MIRAZY X
2 '3 Character
2 Characters
>
2 1 0
Row Tall
A
(7 in oneChracter)
BB ff)1:1 E11 00 DOS.
'6 V 5 .6. C B
(zero)(times)
There are no half-horizontal lines in the position equivalent to
the horizontal a.
Fig. 3. Short form documentption.
48
f

Verticals - Short Form Documentation Cont.)
Diagonals
TI 1;1]..111 Elf .g h
5 Characters (150)
clan cluwouv wxy zqrs t
2 x 5 Characters (30°)
ikl m no
Rroll
2 x 3 Characters (450)°IC .1. Sri W
i
x 1 Character (60°)
11 x 7 Characters (350) 2 x 1 Characters (70°)
Shading
Li}
S.
(comma)
W
(slash)
Fig. 3 continued. Short fon! documeniation.
41
x 1 Characters (752
9
414
A

42 .
of entering on-line is that tilt programer may see the portions of the
.. drawing as he enters it, thus allowing him to cOrrect or change the coding and
the driwing..
A Processor for .Mul Mole Numeric Entries -,TIBN 1410 Computer tystem)
For the sequential testing progrik it was desired that a student be
allowed to respond io multiple choice questions in the embedded tests by
stating his subjective probability of-degree of belief fo'r each of the choices
presented. It was further desfred that the,1e of responding not be unduly
time consuming or unnecessarily restricted in the range of format variations
accepted. Due to the time factor involved following each student response on
the 1410 system, it was not desirable to have the student enter his subjective
irobability for each choice separately. If the student was to be allowed to
enter his subjective probabilities -for all choices in a single response, there
were two Ooisible ways of processing the response in which the information con-
cerning the subjective probability for each choice would be .preserved. A series
or "sick" of possible answers could have been provided in the program against
which to compare the student's response. However, because of the number of
combinations of subjective probabilities possible and the peruitations possible
for each combination, it was, istP0act1cal to employ this procedure.
The alternative procedure (Bahn and Brown, 1968) entailed evaluation of
each subjective probabi Hty In the student's response when .the individual pro-
babilities were themselves components in a string of probabilities which made
up a single Nsponse. No stich capbbility- exists in 1410 Coursewriter. The sub-
routine described here pi.ovided this capability and was employed in the pre-
viously referenced inktructional program.
The,algorithm for the multiple entry' subroutine is as follows:
1./the student's response is entered in' the form:
XX, XXXX, XX, XX, XX
or
XX , XX , XX , XX , XX
where xx is any 1mo-digit number within the range 00 to 99 or the three-digit
number 100..
*$
50

0
2. An edit function deletes extraneous spaces, letters, and special
characters.
3. A series of edit functions rounds the numbers in the student's
response to the nearest ten and converts the number 100 to 99.
4. The response is now in the form:
31, YY)79 yy, YY
or
yy .Y3f 319 YY
43
where yy is a member of the set of numbers (00, 10, 20, 30, 40, 50, 60, 70, 80,
90, 99).
5. Response processing now enters a series of twenty-two (22) to fifty-
five (55) initial character function (ic fn) calls depending upon the number
of entries (2, 4, or 5) and the values of the entries. The initial character
function allows one to compare n initial characters of a response and .o
include "don't care" characters (in this case S) which will match any single
character in the string of characters which is to be matched, i.e., "wild"
cards in poker.
6. The first set of initial character functions compares the first
three (3) characters of the student's response with answers of the form:
YY
7. The second set compares the first seven (7) characters of the
response with 4nswers of the form:
$S9YY
8. If only two .(2) entries were required, processing passes to step 13.
9. The third set of functions compares the first eleven (11) characters
with answers of the Sonn:
$$, Yy
lo. The fOurth set compares the first fifteen (15) characters with
answers of the form:
$$9 $S, SS. )7
11. If only four (4) entries were required, processing passesto step 13.
51

12. The fifth set of functions compares the first.ninteen (19) charac-
ters with answers of the form: .
$$9 $$9 $$9 $$9 YY
13. Each time an entry was matched, its value (yy) was placed in a
counter corresponding to its original position in the total response. These
counters are noW added together to _see if their total is one hundred (90 to
110 to allow for rounding error).14. The entry with _the highest value is loaded into couriter six (c6) and
a switch is set to indicate the original position of this value.
15. Control is returned to the main program.
With the the advent of the IBM 1500 instructional system and the extract
integer function (er frt) this same procedure can be implemented with fewer
statements and greater accuracy. A macro has been written to accomplish this
task.
6
CHAPT,ER VI
RESEARCH STUDIES
Relationship Ampong Attitude, Achievement, and
Aptitude asiiFFilM. Pe orr-Hrmince
Purpose
45
The main objective of -the investigation(Wodtke, 1965) was to examine
relationships among academic aptitude, past achievement, and perfonnance in CAI
to determine whether the results of previous investigations can be generalized.
Methods and Procedures
Forty-five college students completed a section of a course in modern
mathematics whichwas presented byieans of computer-teleprocessing.The stu-
dent terminal consisted of an IBM 1050 communications system consisting pri-
marily of an electric typewriter as an input-output device. The frames of the
program were typed out to the students at the typewriter, and the students
entered their responses by* typing them at the terminal. Responses were evalu-
ated by the computer which kept track of the students' performance by accumu-
lating their errors and response latencies in counters. These error and
response latency data were later retrieved by means of a Student Records pro-
gram developed by IBM computer scientists.
Each student was scheduled for a three-hour instructional session. Upon
arriving at the CAI laboratory, each student was pre7examined on his knowledge
of the content of the modern mathematics pm. ram. The student was then giien
a warm-up period to familiariie.himself with the operation of the student
terminal. Following the warm-up period, each student completed a section of
the modern mathematics course on number systems with bases other 'than ten.,
Most stirdents'completedthe cours in about 2 to 2 1/2 hours. The course con-
tained instruction in base eight, base five, and base two number systems, and
transformations from one base to another. The modern mathematics course has
been found to be fairly difficult for the average col ege nt, and only a
few students exhibit prior knowledge of the concept as i ated by their
performance ,on the pretett. Following completion o the course 9 students were
53

46
given a criterion measure of their achievement in the course, and responded to
a number of attitude scales modeled after the Semantic Differwtial scales
(Osgood, Suci and Tannenbaum, 1957). The criterion achievement test was found
to have a test-retest reliability (one7week interval) of .93 in an earlier
study by Wodtke, Mitzet, and Brown (1965). The attitude scales were designed
to measure the students' reactions.
Summary1
+ The results of the present investigation may be summariked'as follows:
1) The present results do not agree with the results of several previous
investigations.which found nonsignificant relationships between achievement in
programed instruction and measures of general intelligence. Significant corre-
lations were obtained betmeen Scholastic Aptitude Test scores and a criterion
measure of achievement in modern mathematics presented by omputer-assisted
instruction. Although it may be reasonable to expect individualized programed
instruction to reduce individual differences in student achievement in some
content areas, student pelformance in other content areas maydepend on :eq-
uisite skills and abilities which have deep roots in many years of previous
training.
2) Cumulative college grade point average was found to correlate signi-
ficantly with modern mathematics achievement level prior to CAI instruction,
but did not correlate significantly with poit-instruction achievemeni level.
This resift suggests that grade point average reflects the amount of prior
achievement, but is not a gobd,predictor of how much a student will learn in
short periods of instruction via CAI.
3) The best predictors of student errors made during CAI were SAT -M,
SAT -V, CGPA, and response latency in that order. =The results suggest that the i
latency of a student's response might be used as a signarto the computer to
present remedial instruction and thereby, prevent the occurrence of an incorrect
response.
4) A measure of the students' attitudes towards CAI indicated that
college students generally reacted favorably to the experience. However, men
tended to react more favorably than women, and)high-aptitude,students tended
Va react more favorably than low-aptitude students.
54

5) Nonsignificant relationships were obtained between-attitude towards
CAI and performance in the course when the effects of aptitude were.partialed
out.
Scrambled vs Ordered Course Sequencing
Purpose
47
The primary purpose of this investigation (Wodtke, 1965) was to determine
the interaction between student aptitude and scrambled vs ordered sequencing of
instruction. pis study employed a fairly lengthy instructional program of
considerable difficulty for the average college student. The material used
involved the learning of principles, mathematical problem solving, and contained
large number of sequential dependenciei among the concepts,taught. The
specific objectives and predictions of the experiment were as follows:
1) To determine under what conditions careful sequencing of instructional
programs nmake a difference" in student learning within the context of computer-
assisted instruction. Following appropriate hypothesig tests, it was pre-
dicted that scrambled item sequencing would have a detrimental effect on stu-
dent learning in a telatively lengthy, difficult program containing many
sequential dependencies among concepts, e.g., when the mastery of some concepts'
and principles are prerequisite to the mastery of other concepts and principles.
2) To determine whether scrambled as compared to ordered item sequences
have a differentialoeffect on students of high- asicompared to low-verbil
An.aptitude by sequencing interaction effect was predicted. 'Scram-
bled item sequences were expected to have a more detrimental affect on the
learning of low verbal ability students than on the learning of high verbal
ability students. It was thought that students of low-verbal ability would not
have the conceptual skifis required to reorganize the scrambled material.
Methods and Procedures
The course used was a section of a modern mathematics course which had.
been developed for CAI by the staff of the Computer Assisted Instruction LabOra-
tory at Penn State. The material selected contains instruction on the use of

,
48
number 'systems with bases otherhan ten. This learning task offers the
advantage of being relatively difficult for college students to learn, and the
material is unfamiliar to most students. The ordered version of the program
presents subsets of items in the folleving sequence: revir4 of the base ten
system; the concept of place.value; the application of the concept of place
value in base eight, base-two, and base twelve number systems; transformations
from one base to another; addition and subtraction in numbers systems with
bases other than ten; and multiplication and division in nuinber systems with
bases other than ten. Previous experience with these course materials indi-
cated that most undergraduate college students could complete instruction.in
approximately two and one-half to three hours with a mean error rate of about
fifteen percent.
Fifty-one undergraduate students in an educational psychology course at
Penn State served as the Ss in the investigation. Ss with absolutely no pre7
vious typing experience were not included in the study.. Two Ss were eliminated
because a modern mathematics pretest indicated they.had previous knowledge of
number systems with bases other than ten. One other S was eliminated because
his scholastic aptitude test scores (SAT) were not available. hese elimina-
'tions brought the total number of Ss to 48.vk
Subjects were then subdivided into high- and low-aptitude groups on the
basis of their 1;i:ores on the verbal Scholastic Aptitude, Test (SAT) The meat)
of the high group was 612.and the mean of the low group was 534 (SAT employs
standard scores based on a mean of 500 and a standard deviation of 100). The
'original plan of the investigation was to assign Ss within each of the high
and lairaptitude groups at random to the scrambled or ordered instructional
treatment Conditions. Although approximately half.of the Ss were assigned to
treatments at random, the random assignment of a large number of Ss had to be
altered due to a number of.programing "bugs" which developed at the last
minute in the scrambled sequende program. For this reason, tlarger number of
Ss who were scheduled for ihe eirly experimental sessions'were run'in the
ordered sequence condition, and a.larger number of Ss scheddled for the later
experimental sessions were run in the Scrambled sequence condition., The
investigator had carefully exaiined the two groups of subjects and in spite of
the nonrandom assignment Of some of the Ss, can find no selective factors which
could account for the results obtained in the study.
56

a 44. 411.
49,
The dependent variables of the study were criterion test performance,
errors made in the program, total,time taken to complete the program, mean
response latency per frame, an efficiency score obtained by taking the ratto
of criterion test Oerformance to instructional tirie, and measures ofsthe stu-
dents' attitudes towards CAI. The data'were analyzed by means of a two by two
Ilitrfactorial analysis of variance design with unequal numbers of caies per subce111-..
One experimental factor consisted of high versus low aptitude; the other of
scripbled versus ordered program sequence.
Resufts
:A preliminary analysis indicated that although the high:- and low-aptitude
gronps.differed significantly on the verbal...SAT measure, the scrambled and
.ordered,Sequence groups did not differ significantly in verbal ability as
measured hi, the',SAT. In Addition', an analysis of quantitative SAT scores'pro-
ducell nonsignifiCant differences among the four treitMent gronps employed in
the-study.p
The distributions and tWe variances within groups of the dependent:vari-
ables were examined to determine whether.the assumptions underlying the analy-
sis of variance had been met. None of the distributions appeared todeviate.
substantially from normality. Hartley'sgaximum F-ratios' were comOuted te test
the assumption of homogiteity of variance. All of the F-ratios were.nonsigni-
ficant except one. The F -ratio for tpe efficieney4core was significint at-4 .
less than thq .01 level indecating the presence of heterogeneity of variance,
for this variable. In view'of the results obtained by other reseprchers'who
found that heterogeneity of variance did.not seriously bias either the t-test
or F -ratio, the hetekrogeneity of variancifor the efficiency-score cduld not
have seriousty biased the results obtained in'the present study.
In general, the results of the analysis of the main dependent variables. )'
of the study confinned the initial expectations. The results indicatedthat
students in the sCrambled sequence group made significantly more errors during -
instruction than the students in the ordered'sequenceroup (P <.001)% Since.gj
the students:in the scrambled sequence group were morelikely to endounter ().;
remedial segments of the program (due to thq0r greater tendency to.make errors),
than the students in the Ordered group, the scrambled sequence group actually
57

50
responded to more questions than the ordered sequence group. The differences
`obtained in the total frequency of errors might have resulted from the fact
that the stadents in the scrambled group simply responded to more questions
and thus had more opportunity to make errors than the ordered group. To
control for this possibility, an analysis was alsto compUted based on percent
error scores. This analysis indicated that students in the scrambled sequence
group made a significantly greater percentage of errors than the ordered
sequence group. In spite of the highly signi fi cant sequencing main effect for
frequency and percentage of.errors, the sequencing main effect for the criste-
rion test score was nonsignificant. Considered togetrier, these resul ts indi-
cated that al though the scrambled sequence students made significantly more
errors during instruction than the ordered sequence Ss, they apparently
improved their performance during instruction and, by the end of the course,
they performed approximately at the same level as the ordered group on the
'cri teri on measure.
The data indicated that the predicted aptitude by sequencing interactions
were obtained, The interactions for frequency of errors and .the criterion
measure were both very close to significance it the .05 level. However, the
interactions which were obtained for several criterion variables did not
result from a decrement in the performance of the low-aptitude group in the
scrambled program as precicted, but from a decrement in the performance of the
high aptitude Ss in the scrambled program. The results of the present study
support the conclusion that scrambling an instructional program has little or
no effect on the performance of low-aptitude students, but produces a rather
marked decrement in the performance of high-apti tude students.
Rote Rule-learning on Transfer of Training
Major Objectives
1) By means of an experimental paradigm which simulated a comon class-
room teaching sequence, the study attempted to demonstrate the detrimental
effects of adding rote rules-of-thumb to instruction designed to facilitate
basic understanding and transfer of training.
58
t-
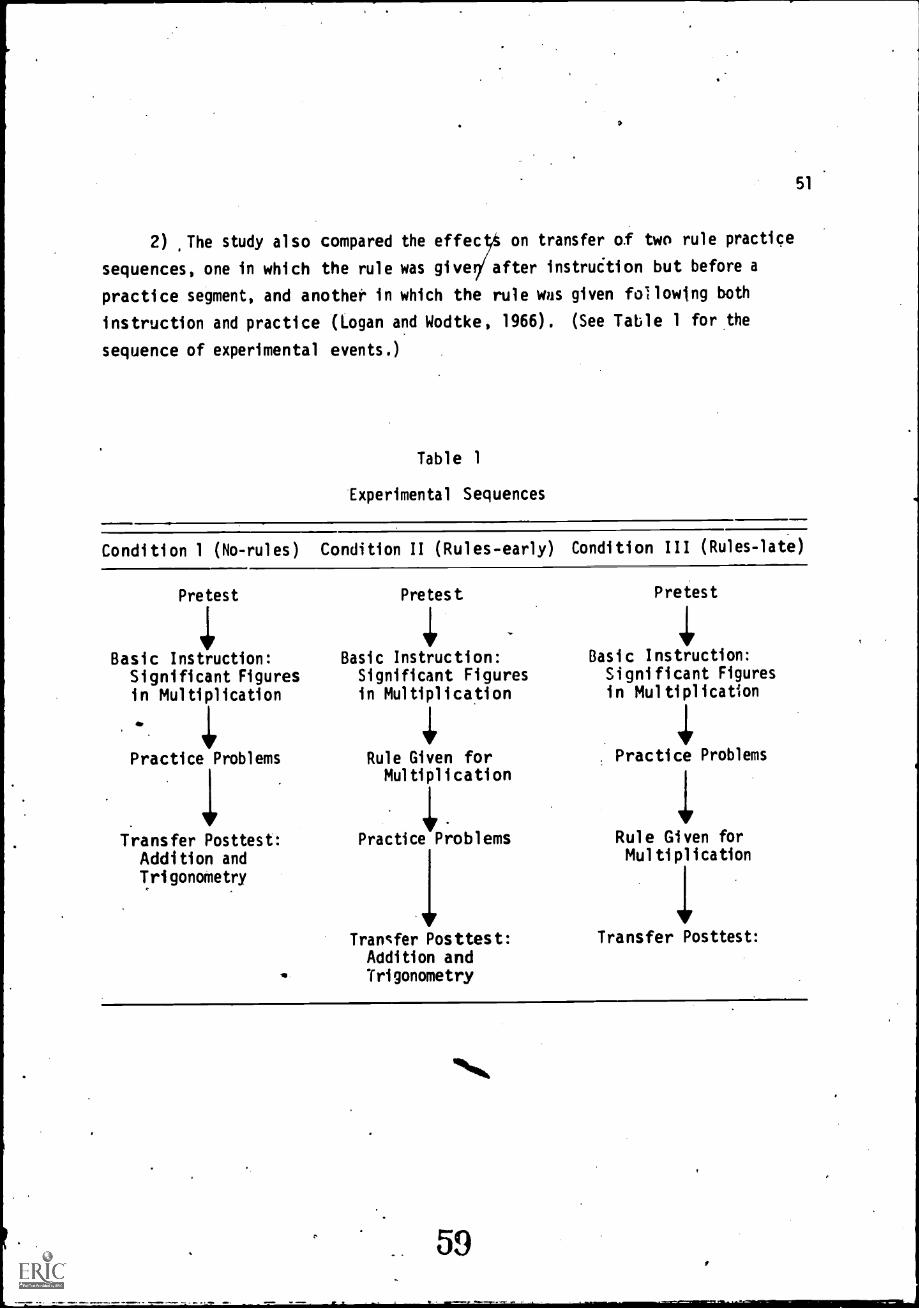
51
2) The study also compared the effec on transfer o.f two rule practice
sequences, one in which the rule was give after instruCtion but before a
practice segment, and another in which the rule was given following both
instruction and practice (Logan and Wodtke, 1966). (See Table 1 for the
sequence of experimental events.)
Table 1
Experimental Sequences
Condition 1 (No-rules) Condition II (Rules-early) Condition III (Rules-late)
Pretest
Basic Instruction:Significant Figuresi n Mul tipl i cati on
Practice Problems
Transfer Posttest:Addition andTrigonometry
Pretest
Basi c Instruction :
Significant Figuresin Multiplication
Rule Given forMul tipl i cati on
III
Practice Problems
Transfer Posttest:Addition andTri gonometry
Pretest
Basi c Instruction:Si gni fi cant Figures
i n Mul tipl ication
Practice Problems
Rule Given forMul ti pl i cation
Transfer Posttest:

52
This comparison was designed to test the hypothesis that the addition of
a rote rule-of-thumb to an instructional program winch strives for under-
standing will, if it comes before the studeint is given a chance to Use his
basic understanding in practice problems, produce a decrement in performance
on transfer tasks.
Another phase of the .investigation examined the hypothes! s that a condi-
tion in which a rule was gi ven before practice 'would have a more detrimental
effect on transfer than a condition, in which the rule was given after practice.
This hypothesis was based on the supposition that students would, if given the
rule before the practice problems," practice using the rule, and !would not
exercise the problem-solving strategies,developed in the basic instruction. On
the other hand, students who did not have the rule aval lable until after the
practice session would be forced to solve the practice problems using the under-
standing of significant figures which was developed by the basic program. This
hypotheiis was not confirmed.
Conclusions
1) The presence of a rote rule-of-thumb in an instructional sequence
designed to facilitate transfer to problems which were not specifically taught
in the program, and to which the rule did not apply, produced a marked decre-
ment in performance on the transfer tasks. The decrement on the transfer tasks
was obtained by comparing an instructional program containing a rote rule-of-
thumb with an identical program containing no such rules. The transfer decre-
ment occurred in spite of- the fact that the students were given a didactir.
warning indicating that the rule would not apply on the transfer problems. The
results of the studif indicate that didactic verbal warnings to students have
little effect on their behavior in an actual transfer situation. The authors
believe, that the results of the present study are fairly typical of actual
classroom teaching practice, and that much.more care should be taken in pre-
paring instruction which involves the use of 'rules-of-thumb in problem solving.
2) "the present resul ts indicate that it makes little difference whether
the rule-of-thumb precedes practice or follows practice. In either case the
presence of the rule inhibits performance on transfer tasks when compared to a
group taught without the use of rules. For example, if one examines the
60
53
percentage of naive students in each experimental group which reached "mastery"
on the addition transfer tasks, mastery being defined as perfect performance,
one finds that only 20% of the rule-late group, 20% of the rule-early group,
but 75% of the no-rules group reached mastery!
3) A supplementary examination of the responses made by the students in
the transfer tasks indicated that the poor performance of the rule-groups
resulted to a considerable extent from their misuse or- overgeneralization of
the rule. The misuse of the rule occurred even though students had been warned
several times concerning the inapplicability of the rule to the transfer situa-
tion.
The writers do not take the present results to indicate that computational
rules or algorithms should not be inclucied in quantitative instruction, tut
only that teaching students to use such rules appropriately requires special
instructional procedures which are frequently omitted in actual practice. The
apparent tendency of students to overlearn a simple rule-Of-thumb at the expense
of their basic understanding of the processes involved would seem to indicate
that much more care should be taken in the preparation of instructional
materials designed to produce basic understanding and transfer of training., The
results of the present study are probably most easily interpreted as a case of
the students' failure to discriminate problems in which the rule applies from
problems in which the rule does not apply. Perhaps the optithal instructional
program would provide the basic understanding, useful problem solving rules,
and the discrimination-training needed to help the student avoid instances of
rule misuse. Most instructional situations do not provide the discrimination
training necessary to reduce the frequency of rule misuse. It is quite evident
in the present results tfiat this objective is not achieved by simple didactic
verbal statements. As a general recomendation for teachers in quantitative
subjects, if simple rules-of-thumb are to be taught, much discrimination
training in the use of the rules will probably be necessary in order to avoid
the students' tendencies to blindly apply the rules without regard to the
appropriateness of the situation.
Although one might presumably argue that the present results indicate
that rules-of-thumb should be avoided in quantitative instruction.altogether,
there are obviously many problem solving situations in which such rules have
61
1
54
great utility. Ideally, a student should be able to capitalize on the
increased efficiency provided by the.rules in problem solving, but he should
also be able to select the appropriate rule for a particular problem, and be
able to rely upon his basic understanding of the processes involved when he
recognizes that no existing rule applies.
Educational Variablei
Purpose
The primary purpose of the present study (Gilman, l966) was to compare an
instructional program prepared by means of IBM's Coursewriter language for CAI
presentation with a more conventional programed text. The feedback, prompting,
and correction procedures available in' the Coursewriter language were expected
to produce increased student motivafion, attention, achievement, and retention
over time. The branching and decision-making capability of CAI was not examined
in the present study.
Method
Subjects. The subjects were 66 ninth and tenth-grade students in the
college preparatory curriculum at State College Junior High School. All were
naive with respect to educational experimentation procedures and none.had
received instruction in physics., All Ss who began the experiment completed the
experiment.
Design. Subjects were randomly divided into three groups. The randomiza-Ytion was accomplished by the use of a well-shuffled stack of student data cards.
Ss were pretested with the ten-question pretest. No S'answered more than 3
questioni correctly and most answered all responses incorrectly.
.Two of the groups received instruction by CAI programs. The.first of these
(CPF) received contingent feedback and prompting and students were required to
answer the item correctly before proceedi.ng. The second group (KCR) received
instruction by means of a CAI program providing a statement of the correct
response. The third group (text) rineived instruction through a programed text
containing material and feedbackidentical to that of the KCR program. In all
three groups, the instruction was completed in a singlerlesson.
69

55
All instruction was "stand alone" instruction in that no other instructionwas provided other than the programed course. There were no difficulties withany of the equipment used during the experiment and the CAI groups experienced
no down time or delays.
(Conclusions
The major conclusions of the study may be sumarized as follows:1) No differenCes in learning and retention were obtained for a CAI pro-
gram which incorporated response-contingent feedback, prompting, and overt cor-rection procedures on the part of the student when compared to a CAI programwhich simply typed the correct response following a student response and pro-ceeded to the next frame.
2) No differences in learning and retention were obtained for a conditionin which an instructional program was administered.by a teletypewriter comuni-cation device as compared to a condition in which the material was presented bymeans of a programed text.
3) The conditions.in which instruction was presented by a CAI comunica-don device took signifiCantly more instructional time than the programed textcondi tion.
The results of the present study appear to be consistent with the resultsof Swets. (1962), Swets, Harris, McElroy, and Rudlow, (1964), and Stolurow and
Davis (1960). Shurdak (1965), however, employed an instructional program whichcontained branching to adapt to the individual learner, diagnostic and drillquestions, and cqmputer-controlled and optional review. Shurdak's more
adaptive program probably accounts for the superiority of his computer-basedinstruction group over programed and conventional text groups. The present
study did not examine the branching question, but only compared differentstrategies for correcting student errors and providing feedback to the learner.The present findings bear on the question of the nature of feedback and cor-rection procedures. These results tentatively Suggest that less elaborate andstraightforward feedback and correction procedures may be as effective as the
more elaborate prompting, response-contingent feedback, and overt correction
procedures.
56
Tykewri ter Interface
Nature and PurposeFiTEFe: Study
For individuals not familiar with CAI terminology, the term interface
(Wodtke and Gilman, 1966) refers to the input and output devices through which
the subject matter is presented to the learner.and through which the learner
makes his response. The interface might include auditory communication devices,
visual communication devices varying in sophistication from simple slide pro-
jectors to CRT displays, two-way typewriters of the type currently (circa, 1966)
in use at Penn State, etc.
In discussions of the interface between student and subject matter in CAI,
the typewriter usually draws a substantial amount of time. Some of the disad-
vantages which have been attributed to the typewriter interface are "penalizes
the nontypist," "inappropriate for use with young children," "too slow 'in trans-
mitting information to the student," etc. Some of the advantages ascribed to
the typewriter interface have been "provides for constructed response," "permits
remote teleprocessing," "provides hard-copy for the student," and so on. Some
of our preliminary research raises some questions concerning the efficiency of
the typewriter interface.
Several studies are presently heing conducted on various problems related
to individualized instruction. Two of the studies provide preliminary data on
the efficiency of the typewriter as a communication device for high school and
college level instruction. Table 2 presents part of the data of one study
which compared equivalent instructional materials presented "on-line"1
and
"off-line" in the form of a programed text. This comparison is shown in rows
A and B. Row C contains a condition we call a "linear coursewriter" program
administered "on-line." This program differs from A and B in that each frame
contains several prompts and cues designed to elicit a correct response from a
student who initially makes an error. Condition D, a branching coursewriter
1"On-line" in the present context means that all instruction was taken via
CAI at the typewriter interface. "Off-line" means that the course was takenln the form of a prqramed text.
64

57
Table 2
Comparison of Mean Posttest, Retention Test, andInstructional Time for On-line_and Off-line
Instruction in Technical Physics(High School Student Sample)
Pretest Posttest 6-week Retention
MeanInstructionalTime (minutes)
(A) Linear Programedtext (off-line)(n . 22) 1.06 20.6 17.0 42
(B) Linear Programedtext (on-line)(n . 22) 1.09 20.0 15.3 52
(C) Linear CoursewriterProgram (on-line)(n = 22) 0.91 21 9 17.9 68
(D) Branching CoursewriterProgram (on-line)
n. S. n. S. n. s. P <.001
program, was included in Table 2 to indicate the direction of future research.
Through condition D we eventually hope to produce a program which adjusts
instruction to relevant individual differences among learners to produce maxi-
mum achievement in a minimum amount of instructional time. The subjects in the
study were high school students. The instructional program was relatively
"rOnverbal," consisting primarily of short questions and verbal communications.
Table 2 shows that although the posttest and retention scores were non-
significantly different for the three groups, that the variations in instruc-
tional time were highly significant. The time lost by administering the same
material via the typewriter interface was 10 minutes.i
(If two extreme subjects
are eliminated from the "off-line" group the mean time drops to 35 minutes.)
Comparing conditions B and C indicates-that' we lose another 17 minutes by
adding prompts and by requiring the student to produce the correct response by
typing it into the machine.
65

58
Similar data from.another study using a small ,sample of college students
and a-program with longer typed questions and mes'sages obtained a mean time
"off-line" of 51 minutes (n = 8) and a mean time "on-line" of 80 minutes
(n = 7). Several of thg students in the "on-line" group took a short five-item
pretest and five-item posttest which is included in their time, however; an
adjustment for this additional activity still leaves a rather substantial time
difference.
These time differences can be reduced to some extent by programing to
eliminate a number of typewriter carriage returns which are currently built
into our programs (each taking approximately 1.3 seconds). The time differeoces
may also be reduced after students have had more experience working with the
typewriter terminal and are able to operate it more rapidly. However, some
portion of the time loss is undoubtedly due to the large difference between
the typeout rate of the typewriter (approximately 120 words per minute) and
the reading speed of the typical high school or college student. 'The average
highly verbal student appears capable of assimilating information.at a rate
considerably faster than can be communicated to him through the typewriter
interface. Obviously the instructional time lost will be greater for subject
matter which is highly verbal in nature, and for highly verbal students. It is
impossible to estimate the exact extent of the time loss for different subject
matters at the present time. Admittedly, our data require replication with
larger samples of students.and different subject matters. However, in.an area
of research where instructional manipulations generally produce only small
gains in student,achievement, a time loss of the order of 25 percent represents
a substantial amount. Students could be given 25 percent additional practice,
instruction on new material, practice on transfer problems, etc. In addition
to the gains in student learning which might result from a more efficient use
of instructional time, there are also economic considerations in the cost of
computer time, tie-lines, and other "hidden" costs involved in the preparation
of the courses. All other things being equal, by employing an interface which
would increase the amount learned per unit of time by say 25 percent, four
students could be taught for every three taught by means of a typewriter.
It is also important to realize that from the college student's point of
view, learning at a typewriter terminal is not self-paced instruction since he
66

59
must slow down his normarrate of work _ Pacing instruction below a student's
optimal'rate could produce boredom, negativism, and avoidance of CAI as.an
aid to learning. This, is not an.uncommon finding when the pace of classroom
instruction by the lecture method is ,too stow for the brighter students.
What are the possibilities for speeding up instruction using a typewriter
interface? We have considered the possibility of putting all lengthy; typed
communications, and possibly all st,mus materials on slides for more'rapid.
presentation to students. Two factors weigh against this proposal: a) the,
slide production and duplication problem becomes immense for any full length ,
course used with a number of students simultaneously; b) the presentation of
questions, problems, and other messages-v a the slide projector leave the stu-
dent with no hard-copy as a record of his work..'It would be much- simpler to
put all course materials in a display book and use the typewriter solely to-
direct the student to a particular question, problem, or'display, and as a
response input device. Following this strategy, the .CAI systemmould not be
used to display instructional material, but to evaluate student responses and
to refer the student to appropriate display materials according to his progress
in the course.
Another question which is frequently raised concerning the typewriter
interface is the extent to which typing ability affects student performance.
In the first study described above, students were identified as typists or non-
typists on the basis of interview data, A Comparison of the posttest achieve-
ment and retention scores of typists and nontypists..showed nO statistically
significant differences This finding is not surprising since the responses
required in most of.our programs are relatively short one-word or at.most two-
word reponses. However, as might be expected, typing ability does appear to
relate to the time variable particularly when the program requires much-inter-
action between the student and the subject matter through the typewriter inter-
face. Table3 shows the mean times for typists and nontypists in programs B
'and C. Program B was the linear program which required only one response per
frame; program C was the course which was programed to anticipate student
errors, and to elicit a correct response by means of successive prompts. The
time difference for typists and nontypists was 2 minutes on the aVerage far
program B, and l2 'minutes on the average for program C.
67
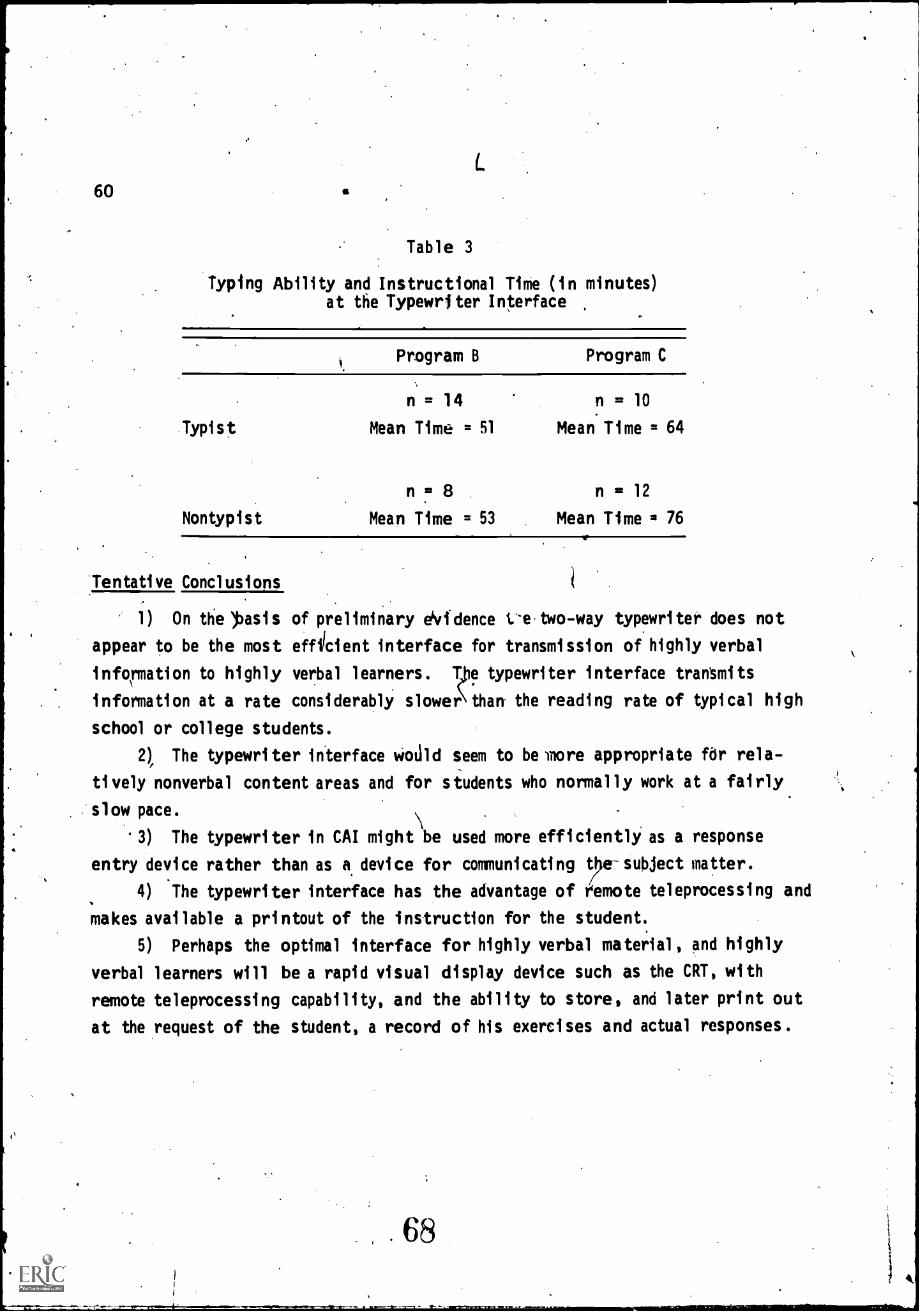
60 a
Tabl e 3
L.
Typing Ability and Instructional Time (in minutes)at the Typewriter Interface
Program B Program C
Typist
Nontypist
n = 14Mean Time = 51
n = 8Mean Time = 53
n = 10Mean Time = 64
n = 12Mean Time = 76
'Tentative Conclusions 1
1) On tbel.lasis of preliminary eVidence 1..-etwo-way typewriter does notappear to be the most efflicient interface for transmission of highly verbalinformation to highly verbal learners. Tpe typewriter interface trantmitsinformation at a rate considerably slower than the reading rate of typical highschool or college students.
2), The typewriter interface wotild seem to be .more appropriate fOr rela-tively nonverbal content areas and for students who normally work at a fairlyslow pace.
3) The typewriter in CAI might be used more efficientlY as a responseentry device rather than as a. device for comunicating subject matter.
4) The typewriter interface has the advantage of eemote teleprocessing andmakes available a printout of the instruction for the student.
5) Perhaps the optimal interface for highly verbal material, and highlyverbal learners will be a rapid visual display device such as the CRT, withremote teleprocessing capability, and the ability to store, and later print outat the request of the student, a record of his exercises and actual responses.
68
41

Purpose
It is. appropriate to scrutinize the particular characterittics of a givensystem to deterMine whether,or not there can be or is tmprovernent in learning.
.Many of these characteristics or Variables cannot be judged in terms of pre-vious experimentation in the field of'educational psychology because they existonV in CAI. Further, studies conducted in laboratory situations cannot.bereadily transfurred to an educational .environment. This study (Hall , Adams,
and Tardibuono; 1967) attempted to remove one learning experiment from the .
artificial world of animal laboratories and nonsense syllables and to place itin an educVnal context.
Gradient- and Full-Response FeedbackTO-nputer-Assisted Instruct on.
61
Method
Programs were written for investigating the effectiveness of these twokinds of feedback - gradient- and full-response feedback. A paired-associate
learning task was employed using fifty pairs which the student learned. Thefifty state names of the United States .were presented as stimulus items, andthe student learned to respond with the names of the capitals. The items were
presented individually, in random order, to the student at tht typewriterterminal. If the student resPonded correctly (acquired) on his first attemptto that stimulus, it would be dropped from the program. The program recycled
until each student had responded correctly on his first attempt to eadh of,the
items during one cycle. The number acquired on the first cycle through theprogram was used as a pretest score. After the Student acquired each of thefifty pairs, the entire list was presented as a posttest. A retention test wasadministered to each student two weeks after the initial treatment. The pro-
gram for each of the experimental treatments contained the following features:
1. A list of wann-up items consisting of five foreign countriespresented as stimuli and their capitals as response items.
2. A typing test which recorded the student's time and accuracyin typing an alphabetic sentence consisting of' 74 computercharacters.
69

62
3. A progress report to the student after each cycle consistingof:
a. total number of responses;'b. total number of stimuli presented;c. total number of items acquired;d. total response latencY;e. current clock reading.
4. An automatic 5-minute break approximately halfway throughthe task.
5. An automatic connection to a system-administered studentopinion surveY (SOS) regarding CAI.
Subjecs
On the basis of variability data collected during a pilot study, it was
estimated that a minimum of ten subjects in each experimental gr6up would be
'needed for statistical purposes . A total of 24 students from. the Wi 1 1 iamsport
Area Community College and the Al toona Campus of the.University were included
in the study and were' randomly assigned to the experimental treatments .
Prbctors who administered and supervised the students at these locations were
giVen *speci fi c instructions to read to the students participating i n the study.
CAI proctors from the two campuses solicited volunteers to participate in
the experimental study. The students were told that the study would require a
maximum of four hours and that they would be paid a flat rate of $5.50 regard-
less of how much actual time it took theni to complete the study. The students
were randomly assigned to one of the:msperimental -treatments. The proctors
assisted the students with the initial' registration procedure. The students'
typeouts were returned to the course authors for analysis.
The following summarizes the variables and their 'parameters which were of
concern in this study:
1. Pretest, posttest, and reteation tests:, all contained the sameitems-;.the names of the 50 states of the United States with a.possible high score of 50 and a possible low score of 0.
2. Total number of stimuli presented: fifty stimuli (state names)were presented to each subject on the first cycle through the
material. Those to which he responded correctly on his firstattempt were not presented again. Those to which he respondedincorrectly were retained and presehted again during the nextcycle of the prograM. The minimum number presented was 50; themaximum was unlimited, determined by each subject's perfOrniance.
70

-
1
1
63
3. Total number of responses during instruction: each time a stimuluswas presented a response was required from the subject. Feedback
was presented after each incorrect response and additional responseswere required until the correct response was made. The minimum
number of responses was 50; the maximum was unlimited but based (Ineach subject's performance.
4. Total instructional time: includes the elapsed time from whenthe first item was presented until the final correct response wasmade.
5. Student opinion survey: a 20-item multiple choice questionnaire.Each response was weighted from five to one to produce a maximumscore of 100 reflecting a strong favorable attitude toward CAIor a minimum score of 20 reflecting a strong negative attitudetoward CAI.
6. Response latency during instruction, posttest, and retention test:After each stimulus item was presented a green PROCEED light turnedon. The PROCEED light remained on until the subject pressed theEOB key to record his response. The time interval that the PROCEED )light was op was recorded as the responge latency for that item.The sum of these intervals was the total response latency accumu-lated during instruction, the posttest, and retention test.
Findings
There was very little difference in the two treatments based upon all of
these criteria eicept total instructional time. 'Although there is some differ-
ence in the total number of states presented, there is virtually no difference
in the total number of responses made in each experimental treatment. This
means that in the gradient feedback treatment the student was responding more
often to the same stimulus, but it was not necessary to present the stimulus as
often as was required for the students in the full-response feedback progra4.
An adjusted analysis of variance using the pretest scores as a covariant
was perfonned.on total instruction time. The pretest correlated -.847 with
total instructional time. The analysis produced an F-ratio of 15,3 which was
significant beyond the .01 level. For the analysis of the posttest data, the
pretest scores and the typing scores were used as covariants in n analysis of
covariance. A Kuder-Richardson formula 20 reliability estimate of .725 was
found for the posttest. The pretest correlated .468 with the pOsttest; the
typing test correlated .403 with the posttest. The adjusted analysis of
variance for the posttest scores resulted in an F-ratio of less than unity.
71

An adjusted analysis of variance was also performed on the retention test
scores (Kuder-Richardson formula 20 reliability estimate of .893) using the
posttest and the tiping test as covariants. The pottest correlated .675 with
the retention test, and the typing test correlated .592 with the retention test./
This analysis resulted in an E-ratio of 1.44, not significant at the .05 level.
Conclusions
Al though the treatment comparisons did not show statistical ly significant
differences in learning, there was a very strong difference in instructional
time for the two treatments. The response latencies also show rather striking
differences between the two treatment groups and hold some promise for Orecting
future research. The anticipated advantage for gradient feedback over.full-
response feedback did not materialize in this study. We are well aware that ,
additional investigations will be required before discarding the theoretiCally
sound idea of providing learners with, a graduated feedback..
Because of the problems encountered with remote locations it was not con-
sidered advisable to engage in further statistical analysis of the data although
they do suggest a trend. ,Silberman, Melaragno, Coulson, and Estavan (1961)
conjectured that some measures such as response latency are more appropriate
than error rate for making certain decisionsi,frithin.a program. Postman and
Egan (1949) point out that reaction time remains a sensitive Measure of the
readiness of an organism to respond. Using data of this kind has always been
a difficult process because of the technical problems involved in measuring
response latency and feeding the information back into the operating system for
decision-making purposes. However, with the development of computer-assisted .
instruction and the speed and flexibilities of such sYstems, this information
is readily available and can easily be used for making such decisions. It is
the intent of the authors to continue investigating these variables which seem
to hold promise for improving learning with .computer-assisted instruction.

65
1"
A Comparison of the Effectiveness of Five Feedback Modesin A Computer-AiiTsted Adjunct AuTE-iniTruct on Program
Rationale
Intuitively, it seems probable that the correction of errors in a program
should be beneficial to the student and that an efficient mode of feedback for
correcting'errors can be developed. This study used materials designed to teach
widely misdnderstood general science conceptsiGilman, 1967). Errors made by
the subjects'occurred as a result of misconceptions they had acquired in pre-
vious conventional instruction. It was thus possible to correct Ss' errors
without teacWing them erroneous material and without intentionally tricking
them into committing errors.
Sub ects
Subjects for the study were 75 students in teacher preparation curricula
(science teaching excluded) at The Pennsylvania State University. Ss were
'students in audio-visual classes and had no previous experience with computer-
assisted instruction.
Materials
An adjunct auto-instruction program was prepared to teach commonly Mis-
underStood general science concepts. The frames of the program were multiple-
choice iteMs. One response to each item was a correct response, one response
to each item was a common misunderstanding of the concept, and the other two
respOnses were plausible distractors.
The program caused all of the items to be presented on the first iterition
and all, items missed on the first iteration to be repeated on the second iter-
ation; all items missed on the second iteration to be repeated on the third
iteration, until the subject had answered all of the items correctly. Crite-
rion for the program was a correct response to each of the thirty items.
Procedure
Seventy-five subjects were assigned to fifteen strata on the basis of
scholastic aptitude examination scores. Five Ss in each strata were randomly
73

66
assigned to one of five treatment groups: a) no feedback; b) knowledge of
results feedback; c) knowledge of correct response feedback; d) response
contingent feedback; e) a combination of b, c, d feedback.
Independent Variables
Analysis of variance performed on data obtained from the scores of Ss on
The Pennsylvania State University Scholastic Aptitude Examination (obtained
from University files prior to the study) showed no differences between-treat-
ment groups at the .05 level of significance. Analysis was made of the correct
response scores attained by Ss immediately following the first iteration of the
30-item program (the pretest). No significant differencet were found among ,
treatment groups.
From this evidence, it may be concluded that there were no dffferences
among the treatment groups with respect to sCholastic aptitude, or to prior
knowledge of the concepts.
Rate of learning. In terms of the results obtained during the second
iteration and during the time spent by ST to reach criterion, there were stroni
indications that Ss who received feedback guiding them to the correct response
wv'e learning more effectively and performed better than did those who were
forced to "discover" the correct response. The means of groups C, D, and E are
significantly better at the .01 level of significance than those of groups A
and B on the following criteria:
Number of correct responses to second iteration of programNumber of responses required to attain criterionNumber of iterations of program required to attain criterionAccumulated response latencies on second iteration of program
These results and their level of significance clearly indicate some of the
advantages to be gained by instructing students with a feedback mode that guides
them to the correct response.
The results of these comparisons indicate the value of providing informa-
tion to students during a programed instructinn sequence. The findfngs are in
agreement with those of Holland (1965) who concluded, after analyzing several
studies, that if a student does not know the correct .answer, he might as well be
told it.
74

67
However, Klaus (1965) in describing the point of view of those programers
using the knowledge of results technique stated that they found no advantage
in showing the correct answers to learners who provide incorrect responses.
Klaus states, "Simple substitutes, such as the statement, 'you are correct'
should prove equally effective as a confirmation of the correct answer." In
other words, Klaus holds that the appearance of a correct answer serves as
reinforcement only when the response is correct; otherwise, the response is
wasted.
The poor results demonstrated by the knowledge of results feedback group
(Group B) in the present study raise questions as to whether this mode of feed-
back is adequate for an adjunct auto-instructional progrhm. Most of the studies
involving adjunct auto-instruction have utilized knowledge of results feedback
and have only informed the S whether his response was correct or wrong. This
type of feedbaCk has been utilized in many types of teaching machines. Data
from the present study, however, indicate that providing a student with a state-
ment of which response was correct, or providing him with a statement of why
the correct response was correct would be of more*value than merely telling
him "correct" or "wrong."
From, the analysis of the means of all of the variables in this study, it
is interesting to note that there was little difference between the means of
the knowledge-of-results feedback group and the no feedback group. In none of
the variables analyzed was there a significant difference at the .05 leyel
between means of groups A and B.
In the comparisons cited in the first part of this section as being indica-
tive of the advantage of using a feedback mode which guides the S to the cor-
rect response, there were no significant differences between groups C, D, and
E. Apparently the factor which accelerated the learning of Ss was "being
informed as to which response was the correct one." In all of these compari-
sons, however, the mean of proup E, the Combination of feedback modes group,
was only slightly, but not significantly better than the means of groulis C and
D, and in .all cases, significantly better than the means of groups A and B.
This finding is contrary to those of Swets and his co-workers (1962) who found
that "fairly extensive feedback may be,detrimental." However, Swets et al. used
a small step programed instructional sequence whfch resulted in few response
errors.
75

68
-he findings of the present study are in agreement with those of the pre-
viously cited study by Bryan and Rigney (1956). Although Bryan and Rigney
found response contingent feedback to be superior to knowledge-of-results feed-
back, they made no comparison of these feedback modes with knowledge of correct
response feedback.
The results of the present study clearly demonstrate some of the ineffi-
ciencies of using a "discovery" approach in teaching facts or concepts by an
auto-instruction program. Those Ss who were required to discover the correct
response demonstrated poorer performance than did those Ss who were merely told
the correct answer.
Time required for instruction. The results from the time required to com-
plete the first interation showed clearly that those treatment groups which
received long feedback messages (groups D and E) required significantly more
time to comOete the thirty items in the first iteration than did groups A,
B, or C. The time to criterion means show that Group C required significantly
less time than did groups D or E. and required the least time of the five treat-
ment groups.
The'time required for a student to receive instruction by CAL is a function
of the number of instructional frames he completes and also is a function of
the amount of time the terminal spends displaying messages. Several studies
have demonstrated that the operating speed of the IBM.1050 terminal is slower
than would be ideal for an interface between student and computer. The longer
feedback messages require much more time because of the slow (120 words per
minute) typing rate of the terminal. 4lowever, the new interfaces using CRT
display devices display verbal and graphic material much more rapidly than does
the typewriter terminal. Therefore, the additional time required by Ss in
groups D and E should be interpreted with caution, since better equipment may
soon eliminate those observed differences in instructional time.
The analysis of the data from the first and second iteration of the pro-
gram and during the entire sequence indicate that the principal difference
between the treatment groups is in rate of learning. Rate of learning may be
considered in terms of the amount of instruction that must be presented or in
terms of the amount of time required to complete the instruCtion. When rate of
learning is considered in terms of amount of instruction presented, then a
76

(
69
feedback method which guides the student to the correct response is clearly
superior to a feedback method which requires the student to discover the f.or-
rect response. When learning rate is measured in terms of the amount of time
required for instruction, a feedback method utilizing short messages requires
less instructional time per frame than does one utilizing long feedback
messages. However, this difference may be eliminated as better interfaces
between computer and student are designed.
Retention. The analysis of variance on posttest scores indicated that the
combination of feedback modes group (Group E) was superior to other feedback
and no feedback groups. Apparently the amount of Information the S derives
from the feedback is important id affecting retention.
Because many of the programs used in previous studies have been of the
linear low-error-rate variety, little work has been done to ascertain how to
deal with errors committed by the student during,a program. There have been
few studies dealing with "corrective" feedback in verbal learning. One study
found that providing the correct answer following an incorrect response is a
reinforcing event in the same way that confirmation after a correct response is
a reinforcing event. The results of the present study indicate the advantages
for learning attained by providing the correct response when the S makes an
error and also show the retention advantages of providing the S with as much
information as possible in the feedback messages. These findings disagree with
some studies that found that extensive feedback may be detrimental.
Results obtained from the posttest also indicate some differences favoring
the response contingent feedback groups. On the posttest, the response con-
tingent feedback group (Group D) received the second highest scores and scored
higher than any other treatment group receiving a single feedback treatment.
Group D accumulated significantly higher response latencies during the
first iteration 6f the program and during their performance criterion. Appar-
ently the Ss receiving response contingent feedback were contemplating their
previous feedback messages during the 'time period that they might have been
responding.
Relationship between analyzed variables and scholastic aptitude. Analysis
of variance showed only one significant difference for level effects--instruc-
tional time for the second iteration of the program. There was no apparent

70
pattern in the means of strata for the admissible probability score on the
first iteration of the program, but examination of the time to criterion means
for the 15 strata reveals a negative relation between scholastic aptitude
and time for the second iteration.
A low correlation between Ss' rate of learning and academic ability is one
of the desirable characteristics of computer-assisted instruction as expressed
by Mitzel. Mitzel hypothesizes that computer-assisted instruction
. . .at its best should offer a distinctly individualizedcourse of instruction in which gaps in the learner's know-
ledge are filled by means of diagnostic and remedialsequence steps. Thus, Wseems to be theoretically appro-priate to ask the typical CAI learner to achieve masteryof the content as long as we allow him a reasonable amountof time. (Mitzel, 1966)
Mitzel concluded that if examining is done at appropriate intervals
throughout the program, then every learner should have achieved mastery of the
content up to the limits of his capacity.
Further researchlis necessary to determine the effects of using various
modes of feedback to correet errors. Many forms of programed instruction
require the student to reveal, by making some sort of errort_the kind of
instruction he should receive nextn However, most typical programed instruc-
tion studies have been conducted with relatively error-free programs and little
is presently known about correcting student errors in programed instruction.
The present study should be repeated using a student terminal capable of
faster communication and response time than the 1050 terminal.
Also, the present study should be repeated using a delayed retention
measure in addition '6 the immediate retention measure.
The high posttest scores achieved by all groups, including the control
group, demonstrated the value of reiterating the program items until the stu-
dent had answered all items correctly. Several studies have demonstrated the
value of providing feedback on test items. The results of the present study
indicate that an additional advantage can result from having an S repeat all
unanswered questions until he has correctly responded ,to each one. This pro-
cedure provides a "drill" type of exercise in a test situation in addition to
providing feedback.
78

71
Effect of CAI un Natural Spelling Behaviors
Rationale
Although a field trial had indicated that the CAI 4el1ing course was an
effective means for two-year technical students to learn spelling, no attempt
had been made to examine whether the students transferred their increased know-
ledge of spelling rules (as indicated by criterion scores) to off-terminal,
non-test writing situations. Consequently, the investigation of transfer was
selected as the primary-focus of the present study (Farr and Hogan, 1967).
It was assumed that after the diagnosis and identification of spelling
errors, followed by remedial instruction, students would spell more accurately
than they'had in non-test, writing situations before instruction. Further, it
was assumed that students who were merely informed of the number and kinds of
spelling errors that they had made on the pretest would show less improvement
in non-test, writing situations than the students who had been given the same
'information and also received prescribed remedial instruction. Accordingly,
the main dimension investigated in this study was the difference in 'the extent
to which the instructed students transferred their demonstrated spelling skills,
in contrast to those who had not been instructed.
Method
The materials used in this study were of three types: a) two samples of
expository writing done by the students on topics they.selected from a list
provided; b) selected segments of the CAI spelling program; and c) a 44-item
attitude question aire about CAI.
The topi for these writing samples were deliberately planned by the
authors to center the attention of the students on the thought content of their
writing, rather than on spelling or other mechanics of composition. Further-
more, no mention of spelling was made when the writing.assignments were gilien, .
and the,attitude questionnaire was concerned with CAI and the students' reac-
tions to it, rather than to any aspect of spelling.
From the CAI spelling program,.all of the students were given three
segments on-line: orientation, word study, and the diagnostic test. Tpe first
segment was a short one dealing with orientation to the terminal 'Equipment and
79
:sit 6 ,
f
IC
7
(

72
its operation. The second segment priovided the students with further oppor-tunity to familiarize themselves with appropriate on-line procedures, as wellas preparation for maximum benefit from spelling study. The diagnostic, segment
consisted of a 37-word test which included 50 possible error items representingnine Categories of spelling errors. For example, the word "piece" was desig-
nated as both' a possible homonym error and as a possible "i-e" error.In addition to these three segments, the students in the experimental
group took the on-line instruction prescribed by their diagnostic test per-`formances, and a 37-word 250-item, on-line posttest similar to the diagnostictest.
The 48 students participating in this studY were enrolled in post-highschool, two-year technical programs. The experimental group consisted of 23
students; the control group contained 25 students. Two of the experimental
students were women; one of the control students was a woman.
Resul ts
The effectiveness of transfer from this CAI spelling program was assessedon two dependent measures: a) performance.on the spelling pretest and'posttest(minimal transfer); and b) performance on two writing assignnients (remote'transfer).
Spelling te,st data for the experimental students were analYzed within a2 x 2 factorial design (two student groups x two test scores and/or Pretestand posttest scores) with repeated measures on one factor (preteit andposttest). The results of this analysis indicated that there was a significantimprovement in spelling test.performance on the CAI posttest (p <.05). How-
ever, when absolute criterion performance was examined, it was found' that the
experimental students had entered the program performing at a 66% level ofr
accuracy, and tfieir end-of-program criterion performance was only76%. These
results indicate that some learning had occurred, but that the students' diffi-culties withtselling had by no means been erStirely eliminated.
Conclusions
The main conclusions from this study to investigate the effectiveness oftransfer from this CAI spelling.course were: a) students in two-year
80

73
technical courses dethonstrated a significant improvement in their spellingabilities as measured by spelling tests, after they had received instructionfrom this CAI program; and b) when they were not specifically told, on writingassignments, that "spell ing counts," post-high school technical students- madefar more errors in certain categories than they made in those categoriesduring test situations.
Because, for the non-test writing samples gathered in this study, studentswere free to use--or not to use--any words they wished, it is reasonable toconclude that the ones they used are the words they "need" to know how to
spell: the very words that formal spelling instruction aims to teach. Like-
wise', the large number of errors appearing in the writing samples can be takenas in indication of the failure of traditional, classroom spelling instructionto achieve its commonly stated goal of teaching "needed" words.
The-novelty of CAI experience and the appeal .of its technology for studentsin technical courses did not produce a markedly.greater,amount of transfer ofspelling ability to non-testsituations than had other methods of instructionearlier in the students' ,educational experiences. This, however, should not be
regarded as failure of this CAI course.. UnanimoUsly, on the attitude question-. .
naire students indicated that they felt that spelling was a subject that could
be effectively taught by CAI, and their score.s indicate that it was. Since,
CAI does not seem to affect their spelling in general writing situations-anymore than any other method of instruction, it might be of particular value to ,
confider the ways in which students--and teachersappioach spelling instruction.Such consideration is recomended if the present CAI course is rivised in thefuture.
Perhaps; if adults who are in need of remedial spelling'-are to be "all-around"' competent spellers, the spelling course must include an attempt atattitude change, so that spelling is accepted as a skill with "all-around"importance, Otherwise, for many students, and especially for students in tech-nical courses, spelling is likely to remain a subject in which students do as
well as possible only on spelling tests and in situations where they know that
"spell ing diuntS. "

I.
74
Comparability of Computer-Assisted andConventional"Test Administration
Purpose
The purpose of the research reported here was to compare conventional
group administration and computer-assisted administration of a test of crea-
tivity (King and Rabinowtiz, 1968).
Method1
Two separate ktudies were conducted using different Ss and slightly differ-
ent procedures. They used the same basic measures and analysis, however, and
thus mai be presented together. Study I was a preliminary effort to the larger,
more extensive Study II.
Subjects
Study I used 37 paid volunteer male tech ical education (two-year program)
students enrolled at The Pennsylvania State Uni'e,rsity. Random assignment was
made tO either a computer-assisted or a conventionihtNtt administration con-
dition. Study II used 107 (36 men, 71 women) volunteer undergraduates enrolled
in baccalaureate programs at The Pennsylvania State University. Ss within each
sex were randomly, assigned to the two test conditions to insure equal propor-
tions of men and women under each condition.
Analysis
The problem of determining whether computer-assisted testing and conven-
tional testing are directly comparable is really a problem of, determining the
equivalence of two forms of the same testone idministered by computer and the
other b4conventional procedures.
Medley (1957) has proposed a Procedure for' testing the equivalence of two
tests which examines four criteria: equality of means, equality of variances,
equality of errors of measurement, and "homogeneity of function." The pro-
cedure is based upon a two-factor analysis of variance with repeated measures
on one factor, and is especially appropriate for use in studies of the type
reported here where carry-over effects necessitate the use of different sub-
jects for the two test forms (or in this case two modes of administration).
82
75
In the present experiment. the Medley test for equivalence was applied
in both Study I and Study II to compare the performance of the computer-
assisted and convention41 groups of the Remote Associates Test (RAT) Form I.
The two administration modes couplediwith the 30 items of the RAT resulted in
a 2 x 30 factorial design, with repeated measures across subject. In the
Medley procedure each of the four j ri teri a for equivalence (equal means, equal
variances, equal errors of measurement, and homogeneity of function) can 6e
stated as a null hypothesis, and if any are rejected the tests in question
cannot be regarded as equivalent. If all four null hypothesis cannot be
rejected then the overall hypothesis of equivalence may be accepted. The four
F-ratios corresponding to the four hypothesis were calculated and tested for
significance in both studies. .
Additional correlational analyses were performed in Study II to determine
the existanCe of possible diZerential. relationships between the two adminis-
tration modes of.the RAT Forlirl and the four reference measures. Pearson
Product-moment Correlation Coefficients were calcul'ated between each of the
reference measures and each, mode of administration of theRAT Form 1,"and all
pairs within administrations were tested for significant.differenceS with z-
transformations.
Resul ts
The means and standard deriations for all administrationt compared favor-
ably with Xhose reported by Mednick and Mednick (1967) in the normative data
for col 1 ege undergraduates . Hoft internal cons i stency reliabi 1 i ty estimates,
calculated from-the analysis of variance format used for the Medley procedure,
were found to be' slightly lower than odd-even split-half coefficients reported
by Mednick and Mednick.
One noteworthy comparison that can be made is the high degree of similar-
ity between the performance of the techniCal edUcation Ss in Study I and the
baccalaureate program Ss in Study II. Students enrolled in two-year technical
education programs are generally believed to be less intellectually capable
than four-year students. Although many 'variables were uncontrolled between
Studies I and II the results would appear to indicate that in at least one
dimension ,of intellectual functioning the two-year students compare quite
closely with four-year students.
83

76
Tabl e 4
Medley .Equivalence Analysis
. Analysis of Variance: RAT Fonn 1
Source df
Study I
df
Study II
MS MS
Conventional Administration
SubjectsItemsError
CAI Administration
SubjectsItemsError
17
29
493
. 184
29
522
1.00.80
.19
.i. .731.04.
.19/
1.37a
1.00
V
53
29
1537
5229
1508
.88
1.99
.19
1.082.57
.18
.81a
b**1.06
/
Combined Groups
Subjects 36 .85 106 .99
Items 29 1.63 29 4.18Error 1044 .19 3074 .19
Analysis for TestingEquivalence
.-
Administrations. 1 .2629c
J 1.32 Y34cSubjects (withinadministrations) 35 .87 105 .98
Items .
Error Between29
29
1.63. .21 1.10
d29
29
' 4.18.38 2.11
d**
Error Within 4015 .19 3045 .18.
aF ratio formed by comparing MS for sjubjects under conventional administration with MS.for subjects under
CAI administration. Actually a test for.fiomogeniety of variance.
bF ratio formed by comparing MS for error under conventional auministration with MS for error under CAI
administration. Actually a test for homogeniety of the variance of errors of measurement.
ceF ratio 'formed using-subjects within administrations as a conventional error term. A test' for equality
of means for the two administration conditions.
dF ratin formed using error ./inin adrioistratiens as a cnnveotional error term. A tpct fnr hom000niety
of function which compares the rank order of item difficulties for the two administration conditions.1
** E <.01
4,0

77
The Medley equivalerice analysis and the calculation'of the F-ratios usedto test each of the four equivalence criteria necessitated dividing the overallanalysis of variance'intoseparate analyses representing each mode of adminis- .
tration, and an analysis representing the 'combined administratfons. The firstcriterion of interest, equality of means for the two administration modes, wastested by comparing the variance between administrations with the variance for,Ss withiniadministrations. The resulting F-ratios for both studies were non-significant, indicating failure to detect differences with respect to the meanperformarices under the two modes of, administration. The second criterion,equality of variances, was tested by forming an Fe-ratio >from the mean square'
for subjects in earh of the separate mode analyses. Again, the F-ratios forboth studies were nonsignificant, and the conclusion is that the variances forthe two modes of administration are not reliably different. The third crite-rion, equality of measurement error variances, was tested by an F-ratio, formedfrom the error terms in each of the separate mode analyses. Here a significantF was obtained for Study II, but since the lialue of the F was only 1.06 wfth
1537 and 1508 df the difference is probably. not-of great consequence. Thus,
the criterions of equal error of measurement variances also appears to be'reasonably satisfied. The final criterion, homogeneity of function, was testedwith an .F-ratio formed by comparing the error 6etween admfnistrations with theeri'or wi-thin administrations. A sigpificant F was obtained for Study II indi-cating that the item difficulty rankingS were not the same for both 'modes ofadministration. Items proving very difficult under computer administration .
were apparently slightly easier under conventional administration and vice,versa. The resulting concluSion is that in Study. Il the RAT Arm 1 was notmeasuring identical functionsnder the two modes,of administration.
Additional .correlational analyses performed in Study II resulted in cor-relations between each of the administrations of the'RAT Formal and each of, the
refer.ence measures correspond .(in the case bf the first three reference mea-sures) roughly with those reported by Mednick and Mednick. The cOrrelations
between the RAT Form 1 and the RAT Form 2i. are slightly loWer than reported inA
the Test Manual. The fourth reference measure, Flexibility, does not appearto correlate with the 'RAT. All four correlation pairs between admiriiitrationmodes were tested for significance, 'and none of the differences proved

78
.1
significant. Thus, there is no evidence to indtcate that the parallel forms
reliabilfty or the validity of the RAT are any different under computer admin-
istration than under conventional administration.
In sumary, the study reported here does not present any evidence to in-
dicate that coniputer-assisted test administration introduces neW 9urces of
variance that markedly modify the statistical properties of a test as deter-
mined through conventional administration.
Numertcal and Verbal Aptitude TestsAdm n stered at IETT7a-31Tia-erTa.:TERTon
Purpose
-The purpose of this study (French and Tardibuono, 1968) was to arrange
tests using multiple choice, numerical, and verbal items, in a program so that:
1) the average number of items attempted by each student will be
significantly less than the number of items traditionally required by
a test of similar content (in this dase, the Henmon-Nelson Test of
Mental Ability);
2) the test will take significantly less time to administer
than the traditional test;
3) indices of reliability obtained by means of internal con-
sistency formulas (KR 20) will be higher for COMPAT (Computer Admin-
istered Test) than for those reported in the manual for.the Henmon-
Nelson tests; and
4) there will be a significantly high correlation between each
COMPAT and the Henmon-Nelson Test, and between each COMPAT and stu-
dent performance in other academic activities.
The SamOle
One of the practical limitations encountered in the first phase of this
project was the availability of subjects of the approprtate age and educational
level willing to take time for research .projects. Since this project focuses
- 86

79
on the feasibility of developing short, highly reliable tests, vocational-
technical school subjects were not sought. The 73 subjects used in this
reporting period included Iligh school juniors and seniors, hou.sewives, and
undergraduate and graduate students.from Penn State. It should be noted that
80 subjects took the various tests. However, systems difficulties and loss of
subjects reduced the number to 67.
Procedure
Each subject took five tests: 1) the Henmon-Nelson College Level, Form B,
2) Verbal 80, 3) Numerical 80, 4) Pretest, and 5) Verbal A, B, C, or D. The
directidns for the Henmon-Nelson are containe'd in the test booklet which each
subject read himself. For the COMPAT tests, each S was shown how to operate
the terminal; how to respond, and how to correit a mistake. He was instructed
as follows:
You will be shown 'questions, either verbal or mathematicalon the screen at your left. As soon as you have the anSWer,type the number indicating that_ answer', then press EOB; thenext question will then be.shown. If you wish to change ananswer before you press EOB, follow the procedure previouslydescribed. Remember once' you press EOB you will not be ableto change your response. There is a time limit for eachquestion; but if you work steadily, you need not rush. I
will be in the next room if any complications arise. Any
questions? You are how ready to begin.
Due to the length of time necessary to complete all five tests, most f the
subjects returned for a. second session. The availability of computer tme as
well as consideration for the subject's schedule made exact inteevals between
sessions Jmrractical. Each subject was,paid a flat rate of $3, unless system
failures necessitated returning for a third session in which case payment was
made at the rate of $1.25 per hour.
As each S entered the terminal room, he was given either the Henmon-
Nelson College Level, Form B, the pretest, or assigned to one of the computer-
administered tests. Due to the varying lengths of time subjects spent on each
of the tests, it was not practical'to randomize fhe order of the tests.
87

80
Results
To achieve goals 1 and 2 required theadministration of relatively few
items in a relatively short period of time when compared with the administration
of the conventional format of the Henmon-Nelson. In conventional format the
Henmon-Nelton test provides 100 items and allows no more than 40 minutes of
'working time. While not all subjects attempt the 100 items, it is assumed-that
as subjects run into difficult items they scan the remaining items in hopes
that.they can find some which they can answer. With the COMPAT procedures, the
mean number of items attempted varied from 23 to 30 and the mean number of
minutes varied from 21 to 31. Relatively large standard deviations were
observed for both number of items attempted and time spent on the test. The
objectives of constructing a test with fewer administered items than on the
criterion test was realized. When the numerical test and verbal test were
added together, a mean of 57 items was obtained.
Time was obtained by subtracting "sign-on" time from "sign-off" time.
The figures include-minor system delays and program malfunctions. By analysis
of the response latencies of a random sample of 25 subjects, it was learned
that the time to complete the test is decreased significantly when only
response latencies to each item are considered.
Goal 3 pertains to reliability. At this stage of development with these
tests, test-retest procedures over short periods of time did not seem appro-
priate. Statistical formulas requiring that the same items be presented to
each subject were inappropriate also since the same pattern of 'Items was
presented to few subjects. Since,great care was exercised in the selection of
items arranged in order of difficulty, it was assumed that all items which were
not administered and which were below the score would have been passed. It was
further assumed that all items which were not administered and which were above
the subject's score would have been failed. Since these issumOtions are
implicit in the computation of the score, it'is reasonable to assume them also
in the computation of reliability coefficients. (Such procedure is followed in
the administration of such tests as the Stanford-Binet.)
It-should be noted that.Kuder-Richardson formulas yield slightly higher
correlations than other methods of measuring reliability and that the,tethnique
of assigning a minus or a plus to unanswered items will tend to inflate the

81
obtained correlationS. The Kuder-Richardson coefficients ranging froM..977 to
.988 compare favorably with the odd-even reliability coefficients of .94 and
95 reported in the technical manual for total scores of the college level
Henmon-Nelson tests. The technical manual reports alternate form reliability
coefficients of .84, .876, and .887 for Q, V, and total scores. Thus, it is
concluded from the first phase of the reliability study that a Oghly reliable
test can be adapted for presentation by a computer.
The final area of investigation to be reported here involves a comparison
between COMPAT and the conventional Henmon-Nelson test. The relationship
between COMPAT and the conventionally Administered Henmon-Nelson test are not
as substantial as those reported in the Examiner's Manual for alternate forms
of the Henmon-Nelson.
It was evident from the data that the normative data for the Henmon-Nelson
cannot be used to interpret COMPAT scores. Norms will need to be developed if
COMPAT scores for individuals are to be interpreted.
It should be noted that the number of subjects who took COMPAT Verbal-C
or Verbal-D'was dependent .on their score on the pretest. Since COMPAT Verbal-A
and Verbal-B were administered to only 10 subjects, correlational data for those
tests were not computed.
Remedial and Review Branching inComputiFFER Instructlon
Purpose
There are two basic kinds of branching strategy. The first is to branch
the student to an alternate sequence of remedial material. The second is to
provide the student with a review or re-exposure to material he does not yet
understand.
The purpose of this investigation (Gilman and Gargula, 1967) was to cnm-
pare the effectiveness of branching strategies in an instructional program
prepared for computer-assisted instruction with that of a nonbranching CAI pro-
gram.,

82
Method
The subjects were 42 students from the tile setting and plumbing programs
of Williamsport Area Community College, Williamsport, Pennsylvania These stu-
dents were selected because they had not previously received instruction in
physics. All were naive with respect to educational experimentation procedures.
Subjects were randomly assigned to two proportional groups. The linear
group consisted of 14 Ss and the branching group consisted of 28 Ss. The ran-
domization was accomplished by the use of a well-shuffled stack of student data
cards. Ss were pretested with the 10-item pretest. No S answered more than
four questions correctly, and most answered all questions incorrectly.
The linear group received only the instructional frames of the program.
The branching group received the instructional frames and corresponding remedial
frame when an incorrect response was emitted during the instructional frame,
but also reviewed segments of the program on which they had a high error rate.
Response latency, or the time required for the student to answer a ques-
tion, was recorded by the computer...for each response and was accumulated during
the instructional period. The total instructional time was also recorded by
the computer."
Immediately following the instruction, the 25-item posttest was adminis-
tered to each subject.
All instruction was "stand alone" instruction in that no other instruction
was provided other than the programed course.
There were slight differences in the means of the posttest favoring the
branching group and A slight difference in instructional time favoring the
linear group. These small differences were not statistically significant
(P >.10), but they do suggest the need for further study of this variable in CAI
mode.
One important factor in 'comparing the programs was the number of responses
required in the program. The difference in the means of the group were signi-
ficant (P <.001). Clearly, more responses weie required by the branching group
than by the linear group.
It is interesting to note that although the branching group required more
responses to complete the program, the mean response latency was'less than thAt
of the linear group, so that differences between the means of the total

83
accumulated latencies for the'' two groups were not significant (P <.10). The
lower latencies perhaps resulted 'from a greateramount of practice in using
the terminal interface.,
Di scuss i on
The major conclusions of the study may be summarized as follows:
1) No differences in achieVement were obtained for a CAI program which
incorporated instructional frames, branching to remedial frames, and review
of program segments over a program whiCh presented only instructional 'frames.
2) As.a result of a criterion established by the programer, the students
in the branching group required significantly more responses to complete the
program. However, this learning strategy resulted in no noticeable gains in
1 earni ng .
3) Although the branching group required significantly more responses 11 ,
to complete the program, the mean response latencies of the linear group were
lower than those of the _branching group. Thus,- there were no differences in
the total accumulated response latencies for the two groups..
Concl us i on 4 t
The results of the present study appear to be consistent with the results
of Holland (1965), Campbell (1961, 1962), and Glaser (1962) in that no advan- ..,
.1?
.41
t.
4#.
tages were found for a" branchin6 strategy:The results are not consistent with those found by Skinner (1961) and
Holland and Porter (1.961). Evans (1965) and Barlow (1963) who have found the
controversy of "linear vs. branching" to be one which cannot be answered
unequivocably, since the two instructional techniques serve different functions.
The results of this study indicate that if branching is to be used to
advantage in computer-assisted instruction, there must be a thorough investi-
gation of those situations where it facilitates learning. Also, research needs -e
to be implemented to determine the criteria for branching decisions.
91

a
84,
Relative Effectiveness of Various Modes ofStimulus PresentatiTaTTErTivatiiipt757-Assisted Instruct on
. Purpose(
The purpose of this study (Johnson and Borman, 1967) was to determine therelative effectiveness of the vaHous modes of Oesentation on total time forsrdents to coniplete the course and on competence as determined by a posttest.
s ore. .
-Based.on selected studies, it was hypothesized' that the static displayMode of presentation .would take significantly less time and result in asequally effective learning' as.the. typewriter-output mode of presentation since
,
the static:display mode presents a paragraph Of material to a student at'a time
'and al tows'him toproceed at his own pace,. The material chosen for this study
.was a basic physics ,sequence or "Working with Unite." The instrUction was
,designed for vocational-technical.students. who have finished:high school and
°have ar limited.background in mathematits and.physics.
Subjects ,
The'Ss.consisted of 90 upperclaismen,majoring in education and taking
Instructional Media 435-at-The Pennsylvania State University during the Fall.Term, 1966. Each S in the Instm.. 435 class was required to- spenO One' hour at
the CAI student station. The'Ss were'rindomly assigned to one of four groups. .
(Due' to computer malfunction and'scheduling problems, ,the final 4groups did not
contain equal' numbers.) _None of thels possessed a background of study in'..
mathematics or physics prior to the treatment.,
Procedure..
Type Mode. The S signed on the course, the computer typed out instruc-
tions followed by'questions. After the S typed his answer, the computer pro-ceeded by typing material to the S, showing slides, typing questions, etc.,until the lesson was completed, The S was immediately tested on his knowledge
by a 15Litem, multiple choice, computer-admikistered test. Total instructionalttme anil test scores were recorded.
ft

II
1
\
85
Audio Mode. Ss who received instruction through the audio mode heard the
same material that the Ss in the previous mode read from the typeout. Ss could
repeat each message -as often as desired. They also received some 'typed mate-
rial and slides which were common'to all groups. When finished, they took the
same computer-administered test. Total instructional time and test icores were'recorded.
Display Mode. Ss in the display mode had a booklet containing all of themessages heard by the above group. InsteaCof hearing the messages as theabove group, the typeout instructed them to read the proper page of the book-let. This group also received the same typed material and slides as the abovegroups. The same computer-administered test was- taken by this group and their
total instructional time and test scores were recorded.Control Group. Ss in the control group received no instruction, but took
the same computer-a.dminis'tered test as the above groups. Only their total testsCores were recorded.
'Findings
An analysis of variance procedure gave the results shown in Table 5. The
F-ratio was signifiCant beyond -the .05- level of confidence. Sheffe' s procedure
for multiRle comparisons (Sparks, 1963) showed that the audio, type, and display-modes bf presentation were all significantly superior to the control group con-
,
cerning posttest scores: There were no signiticant.differences between theaudio; type, and display modes.
The above finding suggested to the authors that there May have been toomuch overlap between the type mode and the other modes since 39 out of 55 frames
were common to all groups in stimulus mode. This commonality May have hidden
any mean differences in completion time. In order to remedy this situation,the authors decided to run the experiment again, this time increasing thenumber of frames containing variable modes of presentation.
Subjects
The,Ss consisted of 87-;,upperclassmen majorih4 in education and taking
Ins&ubtional Media 435 at The Pennsylvania State University during the Winter

1
'1*
86
Table 5
Means and Standard Deviations of Posttest Scores(Maximum Possible Score 15 Points)
,Mode Mean
Type Mode .12 11.17
Audio Mode 16 13.00
Di spl ay Mode 12 11.67
Control Group 50 8.90
Term, 1967. Each S in the Instm. 43,5 class was required to spend one hour at
the CAI student station. The Ss were randomly assigned to one of four groups.
The Ss did not have a mathematics or phygics background._ .
Implications,
The purpose of this experiment was to examine the question of decreasing
instructional time on-line through various modes of presentat.ions without a
decrease in learning.
Special note should be taken of the findings indicating that the mean
scores on the posttest for each exPerimental group was 'significantly higher
than the mean score on the posttest for the no-instruction control group. It
should also be noted that there were no significant differences on posttest
-score among the experimental treatments (audio, display, type, and slide).
,T.his was, a consistent finding ir both experiments. Therefore, regardless of
mode of presentation, all grottps were able to learn from the programed sequence.'
The main purpose of the experiment, to decrease instructional time on-line,
did not restilt th signifiant findings. However, there are some intereiting
tendenciei which warrant further investigation.
94

1
.87
An Experimental Procedure for Course RevisionBased on Staiiitirirast Pet-7iFFmance
Purpose
In an earl ier 'study the researchers had investigated the time required to
complete a program under various modes of stimulus presentation. No significant
differences were demonstrated between the various modes because of the large
. variances obtained in the dependent variables for the various modes. At that
time sit was the intent of the authors to analyze each subject's performance on
. each frame in order to determine whqher or not there were certain frames in
the program that contributed a large proportion of variance to the total within
groups variance. This study (Borman ankl Johnson, 1968) was an attempt to
improve the program.
Method
Upon completion of revisions, the course originally titled, "Working Olith
Units," contained 47 frames including six sl ides common/to all modes of presenta-
tion. The sequence was designed so that all Ss received four tsirm-up frames,
each frame presented in a different mode, the main purOose of which was to
acquaint each S with the correct method of terminal operation. Following the
introductory material, 43 frames of material were presented for Which data
were collected and analyzed.In order to provide for a variation in stimulus modes, ,four versions of .
the course were created. The material from the 37 frames (not including slide
material) was presented four ways. One group recefved this material on audio
tape to provide the audio mode of presentation. One group received this
material printed on charts and put together in a booklet, each page of which
contained the material from one frame of the program. The program instructed
the Ss to, read a given page. This mode of presentation provided the chart
display mode of presentation. In a third version of the course, the type mode,
the material was typed to the student on the typewriter associated with the IBM
1050 'computer teminal. The fou4rth grouP received the instructional Werial
on 2 x2-Inch photographic slides; the material, was identical to that contained-
on the audio tape, chart display group, and typewriter output. All groups
(
7
88 eafti,
received identical versions ,of the courie and all groups were required to
answer the questions by typing their answers on the, typewriter keyboard at the
terminal.
A 20-item constructed-response test was created. The test was designed to
measure factual material as presented in the program as well as a subject's
ability to transfer what he learned to similar problems. For example, in
addition to dividing meters by seconds, a concepi taught in the course, the Ss
also had to divide ficticious units such is dividing "yens by fuds." Since'-the ,
program was not designed to teach computational skill, it ,was decided to
score the test only on the basis of whether or not the S had the correct units,
not whether or not the S had the right numerical answer. The Kuder-Richardsons,
Formula 20 reliability of this test was .862.
Subjects
The S's consisted of 33 volunteer upperclassmen pajoring in education and
taking Instructional Media 435 at The Pennsylvania State University during the
Fa1.1 Term, 1967. The Ss were randomly assigned to one of the four experimental
treatments. The Ss did7not have a mathematics or physics background. In ad-
dition another group consisting of 90 upperclassmen -majoring in education and
taking Insiructional Media 435 at The -,Pennsylvania State University during the
Fall Terin, 1967, served as a naive control group and took only the posttest.
.Procedures
Each S signed on the course and was presented with the instructional,
material and questions based on the material. The S responded to the questions
by typing his answer, on the typewriter keyboard. Feedback material was pre-
sented by the computer to all Ss via the typewriter. Upon completion of the
course, Ss were administered a 20=questinn constructed-response test off'-line.
Total for each question, the response latency for each response, and the
number of correct responses on the posttest were collected for each subject.
Resul ts
The main purpose of this experiment was to/ test a procedure for course
revision based on past performance: Graphs were prepared to indicate weak
S6
89
secttons or frames in the course.based on high mean response latencies and/or
high mean .numbers of attempts. 'The graphs also indicated frame-by-mode-of-pre-
sentation interactions, i.e., indicated frames where OW mode of presentation
wai superior or inferior to the other*: modes of presentation. It is felt that
by examining these interactions, it may be possible to intlicate which mode of
presentation should be used for which purposes s well as how to best use a
medium.fo'r a specific purpose: For example, it 'was .found that, for the giveli
course matetial, it was necessary to keep the audio messages relatively short.
IA revsing the course, care was taken to improve those frames which con-
tributed large proportions of variance to lirge mean response latenCies and the
high mean numbers of attempts. The reVisions would tend to make the course
more uniform* and easier for all groups, since all versions of the course were
improved, a condition reflected by the minute mean differences for total time
to complete the progriaM. A possibiltty for future research would be to revise
only the frame for the modality which experienced difficulty, leaving the other
frames unchanged. Diagnostic revisions may serve to lower within group vari-
ance and capitalize on the differences that are inherent in the various modes
of stimulus presentation available with CAI .
The course material used in this experiment is the product of a number of
revisions áfter it had been carefully written by a subjeCt matter and program-
ing expert. Even now, it is far from being optimally efficient and effective
stimulus material to promote student learning. There are still many peaks and
valleys that must be accounted and compensated for through revisions or branches.
The most significant finding to date is that coUrse development is a complex,
time-consuming process which must be carried out in a context where student per-
formance data are continually used as a basis for subsequent revisions.
Expressed Student At itudes Under Several Conditions of, Automated Programed Thistruct on
Purpose
Due to the rather general finding .that student attitude and performance
measures tend to be only moderately correlated, it cannot be assumed that a
program which results in satisfactory criterion performance will necessarily
result in a positive student attitude. If it is granted that student attitude
97
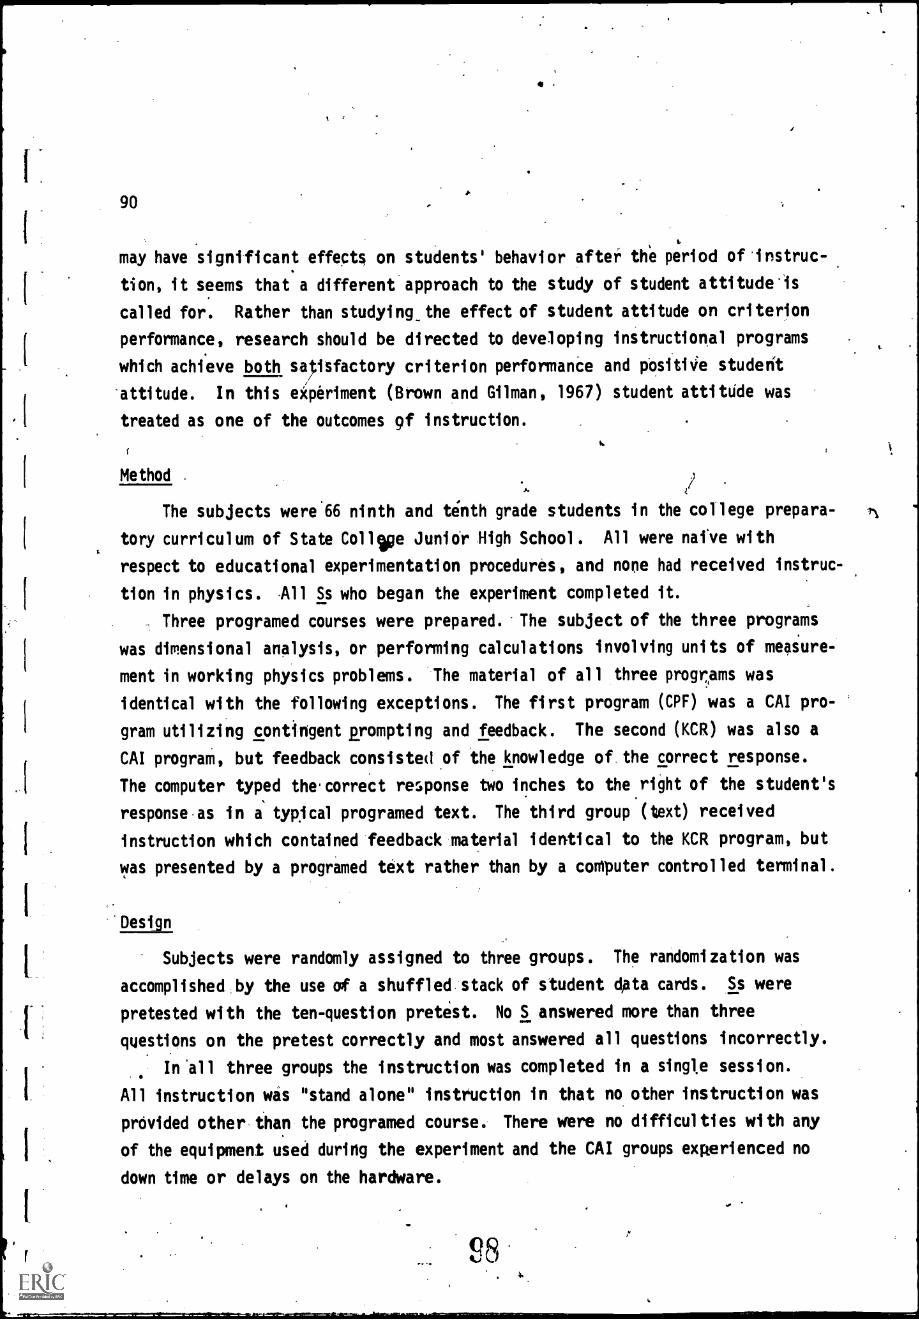
90
I.
may have significant effects on students' behavior after the period of 'instruc-
tion, it seems that a different approach to the study of student attitude'is
called for. Rather than studying_the effect of student attitude on criterion
performance, research should be directed to developing instructional programs
which achieve both sa,isfactory criterion performanee and positiie student
-attitude. In this elperiment (Brown and Gilman, 1967) student attitUde was
treated as one of the outcomes 9f instruction.
Method .
4'
The subjects were.66 ninth and tenth grade students in the college prepara-
tory curriculum of State Collwe JuniOr High School. All were naive with
respect to educational experimentation procedures, and none had received instruc-
tion in physics. All Ss who began the experiment completed it.
Three programed courses were prepared. -The subject of the three programs
was dimensional analysis, or performing calculations involving units of measure-
ment in working physics problems. The material of all three programs was
identical with the following exceptions. The first program (CPF) was a CAI pro-
gram utilizing contingent prompting and feedback. The second (KCR) was also a
CAI program, but feedback consisted of the knowledge of the correct response.
The computer typed the.correct response two inches to the.right of the student's
response.as in a' typical programed text. The third group (text) received
instruction which contained feedback material identical to the KCR program, but
was presented by a programed text rather than by a computer controlled terminal.
Design
Subjects were randomly assigned to three groups. The randomization was
accomplished by the use of a shuffled stack of student dpta cards. Ss were
pretested with the ten-question pretest. No S answered more than three
questions on the pretest correctly and most answered all questions incorrectly.
In'all three groups the instruction was completed in a single session.
All instruction wis "stand alone" instruction in that no other instruction was
provided other than the programed course. There were no difficulties with any
of the equipment used during the experiment and the CAI groups experienced no
down time or delays on the hardware.

91
Test
Student attitude was measured by a 40-item Like?-type scale, previously
developed at The Pennsylvania State University CAI Laboratory.
Student responses were scored) to 5,:with 5 being the response which
indicited the most favorabJe attitude toward the instruction. The maximum
attairiable store was 200. Kuder-Richardson fnrmula-20 reliability obtained
during an earlier study was .885.
The attitude scale was administered to each S following the session of
instruction.
Resul ts
The responses of each student to the 40 items on the attitude scale were
sumed to yield one score for each student.. The data were analyzed within a
two-factor, treatments by sex, analysis of variante design. The only signifi-
cant difference found was between the three-treatment mears (F = 12.89, df = 62,
P <.001).. Scheffe's "S-test" was performed on the three group means. This
analysis showed that both KCR and CPF means were significantly different
(P <.01) from the text group. The KCR and CPF were not significantly different
from each other (P >.05).
Groups KCR and CPF scored significantly higher on the attitude inventory
than did the text group. There were no significant differences between.the KCR
group and the CPF group. There were no differences attributable to sex.
The differences between groups receiving computer-assistied instruction and
instruction by programed text are similar to the anticipated results. The
differences in attitude scores cannot be attributed to differences in perform-:,
ante as the three groups did not differ significantly on either posttest or
retention test performance. The groups did differ on the amount of instruc-
tional time required; however, in this experiment there seems tobe no basis
for explaining attitude in terms of time per se. Apparently the more positi've
expressed attitude computer-assisted instruction as compared to the attitude
(expressed toward programed texts is attributable to student preference for a
novel automated instructional medium.
In the opinion of the authors the approach to the study of student atti-
tude suggested in this report and illustrated by the above experiment should be

92
employed, in
approach, 'in
achieve both
conjunction wtth, if not instead of, the typical correlational
research aimed at the development of instructional programs which
satisfactory Criterion perfoOmance and positive student attitude.
Effects of ReIucing Verbal Content inComputer--Tssisted Ins tructiaWams
*Purpose
This stuly-i vestigated the effects resulting from reducing the verbal con-
Nab)tent in a CAtfpro ram. The rationale for this treatment'is that those students
of low verbal. ility may comprehend material better when taught by Programs
with short, concise sentences containing few unusual words, rather than when
they are taught by programs with a high verbal Content.
This study (Gilman and Harvilchuck, 1967) tested three hypotheses
regarding the verbal content of computer-assisted instruction programs. The
expected findings were as follows:
1) A low verbal content program requires less instructional time than a
high verbal content program.
2) Greater comprehension (posttest performance) results from having
studied a low verbal content program, as contrasted with 'having studied a high
verbal content program.
3) There is a higher correlation between achievement (posttest performance)
and verbal intelligence (California Test of Mental Maturity) for students
studying a high verbal content program than for students studying a low verbal
content program.
Method
The subjects were 36 students from the tile setting and plumbing programs
of Williamsport Area Community College, Williamsport, Pennsylvania. The stu-
dents were selected because they had notyet demonstrated high academic ability
and had not recetVed previous instruction in the content materials (significant
figures) to be used in the study. All Ss were naive with respect toNeduca-
tional experimentation.
IC 0

93
Ss were randomly assigned to two treatment groups of 18 Ss per group. Ss
were pretested with the five-item pretest. No Ss answered more than two ques-
tions correctly and most Ss answered all questions incorrectly.
Both treatment groups received instruction through the 1050 terminal. The
time required for instruction was recorded by the computer. Immediately fol-
lowing the instruction, the 18-item posttest was administered.
Conclusions
The major conclusions from this study may be summarized as follows:
1) It is possible to substantially reduce the verbal content of a
computer-assisted instructional program without significantly decreasing the
learning which results from a student having studied the program.
2) The conditions in which instruction is presented by a low verbal con-
tent program required significantly less time than instruction by a high verbal
content program. This effect results from the slow type-out rate of the type-
writer terMinal device and the additional time required by students to read
and comprehend the longer typed messageis.
3) Although the difference between the correlation of achievement and
verbal intelligence was not significant, the results indicated a slightly
higher correlation between intelligence and achievement on the part of the
students who studied the low verbal content program.
Reducing the verbal content of a computer-assisted instruction program
hal definite advantages for efficiently utilizing instructional time. The
time saving can be considerable when a typewriter interface is used. There
are also advantages for using low verbal content programs with the newer
CRT interfaces, since these devices cannot accommodate lengthy messages.
The use of low verbal content materials may also be advantageous for the
slow learner. Further studies should be conducted with a wide variety of pro-
gramed materials and with larger groups of subjects to ascertain whether or not
the lower correlations of achievement and verbal intell'igence on the part of
the students studying low verbal content programs can be replicated.
The widespread use of programed materials is advantageous to students of
all ability levels, but particularly to low ability and less literate students.
For many low ability students, studying materials that are'programed may mean
the difference between comprehending the material and being cOnfused. It is
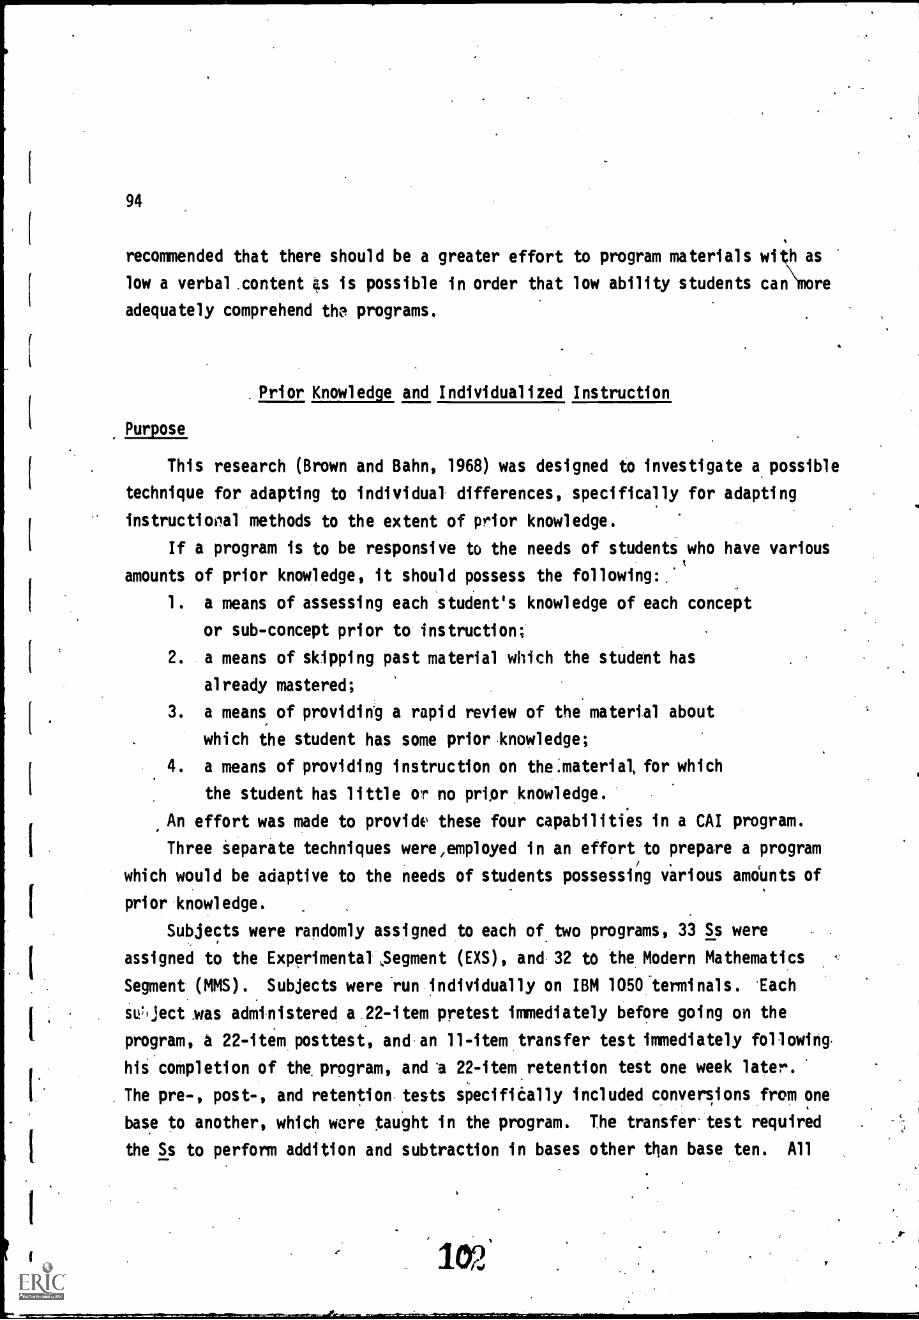
94
recommended that there should be a greater effort to program materials with as
low a verbal .content 4s is possible in order that low ability students can\more
adequately comprehend the programs.
. Prior Knowledge and Individualized Instruction
Purpose
This research (Brown and Bahn, 1968) was designed to investigate a.possible
technique for adapting to individual differences, specifically for adapting
instructiooal methods to the extent of prior knowledge.
If a program is to be responsive to the needs of students who have various
amounts of prior knowledge, it should possess the following:.
1. a means of assessing each student's knowledge of each concept
or sub-concept prior to instruction;
2. a means of skipping past material which the student has
already mastered;
3. a means of providing a rapid review of the material about
which the student has some prior knowledge;
4. a means of providing instruction on the.materiat for which
the student has little or no prtor knowledge.
An effort was made to provide these four capabilities in a CAI program.
Three Separate techniques were,employed in an effort to prepare a program
which would be adaptive to the needs of students possessing various amdunts of
prior knowledge.
Subjects were randomly assigned to each of two programs, 33 Ss were
assigned to the Experimental Segment (EXS), and 32 to the Modern Mathematics
Segment (MMS). Subjects were -run individually on IBM 1050 terminals. Each
sC,ject mas administered a 22-item pretest immediately before going on the
program, a 22-item posttest, and an 11-item transfer test immediately following.
his completion of the program, and'a 22-item.retention test one week later.
The pre-, post-, and retention tests specifially included conversions from one
base to another, which were taught in the program. The transfer test required
the Ss to perform addition and subtraction in bases other than base ten. All
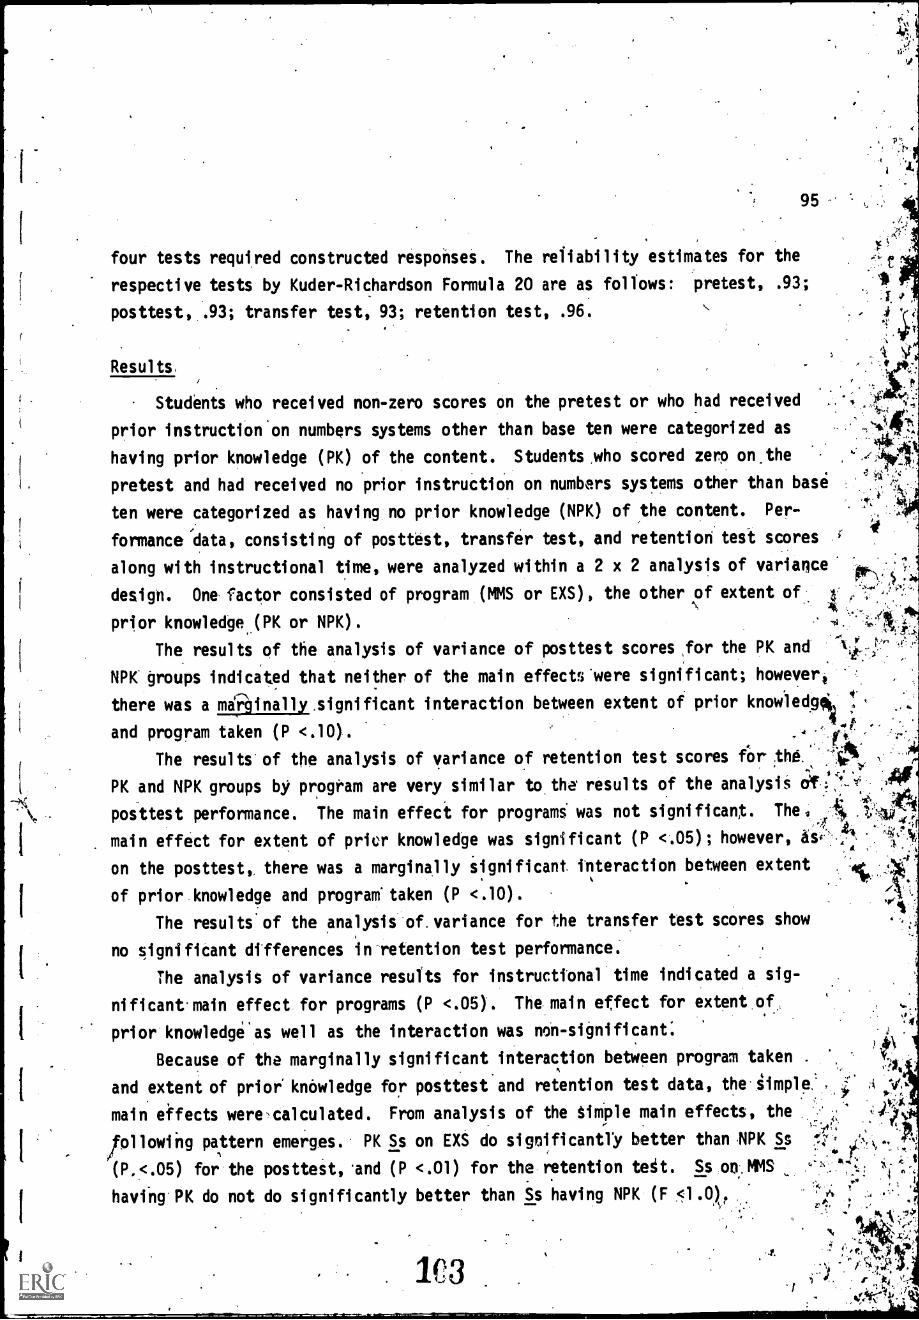
95 .
four tests required constructed responses. The reliability estimates for the
respective tests by Kuder-Richardson Formula 20 are as follows: pretest, .93;
posttest, .93; transfer test, 93; retention test, .96.
Results .
Students who received non-zero scores on the pretest or who had received
prior instruction'on numbers systems other than base ten were categorized as
having prior knowledge (PK) of the content. Students,who scored zero on.the '-
pretest and had received no prior instruction on numbers systems other than base
ten were categorized as.having no prior knowledge (NPK) of ,the content. Per-
formance 'data, consisting of posttest, transfer test, and retention'test scores .e
along with instructional time, were analyzed within a 2 x 2 analysis of variance' '
design. One, factor consisted of program (MMS or EXS), the other of extent of I'.
prior knowledge,(PK or NPK).T
The results of the analysis of variance of posttest scores for the PK and )
NPK groups indicated that neither of the main effects were significant; howeverp
there was a minally significant interaction between extent of prior knowledg* 4
and program taken (P <.10),
..
The results of the analysis of variance of retention test scores for lov,
PK and NPK groups by program are very similar to the results of the analysis
posttest performance. The main effeci for programs was not significant. Thel
main effect for extent of prier knowledge was significant (P <.05); however, Asf'
on the posttest, there was a marginally significant interaction between extent
of prior knowledge and program.taken (P <.10).
The results of the analysis of.variance for the transfer test scores show
no significant differences in-retention test performance.
The analysis of variance resutts for instructional time indicated a sig-
nificant.main effect for programs (P <.05). The main effect for extent of,
prior'knowledge'as well as the interaction was win-significant:
Because of the marginally significant interaction between program taken . 'P, A
and extent of prior knowledge for posttest and retention test data, the-iimple, , A V,*
., 10main effects were,calculated. From analysis of the tiMple main effects, the
, .
lollowingpattern emerges. PK Ss on EXS do significantly better than NPK Ss
(P,<.05) for the posttest, 'and (P <.01) for the.retention tegt. Ss:on...MMS i'''t I, r , ' : ^,
having.PK do not do significantly better than 'Ss having NPK (F <1.0),. , . ./
.:
X
4 91 'It sr103r

c
I.
I.
96
The simple main effects of PK - NPK across 141S - EXS are(as follows.: for
Ss having PK there were no significant differences in perfomance on posttest
or retention .test attributable to the instructional programs (F <1.0). Ss
having NPK did significantly better .on R1S on both posttest (P <1.0) and
retention test (P
The EXS program seems to have capitalized on the knowledge which Ss had
prior to instruction. The finding of no significant differences between MMS
and EXS on posttest, tran,esfer test, and retention test, coupled with the time
saving for EXS, suggests that students with prior knowledge would benefit by
having instruction On EXS rather_ than MMS. For NPK Ss the lower posttest and
retention test scores on EXS-seem to call for *IS for these Ss in spite of the
time saving on EXS:
d
Discussion and Conclusions
The procedure reported here seems to provide a means of adapting to extent
of prior knoWledge Which results in considerable time saving with no decrease
in criterion performance. The results of this study also suggest that neither
of the programs coulif be recommended for all students if they vary widely in
extent of prior knowledge. Perhaps parallel programing ethploying the formats
of both the programs with a branching procedure for switching students from one
program to the other may provide the benefits of both.
The procedure employed in EXS may have somewhat limited application in
terms of the instructional content. The content in this study was such that.a
student's prior knowledge of a, concept could be evaluated. For content con-
sisting of more or less discrete units of information, eivaluation of prior
knowledge by the method employed here may not be feasible.
104
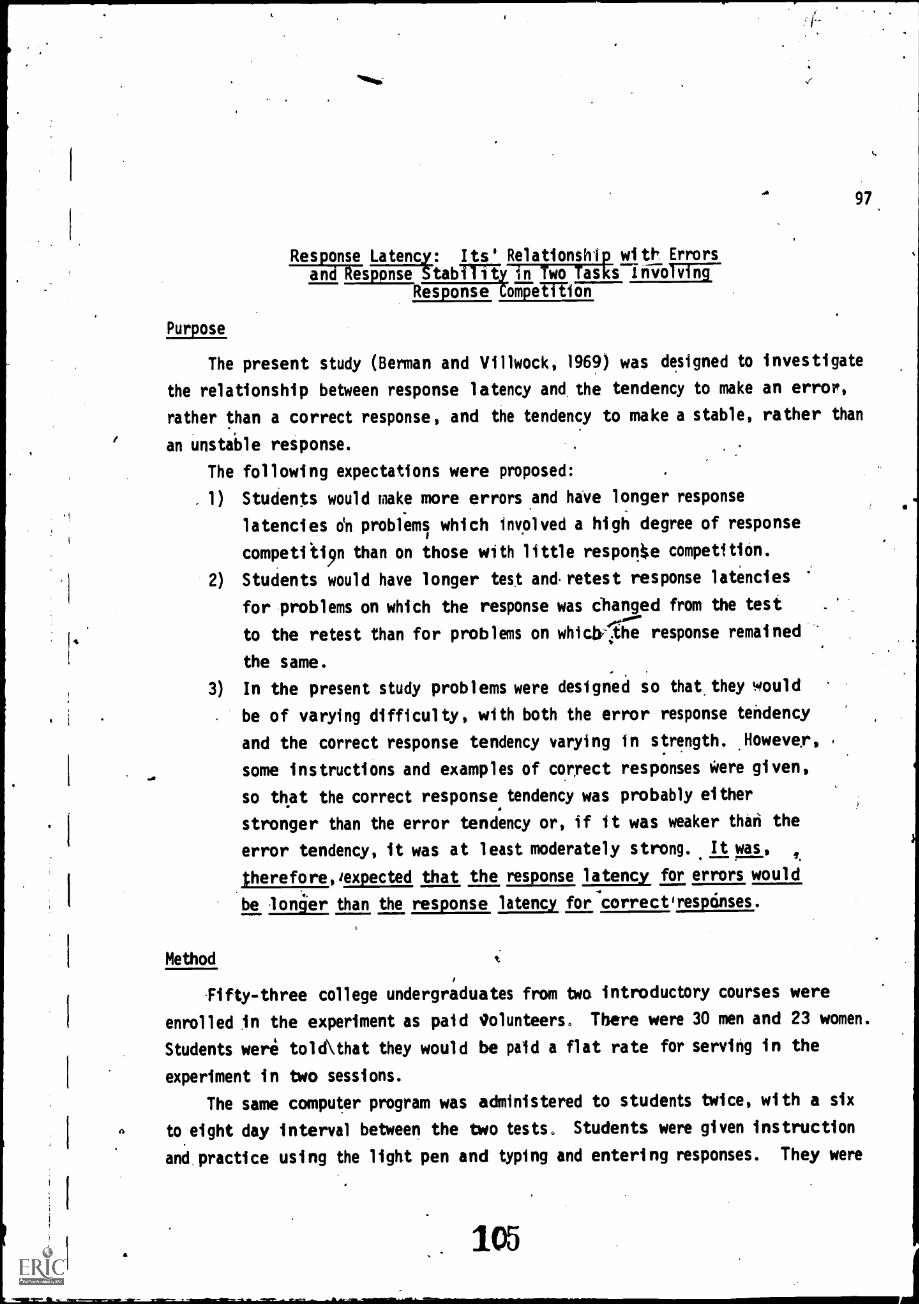
11000.
97.
Response Latenc : Its' Relationship with Errorsand Response Stability in Two Tasxs ihvolvfng
Response Compeffeion
Purpose
The present study (Berman and Villwock, 1969) was designed to investigate
the relationship between response latency and the tendency to make an error,
rather than a correct response, and the tendency to make a stable, rather than
an unstable response.
The following expectations were proposed:
1) Students would Make more errors .and have longer response
latencies o'n problems which involved a high degree of response
competiti9n than on those with little respone competition.
Students would have longer tes,t and retest response latencies
for problems on which the response was cbanged from the test
to the retest than for problems on whicfrithe response remained
the same.
3) In the present study problems were designed so that they would
be of varying difficulty, with both the error response tendency
and the correct response tendency varying in strength. .However,
some instructions and examples of correct responses Were given,
so that the correct response tendency was probably either
stronger than the error tendency or, if it was weaker than the
error tendency, it was at least moderately strong.. It was,
therefore,lexpected that the response latency for errors would
be onger than the response latency for correctlresponses.
Method
Fifty-three college undergraduates from two introductory courses were
enrolled in the experiment as paid Volunteers. There were 30 men and 23 women.
Students were told\that they would be paid a flat rate for serving in the
experiment i n two sessions.
The same computer program was administered to students twice, with a six
to.eight day interval between the two tests. Students were given instruction
and practice using the light pen and typing and entering responses. They were
105

4
-1
I.
4 1
0
98
tolci to answer as,soon as they thought they knew the correct answer and that
both speed and accuracy were important. The two keys used to enter responses
were covered, with red tape and referred to as the "red keys" in an attempt to
YaCilitate discrimination and shorten response time. IntroductorY and instruc-
tional frames remained on the interface until the student indicated his readi-
ness to proceed by pressing the eed keys.
Resul ts
The results confirped two of the study's hypotheses,"and were equivocal
with respect to the third..
. Students made more errors arid haa longer response latencies on problems
whith involved more ,competition between responses than on those with less
response competition.' This was true with both Vries of problems oeven though., in
each, response competition was varied in a different manner".
In the set tasks the number of responses which appeared relevant to problem
solution were varied. Single dithension problems could be sOved by simply
attending to the one feature of the stimuli on which the two choice figures
differed. In contrast, the critical feature of the multi-dimenSion problems
could be any of a number of .dimensions on which the choice figures differed.
In order to solve the multi-dimension problems students were required to attend
to each of these stimulus features until they found the critical feature. In
the baie problems, the degree to which overlfiarned habits from base 10 were in
conflict with new responses associated with 'other base systems, varied.-
The results are perhaps more clearcut for the base problems than for the
set problems, since the difference between the ,r4sponse latencies .of single
and multi-dimensional problems failed to reach 41gnificance on the retest. In
constructing the set figures there were no controls for perceptual variables.
Instead, perceptual .differences were randomly .distributed among single and
multi-dimension problems:since the ten sets of stimuli were randomly assigned
to the tbto conditions. Perceptual factors were undoubtedly a source of /
significant vaeiability in errors and latency among the five single dimension
problems, and among the five multi-dimension problems. A possible means of.
controlling for these differences would be to construct two sets of choice
figures for 'each.pitblem, thus creating a single and a multi-dimension fonn of
eath problem, each to be adminitered to a different group of student,s.
106

1
99
Students took longer to produce errors than correct responses on both
types of probleMs. The differences were highly significant and were not due
to the fact that errors and long latencies were both .associated with signifi-
cant factors such as test vs. retest, single vs. multi-dimension problems, or
type of base question asked. These factors had been equally weighted in cal-
culating students.' .average,latencies .for correct and,incorrect responses.
In the set problems two response alternatives were given; in the base
problems students produced a response from an unlimited number of alternatives,
although the two strongest response tendencies were presumed to be the correct
respOnse and the response which would be correct in the bise 10.system. Of
course, other respOnses were possible and were, in fact, made. It is inter-r,esting.that these other error responses were also associated with longer
latencies than correct responses.
AlthOugh numerical 'base instructions.were.held to a minimum, they were
obviously sufficient to establish the correct response as a strong competitive
response. If it were not so, there would be little competition between the
correct response and base 10 habits, and."quick errors" based on strong base 10
habits would probably have been.made. After subjects produced each number in a
series they were told the correct response. Subjects made miny errors at the
power changes. However, the 'time taken to produce numbers at power changes
increased with each power change up to the. third:or fourth in_ the series. This
inCrease,in response latency coincided _with dedrease in the number of correct
responses produced by the 'group..
The procedure used in the present experiment was more like the usual school
situation in which sock instructions are given, so that the correct response
becomet a strong, if not dominants.response. However, it is well to remember
that the positive association between error rate and latency may be restricted
to Situations where the error response is not in a strong dominant position.
In the set task there was no obvious relationship between error' rate and
mean latency for the ten problems. The correlation' between errorbrate and mean .
latency for the nine base problems was .82.
It should be noted that, while students took longer to produce error
responses than correct responses, students who had longer mean response
latencies did not necessarify make more errors than those with shorter mean
IMOMnr.71-
107
100
latencies and error scores on the retest, but not the test. In contrast, the
relationship .between man latency and error scores on the set problems was
negative (and significant on the test, but not the retest). The relationship
may indicate that more care was taken by students who were more successful,
and this interpretation is supported by the fact that students who spent more
time looking at the instructions for the base problems took longer to respond
to set problems and made fewer errors on set problems.
It was expected that students would have longer test and retest response
latencies for problems on which the response was changed from test io retest
than for problems on which the response remained unchanged. Mean latencies of
changed and unchanged responses within six categories were. compared. In all six
categories the average latencies of changed responses were-longer than those of
unchanged responses, but the difference between dianged and Unchanged responses
reached significance in only one category. The number of.students with appro-
priate data to make these tests was small, particularly for the bases problems.
The hypothesis cannot be accepted, based on the resultsof the present experi-
ment, but it is certainly worth further testing.
Prompting and Conf\rmation as Modes
of Feedback wi thmputer-Assi sterInstruction
Purpose.
The purpose of this experiment (Borman and Hall; 1969) was two-fold:
1) to test the assumption that 16 stimulus items were of equal difficulty; and
2) to test.the relative effectiveness of prompting and confirmation as two modes
of feedback. It was expected that the stimill-us items were not ,of equal diffi-
culty; that the stimulus items would be learned in less time than when presented
under the prompting mode of feedback; and that the items would be more readily
remembered after varying periods of time when presented under the confirmation
mode of feedback.

101
Method
Forty-three volunteer subjects were obtained from an Educational Psy-
chology 14 class during the Fall 1968 term at The Pennsylvania State University.
The Ss were notified that approximately two and one half hours of ttme would
be required to complete the study; that they would be required to return to
the CAI laboratory 1, 7, and 21 days after the initial training session; and
that they would be paid33.25 for ther, time.
Each S was randomly assigned to either the prompting or confirmation mode
of feedback and trained to a criterion of 2 successive errorless identifications
of the 16 stimulus materials. The Ss returned to the laboratory 1, 7, and 21
days foll^wing completion of the training session and mere administered a-reten-
tion test during which the Ss tried to identify each of the 6 original stimulus
items randomly ordered. Before the first retention test the Ss were adminis-
tered an opinion survey dealing with their experiences with CAI.
Findings
An analysis of variance procedure for repeated measuret used to test the
hypothesis that the 16 stimulus items were of equal difficulty. The total
number of trials required to learn each stimulus item was the dependeAt variable.
Because of the significant interaction, it was necessary to examine the simple
effects, i.e., test the effect of the stimulus item at-each level of feedback.
The least signifiCant difference procedure was used for each level of feedback.
The items did differ significantly from each other at both levels of the factor
"mode of feedback." The order of the items also differ at both levels of the
mode of feedback factor. This makes it necessary to analyze the random split
halves hy the orders obtained from both the prompting simple effect and the
confirmation simple effect. The items were arranged in descending Order from
most d4fficult to least difficult for each simple effect. Those items were
marked with a P for each level of the criterion. Those items not so marked
were taught by the confirmation mode. In the majority of cases, the items
taught hy the prompting mode of feedback were harder or easier, but not equal
in difficulty, to the items taught by confirmation. Also, in the majority of
the cases the items actually included in the split half were.significantly

If
102
different from the items which should have been included in the split half.
Only those items chosen for the prompting mode of feedback at the sixth level
of criterion did not differ significantly from the ideal split.half.
To examine the expectation that prompting would facilitate learning, three
variables; total time to criterion, total number of trials to criterion and
student opinion were examined. A multivariate analysis of variance procedure
produced an F of 4.80, df = 3.39, P <.01 indicating that significant differ-
ences did exist among the groups.
The Ss who learned the items by the prompting mode of feedback required an
average time of 87.69 minutes (S. D. = 31.21) and an average of 7.35 trials
(S. D. = 2.90) to reach criterion while the Ss.who learned the items by the
confirmation mode of feedback required aniaverage time of 98.70 minutes
(S. D. = 32.97) and an average of 10.55 trials (S. D. = 4.95) to reach crite-
rion. A t of 2.54, (df = 19) was significant at .05 level for the average
number of trials to reach criterion indicating that the prompting Ss took
fewer trials, but the same amount of time to learn the items than did the con-
firmation Ss.
In addition, the student opinion scores obtained 1 day after training
showed the prompting Ss to have a significantly (.05) more positive attitude
toward CAI than the confirmation Ss.
The expectations that confirmation would produce higher levels of retention
than prompting was tested by analysis of variance for repeated measures.
Although the F = 1.18 for mode of feedback was nonsignificant, a trend did exist.
Because of the tendency of the two groups to merge at 21 days, the authors
hypothesized that the curves would cross after a 'longer period of time had
elapsed after training.. To test this, a fourth retention test was administered
after an interval of 90 days from the time of training. Thirty-three Ss were
available at that time and were willing to take a fourth retention test
(N prompting = 18, N confirmation = 15). . Ninety days after training, the
prompting Ss missed an average of 8.6 items (S. D. = 3.11) and the confirmation
Ss missed an average of 9.6 items (S. D. = 2.77). The difference was not signif-
icant, and the curves did not intersect. .
Analysis of covariance procedures were used to adjust for the unequal
number of trials and unequal amounts of time spent by the Ss in the various
110

treatments. It was assumed that if a
large number of training trials, that
spondingly higher. However, analysis
time to criterion and total number of
change the resUlts.
Discussion
103
person spent more time, or required a
his level of retention would be corre-
of covariance procedures using total
trials to criterion as covariants did not
It was shown that the 16 stimulus items were not equally difficult as
assumed by Hall and Borrnan (1968). The data contained in thi.s report suggest
that one of two procedures L\ e followed in further studies to avoid this error:
1) that all treatments be pr \ented with all of the stimulus items as was dOne
in the current study; 2) that)natched ,grodps- of stimulus items be formed on
the basis of the data presented -in this paper. For exampl.e, once the stiMuli
have been ordered on the basis of 'diffidulty, one could then assign pairwise
items to alternate groups on a.random basis. This procedure would assure that
the two groups would have items of similar difficul ty levels.,It was also shown in this paper that the prompting mode of feedback
required fewer trials to master the items than did the confirmation mode of
feedback even though both groups consumed equal amounts of time. This finding
may be accounted-for by examining the logic of the pgm. The stimulus drawing
and the name of the drawing appeared simultaneously to the students in the
prompting mode. The student could then spend as much time as he pleased
studying the item before he typed his response and went on to the next item.
However, for students in the.confirmation mode, once the student typed his
answer and the correct name appeared on the screen, the student.only had between
8 and 10 Seconds to study the stimulus and correct name together before moving
on to the next item. In order for the student in confirmation mode to have an
equal amount of "study time", he would be required to go through more learning
trials. Amount of "study time" is a variable t'hat should be controlled in
further experiments of this nature. .
The authors have also arrived at the conclusion that.an additional source
of variance was introduced into the task and' not accounted for. Each stimulus

104
item consisted of two concepts: A means of fastening an object (weld, flange,
screw; etc.) and the object (elbow, valve, joint, sleeve,,etc.). The authors
currently hypothesize that students may have tried to form concept,for weld,
screw, flanged, elbow, joint, sleeve, etc., instead of, memorizing the name
that appears with the item. This concepi formation procedure by the students
may have contributed an additional source of error variance, possibly hiding
any effects due to prompting and confirmation as modes of feedback. In the
future the authors plan to control this source of variance by keeping the means
of fastening the object constant,and eliminating that concept from the response.
Materials are currently under development to permit the execution of this design.
Reading, Rate, and Retention Under
Two fEdisMTPTlieitation
Purpose
The present study (Brawn, Dwyer and Hollick, 1969) is focused on the
investigation of one stratey for optimizing reading rate. A response sensitive
external pacing technique was employed whereby reading rate was adjusted on the
basis of frequently assessed immediate recall. The effects of adaptive external
pacing on reading rate, immediate recall, and delayed recall were investigated.
The experiment was implemented on the IBM 1500 CAI system in the Computer-
Assisted Instruction Laboratory at The Pennsylvania State University.
Method
Forty-two students from introductory educational psychology and psychology
classes at The Pennsylvania State University served as subjects. The students
were paid for their participation in the experiment.
Procedure
Each S received 30 of the 60 passages under self-paced presentation and
30 under externally-paced presentation. 6s were randomly assigned to two
groups; one group received the self-paced presentation first (SPF) and the
other the externally-paced first (EPF). Within each group each S was assigned
to one of four random orders of presentation of the passages.

105
In both the SPF and EPF conditions each passage was followed by three
questions. Following the third question on each passage the S was given feed-
back indicating which of the questions he answered correctly or incorrectly.
In the EPF condition the student's performance was evaluated following
each .set of questions and on the basis of a simple set of decision rules the
reading was set for the passage:
1) If the S answered all three questions correctly, the rate was
incremented for the next passage.
2) If the S answered less than two of the three questions correctly,
the rate was/decremented.
3) If the S answered two questions correctly and if he had answered
all three correctly on the previous passage, vie rate remained
unchanged for the next passage.
For the first ten of the 30 passages under the EPF condition, increments
or decrements were.in steps Of 25 words per minute. For the second ten
passages, steps of 15 words per minute were employed, and for the last ten
passages the increments or decrements were in steps of 5 Words per minute.
.The'rate for the first passage in the EPF condition was set at 225 words per
minute on the basis of data from a pilot study.
The Ss were run individually on the IBM 1510 CRT.. Performance records
were recorded for each Ss via the IBMI-1500.student records program. Ss returned
one week later and were given a 60-item retention test made up of one item from
each of the 60 .passages.
Resul ts
Inadvertently 22 Ss were run in ihe SPF condition and 20 in the'EPF-con-,
dition. To achieve equal Ns two Ss from the SPF condition were picked at random
amd their data were excluded from the analysis.
The repeated measures analysis of variance.wis utilized to analyze ihe
data. This analysis produced the followihg results. The externally-paced con-
dition resulted in faster reading rates (P <.01). The carry-over effect of EPF$
coupled with what seems to have been a warm-up effect resulted in a significant
interaction (P <.05). For the immediate,recall scores, the effect attributed.
_ 113I.

106
to differences between the two pacing conditions was significant (P <.01). The
self-paced condition produced better iMmediate recall than the externally-paced
condition. Retention test scores showed no significant differences.
While the self-paced condition did produce significantly higher immediate
recall, the externallYlpaced condition produced significantly faster reading
with no observable decrease im retention. Given this set of conditions, one
should perhaps ask how important immediate recall differences of approximately
four items may be, eipecially in light of almost identical results on retention.
Perhaps the gain in reading rate in some conditions might be more important
than a loss in immediate recall. The substantive significance of differences
as well as the statfttical signiftcance should be considered.'
.Correlation coefficients for the EPF and SPIT conditions were run. Several
interesting and some rather puzzling obiervations can be made concerning the
coefficients. The overall pattern is one of higher correlations in the EPF. .
group.. Response sensitive external pacing should largely rule out the effects
of idiosyncratic pre-dispotitional characteristics on reading rate. If a con- .
struct such as.optimal information proCesting speed is hypothesized, then the
positive correlations of reading.rate with recall and retention in the EPF con-
dition would seem to indicate that the.EPF, externally-paced condition did
assign Ss to rates which were appropriate. The continued positive relationships
seen for EPF self-paced seems to indicate some transfer effect of the rate
establithed in EPF externally-paced conditior
The generally low correlations under externally-paced presentatiOn in the.
SPF group are diffiCult to explain. Perhaps starting at a rate differing,from
the rate established in the self-paced presentation hid a disruptivg effect
which is reflectedin the lower Correlations for this group. Perhaps further
light will be'shed'on the result by tlditional studies employing modifications
of thedecision rules employed in this experiment. Further investigat-ion of
individual difference variables in refation to rate and retention is planned.
(
107
CHAPTER VII
FLOWCHARTS
n40
J'
As mentioned in Chapter II, flowcharting was one of the most impontant
activities of the project. Chapter II gives the.principles of flowcharting ana,.
explains a sample flowchart. Thepresent chapter devotes itself to a descrip- ,t4141'.. ik,.*r-
tion of the instructional flowcharting strategies developed in th,its prOject.
Course flowcharts, section flowcharts, and question-level 'flowcharts will be . e
1 ....
described. For a more complete desertption; see Teaching Strategies and Tactics
for Computer-Assisted instruction, (Dwyer, 1970).
Strategies InforminStudent About Content
Course Flowcharts
-
Students may be able to proceed through a course wjth greattyccess if
they are informed about the objeitives of the course. Knowing what is expected
of them, the students can work effectively toward the objectives.
Objectives of 6urse presented to student. This procedure keeps the stu-
dent informed about what is expected of him and,of his progress. Alternate
approaches can replace presentation of the objecttves of'a unit with senta-,4>,''
tion of concepts'that are to be acquired and skills that should be de oped
the presentation of'key questions the student answers (see Figure 4), p , ,N I
Objectives, Stated Prior to Module Instruction with Option to Repeat Module.
Through this proceddre the student is informed of the objectives of the unit,
enabling him to follow instructions more knowledg'ably. In addition, as the.unit--
is'summarized by modules, the student cin select those he should:repeat (see
Figure 5).
Strategies Based on Performance1
A common technique .in computer-assisted instruction is to accumulate data',"
on the individual student's aptttude Or his performance while taking the course
and then tcLuse this information O determine what path the student'should follow.
115S.

108
Lel to Flowchart - Ob ectives of Course Presented to Student
1. Start2. Broad objectives of course presented3. Objectives of unit n are presented to the student at the student's
level of understanding4. Instruction designed to achieve each oi the objectives of unit n5. Each objective of unit n is presented once again to the student, and
he is asked to judge whether he has achieved each objective.6. Do you want to select any sections for addilional instruction?7. Do you want additional instruction on objective n of unit n?8. Additional instruction on objective n9. Has student had the option to receive additional instruction on all
objectives of unit n?10. Quiz 9n unit n11. Analysis of quiz results to determine which, if any, of the objectives
were not achieved
12. Is remedial instruction required?13. Remedial instruction on sections determined by results of quiz14. Quiz questions on those sections that required remedial instruction15. Was criterion met on the quiz?16. Proctor message is sent to proctor station indicating the specific
deficiencies of the student; off-line instruction would be given.When the student had achieved criterion on an off-line quiz similarto his most recent quiz, instruction then could proceed.
17. Next unit of course

Objectives of Course
Presented to Student

110
Mx to Flowchart
Ob ectives Stated Prior to Module Instruction with Option to Repeat Modules
1. Start2. Objectives to be achieved in unit n we presented3. Module of instruction in unit n4. Is this the first time 'the student has received the instruction
in this module?5. Have all modules in the unit been presented?6. Summary of unit n
7. Do you wish to repeat any of the modules in unit n?8. Module is selected9. Has entire course been presented?
10. End
118
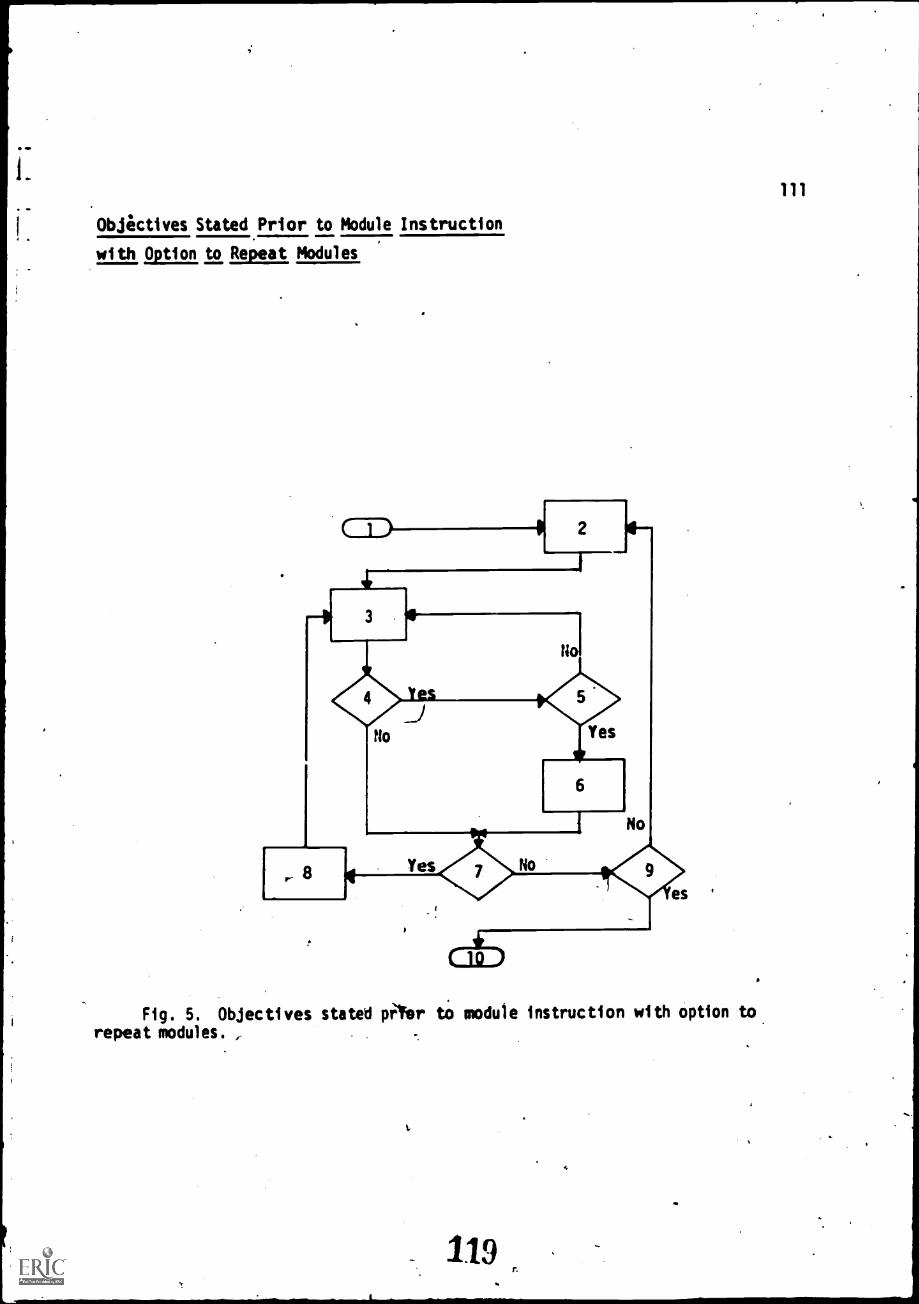
111
Objectives Stated.Prior to Module Instructionwith Option to Repeat Modules
4
2
4 3
Ho
Yes
_
10
Fig. 5. Objectives stated prlYer to module instruction with option torepeat modules. ,

112
Sequence based on diagnostic tests. Here the student is introduced to the
.program, receives basic directions,,and is given a diagnostiC test to determine
the help he needs. Based on test results he is branched to appropriate instruc-
tion, given an exercise on what he learned and a posttest to determine the
extent of his learning (see Figure 6).
Course presentation in three iracks. Instruction for the below average
student contains a minimum number of concepts and drill work; for the average
student, basic concepts, additional concepts, and some applications of more
advanced exercises"; and for the above average student, all concepts, enrichment
material, and advanced exercises. At specific points decisions can be made
regarding the student's needs (see Figure 7).
Flexible strategy for slow, average, and advanced students. This strategy
allows for slow, average, and advanced students to proceed through a course.
The advanced student has the shortest and most direct route through the course.
Each student ieceives a body of instruction and questions. Students are
branched to remedial, review, or advanced materials according to performance on
criterion items (see Figure 8).
Shorter sequence for better students. This procedure allows the better
student to get through the material at a rapid rate, but it also presents a
review of the type of material he may elect to skip (see Figure 9).
Sequence and review based on errors made. Here the student is given a
choice of a quiz.first. The quiz is analyzed and a branch is made depending on
the number of errors.. If errors are greater than an established percentage,
the student is branched to instruction. If the number of errors is less than':
an established percentage, he is\given a review of those items he answered
incorrectly. If he has no errors he proceeds (se4 Figure 10).
Hierarchical instruction beginning at highest competency of student. This
technique is used.in disciplines like math and physics which lend themselves to
a hier.archical design. Here the content of a course can be separated into can-
oe tend es whiCh are related in such a manner that capability in certain areas
is a prOrequisite for success in areas higher in the hierarchy. The course can
begin with a quiz on the skills and concepts in the highest competency in one
branch of the hierakhy. If criterion is met on the quiz, another branch of
the hierarchy can be entered. If criterion is not met on the quiz, a quiz can
120

114
Kty. to Flowchart - Suence Based on Diagnostic,Tests1
1. Start
2. Introduction to the computer and basic directions
3. Diagnostic test to determine the concepts with which the student
needs help
4. Student's score on concept n in diagnostic test is evaluated. If
student understands concept n well enough to achieve the desired
criterion on the diagnostic test, he is branched to further instruction
on concept n (block 5). If student meets the criterion level, he is
branched to the next decision point Ithere it is decided whether or
not he meets criterion on concept n + 1 (block 6).
5. Instruction on concept n
6. Have the results of the diagnostic test been used for all concepts
tested?
7. An exercise is provided in which the student uses the material under
study
8. A posttest similar to the diagnostic test is given and results used
to evaluate student's learning
9. Stop
1From Penn State's course segment Spellin , Project 5-85-074, IBM 7010 or
1410; authors: Helen L. K. Farr, Harriett A. Hogan.

Sequence Based on Diagnostic Tests
C-)
16
115
5
2 3
8
Fig. 6. Sequence based on diagnostic tests.
123

116
Key to Flowchart - Course Presentation in Three Tracks
1. Start
2. Analysis of pretests
3. Should instruction proceed
(track 1)?
4. Should instruction proceed
5. Highest level presentation
section n
6. Criteria questions in track 1 on concepts presented most rezently
7. Should enrichment activities or advanced exercises be included here?
8. Enrichment activities or advanced exercises
9. Decision is made and recorded whether the track of presentation should
be lowered to average-level instruction
10. Have all sections in this unit been presented?
11. Average-level presentation (track 2) of instruction on concepts in
section n
12. Criteria questions in track 2 on concepts presented most recently
13. Decision is made and recorded as to whether or not the track of presenta-
tion should be raised, lowered, or remain in the average track
14. Below-average presentation (track 3) of instruction on concept(s) in
section n
15. Criteria questions in track 3 on concepts presented most recently
16. Should a recapitulation of the instruction be given?
17. Recapitulation of recent instruction
18. Decision is made and recorded whether the track of presentation should
be raised or remain at the below-average presentation
19. Unit exam is given and grades are assigned by consideration of exam
score and most recent track of presentation
20. End of instruction dr next uni t
in the track
in the track
(track 1) of
for above average achievers
for average achievers (track 2)?
instruction on concepts in

Course Presentation in Three Tracks
8
Track 1
5
2
_A2.s No Yes
Track 21
6
9
11
12]
4
13es
18
117
17
19
Fig. 7. Course presentation in three tracks
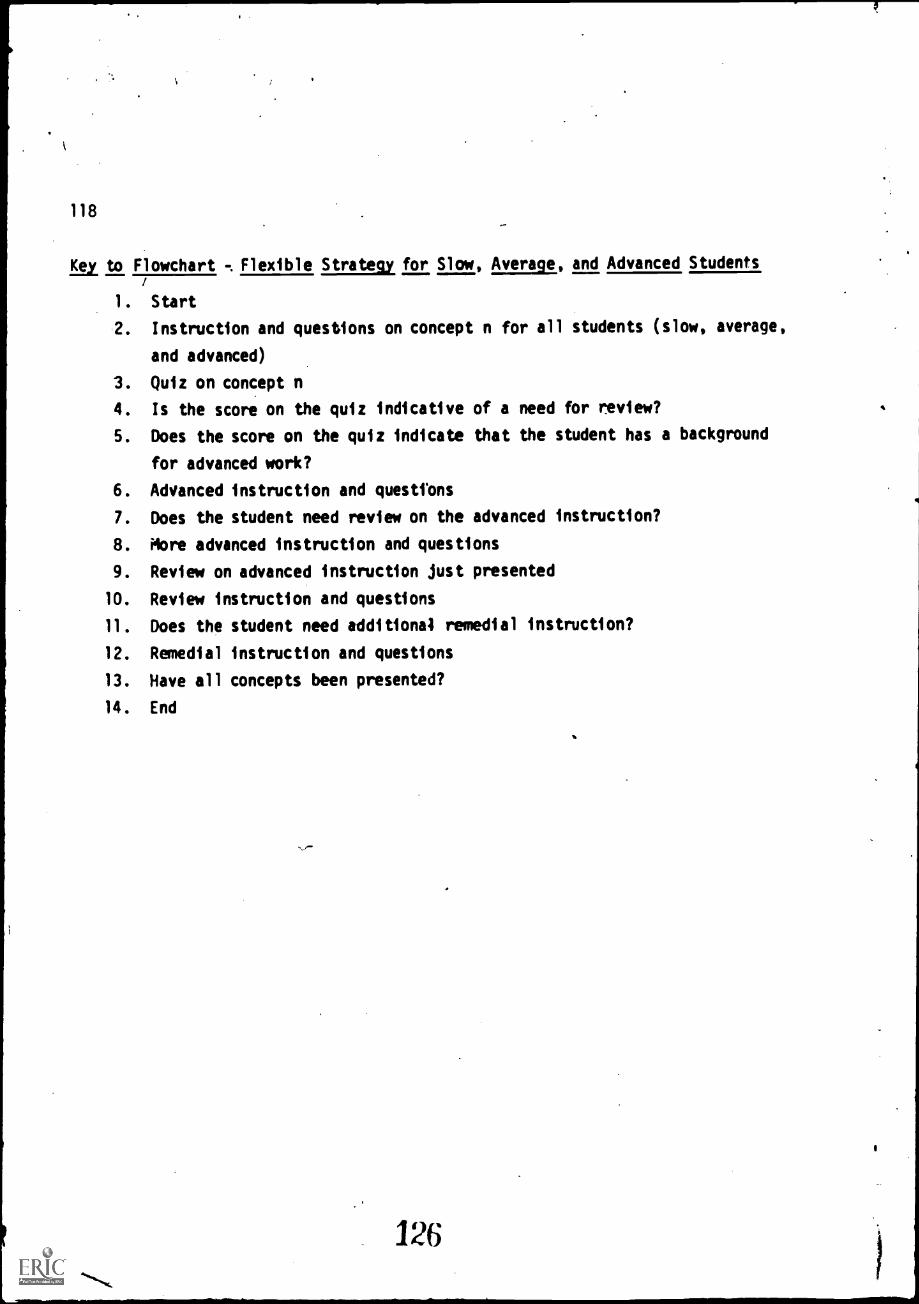
118
la) to Flowchart Flexible Strategy for Slow, Average, and Advanced Students
1. Start
2. Instruction and questions on concept n for all students (slow, average,
and advanced)
3. Quiz on concept n
4. Is the score on the quiz indicative of a need for review?
5. Does the score on the quiz indicate that the student has a background
for advanced work?
6. Advanced instruction and questfons
7. Does the student need review on the advanced instruction?
8. More advanced instruction and questions
9. Review on advanced instruction just presented
10. Review instruction and questions
11. Does the student need additional remedial instruction?
12. Remedial instruction and questions
13. Have all concepts been presented?
14. End
126

Flexible Strategy for Slow, Average,
and Advanced Students
6Yes
8
I.
3
10
11
Yes
12
Fig. 8. Flexible strategy for slow, average, and advanced students.
127

1 20
Key to.Flowchart - Shorter Sequ.ence for Better Student
1. Start2. Presentation of section n3. Quiz
4.. Did the student know the content well enough to proceed?5. Rapid preview of the next section6. Student is' asked whether he would like to skip the next. section7. Is there more material to present?8. End or test
128
tt
S.
4.
./

. _Shorter Sequence for Better Student-
Fig. 9.4b., Shorter sequence for better'student

Kei to .Flowchart - Sequence and Review Based on Errors Madea
1. Start
2. Choice of instruction or quiz
3. Instruction which could incl ude.any number of steps
.4. Quiz on instructional material from Block 3
5. Branch depending upon number of errors in quiz: (If there are no
errors., student goes on to new section. If criterion was met,
student is given reyiew on the _questions he answered incorrectly.
If criterion was not met, student is branched back to instruction.)
6. Review is available on all questions; however, student is 9iven
review on questions he answered incorrectly
7. .Continuation of course
9_..rom Penn State's course segment Scientific Notation, Project No. 5-85-074,
IBM 7010 or 1410; author: Joseph Ritchey.
ANA
130

Sequence and Revieit
Based on Errors Made
L
,
, 123
Quiz
'3
Criterion Met
6
4
Lowcore
A 1 Correct
Fig. 10. Sequence ind review based on errors made.
_ 131

t
IT
124'
be adminfstered on the next lower level of the hierarchy. If criterion is met,
instruCtion begins at the next higher level of the hierarchy; if criterion is
not met, a quii would be adm4nistered on the next lower level until a.level was
found for which the studr had the necessary prerequisites (see Figure 11).
Student-Selected Sequences
There are instructional sequences wherein it may be desirable to deviate
, from a definite order of presentation within a specified framework and allow
the student to make a choice in regard to the presentation of material. Options
could be to skip a section of a course, select the order to study required
topics, or choose to review Or not.
Student choice of additional practice or test. The student has the choice
of receiving an explanation, practice problems, or a test. The only difference
between &ping practice problems and the test is that during the test, counters
are used and the student must answer so many consecutive problems correctly in
a certain period of time in order to proceed to the next section (see Figure 12).
Student given option to skip section of course. For each section, the
student is .given a preview and an option to skip that section. After all the
sections are completed or skipped, the student is tested on those sections he
selected to skip. If the,test reveals tnsufficient competency, he is branched
back to these sections for ihstruction (see Figure 13).
Type of sequence through course chosen la student. Student is given the
choipe to proceed through the regular programed sequence, a self-structured
seq4lence, or a quiz. If he chooses the regular programed sequence, he goes
through each of the concepts in order and then to the quiz. If he chooses the
self-structured sequence, he can go through the instruction on the concepts and
quiz questions on each concept in any order he chooses. If he chooses the quiz,
he gets an opportunity after the quiz is completed to choose the concepts he
would like to review. Depending upon his score on the quiz and the way in which
he has chosen to goi) through the program, he is given various kinds of feedback.
The feedback may consist of his score, an explanation of those questions he
answered incorrectly, an explanation that goes along with eich,item under each
multiple-choicc question that student can choose, and a statement telling him
on which concepts he has shown competencey (see Figure 14).
132

125.
1
133

126
Key to Flowchart
Hierarchical. Instruction Beginning at Highest Competency of Student
This flowchart gives the logic involved in one branch of the hierarchy of
the course content.
1. Start
2. Quiz on the competencies of the highest, level of this branch of the
hierarchy
3. Was criterion met on the quiz?
4. Quiz for the competencies at the highest level of another bra.nch of
the hierarchy
5. Did the student come to the criterion quiz after receiving instruction
at the highest level of this branch of the hierarchy?
6. Quiz on the competencies of the next lower level (level 2) of the
hierarchy
7. Was criterion met on the quiz?
8. Has student received instruction at this level two successive times
without achieving criterion?
9. Instruction on the highest level (level 1) of this branch of the
hierarchy; (The instruction may include remeilial instruction for the
student passing through the instructional sequence a second time
after failing to meet the criterion on the quiz.)
10. Quiz on the competencies of the next lower level (level 3) of this
branch of the hierarchy
11. Was criterion met on the quiz?
12. Instruction at level 2 of this branch of the hierarchy
13. Processing may continue in one of three ways:
a. Quiz on the next lower. level of the hierarchy with the same
logic being followed as the logic for other criterion quizzes
b. Branch to another section of the course which is considered to
be a prerequisite for this branch of the course
C. Instruction at this level , which would be the lowest level of
this branch of the hierarchy

Hierarchical nstruction Beginning at
Highest Competency of Student
6
9
-c9
127
lo
(13
Fig. 11. Hierarchical instruction beginning at highest competencyof student.
135
1
1

128
Key to Flowchart - Student Choice of Additional Practice or Test
1. Explanation of options available; student makes"his selection
2. Did.the student choose to take the test first rather than having the
explanation or practice?
3. Zero is loaded into switch n which records that the student is doing
problems for.the test
Did the student choose to have the explanation of procedure?
5. Explanation of procedure is given and the student proceeds with
practice problems
6. One is loaded into switch n which, records that the student is doing
problems for practice
7. Problem randomly generated by the computer is presented to the student
8. The student responds
9. .Was the response correct?
10. Branch-depending upon switches and counters; (If student is doing
practice problems or has met the criterion on the test, response
latency ii given next. If more test problems are required, student
receives a new problem.)
11. Counter used to count number answered correctly in test is incremented
12, Response latency tyPed out to student at end of each p.Ictice
problem and end of test
13. Branch depending upon whether student is doing practice problems or
the test
14. Student has choice of more practice problems or the test
15. Branch depending upon response latency on the test
16. Next section"of course similar to this one
17. Inftialize to zero counters and switches for student taking test in
order to record how many consecutive problems answered correctly
18. Since student did not match the correct answer, the correct answer is
stated along. with an example of how it was.arrived at
19. Is student taking test? If student is doing practice problems, he
goes back to the same question and answers it again; if doing test,
counters and switches are initialized to zero
136

Student Choice of Additional.Pactice or'Tesi
5
Test
fy 6
4,
1
129
4
Correct
Practice problems orcriterionmet on testi
12
OWncorrect,
8
18
Practic
No
17
too long
*TestPractice.
Test
mecriterionmet ,
Fig. 12. .Student choice of additional practice or test.
137
11
16
441'

130.
Key to' Flowchart.- Student Given Option to Skip Sections of Course3
1. .Begin
2.. Preview of section n, including a content outline
3. Is the'student following a flexible 'sequence? (This can be determined
by a pretest, by the instructor, or bY previous 'work in the course.)
4. "Do you want to skip this, section?"
.5. Pigesentation to sectionn material
6. Did the student know the material;well enough to proceed?
7. ,Remed1al .instruction given on section n
8 . Student is al lowed to decide whether 'or not ne wi 11 receive a repeat
presentation of. the material in the section just covered; option is,.
given even if student ichieved cr_frterion
'9. Has--the student been through the entire course prior 'to this? ,
10. ."Did the student skip section n?" Beginning with the first sec,tion;
a check is made to determine which sections were skipped'
11 Test on section n
,,Did the'student do well enough on the test?
13.' "Do you want to study section :ri?" Option is given even, though
criterion was met
14. Has student completed or been .tested on all sections?
15. End
3From Penn State's course segment Audiology, Project No. 5-1194 IBM 7010
or 1410; authors: Bruce M. Siegentheer, Jeffrey Katzer.
138

Student Given optim to
Skip Sections of Course
)
131
/-
5
2
0
11
Ca
Yes
Fig. 13. Student given option 'to skip sections of course.
139

1
I.
I.
Ett) to Flowchart - Type of Sequence Through Course Chosen .12x.Student4
1. Start2. Introduction3: Choice of programed sequence (A), sel?-st?uctured sequence (B) or
quiz (C)4. Instruction on. concept n5. Branch depending on choice made in step 3; for the regular programed
sequence, stepS 4 and 5 are repeated asmany times. as., the number of, concepts to be presented, eachtime a.new concept being presented.
6. Have all concepts been presented?
7. Choice of instruction on any of the concepts or tbe qui.z:on theseconcepts
8. Quiz oh concept n; for regular programed sequence, quiz Includes allconcepts
9. Branch depending on choice made in step 3 (A, B, or c)10. Score on most recent questionsirevealed to students and opportunity to
review specified concepts given and carried out11. Brahch depending on choice made in step 3 (B or C)12. Branch depending on,total quiz score13. Student told that all .answers were correct'
° 14. Branch depending on choice made An step 3 (A, B, or C)15. 'Statement made to student cqncerning completion of instruction
;-16. End
17. Branch made depending 'on choice made in step 3 (A. B. or C)
18. Student is told on which concepts he is competent and those on whichhe needs instruction
19. Choice of going to end or back to po,int where choices can be-made of. the concepts on which to receive instruction
20. Explanation given on each response which was incorrect21. Branch depending on choice made in step 3 (A or B)
22. Student can select from al 1 quiz questions and receive explanationsregarding them
23. Student can choose whether to go to end or to be given opputunity toreview
4 From Penn State's course segment Educational Measurement,project No. 5-85-074, IBM 7010 or .1410; aut ors:, Keith A. H711 andHarold E. Mitzel.
140

Ii
I.
Type of Sequence Through Course
. Chosen lox Student.
A. Regular Programmed Sequence
B. Self-Structured Sequence
°C.. Quiz
Fig. 14. Type of seqUence through Course chosen by student.
#\ 141
133
4
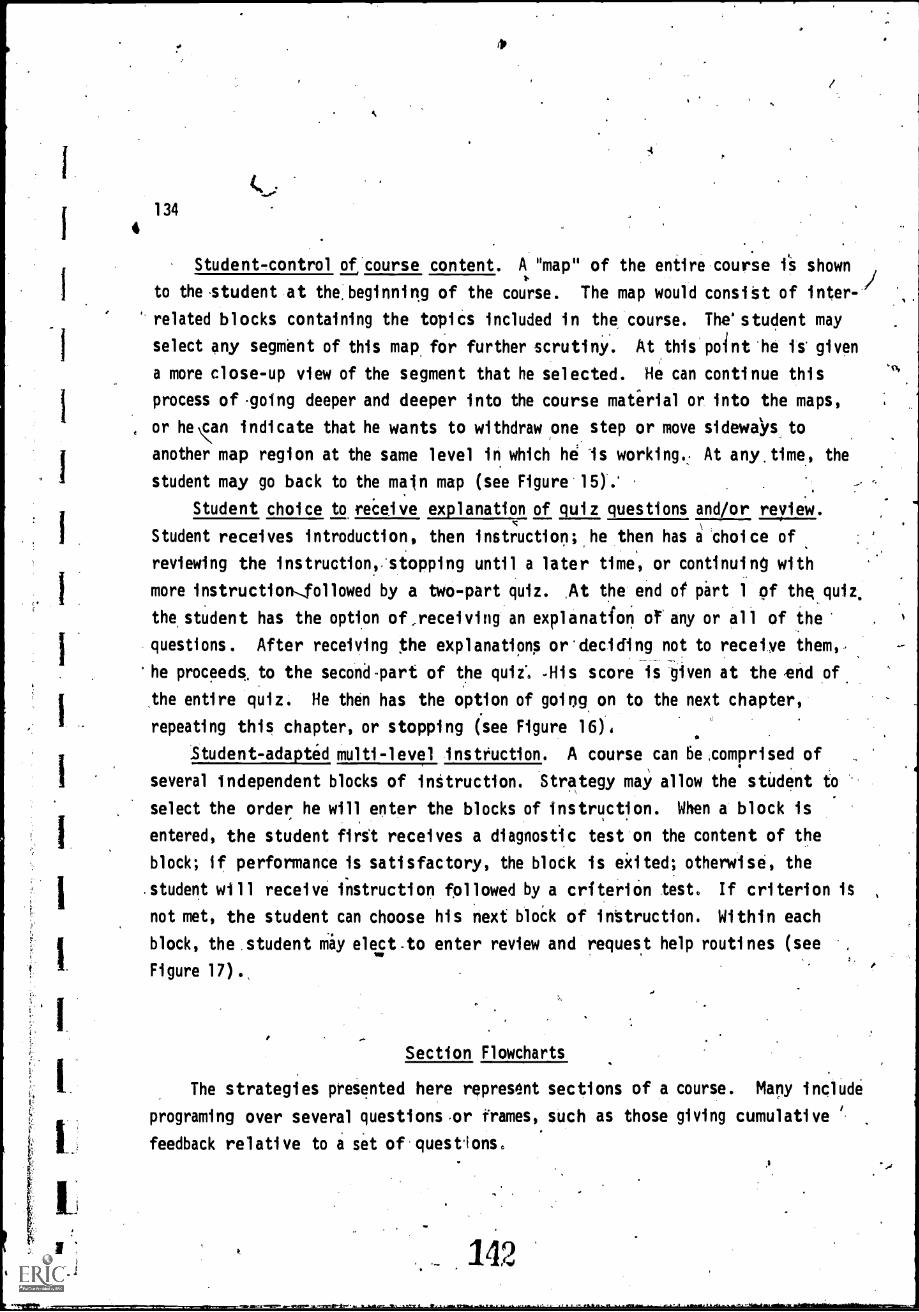
4
134
Student-control of course content. A "map" of the entire course is shown
to the student at the.beginning of the course. The map would consist of inter-/
related blocks containing the topics included in the course. The student may
select any segment of this map for further scrutiny. At this point he is given
a more close-up view of the segment that he selected. He can continue this
process of going deeper and deeper into the course material or into the maps,
or hean indicate that he wants to withdraw one step or move sidewaYs to
another map region at the same level in which he is working.: At any.time, the
student may go back to the main map (see Figure 15);
Student choice to reeeive explanation of quiz questions and/or review.
Student receives introduction, then instruction; he then has a choice of
reviewing the instruction, stopping until a later time, or continuing with
more instructionfollowed by a two-part quiz. At the end of part 1 Qf the quiz,
the student has the option of,receiving an explanation of any or all of the
questions. After receiving Pie explanations or deciding not to receive them, -
'he proceeds, to the second 'part of the quiz'. Ais score is given at the ,end of
the entire quiz. He then has the option of going on to the next chapter,
repeating this chapter, or stopping (see Figure 16),
Student-adapted multi-level insteuction. A course can be ,comprised of ,
several independent blocks of instruction. Strategy may\ allow the student to
select the order he will enter the blocks of instruction. When a block is
entered, the student first receives a diagnostic test on the content of the
block; if performance is satisfactory, the block is eicited; otherwise, the
student will receive instruction followed by a criterion test. If criterion is
not met, the student can choose his next bloek of inttruction. Within each
block, the student may elect-to enter review and request help routines (see ,
Figure 17).
Section Flowcharts
The strategies presented here represent sections of a course. Many include
programing over several questions .or frames, such as those giving cumulative
feedback relative to a set of questions,

I.
1.
I.
)
Ej
t:.
143
4
v
135

136
Cu.! to Flowchart - Student-Control of CoUrse Content
1. Start
Main msap of thecourse is shown to student; (sections on the main map
could be descriptive chapter titles)
3. Did the student choose to explore section 1 further?
4. Sections 2,-3, and so On, all of which have flow similar to section 1
5. Map indicating subsections of section 1 is shown to the student;
(this map could be chapter subtitles)
6. 'Was "main map" chosen?
7. Was a related section at the same level selected?
8. Was subsection 1 chosen by the student?
,9. Supsections' 2, 3, etc., of section 1; ,:ach is similar in flow to
subsection 1
10. Items for study within subsection 1.are shown in map form to the
student
11. Was "main map" chosen?
12. Was a related subsection at the same level selected?
13. Was the subsection map for section 1 selected? ,
14. Was item 1 of the map selected?
15. Items 2, 3, and so on of subsection the flow in each is similar
to that of item 1
16. Instruction on item 1; (within each phase of instruction, the student
is allowed to select different topics for study by Choosing other
parts of the course map)
17. Did the student choose to go back to the "main map?"
18. .Did the student select related initruction in subsection 1?
19. Did the student select the subsection map for section 1?
20. Did the student select the item map in subsection 1?
21. Continuation of instruction on item 1

Student-Control of Course Content
SECTION 1
SUBSECTION 11
1
1,1
'
1
1 I
I
1
1
I
1 1
I
I
I
I 1
I
I .1
I II
137
,. 400
>11117. /
Yes Yes
Yes No Yes
YcNo No
Fig. 15.
1
1
1
MOWN, IIMMIM, =IMP
ITEM 11
Yes I
1
1
1
1
1
No
1
1
Yes
--Student-control of course content.
145
1
I 1
I 1
I 1
I I
1
I
1 I
11
1 1
1
1
I I
I I
1
II.1 I
I
1
1
1
1 1
1 I.
I III
I
...

138
Kty. to Flowchart
Student Choice to Receive Explanation of Quiz Questions and/or Review5'
1. Start
2. Introduction to the course segment
3. Beginning of instruction
4. Student is given option to receive either a review of previous instruc-
tion, or instruction on new material
5. Review of previous instruction
6. Instruction presented on new material
7. Part 1 of quiz
8. "Do you went an explanation of question 1 in part 1 or quiz, or
all questions explained?"
9. Explanaticm of question n
10. Nes option for all questions been given?
11. Do you want an explanation of next question?
12. Explanation of each*question in Part 1 of quiz
13. Part 2 of gut;
14. Feedback is given: "Your score for Part 1 and 2 of quiz is .H
15. Student is given option to proceed to the next section; repeat
this section; or stop
16. Next section
17. Stop
5From Penn State's course segment Management Accounting, Project No. 5-1194,
IgM 7010 or 1410; authors: Joe J. CraMer and Carl R. Palmer.
143
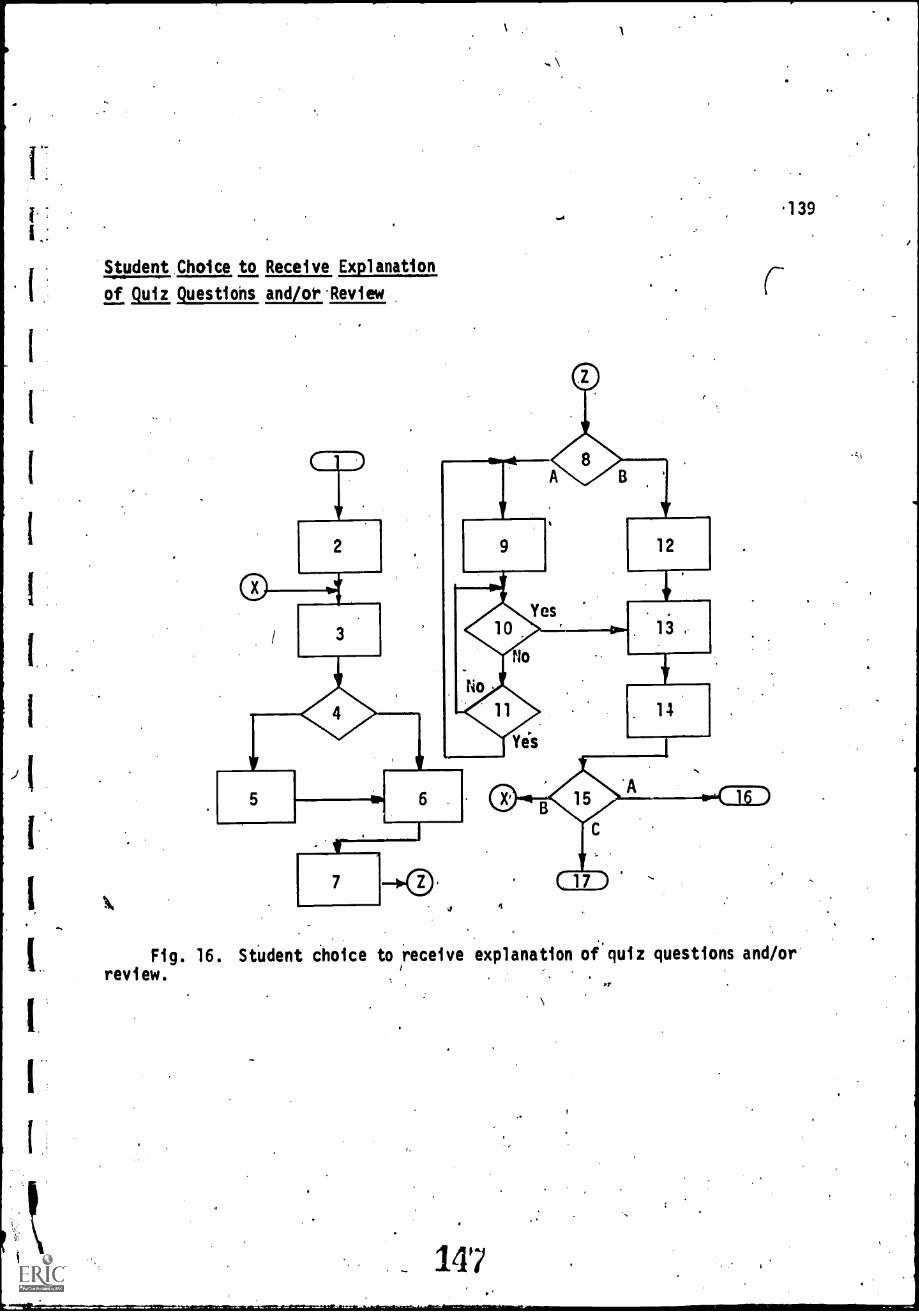
Student Choice to Receive Explanation
of Quiz Questions and/or.Review
7
,9 4
( 17 )
.139
Fig. 16. StUdent Choice to receive explanation of quiz questions and/orreview.
Pr

140
Kly. to Flowchart - Student-Adapted Multi-Level Instruction6
1. Sign on2. Introduction to course: list of topic areas3. Has.student completed smear technique?4. Did student elect to enter smearIechnique?5. Diagnostic test: smear technique6. Was student performance satisfactory?7. Instruction: smear, technique8. Does the student wish to review?9. Review: blood smear technique
10. Criterion test: smear technique11. Is remedial work required?12. Remedial: smear technique13. Has criterion been reached?14. Has student completed stage instruction?15. Did student elect to enter stage instruction?16. Diagnostic test: stage instruction17. Was student performance satisfactory?18. Instruction: stage.discrimination19. Does the student wtsh to review?20: .Review: stage discrimination21. Stage drill22. -Has student requested assistance?23. Assistance: stage drill24. Has student completed the drill25. Criterion test: stage discrimination26. Has student completed species diagnosis?27. Does student wish to enter species diagnosis?28. Diagnostic test: species.diagnosis29. Was student performance satisfactory?30. Instruction: diagnostic properties31. Is further instryction required?32: instruction: aPtifact discrimination33. Is further instruction required?34. Does the student wish to review?35. Review: species diagnosis36. Species drill37. Criterion test: species diagnosis38. Has student completed all sections?39. Off-line microscope test
140. Is remedial work required?41. Remedial: species diagnosis42. Sign off
6From Penn State's course segment Laboratory Diagnosis Of Malaria, Office
of Naval Research, Contract No. N00014-67-A-0385-0003, IBM 71516151F7410;authors: CDR M. Stirewalt Lincicome, MSC, USN; Richard BeaudoiN.HMC Deah
'Armstrong, USN (Ret.); HM1 Arthur Wentland, USN; Leslye Bloom.
_ 148

FLO
W' C
HA
RT
FO
R T
HE
LA
BO
RA
TO
RY
DIA
GN
OS
IS O
FM
ALA
RIA
IMM
EM
1.11
1=0
1.10
AM
MO
MM
I4/
MM
EID
11=
.MM
ilIIM
MIN
1
1N
O
Ct.
CD 01 Ct.
Cla
1,3 tl) 0. a. CD
CD
NO
El
NO
NO
YE
S
YE
S17
21
- S
ME
AR
TE
CH
NIQ
UE
S -
YE
S
wom
mo.
mm
mam
iw
NO
NO
CO
N T
R0
L
2 1
YE
S
20Y
ES
I
ST
AG
E D
ISC
RIM
INA
TIO
N11
MI1
10
41
.N
O
ON
EM
Ilrl
NIIM
OM
=0
H 3
0 1
.1
YE
S/L
.
NO
"T
ES
TI
-
:' ...
:-.4
s;-.
.-
',%-
. -i-
..;-
---
- 'r:
..
..."-
--
.--t
::-...
.* -
-.._
...... -.. -
1.' .
--.-
t-"-
-- -
:-7.
'--
..,..,
..z. :
**e
.".;
-,.
.9..,
. --.
:,s
......
......
..,..,
. .: .
,..1-
:-.-
-1-.
.--
--..r
.,..:.
7,1c
.:
,-
-t
s
-%_
-
-I
-SPt
C1E
.-4
.,-
O)S
titiM
INA
TI
-
-
--
--
,-r
.":;)

142
Giving Ciimulative Feedback
One of the primary advantages of computer-assisted instruction is thefacility eaih student is giverby providing feedback concerning his progress.
After information is accumulated about the studgt's performance, problems canbe assigned to additional instruction or drill . 1*-
s. Indicating response latency to student. Each.time the student answers a
question, his response iatency is added 'to a counter. When his answer is pro-cessed, he is told whether he .is right or wrong and how many seconds he spenton the question (see Figure 18).
Testing student and giving feedback -to student and proctor. This -routine/is designed for a test situation. The test is written in a manner that will /
present ten problems one at a time with the answers and problems remaining /
visible.. When the -student completes the last problem, the progiam analyzesall answers and-indicates to the student whether each answer is correct (seeFigure 19).
, Giving, information to proctor when student completes. an, instructionalsession. _When 'a student has completed an instructional session, it may bedesirable to have information on his performance: what part of the course hecompleted; how many questions he answered in sesSion; how many questions he
answered correctly-on first attempt; how many times did the student time-out;.and how many minutes was the student on the course (see Figure 20). ,
Flexible Course Flow .
One of the difficulties with conventional classroom teaching is that theinstruction cannot be made suitable fo'r a widek range of capabilities andinterests. CAI courses can be programed to allow for individual differencesand diff:iculties.
Student control of course flow. In the initial development f a coursethe author, cannot be certain that the selected content and organization of thecourie--4,s the most efficient for achievement 'of the objectives of the 'course.Even aftier revisions are made on the basis of student perfonnance and observa-tions by the stuitents, instructor, and others, a,program which does not allow-for indi'vidual differ:encestmay not achieve the objectives efficiently. °
150

.
, ,

144
litt to FIowchart - Indicating Resp'wise Latency to S'tudent7
1. Start2. Ihitialize to zero counter used to accumulate response latency
(ounter n)3. Update restart record so that if student signs off before the problem
is completed correctly, this will be the restart point4. Show the proper image on the image.projector5. Display the statement: Examine the image. What is the atomic number
of sodiUm?
6. Student may respond to the question
7. Add response latency to counter n8. Is answer correct? If so, go to 9, if not, go to 109. Display contents of counter n within the statement: It took you
seconds to answer the question correctly10. Display counter n within the statements: Wrong. You have now
spent seconds trying to answer this question.11. Next problem
7 From Penn State's course segment Atomic Energy, Project No. 5-85-074,IBM 7010 or 1410; author: David A. Gilman.
152
3.

k7;
Indicatiyig Response Latency to StUdent
A
2
5
Yes
Fig. 18. Indicating response latencY to student.
.. /53
145.

[1
LI
F.
liiea'
146
Ke.y. to Flowchart 7 Testing Student and Givin_g Feedback to Student and Proctor
1.. Start
2. Display example problem on the image projector
3. Display one problem and allow student to respond
4. Is student's response correct? If so, go to 6; otherwise go to 5,
5. Load 0 into appropriate switch
6. Load 1 into appropriate switch'
7. Move the problem label' (A, B, etc.) into a buffer area for later use
to display to proctor which problems were correct
8. Add 1 to total-correct counter
Are all the test problems displaYed? If not go to 3; otherwise go
to 10 4
10. Test the switch recording-correctness Yf each problem. If equal to
zero, -go..to 11; otherwise go to 12
11. Indicate a wrong answer by placing the letter 'w' beside the appro-
priate problem label and go* to la12. Indicate a correct answer bY placing the letter beside the appro-
priate problem label and go to 13 ,
13. Have all switches been tested? If so, go to 14; 'otherwise go to 10
1.4. Send proctor message; that is, display 'contents of aPpropriate buffers,
counters, and switches at proctor station
15. End of test
154
t
'
to

11
tj
Iii
II
Testing Student and Giving
Feedback to Student and Proctor
OW
Yes
11- 12
V.
dB
Fig. 19. Testing student and giving feedback, to .student and proctor.
155
147

148
Key to FlowchartGiving Information to Proctor when Student Completes. an Instructional Session8
1. Sign' on
2. Initialization \of cognters to be used for recording ofnumber ofotiestions answered, number answered correctly on the first attempt,_number of time-outs, etc.Body of instructih which uses .t e specified counters to recordinformation
4. Question is presp,nte and student has_ chance to respond
Did stude4 indicat that .he wants to sign' off instead of respondingto question?
6. Sending of messages to proctor consisting:of information on ihestudent's pirformance during the recent session ) ,
End of session; when student signs on again he.t'will be restarted 'atbeginning of the section in which 'he signed offAnalysis of response and continuation:of instruction ,
(
a
d
t
I.
8From Penn,State's course segments lagebra and General Math, stl. S. Office ofEducation through the School District of Pittsburgh,Wne contract Grant No4
.0EG-0-8-055230-3479, Project No. 5523; IBM 1500 system; authors: Carol Dwyer,Robert Igo, Terry Bahn, Diana Ryall.
156
9

Jr
LI
II
ft
Ii
Giving Information to Proctor.whenStudent Completes an Instructional 'Ses;ion
Poi
14'9
Fig. 20. Giving, information to proctor when\student completes an instruc-tional session.
157
/Is

ii
150
If while remaining in the basic framework planned by the author, the
student can control course flow, performance of the student may be improved;
and, ,in addition,..when the instructor reviews.the flow through the Course
selected by the,student, he may receive clues as to where revisions are needed:
Computer-assisted instruction can provide great opportunity for student-control
of course flow. At each question, prior to answer analysis, tests may be made
for a special cOde which, if typed by the student, indicates a request for
one of the ofirtions- available in the course that will alter course flow (see
Figure 21).
Sequence based on number of consecutive problems which are correct. A
student who has mastered a concept will lose interest if he is required to
answer question afte'r question using this concept. In a set of practice .
exercises, -flexibility can result by.hiving many exercises available and
branching out of the sequence of exercises if the student answers correctly a
specific number of consecutive problems (see Figure 22).
Allowing student to change responses. The student is given four problems
to solve. He answers each one individually in' order.with his answer being.
placed next- to the corresponding question. After the responses have been
given, but before feedback as to correctness is made, the student is given
the option to change any of his 'answers. After any desired changes are made,
analysis is done and feedback is given on all problems (see Figure 23).
Queistion-Level FlOwcharts
Question-level flowcharts involve the strategy required for a single'
question, problem, or frame. The- strategies presented hetv are merely a
representative sample of possible sequences at the question or frame level.
Individualization of Presentation
One criticism of computer-assisted instruction is that ,receiving instruc-
tion via a machine is too impersonal. However, there are means by which'an
author can decrease the feeling 'of the student that he is alone with a powerful
mechanical device.
en'
158

twegion
-
a

4
152
icejt to Flowchart - Student Control of Course Flow-
1., Stift of lesson
'-/ .2. -Series of problems
Problem imm'ediately, preceding the current problem
4. Preliminaryttruttions,for the current problem are presented
5 The problemisi3resented
6. Student may respond to the question
.7. Was 'an uhaviilableoption requested?. .
8. .Nlessage that.the selected option is not available at this time
9. Was a.request for -help\frod-the proctor made by the student? thatis, did the student type )
10.. Proctor message is sent ltliA.* proctor: station and the student istold tO w6it for atsistance, '
IL' Did the student reluest.a rev,feri of the lesson?-that is, did thestudent type "-r"?.
1)'
12. Review questions and discussion of the material covereirthus far inthe current lesson and pertinent information from previous lessons
13. Did-the 'student request a summary of the current lesson? that is,did the student type "7s"?
14. Presentation of summary statements of information presented in thecurrent lesson
15. Did.the student request to gocurrent.problem?.that is, did
16. Did'the student request to gothat is, Aid the student type
back tb the beginning of thethe student type "-p"? .
back to the previous problem?b
17. Did the student request.to go back to the beginning-of thecurrent lesson! that is, did the student type "-1"?
.18. /Did the student request to go to the end of the current.lesson?that is, did the student type "-e"?.
19. 'Did the student request to go to the next problem in sequence?that is, did the student type "-n"?
20. Did the.student type the ctrrect answer to the question?
21. Feedback fOr correct response
22. Next problem in sequence .
^ .23. Additional answer analYsisinstruftions.
24. End of the current lesson

Student Control of Course Flow
I.
153
1
1
we
No
4**N° 4toY.'esYes Yes
, ^Tize T
Fig. 21. Student control'of course flow.
I.

1
:
154
Ett,to FlowchartSeimence Based on Number Of Consecutive problems which are Correctf
1 Start .
2. . Initialize specific counters for scorekeeping and give instructions3. Question is presented and student responds.
4. Is the answer correct? If yes; gO tà 5-; if not, go to 125. Give feedback -that response is correct; add 1 to the total-correct
counter; add 1 "tol-,the counter storing 'the number of consecutivecorrect 'problems 0 _
6." Hii .criterion of 'getting a certain numberof cOnsecutive problemsairrect been Met? If Yes, go to 7; otherwise, go to 8
7. Indfcate,that. criterion, has been'.met and go on to next section8. Have 'all, learnimg exercises been presented?
9. Qid the.student haiie 60% of all problems correct?.1(1.- Present several practice problems with specific feedback when
i ncorrect11 . *Give intpris ve remedial instruction' and practice 'exerci ses12: Indiate to the: student that responte .is incorrett- and give'specific
feedback to assist the studdnt.in unde'rstanding how ,to correctlyantwer the problem
13. Initialize to zero the co.unter in which the number: of consecutivecorrect problems is stored
dcz,
A
I.

I
Sequence Based on 'Number of
Consecutive Problems which are Correct
12
13
11
Fig . 22 . Sequence based, on nuniber of .consecuti ve probl ems whi ch are
correct.
N_
163
155

156
lity. to Flowchart - Allowing Student to' Change Responses9
1.
2.
3.
Four problems are presented
Student is allowed to respond to one ofthe questions; response isplaced beloiv the question
The response and whether it is correctis recorded
I. Have all questions been answered?
5: Student is asked whether or not heif so, go to 6, if not, ge'to'10
If so, go to 5; if not vo to 2
would,like to change any answers;
1
6. Student is given the opportunity to list the nUmbers of the problemshe, would like to change .
7. Has the student been given the opportunity to change all prob)lemsthat he wanted to change? If yesfgo to 10; if no go to 8 .
8. Has student indicated that he woul'd like to change problem n? If
yes,- go to 9; if no go to 7
9. Student respondS again to problem n; his answer and whether or not itis correct is recorded in place of.the former results
10. Student is told ighich answers are correct and which are incorrect
11. Next problem
e
9From Penn State's course segment Algebra, U, S. Office of Education throbgh
the School District of Pittsburgh, prime contract Grant No. OEG-0-8-055230-3479,,Project No. 5523, IBM 150 system; authors: Catherine Folger and John McNear.
e
164
r,

Jr
I (
El
Allowing Student th :Change Responses
(r)
A
4
10
CDD
Fig. 23. Allowing student to change responses.
4
ii - 165
157
.

I.
7
158 .
Introduction df new concept.. Assume. that a new concept is to be intro-
duced. Since the purpose of the question-to be asked is to provide a provoca-
tive introduction or bridge towhat comes- next, the student's respianse should
not be checked for correctness. However, when the student has completed his
response, he is presented with some correct answers before continuing.
Flow proceeds directly in Order:
1. Display question: What is a noun?
2. Student is allowed .to. respond
3. Feedbaok is presented toile student that begins, "You should have
typed. . ."
4. The .student,indicates when he is ready to go on
Personalizing .a course by. using .student's name: .It possible to make
the student feel that the course has been individualizer using his name in
asking questions 'and i givi:ng him feedback. This can e' done easily by asking
the student to type his first .name at the beginning of the course or by
retrieval- 'of the student's name'from his record.
- Flow proceeds LI order:,
1.. 'The student is asked a question
2. The sthdent responds
3. Appropriate feedback and the student's Iname'are displayed
Displaying student's response. It may be desirable to display the.response
made by the student. Any response the student makes is saved until the next
response request. Therefore, all that is necessarY is for the response to be
displayed in an appropriate place.
Procedure could be:
Display the phrase, "41'ou responded": followed by the student's response
and the question, "Is this what you'meant to say?"
Requests. Made ta, Student
Students participating in computerd=assisted instruction Ire usually accus-
tomed to conventional classroOm instruotion in which many of their questions
are answered and 'individual problemS may ,be solved with a brief request. With
CAI, students may have the option to request. individual assistance from a
teacher and also to make other requests.
166

Li
1.1
159
Student inarequest assistance from proctor. Situ/Mons may arise in ,
which the student reaches an impasse in the course. One way this could happen
is within a question frame that required the student to giave a correct answer
before" he goes on 'to the next frame, but the studen ,p. cannot determine the co
red answer from the hints given. The student cannot go:on without help, and
if the helalreclired is not programed into the course he can enter a request
for help from the proctor who could then give him individual assistance (see
Figure 24).
Student may request correct answer. The author allows the student to
request the torrect answer to a question by entering the word "go." Once he .
has been given the correct answer, he must type it before he can proceed to
the next material. If the response "go" is not found, the student's response
is compared in the usual manner with' anticipated correct and incorrect answers,
and feedback is_ given (see Figure 25).
Student tax indicate need for review. The student may be told before
beginning a series of questions that if.he feels a need for a review, such a
request may be made by tyPing the word "review" at the time of a response
request instead of entering a response. One of the anticipated responses for
each question would be "review" which, if matched, would be followed by a
branch to an .appropriate review sequence (see Figure 26).
Ej. Fl exibl e Feedback
Ii
ii
'Since computers have the capability to use information about the student,
varied feedback can be stored in, the.program, and its use can depend on the
student's personality, background, or performance..
Feedback adjt.tsted to student. Students with many personalities and past
achievement and differing in sensitivity and temperament take courses presented
by .computer-assisted instruction. In a course with one path that 'all .students
follow, it is possible to make feedback appropriate to the ,student. Several
types of feedback may be .avail'able throughout all of the course or within,
specific sections such as a review .prior to a quiz'. As examples, here are
three types: ..

.
160
_
Key_ to Flowchart - Student Max Request AssiStance From the Proctor
The student-may,be/ given the Option to interrupt the flow qf.the counse at
.any. time to.request asistance. The dotted lines indicate student-initiated
flow..
1. Start of problem
2. Question is presented
3. Student is given opportunity to respond
4. Was answer correct?
5. Appropriate feedback is given and student goes to next problem .
6. Was this the first incorrecloresponse?
7. First hint0
8. Was this the second incorrect response?
9. Second hint ._
10. Third hint; which is given on, all subsequent responses
11. Proctor message is sent by the student that he needs help; assistance
is given by the proctor either on or off line; when the student is
ready to cmitinue, the computer automatically branches to the begin-
ning of the current problem

Student tyky. ReqUest Assistance
From the Proctor
1
IL
11
4,
161
r-
10
Note: Dotted lines indicate points where assistance may be requested.
Fig. 24. Student may request asiistance from the proctor.
1694.

162
Itex o Flowchart - Student h_lay. Request Correct Answer1°
1. Entry to problem
2. Problem is presented
3. Question is asked
4. Is response "go?"
5. Correct response is given and student is told to type response
6. Additional response analysis takes place
7. Continuation of course
2
10From Penn State's course.segment Atomic Energy, Project No. 5-85-074,
IBM 7010 or 1410; author: David Gilman.
ti 170
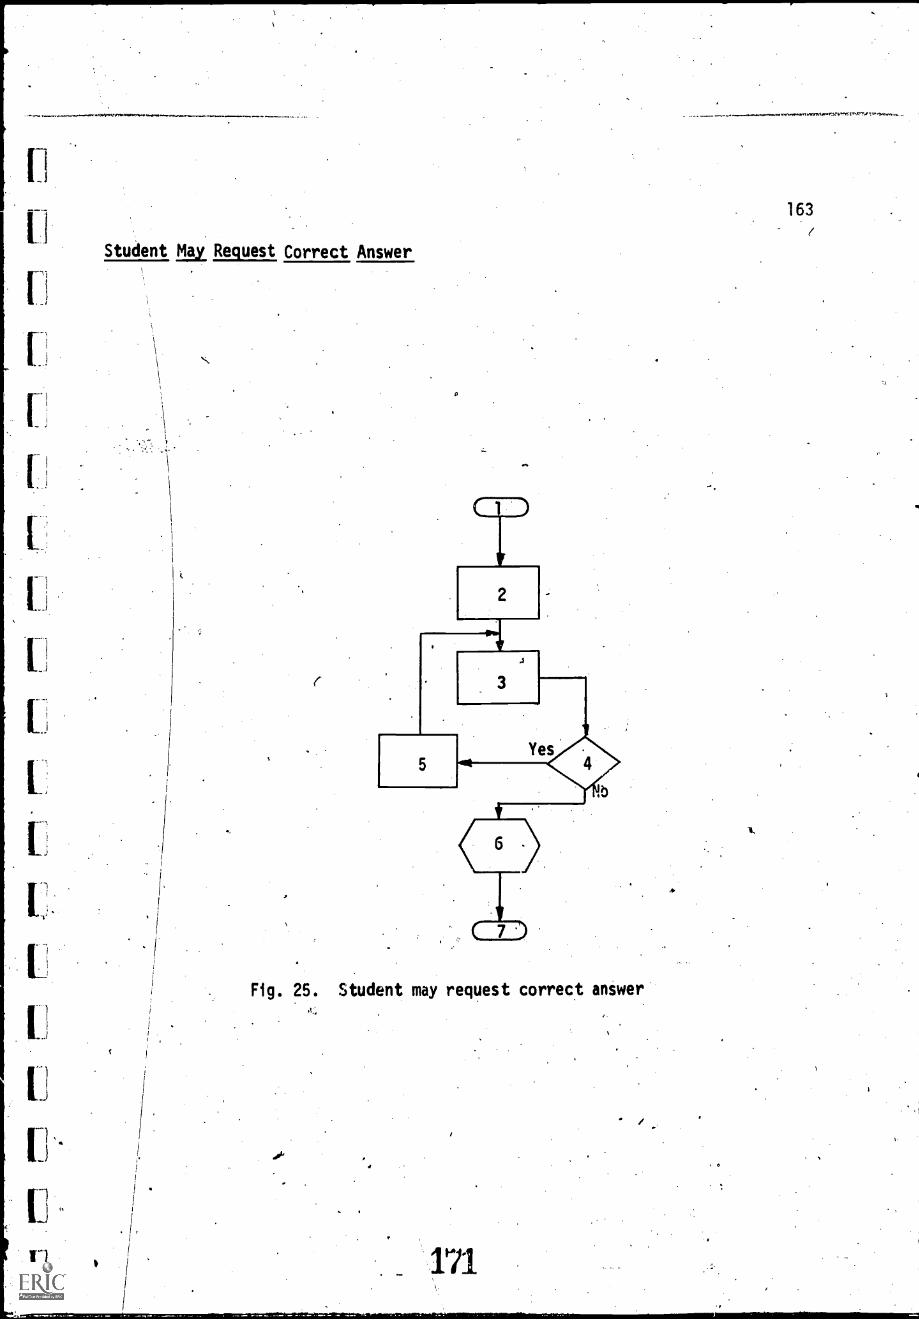
Li
-;)
[
[
Student May Request Correct Answer
11
L
171
2
5
7 *)
Fig. 25. Student may request correct answer
163

t,
164
S.
Cal to Flowchart -.Student Indicate' Need forReview
1. Question is presented
2. Student responds to question
3. Did the student mateh the correct answer?
4. Did the student match a specific wrong answer?
5. Specific feedback is given
6. Did the student type the word "review ?
7. Review
8. Feedback given for an unrecognized response
9. Feedback for correct response
10. Next problem
172
0

[ii
In.._J
II
Student jay.r. Indicate Need for Review
I\
5
Fig. 26. Student mdy indicate need for review.
I
173'
4
,.;
r:4)7.'2'.;

1. For the "well-adjusted high-achiever,:' feedback wOuld beshort and could include some information about the gapbetween the student'S ability and his performance.
2. The "non-extreme personal i ty 'and/or average-achiever" wouldrecei ve the common type feedback .
3. For. the "unconfident low-achiever," feedback would be encouragingand extensive.
When the decition relative to the 'type of feedback applicable is made,a counter' can be loaded with one, two, or three corresPonding to the type of'feedback. :This .counter can be,tecked at the 'approPriate points in the courset6 determine whi.ch of the three arailable feedbacks is to be used (see
Figure 27). .
Varyirig feedback for each response attempc. Common-programing usually
provides varying feedback for several anticipated responses. However, many
programers do not provide different feedback, for example, if the correctanswer is given on the second, third, or fourth attempt as ,qpposed to 'the
first attempt Feedback of "excellent" on the fourth response to a basicquestion,may ma e a student lose confidence in the course program. Ifdesirable, it is ithin the capabilities of CAI to program varying feedback tobe used nt response attemPts. In the example included here, theflow f r a match o .the correct answer is shown. The same logic could be
followe or each anticipated incorrect response (see Figure 28).
Multiple-level cfuestion. "Behind the scenes" in a question from the main
flow"of a, course, there' may be a ,great deal of course material which is notpresented to the student)who quickly .coMprehends the objective of the .particularlesson; this student ansWers the question correctly and imedlately goes to
the next problem in the main flow. However, as 'in this example, for each ofthe three incorrect choices in the multiple-choice question from the main flow,different feedback is, given and a thought-provoking question is asked. Then,
depending upon the response to this question, a review may be given, an addi-,.-
tional question may, be presented, or some resulting conclusion is stated fol-lowed by transfer back, to the Original main flow question. If the studentanswers the main flow question incorrectly on his second' attethpt, he is givena review.

167
- 175.
1
1
l

168
Ket to flowchart - Feedback Ad usted to Student
1. Start
2. Setting of counter n to one, two, or three cOrresponding to feedback
type on the basis of some judgment as to the student's personality
or ichievement
,3. Presentation of a question; student responds-
4. Was response correat?
5. Should feedback 1, telling the student he is ccirrect, be given; that
is, is counter n equal to one?
6. Feedback 1, telling the stddent he is correct, is given
7. Should feedback 2, telling the student he is correct, be given; that
is, is counter n equal to two?
8.. Feedback 2, telling the student he is correct, is given
9. Feedback 3, telling the student he is correct, is given,
10. Should feedback 1, telling the student he is incorrect, be given; that
is, is counter n equal to.one?
11. Feedback 1 , telling the student he is incorrect, isigiven
,12. Should feedback 2, telling the student he is incorrect, be given?
13. Feedback 2, telling the student he is incorrect, is given
14. Feedback 3, telling the student he is incorrect, is given
15: Next problem in sequence
A
176

Feedback Adjusted to Student
z
169
Fig. 27. Feedback adjusted to student.

s.
170to
Ita to Flowehart - Varying Feedback for Each Response Attempt
1. Start and initialization of the counter used to record number of
response attempts to this problem (counter (n)
2. Question is presented and student responds
3. Counter n is incremented by one
4. Did student give the correct .answer?
5. Additional answer analysis instructions and apprsopriateii" dback
6. Does counter n contain 1?
7. Feedback 1, for response correct on first-attempt; is given
8; Does counter n contain 2?
9. Feedback 2, for response 'correct on second attempt, is given
10, Does counter n contain 3?
11. Feedback 3, for response correct on third attempt, is given
12. Feedback. 4., for response correct oil fourth or later attempts, Is given
.13. 'Next problem

4
I
! I
ii
Varying Feedback for
Each Response Attempt
2
5
Yes
No
Yes
No
Yes11
12
Fig. 28. Varying feedback for each response attempt.,
179
171
172
The main flow question used in this flowchart appeared in a programed
textbook by Heimer and others (1963).
At any time during the multiple-level question, if the student does not
select from the Stated choices, he is branched to a special rbutind to inform
him of this condition and is given a.chance to respond to the question again.
Also, after each special'review, a branch is made back to the original
question (see Figure 29).
Editing Student's Response
It would be unreasonable to assume that each student will type the
correct answer in one definite sequence of characters. Since the computer
records by characters, it may be necessary, in order to eliminate a possible
source of confusion, to delete irrelevant characters from a student's response
prior to analytin, whether it is correct. Several examples of what can be
done in computer-assisted instruction are as follows:
L 1. replace _commas and periods with a space or delete
specific riunctuition marks
2. compress all spaces from the student's response
3. compress multiple spaces into one space
4.. replace capital letters with lower case
5. replace an 1 (el) with a 1 (one)
In addition, words can be replaced with synonyms.
Downshifting response characters and replacing words with numbers. The
author specifies that the quantities 12 and 3 appear in the student's answer
in that orsier for the answer to be accepted as correct,'but he wishes to allow
the student to input these.quantities as words, with or without capital letters,
or aS numerals.. He accomplishes this by editing the response in a manner to
delete.any shift characters from the student's response and to replace "twelve")
with "12" 'and "three" with "3," and then testing the student's answer for the
presence of 12 arid-3 in order (see Figure 30).
Replacing words in student's response with synonym. Often a word in a
student's response is acieptable as correct even though misspelled. The
exaMple which follows illustrates one way that-the*student's response may be

173
litz to Flowchart - Mul Questionll
1 Display question:,
When we write 672, it is understood that x-2 00
a. > b. > c. = d. <%2. Did student select .b? If so, go to 3; othei.wise, go to 5
3. Give feedback; You are correct
4. Next problem
5. Has student answered the question from the main flow (item 1) incor-rectly twice? if so, go to 6; otherwise go to 8
6. Give feedback that student has answered incorrectly once again andbranch to a special review
7. Special 'review on why T:2- implies that x-2 > 08. Did student select a? if. so, go to 9; otherwise, go to 109. Give feedback: Your answer is*.partially correct. x-2 is defined
when x-2 > 0. Is AZZ,,defined when x-2 = 0? (Answer yes or no.)Go to 27
10. Did student select c? if so, go to 11; otherwise, go to 12
11. Give fgegback: Your_answer is partially correct. is definedwhen A-2 = 0. Is A-2 defined when x-2 > 0? (Answer yes or no.)Go to 33.
12. Since the student gaVe d as his choice, he. is asked: Is v definedwhen x-2 = 0? (Answer yes or no.)
13. Did student answer yes? if so,/ go to 14; otherwise,go to 1514. Feedback that student is correct is given., Go to 16
15. Has student-answered the question ,in .item 12 incorrectly twice?so, go-to 7; otherwise, go to 29Student is asked: Is ix-2 defined when x4 > 0? (Answer yes or no.)
Did student aniwer yes? if so, go to 18; otherwise, go to 19Feedback is given 'that student is correct. Go to 25
Has student had a prior opportunity to miswer the question in item 16?if so, go to 20; o,therwise, go to 21
20. Special review on why ijr is defined wherry > 0
21. Student is told that he is incorrect and is givenfeedback: I.\
Recall that when we write /7, it is understoodIf y x-2, then-by our-agreement, if we writex-2 23 0 or x-2 0.
16.
17.
18.
19.
if
11a. < b. = c. > d. none of these
the additional
that ythen
22. Did the student answer c? if so,, go to 23; otherwise, go to 26
181

ii
LI
t_
E.
t_
174
23. Feedback is given: Correct. 17-T) is defined for x-2 > 0. Go to 24
24. Did student come to the question in item 21 from a wrong answer to
item 16? if so, go to 16; otherwise, go to 25 .
25. Additional feedback is given: Thus, is defined when x-2 isnon-negative. Now.try again to answer the original question (item 1)
26. Feedback is given: No. The correct answer is > . If we writer > s, wp mean r s or r = s. Go to 24
27. Did student select yes? If so, go to 28; otherwise, go to 29
28. Feedback, "Right," is displayed. Go to 25
29. Feedback is displayed: Incorrect. Recall that when we write 6, itis understood that y > 0. If x-2 = 0, then x-2 = Id- and )45 =
a. 0 b..1 c. 2 d. none of these
30. Did student answer a? if so, go to 31; otherwise, go to 35
31. Feedback i given: Correct. Thus, .77-7) is defined when x-2 is
non-negati e. Now try again to answer the questiOn. Flow goes toitem 32
32. Did the.stu t ome to this question after answering .the original
question with he incorrect choice d? if so, go to 12; otherwise,go to 1
33. Did student answer yes? if so, go to 34; otherwise,.go to 21
34. Feedback is given that student's.response is correct. Go to 25
35. Feedback is given: No. Z= 0 so 0. Thus, IT-7) is defined
when x-2 = 0. Go to 32
It
11From Penn State's course segment Demonstration in Mathematics, for .
National Conference on Computer-Assisted Instruction, The Pennsylvania StateUniversity, University Park, Pa., September 24-26, 1968; IBM 1500; authors:
Ralph Heimer, Paul Klein, Robert Hostetler, Carol Dwyer.
. 182

1
1
1
Mu litiple Level Question
7
1
6
1
3 4
.175
34
Fig. 29. Multiple level .qUestion:

176
I(12: to -Flowchart
Downshifting Response Characters and Replacing Words with Numbers
1. Start
2. Display,question: n Our system of measurement, we use the foot and
the yard. there are inches in 1 foot and feet in -
, 1 yard
3'. Student responds to qmestion
4. Response is edited with functions. That is, uppee case 'letters are
replaced with lower Case; "12" replaces "twelve;" "3" replaces "three"
5. The integer whicti appears first in the response is placed in counter a;
the integer which appears second is placed in countir b
6. Does counter a contafn 12? if yes, go to 7; if no, go to 9
7. Does counter b contlin 3? if yes, go to 8;, if no, go to .9
8, Feedback tht answer is correct
9. Feedback given.because of incorrect answer: There are 12 inches n
.
1 foot and 3 feet in one yard
10. Next problem
,a .
184
1
A
a
I.

1*
Downshifting Response Characters
and Replacing Words with Numbers
I
IBM
8
. 3
Fig.' 30 . Downshiiting respOnge character's and replacing Words withnumbers.
.-0 1
s
185
.4
4
4
r
-177
'';7)1
i.
;NI 01
;.1 r
4A, ,111
ick. 6-1
.1? , '
J.
4

1 78
edited so that a specific word in his response is changed to the most acceptable
version of the word (antihelix), and then his response is tested for'-the pre-
sence of three words (lower, crus, antihelix) in order as separate words
(see Figure 31).
Responses Checked for Km Parts
When one thinks of the number of possible combinations that a student
could type a set of three correct words, he realizes that it would be quite a
task if in each multiple-word response the various versions of the correct
answer had to be listed! In CAI, functions can be used to scan the student's
response for the words of the correct answer, evaluate the number correct, and
inform the student which items are correct.
Testing for specific words in student's response. Since many varieties
of both correct and incorrect responses can be made by students, it is often
desirable to check for specific "key" words in the response and give feedback
based on the number of words which matched the correct response. In this
example, if at least six of the seven words are matched, the student is told
he is correct and is branched to the neict problem. If from one to five words
are matched, the student is infomed as to which words he had correct. If no .
words were matched, the student would be branched to a review section (see
Figure 32).
Checking response for specific character strings. This section describes
a routine which is designed to test a student's response for specific charac-
ter strings (partial words), as opposed to complete key words. If any of the
strings are found, the student's correct words (i.e., those words containing
acceptable strings of letters) are fed bacic to the student (see Figure 33).
Multiple-Part Responses
A question often askee about CAI is whether or not the system can handle
responses consisting of several parts such as sentences or mathematical
equations. The answer is affirmative, and with the capability to writz new
functions and- addsitiem to the system, the possibilities are almost limitless.
Student-constructed equations and complex numbers can be analyzed for
correctness.

1 \
179
_ 187

411,.
180
Key to Flowchart - Replacing Words in Student's Response with Synonyml
In this example, the student is asked to identify a portion of the pinna
marked on a plaster model of the human ear.
1. Start-
2. Question is presented: "What is the name of part C?" Student is
given opportunity to respond
3. Editing is done to change a word in the student's response to the
most acceptable version, i.e., inthelix, anti helix, anti-helix,
anti -helix, anti- helix, and anti* - helix are edited to antihelix
4. The correct reiponse, lower crus antihelix, is compared with the
student's response. A test is made to determine whether three words
in the student's response 'Were correct. Were three words correct?
5. Feedback for correct response is displayed: Your answer is correct
6. .Next prob;em
7. A test is made to determine whether: one or m3re words in the student's
response were correct. Were one or more words correct?
8. Feedback for partially correct response is displayed: Your answer is
partially correct. Try again
9. Feedback for totally unrecognizable response is given: Your answer is
incorrect. Find the correct answer on your.handout and type it.
12From Penn State's course segment Audiology, Project No. 5-1194,
'IBM 7010 or 1410; authors: Bruce M. Siegenthaler and Jeffrey Katzer.
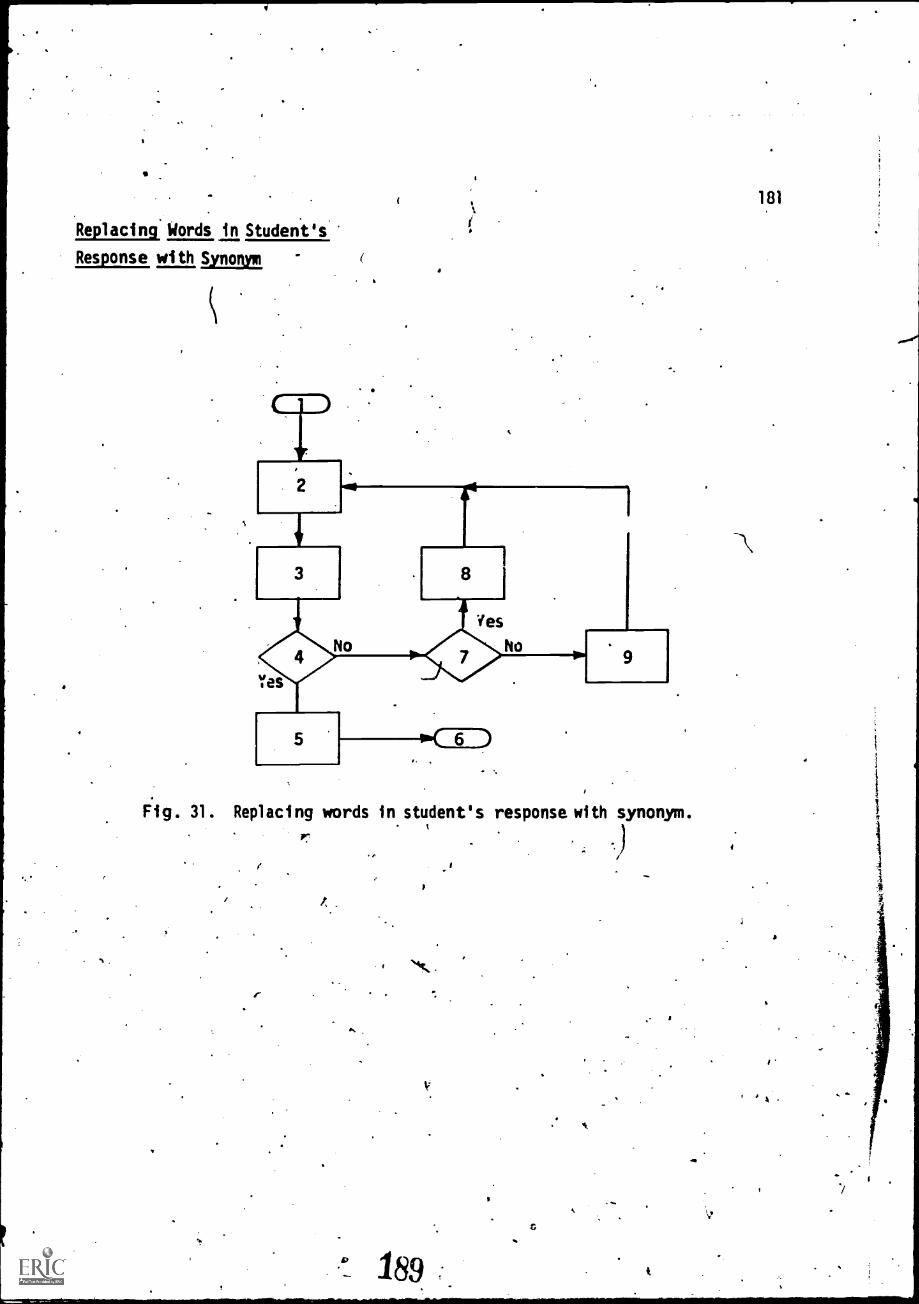
1,81
Replacing Words in Student's
Response with Synonym
2
9
Fig. 31. Replacing words in student's response. with synonym.
4k
a: 189
v

182
t o Flowchart - Testing for Specific Words IiiStudent'i Response
1. Start
2. Problem is presented: Name six of the seven colors of the spectrum.
3. The response is checked for correct words (red, orange, yellow, green,
blue, indigo, violet). Is the number of Matched words equal to or
greater than 6?
4. Feedback for-correct answei is given: You have the answer entirely
correct. Very. good.
5. Next problem
6. Is the number of matched words greater than or equal to 1?
7. The correct words from student's response are shown to him
8. Feedback for partially correct respense is given: The list above
indicates which.colors you_ have correct. Give another answer including
these you now have correct
9. Unrecognized response noted
10. Feedback for answer with no correct words given: You aren't doing
very well. It appears You need a review.
11. Review of concepts from which branch will be made back to current
problem

Testing for Specific Wordsin Student's Response
4
9
2
7
8
Fig. 32-. Testing. for specific words in student's response.
191
183

184
1*.to Flowchart - Checking Response for Specific Charact& Strings
1. Start
2. Display question: What are the three fundamental particles in an
atom?
3. Student responds to the question
4. Test for key strings (i.e., "prot," "neut," "elect") to see how many
match the correct strings; if all are found, go to 5; if one or more
are found, go to 7; and if none are found go to 9
5. Display feedback for correct response
6. Next section of course
.7,\. Edit student's response so that only the words containing correct
strings appear
8. Display the edited response to indicate to the student which words
were correct and give the message that the answer is partially correct
and the student is to try again; go to 3
9. Indicate the answer is completely wrong and go to 3
192

Checking Responses for
Specific Character Strings
5
2
3
All None
correct correctAmp
One wordcorrect
6
8
9
Fig. 33. Checking responses for specific character strings.
193
-185

186
Creating a response pi. selecting its parts. A creative approach from Oe
student's viewpoint can be used in the construction of mathematical open
sentences (i.e., equations with unknown quantities). Given the mathematical
characters 0, =, +, 3, and 4, the student is asked to construct an open sen-
tence using each of the items once. As an item is selected, it is excluded
from the list so that it may not be used again, thus limiting the number of
possible correct solutions.
On the first incorrect response, the student is told that the items do
not form an open sentence. On subsequent incorrect responses, he ls given a
list of correct responses, is asked to construct one of these, and ask the
proctor for help if needed (see Figure 34).
Two-part response tt student. Often a responseincludes two parts, each
of which should receive specific feedback. In this bxample each part of the
reiponse consists of one word, either oxygen, or hydrogen. Feedback is given
indicating which of the words are correct.. If the t64ent does not answer the
question correctly by the third attempt, he is branched to a' review (!;,terna-
tional Business'Machines Corporation; 1968, pp. 43-44, 52), (see Figure 35).7
Responses Requiring Ordering
Many questions asked by instructors require more than one word in the
response. In addition, in the correct response these words must be in a
definite order. CAI has the cipability to analyze responses containing several
words, letters, numberslior strings of charrters. These key parts may be
checked for order, position, and initial.worps or characters.
Arrangement ta student of given items in proper order. The problem for
the student .in this exetcise is to arrange five particles (proton, neutron,
electron, atom, and molecule) according to weight and for him to type only the
initial letters in the proper order. The author wants the student to be able
to enter the letters freely, in upper or lower case and with any reasonable
combination of punctuation and spaces between the letters. Alto, -since. he
lists the particles, the author anticipates that a student may list the letiers,
i.e., separate them with carriage returns. Therefore, the author begins iby
deleting shift-characters, spaces, periods, commas, semi-61ns, colns, dashes,
and carriage returns from the student's response. He thed'tests for the
194

*4
125
5
187

1:188
My. to Flowchart - Creating a Response by. Selecting Its Parts13
1. Start
2. Display the basic set of symbols: 0, =94, 3, 4
3. Give instructions for the problem
4. Student responds by indicating the order of his choices from the
given items
5. Is the student's response a valid open sentence construction? if not,
go to 8; otherwise, go to 6
6. Give feedback that response was correct and go to 7'
7. Next phase of instruction
8. Is.this the stUdent's first mistake? if so, go'to 9; otherwise go
to 10
9. Feedback: The items do not form an open sentence in the order chosen.
Answer again.
10. Display all possible valid constructions of open sentences using the
given elements; ask th'e student to type oneif these and to request
help from the proctor if assistance is needed
13From Penn State's course segment General Mathematics, U.S. Office of
Education through the School District orisTiTiEurgh, prime contract Grant No.
0EG-0-8-055230-3479, Project No. 5523, IBM 1500 System; authors: Roland Lazzaro,
John McNear.
- 196

Creating A Response ky.
Selecting Its Parts.'
2
,g
9
10 6
. t1
t
Fig. 34. Creaiing a risponse by selecting Its pant.,
1

190
Key to. Flowchart - Two-Part Response bx Student
1. Question is presented: What are the two elements of water?
2. Student *is al lowed to respond Ki th two separate words
3. Increment counter keeping track of number of responses to this
question; i ni ti al ize counter keepi ng track of whi ch words are
given correctly 4.
4. Does student's response include the,word "oxygen?"
5. Indicate to the student that "oxygen" is correct
6. Increment by 2 the counter keeping track of which words appeared
in the response
7. Does the student's response include the word "hydrogen?"
8. Indicate to student that "ficirogen" is correct
9. Increment by 1 the counter keeping track of which words appeared
in the response
10. Does the counter keeping track of which words appeared in the student's
respOnse contain 3?
11. Next. problem
12. Has student made three attempts to answer the question?
13. Tell the student that the correct response is oxygen and hydrogen and
indicate to the student that he will receive a review
14. Review from which student will be branched to the beginning of the
question set
15. Give him feedback that the response is incorrect; ask him to answer
again, giving both elements correctly
198

Two-Part Response by_ Student
191
Fig. 35. Two-part response by Audent.
199

192
correct answer: manpe. If this fails, the author tests for the presence of
any-of the other 21 letters of the alphabet and the numbers 1, 2, 3, 4, 5. If
one or more extrarTous letters or numbers are found, the student is told to
type only the initial letters and to answer again.
At this point in the processing, i f one of the letters manpe is found, i t
is not because the student entered a word such as "neutron." The author there-
fore tests for the presence of at least one of ,the letters. If at least one is
found, the student gets a feedback which ,types the let.ter(s) he had in the
correct order and types dashes for the letter(s) which he omitted or had out of
order. Fqr example, if the student's answer is rnpnea, the feedback, is: ma--- .
If the.student's answer does not contain at least one of the five, letters,
he receives feedback designed for: an unrecognizable response (see Figure 36).
Analyzing a response containing ordered words. Many times e significant
part of the response is the order in which the words of the response are given.
An example whuld be a request to identi fy the four seasons of the year begin-
ning with the season of the month of January.
'In this example, for the student's answer "fall winter spring summer,"
feedback would be given in the form "winter spring summer ----" with the state-
ment that the dashes indicate an omission or improper order of the season.
In order to eliminate the resulting confusiOn if the Word autumh would be
used in place of fall, prior to checking the response, "autumn" would be
edi ted to "fall" (see Figure 37) .
Numerical Responses
Many types of numerical responses may be analyzed in a CAI system.
Responses may be checked precisely or to determine whether they fall into a
specified range. Several numbers may be checked simultaneously; the numerator
and denominator of fractions may be checked individually. -
Testing for a numerical response within a.specified range. An author may
want to accept any response in which the integer portion,of the number in a
response is correct, regardless of the iolue of the decimal places or the
nature of the text typed along with the number.

193
,

194
Key_ to Flowchart - Arrangement by. Student of Given Items in Proper Order14
1, Start; initialize to Zero the counter in which number of responses
is kept
2. Show the proper image on the image pro' cor and display the statement:
The proton is much heavier than the electron. The neutron is about the
size of the proton and electron combined. Arrange the particles ac-
cording to weight from the largest to the smallest. Type onl/ the
first letter of each word.
3. Display the list: proton, neutron, eledtron, atom, molecule
4. Student is given time to type his response
5. Punctbation and spaces are edited from student's,response
6. Is student's response "manape?"
7. Give feedback: Correct: molecule, atom, neutron, proton, electron
8. Next problem
9. Increment by 1 the counter in which number of responses to the question
is recorded
10e Has student responded more than four times?
11. Give proctor message asking proctor to assist student or give a
review
12. Does student's,response contain extraneous letters or numbers?
13, Display: Type onlY the initiat letter of each particle (in order)
14e Is,at least one of the letters in the student's'response in the
correct order?
15. .Give feedback indicating which letters were placed in proper order
16e Is this the first unrecognized response?
17 Display: Reread the paragraph above and consider the relative weight
of each pirticle. Then type the initial letter of each particle from
the largest to smallest
18. Is this the.second unrecognized response?
19. Feedback: The, molecule is.the largest. An m should be your first
letter. Try again.
20. For all additional unrecognized-responses feedback is as follows:
.Hint--Each atom is composed at:least of one electron, proton, and
neutron. Answer once again.
14From Penn State's course segment Atomic Energy. Project No. 5-85-074
IBM 7010 or 1410; author: David Gilman.

Arrangement tutSiudent of
Given Items in Proper Order
)14 7
195
3
9
4
5
13
15
17
19
20
Fig 36. Arrangement by student of given items in proper order.
203

196
Key to Flowchart - Anatyzing a Response Containing Ordered Words
1. Start'
2. Presentation of question: What are the four seasons of the year,
starting wi th. the season in which January is?
3. Student responds
4. Any appearance of "autumn" in the student's response is edited to
"fall."
5. Does the response contain "winter spring summer fall" in proper order?
6. Give feedback that the response is correct and all seasons are in the
proper order
7. Next problem
8. Does the student's response contain at least one correct word?
9. Give feedback as to which words are in the proper order and ask the
student to answer again
10. Has the student responded with an unrecognizable response two times?
11. Remedial instruction on the seasons of the year
12. Give feedback that the response is totally incorrect and the student
should try once more to answer the question correctly
204

Analyzing a Response
Containing Ordered Words
7 ).
2
6
11
3
197
9
12
Fig. 37. Analyzing a response containing ordered words.
205

198
Proper codingsmakes it possible to pick a:numerical field from a response,
convert it to an integer, and stOre it in a specific counter. The contents of
the counter are then compared wit.h the corret response to test.whether the
student's response was'acceptable.
In the example below, the integer is extracted from the response. If the
response is exactly correct (5.3), the student will see the correct answer
feedback. If the student is almost correct (5.0 to 5.9), he is told the cor-
rect response and continues on. If his response does not include the correct
integer portion, he is branchedto a review (see Figure 38).
Testing for a precise numerical response. Let us assume in this example
that the desired numerical response must be precise to nearest tenth. The
student is allowed to respond any number of times and at each response he is
told whether his numerical response is too high or too low, and as the range
of his response from the precise response is decreased, the feedback gives
some encouragement such as "You are very close." (see Figure 39).
206

/7
J.

200
Key to Flowchart - Testing for a NUmerical Response within a Specified Range15
1. Start of problem
2. Problem is presented: Measure line a on the handout. Give your
answer in centimeters
3. Student is given a chance to respond
4. Did response match cOrrect answer: 5.3?
5. Feedback for correct answer: Correct
6. The integer portion of the first numerical field is picked out from
the response and placed in a counter
7. Does the counter containi5?
8. Feedback for answer within acceptable range: Correct. The answer
is 5.3 and you are close enough to it
9. Feedback for unacceptable answer is displayed. No, there are 5 whole
centimeters plus 3 tenths of a centimeter. Let's try a review
10. Pause so that student can measure line a again
11. Special review on measurement in the metric system
12. Next problem
15From Penn tate ' s course segment Metric System of Measurement ,
Project No. 5-85-074, IBM No or 1419; ilia (7'; ----tlitAd
208

201
Testing for a Numerical Response
within a Specified (Range
9No
2
6
3
10
5
12 )
Fig.. 38. Testing for a numerical response wi thin a specified range.

202
Key to Flowchart - Testing for a Precise Numerical Response
Assume that the desired response is 23.7 or between 23269 and 23.71.
1. Question is presented
24 Student responds
3. Is response between 23.69 and 23.71?
4. Give feedback that response is correct and go to 5
5. Next question
6. Is respoirse between 23.6 and 23.8?
7. Give feedback that 'student's respnse is "Extremely close but" and go
to 12
8. Is response between 23.0 and 24.0?
9. Give feedbAck that student's response is "Very close but" and go to 12
10. Is response between 20.0 and 30.0?
11. Give feedback that student's response is "Quite close but" and go to 12
12.. Is response less than or equal to 23.69?
13. Give feedback "response is too low."
14. Is response-greater than or equal to 23.71?
15. ,Give,feedback "response is too high."
16... If student reaches this point, he has not typed a number so he is
told to type a number
I. 210

Testing for a Precise.
Numerical Response
A13
15
16
4
9
Fig. 39. Testing for a precise numerical response.
(211
203

4
CHAPTER VIII
DISSEMINATION.
205
Dissemination activities of the CAI Laboratory have been extensive and
have varied'in form. Fellowships and graduate assistantships have been but
one phase of what we see as an ongoing prOcess of training others in'the poten-
tial of computer assisted instruction in educaiion. New methodologies., new
curricula and new educational strategies do. not .juat happen. Innovations must
be developed and comunicated through as \many avenues`aksptissible in order to
overcome the great inertia in educational processes. Individuals trained in
computer-assisted instruction can influence the course of educational change.
Information about our CAI activities in techni.cal education have.beeR
disseminated through demonstrations to individuals from the United States
and representatives from foreign countries. Gradifite\-and underghduate classes
have toured the Laboratory facilities and have learned about the potentials of
CAI in the coming years. Samples of this' information for selected periods is
summarized in the tables that follow.
The reports, journal articles, and speeches dealing with the CAI Labora-
tory are given in the sections that follow. Again it is easily seen that these \
formal activities have been many and varied and have reached large numbers of
professional educators.
A film entitled "Sign On/Sign Off"-was designed,to gi ve the basic idea of
how a computer simulates a tutor. The film describes the equipment and
objectives of CAI and is available from the Audio-Visual Libeary of the Uni-
versity (16mm; 24 minute; sound; color).
212

206
Table 6
Organized Dissemination Activitiesby CAI Laboratory Personnel
'May 1, 1967 through June 30, 1968
No. in
Date(s) Participant(s) Audience Event Location
5/26/67 Mitzel, R. E. 45 Center for Cooperative Penn State
Research With Schools
6/21/67 Mitzel, K. E. 60 American Society for East Lansing,
Engi neeri ng Educati on Michigan
Annual Meeting (MichiganState)
7/1/67 Mi tzel , H. E . 1000 National Seminar on Honolulu,
to Innovation Hawai i
7/20/67 Sponsored by I.D.E.A.The Action-OrientedDiOsiOn of the Chas.F. Kettering Founda-tion and USOE
7/26/67 Mitzel, H. 100 Computer SummerWorkshop 4
8/15/67 Igo, R V. 50 ENTELEK Workshop
8/8/67 Mi tzel , H. E .
Brandon, G.
Sj
10/3/67 Mi tzel H. E.
200 Nati onal EducationalMedia Seminar inVocational andTechnical Education
40 Training program onManagement Develop-ment for Health AgencyPersonnel Hospi tal
Administrators, etc .
West Point,New York
Harvard Uni v .
Cambridge,Mass.
Columbus,Ohio
Penn State
10/6/67 Mitzel , H. E . 9 75 USOE Demonstration Washington,
Hall, K. A. Center D. C.
Johnson, D.Riedesel, A.
213

10/27/67 Mitzel, H. E.Hall, K. A.
10/27/67 Farr, H. L. K.
11/13/67 Mitzel, H. E.
11/9/67 Mitzel, H. E.Hall, K. A.Brown, B. R.
2/22/68 Mitzel, H. E.Hall, K. A.Dwyer, C.Knull, D.
3/28/61, Hall, K. A.
4/18/63 Hall, K. A.
125 Phi Delta KappaMeeting, AlphaChapter
207
Penn State
45 Pennsylvania Council Penn State
of Teachers ofEnglish, llth Annual
Conference
200 Convocation ofEducational ResearchAssociation of NewYork State
20 Psychologists fromPenn State's Common-wealth Campuses
35 faculty DevelopmentInstitute
450 NEA Department ofAudio Visual Inst.
150 National Society ofProgramed Inst.
Albany,New York
Penn State
Penn State
Houston,Texas
San Antonio,Texas
214

208
Table 7
Visitors to CAI LaboratoryMay 1, 1967 through April 30, 1968
Number in groups 919
Individuals 73
Total 992
Countries Represented:
Australia
Canada
England
Netherlands
Sudan
215

209
Table 8
Summary1410 Student Terminal Usage
May 1, 1967 through April 30, 1968
Use
Avg. Per.Number Hours Month
Students 788* 1,163.37 96.95
Staff 330.65 27.55
Demonstrations 109.44 9.12
A/V Testing 7.21 .60
Equipment Testing 9.59 .80
Testi ng 788 1,620.26 135.02
*Investigations 694 1,088.37
Other Subjects 94 75.00
788 . 1 163.37
216

210
Table 9
1500 System UsageFebruary 1, 1968 through April 30, 1968
System Usage
No. ofHours
Avg. Per.Month
Author/Student 1,336.95 445.65
Demonstrations 58.03 19.34
Systems Work 124.00 41.33
Preventive Maintenance 26.00 8.67
Total 1,544.98 514.99
217

THE PENNSYLVANIA STATE UNIVERSITY
College of Education201 .Chambers Building
University Park, Pennsylvania 16802
Computer Assisted Instruction Laboratory
CAI
BIBLIOGRAPHY
REPORTSERIES
No. R3 Mitzel, Harold E., and Brandon, George L.
Experimentation with Computer-AssistedInstruction in Technical EducationSemi-Annual Progress Report (105 pp.)
N . R4 Mitzel, Harold E., and Brandon, George L.
Experimentation with Computer-AssistedInstruction in Technical EducationSemi-Annual Progress Report (69 pp.)
rlo. R5 Mitzel, Harold E., and Brandon, George L.
Experimentation with Computer-AssistedInstruction in Technical EducationSemi-Annual Progress Report (132 pp.)
211
Project No. 0.E. -85-074
December 31, 1965
Project No. 0.E. -85-074
June 30, 1966
Project No. 0.E.-5-85-074--,
December 31, 1966
No. R6, Mitzel, Harold E., and Brandon, George L. Project No. 0.E.-5-85 074
Experimentation with Comp411uter-Assisted -
Instruction in Technical EducationSemi-Annual progress Report (70 pp.) June 30, 1967
No. R9 Mitzel, Harold E., and Brandon, George L.
Expprimentation with Computer-AssistedInstruction in Technical Education
Semi-Annual Progress Report (79 pp.)
No. Rll Mitzel, Harold E., and Brandon, George L.
Experimentation with Computer-Assisted
Instruction in Technical EducationSemi-Annual Progress Report (60 pp.)
218
Project No. 0.E.-5-85-074
December 31, 1967,
Project No. 0.E.-5-85-074
June 31, 1968

212
REPORTSERIES
No.R17 Peloquin, Paul V. Project No. 0.E.-5-85-074
1500 System Geometric Dictionary June 30, 1968
o.R18 Mitzel, Harold E., and others Project.No. 0..E.-5r85-074'
ExPerimentation with Computer-AssistedInstruction, in Technical EducationSemi-Annual Progress Report - (In Press) December 31; 1968.
No.R27. Mitzel, Harold E., and others Project No. 0.E.-5-85-0741-
Experimentation with Computer-Assisted
Instruction in,Technical Education
Semi-Annual Progress Report - (In Press) June 1g69.
No.R35 Dwyer, Carol A.Project No. 0.E.-5-85-074 44
Teaching Strategies and Tactics for
Computer-Assisted Instruction June 1970
No.R37 .Mitzel, Harold E., and others Project No: 0.E.-5-85-074
Experimentation with Computer-AssistedInstruction in Technical Education
Final Report - (In Press) December, 1969
REPRINTS PRODUCED IN CONJUNCTION WITH THE COMPUTER
.ASSISTED INSTRUCTION LABORATORY
REPRINTSERIES
Pr. 1 Gilman, David Alan. Computer-assisted instruction for technical
education. School Shop, November 1966.
(Reproduced in R5)
PR 6 Wodtke, Kenneth H. Educational requirements for a student-subject
matter interface. AFIPS Conference Proceedings, (Sprtng Joint
Computer Conference, 1967,.Atlantic City, New Jersey), Vol. 30,
pp. 403-411.(Reproduced in R7)

REPRINTSERIES
PR 8 Gilman, David Alan. Feedback, prompting, and overt correction pro-.
cedures in nonbranching computer assisted instructed programs.Journal of Educational Research, May-June 1967, 60, 423-426
PR 12 Hogan, Harriett A., and Bjorkquist, David C. Teaching a tech-ed unitvia computer-assisted instruction. School Shop, April 1968,pp. 94-95.
21 3
PR 13 Impellitteri, Joseph T. Exploring the potential of computer-assistedvocational guidance. School Shop, April 1968, pp. 94-95.
PR 14 Hall, Keith A., Adams, Marilyn, and Tardibuono, John. Gradient- andfull-response feedback in computer-assisted instruction.- Journalof,Educational Research, January 1968, pp. 195-199.
,PR 16 Impellitteri, Joseph T. Experiments with a computer-assisted occupa-
tional system. Educational Technology, March 1969, pp. 31-38.a,
PAPERS PRODUCED IN CONJUNCTION WITH THE COMPUTER ASSISTEDINSTRUCTION LABORATORY
PAPERSERIES
P 1 Wodtke, Kenneth H., and Gilman, David A. Some convents on theefficiency of the typewriter interface in computer-assistedinstruction at the high school and college levels. A paperpresented at the Annual Convention of the Association of Educa-
tional Data Systems, Philadelphia. May.1966. (8 pp.)(Reproduced in R4)
P 8 Logan, Tracy H., and Wodtke, Kenneth H. The effects of rules-of-thumbon transfer of training, June 1966 (11 pp.)(Reproduced in R4) .z--
P 11 Mitzel, Harold E. Five major barriers to the development of computer-assisted instruction. August 1966. (Remarks prepared forAmerican Management Association Meeting, Americana Hotel, NewYork City, August 12, 1966.)( Reproduced\ i n R5)
220e.

214
PAPER
SERIES
P 13 Hall, Keith A., Adams, Marilyn, and Tardibuono, John. Cueing andfeedback in computer-assisted instruction. (11 pp.)(Paper presented at NEA National *Convention, Department of A-Vinstruction, Atlantic City, New Jersey, April 5, 1967.)(Reproduced in R5)
P 14 Hall, Keith A., Adams, Marilyn, and Tardibuono, John. Cueing andfeedback in computer-assisted instruction. (19 pp.) Revised
April 1967.(Reproduced in R6) ,
P 15 Gilman, David Alan, and Harvilchuck, Nancy Ann. A-coursewriter guidefor teacher-authors of materials for computer-assisted instruction.May 1967. (106 pp.)
P 16 Mitzel , Harold E. Computer-assisted instruction-origins, definitions,and growing pains. June 21, 1967.(Presented at the American Society' for Engineering EducationalAnnual Meeting, East Lansing, Michigan.)
P 17 Mitzel, Harold. On narrowing the credibility gap for computer-assisted'instruction. .
(Presented at the New York State Research Convocation, Albany,New York, November 13, 1967) (6 pp.)(presented at the Computer Sumer Workshop, Industrial College ofVie Armed Forces and U. S. Military Academy, West Point, NewYork, July 26, 1967) (10 pp.)
P 18 Hall, Keith A. Educational measurement CAI course.(Paper presented at the IBM 1500 Instructional System Seminar,Chicago,.Illinois, AuguSt 2-4, 1967.) (7 pp.) °
P 19 Hall-, Keith A., Adams, Marilyn, and Tardibuono, John. Gradient- andful 1-response feedback i n computer-ass i sted instruction.June 30, 1967, (25 pp.) (Reproduced in R6)
P 20 Gilman, David Alan. A comparison of the effectiveness of feedbackmodes for teaching science concepts by means of a computer-assi sted adjunct- auto-i nstructi on program. September 1967.
(163 pp.) (poctoral dissertation)
221

1
PAPERSERIES
1
1.
Ii
'40,
215
Impel I tteri , Joseph T. , Campbel 1 , Edward A. , and Kostenbauder, Scott I .
The development and eva3uation of a pilot computer assistedoccupational guidance. program. April , 1967. (17 pp.)(Interim Report - Pennsylvania Department of Public InstructionBureau of ,Vocational , Technical and Continuing ,Education)
4
222

217
REFERENCES
Bahn, T. A. and Brown, B. R. A processor for multiple numeric entr4s. In
Semi-Annual Progress Report No. R-11, Experimentation with. Computer-
Assisted Instruction in Technical Education, Project No. 5-85-074,
prepared by Harold E. Mitzell et a .rniiversity Pak: The Pennsylvania
State University, June 30, 1968, pp. 55-57.
Barlow, J. A. PrograMed instruction in perspective: Yesterday, today,' and
tomorrow. In R. Filep (Ed.) Prospectives in Programing. New York:
MacMillan Company, 1963.
Berman, P. W. and .Villwock, M. A. Response latency: Its' relationship with
errors and response stabi 1 ty wo tasks involving response competition.
In Semi-Annual Progress Report . R-27, Experimentation with Computer-
Assisted Instruction in Technical Education, Project No. 5-85-074, pre-
pared by Harold E. Mitzel, et al., University Park: The Pennsylvania
State University, June 30, 1-9-69, in press..
Bitzer, D. L. and Easley, Jr., J. A. Plato: A computer-control-led teaching
system. Paper presented DAVI Convention, Rochester, N. Y., April 22,
1964,
Bjorkquist, D. J. CAI communicattons skills. In Semi-Annual Progress Report
No. R-3, Experimentation with Computer-Assisted Instruction in Technical
Education, Project.No. 5-85-074, prepared by Harold E. Mitzel; et al.
Un versity Park: The Pennsylvania State University, December 3T:
pp. 18-26.
Borman, Ko'G. and Hall; K. A. Prompting and confirmation as modes of feedback
with computer-assisted instruction. In Semi-Annu0 Progress Report No.
R-27, Experimentation with Computer-Assisted Instruction in Technical
Education, Project No. 5-85-074, prepared by Harold E. Mitzel, et al., ,
University Park: The Pennsylvania State University, June 30, 1969,
in press.
Borman, K. G. and Johnson, D. W. An experimental procedure for course revision
based on students' past performance. In Semi-Annual Progress Report No.
R-11, Experimentation with Computer-Assisted Instruction in Technical
Education, Project No. 5.-85-074, prepared by Harold E. Mitze , et a ,
University Park: The Pennsylvania State University, June 30,
pp. 33-60.
Brandon, G. and Evans, R. Research in vocational education. 64th Yearbook of
N. S. S. E., Chicago: -.PUniversity of Chicago 157eir,79-65.
Brown, B. R. and Bahn, T. A. Prior knowledge and individualized instruction.
In Semi-Annual Progress Report N. R-11, Experimentation with Computer-
Assisted Instruction in Technical Education, Project No. 5-85-074, pre-
pared by Harold E. Mitzer,--ITITT, University Park: The Pennsylvania
State University, June 30, Tg6§, pp..1-15.

218
Brown, B. R. and Gilman, D. A. Expressed student attitudes under severalconditions of automated programed instruction. .In Semi-Annual ProgressReport No. R-6, Experimentation with Computer-Assisted Instruction inTechnical Education, Project No. 5-85-074, prepared by Harold E. Mitz#1,et al., University Park: The Pennsylvania State University, June 30,Tg67, pp. 41-47.
Brown, B. R., Dwyer, C:-, and Hollick, R. Reading rate and retention under twomodes of presentation. In Semi-Annual Progress Report -No. R-27,
Experimentation with Computer-Assisted Instruction in Technical ,Education,PrOject _No. 5-857074, prepared by Harold E..Mitzel, et al., Univers tyPark: The Pennsylvania State University, June 30, 1-§-6"9, in press.
Bryan, G. L. and Rigney, LT.G. An tivaluation of a method for shipboardtraining in 'operations knowledge. University of iouthern CaliforniaReport No. 18, September, 1956.
Campbell, V. N. Adjusting self-instruction programs to individual differences:Studies of cueing, responding, and bypassing. San Mateo,'CiTif.:rierlcan Institute for ResearchT96l.
Campbell, V. N. Studies of bypassing as a way of ada tin self-instructionprograms to individuir differences. San -Mateo, Ca f.: American
Institute for Research, 1962.
Dwyer, C., Teachirig strategies and tactics for computer-assisted instruction.-Report No. R-35, University Pai--The Pennsylvania State University,June, 1970.
Evans, J. L. Programing in'mathematics and logic. .In R. Glaser (Ed.)
Teaching Machines and Prograrped Learning, II. Washington, D. C.:National EducationAisoc at on, 1965, pp. 371-441.
Farr, H. L.. K. and Hogan, H. A. Effect of CAI on natural spelling behaviors..In Semi-Annual Progress Report No. R-9, Experimentation with Com uter-Assisted Instruction in Technical Education, Project No.7-1-35- , pre-pared by Harold E. Mitzer,er ITT, University Park: The Pennsylvania
State University, December 7 79670 pp. 53-70.
Farr, H. L. K., Kelly, J., and Palmer, D. A developmental report on a*CAI-CRT
spelling course for post-high school students. n Semi-Annual Progress
Report No. R-27, Experimentation with Computer-Assisted Instructionin Technical Education, Project NO:7-85-074, prepared by Harold E.
thWiFs i ty Park: The Pennsylvania State University,June 30,79U, in press. .
Feurzeig, W. Conversational teaching machine. DatamatiOn, June 1964.
French, J. L. and Tardibuono, J. NUmerical and verbal aptitude tests .admtnis-, tered at the CAI student stAion. In' Senii-Annual Progress Report No. R-11,
Experimentation with Computer-Assisted Instruction in Technical Education,Project No. 5-85-074, prepared by Harold E. Mitzel, et a ., 1iniversl ty
Park: The. Pennsylvania State University, June 30, 1968, 'pp. 17-32.
224
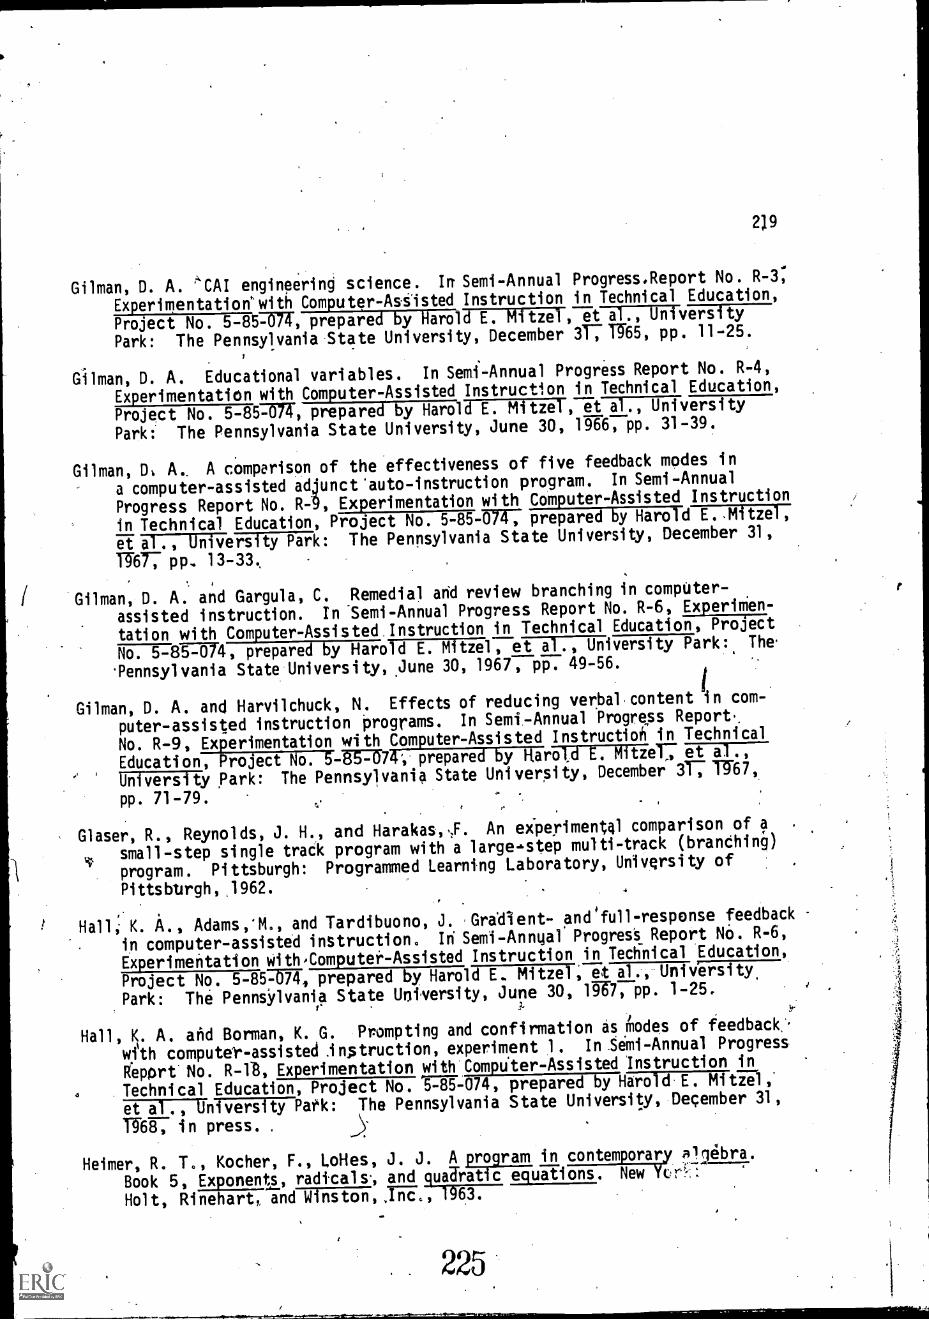
219
Gilman, D. A. ''CAI engineering science. In Semi-Annual Progress.Report No. R-3;
Experimentation"with Computer-Assisted Instruction in Technical Education,
Project No. 5-85-074, prepared by Harold E. Mitzel, et al., Univers tyPark: The Pennsylvania State University, December 311:1765, pp. 11-25.
Gilman, D. A. Educational variables. In Semi-Annual Progress Report No. R-4,Experimentation with Computer-Assisted Instruction in Technical Education,Project No. 5-85-074, prepared by Harold E. Mitzel ,Park: The Pennsylvania State University, June 30, 1966, pp. 31-39.
Gilman, DI A.. A comparison of the effectiveness of five feedback modes in
a computer-assisted adjunct 'auto-instruction program. In Semi-Annual
Progress Report No. R-9, Experimentation with Computer-Assisted Instructionin Technical Education, Project No. 5-85-7747 prepared by Harold E..Mitzel,et al., UniveTs PFk: The Pennsylvania State University, December 31,17677 pp. 13-33.,
Gilman, D. A. and Gargula, C. Remedial arid review branching in computer-assisted instruction. In Semi-Annual Progress Report No. R-6, ExperiMen-
tation with Computer-Assisted Instruction in Technical Education, ProjectNo. 5-8-57:074, prepared by Harold E. Mitzel, el-717:7Tniversity Park: The.
'Pennsylvania State University, June 30, 1967, pi-5-7 49-56.
Gilman, D. A. and Harvilchuck, N. Effects of reducing verbal content in com-puter-assisted instruction programs. In Semi-Annual Progress Report,
No. R-9, Experimentation with Computer-Assisted Instruction in TechnicalEducation, Project No. 5-85-074, prepared by Harold E. Mitzet: et a .,University park: The Pennsylvania State University, December 3T: W67,
pp. 71-79.
Glaser, R., Reynolds, J. H., and Harakas,,F. An eiperimental comparison of asmall-step single track program with a large-step multi-track (branching)
program. Pittsburgh: Programmed Learning Laboratory, University ofPittsbtirgh, 1962.
Hall, K. A., Adams,'M., and Tardibuono, J. Grddient- pnefull-respense feedback
in computer-assisted instruction. In Semi-Annya1 Progress Report NO. R-6,
Experimentation with,Computer-Assisted Instruction in Technical Education,
Project No. 5-8576.77, prepared by Harold E.. Mitzel, eta-r71.-1 i rs ity,Park: The PennsYlvania State University, June 30, lg-67, pp. 1-25,
Hall, K. A. and Borman, K. G. Prompting and confirmation as iciodes of feedback
with compute'r-assisted Instruction, experiment 1. In Semi-Annual ProgressRepprt No. R-18, Experimentation with Compu'ter-Assisted Instruction inTechnical Education, Project No. 1735-074, prepared by Harolifiewl,'et al., University Park: The Pennsylvania State University, December 31,
W68, in press. .
Heimer, R. T., Kocher, F., LoHes, J. J. A program in contemporary algebra.Book 5, Exponents, radicals-, and quaaratic equations. New 'kr',Holt, Rinehart, and W nston, ,Inc., 1963.
225

220
Holland, J. G. Teaching machines: An application of principles from the
laboratory. In R. Glaser (Ed.), Teaching Machines and Programmed
Learning II. Washington, D. C.: National EducatiorrTssociation, 1965,
pp. - 177
Holland, J. G. Research on programing variables. In R. Glaser (Ed.), Teaching
Machines and Programmed Learnin , II. Washington, D. C.: National
aCiTTEn-Tisociation, 1965, pp. 6'67118.
Holland, J. G. and Porter D. The influence of repetition of incorrectly-
answered items on a teaching-machine program. Journal of the Experimental
Analysis of Behavior, 1961, 4, pp. 305-307.
International Business Machines Corporation. IBM 1500 Coursewriter II,
author's guide. San Jose, California: Speciii-Tystems ProgramEing
Documentation, 1968.
International Business Machines Corporation. IBM 1500 Coursewriter II
author's guile. Part 3, Course planning. San Jose, California: IBM
Systems Deve opment Diviifi51,7:7967.
Impellitteri, Q. T., Kostenbauder, S. I., and Paolone; F. J. The Development
and Evaluation of a Pilot Computer-Assisted Occupational TiTilance Program.
ITTnal report to fEe Pennsylvania Department of Public InTfRreirEn,
Project No. 16033, 17033, 18033.) University Park, Pennsylvania, Depart-
ment of Vocational Education, The Pennsylvania State UniversitA July,
1968.
Johnson, D. W. and Borman, K. G. Relative effectiveness of various modes of
stimulus presentation through computer-assisted instruction. In Semi-
Annual Progress ReDort No. R-6, Experimentation with Computer-Assisted
Instruction in Technical Education, Project No. -6:£-T-074, prepared by
Harold E. Mitzel, et al:, University Park: The Pennsylvania State
University, June 371"gr67, pp. 27-39.
King, R. B. and Rabinowitz, W. Comparability of computer-assisted and conven-
tional test administration. In Semi-Annual Progress Report No. R-18,
Experimentation with Computer-Assisted Instruction in Technical Education,
Project No. 5-85-074, prepared by Harold E. Mitzel, et al., Univers ty
Park: The Pennsylvania State University, December 3T7 Tg68, in press.
Klaus, D. J. An analysis of programing techniques. In R. Glaser (Ed.),
Teaching Machines and Programmed Learning II, Washington, D. C.: National
Education-TirliTaifTW, 1965, pp. 118-161.
Logan, T. H., and Wodtke, K. H. The effects of rote rule-learntng on transfer
of training. In Semi-Annual Progress Report No. R-4, Experimentation with
Computer-Assisted Instruction in Technical Education, Project,No. 5-85:747,
prepared by Harold E. Mitzel, et al., Uni versi ty Park: The Pennsylvania
State University, June 30, 1966, pp. 53-63.
226

221
Mednick, S. A. and Mednick, M. T. Remote Associates Test. Boston: Houghton
Mi ff 1 i n Company, , 1967. (ManuaT).
Medley, D. M. A general procedure-for testing the equivalence of two tests.
Paper presented at the meeting of the National Council on Measurement in
Educatioh, February, 1957.
Mitzel, H. E. Five barriers to computer-assisted instructico. In Semi-
Annual Progress Report, No. R-5, Experimentation With aiiiputer-Assisted
Instruction in Technical Education, Project No. 5-1657074, prepared by
Harold E. MitzeTTTF-07:111rT5-iFifty Park: The Pennsylvania State
University, December "!PF, 1966, pp. 13-19.
_Osgood, C. E., Sudi, G. J., and Tannenbaum, P. H. The measurement of meaning.
Urbana: University of Illinois Press, 1957.
Peloquin, P. V. 1500.system geometric dictionary. Jn Semi-Annual Progress
Report, No. R-11, Experimentation with Computer-Assisted Instruction in
Technical Education, Project No. 5-85-074; prepared by Harold E. MitiiT,
et a ., University Park: The Pennsylvania State University, June 30,
1968, pp. 47-52.4
Postman, L. and Egan, J. P. Experimental Psychology: An Introduction. New
York: Harper and Row, 1949.
Ritchey, J. K. CAI technical mathematics. In Semi-Annual Progress Report,
No. R-3, Experimentation with Computer-Assisted Instruction in Technical
Education, Project No. 5-85-074, prepared by Harold E. MitzeTT et a .,
University Park: The Pennsylvania State University, December ITT 765 ,
pp . 6-10.
Sands, H. Number Systems. In Semi-Annual Progress Report, No. R-4, Experimenta-
tion with Computo--Assisted Instruction in Technical Education, Project .
No. 57E7074, prepared by Harold E. MitieT,et-11.707e-FM31 Park: The
Pennsylvania State UniverSity, Jund 30, 1966, p: 20.
Silberman, H. F., Melaragno, R. J., Coulson, J. E., and Estavan, D. Fixed
sequence versus branching auto instructional methods. Journal of
'Educational Psychology, 1961, pp. 166-172.
Skinner, B. F. Teaching machines. Science, 1958, 205, pp. 91-102.
Sma1lwood,R.D. A decision structure for teachino machines. .Cambridge, Mass.:
MIT Press; 192.
Stolurow, r. M. and Davis D. J. Teaching machines and Computer based systems.
In R. Glaser (Ed.) Teaching Machines and Prbgrammed Learning II,
W9hington, D. C.: National' ITOF-oh Association, 1960,.p. iat
Stolurow, L. M. and Davis, D. J. Teaching machines-and computer-based systems;
Technical Report No. 1, Urbana, Ill.: University 'of Illinois, Training
Research Laboratory, -(Yffice of Naval Research, NONR 3985 (4) , 1963.
227

222
Suppes, P. and Ginsberg, R. Application of 'a stimulus sampling model to
children's concept formation with and without overt responses. Journal
of Experimental Psychology, 1962, 63, pp, 330-336.
Swets, J. A., MI-Oman, S. H., Fletcher, W. E., and Green, D. M. Learning td
identify non-verbal sounds: An application of a computer as a teaching
machine. Journal of Acoustical Society of America, 1962, 34, pp. 928-935.
Swets, J. A., Harris, J. R., McElroy, L. S., and Rudlow, H. Further experiments
on a computer-aided learning of sound identification. Bolt, Beranek, and
Newman, Technical Report: Navtradevcen, 1964, pp. 789-792.
S. Department of Labor. Manual for the General Aptitude Test Battery.
Section II: Norms. walF5lifon, D77-C.: U. S. GovernmeiirTrinting Office,
June 1907
Utall, W. R. On conversational interaction. IBM Research Report RC-532m,
Yorktown Heights, N. Y.: 1961.
Venn, G. Man, education, and work. Washington, D. C.: American Council on
Education, 1964, p. 36.
Wing, R. L. BOCES Status Report, Board of Cooperative_Education Services,
Westchester County, New York, June 1966.
Wodtke, K. H. Relationships among attitude, achievement, and aptitude measures
and performance in computer assisted instruction. In Semi-Annual Progress
Report, No. R-3, Experimentation with Computer-Assisted Instruction in
Technical Education, Project No.. "6":"85-074, prepared by Harold E. Mitzel,
et a ., University Park: The Pennsylvania State University, December 31,
TT65, pp. 46-62.
Wodtke, K. H. Scrambled versus ordered course sequencing in computer-assisted
instruction: Experiment 1. In Semi-Annual Progress Report, No. R3,
Experimentation with Computer-Assisted Instruction in Technical EducatIon,
Project No. 5-85767, prepared/by Harold E. Mitzel, et al., Universiry
Park: The Pennsylvania State University, Decembet. 3T7TT65, pp. 27-45.
Wodtke, K. H. and Gilman, D. A. Some comments on the efficiency of the
typewriter interface in computer-assisted instruction at the high school
and college levels. In Semi-Annual Progress Reports-No. R-4, Experimenta-
tion with Computer-AsFisted Instruction in Technical Education, Project
5:75=gg=074, prepared by Harold E. NItii1:7EFiT77-61Tiiii7I7 Park: The
Pennsylvania State University, June 30, 1966, pp. 43-50.
Wodtke, K. H., Mitzel, H. E., and Brown, B. R. Some preliminary results on
the reactions of students to computer7assisted instruction. Proceedings
of the American Psychological Association, September, 1965.