in-transit analytics on distributed clouds: applications ... · autonomic streaming pipeline •...
TRANSCRIPT
1
In-transit analytics on
distributed Clouds:
applications and architecture
Omer F. Rana School of Computer Science & Informatics
Cardiff University, UK
Structure
• Characterising “Big Data” applications
– Application focus
– What are these applications
• Common themes across applications
• Supporting in-transit analytics
– An architecture for undertaking this
– A Model for supporting in-transit analytics
– Executing the model
2
Distributed, Dynamic, Data Intensive Applications
• Applications where data workload is equivalent to or greater than computational workload
• Properties of “dynamic” data applications – Real time: generated, re-distributed or partitioned data
– On-demand: varying availability of data
– Adaptive: change in processing or storage granularity
• Computational activities triggered due to data creation – Computation must respond to unplanned changes in data volumes or
content
• To scale – various trade-offs necessary: – Move computation or data?
– Frequency of access impacts various modes of analysis
– Increasing interest in “in-memory” processing (high disk I/O overhead)
– Exploitation of the full memory hierarchy (RAM, SSD, Disk) + other buffering strategies
Considered a variety of applications that conform to the above characteristics
Types of applications • Variety of applications in multimedia streaming
– e.g YouTube for multimedia streaming, xoIP (x=TV, Voice, etc)
– Sensor networks (emergency response, security, environment, etc)
– Processing requirements vary – over different timeframes
• Not just true for physical sciences – increasingly social scientists also face similar challenges (e.g.
tension indicators in communities)
• Increasing availability of data over the Web and from government departments – Data from Facebook, Twitter, Flickr (text, audio, video, etc)
• People as sensors
– Data from government agencies – Police API, Demographic data (ONS), etc
3
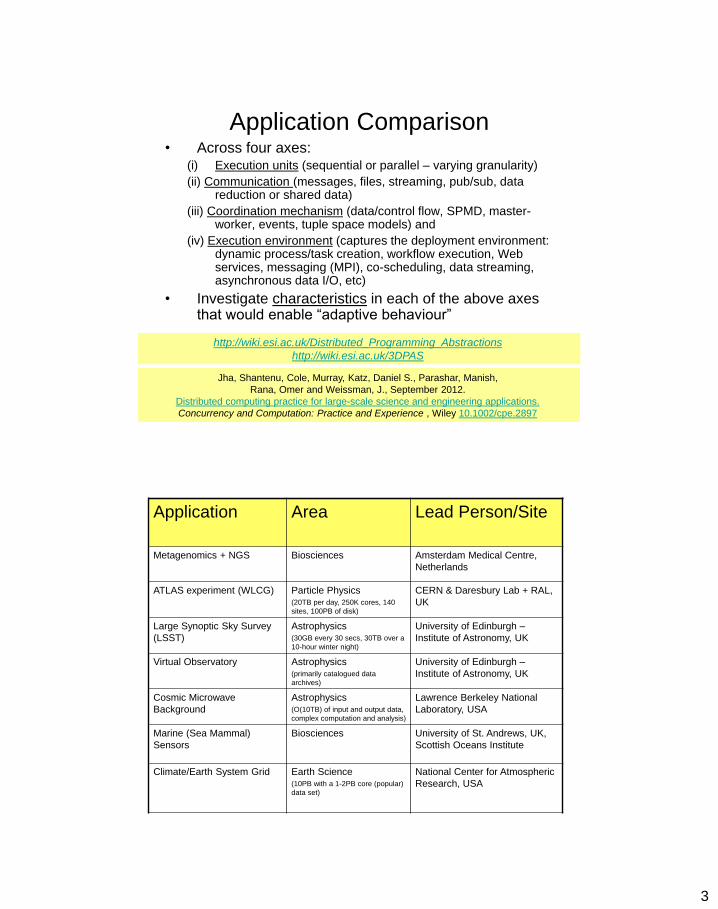
Application Comparison • Across four axes:
(i) Execution units (sequential or parallel – varying granularity)
(ii) Communication (messages, files, streaming, pub/sub, data reduction or shared data)
(iii) Coordination mechanism (data/control flow, SPMD, master-worker, events, tuple space models) and
(iv) Execution environment (captures the deployment environment: dynamic process/task creation, workflow execution, Web services, messaging (MPI), co-scheduling, data streaming, asynchronous data I/O, etc)
• Investigate characteristics in each of the above axes that would enable “adaptive behaviour”
Jha, Shantenu, Cole, Murray, Katz, Daniel S., Parashar, Manish,
Rana, Omer and Weissman, J., September 2012.
Distributed computing practice for large-scale science and engineering applications.
Concurrency and Computation: Practice and Experience , Wiley 10.1002/cpe.2897
http://wiki.esi.ac.uk/Distributed_Programming_Abstractions
http://wiki.esi.ac.uk/3DPAS
Applications Application Area Lead Person/Site
Metagenomics + NGS Biosciences Amsterdam Medical Centre,
Netherlands
ATLAS experiment (WLCG) Particle Physics (20TB per day, 250K cores, 140
sites, 100PB of disk)
CERN & Daresbury Lab + RAL,
UK
Large Synoptic Sky Survey
(LSST)
Astrophysics (30GB every 30 secs, 30TB over a
10-hour winter night)
University of Edinburgh –
Institute of Astronomy, UK
Virtual Observatory Astrophysics (primarily catalogued data
archives)
University of Edinburgh –
Institute of Astronomy, UK
Cosmic Microwave
Background
Astrophysics (O(10TB) of input and output data,
complex computation and analysis)
Lawrence Berkeley National
Laboratory, USA
Marine (Sea Mammal)
Sensors
Biosciences University of St. Andrews, UK,
Scottish Oceans Institute
Climate/Earth System Grid Earth Science (10PB with a 1-2PB core (popular)
data set)
National Center for Atmospheric
Research, USA
4
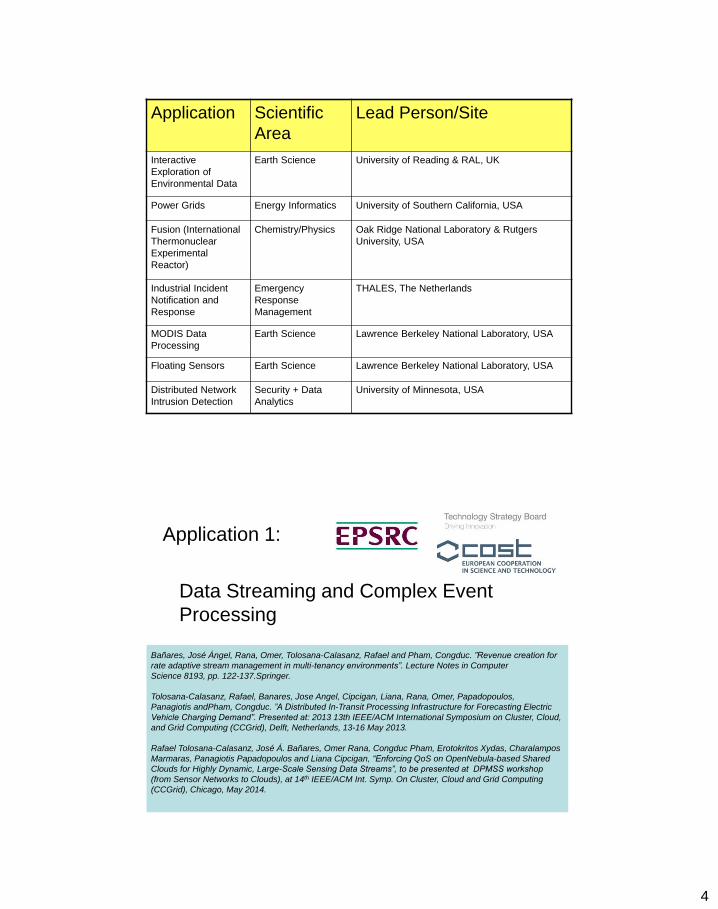
Applications (2) Application Scientific
Area
Lead Person/Site
Interactive
Exploration of
Environmental Data
Earth Science University of Reading & RAL, UK
Power Grids Energy Informatics University of Southern California, USA
Fusion (International
Thermonuclear
Experimental
Reactor)
Chemistry/Physics Oak Ridge National Laboratory & Rutgers
University, USA
Industrial Incident
Notification and
Response
Emergency
Response
Management
THALES, The Netherlands
MODIS Data
Processing
Earth Science Lawrence Berkeley National Laboratory, USA
Floating Sensors Earth Science Lawrence Berkeley National Laboratory, USA
Distributed Network
Intrusion Detection
Security + Data
Analytics
University of Minnesota, USA
Application 1:
Data Streaming and Complex Event
Processing
Bañares, José Ángel, Rana, Omer, Tolosana-Calasanz, Rafael and Pham, Congduc. ”Revenue creation for
rate adaptive stream management in multi-tenancy environments”. Lecture Notes in Computer
Science 8193, pp. 122-137.Springer.
Tolosana-Calasanz, Rafael, Banares, Jose Angel, Cipcigan, Liana, Rana, Omer, Papadopoulos,
Panagiotis andPham, Congduc. ”A Distributed In-Transit Processing Infrastructure for Forecasting Electric
Vehicle Charging Demand”. Presented at: 2013 13th IEEE/ACM International Symposium on Cluster, Cloud,
and Grid Computing (CCGrid), Delft, Netherlands, 13-16 May 2013.
Rafael Tolosana-Calasanz, José Á. Bañares, Omer Rana, Congduc Pham, Erotokritos Xydas, Charalampos
Marmaras, Panagiotis Papadopoulos and Liana Cipcigan, “Enforcing QoS on OpenNebula-based Shared
Clouds for Highly Dynamic, Large-Scale Sensing Data Streams”, to be presented at DPMSS workshop
(from Sensor Networks to Clouds), at 14th IEEE/ACM Int. Symp. On Cluster, Cloud and Grid Computing
(CCGrid), Chicago, May 2014.
5
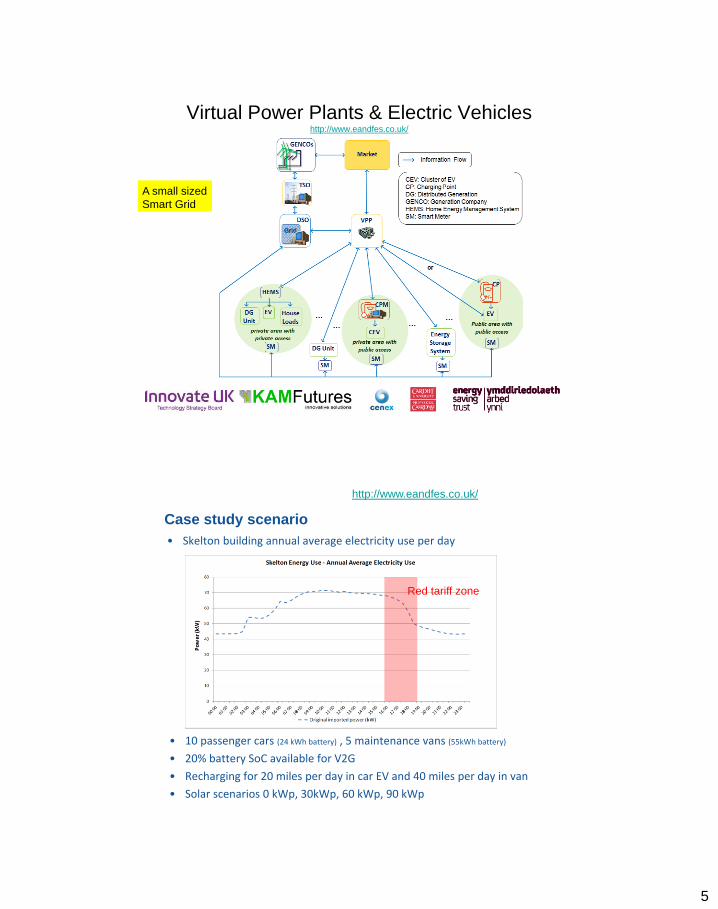
Virtual Power Plants & Electric Vehicles http://www.eandfes.co.uk/
A small sized
Smart Grid
Case study scenario
• Skelton building annual average electricity use per day
• 10 passenger cars (24 kWh battery) , 5 maintenance vans (55kWh battery)
• 20% battery SoC available for V2G
• Recharging for 20 miles per day in car EV and 40 miles per day in van
• Solar scenarios 0 kWp, 30kWp, 60 kWp, 90 kWp
Red tariff zone
http://www.eandfes.co.uk/
6
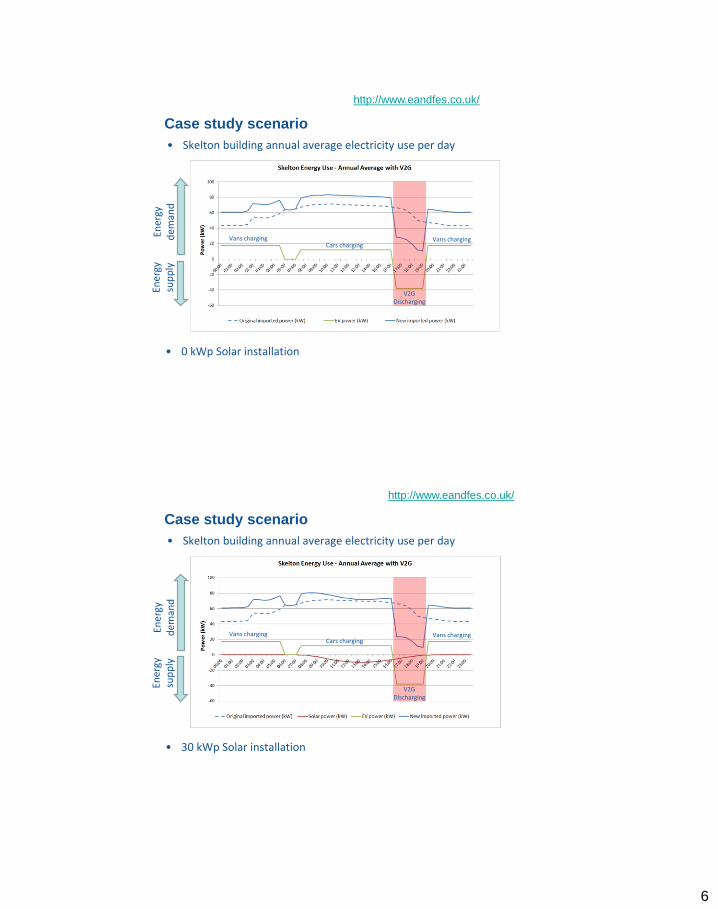
Case study scenario
• Skelton building annual average electricity use per day
• 0 kWp Solar installation
Ener
gy
dem
and
Ener
gy
sup
ply
Cars charging Vans charging Vans charging
V2G Discharging
http://www.eandfes.co.uk/
Case study scenario
• Skelton building annual average electricity use per day
• 30 kWp Solar installation
Ener
gy
dem
and
Ener
gy
sup
ply
Cars charging Vans charging Vans charging
V2G Discharging
http://www.eandfes.co.uk/
7
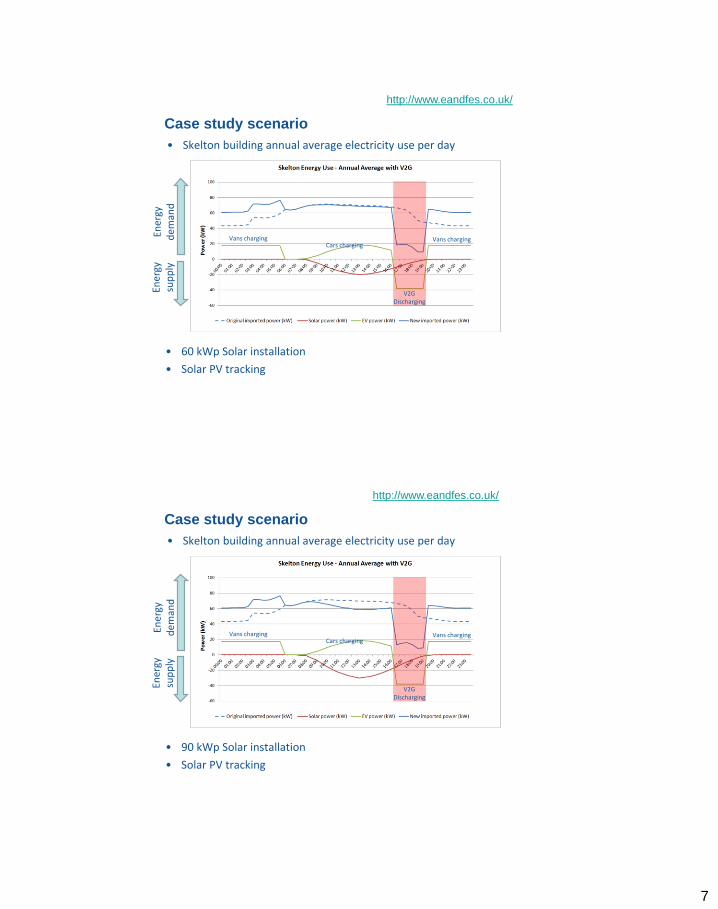
Case study scenario
• Skelton building annual average electricity use per day
• 60 kWp Solar installation
• Solar PV tracking
Ener
gy
dem
and
Ener
gy
sup
ply
Cars charging Vans charging Vans charging
V2G Discharging
http://www.eandfes.co.uk/
Case study scenario
• Skelton building annual average electricity use per day
• 90 kWp Solar installation
• Solar PV tracking
Ener
gy
dem
and
Ener
gy
sup
ply
Cars charging Vans charging Vans charging
V2G Discharging
http://www.eandfes.co.uk/
8
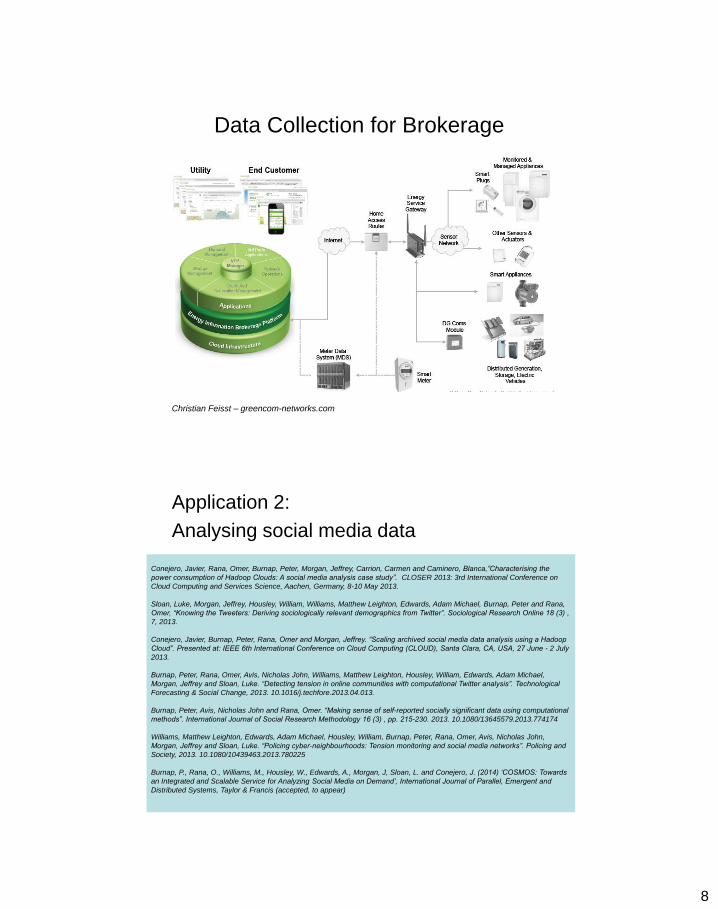
Data Collection for Brokerage
Christian Feisst – greencom-networks.com
Application 2:
Analysing social media data
Conejero, Javier, Rana, Omer, Burnap, Peter, Morgan, Jeffrey, Carrion, Carmen and Caminero, Blanca,”Characterising the
power consumption of Hadoop Clouds: A social media analysis case study”. CLOSER 2013: 3rd International Conference on
Cloud Computing and Services Science, Aachen, Germany, 8-10 May 2013.
Sloan, Luke, Morgan, Jeffrey, Housley, William, Williams, Matthew Leighton, Edwards, Adam Michael, Burnap, Peter and Rana,
Omer, “Knowing the Tweeters: Deriving sociologically relevant demographics from Twitter”. Sociological Research Online 18 (3) ,
7, 2013.
Conejero, Javier, Burnap, Peter, Rana, Omer and Morgan, Jeffrey. “Scaling archived social media data analysis using a Hadoop
Cloud”. Presented at: IEEE 6th International Conference on Cloud Computing (CLOUD), Santa Clara, CA, USA, 27 June - 2 July
2013.
Burnap, Peter, Rana, Omer, Avis, Nicholas John, Williams, Matthew Leighton, Housley, William, Edwards, Adam Michael,
Morgan, Jeffrey and Sloan, Luke. “Detecting tension in online communities with computational Twitter analysis”. Technological
Forecasting & Social Change, 2013. 10.1016/j.techfore.2013.04.013.
Burnap, Peter, Avis, Nicholas John and Rana, Omer. “Making sense of self-reported socially significant data using computational
methods”. International Journal of Social Research Methodology 16 (3) , pp. 215-230. 2013. 10.1080/13645579.2013.774174
Williams, Matthew Leighton, Edwards, Adam Michael, Housley, William, Burnap, Peter, Rana, Omer, Avis, Nicholas John,
Morgan, Jeffrey and Sloan, Luke. “Policing cyber-neighbourhoods: Tension monitoring and social media networks”. Policing and
Society, 2013. 10.1080/10439463.2013.780225
Burnap, P., Rana, O., Williams, M., Housley, W., Edwards, A., Morgan, J, Sloan, L. and Conejero, J. (2014) ‘COSMOS: Towards
an Integrated and Scalable Service for Analyzing Social Media on Demand’, International Journal of Parallel, Emergent and
Distributed Systems, Taylor & Francis (accepted, to appear)
9
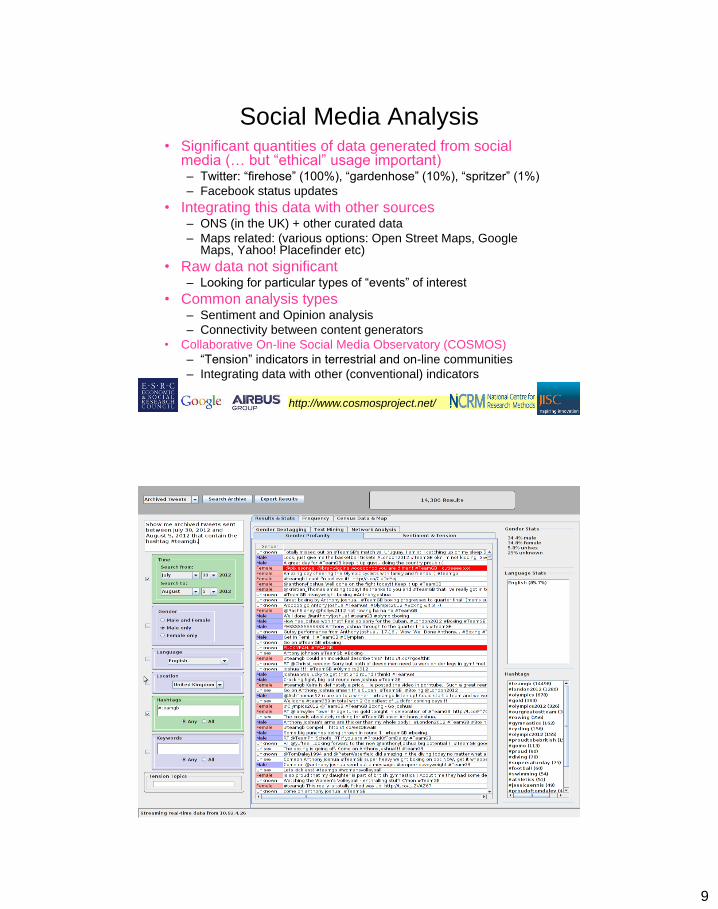
Social Media Analysis • Significant quantities of data generated from social
media (… but “ethical” usage important) – Twitter: “firehose” (100%), “gardenhose” (10%), “spritzer” (1%)
– Facebook status updates
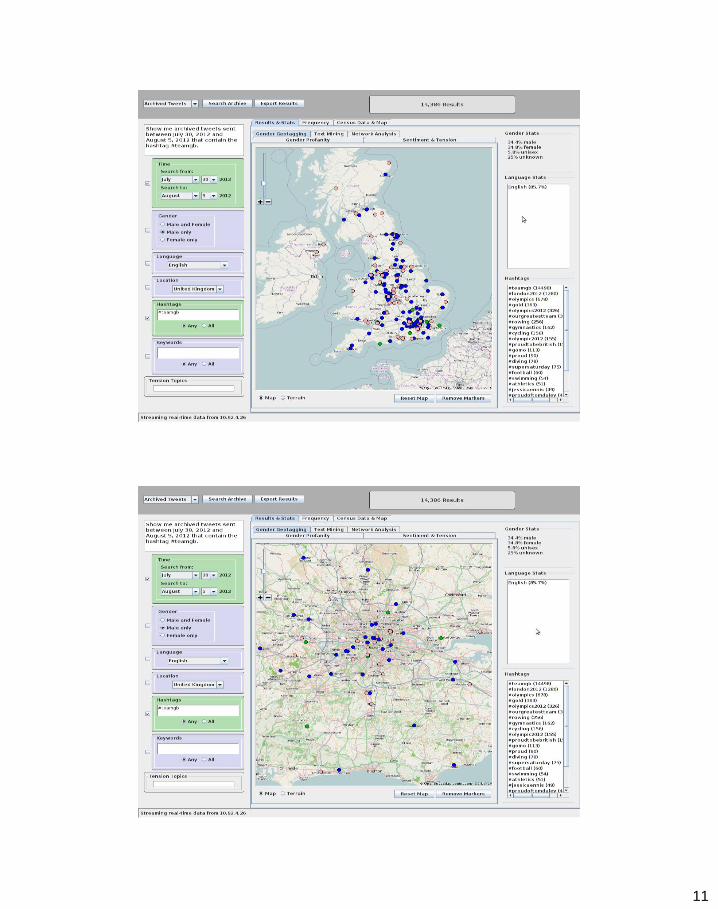
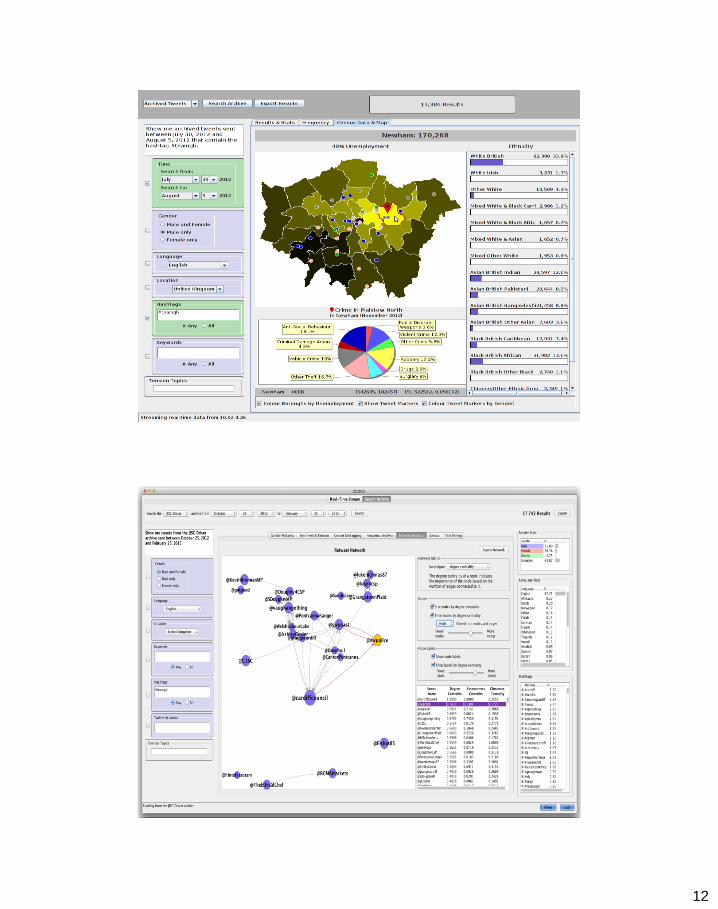
• Integrating this data with other sources – ONS (in the UK) + other curated data
– Maps related: (various options: Open Street Maps, Google Maps, Yahoo! Placefinder etc)
• Raw data not significant – Looking for particular types of “events” of interest
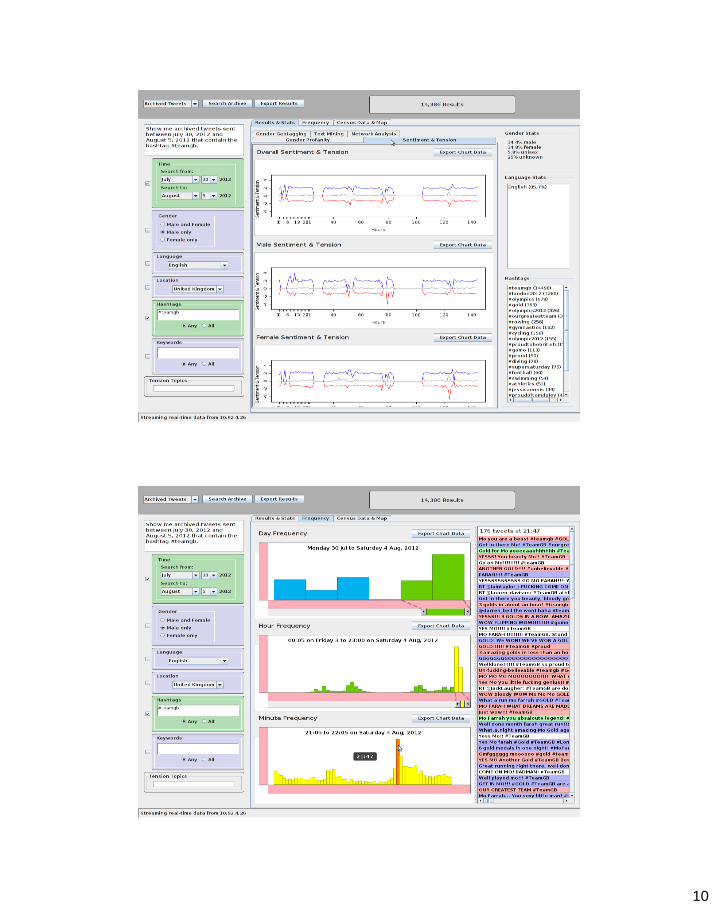
• Common analysis types – Sentiment and Opinion analysis
– Connectivity between content generators
• Collaborative On-line Social Media Observatory (COSMOS)
– “Tension” indicators in terrestrial and on-line communities
– Integrating data with other (conventional) indicators
http://www.cosmosproject.net/
10
11
12
13
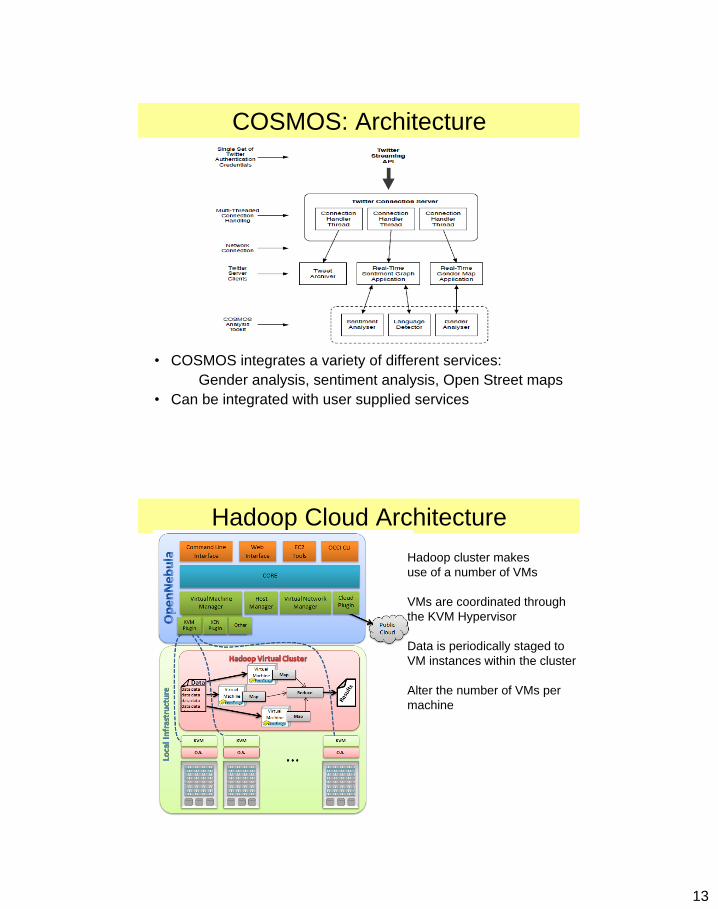
COSMOS: Architecture
• COSMOS integrates a variety of different services:
Gender analysis, sentiment analysis, Open Street maps
• Can be integrated with user supplied services
Hadoop Cloud Architecture
Hadoop cluster makes
use of a number of VMs
VMs are coordinated through
the KVM Hypervisor
Data is periodically staged to
VM instances within the cluster
Alter the number of VMs per
machine
14
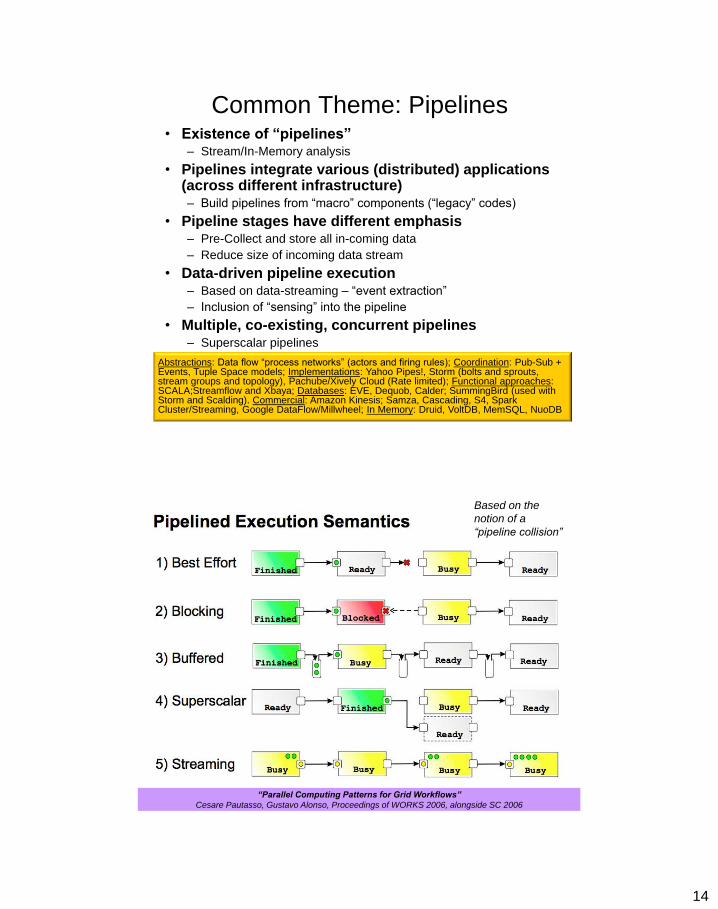
Common Theme: Pipelines • Existence of “pipelines”
– Stream/In-Memory analysis
• Pipelines integrate various (distributed) applications (across different infrastructure) – Build pipelines from “macro” components (“legacy” codes)
• Pipeline stages have different emphasis – Pre-Collect and store all in-coming data
– Reduce size of incoming data stream
• Data-driven pipeline execution – Based on data-streaming – “event extraction”
– Inclusion of “sensing” into the pipeline
• Multiple, co-existing, concurrent pipelines – Superscalar pipelines
Abstractions: Data flow “process networks” (actors and firing rules); Coordination: Pub-Sub + Events, Tuple Space models; Implementations: Yahoo Pipes!, Storm (bolts and sprouts, stream groups and topology), Pachube/Xively Cloud (Rate limited); Functional approaches: SCALA;Streamflow and Xbaya; Databases: EVE, Dequob, Calder; SummingBird (used with Storm and Scalding). Commercial: Amazon Kinesis; Samza, Cascading, S4, Spark Cluster/Streaming, Google DataFlow/Millwheel; In Memory: Druid, VoltDB, MemSQL, NuoDB
“Parallel Computing Patterns for Grid Workflows”
Cesare Pautasso, Gustavo Alonso, Proceedings of WORKS 2006, alongside SC 2006
Based on the
notion of a
“pipeline collision”
15
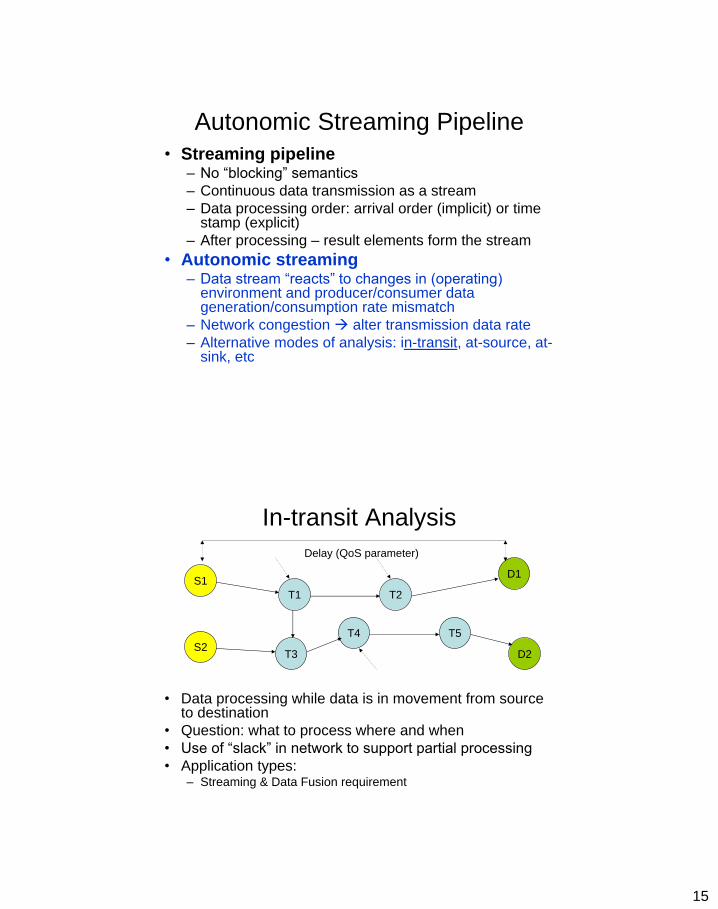
Autonomic Streaming Pipeline
• Streaming pipeline – No “blocking” semantics
– Continuous data transmission as a stream
– Data processing order: arrival order (implicit) or time stamp (explicit)
– After processing – result elements form the stream
• Autonomic streaming – Data stream “reacts” to changes in (operating)
environment and producer/consumer data generation/consumption rate mismatch
– Network congestion alter transmission data rate
– Alternative modes of analysis: in-transit, at-source, at-sink, etc
In-transit Analysis
• Data processing while data is in movement from source to destination
• Question: what to process where and when
• Use of “slack” in network to support partial processing
• Application types: – Streaming & Data Fusion requirement
S1
T1 T2
D1
T4 T5
T3 S2
D2
Delay (QoS parameter)
16
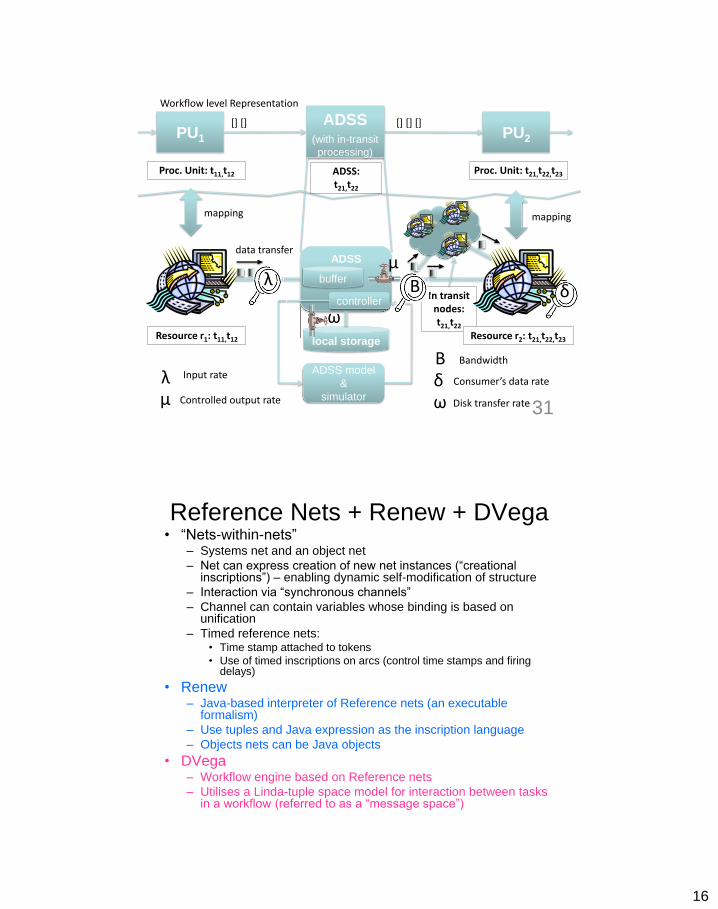
In transit nodes: t21,t22
PU2 PU1
Resource r1: t11,t12 Resource r2: t21,t22,t23
ADSS
local storage
ω
ADSS (with in-transit
processing)
μ
mapping mapping
data transfer
[] [] [] [] []
Workflow level Representation
Proc. Unit: t11,t12 Proc. Unit: t21,t22,t23 ADSS: t21,t22
buffer
controller
ADSS model
&
simulator
λ Input rate
μ Controlled output rate
δ Consumer’s data rate
ω Disk transfer rate
δ
B Bandwidth
λ B
31
Reference Nets + Renew + DVega • “Nets-within-nets”
– Systems net and an object net
– Net can express creation of new net instances (“creational inscriptions”) – enabling dynamic self-modification of structure
– Interaction via “synchronous channels”
– Channel can contain variables whose binding is based on unification
– Timed reference nets: • Time stamp attached to tokens
• Use of timed inscriptions on arcs (control time stamps and firing delays)
• Renew – Java-based interpreter of Reference nets (an executable
formalism)
– Use tuples and Java expression as the inscription language
– Objects nets can be Java objects
• DVega – Workflow engine based on Reference nets
– Utilises a Linda-tuple space model for interaction between tasks in a workflow (referred to as a “message space”)
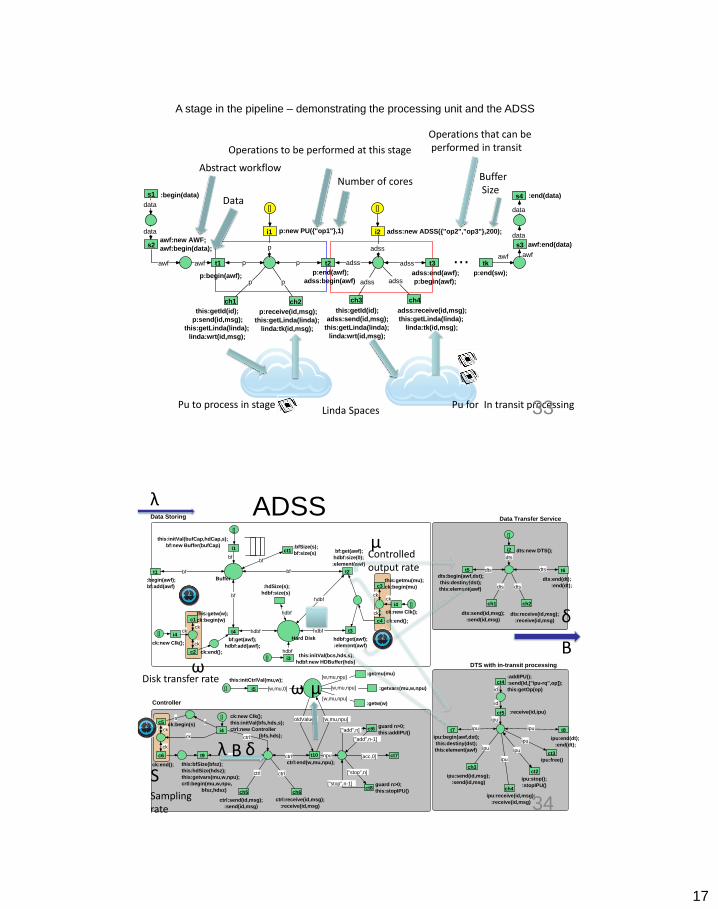
17
p:begin(awf);p:end(awf);
adss:begin(awf)adss:end(awf);
p:begin(awf);
p:end(sw);
awfawf
data
:end(data)
awf
awf:new AWF;
awf:begin(data);
p
p
p adss
adss
adss
data
:begin(data)
data
data
awf:end(data)
s1
s2 s3
s4
awf
[] []
i1 i2
ch2
t1 t2 t3 tk
p:new PU({"op1"},1)
...
adss:new ADSS({"op2","op3"},200);
p p adss adss
ch4ch1 ch3
this:getId(id);
p:send(id,msg);
this:getLinda(linda);
linda:wrt(id,msg);
p:receive(id,msg);
this:getLinda(linda);
linda:tk(id,msg);
this:getId(id);
adss:send(id,msg);
this:getLinda(linda);
linda:wrt(id,msg);
adss:receive(id,msg);
this:getLinda(linda);
linda:tk(id,msg);
Operations to be performed at this stage
Number of cores
Operations that can be performed in transit
Buffer Size
Abstract workflow
Data
Linda Spaces Pu for In transit processing Pu to process in stage 33
A stage in the pipeline – demonstrating the processing unit and the ADSS
ADSS []
[]
[]
hdbf
dts
dts:new DTS();
hdbf
bf
bf
dts:end(dt);
:end(dt);
dtst1 t6t2
t3t4
i1 i2
i3
t9
bf
hdbf
this:initVal(bcs,hds,s);
hdbf:new HDBuffer(hds)
bf
ck
ck
ck:end();
ck
[] i4
c1
c2
ck:end();
[]i4
c3
ck:new Clk();
ckck
ck
c4
hdbf:get(awf);
:element(awf)
dts:begin(awf,dst);
this:destiny(dst);
this:element(awf)
ipu:end(dt);
:end(dt);
ipu:begin(awf,dst);
this:destiny(dst);
this:element(awf)
ipu
ipu ipu
:receive(id,ipu)
bf:get(awf);
hdbf:size(0);
:element(awf)
ck:new Clk();
this:getmu(mu);
ck:begin(mu)
[]
bf:get(awf);
hdbf:add(awf);
:begin(awf);
bf:add(awf)
bf
this:initVal(bufCap,hdCap,s);
bf:new Buffer(bufCap)
DTS with in-transit processing
this:getw(w);
ck:begin(w)
this:initCtrlVal(mu,w);
i5 [w,mu,0]
:hdSize(s);
hdbf:size(s)
Hard Disk
Buffer
Data Storing Data Transfer Service
ctrl t10
ctrl:end(w,mu,npu);
ctrl:receive(id,msg);
:receive(id,msg)
dts:send(id,msg);
:send(id,msg)dts:receive(id,msg);
:receive(id,msg)
ipu:send(id,msg);
:send(id,msg)
ipu:receive(id,msg);
:receive(id,msg)
ctrl
ipu
ipu
ctrl:send(id,msg);
:send(id,msg)
["stop",n]
ck
ck i4
c5
c6
:addIPU();
:send(id,["ipu-rq",op]);
this:getOp(op)
ipu:free()
ipu
ipu
hdbf
:getmu(mu)
:getw(w)[w,mu,npu]
[w,mu,npu]
id
id
ipu:stop();
:stopIPU()
ck:end();
[]
ctrl
hdbf
:getvars(mu,w,npu)[w,mu,npu]
ck:new Clk();
this:initVal(bfs,hds,s);
ctrl:new Controller
(bfs,hds);ck
ctrl
oldValues [w,mu,npu]
guard n>0;
this:addIPU()
[acc,0]
guard n>0;
this:stopIPU()
["add",n]
["stop",n-1]
["add",n-1]
npu
ctrl
this:bfSize(bfsz);
this:hdSize(hdsz);
this:getvars(mu,w,npu);
crtl:begin(mu,w,npu,
bfsz,hdsz)
ck:begin(s)
Controller
xss
t5
t7 t8
dts
dtsdts
ch1 ch2
ch3
ch4ch5 ch6
ct1:bfSize(s);
bf:size(s)
ct2
ct3
ct6
ct7
ct8
ct4
ct5
μ Controlled output rate
ω Disk transfer rate
S Sampling rate
λ
ω μ
B δ
34
λ
δ
B

18
Control Strategy + Adaptation
• Reference net
model executes
alongside real
system
• Model used to
tune behaviour
• Rule-based
Reasoner coupled
with other machine
learning strategies
Rafael Tolosana-Calasanz, José A. Bañares, Omer F. Rana:
Autonomic streaming pipeline for scientific workflows.
Concurrency and Computation: Practice and Experience 23 (16): 1868-1892 (2011)
Adapting Transfer Rates based on Network
Congestion
Lamda: data generation rate; B: bandwidth; omega: hard disk transfer rate
Network congestion added: intervals 11-24; control interval: 10 secs.
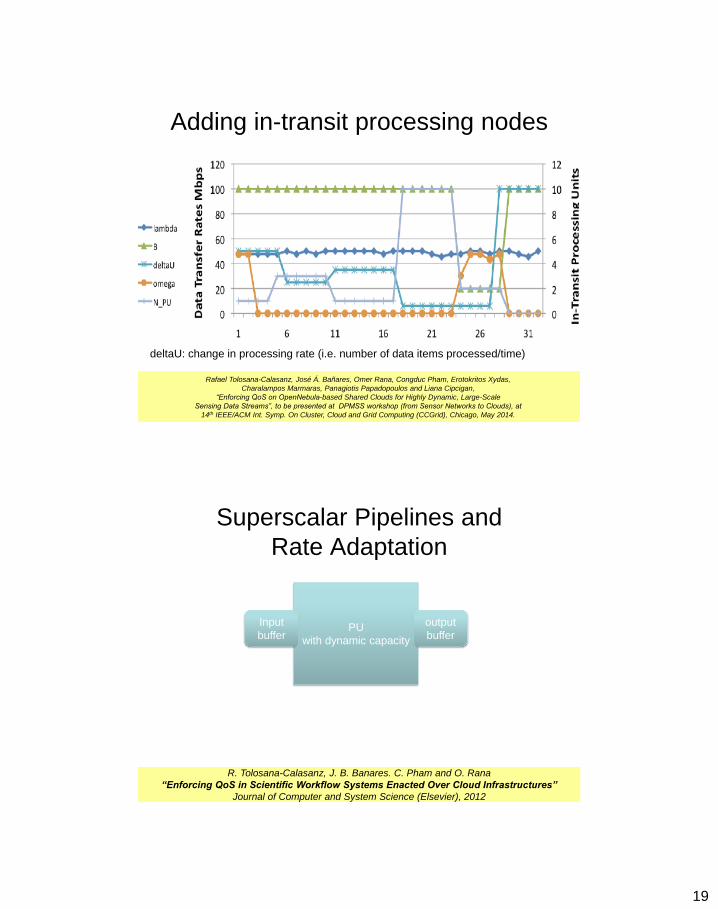
19
Adding in-transit processing nodes
deltaU: change in processing rate (i.e. number of data items processed/time)
Rafael Tolosana-Calasanz, José Á. Bañares, Omer Rana, Congduc Pham, Erotokritos Xydas,
Charalampos Marmaras, Panagiotis Papadopoulos and Liana Cipcigan,
“Enforcing QoS on OpenNebula-based Shared Clouds for Highly Dynamic, Large-Scale
Sensing Data Streams”, to be presented at DPMSS workshop (from Sensor Networks to Clouds), at
14th IEEE/ACM Int. Symp. On Cluster, Cloud and Grid Computing (CCGrid), Chicago, May 2014.
Superscalar Pipelines and
Rate Adaptation
PU
with dynamic capacity
Input
buffer
output
buffer
R. Tolosana-Calasanz, J. B. Banares. C. Pham and O. Rana
“Enforcing QoS in Scientific Workflow Systems Enacted Over Cloud Infrastructures”
Journal of Computer and System Science (Elsevier), 2012
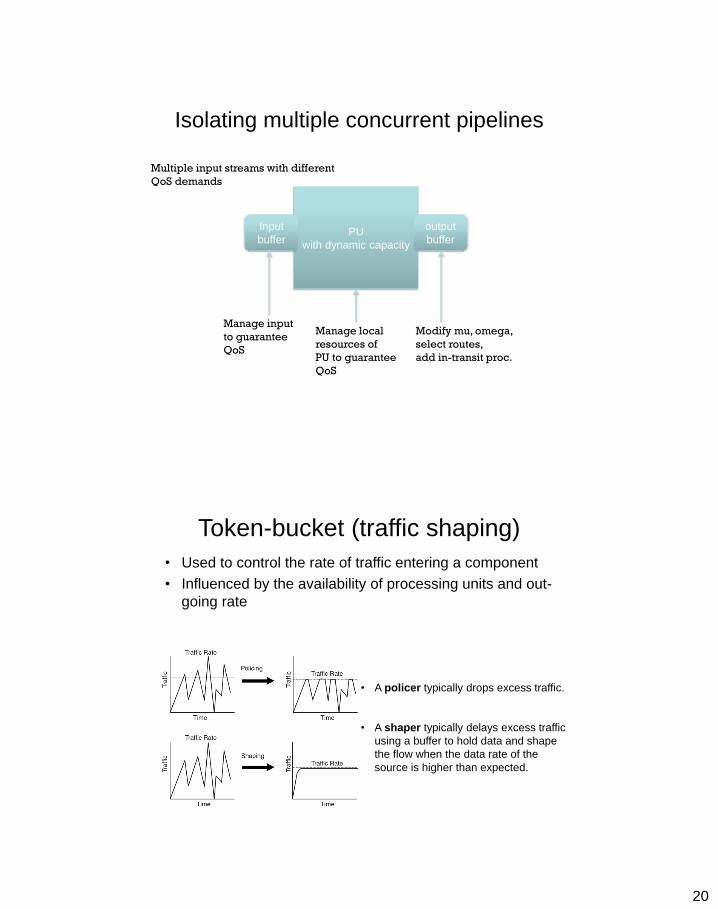
20
Isolating multiple concurrent pipelines
PU
with dynamic capacity
Input
buffer
output
buffer
Multiple input streams with different
QoS demands
Manage input
to guarantee
QoS
Manage local
resources of
PU to guarantee
QoS
Modify mu, omega,
select routes,
add in-transit proc.
• A policer typically drops excess traffic.
• A shaper typically delays excess traffic
using a buffer to hold data and shape
the flow when the data rate of the
source is higher than expected.
Token-bucket (traffic shaping)
• Used to control the rate of traffic entering a component
• Influenced by the availability of processing units and out-
going rate
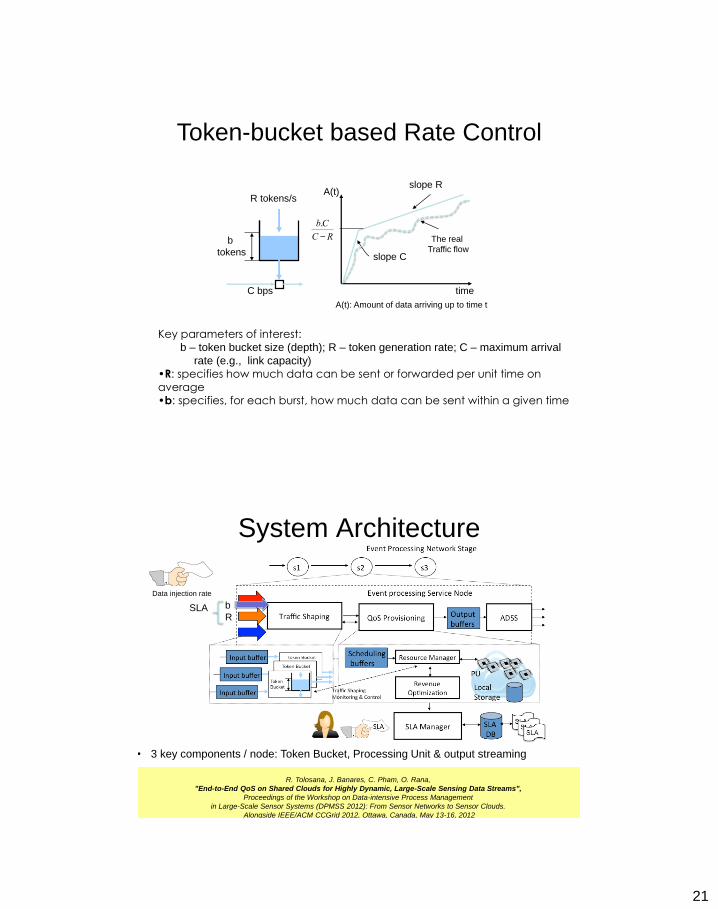
21
Key parameters of interest: b – token bucket size (depth); R – token generation rate; C – maximum arrival
rate (e.g., link capacity)
•R: specifies how much data can be sent or forwarded per unit time on
average •b: specifies, for each burst, how much data can be sent within a given time
b
tokens
R tokens/s
C bps time
A(t)
slope C
slope R
b.C
C - R The real
Traffic flow
A(t): Amount of data arriving up to time t
Token-bucket based Rate Control
System Architecture
b
R
Data injection rate
SLA
• 3 key components / node: Token Bucket, Processing Unit & output streaming
R. Tolosana, J. Banares, C. Pham, O. Rana,
"End-to-End QoS on Shared Clouds for Highly Dynamic, Large-Scale Sensing Data Streams",
Proceedings of the Workshop on Data-intensive Process Management
in Large-Scale Sensor Systems (DPMSS 2012): From Sensor Networks to Sensor Clouds.
Alongside IEEE/ACM CCGrid 2012, Ottawa, Canada, May 13-16, 2012
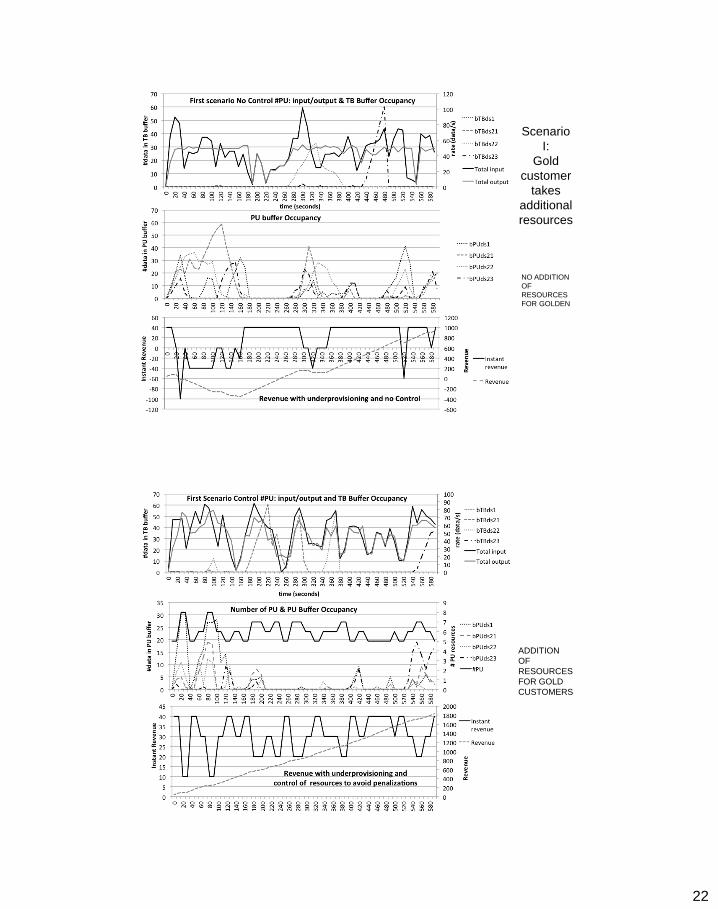
22
Scenario
I:
Gold
customer
takes
additional
resources
NO ADDITION
OF
RESOURCES
FOR GOLDEN
ADDITION
OF
RESOURCES
FOR GOLD
CUSTOMERS
23
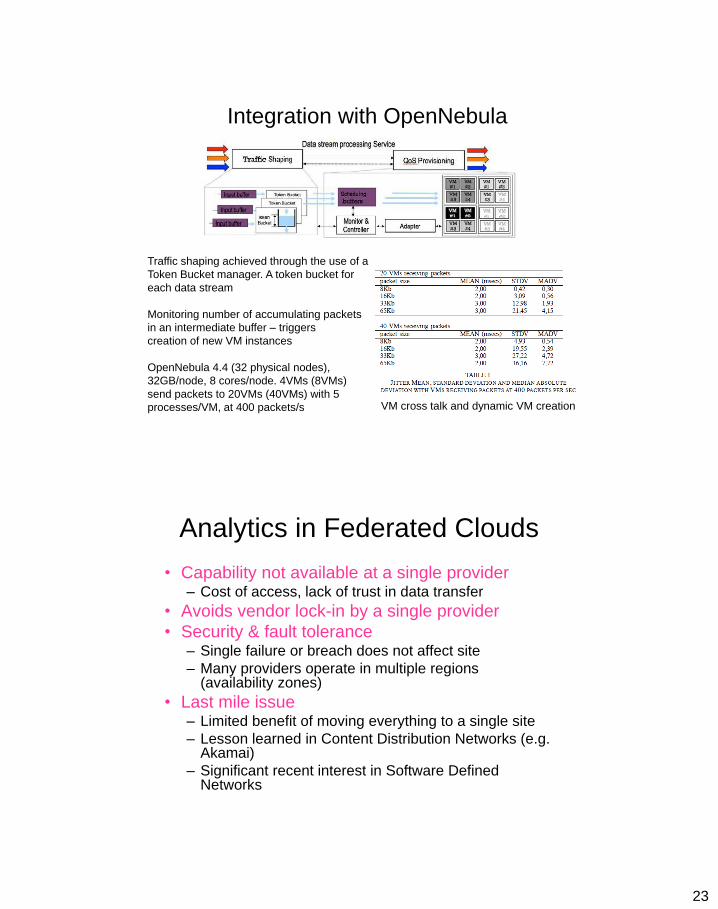
Integration with OpenNebula
Traffic shaping achieved through the use of a
Token Bucket manager. A token bucket for
each data stream
Monitoring number of accumulating packets
in an intermediate buffer – triggers
creation of new VM instances
OpenNebula 4.4 (32 physical nodes),
32GB/node, 8 cores/node. 4VMs (8VMs)
send packets to 20VMs (40VMs) with 5
processes/VM, at 400 packets/s
VM cross talk and dynamic VM creation
Analytics in Federated Clouds
• Capability not available at a single provider – Cost of access, lack of trust in data transfer
• Avoids vendor lock-in by a single provider
• Security & fault tolerance – Single failure or breach does not affect site
– Many providers operate in multiple regions (availability zones)
• Last mile issue – Limited benefit of moving everything to a single site
– Lesson learned in Content Distribution Networks (e.g. Akamai)
– Significant recent interest in Software Defined Networks
24
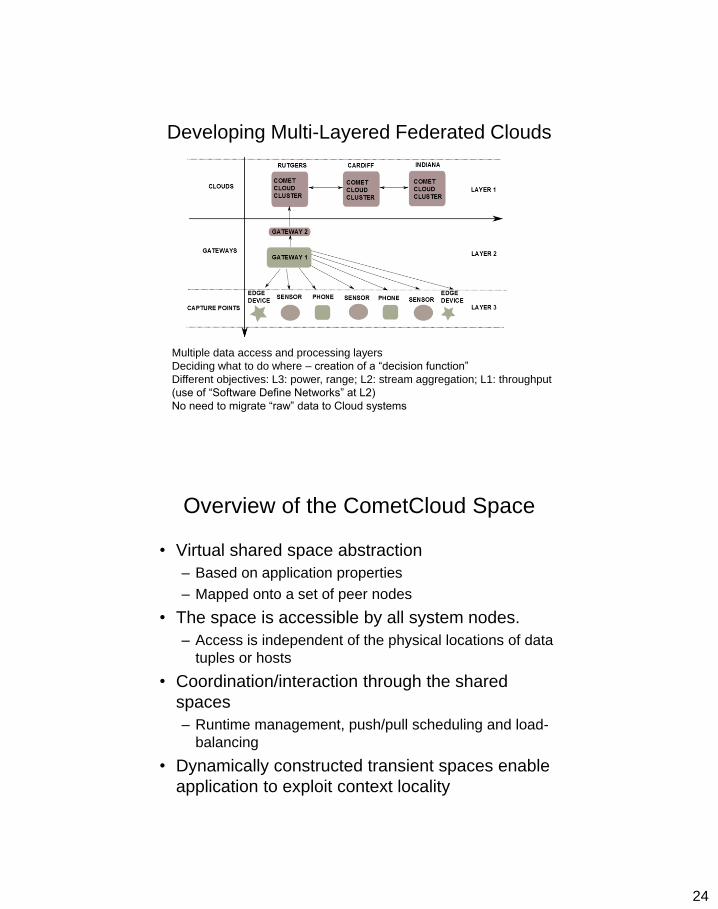
Developing Multi-Layered Federated Clouds
Multiple data access and processing layers
Deciding what to do where – creation of a “decision function”
Different objectives: L3: power, range; L2: stream aggregation; L1: throughput
(use of “Software Define Networks” at L2)
No need to migrate “raw” data to Cloud systems
Overview of the CometCloud Space
• Virtual shared space abstraction
– Based on application properties
– Mapped onto a set of peer nodes
• The space is accessible by all system nodes.
– Access is independent of the physical locations of data
tuples or hosts
• Coordination/interaction through the shared
spaces
– Runtime management, push/pull scheduling and load-
balancing
• Dynamically constructed transient spaces enable
application to exploit context locality
25
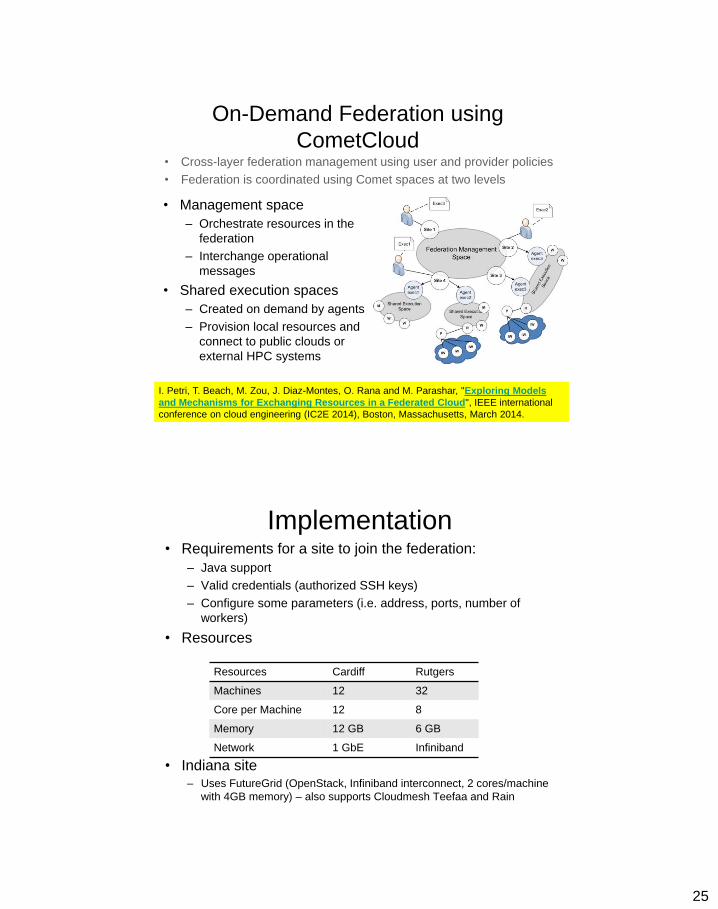
On-Demand Federation using
CometCloud
• Management space
– Orchestrate resources in the
federation
– Interchange operational
messages
• Shared execution spaces
– Created on demand by agents
– Provision local resources and
connect to public clouds or
external HPC systems
• Cross-layer federation management using user and provider policies
• Federation is coordinated using Comet spaces at two levels
I. Petri, T. Beach, M. Zou, J. Diaz-Montes, O. Rana and M. Parashar, "Exploring Models
and Mechanisms for Exchanging Resources in a Federated Cloud", IEEE international
conference on cloud engineering (IC2E 2014), Boston, Massachusetts, March 2014.
Implementation • Requirements for a site to join the federation:
– Java support
– Valid credentials (authorized SSH keys)
– Configure some parameters (i.e. address, ports, number of
workers)
• Resources
• Indiana site – Uses FutureGrid (OpenStack, Infiniband interconnect, 2 cores/machine
with 4GB memory) – also supports Cloudmesh Teefaa and Rain
Resources Cardiff Rutgers
Machines 12 32
Core per Machine 12 8
Memory 12 GB 6 GB
Network 1 GbE Infiniband
26
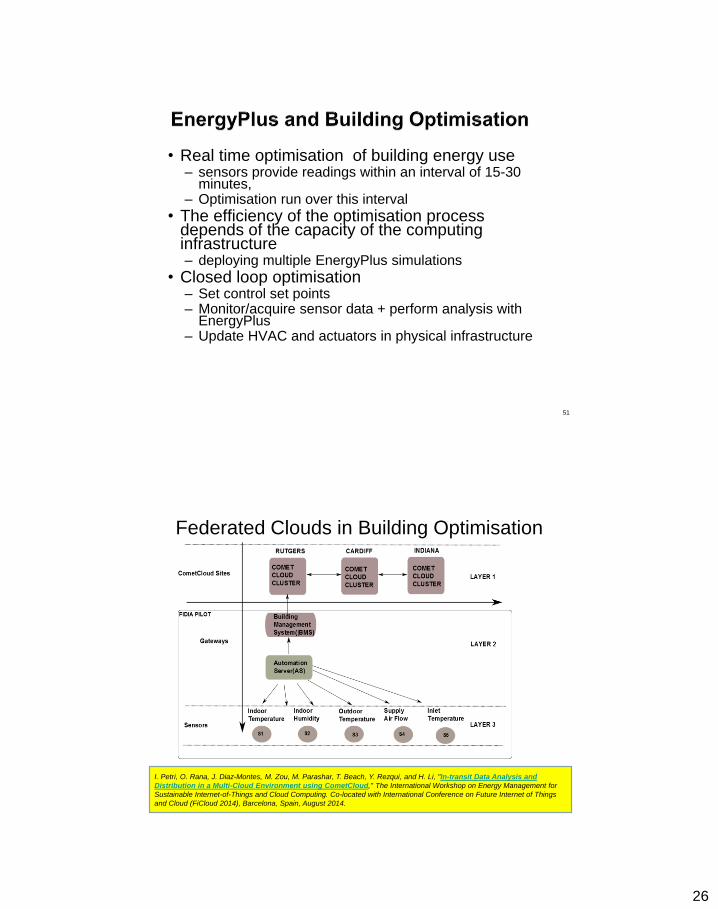
• Real time optimisation of building energy use – sensors provide readings within an interval of 15-30
minutes, – Optimisation run over this interval
• The efficiency of the optimisation process depends of the capacity of the computing infrastructure – deploying multiple EnergyPlus simulations
• Closed loop optimisation – Set control set points – Monitor/acquire sensor data + perform analysis with
EnergyPlus – Update HVAC and actuators in physical infrastructure
51
Federated Clouds in Building Optimisation
I. Petri, O. Rana, J. Diaz-Montes, M. Zou, M. Parashar, T. Beach, Y. Rezqui, and H. Li, "In-transit Data Analysis and
Distribution in a Multi-Cloud Environment using CometCloud," The International Workshop on Energy Management for
Sustainable Internet-of-Things and Cloud Computing. Co-located with International Conference on Future Internet of Things
and Cloud (FiCloud 2014), Barcelona, Spain, August 2014.
27
53
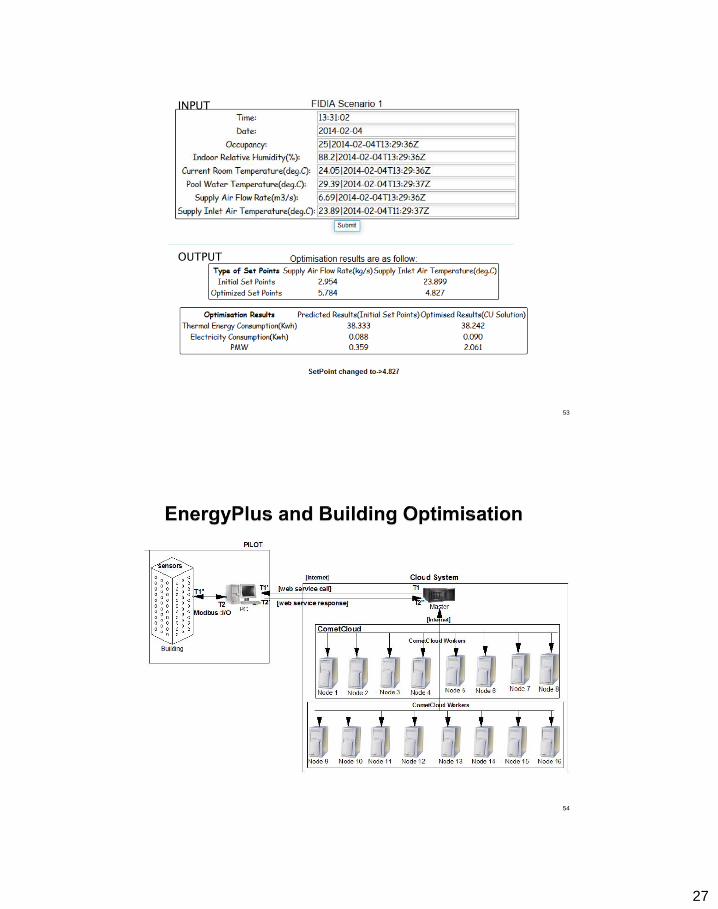
INPUT
OUTPUT
54
28
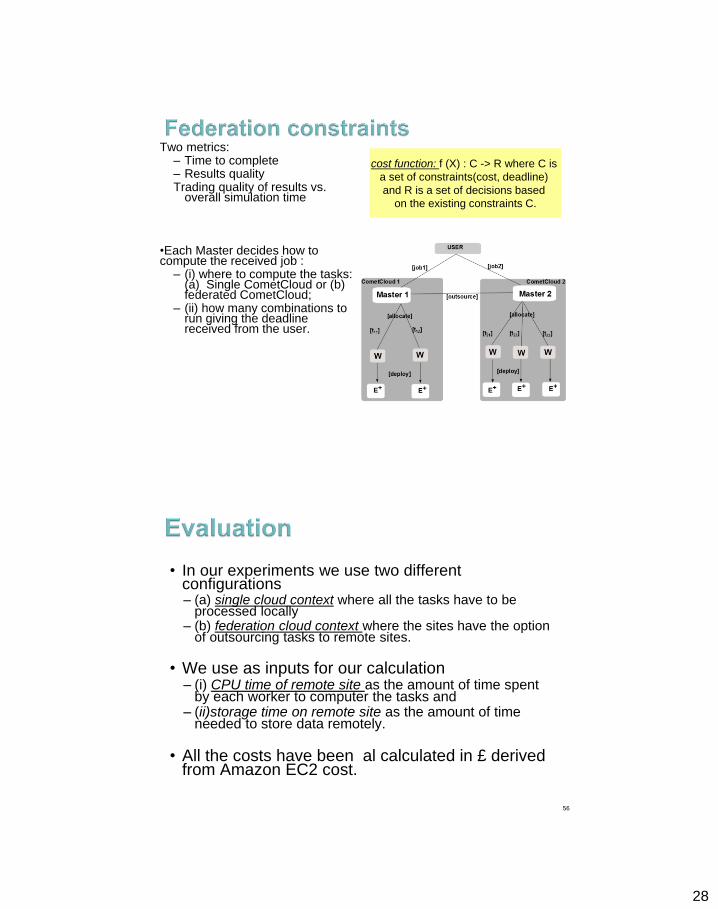
Two metrics: – Time to complete – Results quality Trading quality of results vs.
overall simulation time •Each Master decides how to compute the received job :
– (i) where to compute the tasks: (a) Single CometCloud or (b) federated CometCloud;
– (ii) how many combinations to run giving the deadline received from the user.
cost function: f (X) : C -> R where C is
a set of constraints(cost, deadline)
and R is a set of decisions based
on the existing constraints C.
• In our experiments we use two different configurations – (a) single cloud context where all the tasks have to be
processed locally – (b) federation cloud context where the sites have the option
of outsourcing tasks to remote sites.
• We use as inputs for our calculation – (i) CPU time of remote site as the amount of time spent
by each worker to computer the tasks and – (ii)storage time on remote site as the amount of time
needed to store data remotely.
• All the costs have been al calculated in £ derived from Amazon EC2 cost.
56
29
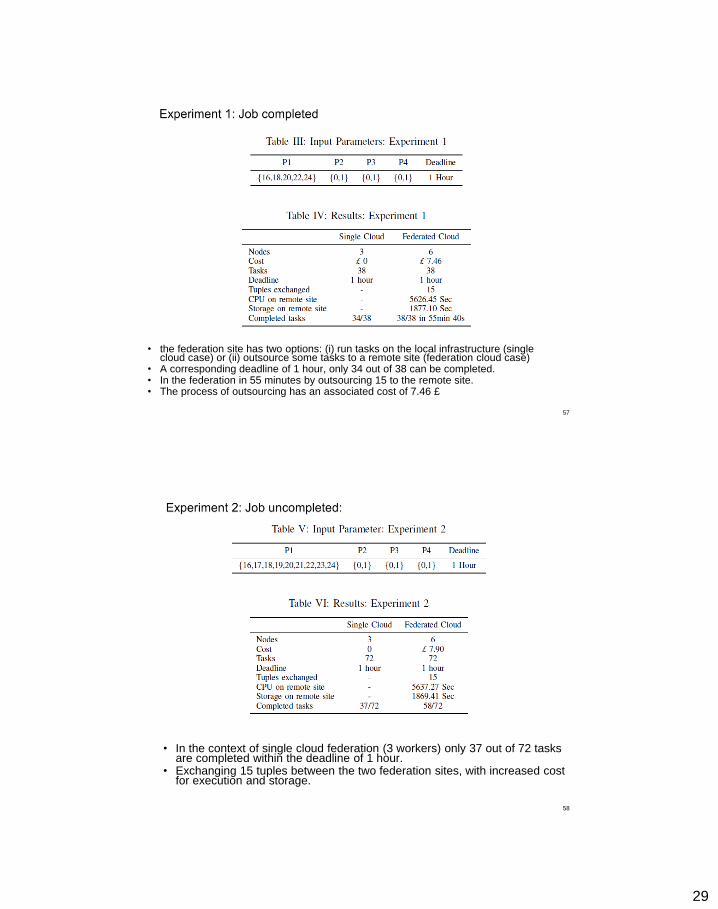
• the federation site has two options: (i) run tasks on the local infrastructure (single cloud case) or (ii) outsource some tasks to a remote site (federation cloud case)
• A corresponding deadline of 1 hour, only 34 out of 38 can be completed. • In the federation in 55 minutes by outsourcing 15 to the remote site. • The process of outsourcing has an associated cost of 7.46 £
57
• In the context of single cloud federation (3 workers) only 37 out of 72 tasks are completed within the deadline of 1 hour.
• Exchanging 15 tuples between the two federation sites, with increased cost for execution and storage.
58
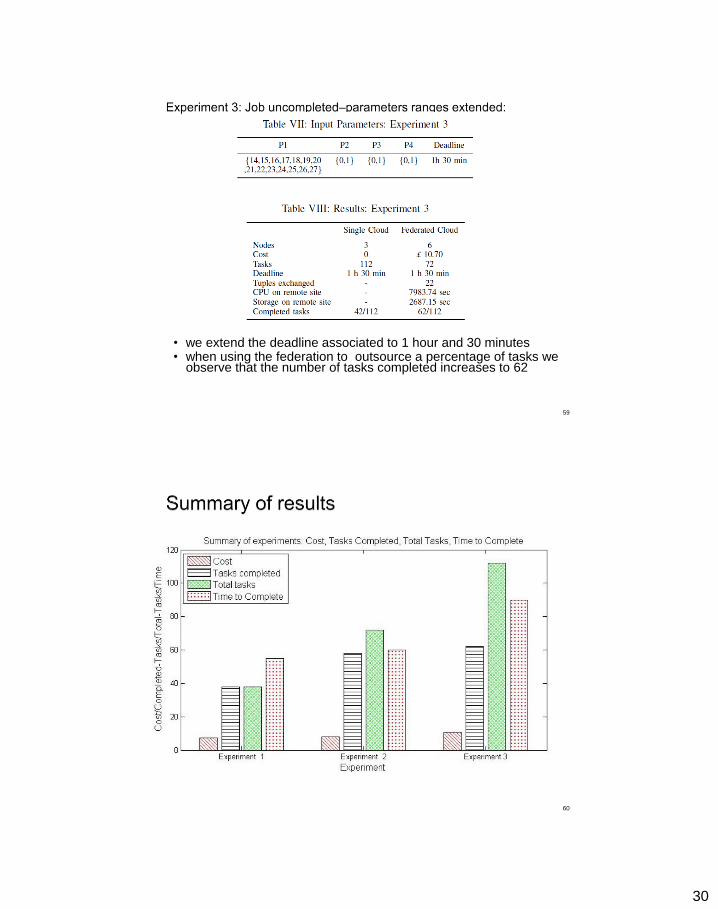
30
• we extend the deadline associated to 1 hour and 30 minutes • when using the federation to outsource a percentage of tasks we
observe that the number of tasks completed increases to 62
59
60
31
Conclusion …
• Emergence of data-driven + data intensive applications
• Use of Cloud/data centres and edge nodes collectively
• Pipeline-based enactment a common theme – Various characteristics – buffer management and
data coordination
– Model development that can be integrated into a workflow environment
• Automating application adaptation – … as infrastructure changes
– … as application characteristics change
3DPAS theme -- people
• Shantenu Jha (Rutgers University, USA and University of Edinburgh, UK) – theme coordinator
• J. D. Blower (Reading University, UK)
• Neil Chue Hong (Software Sustainability Institute, University of Edinburgh, UK),
• Simon Dobson (University of St Andrews, UK)
• Daniel S. Katz (Computation Institute, University of Chicago, USA & NSF Cyberinfrastructure, USA),
• Andre Luckow (Louisiana State University, USA)
• Omer Rana (Cardiff University, UK)
• Yogesh Simmhan (University of Southern California, USA)
• Jon Weissman (University of Minnesota, USA)
32
Collaborators … • COSMOS: Jeffrey Morgan, Peter Burnap,
William Housley, Matthew Williams, Adam Edwards, Nick Avis (Cardiff)
• Ioan Petri (Cardiff, CS)
• Yacine Rezgui, Haijiang Li. Tom Beach (Cardiff ENGIN)
• Manish Parashar, Javier Diaz-Montes, Mengsong Zou (Rutgers University, US)
• Rafael Tolosana, Ricardo Rodriegez and Jose Banares (University of Zaragoza, Spain)
• Congduc Pham (University of Pau, France)
• Andreas Hoheisel (Fraunhofer Institute, Germany)